Embed Size (px)
Citation preview


2
DR. SUE GREENER & DR. JOE MARTELLI
AN INTRODUCTION TO BUSINESS RESEARCH METHODS

3
An Introduction to Business Research Methods3rd edition© 2018 Dr. Sue Greener, Dr. Joe Martelli & bookboon.comISBN 978-87-403-2045-9Peer review by Kiefer Lee, Principal Lecturer, Sheffield Business School, Sheffield Hallam University

AN INTRODUCTION TO BUSINESS RESEARCH METHODS Contents
44
CONTENTS
Preface 8
1 Research problems and questions and how they relate to debates
in Research Methods 9
1.1 Chapter Overview 9
1.2 Introduction 9
1.3 The nature of business research 10
1.4 What kind of business problems might need a research study? 14
1.5 What are the key issues in research methods we need to understand? 16
1.6 Questions for self review 24
1.7 References 24
2 Putting the problem into context: identifying and critically
reviewing relevant literature 26
2.1 Chapter Overview 26
2.2 How does literature relate to research? 26
2.3 What kind of literature should we search for? 28
www.sylvania.com
We do not reinvent the wheel we reinvent light.Fascinating lighting offers an infinite spectrum of possibilities: Innovative technologies and new markets provide both opportunities and challenges. An environment in which your expertise is in high demand. Enjoy the supportive working atmosphere within our global group and benefit from international career paths. Implement sustainable ideas in close cooperation with other specialists and contribute to influencing our future. Come and join us in reinventing light every day.
Light is OSRAM

AN INTRODUCTION TO BUSINESS RESEARCH METHODS Contents
5
2.4 Effective literature searching 31
2.5 Critical analysis of literature 35
2.6 Using Harvard referencing style 41
2.7 Questions for self review 42
2.8 References 43
3 Choosing research approaches and strategies 44
3.1 Chapter overview 44
3.2 Different perspectives of knowledge and research which underpin
research design 44
3.3 Identify differing research paradigms for business 46
3.4 Key differences between qualitative and quantitative research
methods and how and why they may be mixed 47
3.5 Criteria of validity and reliability in the context of business research 49
3.6 Your choice of research strategy or design 51
3.7 Classification of research 52
3.8 The Business Research Process 54
3.9 The Academic business research process 55
3.10 Questions for self review 56
3.11 References 56
4 Ethics in business research 58
4.1 Chapter Overview 58
4.2 Understand how ethical issues arise in business research at every stage 58
4.3 Ethical criteria used in Higher Education business research studies 62
4.4 Strategies to ensure ethical issues in business research are addressed
appropriately 62
4.5 Plagiarism 66
4.6 Questions for self review 67
4.7 References 67
5 Choosing samples from populations 68
5.1 Chapter Overview 68
5.2 Understand how and why sampling relates to business research 68
5.3 Identify and use a range of probability and non-probability
sampling techniques 69
5.4 Selecting the size of your sample 72
5.5 Understand and assess representativeness of samples and
generalisability from samples 75
5.6 Sampling simulation exercise 77
5.7 Questions for self review 77
5.8 References 77

AN INTRODUCTION TO BUSINESS RESEARCH METHODS Contents
6
6 Quantitative research methods: collecting and analysing data 78
6.1 Chapter Overview 78
6.2 Anticipating how the research design is affected by data collection
and analysis tools 79
6.3 Recognising different levels of data for analysis 80
6.4 Coding and entering data for computerized statistical analysis 82
6.5 Choosing appropriate ways to present data through charts, tables
and descriptive statistics 85
6.6 Selecting appropriate statistical tools for the research variables 88
6.7 Families of Statistics 89
6.8 Measures of Correlation – the correlation coefficient 91
6.9 Regression analysis 92
6.10 Statistical significance 93
6.11 Questions for self review 95
6.12 References 96
7 Questionnaire design and testing 97
7.1 Chapter overview 97
7.2 Appreciate and overcome the difficulties associated with
questionnaire design 97
7.3 Choosing from a range of question formats 99
7.4 How to design, pilot and administer questionnaires 101
7.5 Questions for self review 105
7.6 References 106
8 Using secondary data 107
8.1 Chapter Overview 107
8.2 The value of secondary data to business research 107
8.3 What to look for as secondary data and where to find it 110
8.4 The disadvantages of using secondary data in business research 112
8.5 Big Data 114
8.6 Questions for self review 115
8.7 References 115
9 Qualitative research methods: collecting and analysing
qualitative data 116
9.1 Chapter overview 116
9.2 Key issues in qualitative data analysis 116
9.3 The range of qualitative research methods applicable to research topics 118
9.4 How qualitative data can be prepared for analysis 123

AN INTRODUCTION TO BUSINESS RESEARCH METHODS Contents
7
9.5 Computer based methods for qualitative data analysis 124
9.6 Questions for self review 125
9.7 References 125
10 Practical issues in conducting interviews, focus groups,
participant observation 127
10.1 Chapter overview 127
10.2 Practical considerations relating to participant observation 127
10.3 Practical issues relating to interviews 130
10.4 Practical issues relating to focus groups 134
10.5 Questions for self review 136
10.6 References 136
11 Forecasting trends 138
11.1 Chapter overview 138
11.2 Why forecasting is not widely covered in the business research
methods literature 138
11.3 Existing methodologies for forecasting 140
11.4 Basic forecasting tools 144
11.5 Regression and discriminant analysis 145
11.6 Measures commonly used to evaluate forecasts & predictions 148
11.7 Exploring the value of forecasting methods in business practice 150
11.8 Questions for self review 151
11.9 References 151
12 Reporting research results 152
12.1 Chapter overview 152
12.2 Your personal approach to writing a research report 153
12.3 The differences between writing a report for a business audience
and for academic purposes 155
12.4 Producing an oral presentation of key findings 161
12.5 Questions for self review 163
12.6 References 163
Comments from peer reviewer 164

AN INTRODUCTION TO BUSINESS RESEARCH METHODS PrefaCe
8
PREFACE
Welcome to this research methods guide which aims to introduce students to the main ideas and issues to consider in conducting rigorous and effective business research. We offer many links and references to standard works in the field. This book is not a substitute for those standard works, but a starting point which should help you to understand the terminology and find what you might need to know.
In this third edition, we have included some updating and improved explanations of families of statistics, regression analysis, big data, mixed methods, social media and presentation. We have also tried to improve sections by changing formats to make them easier to read.
If you are new to academic research, keep one thing in mind: there is no one right way to research and no one right way to write a research methodology chapter. The point is to look at the alternatives and build a rational case for the path that your research takes.
Sue Greener & Joe Martelli2018

AN INTRODUCTION TO BUSINESS RESEARCH METHODS
RESEARCH PROBLEMS AND QUESTIONS AND HOW THEY RELATE TO DEBATES IN RESEARCH METHODS
9
1 RESEARCH PROBLEMS AND QUESTIONS AND HOW THEY RELATE TO DEBATES IN RESEARCH METHODS
1.1 CHAPTER OVERVIEW
1.1.1 LEARNING OUTCOMES
By the end of this chapter successful students will be able to:
1. Distinguish business and management research from other kinds of research2. Understand the issues relating to identifying and reformulating problems for research3. Identify the key debates in research methods
References, Links and Further Reading
Bryman and Bell (2015) or look for other web resources relating to “problematisation”, business research and debates in research methods in social sciences.
1.2 INTRODUCTION
1.2.1 RESEARCH METHODS AS AN AREA TO STUDY
As a student of Business Research Methods, you will be wearing two hats. One hat or role is that of a student who wishes to pass exams in this area, so you will need to learn enough about research methods to write an assignment of appropriate standard and/or to pass the examination. This is your academic role, and this means we must look at research methods from an academic point of view. All academic work, as you already know, must take account of published literature (textbooks, journal articles, professional articles, relevant website information, company literature etc.). So we will be looking at research methods literature, in order that you can use it to help you understand the chapters, and use the literature in your assessment. You may continue your studies and do further academic work at a higher level; again you will need to use research methods ideas and theories from the literature directly in that study.

AN INTRODUCTION TO BUSINESS RESEARCH METHODS
RESEARCH PROBLEMS AND QUESTIONS AND HOW THEY RELATE TO DEBATES IN RESEARCH METHODS
10
But there is another hat, that of manager, research consultant or practitioner, for which this short book aims to prepare you. Sometimes, your academic assignments may require you to step into the role of consultant. So sometimes in this book, you will need to imagine yourself in the role of manager or consultant, needing to answer questions in real-time, carry out research to answer vital questions for the business you are in.
Most of you reading this book may not wind up as researchers in an organization or ever have the title of “researcher”, but in fact, as a manager or a professional in an organization, you will be expected to operate in a logical and scientific manner. Most of the research that is being done in an organization is not in the Research and Development department. In fact, it’s done throughout the organization.
As an accredited professional in an organization, particularly one with a university or graduate education, you will be expected to work with sound research-oriented skills. In most organizations, the responsibility for thinking in a systematic and logical manner is everyone’s responsibility, rather than being concentrated in just one function of the business or just being “management’s responsibility”.
Take a moment to think through the differences between these research roles, between your academic hat and your business hat.
1.2.2 RESEARCH METHODS VERSUS RESEARCH METHODOLOGY
Many authors use these terms interchangeably, but there is a correct way of using them. As students of “Research Methods”, we must know the difference. What is it? Textbooks treat this in varying ways but research “methods” usually refers to specific activities designed to generate data (e.g. questionnaires, interviews, focus groups, observation) and research “methodology” is more about your attitude to and your understanding of research and the strategy or approach you choose to answer research questions. This chapter will start with a good look at research methodology, and then will go on to look at research methods.
1.3 THE NATURE OF BUSINESS RESEARCH
If you have ever used the phrase “research shows that…” in an assignment or conversation, you will not be doing this again! Understanding Research Methods helps us to be specific about the research we discuss, and to make sure that research comes from a valid source and was collected and analysed appropriately. Many surveys are conducted every day throughout

AN INTRODUCTION TO BUSINESS RESEARCH METHODS
RESEARCH PROBLEMS AND QUESTIONS AND HOW THEY RELATE TO DEBATES IN RESEARCH METHODS
11
the world to prove a particular point, to support an ideological argument, or just to sound authoritative. We hear them and see them in the news media all the time. Some of this “research” is a “vox pop” where someone, often a journalist, has asked a few people in the street their view of a Government policy, or a product or service, or a current crisis. This is quite different from the kind of business research we are discussing on this chapter.
In business, and for academic research, the questions we ask must be valid and fair, relating directly to our need for information, in other words our research must have a clear objective purpose, we are not collecting information for its own sake. Survey research software (e.g., Survey Monkey, etc.) makes it simple to construct and administer surveys, and many of these are poorly worded and designed
We must also collect that information (data) in a fair and systematic way. For example, we should think about who we ask for information, and how they will understand our questions. If we cannot ask everyone involved, then we must be able to justify why we ask only a certain section of that population. When using sampling, you must ask “to whom can the results be statistically generalized?”
We must also analyse our data with great care in a systematic way. The rigour of our analysis will have a major effect on whether our research results are valid or not. If we are trying to determine which of a range of new technologies to invest in, then it will be very important that we don’t skew our results towards a technology or application created by someone we know, or that we don’t miss out certain relevant technologies, as these inaccuracies will lead to a poor investment decision.
1.3.1 WHAT MIGHT BE SPECIAL ABOUT BUSINESS RESEARCH?
If we contrast research in business with, for example, research into chemistry, one particular issue is clear: business research is not a single pure academic discipline like chemistry. If we conduct research in the field of chemistry, we will certainly have to know a lot about chemical concepts, the laws of chemistry and the history of scientific development in chemistry as well as the context of current chemical research. There will be much to learn about the field before we could become successful researchers in that field, contributing to new knowledge.
However, in business the issues are not so narrowly focused. We will need to understand things about a range of stakeholders; for example, managers, staff, customers and owners, about business entities such as companies and partnerships and co-operatives, about economies and how they affect business operations, about products and services and how they vary over

AN INTRODUCTION TO BUSINESS RESEARCH METHODS
12
RESEARCH PROBLEMS AND QUESTIONS AND HOW THEY RELATE TO DEBATES IN RESEARCH METHODS
12
time, how they can be produced efficiently, about money and what regulates its availability, how it produces profit, and Governments and how their policy affects business operations, customers’ income and needs etc.
We can see that business is an umbrella term for many different things, and involves a number of different academic disciplines, such as mathematics, psychology, sociology, physics, economics, politics, history and language. So when we research into business or management, we will be drawing on a number of different disciplines and domains. Business research is multi- faceted and disciplinary.
Business research can also be conducted at different levels. We may want to find a way to predict when a particular project might move to the next stage of the product life cycle. This could involve a substantial piece of work involving customers, competitors and markets as well as product strategies for resource use, marketing and sales. We could try some trend analysis and aim to forecast future growth or decline in sales of our product against the competition, we could do some desk research into government policy affecting this market, we could interview experienced managers in the field to find out their subjective views about the product’s predicted life. This is a complex piece of research, since there are so many variables and stakeholders involved in influencing a product’s life cycle.
EADS unites a leading aircraft manufacturer, the world’s largest helicopter supplier, a global leader in space programmes and a worldwide leader in global security solutions and systems to form Europe’s largest defence and aerospace group. More than 140,000 people work at Airbus, Astrium, Cassidian and Eurocopter, in 90 locations globally, to deliver some of the industry’s most exciting projects.
An EADS internship offers the chance to use your theoretical knowledge and apply it first-hand to real situations and assignments during your studies. Given a high level of responsibility, plenty of
learning and development opportunities, and all the support you need, you will tackle interesting challenges on state-of-the-art products.
We welcome more than 5,000 interns every year across disciplines ranging from engineering, IT, procurement and finance, to strategy, customer support, marketing and sales. Positions are available in France, Germany, Spain and the UK.
To find out more and apply, visit www.jobs.eads.com. You can also find out more on our EADS Careers Facebook page.
Internship opportunities
CHALLENGING PERSPECTIVES

AN INTRODUCTION TO BUSINESS RESEARCH METHODS
RESEARCH PROBLEMS AND QUESTIONS AND HOW THEY RELATE TO DEBATES IN RESEARCH METHODS
13
Alternatively, we may want to find out how sales have changed over a period of five years. This will involve “fact finding”, and may be simple to collect from financial statements, and be expressed in a clear chart showing sales figures over time. Easy. But what if there were major changes to products or services during that time? Or a move of premises which caused a slump in sales during a short period? Or a re-branding exercise? We would have to decide what depth or what level to use for our research, and for this we would need to know its purpose.
You might be thinking that this sounds a bit complicated. After all, not every manager or employee has studied business research methods, yet they still have to make decisions affecting the business on the basis of what they find out. Fair point. Millions of business decisions are made daily across the world without detailed research. What we are trying to do by studying Business Research Methods is to give you the choice to do the research systematically and rigorously. That way, your decisions will improve, and you won’t be tempted to go with the first option, which may not be the best one.
Does this mean a lot of theory? Not necessarily a lot, but some will be helpful, in order to interpret the “facts” that we find. Usually business research will be conducted to achieve a practical outcome, and that practical outcome will be best understood in a context. A theoretical context, for example industrial sociology, or economics, may help us to analyse a situation more effectively and critically. It may even help us to challenge or move that theory forward. While this book is not about critical thinking skills, it should be clear to you that that is a fundamental skill to learn in your studies. It does not mean being “critical” in a negative sense. It means asking searching questions to challenge the assumptions people make, looking not just for what is said but also for what is not said and considering the reasoning behind conclusions drawn. For a good presentation further expanding on critical thinking, watch the following video: https://www.youtube.com/watch?v=oefmPtsV_w4
Bryman and Bell (2015) discuss the distinction between “grand theory” i.e. a theory dealing with abstract ideas and/or relationships between factors and “middle range” theory which deals with a more limited context (p. 21–22). Additionally, Saunders, Lewis and Thornhill (2016) provide a summary of some research on “what theory is not”.
1.3.2 MODES OF KNOWLEDGE
One way of thinking about the knowledge that is created through business research is provided by Gibbons et al (1994). These researchers talked about “Mode 1 knowledge” as that which is created by academics for an academic intellectual purpose, to further and add to what is known. This has to do with basic research and tends to be built on the foundations

AN INTRODUCTION TO BUSINESS RESEARCH METHODS
RESEARCH PROBLEMS AND QUESTIONS AND HOW THEY RELATE TO DEBATES IN RESEARCH METHODS
14
of what was known before, just as in any academic essay, you must discuss what is known (published) before you start to do your own research or consider how that knowledge might be further discussed or developed. Who wants Mode 1 knowledge? Usually other academics. An example of Mode 1 business knowledge could be: the concept of economies of scale.
The researchers distinguish this from “Mode 2 knowledge”, which is practical applied knowledge and comes from collaborating with practitioners or policy makers, for example managers in organizations. Who wants Mode 2 knowledge? People making business decisions or developing policy as well as academics interested in applied research. This kind of knowledge is much more dependent on an understanding of context because it is essentially “real world” knowledge. It is no use knowing that generally there are economies of scale if your business has overstretched itself by investing in a larger factory and profit has reduced as a result. An example of relevant Mode 2 knowledge here would be: how to calculate depreciation on capital investment with a particular country’s accounting standards and how this might be used in conjunction with business strategy objectives for expansion.
Huff and Huff (2001) also suggest a third mode of knowledge. “Mode 3 knowledge”. This is knowledge, which is neither produced specifically for academic purposes nor for direct application to practical need, but for understanding the bigger picture in relation to society’s survival and the “common good”. An example of Mode 3 knowledge might be: the impact of capitalism on developing countries in the African continent. This kind of information does not have specific immediate practical value (and would not find a business sponsor), and it may not result from academic enquiry, yet it could be of profound importance to international economic and social policy and business organizations in Africa.
Have a look on the web, use Google Scholar or another academic database or search engine, to find an example of business research and then classify it into Mode 1, 2 or 3 knowledge.
1.4 WHAT KIND OF BUSINESS PROBLEMS MIGHT NEED A RESEARCH STUDY?
Most work in business organizations, in whatever sector or ownership, will require research activities. We have already discussed the idea that business research in the context of this course is likely to involve some theory or concept as well as purely practical questions such as “how does the product range compare in terms of contribution to profit?” Or “which method of training has produced more output – coaching or a group training course?”
Both these questions have potential for theory application as well as simple numerical survey, but some research problems are more obviously underpinned by theoretical ideas.

AN INTRODUCTION TO BUSINESS RESEARCH METHODS
15
RESEARCH PROBLEMS AND QUESTIONS AND HOW THEY RELATE TO DEBATES IN RESEARCH METHODS
15
For example, those which seek to generalize or to compare one organization with another: “what are the most effective ways of introducing a new employee to the organization?” or “how do marketing strategies differ in the aerospace industry?”
When choosing an area for research, we usually start either with a broad area of management, which particularly interests us e.g. marketing or operations management, or we start with a very practical question like those in the last paragraph, which need answers to help with managerial decision-making.
Refining from this point to a researchable question, objective or hypothesis is not easy. We need to do a number of things:
• Narrow down the study topic to one which we are both interested in and have the time to investigate thoroughly.
• Choose a topic context where we can find some access to practitioners if possible; either a direct connection with an organization or professional body, or a context which is well documented either on the web or in the literature.
• Identify relevant theory or domains of knowledge around the question for reading and background understanding.
If you’re hoping for a truly modern education, one where you’re encouraged to speak your mind and to think long-term, both when it comes to your own future and the future of the planet. Then the University of Gothenburg is the place for you.
Study a Master’s programme in Gothenburg, Sweden | www.gu.se/education
INNOVATIVELIKE YOU.

AN INTRODUCTION TO BUSINESS RESEARCH METHODS
RESEARCH PROBLEMS AND QUESTIONS AND HOW THEY RELATE TO DEBATES IN RESEARCH METHODS
16
• Write and re-write the question or working title, checking thoroughly the implications of each phrase or word to check assumptions and ensure we really mean what we write. This is often best done with other people to help us check assumptions and see the topic more clearly.
• Use the published literature and discussion with others to help us narrow down firmly to an angle or gap in the business literature, which will be worthwhile to explore.
• Identify the possible outcomes from this research topic, both theoretical and practical. If they are not clear, can we refine the topic so that they become clear? (For example, ask yourself the question, if I find an answer, then what use is it?)
1.5 WHAT ARE THE KEY ISSUES IN RESEARCH METHODS WE NEED TO UNDERSTAND?
1.5.1 RESEARCH IS A MESSY ACTIVITY!
Saunders, Lewis and Thornhill (2016) provide a flow diagram of the research process. This helps us to see the process as a logical progression, which has certain stages, and this process would apply whether your research is for an academic purpose or a business purpose. However, this model could give a rather misleading impression, as the authors mention. Let’s take just two of the early stages: formulating the research topic and critically reviewing the literature.
Formulating the research topic, as we have seen above in the previous section, can take quite a time. We start with a broad idea of an issue or area for research such as the impact of flexible working on an organization, and this goes through many iterations before it turns into a working title and clear set of research questions. Often the working title does not get finalised until very near the end of the research, when the process and outcomes are clearer, but because this is the first thing which appears in the process, it can seem, often wrongly, to be a first stage. At best, the first stage is a tentative idea, sometimes a leap in the dark, an idea we want to test out. All it needs to do at this stage is give us a direction for research and some ideas about what to read and where to look for information. Much later, the research topic will be the label given to the completed research and will be how others navigate their way to our work, so by then it must be clear and precise.
Critically reviewing the literature – this stage seems to come early on in the research, and that is how it should be, since we must read what is published on a topic before we can begin to formulate clear ideas about how to proceed with primary research and which questions still need answers. However there is no one set time period in which we read the literature. We read as early as possible to get an idea of what is published, but we must

AN INTRODUCTION TO BUSINESS RESEARCH METHODS
RESEARCH PROBLEMS AND QUESTIONS AND HOW THEY RELATE TO DEBATES IN RESEARCH METHODS
17
keep on reading throughout the research as new items may be published in the area, and the primary research may lead us to form new questions of the literature, which involve new literature searches.
However, when we write up the research, it is likely that the literature review will appear to be an early and separate stage in the research process. In reality, it is iterative and “messier” than this.
1.5.2 THE RESEARCHER AFFECTS THE RESULTS OF RESEARCH.
Researchers try very hard to be objective and balanced in their enquiries and their writing. However there is no such thing as totally impersonal objective research. Imagine a scientific model, which sets out a hypothesis or a contention such as “H1: this new computer keyboard will improve typing speeds” and then seeks evidence to prove or disprove the hypothesis, (this is usually referred to as deductive research). This could be considered the closest to “objectivity”, especially when it is possible to experiment on one group and have a “control” group of similar subjects for comparison. For our hypothesis, we could divide all the keyboard users in our organization into two groups, time their typing speeds on the old keyboard on a particular task and then, from the speeds produced, set up two groups, each of which had a similar profile of typing speeds. Then we give a new task at the same time to each group, giving one group the new keyboard. Measure the results to test the hypothesis.
This sounds pretty objective.
So in what way could we, as the researchers, influence the results?
Because researchers are people, not machines, not only will their method of research affect their results, but their values will also affect results. The researcher’s mindset and personal values and experience will provide a filter for which method they use and what they see in the research results. This is often a consequence of the classic functional design model, where employees with similar disciplines (e.g. marketing, accounting, operations etc.) are grouped together for administrative purposes. An unintended consequence of this is “groupthink” (Janis 1983). When an employee wears her “researcher hat”, regardless of their discipline, they try to set aside as much as possible their internal bias and opinions.
Malcolm Gladwell (2000, 2005, 2008) helps readers to understand how we often make quick decisions based upon subconscious processes working within our own minds. His words will help you see the world differently and explain bias in everyday decision making.

AN INTRODUCTION TO BUSINESS RESEARCH METHODS
18
RESEARCH PROBLEMS AND QUESTIONS AND HOW THEY RELATE TO DEBATES IN RESEARCH METHODS
18
In our example about keyboard speeds above, can you see any possibility of bias in the research method? Can you see any assumptions or values? Can you see any ways in which we might look for particular results to confirm what we think?
Just to illustrate this idea a little further, imagine a company in which profit levels are falling. The finance director may see a financial problem here and will research sales and cost trend data, looking for that financial problem. The marketing director will look for problems in the marketing strategy, or more likely the way other people in the business have prevented the marketing strategy from being carried out effectively. The non-executive director may see an industry trend as the problem, and will research professional literature to support his or her idea. Each is likely to find the problem they look for, and they may all be right to some extent.
In business research, we must try our hardest to look for possible bias in both how we conduct the research and in what we think we have found. But since we cannot eradicate all bias, we must also be explicit about the perspective which may colour our research, so that readers of our results can understand we do not find “the truth”, just one version of that truth in a particular context.
© Deloitte & Touche LLP and affiliated entities.
360°thinking.
Discover the truth at www.deloitte.ca/careers
© Deloitte & Touche LLP and affiliated entities.
360°thinking.
Discover the truth at www.deloitte.ca/careers
© Deloitte & Touche LLP and affiliated entities.
360°thinking.
Discover the truth at www.deloitte.ca/careers © Deloitte & Touche LLP and affiliated entities.
360°thinking.
Discover the truth at www.deloitte.ca/careers

AN INTRODUCTION TO BUSINESS RESEARCH METHODS
RESEARCH PROBLEMS AND QUESTIONS AND HOW THEY RELATE TO DEBATES IN RESEARCH METHODS
19
1.5.3 THE DIFFERENCE BETWEEN QUALITATIVE AND QUANTITATIVE RESEARCH
As we move through this book, we will be looking at a wide range of ways to approach business research, especially in the third chapter when we look at research designs. For now, it is simply important to distinguish two major approaches: qualitative and quantitative. Of course, by now in your studies, you will have noticed that nothing is really “simple” in academic work! So in order to talk sensibly about qualitative and quantitative approaches we also have to introduce a few other ideas.
Deductive versus Inductive
As mentioned above, a deductive approach begins by looking at theory, produces hypotheses from that theory, which relate to the focus of research, and then proceeds to test that theory. But that is not the only way to use theory in research. An inductive approach starts by looking at the focus of research (the organization, a business problem, an economic issue etc.) and through investigation by various research methods, aims to generate theory from the research. A simple way to put it would be: deductive reasoning moves from the general to the specific and inductive reasoning moves from the specific to the general. For deductive reasoning to work, we need to have confidence in the general premise, or theory, on which it is based. For inductive reasoning to work, we need to make careful observations of the specific situation and to consider possible causal links in that situation in order to produce a reliable idea or theory which relates to other situations too. For a good presentation further expanding on inductive and deductive reasoning, watch this video: https://www.youtube.com/watch?v=ZBxE0y7b464
Sherlock Holmes, the infamous detective had the extraordinary ability to use logic and reasoning to make accurate deductions from the evidence he collected. To most casual observers, this evidence would seem meaningless and be overlooked or ignored. The process of deduction requires accumulating evidence, asking the right questions (interrogating), formulating and then evaluating a hypothesis, and reaching a conclusion (Smith, 2012). The research process may require a mix of inductive and deductive reasoning in order to identify and solve business problems.
Divergent and Convergent thinking
Inductive reasoning requires divergent thinking. However, people are better at convergent thinking. In the diagram below, try to connect all nine dots with four straight unbroken lines.

AN INTRODUCTION TO BUSINESS RESEARCH METHODS
20
RESEARCH PROBLEMS AND QUESTIONS AND HOW THEY RELATE TO DEBATES IN RESEARCH METHODS
20
Figure 1: Nine dots puzzle
Divergent thinking solves the nine dot puzzle. See below. You have to think “outside the box” for the solution. This is helpful in the problem identification or “problematisation” phase of research.
Linköping University – Innovative, well ranked, European
Interested in Strategy and Management in International Organisations? Kick-start your career with an English -taught master’s degree.
liu.se/master
Click here!

AN INTRODUCTION TO BUSINESS RESEARCH METHODS
RESEARCH PROBLEMS AND QUESTIONS AND HOW THEY RELATE TO DEBATES IN RESEARCH METHODS
21
1 2
3
4
Figure 2: Nine dots solution
In school, we are often taught not to “colour outside the lines”. Even answers to the most perplexing problems, requiring rigorous research, are often out there in the fringe of our perception. That’s what makes solving them so tricky. Once we have identified the underlying problem, having engaged in a creative and divergent process, allowing lots of answers and problems to be generally possible, then it’s time to move to a more convergent or evaluative thinking model to complete the research and look for the solution.
Qualitativemethods
Perceived problem or symptom
Solution
GeneralGeneral
Specific
Specific Quantitative
methods
Divergent thinking(inductive reasoning)
Convergent thinking(deductive reasoning)
Evaluativeprocess
Creativeprocess
Figure 3: Divergent then Convergent process in problem solving

AN INTRODUCTION TO BUSINESS RESEARCH METHODS
RESEARCH PROBLEMS AND QUESTIONS AND HOW THEY RELATE TO DEBATES IN RESEARCH METHODS
22
Failure to explore the problem thoroughly at the start regularly happens in business. Time pressures, boss pressures, customer pressures all force people to act quickly, often without thinking things through. As a researcher, you need to resist the urge to jump to a conclusion; aim to explore the problem creatively, widening out the possible ways forward, before you use convergent and evaluative research approaches to reach a solution.
Positivist versus Interpretivist
A positivist approach is usually associated with natural science research and involves empirical testing. Positivism states that only phenomena which we can know through our senses (sight, smell, hearing, touch, taste) can really produce “knowledge”. It promotes the idea of experimentation and testing to prove or disprove hypotheses (deductive) and then generates new theory by putting facts together to generate “laws” or principles (inductive). Positivists suggest that this kind of research can be “value free” (but see our discussion on bias above). Finally, positivist research is about objective rather than subjective (normative) statements and only the objective statements are seen to be the proper domain of scientists. You can find examples of this approach in randomized controlled trials used for testing new medicines. A control group is used where the new medicine is not used, or a placebo is used, and the test results of this group are compared with results from a group using the new medicine. This aims to find the truth about the new drug – did it help or didn’t it. In business research, such trials are rarely possible because of the difficulty of creating useful control groups, and the difficulty of narrowing down one changed variable (like the drug in a controlled trial).
We contrast this with the idea of “interpretivism”. This is much more common in the social sciences, in which business and management belongs. Because business and management involve people as well as things, the interpretivist argument promotes the idea that subjective thought and ideas are valid. This idea is broadly based on the work of Max Weber (1864–1920) who described sociology as a social science “which attempts the interpretive understanding of social action in order to arrive at a causal explanation of its course and effects” (1947, p. 88). An interpretivist researcher aims to see the world through the eyes of the people being studied, allowing them multiple perspectives of reality, rather than the “one reality” of positivism.
Objectivist versus constructivist
This is a different angle on the ideas above. Objectivism states that social entities (like organizations, societies, teams) have an existence, which is separate from the people in them. You will have discussed the company as a legal entity earlier in your studies, we know it has a legal existence. So from a legal point of view, objectivism is fine. Suppose now we

AN INTRODUCTION TO BUSINESS RESEARCH METHODS
RESEARCH PROBLEMS AND QUESTIONS AND HOW THEY RELATE TO DEBATES IN RESEARCH METHODS
23
consider the idea of a “learning organization” (Senge, 2006). Clearly people in organizations can learn, but to what extent could we say the organization itself learns? Who teaches it? Who assesses that learning? This is a big debate, but we are using this idea to show that an objectivist view would say there definitely is an entity (the organization) independent of the people in the organization which can learn and foster learning. Constructivists would say on the contrary that the organization has no independent reality. It is constructed in the minds of those who think about it. So every time we think about an organization, we are “constructing” it into some kind of reality. From this perspective, the organization only has an existence in the minds of people, whether they are the staff or managers, customers, suppliers, contractors, government, professional bodies or, of course, business researchers.
Quantitative versus qualitative?
So where do these different ideas take us in relation to understanding qualitative and quantitative research strategies? We can use the other concepts above to help us build a picture:
A quantitative approach to research is likely to be associated with a deductive approach to testing theory, often using number or fact and therefore a positivist or natural science model, and an objectivist view of the objects studied.
A qualitative approach to research is likely to be associated with an inductive approach to generating theory, often using an interpretivist model allowing the existence of multiple subjective perspectives and constructing knowledge rather than seeking to “find” it in “reality”.
In current business and management research, you are likely to find a mix of both quantitative and qualitative strategies, looking at observable objective facts where they might be seen to exist, through the use and manipulation of numbers, and looking also at the perceptions of those involved with these “facts”. So in a practical sense, we try to use the best of both worlds to investigate the messy reality of people and organizations. Sound business research often uses both strategies (“mixed-methods”) in coming to valid and accurate conclusions for the problem-solving process.
You may wish to search the web for an article in the International Journal of Social Research Methodology which is the transcript of an interview with the famous social anthropologist Peter Townsend (Thompson, 2004). Although this is not research directly related to business, you should be looking in this article to find some understanding of the complexity and messiness of research, the influence of the researcher on the research and some of the differences between qualitative and quantitative methods.
AN INTRODUCTION TO BUSINESS RESEARCH METHODS
24
RESEARCH PROBLEMS AND QUESTIONS AND HOW THEY RELATE TO DEBATES IN RESEARCH METHODS
24
1.6 QUESTIONS FOR SELF REVIEW
1. What is the difference between Mode 1, Mode 2 and Mode 3 knowledge and why does it matter in business research?
2. What do you think will be the most difficult part of identifying research problems for study and why?
3. Do you prefer the idea of conducting quantitative or qualitative research? Is this just about statistics versus interview research methods? Check what each of these means in terms of what you believe is the nature of knowledge and what you believe about business organizations.
1.7 REFERENCES
Bryman, A. & Bell, E. 2015, Business research methods, 4th Edn. Oxford University Press, Oxford, UK.
Gibbons, M.L. & Limoges, H. et al. 1994, The New Production of Knowledge: The Dynamics of Science and Research in Contemporary Societies. Sage, London.
Gladwell, M. 2000, The tipping point. Little, Brown & Co, New York.
We will turn your CV into an opportunity of a lifetime
Do you like cars? Would you like to be a part of a successful brand?We will appreciate and reward both your enthusiasm and talent.Send us your CV. You will be surprised where it can take you.
Send us your CV onwww.employerforlife.com

AN INTRODUCTION TO BUSINESS RESEARCH METHODS
RESEARCH PROBLEMS AND QUESTIONS AND HOW THEY RELATE TO DEBATES IN RESEARCH METHODS
25
Gladwell, M. 2005, Blink: the power of thinking without thinking. Little, Brown & Co, New York.
Gladwell, M. 2008, Outliers. Little, Brown & Co., New York.
Huff, AS & Huff, JO 2001, “Re-focusing the business school agenda”, British Journal of Management, vol. 12, special issue, pp. 49–54.
Janis, I. 1983, Groupthink: Psychological studies of policy decisions and fiascoes. Houghton Mifflin, Boston.
Saunders, M. Lewis, P. & Thornhill, A 2016, Research methods for business students. 7th Edn. Pearson Education Limited, Harlow, England.
Senge, P.M. 2006, The fifth discipline: The art and practice of the learning organization, 2nd Edn. Currency; Doubleday, New York.
Smith, D. 2012, How to think like Sherlock. London, O’Mara Books Limited, London.Thompson, P. 2004, “Reflections on becoming a researcher: Peter Townsend interviewed by Paul Thompson.” International Journal of Social Research Methodology, vol. 7, no. pp. 85–95.
Weber, M. 1947, The Theory of social and economic organization. (Translated by Henderson, AM & Parsons, T.) Free Press, New York.
AN INTRODUCTION TO BUSINESS RESEARCH METHODS
PUTTING THE PROBLEM INTO CONTEXT: IDENTIFYING AND CRITICALLY REVIEWING RELEVANT LITERATURE
26
2 PUTTING THE PROBLEM INTO CONTEXT: IDENTIFYING AND CRITICALLY REVIEWING RELEVANT LITERATURE
2.1 CHAPTER OVERVIEW
2.1.1 LEARNING OUTCOMES
By the end of this chapter successful students will be able to:
1. See how literature review relates to research projects2. Identify literature from primary, secondary and tertiary sources3. Undertake effective literature searching and become an effective consumer of research4. Critically analyse literature for a research project5. Apply Harvard referencing style and understand reference management
2.2 HOW DOES LITERATURE RELATE TO RESEARCH?
In Chapter 1 we discussed superficial research studies and the idea that theory was going to be relevant to good quality business research, whether or not immediate practical questions needed an answer. We also talked briefly about what theory was and what it was for. We identified deductive research, which looked first at theory and identified propositions or hypotheses, which the research was meant to confirm or disprove, and we found the opposite direction, inductive research which begins with the study of a situation and then seeks to generate theory.
Any research study, inductive or deductive, which you undertake for academic purposes, will always require a review of relevant literature, and that will be a “critical” review, not just a description of what others have said. When you are working in an organization, you may find that there is no time to conduct a full literature review, but this chapter will try to convince you that a clear idea of the theoretical context of a piece of research, helps you to clarify its purpose and outcomes, and make clear for which situations your findings do or do not hold. We all need to get into the habit of literature searching before working out how to research a particular topic.

AN INTRODUCTION TO BUSINESS RESEARCH METHODS
27
PUTTING THE PROBLEM INTO CONTEXT: IDENTIFYING AND CRITICALLY REVIEWING RELEVANT LITERATURE
27
At the very minimum, it is desirable to search professional or industry sources of information before completing a research study of any kind at work. This will demonstrate your professionalism and the breadth of your understanding of the field. Anyone can ask a few people to fill in a questionnaire, but not everyone can make sense of the answers!
Robert Sutton presents the case for using scholarly research in business in an article in Strategy and Leadership (2004). See if you can track down this article on the web and see what you think of his views. There is a strong case there for what we do when we search for and review what others have published in the field. Most business problems can be illuminated by finding out what others have thought before and then trying to apply some of their ideas – this is a natural response, as we chat with friends or colleagues about problems. How much better then to look for and use the extensive work researchers have put in on similar problems and gain the advantage of their scholarly work, provided we can put it into our own context.
���������������������� ���� � �
����������������������� ��� ������������������������������������� �� ���� ����� ������������� ��������� ���������������������������������� ���� ����������� ���� �������� ����������������������� ������� ���� ��������� ��� �������� ������������������� ������������������
� ����������������� �� ������������������� �

AN INTRODUCTION TO BUSINESS RESEARCH METHODS
PUTTING THE PROBLEM INTO CONTEXT: IDENTIFYING AND CRITICALLY REVIEWING RELEVANT LITERATURE
28
2.3 WHAT KIND OF LITERATURE SHOULD WE SEARCH FOR?
At an early stage in trying to identify a research project, any kind of literature may help us. So a Google search (www.google.com) or using Wikipedia (www.wikipedia.com) or any other general search engine will help us experiment with key words until we begin to find material which is helpful.
As soon as we get a clearer idea of what is out there, we need to identify specific kinds of literature, so that we can judge the relative merit of what we find for our research study.
2.3.1 PRIMARY LITERATURE SOURCES
These are the sources, which are the least accessible, often being company literature or unpublished research, private correspondence and can include conference proceedings. What is their value? In some cases this is very valuable information, which relates directly to the research problem in which you are interested. For example, suppose you are researching corporate advertising to children, an area, which is sensitive. Much information about what companies decide, and why, will be contained in company documents and emails. However access to primary sources is becoming easier as the web provides an instant publishing medium.
Blogs and personal websites are able to bring primary literature directly to the public, however we should bear in mind that in such direct personal publication, there is no vetting or monitoring process as there usually is in a secondary source. DO NOT confuse primary literature sources with “primary research”. The latter means research you have conducted yourself for a specific purpose (which produces more primary literature i.e. yours).
2.3.2 SECONDARY LITERATURE SOURCES
These sources are much more easily available in the public domain. They include published books and articles in journals, news media and published business, government and international body publications. Why are they secondary sources? Usually they reproduce in a different format what was original primary work. For example, a researcher will often first reveal their findings at a relevant conference and these may get published later in an academic journal. Similarly, business consultants will report research findings to their clients – often the company in which or for which the research was completed – but later may seek permission to disseminate findings more publicly, perhaps in an anonymised or generalized form, in a professional journal or news report.

AN INTRODUCTION TO BUSINESS RESEARCH METHODS
PUTTING THE PROBLEM INTO CONTEXT: IDENTIFYING AND CRITICALLY REVIEWING RELEVANT LITERATURE
29
Value is high but information in these publicly available media is likely to be less current than primary sources, due to the time it takes to check, review, authorise and publish. However, the web is making a huge difference here. Already many academic journals and professional publications are available full text on the web. In some cases, there is no time difference between primary and secondary sources.
For academic research, peer-reviewed journals, such as the Journal of Management Studies, are considered more reliable sources than trade magazines or news channels, as the material will have to be monitored by experts in the relevant field, who are not in the business of selling publications. The process of peer review is usually rigorous. When someone submits a paper to an academic journal, the editor will first check it fits with the aims and scope of the journal, then check the content is relevant and clearly written and well argued. Only then does the paper normally get sent to other academics not known by the author, who are asked to read and review the paper and suggest improvements and whether they think it is fit for publication. At least two, sometimes more, such referees are approached with the paper. Only when they have sent in their reviews (and these are unpaid and have to be fitted in around other academic teaching and research so they may take some time), can the editor consider their suggestions and send them back to the author. Then the author has the choice to accept and modify their paper, which again takes some time, before resubmitting the amended paper. This process of peer review may happen two or three times for each paper until everyone believes the paper is fit for publication. Then it gets into a queue for the publisher to release, often electronically first, then on paper if it is a print journal. This whole process can take more than a year, which explains the time lag on published academic work and the serious rigour introduced by peer review.
Textbooks may also be peer-reviewed to some extent, but due to the time lag of publication, and the need to reach a wider readership in order to recoup the costs of publication, they tend to be less specialised than journal articles and possibly less current.
It is also possible to find academic journal articles which are themselves reviews of academic literature. While most articles will mention and relate to studies to the published field, a published literature review will provide a deep and wide range critique within a particular field. Of course, the review will only be useful at a time close to its publication, since there will usually be additions to the field after that time which are not included. There is a rigorous method for undertaking such reviews, known as “systematic review”. A systematic review is a type of literature review which tries to find, evaluate and synthesize all good quality research evidence on a particular topic or research question. The review includes a thorough assessment of methodological quality, looking in detail at how research questions in this literature were connected to existing literature at the time, and how research methods were chosen and how rigorously they were used.

AN INTRODUCTION TO BUSINESS RESEARCH METHODS
30
PUTTING THE PROBLEM INTO CONTEXT: IDENTIFYING AND CRITICALLY REVIEWING RELEVANT LITERATURE
30
All this detail is to help the reader judge the reliability and quality of the research. Such systematic reviews enable findings to be checked by readers as they show an audit trail of review, and are usually high quality scholarly works. To undertake a systematic review, we have to do a thorough search of the literature for relevant papers and show where and how we searched in the review itself. This could be listing the databases and citation indexes searched, plus journal websites and hand-searched individual journals and other sources. Remember that although most literature can be tracked down somehow on the Web, much literature is not easily found through standard search engines, and some will be inaccessible online (the content may be subscription only or just the abstract and citation will be there, or it is unpublished). This thorough search is conducted against clear criteria, determined by the research question. The outcome is a synthesis of known research on the question or topic and will be transparent and easy to follow. If there are limitations to the research review, these will be clearly stated.
Consider doing a brief search using either Google Scholar (https://scholar.google.com/) or another database or search engine such as Emerald for a “systematic review” of an area of business literature. Read the abstract, or the full article if you prefer, and familiarise yourself with a good quality literature review. Moving from a basic Google.com search to using Google Scholar is an easy transition as they both work in much the same way. Google Scholar is
Maersk.com/Mitas
�e Graduate Programme for Engineers and Geoscientists
Month 16I was a construction
supervisor in the North Sea
advising and helping foremen
solve problems
I was a
hes
Real work International opportunities
�ree work placementsal Internationaor�ree wo
I wanted real responsibili� I joined MITAS because
www.discovermitas.com

AN INTRODUCTION TO BUSINESS RESEARCH METHODS
PUTTING THE PROBLEM INTO CONTEXT: IDENTIFYING AND CRITICALLY REVIEWING RELEVANT LITERATURE
31
a free, searchable database providing sources for both digital and hard copies of text from a variety of publishers, including books, articles, papers, theses and dissertations, abstracts and technical reports from business, governments, universities and academic publishers. There is another great reason for using Google Scholar in your literature search: it offers citations – links to the number of times a particular paper has been cited by others – which can help us determine the popularity and to some extent the quality of a paper before you even open it. Do bear in mind though that citations take time to appear. If the paper was published in the last year or two, it is unlikely that other papers will have been published citing it given the time it takes to publish after peer review.
2.3.3 TERTIARY LITERATURE SOURCES
These are collections of, or gateways to, secondary sources. They include encyclopaedias, dictionaries, citation indexes, catalogues and web-based portals, databases and journals’ contents pages. We use tertiary sources to track down secondary literature which is relevant to our field of study.
Useful lists and details of primary, secondary and tertiary literature sources are given in most business research methods textbooks; for example (Saunders, Lewis, & Thornhill 2016, pp. 83–89).
2.4 EFFECTIVE LITERATURE SEARCHING
Most of you will have received guidance on literature searching at some point in your studies. Just in case you don’t remember it, or you would like a refresher, here are some tips. If you are comfortable with literature searching, skip this section and go to 2.5.
Sometimes searching for academic literature is simple. You want academic information on a specific topic or by a particular author. You put the information into a web search engine and there it is.
But sometimes it can seem like looking for a needle in haystack.
For these times, consider a three stage search:

AN INTRODUCTION TO BUSINESS RESEARCH METHODS
PUTTING THE PROBLEM INTO CONTEXT: IDENTIFYING AND CRITICALLY REVIEWING RELEVANT LITERATURE
32
Stage 1
1. First, make sure you are using appropriate search terms. Perhaps you don’t know enough about the topic to use the right vocabulary for searching. Or someone mentions a theory or idea, which means nothing to you. As a first step, just enter whatever you do know into Google or Wikipedia. Remember that to narrow a search engine search you need to lengthen (i.e. make more specific) the search string. E.g. rather than just looking for “motivation”, try more detail “Herzberg’s theory of motivation”. Hopefully that will bring you fewer and more relevant results. Using Google Scholar instead of general Google search will help to eliminate many of the commercial and marketing oriented “hits” which are associated with your search terms.
2. Are there American/UK English words and spellings to look out for? Use AND & OR to refine your search. Use ‘truncation’ (e.g. sociol+ to find sociology or sociological). Use ‘wild cards’ (e.g. p*diatrics to allow for different spellings of paediatrics or pediatrics).
3. Once you have some results, scroll through and look for academic domain names in your results. E.g. …ac.uk or ….edu.au Such academic sites are more likely to give you reliable general information. There are often course outlines on the web for Higher Education courses, which give basic information on topics or theories. Use these academic links to find more vocabulary to describe your topic search. A little reading at this point will help you narrow your second stage search.
4. Alternatively, you could look in a relevant book for useful keywords and definitions. Try using the index!
Stage 2
5. Now you have better vocabulary to describe what you are looking for, try a relevant database or portal (tertiary literature source). Examples for business research are Emerald (www.emeraldinsight.com good range of academic management journals, often fulltext), ABI/Inform Global (www.ovid.com wide range of periodicals and reports), Business Source Premier (http://www.ebscohost.com/academic/business-source-premier again a wide range of journals but also useful sources such as Harvard Business Review, Academy of Management Review and professional journals), and the Social Sciences Citation Index (http://mjl.clarivate.com/cgi-bin/jrnlst/jlresults.cgi?PC=SS this only has abstracts and titles but gives a wide search of what is currently being published in the social sciences).

AN INTRODUCTION TO BUSINESS RESEARCH METHODS
33
PUTTING THE PROBLEM INTO CONTEXT: IDENTIFYING AND CRITICALLY REVIEWING RELEVANT LITERATURE
33
6. Within the portal or database, use your more specific search terms and make sure you are looking in the right place e.g. full text or abstract or keywords rather than journal title.
7. Hopefully this search will find some useful academic articles. Read the abstracts and if they look appropriate, try to go to full text if available. If not available see step 9.
8. Consider downloading 3 academic articles, which relate to your chosen topic. If they are Full text, then scroll straight to the reference list at the end. Compare them and see which authors and works appear in more than one of the three lists. If you find some, you have probably found important academic sources on your topic. Go back to your academic database (such as Emerald full text) to key in these author names or titles to find good quality information on your topic.
Stage 3
9. Often the full text version of the articles you want is not available. It may ask you to subscribe or pay, or it may simply not be online as full text. In this case, print off the abstract and journal details of articles and take them to your library. In some cases an inter-library loan or a photocopy can be procured for you.

AN INTRODUCTION TO BUSINESS RESEARCH METHODS
PUTTING THE PROBLEM INTO CONTEXT: IDENTIFYING AND CRITICALLY REVIEWING RELEVANT LITERATURE
34
10. Don’t give up on important articles just because they aren’t fully online. Physically going to the library may lead you to other similar information which is also not online. Also books! Loans of articles and books can take some time so don’t leave this until the assessment deadline.
11. Finally, remember that searching for relevant literature is just one, quite time-consuming, stage of research. Leave plenty of time to do this, because much of what you find and read will not be useable in your final research study, but without searching and reading a wide range of literature, you are less likely to find the really appropriate sources that you need.
2.4.1 HOW DO WE KNOW WHEN WE HAVE FOUND ENOUGH?
It is impossible to answer this question accurately. However, when you begin to find references to the same ideas and authors in several articles you have found, you should start to feel more comfortable that you have covered a good range of the literature for this topic. While you are still discovering yet more and more angles to the topic in your reading, keep on reading.
In most academic domains there are “seminal” articles or books, which are widely cited by other authors in the field. These are usually important to read, preferably in the original version if you can get hold of them. They will be the key pieces of literature, which have shaped the thinking of researchers and practitioners in the field. We had an example of this in the last chapter when we discussed interpretivist research approaches and mentioned Weber (1947). Many writers on research methods, and sociology and philosophy, use his work, so although it was written many years ago, it is still widely cited.
2.4.2 HOW UP TO DATE SHOULD REFERENCES BE?
As just mentioned, seminal works may go back a very long way in time. However, if we are discussing a relatively modern issue, for example employment protection legislation, then we need to use absolutely up-to-date references to show we understand current trends. It is not that older articles are less important, just that they may have been superseded in the field. Some academic journals regularly invite contributors to critique or respond to new articles. If you are using one of these journals (an example would be Interactive Learning Environments on learning technology published by Taylor and Francis), then it is worth reading through the response articles as they often produce valuable critiques of the main article. As a general rule, look for academic references within the last three years for preference, going back further if you cannot find enough useful material.

AN INTRODUCTION TO BUSINESS RESEARCH METHODS
PUTTING THE PROBLEM INTO CONTEXT: IDENTIFYING AND CRITICALLY REVIEWING RELEVANT LITERATURE
35
If you are using professional journal or media information (e.g. in UK Financial Times, The U.S. based Wall Street Journal or People Management, a professional HRM magazine) then aim to use very current material, within the last two years if possible. Out of date news items are rarely useful in academic work, unless you are doing a historical analysis.
2.5 CRITICAL ANALYSIS OF LITERATURE
2.5.1 WHAT DOES “CRITICAL” MEAN?
The following table is an extract from The Study Skills Handbook (Cottrell, S., 2008). You might consider using this when you are drafting a piece of work. Check for those parts of your writing, which do the things on the left, and look across to see how you can redraft them into a critical analytical style.
Descriptive writing Critical analytical writing
States what happened Identifies the significance
States what something is like Evaluates strengths and weaknesses
Gives the story so far Weighs one piece of information against another
States the order in which things happened Makes reasoned judgements
Says how to do something Argues a case according to the evidence
Explains what a theory says Shows why something is relevant or suitable
Explains how something works Indicates why something will work (best)
Notes the method used Identifies whether something is appropriate or suitable
Says when something occurred Identifies why the timing is of importance
States the different components Weighs up the importance of component parts
States options Gives reasons for selecting each option
Lists details Evaluates the relative significance of details
Lists in any order Structures information in order of importance
States links between itemsShows the relevance of links between pieces of information
Gives information Draws conclusions
AN INTRODUCTION TO BUSINESS RESEARCH METHODS
36
PUTTING THE PROBLEM INTO CONTEXT: IDENTIFYING AND CRITICALLY REVIEWING RELEVANT LITERATURE
36
For much more in depth advice, consider looking at a book on critical thinking (e.g. Browne, M.N. and Keeley, S.M. 2011)
2.5.2 CRITIQUING A PUBLISHED ARTICLE
Saunders, Lewis & Thornhill (2016) discuss Mingers’ (2000) idea of four aspects of a critique (pp. 225–6) i.e. critiques of rhetoric, tradition, authority and objectivity. They also classify the types and purposes of reviews; such as integrative, historical, theoretical, methodological and systematic (p. 74).
You could add a practical critique to this list, for example ask the question “How does this article or idea relate to a specific organization, sector or problem?” Could the findings be generalized to a particular context? If the author did not set out to generalize the findings or apply them to a particular context, then we cannot be negative about this, since it was not the author’s purpose. Yet some concepts can be particularly useful in delivering an insight to a practical business situation.
Open your mind to new opportunitiesWith 31,000 students, Linnaeus University is one of the larger universities in Sweden. We are a modern university, known for our strong international profile. Every year more than 1,600 international students from all over the world choose to enjoy the friendly atmosphere and active student life at Linnaeus University.Welcome to join us!
Bachelor programmes inBusiness & Economics | Computer Science/IT | Design | Mathematics
Master programmes inBusiness & Economics | Behavioural Sciences | Computer Science/IT | Cultural Studies & Social Sciences | Design | Mathematics | Natural Sciences | Technology & Engineering
Summer Academy courses
Scholarships

AN INTRODUCTION TO BUSINESS RESEARCH METHODS
PUTTING THE PROBLEM INTO CONTEXT: IDENTIFYING AND CRITICALLY REVIEWING RELEVANT LITERATURE
37
For example, Herzberg’s ideas on a two factor theory of motivation (1966) could be perceived as a universal generalization about how we understand what motivates staff. This finding could be practically applied by minimising focus on dissatisfiers and maximising the focus on motivating factors. A narrower context might render the theory less powerful, for example a workplace where staff delivered a routine public service with few opportunities for intrinsic motivating factors (no career development or job change possibilities, no reward potential) where extrinsic dissatisfiers could be more useful in relation at least to staff retention.
If you have difficulty thinking critically about something you are reading, you may wish to try applying the following set of questions, developed by Professor Tom Bourner (2003).
What explicit assumptions are being made? Can they be challenged?What implicit/taken-for-granted assumptions are being made? Can they be challenged?How logical is the reasoning?How sound is the evidence for the assertion(s)?Whose interests and what interests are served by the assertions?What values underpin the reasoning?What are implications of the conclusions?What meaning is conveyed by the terminology employed and the language used?What alternative conclusions can be drawn from the evidence?What is being privileged and what is off-the-agenda in this discourse?What is the context of this discourse? From what different perspectives can the discourse be viewed?How generalisable are the conclusions?
Source: Bourner 2003
Now we will introduce one more way of critically reviewing academic literature – it is practical and may save you some time in the long run. This is a method designed by UK academics Mike Wallace and Alison Wray and it is starting to be widely used in the UK in universities.
It consists of first producing a synopsis of anything you read, it may be an article or a chapter of a book. You have to ask Five Critical Synopsis Questions of this article or chapter as follows (and, of course, note down your answers).
Why am I reading this?What are the authors trying to do in writing this?What are the authors saying that’s relevant to what I want to find out?How convincing is what the authors are saying?In conclusion, what use can I make of this?
AN INTRODUCTION TO BUSINESS RESEARCH METHODS
PUTTING THE PROBLEM INTO CONTEXT: IDENTIFYING AND CRITICALLY REVIEWING RELEVANT LITERATURE
38
From your answers to these questions, you can write a critical summary through the following structure:
TitleIntroducing the text – use Question 1 to write this Reporting the content – use Questions 2 and 3 to write this Evaluating the content – use Question 4 to write this Drawing your conclusion – use Question 5 to write this.
When you are producing a literature review which will compare a number of articles or chapters about a subject, if you have completed the synopsis questions, again you have a ready-made set of information with which to compare articles:
So a comparative critical summary would take this structure:
TitleIntroducing the text – use answers to Question 1 for all textsReporting the content – use answers to Questions 2 and 3 for all texts to answer this (you can synthesise the answer rather than dealing with each one in turn)Evaluating the content – use answers to Question 4 for all texts to answer this (you can easily compare each text this way)Drawing your conclusion – use answers to Question 5 to compare how useful each of the texts is in relation to your research question.
This method is quite simple in structure, but will produce really good academic critical analysis if you think carefully about your synopsis in the first place.
2.5.3 ARE THERE DIFFERENT WAYS OF READING ACADEMIC LITERATURE?
It is always tempting to read without writing. Reading for academic purposes, however, invariably means reading with a computer or mobile device to hand, or pen and paper, so that notes can be made during reading.
Even just highlighting important extracts as you read can be futile if you are not going to go back over the highlighted text and read it again to make useful notes.
What kind of notes do you make? First it will be vital that you note down bibliographic details (the information you would include in a reference) if you are making notes outside

AN INTRODUCTION TO BUSINESS RESEARCH METHODS
39
PUTTING THE PROBLEM INTO CONTEXT: IDENTIFYING AND CRITICALLY REVIEWING RELEVANT LITERATURE
39
the text itself (on a separate piece of paper, in a notebook, in a database or citation software). Always remember key details such as volume and issue numbers of journal articles, access dates if retrieving articles online, editors if you are reading a contributed chapter in a book. On top of this, we need to note responses to what you are reading e.g. surprise, disbelief, admiration, links to other things you have read, questions. Doing this helps to ensure you don’t just record a description, but that you are starting to respond critically to what you read.
2.5.4 SHOULD I DEAL WITH EACH REFERENCE
SEPARATELY IN THE LITERATURE REVIEW?
It is possible to do this, but it is not best practice. If you look at an article from a peer-reviewed academic journal such as Personnel Review (published by Emerald Emeraldinsight.com), you will rarely find a section on the literature, which deals with each piece separately. Instead you find that authors summarise and synthesise ideas from the literature, listing references together where they all take a particular perspective, discussing them separately only when the difference between them is important to the article or research study.

AN INTRODUCTION TO BUSINESS RESEARCH METHODS
PUTTING THE PROBLEM INTO CONTEXT: IDENTIFYING AND CRITICALLY REVIEWING RELEVANT LITERATURE
40
This means that we can start to see some stages in preparing a literature review:
• General keyword search to learn about the topic area• More specific search (online and in libraries) to identify high quality literature
(academic and professional) which relates to the topic area and research questions• Using really relevant and good quality articles to identify others in the field through
their bibliographies• Reading as much of what we find as possible until we are not finding new ideas
Noting in a retrievable format not only what these articles and chapters say but their bibliographical details (including access dates for web material) and your critical responses to them and links with other literature (similarities, differences)
• Reviewing notes and discarding items which do not fit the research study• Making new notes of the themes in the relevant literature• Writing the literature review on the basis of these themes, including appropriate
referencing.
Summarising what you have learned from the literature review relating to your research study.For example, what gap your primary research needs to fill, or what hypotheses you could test from the literature.
2.5.5 SHOULD I INCLUDE MY OWN OPINIONS?
Just recording your likes and dislikes about a piece of writing is insufficient, since this just tells us about you, not about the piece of writing. Often universities spend some time encouraging students not to include their own opinions in their academic work, and this is because many students do include very subjective reactions to theories, models or concepts, without arguing logically for their view or supporting it with evidence from published literature.
However, your opinion is important. Provided your opinion is based on evidence and logical reasoning, and is expressed fairly and objectively, it is valuable. You will find that the simplest place to express your opinions, and develop them, is either in class, if you attend a class, or online in a discussion forum about this topic or study. A discussion forum thrives on argument and people expressing ideas and being open to others’ ideas. However, your academic assignment will need careful and cautious monitoring of how you express your views, to ensure that you express a balanced view, having weighed up, and referenced where possible, both sides of an argument.

AN INTRODUCTION TO BUSINESS RESEARCH METHODS
PUTTING THE PROBLEM INTO CONTEXT: IDENTIFYING AND CRITICALLY REVIEWING RELEVANT LITERATURE
41
Consider searching for an academic article, preferably a systematic review as mentioned above, on a business topic which interests you, follow the general search advice in these notes until you have tracked one down. Read and make notes on the article and then develop a 250 word critical response to the article, using the technique described above. This should provide you with useable notes for revision later, as well as good notes on the article if you are using it for an assignment.
2.6 USING HARVARD REFERENCING STYLE
For any research of professional standard, consistent referencing of all sources of information used is vital. You will already have been doing this in your degree course, but at this stage in your studies you will be penalised if the referencing style is not correct. When you have produced your own research studies and published them, you will want them to be correctly referenced so that no-one uses your work without attributing it to you.
The Harvard style is the most common referencing style in use in universities across the world, but other styles do exist. The main point about Harvard style is that it does not use footnotes, which can interrupt the flow of the text, and its bibliography is ordered alphabetically by author surname. Most in-text referencing includes simply the author surname(s) and year of publication, plus page number if a direct quotation is given. This means it is easy to find that reference in the surname ordered bibliography.
The basic bibliographic style is author, year of publication, title, publisher, so even for web pages without clear guidance on referencing, we have to look for an author (perhaps the institution hosting the site – this is called a “corporate author”?), a year of publication (is there a recent revision or last updated date?), a title (even of the page used) and a publisher (this could also be the hosting institution).
Managing your references and citations is an important aspect of conducting your literature search and it is essential in maintaining an accurate and up-to-date bibliography. In the past, this was an onerous task. Today, modern word-processing software (e.g. Microsoft Word) have built-in reference management tools. It is important to keep track of your references as you work on your literature review.
Additionally, Zotero (www.zotero.org) provides a free stand alone online system for collecting, organizing and maintaining your references and citations. Your academic institution may also provide you with a paid-for program such as Endnote. All these programs allow for easy integration into your literature review. They also allow you to choose from the most popular style guides (which could be Harvard style, or APA, Chicago, MLA or Turabian for example).

AN INTRODUCTION TO BUSINESS RESEARCH METHODS
42
PUTTING THE PROBLEM INTO CONTEXT: IDENTIFYING AND CRITICALLY REVIEWING RELEVANT LITERATURE
42
For more detailed guidance, especially on referencing personal correspondence and electronic sources, try one of the following websites:
http://www.usq.edu.au/library/referencing/apa-referencing-guide
www.purdueowl.com they provide online guides for many of the standard writing styles.
2.7 QUESTIONS FOR SELF REVIEW
1. Why are critical reviews of relevant literature important in research studies?2. What are the three main types of literature source and what are the key differences
between them?3. If you were advising a novice researcher, how would you suggest they find useful
published work?4. What should you include in the bibliographic details of a chapter written by three
contributing authors, within an academic textbook?5. How can the five critical synopsis questions from Wallace and Wray help you to
avoid “description” in literature reviews?
89,000 kmIn the past four years we have drilled
That’s more than twice around the world.
careers.slb.com
What will you be?
1 Based on Fortune 500 ranking 2011. Copyright © 2015 Schlumberger. All rights reserved.
Who are we?We are the world’s largest oilfield services company1. Working globally—often in remote and challenging locations— we invent, design, engineer, and apply technology to help our customers find and produce oil and gas safely.
Who are we looking for?Every year, we need thousands of graduates to begin dynamic careers in the following domains:n Engineering, Research and Operationsn Geoscience and Petrotechnicaln Commercial and Business

AN INTRODUCTION TO BUSINESS RESEARCH METHODS
PUTTING THE PROBLEM INTO CONTEXT: IDENTIFYING AND CRITICALLY REVIEWING RELEVANT LITERATURE
43
2.8 REFERENCES
Bourner, T. 2003, “Assessing reflective learning” Education and Training, vol. 45 no. 5, pp. 267–272.
Browne, M.N. & Keeley, S.M. 2014, Asking the right questions: A guide to critical thinking. 11th edn. Prentice Hall, Harlow, UK.
Cottrell, S. 2008, The study skills handbook. 3rd edn. Palgrave / Macmillan, London..
Herzberg, F. 1966, Work and the nature of man. World Publishing, Cleveland..
Mingers, J. 2000, “What is it to be critical? Teaching a critical approach to management undergraduates”, Management Learning, vol. 31, no, 2, pp. 219–237.
Saunders, M. Lewis, P. & Thornhill, A 2016, Research methods for business students. 7th edn. Pearson Education Limited, Harlow, England.
Sutton, R.I. 2004, “Prospecting for valuable evidence: why scholarly research can be a goldmine for managers”, Strategy and Leadership, vol. 32, no. 1, pp. 27–33.
Wallace, M. & Wray, A. 2011, Critical reading and writing for postgraduates. Sage Publications, London.
Weber, M. 1947, The Theory of social and economic organization. (Translated by Henderson, A.M. & Parsons, T.) Free Press, New York.

AN INTRODUCTION TO BUSINESS RESEARCH METHODS Choosing researCh aPProaChes and strategies
44
3 CHOOSING RESEARCH APPROACHES AND STRATEGIES
3.1 CHAPTER OVERVIEW
3.1.1 LEARNING OUTCOMES FOR THIS TOPIC
By the end of this topic successful students will be able to:
1. Understand their personal position concerning the different perspectives of knowledge and research which underpin research design
2. Identify differing research paradigms for business3. Explain the key differences between qualitative and quantitative research methods
and how and why they may be mixed4. Explain the concepts of validity and reliability in the context of business research5. Choose a research design for a topic and generate appropriate research questions
3.2 DIFFERENT PERSPECTIVES OF KNOWLEDGE AND RESEARCH WHICH UNDERPIN RESEARCH DESIGN
“Whether we are considering the physical sciences, the life sciences or the social sciences, the research process begins with an interesting thought about the world around us. Without this there is no research. The interesting thought or research question is the common starting point of all research work in all fields of study. From this point research is always concerned with the emergence of theory whereby concepts and notions develop through the application of ideas, the observation of evidence and the evaluation of results. It is worth always keeping in mind that the final result of research is to add something of value to the body of theoretical knowledge.”
(Remenyi, D. 2005)
This is a great starting point, because this chapter is about how you start a research study – and the first step is usually a thought or an idea or an unsupported opinion. But do we really start there? Or do we have to take account of what is already there in our minds? For example, we may have strong opinions, or no opinions, about reality, the world, politics, history, people etc. When that “original thought” occurs to us, it comes up already embedded in a context of what we already think we know about the world.

AN INTRODUCTION TO BUSINESS RESEARCH METHODS Choosing researCh aPProaChes and strategies
4545
You might like to look online for an article by Bannister (2005) which has an intriguing discussion of “realities” and the kinds of filters applied by people directly experiencing an event, researchers looking at the event through their eyes and readers of that research applying a third set of filters to reality.
In Chapter 1 we discussed ideas about positivist and interpretivist research approaches. Basically, this is a debate about the nature of knowledge, which is also called “epistemology”. Questions asked are “to what extent can we know something is true?”. “Does a phenomenon (e.g. gender discrimination at work) have an objective existence, or is it only existing in the minds of those who discuss it? Can we investigate it directly, or must be interpret its meaning from what people say about it?
Then there is “ontology”. We have already begun to look at ontology through the Chapter 1 discussion of objectivism and constructivism. This is like epistemology but deals not with the nature of what we can know or reveal as “true” but with the nature of social entities such as organizations. Again the question is how and if they exist. We regularly refer to teams in business studies. What are teams? An objectivist view of a team is that it exists in itself, beyond the team members. A constructivist view of a team is that every time team

AN INTRODUCTION TO BUSINESS RESEARCH METHODS Choosing researCh aPProaChes and strategies
46
members interact, they have a concept of team which is there in their minds and which can alter over time depending on how they interact, but does not have an independent reality.
Questions like this are relevant to business research because they will affect the kind of research strategy we choose. A further idea which will be helpful in looking at where researchers are coming from is the idea of paradigm.
3.3 IDENTIFY DIFFERING RESEARCH PARADIGMS FOR BUSINESS
3.3.1 WHAT IS A PARADIGM?
Try web-searching for the word “paradigm”. Is it only researchers and academics who use this term? Is it helpful – or could you find a better word which is less academic? Kuhn (1970) describes it as a cluster of beliefs, which guide researchers to decide what should be studied and how results should be interpreted.
Saunders, Lewis & Thornhill (2016, p. 35) cite research by Burrell and Morgan (1979) which offers four paradigms for social sciences research, within which we include business research:
• Functionalist (problem-solving and rational approach to organizations)• Interpretive (organizations only understood through perceptions of people about
those organizations)• Radical humanist (organizations are social arrangements and research is about
changing them)• Radical structuralist (organizations are a product of structural power relations,
where conflict is inherent)
These paradigms are held by the authors to be inconsistent and mutually exclusive with each other, in other words, if you hold one paradigm, you cannot also hold a different one. They therefore foster different research methods and focus on different areas for study. For example, a functionalist paradigm takes a classic survey approach to issues, which are thought to have objective reality. A climate survey of employees would be an example, made to assess something “real” such as how employees feel about working in an organization, and using a questionnaire with both quantitative and qualitative questions to gain descriptive responses about that “reality”.

AN INTRODUCTION TO BUSINESS RESEARCH METHODS Choosing researCh aPProaChes and strategies
47
An interpretive paradigm uses a qualitative research approach such as discourse analysis, unstructured interviews to investigate perceptions and constructions of reality by “actors” in organizations, i.e. employees, managers, shareholders etc.
A radical humanist paradigm would suggest again a qualitative method but looks not necessarily at the perceptions of social actors in the organization but seeks to probe a deeper level of values and social definitions, which underpin the organization. A relevant method would be grounded theory, which looks for theory through a structured method of investigation of what is said or written (inductive) and produces categories of idea, which can then be used to characterize, develop or change organizations.
A radical structuralist paradigm may suggest a historical analysis of power in the organization, by developing case studies or seeking to symbolize transactions between actors in the organization, for example an analysis of employee relations over time.
This is one attempt to pull together the ontological and epistemological debates about conducting social science research. It is the ontological and epistemological stance of the researcher which affects the methodology and specific methods they choose for their research. Does this make sense to you? We are talking about how you think about the world and the stuff you find in it; for example, whether you believe in objective truth, or whether you find all things subjective. What kind of status business organizations have, and the policies and plans and structures and cultures they develop. As researchers, we have to develop a clear sense of how we understand the world so that we don’t make the mistake of thinking everyone else thinks about it the same way. We have to learn to be as objective as possible, to recognize when our assumptions and philosophies may cloud our thinking and try to dispel them for the purposes of research.
3.4 KEY DIFFERENCES BETWEEN QUALITATIVE AND QUANTITATIVE RESEARCH METHODS AND HOW AND WHY THEY MAY BE MIXED
You can have integrated paradigms as just mentioned, but you can also have a mix of qualitative data from a case study approach and the perspective of “grounded theory” (Glaser, B. & Strauss, A., 1967; Locke, K., 2001; Strauss, A. & Corbin, J., 2015) and quantitative data from a subsequent survey. We will go into detail about grounded theory when we cover qualitative data analysis. For now, you should know that this approach is interpretive, as written and verbal data are collected and transcribed so that the texts can be fragmented into ideas, categories and themes by the researcher. So such a mix involves mixed methods as well as an integrated paradigm.

AN INTRODUCTION TO BUSINESS RESEARCH METHODS Choosing researCh aPProaChes and strategies
4848
Research approaches or strategies need to be seen as related but distinct from the actual methods used in research. Make sure you understand what methods are; for example: experiment, interview, survey, case study, action research, grounded theory, ethnography, archival research. This is by no means an exhaustive list of research methods, but it is a useful broad range to keep in mind at this stage.
Why should a business researcher want to mix qualitative and quantitative research methods?
It is increasingly usual for business research to mix methods of data collection and analysis. This can be done by using different data collection methods which are all either quantitative or qualitative (e.g. web and paper survey, or interviews and focus groups) (a multi-method approach), or you can use both qualitative and quantitative data collection and analysis methods (e.g. survey and interview and action research) (a mixed method approach). One of the reasons for this is “triangulation” where different methods of data collection and analysis will both enrich and confirm the picture you collect of a situation. Often survey results are used to map out a broad view of the research question, and to provide themes or areas for investigation in more depth through interview. Triangulation can also provide a check on findings from a particular method. It is worth looking at Dr J.W. Cresswell’s website on mixed methods to see why the mixing of research methods, particularly combining statistical
“The perfect start of a successful, international career.”
CLICK HERE to discover why both socially
and academically the University
of Groningen is one of the best
places for a student to be www.rug.nl/feb/education
Excellent Economics and Business programmes at:

AN INTRODUCTION TO BUSINESS RESEARCH METHODS Choosing researCh aPProaChes and strategies
49
results with narratives which can add richness and understanding of the data collected in social sciences such as business research (http://johnwcreswell.com/).
It will also be important to decide whether research should take a point in time approach, i.e. look at a phenomenon (a new training course, induction process, technology, product launch) at a particular time from the perspectives of more than one person – this is cross-sectional research, or whether you have the opportunity to look at a phenomenon over a time period (for example tracking a new product from launch to maturity, looking at industry trends over time, or following cohorts of new employees through their employment over an extended period) – this is a longitudinal study. Most academic studies for qualifications tend to be cross-sectional as they are completed in a very limited time period. Longitudinal studies usually require external funding to protract the period of research.
3.5 CRITERIA OF VALIDITY AND RELIABILITY IN THE CONTEXT OF BUSINESS RESEARCH
3.5.1 RELIABILITY
Another term for consistency or repeatability over time. Reliability is required of research studies. We must try to design research which is auditable i.e. transparent and clear so that the reader can either undertake the same method themselves and produce the same results, or at least the method is clear enough to instill confidence in the reader that the results were not fudged in any way. (Triangulation will help here.) People not involved in studying business research will often confuse reliability with validity, but in fact just because something is reliable, it does not mean it is also valid. However, measurement and observation cannot be valid if the study is not reliable.
The concepts of participant error, participant bias, observer error and observer bias are factors which can affect the reliability and validity of collecting data and information in survey and experimental research.
3.5.2 VALIDITY
Validity refers to the accuracy of a measurement or observation. There are three main ways of characterizing validity in research studies. It is important that research methods have “face validity” and “construct validity” and “internal validity”. Face validity means effectively that the non-researcher or lay person can broadly see that this is a valid method of researching
AN INTRODUCTION TO BUSINESS RESEARCH METHODS Choosing researCh aPProaChes and strategies
50
this question; i.e. “on the face of it” it makes sense as a method. Face validity is important to encourage participation in surveys or interviews, as well as other experimental or research designs. We want to be able to answer the question “why do you want to know that?”. This is a bit like your personal credibility in the business world, which is influenced by your own behaviour and the extent to which it is professional.
Construct validity is a more complex idea and means that the method must actually measure what you think it measures. There are, for example, statistical ways of checking surveys and questionnaires to check that the questions are really asking what you think (factor analysis and item response theory). Construct validity is particularly important in questionnaires which are not administered face to face by a researcher but sent by post, email or done online, as there is no chance then to discuss and clarify the meaning of a question. Sometimes results can be invalidated because respondents have misunderstood a question and answered in a way which was not intended. This is also referred to as “measurement” validity. We can illustrate this idea by the famous IQ test which was intended to measure intelligence (IQ stands for Intelligence Quotient) but includes items which bias towards particular ethnic groups and educational norms. Or we could ask the question, do examinations test knowledge? Is their measurement validity strong? Or do they actually test something else, for example examination technique and memory skills?
Internal validity relates to causality, i.e. does factor X cause factor Y to happen? It is sometimes easy to assume causality when in fact there is only association of two factors. For example, does strong motivation cause or lead to effective teamwork, or does effective teamwork lead to or cause strong motivation? In this case causality can work either way or may be quite independent concepts. We cannot assume causality either way. In business research, it is easy to make assumptions about a factor (or “independent variable”) causing an effect (or “dependent variable). To test internal validity we have to ask the question: does the independent variable account completely for a change in a dependent variable, or are other factors affecting this outcome? Usually in business organizations, there are very few simple cause and effect relationships. Does a performance bonus make someone work harder? Internal validity essentially checks for the technical soundness of the study.
Other kinds of validity which are sometimes talked about include: external validity (this is more often called generalisability, i.e. can we generalize the results of our study to other contexts, situations or populations?) and ecological validity (this relates to whether the act of researching a situation itself has an effect on that situation; it may be that findings from a business research study are clear within the study, but when applied to a different “ecology” i.e. outside the research study in “real life”, they no longer apply). This is discussed further in Chapter 5: Choosing samples from populations.

AN INTRODUCTION TO BUSINESS RESEARCH METHODS Choosing researCh aPProaChes and strategies
5151
3.6 YOUR CHOICE OF RESEARCH STRATEGY OR DESIGN
A research design is a grand plan of approach to a research topic. It takes quite a lot of work and reading, as well as simply understanding your views as a researcher. For a start, there will be no one right way of conducting business research – this will depend on a number of factors such as research topic, audience for the research (you, your university tutor or your company for example), time and other resources available to you, and the kind of study which is considered appropriate for that topic. There will also be other practical considerations such as access to information and people.
Suppose you wanted to investigate what shoppers thought about a particular marketing strategy associated with an organization. Can you stand outside its shop and ask passers-by questions? From an academic perspective, it is never that simple. There are ethical issues (you would need permission from the retailer to stand outside accosting customers), practical issues (you may cause an obstruction or even a breach of the peace in a public place!), sampling issues (which ones do you talk to because you will have to make a choice), what language will you use for your questions (relevance to the interview subject, their ability to understand the questions), their motivation to respond (why should they? Do you offer an incentive? Will that affect results?) and how do you analyse the results (quantitative analysis of tick box answers? Textual analysis of their comments? Both? Record their body language
.

AN INTRODUCTION TO BUSINESS RESEARCH METHODS Choosing researCh aPProaChes and strategies
52
as well?). And so on. Many of these questions are practical and detailed, but underpinning your approach there will be philosophical assumptions which you must make explicit.
So designing your research will be vital and choosing a strategy will mean you have considered your views on truth and knowledge, social entities, what business research can and cannot achieve and how all this will affect what you actually do to answer a research question.
We have talked about the underpinning role of philosophy and research strategy, which then guides your choice of research method (e.g. survey, interview, grounded theory etc.) and whether they should be mixed, i.e. both qualitative and quantitative. These questions need settling and justifying before you rush off to ask people questions.
3.7 CLASSIFICATION OF RESEARCH
It is also helpful to think about different models of business research. Most subject disciplines are represented by various theories and models which give us language and ways of thinking to describe and understand real situations. When we look at business research, this is no different. The Figure below offers a way of classifying different approaches to business research.
Classification of business research approaches
Exploratory research
Descriptive research
Correlational research
Experimental research
Quasi-experimental
Trueexperimental
Figure 4: Classification of approaches to business research
The figure shows four distinct types of business research. First, we have exploratory research in which we are trying to identify or clarify a problem. Sorting out real problems from symptoms of the problem happens here. This phase is often qualitative, divergent and inductive in nature. The outcome is a better definition and understanding of a problem. This phase of a research project is overlooked, jumping to conclusions about the source of a problem in order to correct a problem. Exploratory research can be the most important phase of a research project. But beware: if you study the wrong problem, you will probably

AN INTRODUCTION TO BUSINESS RESEARCH METHODS Choosing researCh aPProaChes and strategies
53
come up with the wrong solution. Exploratory research can be an end in itself, or serve as the beginning of further research.
Descriptive research answers research questions which are largely “factual” in nature. These questions include those which start with “how”, “what”, “where”, “when”, “how much” and “how often”. In business these questions can often be solved by finding people with the answers, or by doing some simple digging for information (this kind of question is not typically suitable for an academic business research project as it can be quite limited in scope). Research questions are always stated in the form of a question.
Descriptive research typically utilizes descriptive statistics as the statistical method for use in its analysis (e.g. mean, median, mode, standard deviation, variance, range, frequency counts, etc.).
Correlational research looks for relationships between variables. These relationships may be correlational in the statistical sense which means that when one variable varies, another varies too, though not necessarily in the same direction. Correlation is an association of variables but that doesn’t mean the relationship is one of cause and effect. For example, it may be found that more mistakes occur in the office when the boss is present. That doesn’t necessarily mean the presence of the boss has a direct causal effect on mistakes (it might! But it is not proven unless a different kind of research is undertaken). Determining cause and effect among and between variables is the fourth kind of research shown in this figure. Correlational research uses correlation coefficients as the statistical method of analysis. There are different types of correlational coefficients which depend upon the level of data used to calculate the correlation coefficient.
Causal or experimental research tests hypotheses and is designed to explain “why” something happened, i.e. to show cause and effect relationships. Conducting true experimental research in a business environment is not an easy thing to do. However, there are variations of experimental research which do allow for making reasonably accurate “cause and effect” statements about phenomena and this is called “quasi-experimental” research. Experimental research uses inferential statistics for analysis. Inferential statistics allows the researcher to make statistically valid generalizations from a sample to a population. Hypotheses are statements which are made (prior to conducting the research) and must be tested and then rejected or “fail to be rejected” (not “accepted”), within statistically set parameters (the probability level).
AN INTRODUCTION TO BUSINESS RESEARCH METHODS Choosing researCh aPProaChes and strategies
5454
3.8 THE BUSINESS RESEARCH PROCESS
The figure below introduces an outline of the business research process, looking at its stages systematically. This graphical representation looks like a static 5-step, two-dimensional process which appears linear. In practice we don’t always start at one end and follow each step through to the outcome. Remember, business research is often “messy”. So think of this diagram as the “line of best fit” for how business research is conducted. In the real world, business research is a dynamic, multi-dimensional and non-linear process. Conducting business research is a bit like designing a bicycle and riding it at the same time. Downstream processes can affect previously determined upstream conclusions.
www.mastersopenday.nl
Visit us and find out why we are the best!Master’s Open Day: 22 February 2014
Join the best atthe Maastricht UniversitySchool of Business andEconomics!
Top master’s programmes• 33rdplaceFinancialTimesworldwideranking:MScInternationalBusiness
• 1stplace:MScInternationalBusiness• 1stplace:MScFinancialEconomics• 2ndplace:MScManagementofLearning• 2ndplace:MScEconomics• 2ndplace:MScEconometricsandOperationsResearch• 2ndplace:MScGlobalSupplyChainManagementandChange
Sources: Keuzegids Master ranking 2013; Elsevier ‘Beste Studies’ ranking 2012; Financial Times Global Masters in Management ranking 2012
MaastrichtUniversity is
the best specialistuniversity in the
Netherlands(Elsevier)

AN INTRODUCTION TO BUSINESS RESEARCH METHODS Choosing researCh aPProaChes and strategies
55
1. Analyse 2. Design 3. Implement 4. Interpret 5. Act
Recognise organisational performance discrepancy
Develop research
questions and hypotheses
Select appropriate
research design
Conduct research and collect data
Run statistics
Make appropriate
informed management
decision
Answer research questions and test
hypotheses
Prepare research report
Conduct front-end analysis
State the problem
Figure 5: The business research process
Phase 1 – Analyse – is critical. This phase of the business research process is primarily qualitative exploratory research as explained above. If you do not separate symptoms from problem at this stage, you may identify the wrong problem and come up with the wrong solution. This phase is often missed out or rushed through but that is neither efficient nor effective for a business organization.
3.9 THE ACADEMIC BUSINESS RESEARCH PROCESS
We began this book explaining that we were talking about two different roles or “hats”. Figure 5 is addressed to the business role – this is what a manager or consultant is aiming to do for a business research project. However, this book is also designed to help students of business, and you may find some small differences here in the process of achieving an academic business project. The steps are very similar but you need to pay attention to an assignment brief and the specific requirements of your study institution for the project. You are also required to produce conclusions in an academic project, not just recommendations for action. So below is the process to follow when conducting an academic business research project. Just like the business process, this diagram can be a bit misleading in that it looks linear, but in practice will be much messier. It is offered as a guide, not a requirement.
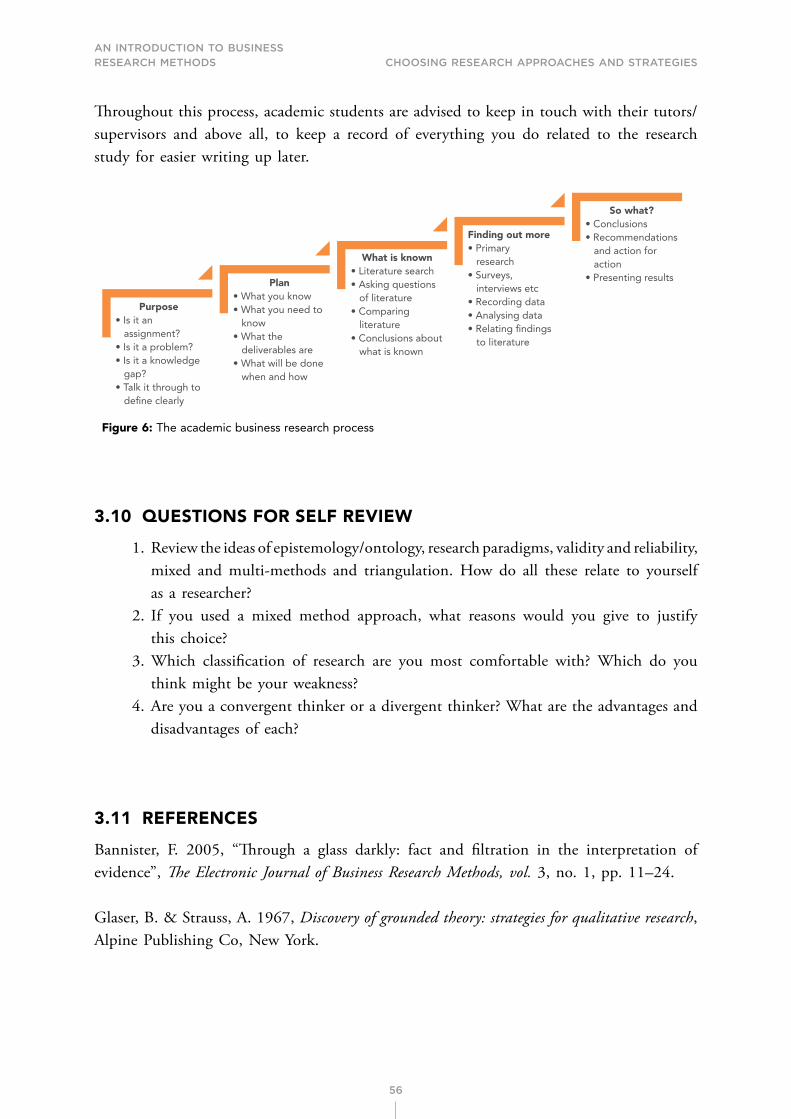
AN INTRODUCTION TO BUSINESS RESEARCH METHODS Choosing researCh aPProaChes and strategies
56
Throughout this process, academic students are advised to keep in touch with their tutors/supervisors and above all, to keep a record of everything you do related to the research study for easier writing up later.
So what?• Conclusions• Recommendations and action for action• Presenting results
Finding out more• Primary research• Surveys, interviews etc• Recording data• Analysing data• Relating findings to literature
What is known• Literature search• Asking questions of literature• Comparing literature• Conclusions about what is known
Plan• What you know• What you need to know• What the deliverables are• What will be done when and how
Purpose• Is it an assignment?• Is it a problem?• Is it a knowledge gap?• Talk it through to define clearly
Figure 6: The academic business research process
3.10 QUESTIONS FOR SELF REVIEW
1. Review the ideas of epistemology/ontology, research paradigms, validity and reliability, mixed and multi-methods and triangulation. How do all these relate to yourself as a researcher?
2. If you used a mixed method approach, what reasons would you give to justify this choice?
3. Which classification of research are you most comfortable with? Which do you think might be your weakness?
4. Are you a convergent thinker or a divergent thinker? What are the advantages and disadvantages of each?
3.11 REFERENCES
Bannister, F. 2005, “Through a glass darkly: fact and filtration in the interpretation of evidence”, The Electronic Journal of Business Research Methods, vol. 3, no. 1, pp. 11–24.
Glaser, B. & Strauss, A. 1967, Discovery of grounded theory: strategies for qualitative research, Alpine Publishing Co, New York.

AN INTRODUCTION TO BUSINESS RESEARCH METHODS Choosing researCh aPProaChes and strategies
5757
Kuhn, T.S. 1970, The Structure of Scientific Revolutions, 2nd edn. University of Chicago Press, Chicago.
Locke, K. 2001, Grounded theory in management research. Sage Publications, London.
Remenyi, D. 2002, “Research Strategies – Beyond the Differences”, The Electronic Journal of Business Research Methods, vol. 1, no. 1, pp. 38–41.
Remenyi, D. 2005, “Tell me a Story – A way to Knowledge”, The Electronic Journal of Business Research Methods, vol. 3, no. 2, pp. 133–140.
Saunders, M. Lewis, P. & Thornhill, A 2016, Research methods for business students. 7th edn. Pearson Education Limited, Harlow, England.
Strauss, A. & Corbin, J. 2015, Basics of qualitative research: techniques and procedures for developing grounded theory. 4th edn. Sage Publications, Thousand Oaks, CA.

AN INTRODUCTION TO BUSINESS RESEARCH METHODS ethiCs in business researCh
58
4 ETHICS IN BUSINESS RESEARCH
4.1 CHAPTER OVERVIEW
4.1.1 LEARNING OUTCOMES
By the end of this chapter, successful students will be able to:
1. understand how ethical issues arise in business research at every stage2. identify the main ethical criteria used in Higher Education business research studies3. propose strategies to ensure ethical issues in business research are addressed
appropriately4. evaluate the ethical properties of existing research5. understand ethical principles when planning a research endeavour
4.2 UNDERSTAND HOW ETHICAL ISSUES ARISE IN BUSINESS RESEARCH AT EVERY STAGE
4.2.1 WHAT DO WE MEAN BY ETHICS?
Discussions of Ethics tend to sound worthy, sometimes border on the philosophical, and occasionally stray right off the point. Why should this be? Ethics relate to moral choices affecting decisions and standards and behaviour. So it is quite hard to lay down a set of clear rules, which cover all possible moral choices.
Especially in research, where the practical aspects of a study (e.g. how and when to meet people for interview, which data to sample, how to deal with someone changing their mind about being part of a study, coming across information which you aren’t really supposed to have etc. and the potential isolation of you as the researcher (not being in a group or class all doing the same thing, but following your own research with your own objectives and contacts), as well as possible inexperience of research at this stage of your studies, can all contribute to a feeling of doubt and worry about what to do for the best.
Sometimes it can be quite a shock, when you have been used to being given pretty clear ideas about how to do something, to find you have to make your own decisions about how things will be done. Ethical choices we have never imagined can just creep up and hit us. An obvious example would be when, as a very honest student, we start to collect

AN INTRODUCTION TO BUSINESS RESEARCH METHODS ethiCs in business researCh
59
some data together and realize that one source of data is completely out of step with the rest. As a professional researcher, that is an interesting challenge, which will create its own new pattern of research and investigation. But as a business student with a fast approaching hand-in deadline, the temptation to lose the odd data can be great.
We are not suggesting that we have to be great moral advocates here, perhaps that is a matter for our own consciences, but we must anticipate as much as we can the moral choices and dilemmas which the practice of research will bring, and try to find appropriate ethical ways of dealing with them. Fundamental to our understanding of ethics in Business research is the idea that all research involving human subjects needs to be governed by good ethical practice, as well as any relevant legislation (e.g. protection of personal data). When we conduct primary research there are some key principles of good ethical practice to consider:
• Non-maleficence• Beneficence• Autonomy• Justice
4.2.2 HOW ETHICAL ISSUES CAN ARISE RIGHT
THROUGH THE RESEARCH PROCESS
How can these broad philosophical notions affect our research study? Here is a brief list of the kinds of ethical issues, which can arise at different points in the research process:
• Access – physical, cognitive, continuing – just getting at the appropriate people can be frustrating and tempt researchers to cut corners. Don’t be tempted.
• Participant acceptance/access (not just those in authority) – for example, you have permission to ask people in customer-facing positions some questions, but they don’t know you and are not sure how far to trust you – are you a representative of management?
• Time – people just don’t respond in time for you to achieve project• Your identity as researcher – what do they know about your study? And how the
data you collect will be used? And whose data is it, if they spoke or wrote it?• Re-phrasing research questions on basis of feasibility (not wrong) i.e. you find that
your initial idea won’t work because you cannot gain access to the right people, so you may need to review your research question to one which is feasible, provided it is still valid and ethical.
• Convenience sampling – e.g. using people we know to take part, which could produce participants who simply want to please you with their answers; or excluding

AN INTRODUCTION TO BUSINESS RESEARCH METHODS ethiCs in business researCh
6060
troublesome views or statistics. E.g. including a poor sales year in an otherwise rising trend. Reality is messy – do we want to smooth the mess and create simple answers, or do we want to understand messy reality in order to change or anticipate it?
• Data recording – what if tape or digital recorder doesn’t work? Can data be recreated from your notes? Do we pretend it worked?
• Interviewing – e.g. what if the first interview turns up new ideas, which are then used in subsequent interviews – can you include that first one in your data set? What if an interviewee starts to see things in a new light and uncovers painful memories or ideas? Latter can also happen in focus groups- conflict, personal animosity could develop – how can this be handled?
• Your role in the data – we have already mentioned this, the researcher is not an object but a human being to whom people will react. What effect does this have on your data? Does it affect validity of results?
• Transcripts – if you transcribe an interview or conversation, what happens to it? Whose is it? How do you label it (Jo Bloggs’ interview?). And how exactly do you transcribe? Do you include repeated phrases or words? Do you attempt to record body language which may affect the meaning of what is said?
• Cheating in analysis when results don’t fit – this can affect both quantitative and qualitative research methods. Remember that provided the process was justified
Get Help Now
Go to www.helpmyassignment.co.uk for more info
Need help with yourdissertation?Get in-depth feedback & advice from experts in your topic area. Find out what you can do to improvethe quality of your dissertation!

AN INTRODUCTION TO BUSINESS RESEARCH METHODS ethiCs in business researCh
61
and conducted ethically and professionally, then a not very exciting outcome does not really matter. We cannot all discover gravity or relativity, but we can all design sound research plans and carry them out professionally.
• Confidentiality in the report of your research – how do you ensure it?• Anonymity in the report – how do you deal with it?• Use of research data for new purposes – can you recycle data? How could you get
ethical approval for this?
4.2.3 “HOW TO LIE WITH STATISTICS” ACTIVITY
We have all heard that statistics may not be “true”. However just how untrue may be surprising. Visit https://www.fastcompany.com/1822354/7-ways-lie-statistics-and-get-away-it. This link has some great information on statistical analysis, which we will return to later in the text when we discuss quantitative techniques. However, this particular link shows with examples how easy it is to present data in such a way that they tell an inaccurate story, using value judgments, inadequate data summaries, inappropriate graph scales, incorrect pictogram sizes, coincidences and generalizing from small samples.
Peter Corning (2011) writes in “The Fair Society” about how former British politician Benjamin Disraeli is noted for the famous quote “…there are three kinds of lies: lies, damned lies and statistics.” Disraeli’s quote prompted the book “How to lie with Statistics” (Huff, D. 1954). Corning (2011) expands on this by classifying statistical trickery into several categories, including statistical cherry picking, the magic of averages, creative graphing, crunching diversity, small samples and mindless extrapolation. These books illustrate how facts can be distorted to present any perspective one wants to promote. Being aware of these techniques sometimes (consciously or subconsciously) used by researchers in presenting their findings is important in ensuring at least that you are an effective consumer of research.
There is also some useful discussion of ethical research issues in an article by Jane Richardson and Barry Godfrey (2003) which focuses on ownership and authority to use interview transcripts which may be in the public domain.

AN INTRODUCTION TO BUSINESS RESEARCH METHODS ethiCs in business researCh
62
4.3 ETHICAL CRITERIA USED IN HIGHER EDUCATION BUSINESS RESEARCH STUDIES
Here are some broad pointers, check they make sense to you:
• Honesty and avoidance of deception (covert studies will rarely be sanctioned within HE and would always require ethical committee approval)
• Following ethical codes of any professional body involved or associated with this kind of research
• Full information about the purpose of the study and the researcher’s status and role• Not to cause harm (including embarrassment, stress, discomfort, pain) by any action
or omission of the research study• Gaining informed consent to participate in the research study unless this would
both invalidate the research and its absence could be approved by a research ethics committee
• Respecting participants’ right to refuse to take part (at any stage)• Respecting participants’ wish or need for anonymity and confidentiality• Clarifying to participants and gate-keepers potential limits on anonymity
and confidentiality• Respecting assurances given to participants and gatekeepers concerning anonymity,
confidentiality and use of data• Maintaining objectivity during data collection, analysis and report stages• Justifying and offer an audit trail for data collection and analysis• Where any possible question arises from the above, seeking the advice and authorization
of the university or college Ethics or Human Subjects Research committee (though this may be a requirement of all research).
4.4 STRATEGIES TO ENSURE ETHICAL ISSUES IN BUSINESS RESEARCH ARE ADDRESSED APPROPRIATELY
Some key themes and strategies to anticipate and deal with them are given below.
4.4.1 STAKEHOLDER ANALYSIS
For ethics considerations and compliance, in business research, it generally can be helpful to start by working out who are the stakeholders in your proposed study. This may include the research participants, their managers and other team members, “gate-keepers” who may be senior managers or specific post-holders who can authorize your research. It may

AN INTRODUCTION TO BUSINESS RESEARCH METHODS ethiCs in business researCh
6363
also include shareholders (in a private quoted company) who may be affected if your research is detrimental to the company and is leaked. It could include customers, for the same reason, but it could be any kind of organization, yourself as researcher, yourself as student, competitors to this organization or activity, suppliers? Can you identify any other stakeholders? Some will be specific to the kind of research study undertaken; for example, a study of recruitment practices could affect potential employees.
Once you know who might be affected by your research study, you could design a simple risk analysis:
– for each stakeholder identify the type of risk from your research, its potential impact (low, medium or high) and the probability that it will happen (unlikely, possible, probable). Entering this into a grid, will give you a clear idea of priorities in designing an ethical study, and should lead you to think about strategies to reduce undesirable impacts.
Participant anonymity is usually a basic requirement in business research, unless using a research method where a particular identity is relevant to results and participants agree their association with the research. So what does participant anonymity involve? It is not usually just a case of not putting their names in the final report, though that is vital. It will be
By 2020, wind could provide one-tenth of our planet’s electricity needs. Already today, SKF’s innovative know-how is crucial to running a large proportion of the world’s wind turbines.
Up to 25 % of the generating costs relate to mainte-nance. These can be reduced dramatically thanks to our systems for on-line condition monitoring and automatic lubrication. We help make it more economical to create cleaner, cheaper energy out of thin air.
By sharing our experience, expertise, and creativity, industries can boost performance beyond expectations.
Therefore we need the best employees who can meet this challenge!
The Power of Knowledge Engineering
Brain power
Plug into The Power of Knowledge Engineering.
Visit us at www.skf.com/knowledge

AN INTRODUCTION TO BUSINESS RESEARCH METHODS ethiCs in business researCh
64
important to decide whether you need to devise a code for each participant (so you know who they are but they cannot be named by others), or whether this is not needed by the study so no-one will have a code or a name. Can you refer to their title, role, function, department, site etc.? All these, in conjunction with your results, may reveal identity. Is it appropriate to record the participant’s names on questionnaires? (this issue is not just to do with ethics, since anonymity also affects how we answer questionnaires). Can you stop yourself referring to someone, in your study, to others in their company, who might try to identify them? If you have, for good reason, collected personal details, have you checked whether you comply with the requirements of any data protection legislation in your country? Why do you need to know someone’s age or gender or ethnic group? Does it really affect the research outcomes and thus will be important data to collect? Or could you redesign your study so that this kind of data was not important and need not be collected?
4.4.2 INFORMED CONSENT
Once you know where to look for participants in your study, and you have identified how to achieve ethical involvement for them and their organization, there is the practical business of achieving their consent. Informed consent requires you to prepare for all research participants some documentation which shows them what you are doing and why, what their role in the research is, what will happen to the data you collect from them and what they are agreeing to do. It will also usually set out how you will keep and dispose of the data and how the required confidentiality will be ensured. It will also set out how the participant can withdraw their consent at any time and you will not proceed with their data/ interview etc. This is very detailed and seems like a lot of work, but in fact a short text can often achieve all the requirements of informed consent. This, or a brief statement referring to this documentation, must then be signed by your participants. Remember that no undue pressure should be brought to bear on any participant or gate-keeper, since this, however well-intentioned, will influence their involvement in your research and will prove not only unethical, but may also invalidate results.
4.4.3 OBJECTIVITY
Let us assume that your motives are honest, in which case there are just two issues to tackle here. The first issue is the way data are collected and recorded. You may be using a specially designed relational database in which to record observations and related information, or we may be talking about a highlighter pen and notes in the margin of an interview transcript, or a clipboard and pencil. Whatever method is used to collect, and transfer data to a retrievable

AN INTRODUCTION TO BUSINESS RESEARCH METHODS ethiCs in business researCh
65
record, then it must be designed for purpose, systematic and capable of capturing all relevant details. Take for example a semi-structured interview method: what kind of system could be used to record the interview?
Digital audio or video recorder? Notepad and pen? Pro-forma template including main questions, and adequate space to record answers? Reflect for a moment on what kind of issues could arise which might affect research objectivity depending on choice of system used to transcribe or document a session.
Could any of these systems fail? If so, what would you do? How could you ensure continuing objectivity if a problem arose during the session.
The second issue is when a research study is under way and something unexpected happens to cause a problem with your data. This might be a rogue result which doesn’t fit the rest of the data. Or a defective or failed recording. Or a key participant withdrawing from the study (attrition), as they have a right to do. At this stage of the research, however honest we are, there will be a temptation to fix the problem. So we should anticipate this temptation and understand, before it happens, that that is the road to failure in research. Academic and professional audiences will not be fooled, because they will understand and look for such issues. The moral responsibility of the researcher is considerable and when researchers are found to have transgressed, they are likely to be held to be accountable to authorities and perhaps in the media. To test this, search the web for legal implications and media coverage of “fixed” or falsified research. Sadly, there are many examples to be found, but at least these will have been held to account publicly.
4.4.4 PRACTITIONER RESEARCHER OR INTERNAL RESEARCHER
This is an extreme case of having a potential unintended effect on the outcomes of your research. If you are researching an organization of which you are part, (even if you just have a casual or part-time job there) then you already have an understood role or status within this organization. It will be difficult for you suddenly to put on an “objective researcher” hat, and even if you could do this successfully, how easy would it be for your colleagues, or subordinates or managers to see you differently in this role? However, an internal researcher may be in a position to conduct a kind of research, which may be impossible from an external perspective. Can you think of an example in business research?
It can be very tempting to undertake participant observation in a covert way in your own organization, but this clearly raises ethical issues and possible bias. Could you possibly find more useful and reliable data covertly, rather than openly declaring your intention and

AN INTRODUCTION TO BUSINESS RESEARCH METHODS ethiCs in business researCh
6666
gaining official agreement for access? In a few cases, the answer may be yes, but if so, there must be approval from any research ethics committee relating to your studies or research (or professional body ethics approval e.g. relating to your work function) and in retrospect you must inform those involved that the study took place and why access was not officially sought in advance. Assurances must then be given about the use to which the research data will be put and to what extent it will be anonymised. Spying is not research!
4.5 PLAGIARISM
It has always been possible to copy information from other sources into your work and pass them off as your own. However, with the rapid expansion of digital media and mobile web access this process has become much easier. Whenever cases of plagiarism are discovered in academic work, there are serious implications for the student, resulting in cancelled marks and sometimes greater sanctions such as forced withdrawal from a course. Digital applications are not just good for finding and copying someone else’s work as your own, they are also available to educational institutions to find plagiarism when it occurs. Clearly plagiarism is an ethical issue. While many excuses, including cross-cultural practice, are offered, it can never be good ethical practice to use someone else’s work without reference or
AN INTRODUCTION TO BUSINESS RESEARCH METHODS ethiCs in business researCh
67
acknowledgement. This includes putting quotations from other people’s work into quotation marks to demonstrate the existence of another source, as well as “in-text” referencing and inclusion of full source details in the reference list. This does not just apply to text, but also of course to videos, music and graphics of any kind. Most business research projects undertaken for academic credit do not require images etc. but if they are necessary in your work, always look for graphics licensed by authors under a Creative Commons licence, and check the particular conditions under which it may be possible to use the graphic or image.
4.6 QUESTIONS FOR SELF REVIEW
1. When should we think about Ethics in a research study?2. What elements would you include in a consent form for interview based research?3. In what circumstances might covert research be justified? How would you deal
ethically with this?4. What practical activities can you suggest to anticipate and prevent unethical
research practice?5. Does your institution have a research or ethics committee? What roles do they play
in providing guidelines and approval mechanisms which must be followed in order to conduct a formal or academic research study.
4.7 REFERENCES
Corning, P. 2011, The fair society and the pursuit of social justice, University of Chicago Press, Chicago.
Huff, D. 1954, How to lie with statistics. W.W. Norton & Company, New York & London.
Richardson, J.C. & Godfrey, B.S., 2003, Towards ethical practice in the use of archived transcript interviews, International Journal of Social Research Methodology vol. 6, no, 4, pp. 347–355.
Saunders, M. Lewis, P. & Thornhill, A 2016, Research methods for business students. 7th edn. Pearson Education Limited, Harlow, England.

AN INTRODUCTION TO BUSINESS RESEARCH METHODS Choosing samPles from PoPulations
68
5 CHOOSING SAMPLES FROM POPULATIONS
5.1 CHAPTER OVERVIEW
5.1.1 LEARNING OUTCOMES BY THE END OF THIS CHAPTER
TOPIC SUCCESSFUL STUDENTS WILL BE ABLE TO:
1. Understand how and why sampling relates to business research2. Identify and use a range of probability and non-probability sampling techniques3. Select appropriate techniques for different research studies4. Understand and assess representativeness of samples and generalisability from samples5. Define key terms associated with sampling
5.2 UNDERSTAND HOW AND WHY SAMPLING RELATES TO BUSINESS RESEARCH
Problem 1: the world is large and full of people. To find out things about people we need to ask (research) them. We usually can’t ask all of them because the numbers make this impossible. So we ask some of them. We sample from the population.
Problem 2: we wanted to find out things about people, so we researched a sample of them. To what extent do our results relate to all people, and to what extent do they only relate to our sample?
Problems 1 and 2 put sampling in a nutshell. Sampling is a practical way of studying people and their activities, thoughts, attitudes, abilities, relationships etc. in relation to business. But because we are not asking everyone in the chosen “population” (which could be the members of a company, or all sales managers in the United States or the UK, or all applicants for a particular job – any group we define in relation to our research objective), then how can we have any certainty that our results can be representative of the whole population?
The crunch is that we don’t want just any sample, we usually want a sample to be representative of a group (population). That would mean that our findings can be generalized to the whole group. To make this happen, we have to learn about a number of issues and technical words and phrases in sampling. In the next section there is a brief glossary based on Box 8.1 in Bryman and Bell (2015):

AN INTRODUCTION TO BUSINESS RESEARCH METHODS Choosing samPles from PoPulations
6969
5.3 IDENTIFY AND USE A RANGE OF PROBABILITY AND NON-PROBABILITY SAMPLING TECHNIQUES
The first table below gives definitions of some commonly used types of sampling.
To learn more about each technique, read the textbook and web search further.
Table of Sampling techniques.
Convenience sampling: Sample is chosen for ease or convenience rather than through random sampling. This sounds underhand but is often used, at least in pilot studies or short-term projects where there is insufficient time to construct a probability sample. Therefore, where this is used, the results cannot be generalized to the population (though many newspapers would like you to believe otherwise!).
Multi-stage cluster sampling:
When drawing a sample from a geographically dispersed population, the logistics suggest that cluster sampling can help. The sampling frame is first broken into clusters (e.g. geographic areas), and a random or systematic sample taken. Then the population of each cluster is sampled randomly to provide random sampling which is logistically feasible. This can of course introduce bias, but using both cluster and systematic sampling can usually produce effective samples.
EXPERIENCE THE POWER OF FULL ENGAGEMENT…
RUN FASTER. RUN LONGER.. RUN EASIER…
READ MORE & PRE-ORDER TODAY WWW.GAITEYE.COM
Challenge the way we run
1349906_A6_4+0.indd 1 22-08-2014 12:56:57

AN INTRODUCTION TO BUSINESS RESEARCH METHODS Choosing samPles from PoPulations
70
Quota sampling: Regularly used in market research and opinion polling. Like a stratified sample, this sample is chosen to include a certain proportion of particular variables (e.g. gender, age group, ethnicity, socio-economic group). Unlike a stratified sample, there is no random sampling stage; the choice of respondent is up to the interviewer provided the profile/ quota is accurate.
Snowball sampling: Similar idea to convenience sampling, the researcher contacts an initial group of people relevant to the research topic, and then uses this group to contact others for the research. There is no sampling frame here, so it is not random, but sometimes it is difficult to pre-define the population (e.g. staff in a company who contribute creative ideas). This technique is often used in qualitative approaches.
Purposive sampling: Using your own judgement to select a sample. Often used with very small samples and populations within qualitative research, particularly case studies or grounded theory. This approach cannot yield any statistical inferences about the population. Cases may be selected for being unusual or special or particularly related to your research question.
Stratified sampling: Random samples are just that and they can appear surprisingly “biased” or unrepresentative of the population (e.g., it would be possible for a random sample to include only one gender, which might affect your results). Stratified sampling specifies any characteristics, which you wish to be equally distributed amongst the sample, e.g. gender or work department. Provided the sampling frame can be easily identified by these characteristics, then strata for each characteristic are identified and within each group, random sampling or systematic sampling can proceed.
Random sampling: (also called probability sampling – see explanation above). Define the population. Define the sampling frame (F) (this may be the same or it may exclude certain groups or individuals as not relevant to the study). Decide the sample size (Z). Apply consecutive numbers to the full sampling frame (F=N). Using a table (or computer program) to generate random numbers, collect Z amount of different random numbers within the range 1-N. Apply the chosen random numbers to the sampling frame to identify your random sample.
This table below includes a simple glossary of terms you may come across when reading about sampling.
Sampling glossary.

AN INTRODUCTION TO BUSINESS RESEARCH METHODS Choosing samPles from PoPulations
71
Generalisability:Being able to use sample results as if they applied to the whole population – this must be based on sound sampling processes
Non-probability sample:
Random selection was not used so some units in the population may have had a higher chance of being selected (e.g. pointing to a crowd and saying “You, you and you!” to the people in front) Non-response: a source of non-sampling error when someone in the sample does not respond (e.g. to questionnaire or interview). A fair amount of this is normal and there are many reasons for it to happen (e.g. away on holiday, lack of time, lack of interest, doesn’t understand question etc.).
Non-sampling error :As sampling error, but these differences do not result from the sample chosen, instead they result from the sampling process (e.g. non-response, errors in sample frame, wording of questions, data analysis)
Population: The full universe of people or things from which the sample is selected
Probability sample:
A sample selected using random selection (this is not the same as “selected randomly” – Why?) so that each unit in the population has a known (e.g. a 10% or 50%) chance of selection. Probability samples keep sampling error low and usually offer a sample which can be seen to be representative
Representative sample:
One which reflects the population accurately – showing the same distribution of characteristics or variables as the whole population
Sample: The section of the population chosen for study
Sampling error: The difference of results between a sample and that of the whole population
Sampling frame:A list of all people or units in the population from which a sample can be chosen
Systematic sample:
Doing without random numbers in selecting a “random” sample. Sample is chosen directly from the sampling frame (which ideally should not be in any specific order except alphabetical). Once you know the sample proportion required e.g. 1 in 20, start with a random number generated item in the list, then choose every 20th name until the sample is complete.
Random number tables:
Lists of numbers which are randomly generated – there is an example of such a table at Appendix 4 in the textbook. Used in random sampling. Use whatever digits in the random numbers apply within your sampling frame total and ignore duplicates. You may find it is simpler to use Excel spreadsheet function to generate random numbers. Formula to find a random number between 0 and 100 is =RAND()*100 Use F9 key to recalculate.
Sampling fraction:Number required for sample divided by number in total sampling frame expressed as a fraction or percentage.

AN INTRODUCTION TO BUSINESS RESEARCH METHODS Choosing samPles from PoPulations
7272
Of all the sampling techniques included in the table, quota sampling and convenience sampling, to some extent snowball sampling, are the least “statistically accurate” in nature. These techniques offer varying levels of generalisability but are always less than a random sampling method. Think about these three techniques and decide how justified you think each is for conducting business research.
5.4 SELECTING THE SIZE OF YOUR SAMPLE
When we are designing a research study, the most common question about sampling is – how large should the sample be? In the definitions of random sampling above, we have ignored this question so it is now time to tackle it. Unfortunately there is no right answer to sample size. You cannot just apply a consistent proportion to the total sample frame. Instead the following issues need consideration:
PDF components for PHP developers
www.setasign.com
SETASIGNThis e-book is made with SetaPDF

AN INTRODUCTION TO BUSINESS RESEARCH METHODS Choosing samPles from PoPulations
73
5.4.1 ABSOLUTE SAMPLE SIZE:
It is more important to look at the absolute size of a sample than its relative size in relation to the total population. Imagine 10% of a population as a possibly sensible sample. If the population total is 100,000, then your sample size is 10,000 – yes this would probably be a good sample size (but see the next problem on this list). However, if we apply a 10% sample size to a population of 10, we have a sample of 1 unit or person – essentially a Case Study (N=1). We can see that this unit or person could be quite unrepresentative of the total population by itself. So relative sample size is not important. Absolute size is. The bigger the sample size, the more the sample is likely to represent the population and the lower is likely to be the sampling error. (Referred to as the Law of Large Numbers.)
5.4.2 STATISTICS AND THE CENTRAL LIMIT THEOREM:
The larger the absolute size of a sample, the more closely its distribution will be to the “normal distribution” (What is this? If you have not done any work on statistics before, do some quick web-searching or look at the index of the textbook to find out). If you wish to conduct a statistical analysis on your data, the minimum size of sample for any one category of data should be 30, as this is most likely to offer a reasonable chance of normal distribution. If your sample frame is 30 or less, then it would be wise to include the whole frame, rather than sampling.
When small sample sizes are used, a family of inferential statistics called “non-parametric statistics” should be considered for use in the data analysis.
5.4.3 MARGIN OF ERROR:
The expected margin of error is affected by absolute size of sample within a population. Note that a 5% margin of error (which is the same as saying 95% certainty) is the maximum normally appropriate for rigorous research. If your population size was 50, you would have to include at least 44 of them to achieve a 95% certainty that the sample would represent characteristics of the population. A very high proportion of the population will be needed to achieve 99% certainty. There is a diminishing need for higher samples at the high population end of the table (the figures to achieve 95% certainty for a population of 1m are the same as for a population of 10m).

AN INTRODUCTION TO BUSINESS RESEARCH METHODS Choosing samPles from PoPulations
74
5.4.4 TIME AND COST:
Bryman and Bell (2015) suggest the law of diminishing returns kicks in at around a sample size of 1000 – i.e. that precision in the data increases up to a sample total of 1000, but then begins to decrease, making it less worthwhile to interview or survey more than 1000 (p. 199). Of course, the population you are researching may be way below 1000 in total, and it may in any case be very costly or time-consuming to use a large sample size. Practical considerations are important in research studies. Just bear in mind that if you choose a sample size which is small in absolute terms, then you must justify this action and take into account the fall in generalisability and representativeness which may result.
5.4.5 NON-RESPONSE:
Inevitably your respondents are less likely to be as motivated as you, the researcher, about your research, so some – and sometimes a majority – will not respond, i.e. refuse to take part. On top of this, some of those who do respond may not produce “useable” data (e.g. you may find that a high proportion of questions in a survey are unanswered, or that some people or units in your sample frame have moved away, changed job, stopped functioning in the role you expected etc.). All this is taken into consideration when a) choosing your sample size and b) calculating the actual response rate. If the pertinent demographics or characteristics of the non-respondents appears to be random, then non-response error is not that much of a problem. However, if certain non-respondents represent a greater proportion of a significant demographic or characteristic of the sample, the problem of sampling error may arise.
Number of useable responses Total sample – unsuitable or uncontactable units
5.4.6 VARIATION IN THE POPULATION:
If the population you are studying is highly varied, then the sample size will need to be larger than if you are studying a population with less variation (e.g. people who have chosen to join a membership organization).

AN INTRODUCTION TO BUSINESS RESEARCH METHODS Choosing samPles from PoPulations
7575
5.5 UNDERSTAND AND ASSESS REPRESENTATIVENESS OF SAMPLES AND GENERALISABILITY FROM SAMPLES
Even if we use probability sampling techniques, we can only hope to produce generalisable outcomes in relation to the population we were sampling. So if all questionnaire respondents are chosen from one company or organization, the best to hope for is that our results can be generalized to the whole workforce of that company or organization. We cannot assume that these results will in fact describe other workforces, as very different conditions and variables may apply in other organizations.
The Sample versus the Sampling Frame. This issue has to do with the accuracy or “completeness” of the Target Population. Suppose you want to conduct research on all people with telephones in a given city. Where would you get the “list” of these people? Whatever “object” or device you use is the “sampling frame”. What are some potential problems that lie between the composition of the actual population, the sample and the sample frame?
A sampling dilemma: You are a store owner and you want to know the average age and income of your “customers”. How would you identify them? What is your sampling frame? Do you really ever entirely know who all your customers are? Think about how customer “churn” (turnover) impacts your estimate.
www.sylvania.com
We do not reinvent the wheel we reinvent light.Fascinating lighting offers an infinite spectrum of possibilities: Innovative technologies and new markets provide both opportunities and challenges. An environment in which your expertise is in high demand. Enjoy the supportive working atmosphere within our global group and benefit from international career paths. Implement sustainable ideas in close cooperation with other specialists and contribute to influencing our future. Come and join us in reinventing light every day.
Light is OSRAM

AN INTRODUCTION TO BUSINESS RESEARCH METHODS Choosing samPles from PoPulations
76
In a similar way, we could conduct a large sample study by random sampling a country’s population based on official census statistics, and if the study was large and rigorous, we might propose conclusions, which apply to this country’s population (with a specified degree of confidence in the statistics). However, we cannot then generalise these conclusions to other countries without further research, nor can we apply these conclusions over time to the same country, as major variables could have changed over time. Think back here to what we discussed earlier about epistemology – what we can really know.
We find this kind of generalization being made all the time in the media. For practical time and cost reasons, media production teams often take quota sampling research (or research done by more dubious methods) and suggest its applicability to everyone watching or listening to a programme. Look out for examples and try to find out what kind of sampling was applied to their research. Remember the ethics discussion about not causing “harm” – how does this relate to TV, radio or webcast research you come across?
If you are worried about the representativeness of your sample, in some cases it may be possible to check this by using a test of statistical significant difference to compare the profile of characteristics in your sample with that of another data list e.g. a census or company database. Clearly if there is no statistically significant difference between your sample and the full population data list, you have added more authority to the representativeness of your sample.
If you are using a non-probability sampling technique then even the flimsy size rules associated with probability sampling fall away. Your sample size for purposive or snowball sampling will really depend on your research questions and objectives. In qualitative research, the focus will not be on trying to estimate things about a population, but in trying to understand or relate the data to theory or ideas. How many people do you need to talk to, to understand their perception of something for example? It could be just one. Or it could be several or many. The question is here, what are you trying to find out and what sample size would give me confidence that my results had validity? We will go further into this when we discuss different qualitative methods, but often a good lead can be taken from research studies in peer-reviewed academic journals, where information has been given about sample size in relation to research question. Find one that is close to your area of study (which you would want to do anyway in your literature review) and check the sample size studied in this type of enquiry.

AN INTRODUCTION TO BUSINESS RESEARCH METHODS Choosing samPles from PoPulations
77
5.6 SAMPLING SIMULATION EXERCISE
Go to the web link provided below to complete a sampling simulation and exercise which demonstrates the principles of random sampling. You will be asked to select a “representative sample” from an entire population of small circles. The circles are all of different diameters.
http://www.learner.org/courses/learningmath/data/swfs/1d_circles.swf
After you have completed the exercise, answer the following 4 questions:
• What was the average diameter of your (non-random) selection?• What was the average diameter of the random selection?• Which was closer to the actual average diameter of the population (all 60 circles)?• If you increased your sample size from 5 to say 25, how do you think it might
affect the average diameter of your selection?
Explain how this simulation could apply to a real world business environment or example (i.e. translate the “dots” into employees, or customers, or products of the assembly line etc.) and describe how the simulation concepts would apply. Try to incorporate correct terminology from the chapter into your explanation.
5.7 QUESTIONS FOR SELF REVIEW
1. Why are random numbers useful for sampling?2. Why don’t academics consider convenience sampling more often?3. How do you calculate a response rate?4. What kind of minimum size would you need in a sample used for statistical inference?5. What level of certainty is needed for statistical sampling in academic research?6. What reasons would you give for not exceeding a sample size of 1000?
5.8 REFERENCES
Bryman, A. & Bell, E. 2015, Business Research Methods 4th edn. Oxford University Press, Oxford, UK.
Saunders, M. Lewis, P. & Thornhill, A. 2016, Research methods for business students. 7th edn. Pearson Education Limited, Harlow, England.
Thompson, S.K, 2012, Sampling 3rd edn. John Wiley & Sons, Hoboken, NJ,

AN INTRODUCTION TO BUSINESS RESEARCH METHODS
78
QUANTITATIVE RESEARCH METHODS: COLLECTING AND ANALYSING DATA
78
6 QUANTITATIVE RESEARCH METHODS: COLLECTING AND ANALYSING DATA
6.1 CHAPTER OVERVIEW
6.1.1 LEARNING OUTCOMES
By the end of this chapter successful students will be able to:
1. Anticipate how the research design is affected by data collection and analysis tools2. Recognise different types of data for analysis3. Code and enter data for computer analysis4. Choose appropriate ways to present data through charts, tables and descriptive statistics5. Select appropriate statistical tools for the research variables
EADS unites a leading aircraft manufacturer, the world’s largest helicopter supplier, a global leader in space programmes and a worldwide leader in global security solutions and systems to form Europe’s largest defence and aerospace group. More than 140,000 people work at Airbus, Astrium, Cassidian and Eurocopter, in 90 locations globally, to deliver some of the industry’s most exciting projects.
An EADS internship offers the chance to use your theoretical knowledge and apply it first-hand to real situations and assignments during your studies. Given a high level of responsibility, plenty of
learning and development opportunities, and all the support you need, you will tackle interesting challenges on state-of-the-art products.
We welcome more than 5,000 interns every year across disciplines ranging from engineering, IT, procurement and finance, to strategy, customer support, marketing and sales. Positions are available in France, Germany, Spain and the UK.
To find out more and apply, visit www.jobs.eads.com. You can also find out more on our EADS Careers Facebook page.
Internship opportunities
CHALLENGING PERSPECTIVES

AN INTRODUCTION TO BUSINESS RESEARCH METHODS
QUANTITATIVE RESEARCH METHODS: COLLECTING AND ANALYSING DATA
79
6.2 ANTICIPATING HOW THE RESEARCH DESIGN IS AFFECTED BY DATA COLLECTION AND ANALYSIS TOOLS
It is never too early to start to think about data analysis. A common problem with research studies is that we focus mostly on our research questions and finding samples, discussing methods etc. and don’t ask simple questions about what data we are looking for and how we will then analyse that data. Asking these questions early on, can avoid much disappointment later, when we realise that the data collected simply can’t be analysed in a straightforward way.
Suppose for example that you want to know the three most useful management textbooks that a large group of 100 managers have found effective. The question might look like this:
Q1 What are the three management books which have been most useful to you so far in your management career?
You might leave three lines of space so that the respondents can write in their answers.
Think about how this might be coded as a question response for analysis. Since most managers will not choose the same three, you will have a wide range of different answers. We cannot code each book separately with a sample size of 100 and 300 potential books in the answer range. So can we make any useful data out of this question?
You might answer that you wouldn’t ask this kind of question anyway! However it is a form of question which is quite common e.g. What five competencies are needed by successful salespeople?, What are the three most important experiences which have helped you to achieve your current senior role? What three benefits do you feel you have gained from mentoring? Etc. etc.
It is possible to turn the question into a list of possible answers from which respondents have to tick three which apply to them. This means you can give each possible answer a unique code in advance and then count the frequency with which each code is used. However, if you want your respondent to have a free answer choice, because perhaps you really don’t know what you might find out, then we have to delay coding until we have received some answers. If we take the first 50 responses and make notes on the characteristics, which define the responses, it becomes possible to group the responses. Once grouped, a code can be assigned to each group and you can then go back and code each answer according to this pre-defined group. In our question, we might find that answers include classical management textbooks from the twentieth century (coded 1), simple How to…guides (coded 2), books by management “gurus” e.g. Tom Peters, Charles Handy etc. (coded 3), books which are not about management directly but have given readers inspiration (coded 4) and books which don’t fall into those categories (coded 5). We now have 5 unique codes and can go

AN INTRODUCTION TO BUSINESS RESEARCH METHODS
QUANTITATIVE RESEARCH METHODS: COLLECTING AND ANALYSING DATA
80
through all the responses collecting numerical data for each code. Now we have a data set for analysis.
A much more simple issue is the questionnaire which contains only yes/no answers. Think about analysing this data. A set of data results is going to look pretty boring, and how much is it going to tell you about your research question? In the next chapter we will investigate questionnaires further, but for now, we need to think about the data which will result from our questions, how useful it might be, and how we might analyse it.
6.3 RECOGNISING DIFFERENT LEVELS OF DATA FOR ANALYSIS
Think of “Numbers” as the official language of business. All competent business people speak in numbers. Business professionals don’t just say ‘we did well yesterday’. We say “productivity was 8,000 units, a .5% increase from yesterday”. We also don’t merely say “margins are fine”. We say “margin is 3.76%”. It’s the difference between being qualitative or quantitative. And statistical method is the way we “process” this data.
Another name for numbers is data and another purpose of business research is to take this data and convert it into meaningful information and knowledge for use by the organization in order to improve the quality of decision making. The business research process helps the business professional collect meaningful data and convert it into knowledge, information and power. This is what is meant by what we often hear as knowledge is power in the organization. As a business professional you are paid by your organization for what you know. Your knowledge is power and that’s what you bring to the organization.
Not all data and numbers are the same. In fact, data can be classified into four levels, forming a hierarchy from the lowest level of data to the highest level of data. The statistics that you can generate and use depends upon the level of the data you have to work with. It’s not that low level data is useless, it’s just not as robust as high level data. And because of its hierarchical nature, data at higher levels can be treated as if it’s at a lower level, but lower level data cannot be treated as higher level data.
6.3.1 NOMINAL DATA
The first or lowest level of data is nominal. Nominal data uses numbers to represent a category. Nominal level data does not imply any form or rank order of importance or power. Numbers are merely used to classify things into categories. A survey asking people where their car was made, using numbers to represent these countries makes sense from

AN INTRODUCTION TO BUSINESS RESEARCH METHODS
81
QUANTITATIVE RESEARCH METHODS: COLLECTING AND ANALYSING DATA
81
a data processing perspective. A “1” is assigned for GB, “2” for USA, “3” for Germany. “4” for Japan, etc. The “number” merely classifies the category and assigns it a number. A social security number, a phone number, your student number, and an employee number are examples of nominal data. The numbers on the strip assigned to football players is also a nominal level number. Nominal level data can have 2 or more categories. When nominal level data have just 2 categories (yes/no; on/off, etc.) it is referred to as a dichotomous variable. Dichotomous variables are a special case of nominal level data.
6.3.2 ORDINAL DATA
The second level of data is called Ordinal data. This has all the properties of nominal data but it also infers a rank or order of importance from lowest to highest. Ordinal data is often the result of questionnaires where grouping data makes sense. For example, questionnaires might ask how old are you? (1) 18 to 25, (2) 26 to 40, (3) 41 to 55, (4) 55 to 67 or (5) 68 or older. Ordinal level data “ranks things from low to high, but there is not an implied equal interval between one number and the next.
Nominal and ordinal level data collectively are often referred to as “low level” (or qualitative) data.
If you’re hoping for a truly modern education, one where you’re encouraged to speak your mind and to think long-term, both when it comes to your own future and the future of the planet. Then the University of Gothenburg is the place for you.
Study a Master’s programme in Gothenburg, Sweden | www.gu.se/education
INNOVATIVELIKE YOU.

AN INTRODUCTION TO BUSINESS RESEARCH METHODS
QUANTITATIVE RESEARCH METHODS: COLLECTING AND ANALYSING DATA
82
6.3.3 INTERVAL DATA
The next highest level of data is called Interval level data. Interval data has all the properties of ordinal level data but it is more powerful than ordinal level data because a scale value is used. That is, interval level data implies an “equal interval” between one number and the next – that’s the distance between one number and the next. This data is meaningful, but implies an arbitrary, rather than an absolute zero. Data from the social sciences is often at the interval level, because of this issue – it lacks an absolute zero. As a result, researchers often treat interval level data as if it is ratio level. The interval data level was created in order to allow “quasi-ratio” data to be treated as such for statistical purposes.
6.3.4 RATIO DATA:
The highest level of data is called ratio level data. It has all of the properties of interval level data but it also has an absolute zero. An absolute zero means that “0” indicates the absence of that property, making ratios meaningful. This is the most versatile data for analysis purposes. For example, your age, specific salary, your weight, the number of employees in your company is ratio level data. 100 employees is twice as many as 50. A person weighing 200 pounds weighs twice as much as a person weighing 100 pounds. Interval and Ratio level data are collectively referred to as “high level” (or quantitative) data.
6.4 CODING AND ENTERING DATA FOR COMPUTERIZED STATISTICAL ANALYSIS
6.4.1 DATA MATRIX
In order to analyse quantitative data, once we have identified the kinds of variable we are collecting, we can then set out the data in a matrix. This can be done in Excel or another spreadsheet first, or put directly into a statistical package such as IBM’s SPSS Predictive Analytics. To make the transition from, say, questionnaire to data matrix, answers will need coding. For example, nominal variables will be text names and will need to be given a unique number to allow entry into a statistical package. Non-responses will also need a unique recognisable number (which doesn’t appear elsewhere in the data). Dichotomous responses such as Male/Female will also need a number e.g. Male= 1; Female= 2.

AN INTRODUCTION TO BUSINESS RESEARCH METHODS
QUANTITATIVE RESEARCH METHODS: COLLECTING AND ANALYSING DATA
83
6.4.2 CODING
Most sources recommend that you keep a “code book” or list of exactly how the codes you devise for your data relate to the questionnaire or other research element. This is vital for two reasons. The first is that codes are often worked out on scraps of paper quite quickly; if the paper is lost and you have a break between entering your data and coming to make sense of it, it is possible you will have a hard time remembering exactly what the results mean.
The second is that it is important not to lose sight of the question when analysing the results of quantitative data. Unusual patterns in the data must be scrutinised and going back to exact coding and possible different interpretations of the question wording, which may have caused the response, will be vital. So keep a retrievable, clear and accurate record of coding as the link between respondent and data.
6.4.3 USING SPSS FOR WINDOWS
Coding is a way of enlisting the help of computer analysis techniques – whether these involve using a spreadsheet, such as Microsoft Excel, or a package like the commonly used SPSS (Statistical Package for Social Sciences) for Windows package which is specifically designed to analyse quantitative data from social sciences research. SPSS for Windows is the most commonly used tool to produce all statistical tests and analysis outlined in the sections below. Using the package is very straightforward, provided you have access to it on a computer. Start the program, which should put you into the IBM SPSS Predictive Analytics Data Editor, which has two components: Data View and Variable View. Screen tabs allow you to switch between these two views. Data View is the screen through which you enter your data (like a spreadsheet). You must enter your data so that each column represents a variable, and each row represents a case. For example, if you have information on the age, salary and qualifications of 100 employees, you enter the variable data for each employee along a row, with column headings of age, salary, qualifications.
It is probably obvious, but in data view you will not enter any text. To describe your variables, you go to Variable View. Text variable names can be a maximum of 8 characters with no spaces. This means it is helpful to make a rough plan of how you will enter data into SPSS – in which order you will show the variables and what variable names you will use. There is a field called “variable label” in which you can put more detailed text if needed. It is also possible to enter labels for Values (all except interval values), so for example you may have a variable labelled Gender, which has values labelled Male and Female, though you have coded Male as 1 and Female as 2 in the Data view. Value and variable labels will be used by SPSS in the Output charts.

AN INTRODUCTION TO BUSINESS RESEARCH METHODS
84
QUANTITATIVE RESEARCH METHODS: COLLECTING AND ANALYSING DATA
84
When you perform an analysis with IBM’s SPSS Predictive Analytics (by clicking Analyse and entering any relevant information about what you want done) it is held as Output in an Output viewer screen (which only appears after an analysis has been done).
While not particularly difficult, statistical formulas and calculations can be lengthy (depending on the size of the data set) and thus often prone to simple calculation errors. The beauty of using IBM SPSS Predictive Analytics, or any other statistical software program, is that the researcher can focus on understanding the statistics and interpreting them rather than on calculating the statistics. The researcher need only focus on careful data planning and data entry. Once entered into the software, the program then creates an electronic version of the original data and codebook.
6.4.4 WEIGHTING CASES
It is possible to weight cases when using stratified random sampling, when there is an unequal response rate for different strata. This is simple to do and researchers do this from time to time, but it does impose constraints on how statistical inferences can be drawn, since cases in the lower response stratum are treated as if there were more of them than
© Deloitte & Touche LLP and affiliated entities.
360°thinking.
Discover the truth at www.deloitte.ca/careers
© Deloitte & Touche LLP and affiliated entities.
360°thinking.
Discover the truth at www.deloitte.ca/careers
© Deloitte & Touche LLP and affiliated entities.
360°thinking.
Discover the truth at www.deloitte.ca/careers © Deloitte & Touche LLP and affiliated entities.
360°thinking.
Discover the truth at www.deloitte.ca/careers
AN INTRODUCTION TO BUSINESS RESEARCH METHODS
QUANTITATIVE RESEARCH METHODS: COLLECTING AND ANALYSING DATA
85
there are (i.e. higher weighting in the dataset). Best avoided if possible unless you are really confident in statistics.
6.5 CHOOSING APPROPRIATE WAYS TO PRESENT DATA THROUGH CHARTS, TABLES AND DESCRIPTIVE STATISTICS
You may have a clear idea of what you are looking for in the data, but once the data is entered into either a spreadsheet or an analysis package like SPSS, other possible ways of analysing the data become apparent.
We usually begin by attempting to describe particular values, their range, their central tendency, their dispersion around the mean. We can look at the data trends over time, and look for proportions in the data. This is called univariate analysis because we are looking usually at one variable at a time.
Once we have a clear picture of how the individual variables are behaving, we can start looking for relationships between variables – bivariate analysis. A range of methods is shown below for these two kinds of analysis.
6.5.1 FREQUENCY TABLES – UNIVARIATE
Tables show a list of categories (types of response) and the numbers of people responding to each. Sometimes this is just shown as a number, sometimes a percentage of the total choosing this response. When building a frequency table for interval level variables, categories will usually be grouped (if not the table would probably be too long). Make sure your groups of categories are exclusive e.g. for ages 21–30, 31–40 etc. not 20–30, 30–40 as this leads to difficulties of coding for age 30.
6.5.2 BAR CHARTS, HISTOGRAMS AND PIE CHARTS – UNIVARIATE
These are generally used for nominal or ordinal variables, so bars will be separated along the x axis. If using an interval variable, then a histogram would be used rather than a bar chart. It looks very similar but the axis shows a continuous interval range and adjoining “bars” are not separated. Note that pie charts should not show more than six segments – more than this will be very difficult to read, so either use a bar chart, or group the data before producing the pie chart.

AN INTRODUCTION TO BUSINESS RESEARCH METHODS
QUANTITATIVE RESEARCH METHODS: COLLECTING AND ANALYSING DATA
86
6.5.3 MEASURES OF CENTRAL TENDENCY – UNIVARIATE
This will be mean (average), median (midpoint value in ranked list) or mode (most frequently occurring value) in a range of values. The measure is a single figure so is not representable in a chart, however, a series of means, medians etc. can be charted or shown in a table. Mean can only be calculated for interval level variables. Median can be calculated for interval or ordinal variables. Mode can be calculated for any variable.
6.5.4 MEASURES OF DISPERSION – UNIVARIATE
This will be the range (difference between maximum and minimum value in a list of interval variables), the inter-quartile range (data must be in rank order, then this will show the difference within the middle 50% of values) or the standard deviation (data should be normally distributed for this to be effective). The standard deviation is the average amount of variation around the mean (calculated by taking the difference between each value and the mean, totalling these differences and dividing the total by the number of values). A higher standard deviation therefore means greater variation around the mean.
We might use a box plot to look at both central tendency and dispersion in a chart format (SPSS can produce these from your data). A box plot shows where the median of the data lies and how the data clusters around that median or middle value. 50% of the data will lie in the “interquartile range” shown in a box plot as a rectangle with the median line cutting vertically through it. In such an example, the median is off-centre to the left, so we can see that this set of values is “skewed positively”, rather than showing a classic normal distribution (see notes on sampling). The plot shows with an extended horizontal line the extent of the lower quartile (i.e. the 25% of the data with the lowest values) and the higher quartile – same but for the highest values. There are two more values from the data set which sit outside the range of most of the data, called “outliers” – they are on the right of the chart. This kind of chart is useful when in your research you want to give an interquartile range (“half of the values are between x and y”) and to see whether a normal distribution applies. This will also affect your later statistical analysis.
6.5.5 CHARTS, DIAGRAMS AND TABLES – THE DETAIL
It is probably quite obvious, but all diagrams etc. which are presented in a research report will need to be checked for detail. When you are putting the last-minute touches to a report before a deadline (at study and at work) it is easy to imagine that everyone will know what this graph shows. This leads to a big problem if we leave it at that. You must check each

AN INTRODUCTION TO BUSINESS RESEARCH METHODS
87
QUANTITATIVE RESEARCH METHODS: COLLECTING AND ANALYSING DATA
87
graph to ensure it has a clear title, the units of measurement involved are shown, any data source is shown, the sample size is shown where relevant, the axes are labelled, the variables read in a comparable way if more than one chart uses the same axes and variables e.g. left to right or top to bottom and there is a key or legend which is readable (importing from Excel often leads to very tiny illegible legends – they must be reformatted). The general rule is that the title for a table is shown above the table itself, while a figure (i.e. chart or graph) title is shown below the figure. It can also be helpful to introduce a chart in the text with an idea for the reader of what it will show, then after the chart in the text, explain what you think it did show. Of course, readers will want to make up their own minds, but it is helpful to let them know what you think they should look for in the chart.
6.5.6 TRENDS OVER TIME
Usually shown in a line graph where time is on the horizontal axis. This is always a good first step in analyzing data over time. Then if you wish to look at a trend over time for a single variable, the most common method is the use of index numbers – such as the FTSE100 index of share movements over time based in London (FTSE stands for Financial
Linköping University – Innovative, well ranked, European
Interested in Strategy and Management in International Organisations? Kick-start your career with an English -taught master’s degree.
liu.se/master
Click here!

AN INTRODUCTION TO BUSINESS RESEARCH METHODS
QUANTITATIVE RESEARCH METHODS: COLLECTING AND ANALYSING DATA
88
Times Stock Exchange) or the Standard and Poor (S&P) 500 based in New York. The base period is usually represented by the number 100 (or 1000 as in FTSE).
The FTSE100 is an index of the stock value of the 100 largest companies listed on the London Stock Exchange, whereas the S&P 500 represents an index value of the 500 largest companies on the NYSE or NASDAQ. Rather than the mere “average price” of the component stocks, these indices are “weighted” by the market value of each company, providing a more meaningful metric.
In a simple index, each value is converted to an index number by dividing the data value for the case by the data value for the base period and multiplying by 100. Why bother converting each value to an index number? Generally because it makes comparison across time or numbers much simpler – can be done at a glance.
Try to find an example (from the web or media) of a trend using index numbers.
Suppose we want to take the trend further and estimate where it will go after the actual data we have to hand? Here we are into forecasting and we will be covering this in our last but one chapter.
6.6 SELECTING APPROPRIATE STATISTICAL TOOLS FOR THE RESEARCH VARIABLES
6.6.1 RELATIONSHIPS BETWEEN VARIABLES – BIVARIATE ANALYSIS
A relationship between variables means the variation in one variable coincides with variation in another variable, it does not imply a causal or “cause and effect” relationship, i.e. it does not necessarily follow that one will be an independent and one a dependent variable. Though this can sometimes seem obvious – e.g. if the two variables include something like age or gender which can influence the other variable but not be influenced by other variables. (Presumably the amount you eat could be influenced by your age, but your age could not be influenced by the amount you eat!)
6.6.2 CONTINGENCY TABLES OR CROSS-TABULATIONS – BIVARIATE
Set up as a frequency table including column percentages but showing both variables against the chosen categories. If one variable is suspected of being the independent variable, this is shown as a column variable not a row variable. Such tables are used to look for patterns

AN INTRODUCTION TO BUSINESS RESEARCH METHODS
QUANTITATIVE RESEARCH METHODS: COLLECTING AND ANALYSING DATA
89
of association in the data. Frequency tables display low level data – just a frequency count of how many times an event occurs.
6.7 FAMILIES OF STATISTICS
Research and statistics are aligned and complementary with each other in many respects. Statistics are used to help describe and analyze the data collected through the research process. Statistics can be useful in qualitative research as discussed in Chapter 9. Even qualitative responses to survey items, or questions posed during exploratory research, can be thematically analyzed and make use of core statistics such as frequency counts and percentages to assist in the analysis and synthesis of such qualitative data.
Statistics can be classified into three “families”. Descriptive statistics, Correlational statistics and Inferential statistics. Furthermore, inferential statistics can be classified as parametric or non-parametric. These families of statistics align well with the Classifications of Research (as presented in Chapter 3).
6.7.1 Descriptive statistics are often used as the basis of both Exploratory and Descriptive research. Furthermore, descriptive research uses descriptive statistics – that is, they are useful in answering research questions, focused around questions inquiring about who, what, when, where, how much/how often.
6.7.2 Correlational statistics, and especially the correlation coefficient (described further in this chapter) are used to provide a measure of association between two or more variables. Correlation coefficients go beyond mere description of data, but begin to show the level of association vis a vis the correlation coefficient. One must be careful to recognize that just because there is a strong correlation between two (or more) items, this does not suggest or imply a cause and effect relationship. The correlation coefficient merely indicates the degree of strength of association between variables. That is, the degree to which one variable is related to another variable. In a positive relationship, as the value of one variable increases, so does the other. The reverse is true when a negative relationship exists. Nil correlation indicates that there is a completely random relationship between data of two or more variables. Correlation coefficients are measured quantitatively. A perfect positive relationship is indicated by +1.00. A perfect negative relationship is indicated by -1.00, and 0.00 indicates the lack of any type of association between variables at all.
6.7.3 Inferential statistics are used when conducting experimental research, and they are used to help determine a cause and effect relationship (and can help answer the question “why” things happen). Inferential statistics are used to test hypotheses, rather than answer research

AN INTRODUCTION TO BUSINESS RESEARCH METHODS
90
QUANTITATIVE RESEARCH METHODS: COLLECTING AND ANALYSING DATA
90
questions. There are many types of inferential statistics, and the choice of a specific statistic depends on the nature of the research design being used and the types of data collected.
Within Inferential statistics are two sub categories: Parametric and Non-parametric statistics (Corder & Foreman 2000). The choice of using a parametric or non-parametric statistic depends on a few things. Parametric statistics are best suited for conditions where the sample size is large (generally over 30), the distribution of the data of the population is assumed to be relatively normal, and the level of the data being analyzed is “high” (interval or ratio level data). Non-parametric statistics are useful for the opposite reason. They are often referred to as “small sample size” statistics (where the N is 30 or less). Also, non-parametric statistics are useful when it can’t be assumed that the data distribution of the population is normal. However, researchers rarely know the exact shape of the population data, so assumptions need to be made. Finally, non-parametric statistics are very useful when the level of the data being analyzed is “low” (nominal or ordinal). Non-parametric statistics are especially useful in analyzing exploratory research data because the data here is often of a low level. Many of the non-parametric statistical tests are included in IBM SPSS Predictive Analysis software. Refer to the Corder & Foreman text included in the reference list for an excellent source on the use and interpretation of non-parametric statistics.
We will turn your CV into an opportunity of a lifetime
Do you like cars? Would you like to be a part of a successful brand?We will appreciate and reward both your enthusiasm and talent.Send us your CV. You will be surprised where it can take you.
Send us your CV onwww.employerforlife.com

AN INTRODUCTION TO BUSINESS RESEARCH METHODS
QUANTITATIVE RESEARCH METHODS: COLLECTING AND ANALYSING DATA
91
The table below shows some of the popular parametric significance tests, along with their non-parametric equivalent.
Parametric test Non-parametric equivalent
One sample t-test The sign test; The Wilcoxon one sample test
Two sample t-test The Mann-Whitney U; Student’s t-test
One way ANOVA Friedman’s test
Pearson Product Moment Correlation Coefficient (r)
The Spearman rho
6.8 MEASURES OF CORRELATION – THE CORRELATION COEFFICIENT
A correlation coefficient is a statistic which is designed to quantify the degree of correlation between two variables. Generally speaking, a correlation coefficient will be expressed as a number which will either be positive or negative. The “sign” (positive or negative) indicates the direction of the relationship, i.e. +1 is a perfect positive relationship (as one variable increases, the other increases, and -1 is a perfect negative relationship (as one variable increases the other decreases). The absolute value of the number indicates the strength of the relationship. The value will be between 0 (indicating no relationship) and 1 (indicating a perfect relationship). Calculating correlation coefficients is easy, BUT they are subject to error due to the numerous (albeit simple) calculations which have to be made. Using a statistics program such as SPSS makes the calculations easy as all the researcher has to do is enter the raw data. The program does the error proof work (assuming error proof data entry)!
There are four different types of correlation coefficients which are described below. The choice of which to use depends upon the level of data being used for the variables being correlated.
6.8.1 PEARSON’S R (ALSO CALLED THE PEARSON’S PRODUCT
MOMENT CORRELATION COEFFICIENT (PMCC)) – BIVARIATE
The Pearson r looks for a relationship between two interval level variables. Before calculating a Pearson r, it is worth constructing a scatter diagram for the two variables, as it should only be used when there is a broadly linear relationship, it will not hold for a curve relationship. The scatter plot provides a visual image of the correlation.

AN INTRODUCTION TO BUSINESS RESEARCH METHODS
QUANTITATIVE RESEARCH METHODS: COLLECTING AND ANALYSING DATA
92
6.8.2 SPEARMAN’S RHO (ρ) – BIVARIATE
The Spearman rho is used when at least one of the two variables is ordinal level data, and the other is ordinal or interval level data. This calculation produces the same kind of outcome as Pearson’s r, i.e. a positive or negative relationship between 0 (no relationship) and 1 (perfect relationship).
6.8.3 ETA – BIVARIATE
Eta is used to explore relationships between an interval level variable and a nominal level variable. Eta can only show strength of relationship, not direction. It does not assume a linear relationship.
6.8.4 PHI COEFFICIENT (Φ) AND CRAMÉR’S V – BIVARIATE
Phi is used for exploring a relationship between two dichotomous variables, Cramér’s V does the same for two nominal level variables. Phi outcomes are like Pearson’s r and Spearman’s rho and can vary between 0 and + or -1. Similar to the Eta, Cramér’s V can only show strength of relationship, not direction (the coefficient is always positive).
6.9 REGRESSION ANALYSIS
Regression analysis is a coefficient of determination (it can also be called a regression coefficient). It can be calculated by squaring the value of Pearson’s r and multiplying it by 100. This produces a percentage, which describes the proportion of variation in one dependent variable accounted for by the other independent variable. So if we explored the relationship between age and weight in a sample, producing a Pearson’s r value of -0.35, then the coefficient of determination would be 12.25%, which suggests that in our sample 12.25% of the variation in weight was accounted for by variation in age. A similar analysis, where more than one independent variable is involved, is called multiple regression analysis. (This will be discussed further in Chapter 11.)

AN INTRODUCTION TO BUSINESS RESEARCH METHODS
93
QUANTITATIVE RESEARCH METHODS: COLLECTING AND ANALYSING DATA
93
6.10 STATISTICAL SIGNIFICANCE
A way of testing the level of confidence we can have that a probability sampling technique has generated results, which can apply to the full population. Such a test can also estimate the chances of no relationship in fact existing between two variables, when bivariate analysis suggests that there is. We often use the word “significant” to mean the same as important when we are writing text. Your understanding of the phrase “statistical significance” should prevent you from now on from using “significant” in academic work, unless you are relating this to a statistical test.
To calculate statistical significance, we set up a “null hypothesis” i.e. that two variables in the sample are not related. Then decide the level of statistical significance we find acceptable, i.e. the level of risk that we would reject the null hypothesis (i.e. say the variables are related) when in fact they were not related. It is usual to say that the maximum level of 0.05 is acceptable (i.e. p<0.05). This suggests that in no more than 5 cases out of 100, will we be wrong (i.e. suggest a relationship which is not there) – the same as saying we have 95% certainty that the relationship is correct. We can choose a more stringent level of certainty (e.g. p<0.01 where there is only a 1 in a 100 chance of our relationship not existing when we say it does). This would, however, increase the risk of a “Type 2 error”,
���������������������� ���� � �
����������������������� ��� ������������������������������������� �� ���� ����� ������������� ��������� ���������������������������������� ���� ����������� ���� �������� ����������������������� ������� ���� ��������� ��� �������� ������������������� ������������������
� ����������������� �� ������������������� �

AN INTRODUCTION TO BUSINESS RESEARCH METHODS
QUANTITATIVE RESEARCH METHODS: COLLECTING AND ANALYSING DATA
94
which means confirming the null hypothesis (that there is no relationship) when in fact there is a relationship.
We should bear in mind that the likelihood of a statistically significant result will increase with sample size – for the obvious reason that the bigger the sample in relation to the population, the less likely that any analysis on the sample will differ from the population by chance. So if we think there is likely to be low statistical significance, we should increase sample size if possible, to make the analysis more sensitive to statistical significance. Very small samples, below 30, are more likely to show an unacceptable p level, i.e. above 0.05 probability that the difference is caused by chance.
We use a chi-square test (x2) to produce our level of statistical significance (or probability level). This test looks at each cell in a contingency table and calculates the expected value if there was no relationship but the value was a product of chance, works out the difference between each expected value and the given value and sums the differences. This produces a single chi square value for the table, which is not important in itself, but is produced with a statistical significance level (ρ). This is the number we are looking for, to check against our desired level of certainty. The chi-squared test can only be used with nominal level data and provides a useful method for determining statistical significance when dealing with such low-level data.
As well as applying chi-square tests to contingency tables, tests of statistical significance should be applied to all bivariate analysis outcomes (coefficients) such as Spearman’s rho and Pearson’s r. This helps us to be sure that the correlation we expect from the sample, really does exist in the population.
6.10.1 TESTING WHETHER GROUPS ARE DIFFERENT – MULTIVARIATE ANALYSIS
If we want to test whether the distribution of a variable in a sample is similar to or different from the distribution of a population or census which is already known, then we can use a Kolmogorov-Smirnov test (only if data is ranked). The test produces a D statistic, which is used to calculate whether the sample distribution differs from the full population distribution by chance only.
Where we have a quantifiable variable which can be split into two independent groups of values using a descriptive variable, we can test the probability of the groups being significantly different using an independent groups t-test. The lower the t statistic, the more likelihood of any difference in the two different groups being caused by chance.

AN INTRODUCTION TO BUSINESS RESEARCH METHODS
QUANTITATIVE RESEARCH METHODS: COLLECTING AND ANALYSING DATA
95
Similarly, a paired t-test can be used to measure similar pairs of variables, e.g. a machine’s speed of operation before and after maintenance. The paired t-test is used when the measures being compared are from the same group (e.g. before/after).
Differences between three or more groups can also be tested to see if they are likely to be occurring by chance or if there is really a “statistically significant difference” – this is done using one-way analysis of variance, ANOVA, and produces an F statistic plus a significance probability level. A high F statistic and a significance p level of below 0.05 should offer a “statistically significant” result, i.e., not one occurring by chance. An ANOVA example might involve members of three or more different groups of staff producing values for “degree of learning” after a training course. The ANOVA test can establish whether different results in degrees of learning after training which seem to be shown by the different staff groups could occur by chance, or whether there is a “statistically significant” difference between them. There are some data requirements for ANOVA, but broadly this can be used provided there are at least 30 values in each group and each value is independent of others. Whereas t-tests compare either two different groups, or the same group twice, ANOVA allows the researcher to compare 2 or more groups at the same time. Both t-tests and ANOVA require high level (interval or ratio) data.
This chapter has been very factual and is not easy to take in, unless you are already familiar with statistical analysis and find it easy to follow. It is intended just to give some revision pointers based on earlier reading or teaching you may have experienced.
You might like to consider the following question to think through this area. If I asked the question: “Please rank order the following benefits of a colour laser printer: speed, professional output, capacity for more than one ream of paper, faster speed on black and white print, capability to back copies, other”. Then what kind of values will be produced if 100 people respond to this question? (a) how would we code each response, including the “other” response? (b) and what kind of technique could we use to analyse the response data, and here we could assume that we know whether the respondent actually uses laser printers or not.
6.11 QUESTIONS FOR SELF REVIEW
1. Why is it important to think through the data likely to be produced from your research at an early stage?
2. Why do you need to know the difference between nominal, ordinal, interval and ratio level variables?
3. What is bivariate analysis?

AN INTRODUCTION TO BUSINESS RESEARCH METHODS
96
QUANTITATIVE RESEARCH METHODS: COLLECTING AND ANALYSING DATA
96
4. What is the minimum number of cases you need to make a sample useful for statistical analysis?
5. What is the level of probability (p) needed to state in your research results you have found a “statistically significant” difference?
6. What is the purpose of using index numbers and an example from the web or media?
6.12 REFERENCES
Corder, G.W. & Foreman, D.I. 2014, Nonparametric statistics: a step by step approach, 2nd edn. Wiley and Sons, Hoboken NJ.
Saunders, M. Lewis, P. & Thornhill, A. 2016, Research methods for business students. 7th edn. Pearson Education Limited, Harlow, England.
Velleman, P.F. & Wilkinson, L. 1993, “Nominal, Ordinal, Interval and Ratio typologies are misleading”. The American Statistician, vol. 47, no. 1, pp. 65–72.
Maersk.com/Mitas
�e Graduate Programme for Engineers and Geoscientists
Month 16I was a construction
supervisor in the North Sea
advising and helping foremen
solve problems
I was a
hes
Real work International opportunities
�ree work placementsal Internationaor�ree wo
I wanted real responsibili� I joined MITAS because
www.discovermitas.com

AN INTRODUCTION TO BUSINESS RESEARCH METHODS Questionnaire design and testing
97
7 QUESTIONNAIRE DESIGN AND TESTING
7.1 CHAPTER OVERVIEW
7.1.1 LEARNING OUTCOMES
By the end of this topic successful students will be able to:
1. appreciate and overcome the difficulties associated with questionnaire design2. recognize the applications when survey research may be useful3. choose from a range of survey question formats4. design, pilot and administer questionnaires as part of a research strategy
7.2 APPRECIATE AND OVERCOME THE DIFFICULTIES ASSOCIATED WITH QUESTIONNAIRE DESIGN
Questionnaires can be a powerful source of information. But effective questionnaire design is of utmost importance if you want to get the information you desire. To begin with, you must decide what the purpose (objective) of the questionnaire is, and ultimately what are the research questions you want to answer as a result of using a questionnaire. From there you begin to design questions which accomplish your objective. You also need to consider the length of the questionnaire. Respondents who begin to suffer from “survey fatigue” will often either fail to finish the questionnaire or just mindlessly rush through the questions to finish it quickly. As a researcher, you want to eliminate both of those possibilities.
What kind of difficulties and problems arise with questionnaires? Surely it is quite straightforward to write them? It is said that a person’s wisdom can be judged by the questions they can compose rather than the answers they know! In fact, designing questionnaires is particularly difficult. What do we need to think about when designing effective questionnaires?
1. The format and design of the questionnaire – not too off-putting, not too long, not too difficult to read, easy to know what you have to do to complete it
2. How much general information do you need to have about the respondent? If you need biographical data such as age and gender etc., why is that? What extra value will it add to your research question? Should you start with easy questions like gender, or end with them?

AN INTRODUCTION TO BUSINESS RESEARCH METHODS Questionnaire design and testing
98
3. What proportion of open and closed questions should be in the questionnaire? Closed questions start with a verb (Do you come here often?) and invite a simple yes/no answer. Or they may be “forced-choice” i.e. only a limited number of alternative answers are available to choose from. They are easy to code but limiting in detail. Open questions give much richer information but are widely variable across responses and therefore harder to code and analyse.
4. What kind of questions can we ask? Straight questions with a clear answer? Questions about which people must reflect? Tickbox questions or written answer questions? Numerical scale questions? These are rating scale questions which allow the respondent to mark a numerical scale in response to a question; for example “How important is it to have a clear organizational policy on harassment at work?” Answers may range from 1 (not important at all) to 4 (very important). Likert scales often have middle points which allow a neutral response. How do we lay out the questions? For example, if they are scale responses – do we lay them out horizontally or vertically?
5. How much space on the page do you give someone to write an answer to an open question?
6. Should you include check questions, for example asking the same thing two different ways to ensure you are getting consistent answers?
7. How much information do you give the respondent about why you are asking the questions? Technical research detail? Just enough to know who you are and how data will be used?
8. How do they get it back to you? If email – what does that do to anonymity? Should you include stamped addressed envelopes, drop boxes?
9. Should you communicate with potential respondents before the survey itself? And after delivery to encourage completion? How many times could you prompt for a reply?
10. Should you use post, fax, email or online surveys?11. What happens if the response rate is too small to be useful? 30% is considered a
minimum but this will depend on the volume of response.12. What if some of the questions are misunderstood? How can I prevent this happening?13. Should I use incentives for survey return? How does that affect results?14. How many surveys should be used for a pilot survey to test the questions? Can we
use pilot responses in the results?15. Where do I keep returned surveys?16. How much do I have to spend on printing and/or designing and/or posting out
and chasing questionnaires? Can they go out with other mailings to save cost, or will this lower the response rate?
These are all practical questions which are best answered in the context of your specific research questions in relation to the actual population who will receive the questionnaire.

AN INTRODUCTION TO BUSINESS RESEARCH METHODS Questionnaire design and testing
9999
You probably already have views about the answers, but if not, these are all detailed practical issues which you will have to decide before sending out your questionnaire.
You may like to search online for an article by Vidal Diaz de Rada on Questionnaire Design (Diaz de Rada, V., 2005). This author discusses some of the formatting details for questionnaires such as size, colour and cover page. All these factors play an important role in your response rate by those asked to complete the questionnaire.
7.3 CHOOSING FROM A RANGE OF QUESTION FORMATS
Textbooks generally list the following as types of closed questions used in questionnaires:
1. List – select any answer of those provided (offer an “other” category if necessary)2. Category – select one answer (also called multiple choice)3. Ranking – put answers in order4. Rating – score or give a value to answers5. Quantity – respond with amount6. Grid – complete a matrix to provide more than one answer

AN INTRODUCTION TO BUSINESS RESEARCH METHODS Questionnaire design and testing
100
We could add to the list above:
1. Personal factual attribute question – e.g., age, employment status, qualifications2. Likert rating scale – strength of response (e.g., strongly agree through strongly
disagree) indicated against numeric scale of 1 to 5 with a neutral midpoint3. Rating scale – strength of response indicated against verbal scale4. Rating scale – strength of response indicated against bipolar or self-anchoring
numeric scale (opposite statements at either end of numeric scale)5. Semantic differential scales – opposite adjectives at each end of numeric scale6. Frequency scale – verbal scale or numeric between always and never7. Fill in the blank (open response)8. Dichotomous choice (e.g. Yes/No, True/False, Agree/Disagree)9. Match pairs
You may be able to think of more? Remember closed questions are designed to check facts or perceptions, confirming information and producing answers which either qualify the respondent in some way, or give comparable data across your sample.
Open question formats include:
1. Open list – number of answers required, type of answer free2. Open essay – often used as a final option to let respondent comment3. Personal question about opinion – free answer4. Personal question about behaviour – free answer5. Vignette or scenario – question is set in an example context, answer usually open
See if you can devise a business research question for each of the formats above. It is only by doing this, that we get an idea of any problems in wording. Wording of the questions on surveys is one of the significant challenges in designing effective questionnaires. Preparing meaningful and carefully thought out response sets to the questions is also an important part of survey design.
In addition to having an objective for the questionnaire when you begin, you should also start by listing what information you want to collect, and then design questions which elicit that information; you also need to consider the type of information you want to collect and the level of data your questions will provide. For example, you may want to know the age (or income, etc.) of your respondent. You can ask that as an open-ended question and request they fill in the blank with their actual age (or income), or you can design a closed ended question with 5 different ranges of ages (or incomes) which the respondent can choose from. While the question is the same, the answers yield very different levels of
AN INTRODUCTION TO BUSINESS RESEARCH METHODS Questionnaire design and testing
101
data which will impact the kind of analysis you can perform on the data. Also, when asking more personal questions, you may get a more honest answer if ranges are used. But range data will be at the ordinal level of data, while asking for actual numbers provides ratio level data. You have to decide what level of data you need. Don’t ask for actual numbers if all you are going to do with it is categorize it later on anyway. When designing ranges, think about the highest value likely to be in the population. Typically, 5–7 categories is standard, so divide the highest number by 5–7 to establish the range which the categories should include. Unless you absolutely know the highest value, leave the last range open (if asking age, the last category should say “xx or older” rather than xx–yy). If too many respondents fill in just one category you probably did not consider this range issue carefully enough! Be sure to collect all the information you need, but do not collect information you will not need or use. This is a common problem novice survey designers often face.
There is another kind of question in many questionnaires and that is a filter question (sometimes a whole filter section). Filter questions are used when some parts of the questionnaire are not relevant to all respondents. We may use a filter question such as “If your answer is no, please move to question x”. Or we can clearly label sections “if x applies to you, please omit this section”. The important thing will be clarity and avoiding filters if at all possible, since they are often a cause of error and non-response. The exception will be if we use filters in an online survey, here they can be automatic for the respondent and remove all doubt as to which question to answer.
When designing questionnaires, it is worth referring to a book on this subject by A.N. Oppenheim. The second (2000) edition of this classic work (originally written in 1992) includes far more information on questionnaires than most of us will need, but discusses specific issues very clearly. Additionally, Saunders (et. al., 2016) dedicate an entire chapter (Chapter 26) to the topic of internet research methods (e-research).
7.4 HOW TO DESIGN, PILOT AND ADMINISTER QUESTIONNAIRES
Remember that questionnaires are not just the self-completion kind sent through the post or email or found on the web. Question sets are also created for structured interviews and semi-structured interviews either face-to-face, over the telephone or online through video-conferening (we will look at these in detail in the chapter on interviewing). Well-designed questions are the skeleton of any good research study. Even when we don’t ask them directly of respondents, we often have to prepare them to collect data – for example when preparing to conduct participant observation, it will help to have clear questions in mind and perhaps some kind of pro-forma for us to complete during the experience.

AN INTRODUCTION TO BUSINESS RESEARCH METHODS Questionnaire design and testing
102102
Here are ten tips to avoid survey question pitfalls:
1. Keep checking back to your research focus and objectives – what do I want to find out?
2. For every question, jot down the maximum number of ways in which you think it can be answered – this immediately identifies problems with wording and scaling. This is even better done by someone else for you as a double check, and serves as a proof reading and a pilot testing of the survey
3. Closed questions are easier to use for data but including only closed questions will provide you with limited data. Unless you believe you can anticipate everything a respondent will say, use some open questions as well.
4. Check for vague terms in the question e.g. often, usually, sometimes, this year, most, few – people will have different meanings for these terms so their answers will not necessarily coincide with what you intend.
5. If you are asking a “why” question, think about the frame of reference of your respondent – are they likely ever to have thought about this “why”? If not, can you make it easier to answer? Perhaps offer alternative answers with an “other” category?
6. Check for “leading” questions which lead a respondent to agree or disagree with something (“Push-polling”).
Open your mind to new opportunitiesWith 31,000 students, Linnaeus University is one of the larger universities in Sweden. We are a modern university, known for our strong international profile. Every year more than 1,600 international students from all over the world choose to enjoy the friendly atmosphere and active student life at Linnaeus University.Welcome to join us!
Bachelor programmes inBusiness & Economics | Computer Science/IT | Design | Mathematics
Master programmes inBusiness & Economics | Behavioural Sciences | Computer Science/IT | Cultural Studies & Social Sciences | Design | Mathematics | Natural Sciences | Technology & Engineering
Summer Academy courses
Scholarships

AN INTRODUCTION TO BUSINESS RESEARCH METHODS Questionnaire design and testing
103
7. Check for “double-barreled” questions. Look for the word “and” in your questions! Allow respondents to answer one thing at a time.
8. Avoid technical words and acronyms (e.g. management jargon such as incremental, optimum, marginal, strategic, motivation, ROI [return on investment] etc.) unless you are sure the respondents are familiar with them.
9. If you are using yes/no or true/false questions, make sure that no-one is likely to want to give an answer which is not available (e.g. sometimes). Make sure the question is truly a dichotomous choice.
10. Ask yourself if some of your questions are actually the kind of things only staff with some considerable experience of the company will know. If so, do you have an attribute question to qualify whether they have that experience? Use filter questions (in an online survey) so that respondents only see those relevant to them.
More generally, here are some pointers to consider about the layout and testing of your survey questionnaire. You should have tested your questionnaire against each of these points before you send it to important respondents.
• Have you considered whether to use five intervals in a scale or four? Five intervals will encourage a central tendency, i.e. respondents find it easier to give a mid-point reply than an extreme reply. So given Very poor, Poor, Average, Good, Excellent, there are likely to be a lot of Average answers. Four intervals are better as they force respondents to commit themselves on the positive or negative side, but should also include a Not Sure or Not Applicable, usually located at the end of the scale for ease of coding.
• For similar reasons, if you are using a large number of rating questions, switch some around (i.e. they should not all be expressed just positively or just negatively) so that respondents have to think, rather than running quickly down a ticklist. They will need switching back before coding.
• If you are asking for company information e.g. sales or customer profiles etc. – are you sure all respondents will be able to answer this? Could you just find this out from a senior manager or contact, rather than asking everyone in your sample?
• Get someone to look at your questionnaire. Could you make the layout and format easier to read?.
• Check the questionnaire’s spelling and grammar – both are vital to ensure transmission of accurate meaning and maintain researcher credibility.
• Have you clearly shown how to respond to each question (e.g. tick mark or circle (difficult on email forms as this requires symbol, a X is easier, this is simplified if using forms software as in Word or Google Docs); and how will the respondent return the form?

AN INTRODUCTION TO BUSINESS RESEARCH METHODS Questionnaire design and testing
104
• Check whether you have authority to send this questionnaire (if it is to an organization’s staff etc.).
• Pilot-test the questionnaire, and pre-pilot (an earlier draft stage). You will only get one chance to get these questions answered by this sample!
• Maintain a record of all changes you have made to your questionnaire and why. This will be helpful when you are writing up your research method and should remind you of the learning you have achieved.
There are a number of articles on web-based questionnaires in recent issues of the International Journal of Social Research Methodology (Fox, J., Murray, C. et al. 2003; Heerwegh, D., Vanhove, T. et al. 2005) and the Electronic Journal of Business Research Methods (McCalla, R.A. 2002). Look through them and consider what you believe to be the most important differences between web-based and postal questionnaires. We know that the web offers us speed and often ease and convenience of use. We also know that some companies offer simple online questionnaire building sites which may be free or involve just a small charge (e.g. www.surveymonkey.com) and this can help give a quick questionnaire a professional look and offer automatic response summaries. If you are a member of a higher education institution or organization which has a professional online survey tool, such as Qualtrics (www.qualtrics.com), then be sure to use this rather than a free version, as your formatting and potential for data analysis will be much more professional.
Survey Monkey and Qualtrics provide a means to both design and deploy your surveys through email, the web, and other online portals including mobile devices. Using such online questionnaire and survey design resources can help make the survey research process efficient. A note of caution is that resources such as these place the ability to conduct a questionnaire or survey into the hands of virtually anyone. While these programs make creating questions easy, they do not make the survey design process foolproof. Many a bad question, or even entire survey has been deployed by “amateur” researchers using high power research tools. And the downside of using these online tools is that they do have some limitations regarding the types and layout of your questionnaire.
The choice of a web survey or physical print survey (post or e-mailed) will always depend on the population you are targeting and the context of your research. Clearly some populations will not have web access and/or may not like using the web interface. Others, for example people seeking a job online, would be ideal candidates for web survey. There is some evidence that if a group to be surveyed is offered a choice between online or physical questionnaires, they will respond better to physical copies if these are administered together in one place and time, but it’s better to use online questionnaires if not co-located.

AN INTRODUCTION TO BUSINESS RESEARCH METHODS Questionnaire design and testing
105105
7.5 QUESTIONS FOR SELF REVIEW
1. Why do most questionnaires for self-completion have a lot of closed questions?2. What incentive would it take for you to answer a 20 item questionnaire, a 50 item
questionnaire and a 100 item questionnaire? Think about your response in relation to how many items you might include.
3. What is a Likert scale? What different kinds of scale questions are there?4. How would you design the category ranges of a question if you were interested in
knowing the ages of parents of nursery school children versus the age of patients in a nursing home?
5. Why should a questionnaire always have a covering letter/email?6. Should you use an odd or even number of scales for a survey question? Why?

AN INTRODUCTION TO BUSINESS RESEARCH METHODS Questionnaire design and testing
106
7.6 REFERENCES
Couper, M.P. 2008, Designing effective web surveys. Cambridge University Press, New York.
Diaz de Rada, V. 2005, “Influence of questionnaire design on response to mail surveys.” International Journal of Social Research Methodology, vol. 8, no. 1, pp. 61–78.
Fink, A. 2016, How to conduct surveys: a step by step guide, 6th edn. Sage Publications, London.
Fox, J. Murray, C. & Warm, A., 2003, “Conducting research using web-based questionnaires: practical, methodological and ethical considerations”. International Journal of Social Research Methodology, vol. 6, no. 2, pp. 167–180.
Heerwegh, D. Vanhove, T. Matthijs, K. & Loosveldt, G., 2005, “The effect of personalisation on response rates and data quality in web surveys”, International Journal of Social Research Methodology, vol. 8, no. 2, pp. 85–99.
McCalla, R.A. 2002, “Getting results from online surveys: reflections on a personal journey”, Electronic Journal of Business Research Methods, vol. 1, no. 1, pp. 55–62.
Oppenheim, A.N., 2000, Questionnaire design, interviewing and attitude measurement 2nd
edn. Bloomsbury Academics, London.
Saunders, M. Lewis, P. & Thornhill, A. 2016, Research methods for business students. 7th edn. Pearson Education Limited, Harlow, England.

AN INTRODUCTION TO BUSINESS RESEARCH METHODS using seCondary data
107
8 USING SECONDARY DATA
8.1 CHAPTER OVERVIEW
8.1.1 LEARNING OUTCOMES
By the end of this topic successful students will be able to:
1. Identify the value of secondary data to business research2. Understand what to look for as secondary data and where to find it3. Understand the disadvantages of using secondary data in business research and
how to overcome them4. Distinguish between proprietary and public access sources of secondary data.
8.2 THE VALUE OF SECONDARY DATA TO BUSINESS RESEARCH
8.2.1 BROAD DATA GROUPINGS AVAILABLE
Survey secondary data will usually have been analysed for its original purpose and could be a national periodic compulsory census, a regular e.g. annual survey or a one-off survey. You should be aware that this is unlikely to be raw data, i.e. some filtering and data decisions will have had to be made (e.g. coding of non-responses, grouping of data etc.).
8.2.2 CONTEXTUAL BACKGROUND
Much business research will require an awareness of industry, national or sector context (for example if you are conducting primary research in a healthcare organization, it will be useful to set the context for this by comparing national or international healthcare statistics, or you may be reviewing your local area’s labour force and want to see how this relates to your country’s or other country’s labour force statistics).
If you would like to try out a search for some international labour force statistics on the web, then conduct the following experiment. Try Google first and note down what you can find in 10 minutes. Then try Eurostat (the European Union statistics website) and note down how long it takes to find labour force statistics for member countries and any other issues which arise. Then try www.esds.ac.uk which should give you access to OECD

AN INTRODUCTION TO BUSINESS RESEARCH METHODS using seCondary data
108108
Labour Force statistics. You may also want to try the US based Conference Board (www.conference-board.org/data) and select “international comparisons”. Note down how long this takes and what kind of information seems to be available. This experiment should give you a clear idea of how complex some secondary data can be and the types of data, particularly statistical data, which is easily available to the researcher.
If you are likely to use such sources, think about:
1. How the different sources compared2. How long did it take to use each source. Would it be easier and faster next time?3. How do the labour force statistics compare? Were you finding similar statistics?
8.2.3 QUICK AND INEXPENSIVE DATA
Secondary data is often cost-free and it can be accessed over the web or from your local/university library. Secondary data can be classified as proprietary or public access. Proprietary data is that which has restricted access, whether it is protected from use by others without permission, or whether it is accessed through a subscription to a service providing the
89,000 kmIn the past four years we have drilled
That’s more than twice around the world.
careers.slb.com
What will you be?
1 Based on Fortune 500 ranking 2011. Copyright © 2015 Schlumberger. All rights reserved.
Who are we?We are the world’s largest oilfield services company1. Working globally—often in remote and challenging locations— we invent, design, engineer, and apply technology to help our customers find and produce oil and gas safely.
Who are we looking for?Every year, we need thousands of graduates to begin dynamic careers in the following domains:n Engineering, Research and Operationsn Geoscience and Petrotechnicaln Commercial and Business

AN INTRODUCTION TO BUSINESS RESEARCH METHODS using seCondary data
109
data. When using proprietary secondary data it is important to be sure you have the right permission to use the data. As students enrolled at a university, often you have access to such proprietary data through your university library. For example, Lexis-Nexis, Hoovers and Mergent-online are private sources to extraordinary amounts of business intelligence and secondary data. However, for example if you just go to “mergent.com” you will be taken to its website, but in order to access its databases, you will have to have a subscription and login to the service. If your university (or public) library holds a subscription to Mergent, you would access it through the library’s gateway to these databases.
Often, students are not aware of the sources of private domain business intelligence to which they have subscription access through their place of study. Take time to visit your university library (either online or in person) to explore the possibilities. Additionally, many businesses often have subscriptions to such databases for its employees to access and use. As knowledge-based professionals, it’s important for you to know where to find and how to use such business intelligence and data to assist you in performing your job, and in helping make your employer successful.
8.2.4 LONGITUDINAL AND CROSS-CULTURAL DATA SOURCE
Much national and international data is collected on a periodic basis over time, so allows longitudinal research studies – not normally possible through primary research in view of cost and time constraints. Similarly, cross-cultural studies can use large survey data, when conducting this as primary research is particularly complex. For more information on cross-national studies and some of the problems which can arise see Lynn’s article on this in International Journal of Social Research Methodology (Lynn, P. 2003), available fulltext online.
8.2.5 META-ANALYSIS MADE POSSIBLE
Meta-analysis (conducting research on other people’s research, therefore at one remove from it) can also produce surprising fresh insights – partly on the basis that at this perspective it may be easier to see “big picture” patterns. Meta-analysis also involves the process of trying to integrate the quantitative and qualitative results of numerous research studies employing various methodologies and designs; all of which are on a similar topic or thesis. Meta-analysis (opposed to a literature review) seeks to draw more comprehensive conclusions and often involves quantitative methods of data analysis and synthesis of these multiple, but common-topic research studies. Meta-analysis operates under the Gestalt principle of “the whole is greater than the sum of its parts”.

AN INTRODUCTION TO BUSINESS RESEARCH METHODS using seCondary data
110
8.3 WHAT TO LOOK FOR AS SECONDARY DATA AND WHERE TO FIND IT
8.3.1 WHAT IS SECONDARY DATA?
Secondary data is data, which the researcher did not collect for themselves directly from respondents or subjects. This means that secondary data was not collected with the researcher’s purpose and objectives in mind. It may have been collected
• by other researchers, perhaps in the process of academic studies (could be available in journal articles, or published doctoral theses or conference proceedings) or
• in the process of normal operations (e.g. an organization’s “grey” material – information it publishes internally such as sales figures, information about product launches, company minutes etc., or an individual’s personal diary or learning log)
• by institutions, whose job is to collect data (e.g. government or regional offices of statistics and information, international bodies whose purpose is information collection e.g. OECD or academic, media and professional bodies set up for the purpose of collecting information and data directly and from these government or international bodies).
For many business research studies, especially qualitative ones, it will be difficult to find exactly the kind of data needed, since it is unlikely you would be doing the research were it not for the fact that it hadn’t been done before! So most studies will need to design collection methods for primary data. However, there is a vast amount of secondary data out there, much of it surprisingly accessible over the web, which may save us considerable time or give us a useful benchmark or context in which to set up our research design or a way of triangulating our results.
Where your research relates to a national or international level of operation, it is likely that national and international statistics will form part or all of your study, since these studies take time and money to achieve. Much of this kind of data. e.g. census data will be available free over the web or free from a variety of Government offices. Secondary data may be documentary, survey or multiple source, i.e. a mix of documents and surveys.
Access to secondary data implies two things – first of all you know how to find it and second you have permission to use it.

AN INTRODUCTION TO BUSINESS RESEARCH METHODS using seCondary data
111111
8.3.2 KEY BUSINESS INFORMATION SOURCES:
These sources and links are subject to regular change, be prepared to try several to find useful data for your research study.
EU: Eurostat – source of data on the European Union http://ec.europa.eu/eurostat/web/mainUK: UK Data Service. This is funded in the UK by the ESRC with contributions from the University of Essex, the University of Manchester and JISC. The main website is https://www.ukdataservice.ac.uk, but there is a special introduction to the service for students at https://www.ukdataservice.ac.uk/use-data/student-resourcesUK: www.statistics.gov.uk (census and other data surveys)UK: CIPD Recruitment Survey/Training & Development Survey etc. www.cipd.co.uk UK: Workplace Employee Relations Survey (WERS) www.data-archive.ac.uk This is a digital data archive for Social Sciences and Humanities UK: FT info http://news.ft.com (company information)
NA & other countries: Hoover’s Online www.hoovers.com (company information)NA: www.Fortune.com (US & Global business data sources); www.mergent.com (Mergent Online) NA: dol.gov; (US Dept. of Labor; incl. international statistics); www.bea.gov/ (Bureau of Economic Analysis); www.Census.gov/ (US Population & Economic Census data)

AN INTRODUCTION TO BUSINESS RESEARCH METHODS using seCondary data
112
UN: www.un.orgWorld-wide: OECD www.oecd.org; www.Lexis-Nexis.comThe US Census Bureau also contains a wealth of population and economic census data. The population census is performed every 10 years, and the Economic Census is conducted every 5 years.
www.census.gov (select “Population” or Economy” underneath “Topics”)
You can probably add sources to this list which you may have found in earlier studies. The list is growing all the time and the web enables us to find new data sources around increasingly specific topic areas.
8.4 THE DISADVANTAGES OF USING SECONDARY DATA IN BUSINESS RESEARCH
8.4.1 DIFFERENCE OF PURPOSE
Because the original researchers had a different purpose and constraints from your current project, there may be inconsistencies or elements of the research which are not compatible with your own. This could include currency, terminology, samples, market changes, boundary changes, new discoveries or technology since the research was carried out etc. Additionally, secondary data may not be in the form in which you would like to use it. As a result, secondary data may need to be transformed and “recoded” from its original format. For example, you may find specific secondary data on the “subjects” of your study; however, you need to know “annual income” but it may be found as “monthly income”, in which case you will need to multiply by 12 in order to use it in the form you require. Or in doing international business research, you may have company financial data reported in the currency of each country but will need to convert it into a common currency appropriate for the audience to which your research is directed.
8.4.2 AGGREGATION AND PRESENTATION OF DATA
Other researchers, working for other research purposes, will often aggregate data in a way which is not useful for your own research, for example showing regional rather than city data, or street rather than household data, or not disaggregating by gender. The presentation of data will depend on the purpose of the original research too – especially if the research is done for a media purpose, where headline stories sell media. There may be some apparent distortion in the data because of this.

AN INTRODUCTION TO BUSINESS RESEARCH METHODS using seCondary data
113
8.4.3 DATA QUALITY
From this book, you will be getting an idea of the attention to detail and careful planning and thought, which goes into good quality research. This is one thing which is difficult to check when using secondary data. Instead, the best we can usually do is to ensure the credibility and professionalism of the source institution, rather than the data. Be particularly careful when using secondary data from internet sources, where organizations are not known to you, as anyone can put up false data on the web without challenge. This also leads us to be particularly cautious about detailing and documenting our reference sources.
A further step in assessing data quality will be to critically evaluate the research methods used to collect the secondary data. It is often reasonable to contact the data source to establish their methods, if you are considering using their publicly available data. Government sources usually publish detailed technical background alongside the data to enable you to interpret the data appropriately.
8.4.4 MEASUREMENT VALIDITY
Think back to our discussions on epistemology – we cannot expect secondary data to be some kind of “truth”. The data will reflect the purposes, and pre-conceptions, of the original researchers. It would also be useful to think back here to your reading on the taxonomy of facts (Bannister, F. 2005).
8.4.5 DATA COVERAGE AND CLEANSING
Does the secondary data cover the exact population in which you are interested? Are there any unwanted exclusions or inclusions, which may affect the way you use this data? Because secondary data was not originally designed to be used by you, it often needs to be “cleansed” for secondary usage. Cleansing involves eliminating extraneous data which may have been included in the original data which is of no use to you, as well as performing the necessary “data transformations” needed to get the original data in the form which you need it to be in (as discussed earlier).
8.4.6 DATA USE
Unless you are simply going to quote from the secondary data as background information, you are likely to want to download or enter secondary data to run statistical analysis of some kind. Some data will be in a format ready for this. Some may not.

AN INTRODUCTION TO BUSINESS RESEARCH METHODS using seCondary data
114114
8.5 BIG DATA
This is a buzzword in the 21st century as massive increases in data collected from business transactions – indeed any transaction – over the web can be stored and analysed. This data might come from a wide array of sources such as financial transactions, accounts, customer behaviour, buying patterns, medical records, surveillance, as well as social media sources like Facebook and Twitter. This data does not come in simple formats, but in semi-structured or unstructured formats such as Web clickstreams, logs, machine data, location data and of course text. The sheer volume of such data makes it hard to see how to derive value, but this is what data analytics is all about: mining large and complex data sets to find information at a level which is helpful for better decision making in business.
However, don’t be put off. Fundamentally, big data is about applying statistical understanding to wide and messy data sets. It uses the same tools we have already discussed but generally employs software to spot patterns and trends, and produces output in user-friendly formats such as infographics and data visualisations. Business organisations such as eBay, Walmart, Amazon and Facebook make a virtue from the huge volumes of data their business generates, running systems which aim to identify trends (descriptive statistics) and relationships (correlational statistics) within the data for use by the businesses.
“The perfect start of a successful, international career.”
CLICK HERE to discover why both socially
and academically the University
of Groningen is one of the best
places for a student to be www.rug.nl/feb/education
Excellent Economics and Business programmes at:

AN INTRODUCTION TO BUSINESS RESEARCH METHODS using seCondary data
115
If you wish to access some of the outputs from such organisations, take care to find the assumptions on which data is collected and processed. For example, Twitter can make data available, but rarely will it actually allow anyone outside the business to see the core data (called FIREHOSE) on which its sample data is based. Linked data sets tend to be error prone and errors at this scale can be seriously prejudicial to the results. The other problem here is that data requires context to make it meaningful. Just crunching vast quantities of data together may be less than helpful without clearly tracking source contexts. You may wish to look at the UK big data research website, which is funded by the Economic and Social Research Council together with three UK universities and includes current debate on Big Data, including access to published research papers using data analytics and machine learning: http://www.blgdataresearch.org/
8.6 QUESTIONS FOR SELF REVIEW
1. Why bother with primary research when you can use secondary data?2. What are the potential problems of using national survey data?3. What is a meta-analysis? How does it differ from Big Data?4. Where would you be able to find a range of OECD survey data reports online?
8.7 REFERENCES
Bannister, F. 2005 “Through a glass darkly: fact and filtration in the interpretation of evidence”, The Electronic Journal of Business Research Methods, vol. 3, no. 1, pp. 11–24.
Lynn, P. 2003, “Developing quality standards for cross-national survey research: five approaches”, International Journal of Social Research Methodology, vol. 6, no. 4, pp. 323–336.
Saunders, M. Lewis, P. & Thornhill, A. 2016, Research methods for business students. 7th edn. Pearson Education Limited, Harlow, England.

AN INTRODUCTION TO BUSINESS RESEARCH METHODS
QUALITATIVE RESEARCH METHODS: COLLECTING AND ANALYSING QUALITATIVE DATA
116
9 QUALITATIVE RESEARCH METHODS: COLLECTING AND ANALYSING QUALITATIVE DATA
9.1 CHAPTER OVERVIEW
9.1.1 LEARNING OUTCOMES
By the end of this topic successful students will be able to:
1. Understand and deal with key issues in qualitative data analysis2. Identify a range of qualitative research methods applicable to different research topics3. Understand how qualitative data can be prepared for analysis4. Identify computer based methods for qualitative data analysis
9.2 KEY ISSUES IN QUALITATIVE DATA ANALYSIS
Clearly qualitative research is a different kettle of fish from a quantitative study – we explored the differences in earlier chapters. At first sight, it may seem that qualitative research is more difficult to pin down, less precise. In fact, qualitative methods are usually governed by clear rules and offer a way of exploring issues, which cannot easily be expressed by numbers. Qualitative and unstructured research often provides “rich” information which is difficult to otherwise uncover by purely quantitative methods.
An article by Rowlands (2005) offers a detailed justification of a qualitative approach to research on SMEs and training practice. This is a useful read to discover the steps taken in justifying a qualitative method. Qualitative methods are increasingly accepted in social science and business research as this branch of enquiry differentiates itself from a scientific positivist paradigm. Human organizations and human behaviour are difficult to hold still and isolate, since they change constantly and can offer different dimensions of themselves to different audiences. Think about the function of Public Relations and the different faces of an organization which may be shown to shareholders, customers, staff, suppliers for example. So it rarely makes sense to look only at numerical measured evidence when trying to understand what is going on in an organization or other group of people. This is not to rule out quantitative study – naturally there are financial data and other quantitative data

AN INTRODUCTION TO BUSINESS RESEARCH METHODS
117
QUALITATIVE RESEARCH METHODS: COLLECTING AND ANALYSING QUALITATIVE DATA
117
which can be established and monitored around business organizations and which will be of vital importance in their study and their day-to-day management. But there is also clearly a place for perception studies, looking at what people think or feel is going on at work, as this will also affect day-to-day and strategic long-term practice in organizations.
Some key differences between quantitative and qualitative method are shown below (Bryman & Bell, 2015) Some of these distinctions are arguable – for example “structured” vs “unstructured”, macro vs micro. Also, we should bear in mind that mixed quantitative and qualitative methods can usefully be used, where elements of both approaches can be used both to triangulate results and to develop richer pictures still of the phenomenon under investigation.
Quantitative Qualitative
Numbers Words
Point of view of researcher Points of view of participants
Researcher distant Researcher close
Theory testing Theory emergent
.

AN INTRODUCTION TO BUSINESS RESEARCH METHODS
QUALITATIVE RESEARCH METHODS: COLLECTING AND ANALYSING QUALITATIVE DATA
118
Quantitative Qualitative
Static Process
Structured Unstructured
Generalization Contextual understanding
Hard reliable data Rich deep data
Macro Micro
Behaviour Meaning
Artificial settings Natural settings
It is helpful to reflect on the influence of the researcher in qualitative research. As we have already discussed, there is a “researcher influence” to some extent in all research and analysis, however qualitative methods are more likely to suggest subjectivity. For this reason, it is essential to reflect on ways in which your qualitative data and analysis could be affected by your standpoint and contextual understanding, as well as your expectations of the research, and to make this explicit within your research report. It will also be necessary to be very clear and explicit about the method of research and analysis adopted, just as we must be in quantitative research.
9.3 THE RANGE OF QUALITATIVE RESEARCH METHODS APPLICABLE TO RESEARCH TOPICS
9.3.1 PRINCIPAL QUALITATIVE METHODS
Action research Appreciative Inquiry Case studyEthnographic research/Participant observation Focus groupsInterviews – structured, semi-structured, unstructured Life history researchParticipant diaries Structured observation

AN INTRODUCTION TO BUSINESS RESEARCH METHODS
QUALITATIVE RESEARCH METHODS: COLLECTING AND ANALYSING QUALITATIVE DATA
119
Some quick web searching will give you plenty of information on these different qualitative methods. Action research for example will involve the researcher as an active participant in the situation under study. As an actor in the organization in which they may be employed, an action researcher seeks to explore and understand the world of which they are a part, and action research can help all involved in that business situation to understand better what is happening through a time of radical change – for example business restructuring, redundancy etc. German Psychologist Kurt Lewin is known to be the “father of action research”. He noted that action research involved a 3-step process of planning, taking action, and then reflecting on the results, feeding back into its next cycle. It’s a cycle of continual mapping, feasibility, implementation and improvement. The outcomes of such research are classified as “actionable knowledge”, of real value to business organisations.
Case study research will involve more than one way of deriving data about the case or organization/ unit under study. This may include collecting and analysing documents, talking to people, survey data, participant observation, consumer research and any other data collection techniques which offer qualitative information about the case. A case study investigates a single subject at a more detailed level; that is the unit of analysis is just one subject, whether it is a person, an organization or institution. Think of a case study as one in which the “N” is just one (“N=1”). The intention of the case study is Gestalt in nature. A paper by Walsham (2006) discusses the nature of interpretative case studies and methods for carrying them out in information systems, business and other areas of social sciences. Another useful source reference is Yin: Case Study Research – Design and Methods which is now in its fifth edition (published by SAGE publications).
A more recent development in qualitative research methodologies is that of Appreciative Inquiry (Cooperrider, D.L. & Srivastva, S., 1987). As a problem-solving technique, Appreciative Inquiry (AI) focuses on what is ‘right” about a situation or condition rather than the traditional approach to look at what is wrong. The AI process involves a four step methodology: 1) Discover or focus in on what is working well in a system, 2) Dream or envision other process that would work well 3) Design by focusing in on one of the dreams that would work best in the situation and 4) Deploy or implement the proposed improvement.
Ethnographic research comes from the study of anthropology, where “tribes” are lived in and observed for purposes of research. This kind of research will raise ethical issues, especially about the impact of the research on the life and behaviour of the group studied. The presence of a researcher in any group is likely to affect how people behave to one another. In less deep and sustained involvement, participant observation may offer similar researcher impact on results.

AN INTRODUCTION TO BUSINESS RESEARCH METHODS
120
QUALITATIVE RESEARCH METHODS: COLLECTING AND ANALYSING QUALITATIVE DATA
120
Action research, case studies and ethnographic research tends to be more naturalistic in its process, in that there is no direct intervention or artificiality as found when quantitative, and even other forms of qualitative research such as focus groups, interviews etc. are conducted.
9.3.2 APPROACHES TO QUALITATIVE ANALYSIS
Analysis method Outline definitions
Analytic inductionSystematic analysis of text or other qualitative data to build categories and sub- categories within the data – attempting to construct a rich picture from data.
Cognitive mappingDetermining how individuals construct mental models, often using visual or spatial means (diagrams, pictures) to produce a map of relationships between concepts as understood by the subject.
Data display and analysis
Analyzing data by first reducing qualitative data to a simple set of ideas, then displaying those ideas in order to draw and check conclusions from the data.
www.mastersopenday.nl
Visit us and find out why we are the best!Master’s Open Day: 22 February 2014
Join the best atthe Maastricht UniversitySchool of Business andEconomics!
Top master’s programmes• 33rdplaceFinancialTimesworldwideranking:MScInternationalBusiness
• 1stplace:MScInternationalBusiness• 1stplace:MScFinancialEconomics• 2ndplace:MScManagementofLearning• 2ndplace:MScEconomics• 2ndplace:MScEconometricsandOperationsResearch• 2ndplace:MScGlobalSupplyChainManagementandChange
Sources: Keuzegids Master ranking 2013; Elsevier ‘Beste Studies’ ranking 2012; Financial Times Global Masters in Management ranking 2012
MaastrichtUniversity is
the best specialistuniversity in the
Netherlands(Elsevier)

AN INTRODUCTION TO BUSINESS RESEARCH METHODS
QUALITATIVE RESEARCH METHODS: COLLECTING AND ANALYSING QUALITATIVE DATA
121
Analysis method Outline definitions
Discourse analysisAnalysing language used by subjects to determine how the world of a subject is constructed through the use of language.
Feminist researchSeeing reality through the perspective of gender. Feminist research tries to revise how organisations are understood, challenging male-oriented values and paradigms.
Grounded theory
Inductive approach to building theory from data, usually from interviews and observations. Various versions exist, but the principal method is to code phenomena within the data (e.g. an interview transcript) and to repeatedly revisit the data in order to refine and “saturate” the categories derived, before meaningful theory can be built.
Historiography
Involves the study of historical method, for example when revisiting an event, this would mean analyzing the epistemological position taken when versions of the event are written and challenging the authenticity of such positions.
Narrative analysisCollecting and analyzing qualitative data without fragmenting it – this method preserves the narrative/story of the data to maintain a sense of time, place and sequence in the data.
Phenomenography
Seeks to describe the way different people view a phenomenon, usually based on interview data taking an interpretivist approach The aim is to develop an intense picture of the phenomenon by defining the outcome space (different people’s views of the same thing) and investigating relationships within that space.
Phenomenology
Approaches social phenomena from the perspective that they are socially constructed. Concerned with discerning meaning within the phenomenon and trying to put aside researcher’s prior understanding of the phenomenon.
Template analysisCreating a hierarchy of categories from the data and using this as a template to explore qualitative data examples
These approaches may overlap in some cases: for example grounded theory is a very detailed iterative method of, usually, interview transcript analysis and thus involves some similar activities to phenomenography, where such transcripts may also be interrogated by the researcher in a very detailed and iterative way. The aim in both cases is to dig into the text to look for categories or themes in the data which may be built into rich ideas or theories. Both are examples of inductive research i.e. theory building rather than theory testing.
While these different methods of qualitative analysis are very distinct – any research methods textbook or website will give full descriptions – they all involve a rigorous attempt to look
AN INTRODUCTION TO BUSINESS RESEARCH METHODS
QUALITATIVE RESEARCH METHODS: COLLECTING AND ANALYSING QUALITATIVE DATA
122
at qualitative data (descriptions, discussions, activities, ideas presented verbally, audio-visually or in text) which offer a range of research interpretations. It may be the case that different researchers using the same analysis method on the same data could find different ideas and theories. They will be interpretations and these will be subject to debate and challenge. Qualitative analysis must therefore be as rigorous and transparent in method as possible, to allow readers of such research to understand how conclusions and findings are achieved. They may not be exactly reproducible, as would be expected in experimental science, but that does not invalidate such results. The outcomes of qualitative research, like those of quantitative research, may be disputed; which is why it is vital to detail the methods used for collecting and analysing the data, and to explain as clearly as possible the researcher’s own paradigm or philosophy about research, so that readers may understand where the ideas come from and how they may be filtered by the researcher.
9.3.3 WHAT ARE THE KEY OPERATIONS REQUIRED
IN QUALITATIVE DATA ANALYSIS?
• Where data is derived from interviews – individual or group, structured or semi-structured or unstructured – there will be a need to transcribe the recording of that interview before analysis. This brings its own problems of time, cost, method and detail.
• Development of themes, categories or ideas (from the literature (which may then be used to offer a hypothesis for testing in the data-deductive approach) or from the data itself (inductive approach). This is often referred to as thematic analysis.
• Unitising, coding or finding units of meaning within the data, which relate to or add to or amend the categories.
• Constant comparative method leading to saturation of categories – this terminology comes from grounded theory but the activity is not confined to this approach; a constant iterative process of checking how the data meanings fit the categories or themes.
• Understanding the variation and role of language as an intermediary in the communication of ideas.
• In many cases, the production of researcher summaries, log books, contextual notes to help provide further explanatory detail to transcripts or observations.

AN INTRODUCTION TO BUSINESS RESEARCH METHODS
123
QUALITATIVE RESEARCH METHODS: COLLECTING AND ANALYSING QUALITATIVE DATA
123
9.4 HOW QUALITATIVE DATA CAN BE PREPARED FOR ANALYSIS
In most cases, this will involve some kind of transcription. Although simply taking notes of observations, and in some cases in interviews, may be sufficient, a transcript is important for conversations in which the researcher wishes to play some part, so that they are not required to both write notes and conduct an interview or group discussion. However, recent advances in computer software provide programs which automatically transcribe voice to text with considerable accuracy. This has eliminated many of the administrative inefficiencies in conducting interviews and focus groups. (You will need to be sure to observe legal and ethical implications and obtain permission and/or authorized consent when recording and transcribing input from your subjects). Nuance’s Dragon 13 is one such program benefitting from its 13 editions of revisions and improvements. There are other similar free programs available online and for download.
This will mean gaining agreement for recording, finding a suitable instrument for recording and transcription and undertaking the transcription itself. Suitable recording equipment will not be too intimidating for the interviewee(s), will be reliable (!), will have a reliable power supply, will have a microphone which can pick up every speaker clearly including the researcher, and will produce adequate sound quality for transcription. Remember that interviewees may begin by speaking clearly and loudly as they are aware of the recording,

AN INTRODUCTION TO BUSINESS RESEARCH METHODS
QUALITATIVE RESEARCH METHODS: COLLECTING AND ANALYSING QUALITATIVE DATA
124
but voice tone and pitch may soften later, so set the recording level high. Always test the recorder at the start of an interview.
Increasingly, mobile phones and digital voice recorders are being used for this purpose as they are easily available and can record longer sessions than many audio tapes. You may wish to use both a conventional audio tape recorder and a digital recorder to make quite sure a useful recording is made. Digital recordings are useful as interviews can be played back to the researcher through MP3 players, phones or computers, removing the need for sitting by a tape player. Do not be tempted to voice record without gaining full agreement from the interviewees, clearly this data cannot be used ethically if collected without consent. Beware voice-activated equipment (which switches off when there is nothing being said) as this can lose definition owing to the transition from off to on when a voice is heard.
It can be possible to pay someone to transcribe interview data for you, which can be helpful if there is a great deal of interview data. However, this does deny the researcher the opportunity of getting to know the interview in great detail during transcription; sometimes it is preferable to do this personally – or it may be the only alternative available.
When transcribing, maintain a context sheet to record non-verbal interventions or interruptions, as this data may affect how the transcript is understood. Transcripts should ideally be double-spaced to allow for coding and other notes to be made on the document. Decide rules for referring to individuals in the interview (actual names are not usually typed up for reasons of confidentiality). You will also need to decide how to type up repetitions of words and phrases, as this is common in speech patterns but usually adds little to the data. Bear in mind that a good typist can take 4–8 hours to type up one hour of interview, this is a very time-consuming process.
Respondent validation: it may be helpful to send transcripts for checking by the interviewees. This helps to build credibility in the transcripts, but is not always acceptable to the interviewee. At minimum, you the researcher must check every transcript against the recording, as it is easy to make mistakes in transcription (sometimes a mind-numbing process) yet such errors may lead to considerable effects on analysis.
9.5 COMPUTER BASED METHODS FOR QUALITATIVE DATA ANALYSIS
Computer aided qualitative data analysis software (CAQDAS) is increasingly available, though like voice recognition software, this will not necessarily reduce analysis time by a great deal and will not be that straightforward. It is particularly helpful when there is a very large amount of data for analysis.

AN INTRODUCTION TO BUSINESS RESEARCH METHODS
QUALITATIVE RESEARCH METHODS: COLLECTING AND ANALYSING QUALITATIVE DATA
125
For example, QSR International produces a software program NVIVO, which allows researchers to use the computer to organize and analyze the findings from purely qualitative and mixed methods research. NVIVO helps researchers to input results from unstructured interviews, and open-ended survey responses, focus groups, social media and other web content.
CAQDAS can produce quantitative data from qualitative methods, for example by producing frequency data on particular events, words etc. However, its main use is the qualitative analysis of such data as interview transcripts or narratives. They do this by organising the data, providing instant access to all data once entered, searching and retrieving particular words or phrases. As with other CAQDAS programs, NVIVO classifies, sorts and arranges prose, and provides output which can be integrated into other software platforms such as MSWord, Excel, or IBM SPSS Predictive Analytics. The program allows the researcher to analyze large amounts of prose-based information and identify trends and themes which are extracted. NVIVO helps those doing qualitative research by organizing and analyzing prose information for the researcher to gain insight on, interpret, construct conclusions, and take action.
If NVIVO is not available as a package on your computer, then visit the website of its supplier www.qsrinternational.com and download a demonstration of the software to investigate what it will do and how it feels. You can also opt for a 14 day free trial to try it out yourself.
9.6 QUESTIONS FOR SELF REVIEW
1. What are the key differences between qualitative and quantitative research methods?2. What are the main activities involved in qualitative analysis?3. What is action research – can you provide an example of how this might be used
in business research?4. What is the case for and against someone else transcribing your interview data?5. To what extent is NVIVO likely to produce different results from your qualitative
data than analysing manually?
9.7 REFERENCES
Bryman, A. & Bell, E. 2015, Business research methods, 4th edn. Oxford University Press, Oxford UK.

AN INTRODUCTION TO BUSINESS RESEARCH METHODS
126
QUALITATIVE RESEARCH METHODS: COLLECTING AND ANALYSING QUALITATIVE DATA
126
Cooperrider, D.L. & Srivastva, S. 1987 “Appreciative inquiry in organizational life”. In Woodman, R.W. & Pasmore, W.A. (eds), Research in Organizational Change and Development, Vol. 1, pp. 129–169. JAI Press, Stamford, CT.
Rowlands, B. 2005, “Grounded in practice: using interpretive research to build theory”, The Electronic Journal of Business Research Methodology, vol. 3, no. 1, pp. 81–92.
Saunders, M. Lewis, P. & Thornhill, A 2016, Research methods for business students. 7th edn. Pearson Education Limited, Harlow, England.
Walsham, G. 2006, “Doing Interpretative Research”, European Journal of Information Systems, vol. 15, no. 3. pp. 320–330. (available online)
Yin, R.K. 2014, Case study research: design and methods. 5th edn. Sage Publications, Thousand Oaks CA
Get Help Now
Go to www.helpmyassignment.co.uk for more info
Need help with yourdissertation?Get in-depth feedback & advice from experts in your topic area. Find out what you can do to improvethe quality of your dissertation!

AN INTRODUCTION TO BUSINESS RESEARCH METHODS
PRACTICAL ISSUES IN CONDUCTING INTERVIEWS, FOCUS GROUPS, PARTICIPANT OBSERVATION
127
10 PRACTICAL ISSUES IN CONDUCTING INTERVIEWS, FOCUS GROUPS, PARTICIPANT OBSERVATION
10.1 CHAPTER OVERVIEW
10.1.1 LEARNING OUTCOMES
By the end of this topic successful students will be able to:
1. Distinguish practical considerations relating to participant observation2. Anticipate and handle practical issues relating to interviews3. Distinguish and prepare for practical issues relating to focus groups4. Conduct interviews and focus groups to collect qualitative data
10.2 PRACTICAL CONSIDERATIONS RELATING TO PARTICIPANT OBSERVATION
10.2.1 ETHNOGRAPHY OR PARTICIPANT OBSERVATION?
Both ethnography and participant observation involve submersion of the researcher into the context under study. As mentioned in the previous chapter, ethnographic research has a more social anthropological feel and may focus more on business “tribes” and organizational settings such as departments and functions, or different national sites of operation. The focus will be on the community described and its symbols, culture, interactions, rituals, language etc. Participant observation will be used to allow the researcher direct experience of a specific situation or event, perhaps working in a factory or office setting during a transition period. However, in some texts, the two terms will be used interchangeably, so when discussing practical issues, we can classify them broadly together.

AN INTRODUCTION TO BUSINESS RESEARCH METHODS
PRACTICAL ISSUES IN CONDUCTING INTERVIEWS, FOCUS GROUPS, PARTICIPANT OBSERVATION
128
10.2.2 ACCESS
Both approaches involve intense involvement of the researcher in the field, in order to feel like an “insider” and try to understand and explain what that feels like. This is usually difficult to do in the short term, so a time commitment to the research will be the first hurdle. In some cases, where a researcher is also employed in the organization being studied, this should not prove too problematic (but does raise other issues of covert research to be covered next). Where the researcher has no other role in the organization being studied, there will probably be protracted negotiations to allow this kind of long-term access.
Think about how you might gain access to an organization for this kind of study? Letters? Emails? Contacts? How do you convince them of your credibility and trustworthiness?
10.2.3 COVERT OR OVERT RESEARCH?
If research is undertaken covertly, without authority, then problems of access and of reactivity disappear. However, a number of others appear instead. For example, the sheer practical difficulty of taking detailed research notes when you are meant to be working on the job! Also being unable to use other research methods during this period such as interviews. There is anxiety about possible discovery of the researcher role and activities, anxiety which is well-founded, since if the covert research is discovered, there is a strong chance the study will have to be abandoned before completion.
Most of all, however there is a problem of ethics, since participants in the research will not have the opportunity for informed consent and their privacy is violated. This can damage the research and researcher if it is discovered, but can also damage the reputation of research in general amongst those whose trust was betrayed.
Is there a happy medium? For example, is it possible to have senior management authority but not to divulge your intentions to colleagues? What kind of difficulties might this cause? Or could the broad purpose of “research” be discussed openly, but the specific focus and question be kept secret?
Whichever conclusion you reach, your research report will have to show clear details of the overt or covert nature of your research, and there would need to be very good reasons for a covert approach.
Think about a scenario in which you would be tempted to try covert participant observation. For example, suppose your place of work was threatened by relocation to a new venue and you wanted to study the effects of this move on the team’s performance. As part of the team,
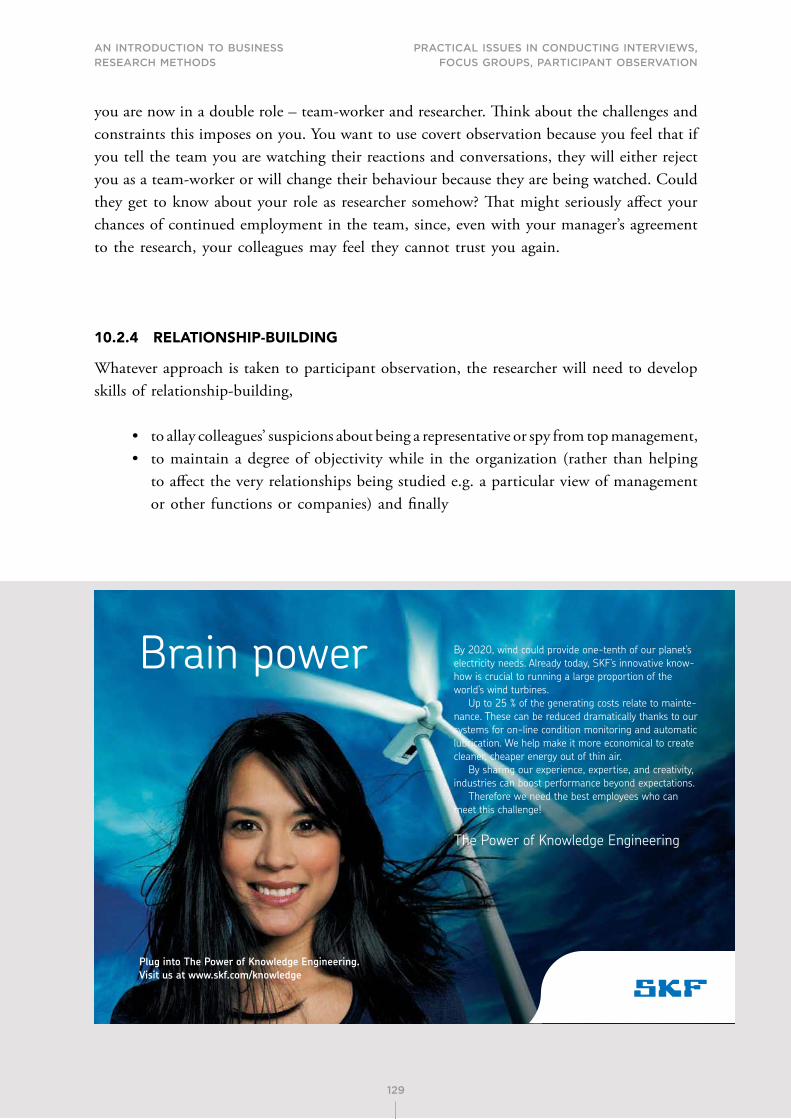
AN INTRODUCTION TO BUSINESS RESEARCH METHODS
129
PRACTICAL ISSUES IN CONDUCTING INTERVIEWS, FOCUS GROUPS, PARTICIPANT OBSERVATION
129
you are now in a double role – team-worker and researcher. Think about the challenges and constraints this imposes on you. You want to use covert observation because you feel that if you tell the team you are watching their reactions and conversations, they will either reject you as a team-worker or will change their behaviour because they are being watched. Could they get to know about your role as researcher somehow? That might seriously affect your chances of continued employment in the team, since, even with your manager’s agreement to the research, your colleagues may feel they cannot trust you again.
10.2.4 RELATIONSHIP-BUILDING
Whatever approach is taken to participant observation, the researcher will need to develop skills of relationship-building,
• to allay colleagues’ suspicions about being a representative or spy from top management,• to maintain a degree of objectivity while in the organization (rather than helping
to affect the very relationships being studied e.g. a particular view of management or other functions or companies) and finally
By 2020, wind could provide one-tenth of our planet’s electricity needs. Already today, SKF’s innovative know-how is crucial to running a large proportion of the world’s wind turbines.
Up to 25 % of the generating costs relate to mainte-nance. These can be reduced dramatically thanks to our systems for on-line condition monitoring and automatic lubrication. We help make it more economical to create cleaner, cheaper energy out of thin air.
By sharing our experience, expertise, and creativity, industries can boost performance beyond expectations.
Therefore we need the best employees who can meet this challenge!
The Power of Knowledge Engineering
Brain power
Plug into The Power of Knowledge Engineering.
Visit us at www.skf.com/knowledge

AN INTRODUCTION TO BUSINESS RESEARCH METHODS
PRACTICAL ISSUES IN CONDUCTING INTERVIEWS, FOCUS GROUPS, PARTICIPANT OBSERVATION
130
• to develop key informants who can be used to provide broad organizational background and check out stories you are told, or help you to find appropriate people to get to know.
For example, a recent student conducted a study on flexible working in her own organization. As a representative of HR, her role actually precluded the hearing of much gossip and informal talk, as HR could be seen as “the enemy” in relation to contracts negotiation. However, her gender, together with strong interpersonal skills, enabled her to get to know about unofficial flexible working through informal networks built on trust over time. This research ultimately exposed serious double standards in the way flexible working was represented by some managers in the company.
10.2.5 ROLES FOR PARTICIPANT OBSERVERS
Bryman and Bell (2015) discuss research by Gold in 1958 setting out four roles for participant observers: complete participant (covert observer), participant-as-observer (complete participant but overt researcher as well), observer-as-participant (primary role is researcher but can participate in work) and complete observer (no participation in work and little communication with those observed). Further views of the different possible roles are offered by Gans and Bryman & Bell. The sense of exchange is usually helpful, since research data can be gained in exchange for consultancy advice, survey work or straight labour. Perhaps the biggest temptation is to “go native” i.e. to become fully absorbed into the perspective of the participant role, and thus to lose the objectivity of the researcher role.
If you are interested in ethnography or life history research, you may wish to consult an article on these methods by Gordon and Lahelma (2003).
10.3 PRACTICAL ISSUES RELATING TO INTERVIEWS
10.3.1 STRUCTURED, SEMI-STRUCTURED, UNSTRUCTURED
If an interview is fully structured in format, does this mean it is quantitative research? To some extent yes, in that clear questions are asked in a consistent way, similar to the administration of a questionnaire by telephone. However, the mere fact that the interviewer and interviewee are face-to-face brings another dimension to the research method. When we can see our interviewees, we introduce the concept of non-verbal communication – not just from them (which helps us understand more about them) but also from us – which

AN INTRODUCTION TO BUSINESS RESEARCH METHODS
PRACTICAL ISSUES IN CONDUCTING INTERVIEWS, FOCUS GROUPS, PARTICIPANT OBSERVATION
131
can steer or emphasise certain areas, mislead or explain further items which would otherwise be misunderstood or left blank and so on.
Semi-structured interviews will be based on a question guide, the contents of which will always be asked of respondents. However, since this is not fully structured, the interviewee is allowed to go where they want with the questions and to divert to other things which interest them. Since the focus of a qualitative interview is the interviewee, not the interviewer, this is fine.
Unstructured or in-depth interviews can go right off the point – and that may be the point, i.e. to discover much more about the interviewee by what they say and think, than how they answer specific questions. These are conversations with a purpose, wide-ranging and thus likely to deliver rich but inconsistent data.
The interviewer’s role is to manage the process (e.g. the time if a particular duration has been promised, the key questions are asked and the conversation stays broadly around the research question). The interviewee can be subject to very few constraints.
Many of the issues we raised around the design of questionnaires in an earlier session apply here to questions used in interviews (for example no leading questions or double questions). Where some are prepared in advance, it is advisable to give a copy to the interviewee in advance if possible, so that rather than “whatever comes into their head at the time”, the interviewer will have the benefit of a reflective response. Some structured questions in an interview can help to provide consistency where multiple cases are studied or where more than one interviewer is used.
10.3.2 THE ISSUE OF TIME
When setting up an interview, time booked will take on great importance to the organization and the individual, who will be trying to fit this interview in around other duties of the day. However, it is normally the case that, once the interview has started, the interviewer will find difficulty in stopping the interview, as the interviewee enjoys the experience and begins to use it for personal reflection or simply the enjoyment of discussing a work issue with an adult in a way they cannot do with colleagues.
From the perspective of planning, especially if carrying out several interviews in one visit, the interview period should be realistic but not too long, whereas a considerable margin of time should be allowed between interviews in case of expected over-run.

AN INTRODUCTION TO BUSINESS RESEARCH METHODS
132
PRACTICAL ISSUES IN CONDUCTING INTERVIEWS, FOCUS GROUPS, PARTICIPANT OBSERVATION
132
As with any work interview, including a selection interview, it is vital that the visitor to the organization (the researcher) turns up on time and in time to begin at the agreed start time, after getting to the right place and setting up and testing the recording equipment. So arriving at least 10 minutes early is usually helpful.
10.3.3 THE INTERVIEW GUIDE
Preparing key questions in advance is very important if you aim to both achieve your research outcomes and be consistent and professional in your approach to interviewing. However, being over-dependent on the pre-prepared interview questions can be dangerous. A professional interviewer is genuinely interested in the interviewee’s perspective and so will flex the questions to follow new directions suggested by the interviewee. Flexibility will make each interview more enjoyable to conduct, rather than feeling slavishly controlled by the pre-set guide. Finally, there is a common tendency for an interviewee to anticipate later questions, often without any prompts from the interviewer. It will be important to allow them to go there, rather than saying “I wonder if we could leave that point as it comes up later.” Inevitably this will cause the interviewee and interviewer to forget what was just said, so you probably won’t get it later.
AN INTRODUCTION TO BUSINESS RESEARCH METHODS
PRACTICAL ISSUES IN CONDUCTING INTERVIEWS, FOCUS GROUPS, PARTICIPANT OBSERVATION
133
However, if later questions are covered early on, don’t worry about running out of questions. Confident interviewers, by demonstrating empathy and genuine regard for the interviewee, can always facilitate further discussion by simple prompts such as “can you tell me more about…?” “that’s an interesting point, I hadn’t thought of that, so what exactly do you mean by…”, “I’m not sure I have fully understood, can you explain that a little further…or give me an example?”. (Such questions assume you have not run out of time, and the initial questions are all answered.)
10.3.4 INTERVIEW BEHAVIOUR
Research cited in Bryman and Bell (2015) by Kvale suggests that an interviewer should be:
• Knowledgeable• Structuring• Clear• Gentle• Sensitive• Open• Steering• Critical• Remembering• Interpreting
They also add the adjectives: balanced and ethically sensitive to the list. To this list, we can add interview competencies suggested by Saunders, Lewis and Thornhill (2015):
• Opening the interview• Using appropriate language• Questioning• Listening• Testing and summarising for understanding• Recognising and dealing with difficult participants• Recording responses• Closing the interview

AN INTRODUCTION TO BUSINESS RESEARCH METHODS
PRACTICAL ISSUES IN CONDUCTING INTERVIEWS, FOCUS GROUPS, PARTICIPANT OBSERVATION
134
10.3.5 AFTER THE INTERVIEW
Urgent action is needed to make notes about what happened. These are contextual notes, which will later shed much light on the event. You might note down personal impressions of how it went, where it happened, specific comments on the outcomes, the setting in which it took place, the state of mind of the interviewee from your current perspective etc. It will also be necessary to arrange to transcribe the interview from the recording as quickly as possible. Within a day or so, it is easy to remember what an interviewee was trying to express, even if the recording is not good. Later on, this will become very difficult.
You may wish to search for an article on interviewing (Carter 2004) which offers some useful ideas about the practical challenges of the interview process.
10.4 PRACTICAL ISSUES RELATING TO FOCUS GROUPS
A focus group method is a focused group interview. There will be several participants, the researcher as facilitator and a method of recording what is said, preferably video recording, as audio can be difficult to follow when several people are speaking. Video recording will also give much richer contextual evidence about how people interact. However, resistance to video recording is much greater than audio recording.
Another key difference with a focus group is that there is usually a specific topic on which discussion is to be held, rather than a whole series of topics. The point of interviewing in this way is to explore the joint construction of meaning around a specific topic and to see how group dynamics and interaction work in this process.
Focus groups are not easy to run, although they get easier with practice. Focus groups can be creative places, but can also be full of challenge and conflict – this needs a light touch of management from the researcher, only to ensure good standards of communication and respect are encouraged, not to stop conflict since this can be a productive source of creativity and meaning development. Issues can surface in a much freer way in a focus group than in an individual interview, and can be considered a more naturalistic context for testing and developing ideas.
In order to decide how many focus groups to hold and who should attend, some of the sampling issues discussed earlier should be discussed, such as stratified or snowball sampling. For example, are there variables, which must be represented in focus group membership (e.g. different departments, levels of work, length of experience etc.) – this may increase the number of groups held. Broadly however, focus groups can continue to be held until the

AN INTRODUCTION TO BUSINESS RESEARCH METHODS
135
PRACTICAL ISSUES IN CONDUCTING INTERVIEWS, FOCUS GROUPS, PARTICIPANT OBSERVATION
135
ideas and themes raised become familiar and can be anticipated by the researcher (saturation of categories). To some extent, feasibility and cost/time issues will also dictate number of groups held.
Each individual focus group should consist of participants of a rather homogenous grouping. Then, collectively, all focus groups pertaining to a common theme can be integrated to identify differences and similarities among the groups. For example, an organization may wish to determine the “organizational climate” among its employees. Several individual focus groups would be necessary. One may consist of “rank and file”/hourly employees, one group would consist of supervisors, one of middle management, and one of upper level executives. Mixing employees of different ranks in a single focus group is possible but can inhibit or contaminate the information collected. Similarly, a marketing department may wish to conduct a series of focus groups on customer preferences. Stratifying their customers against key demographics and creating focus group sessions for each of these demographics would be necessary. Homogeneity among individuals in any one focus group is particularly helpful.
EXPERIENCE THE POWER OF FULL ENGAGEMENT…
RUN FASTER. RUN LONGER.. RUN EASIER…
READ MORE & PRE-ORDER TODAY WWW.GAITEYE.COM
Challenge the way we run
1349906_A6_4+0.indd 1 22-08-2014 12:56:57

AN INTRODUCTION TO BUSINESS RESEARCH METHODS
PRACTICAL ISSUES IN CONDUCTING INTERVIEWS, FOCUS GROUPS, PARTICIPANT OBSERVATION
136
Size of groups will depend on practical factors, including size of available rooms, but ideally six to eight will be the easiest number to manage. While attendance may be easy to control within an organization, inter-organizational studies will prove harder to schedule, with no-shows a common feature if people have to travel to attend the focus group.
The facilitator role varies greatly in focus groups, partly depending on the understanding of the process by participants. Too much control from the facilitator will make it difficult for a free-flowing discussion to construct meaning and reveal new insights. Too little control from the facilitator may lead to lack of time discipline and the ignoring of some of the key issues. Some greater control is usually helpful at the outset, in setting ground rules for the session and explaining that the facilitator does have the right to intervene for time or agenda reasons, or perhaps to request an explanation. Once this is set up, the group can be encouraged to warm up on its own, and will soon get going, provided they trust the researcher. Where steering is needed, the facilitator can then intervene as needed.
Analysis of the focus group is done once the focus group is completed and the recordings are transcribed, and evaluated. Hyden and Bulow (2003) have produced a useful account of focus group methodology which may help you to review this approach.
10.5 QUESTIONS FOR SELF REVIEW
1. What are the (small) differences between participant observation and ethnography?2. How could you adapt a semi-structured interview process to be conducted by email?3. What do you think would be your biggest challenge in conducting research
interviews? What could you do about this?4. Why do you think focus groups are so widely used to test new products and new
policy ideas?
10.6 REFERENCES
Bryman, A. & Bell, E. 2015, Business Research Methods 4th edn. Oxford, Oxford University Press.
Carter, J. 2004, “Research note: reflections on interviewing across the ethnic divide”. International Journal of Social Research Methodology, vol. 7, no. 4 pp. 345–353.

AN INTRODUCTION TO BUSINESS RESEARCH METHODS
137
PRACTICAL ISSUES IN CONDUCTING INTERVIEWS, FOCUS GROUPS, PARTICIPANT OBSERVATION
137
Gordon, T. & Lahelma, E. 2003, “From ethnography to life history: tracing transitions of school students”. International Journal of Social Research Methodology, vol. 6, no. 3, pp. 245–254.
Hyden, L.C. & Bulow, P.H. 2003, “Who’s talking: drawing conclusions from focus groups – some methodological considerations”, International Journal of Social Research Methodology, vol. 6, no. 4, pp. 305–321.
Saunders, M. Lewis, P. & Thornhill, A. 2016, Research methods for business students. 7th edn. Pearson Education Limited, Harlow, England.
PDF components for PHP developers
www.setasign.com
SETASIGNThis e-book is made with SetaPDF

AN INTRODUCTION TO BUSINESS RESEARCH METHODS foreCasting trends
138
11 FORECASTING TRENDS
11.1 CHAPTER OVERVIEW
11.1.1 LEARNING OUTCOMES
By the end of this topic successful students will be able to:
1. Understand why forecasting is not widely covered in the business research methods literature
2. Identify existing methodologies for forecasting3. Understand a range of qualitative and quantitative forecasting tools4. Understand various measures commonly used to evaluate forecasts5. Understand the value of forecasting methods in business practice
11.2 WHY FORECASTING IS NOT WIDELY COVERED IN THE BUSINESS RESEARCH METHODS LITERATURE
Surprisingly few research methods textbooks contain sections on forecasting trends. Why surprising? Because, in business, this is a key activity. We can see that the main business of a researcher is to look backwards and try to see what was happening in a particular situation involving particular variables and people. If research is rigorous, then it may be possible to apply lessons from the past to a current situation. But it is not seen as the job of an academic researcher to try to predict the future. Attempts to do this are found only in concluding paragraphs of research articles, and they will often be suggesting more research in what appear to be developing trends. The Makridakis et al book mentioned in the reference list remains one of the seminal works on forecasting.
This is not coy. It is simply because predicting and forecasting trends is a very risky business, and rigorous research aims to avoid very high risk strategies. Yet people do, of course, predict trends. Management gurus and writers frequently aim to identify what is about to happen in business. If we see them as credible people, we may be persuaded by their predictions. But reality often proves them wrong. Some predictions in business will be about the next wonder product. New Product Development is always highly risky but is engaged in order to develop profit streams, deal with product life cycles and develop businesses. The risk is clear if we think about the current split between companies developing two different technologies for enhanced DVD performance. In early 2007, the market was impossible to call – would

AN INTRODUCTION TO BUSINESS RESEARCH METHODS foreCasting trends
139
we be buying High Performance or Blu Ray? Some companies are producing equipment compatible with both systems to avoid what happened when the last major split in this market caused the death of Betamax video systems in favour of VHS. Now in 2014 these physical video playback media are being replaced with internet-delivered video through a variety of sources. Could this all have been predicted? If so, how? Read on.
Surely we can do better when forecasting something we know about – such as next year’s company sales figures? The evidence shows us that in fact we are poor at predicting even figures with which we are intimately involved and which directly affect our company’s future. To start with, we confuse personal views and impacts with professional forecasts. If we ask a sales person to predict the level of her/his sales next year, that prediction will be partly based on market knowledge, partly on protecting their own position in the company, partly on an estimate of the outcomes of getting it wrong. People, unlike machines, are complex and unpredictable. For example, if sales people predict a high increase in sales, targets are likely to be set high, making it hard for them to achieve targets. On the other hand if they set them to show any kind of downturn, the sales people themselves will probably get the blame. So predictions tend to be cautious when personal targets and responsibility could be at stake. Equally if we have a new business idea and want to borrow money from the bank, it is likely that we will over-estimate potential sales, and the time at which our cash flow will turn positive.
Even when we are simply trying to predict sales forecasts, there will be many different people and departments of a business involved in this prediction. Information from inside and outside the company is relevant, and the quality of both may vary. Since many people are involved and different variables studied, any errors or inconsistencies or communication failures will make this a very imprecise activity indeed.
To quote a larger example cited by Makridakis et al (p. 491), look at the Eurotunnel project involving major engineering work between UK and France to build a rail link under the sea. In 1986, passenger estimates were 16.5 million for the first year of operation. In 1993 this forecast was reduced to 13 million. In 1994 it was reduced to 6 million. The first full year (1995) produced 3 million passengers. The actual cost of building was also more than twice the initial estimate and the intended data of opening was missed by almost two years. Such big projects as this, and, for example, bids to host the Olympic games, are frequently subject to major revisions as more actual data becomes available.
Just because the idea or technology is possible, it isn’t necessarily feasible or implementable; and just because it is feasible, doesn’t mean people will want to do it. Can you think of examples of possible technologies, which either are or are not feasible technologies, which are not wanted?
AN INTRODUCTION TO BUSINESS RESEARCH METHODS foreCasting trends
140140
Forecasting is nonetheless an important business activity underpinning the accurate determination and acquisition of resources (human, capital, buildings, money, energy, materials etc.) and the scheduling of their use.
Clearly this chapter is more focused on research in business, than on academic research about and for business. But as we discuss the issues in forecasting, the debates we have been having will begin to recur; for example, the extent to which the researcher’s assumptions affect the outcomes of that research, the opportunities and risks associated with quantitative data and its analysis, and an attempt to understand how qualitative research can contribute to this field. All these ideas apply to forecasting trends.
11.3 EXISTING METHODOLOGIES FOR FORECASTING
Forecasting methodologies can be divided into:
1. quantitative techniques, which generally use historical time series data as the basis for projection, and regression analysis to determine the relative importance and relationships of variables,
www.sylvania.com
We do not reinvent the wheel we reinvent light.Fascinating lighting offers an infinite spectrum of possibilities: Innovative technologies and new markets provide both opportunities and challenges. An environment in which your expertise is in high demand. Enjoy the supportive working atmosphere within our global group and benefit from international career paths. Implement sustainable ideas in close cooperation with other specialists and contribute to influencing our future. Come and join us in reinventing light every day.
Light is OSRAM

AN INTRODUCTION TO BUSINESS RESEARCH METHODS foreCasting trends
141
2. qualitative techniques, using scenarios which are known to explore the unknown, and3. creative techniques, which aim to suggest possible alternatives where there is no
factual basis of information.
11.3.1 QUANTITATIVE TECHNIQUES
These assume some historical, numerical data is available and that the patterns found in the data may continue (assumption of continuity).
Managers frequently use numerical data in an intuitive way, using their judgement and experience (or the toss of a coin!) to predict how trends will move. This is so widespread as to be a norm in much business practice – why is this, when formal quantitative techniques using statistics both exist and can tell us more about the possible trends? It seems that we are seduced by numbers and react emotionally to them – usually seeing them as important because they are numbers, not from any intrinsic importance. (This explains why spurious research studies can get great media coverage by producing shocking statistics – you may wish to look at the book Bad Science by Dr. Ben Goldacre for some interesting examples).
Time series forecasting
This is about finding patterns in historical data and extrapolating them into the future. This approach does not attempt to understand why the data behave as they do, because the data is seen as too complex to understand or difficult to break down and use, or because we don’t need to know what affects the data pattern, only the outcome of the data values. Such techniques are used to plan and schedule outcomes in business. The assumption of time series forecasting is that past behaviour/performance of a system will predict future behaviour/performance of the same system. In times of significant change, this assumption is rarely true.
Explanatory models
Here we do look at why the data behave as they do, and attempt to identify the key variables affecting the data values. It is unlikely that the variables we investigate will account for all the change in the data value, so an element of error is introduced to represent what we cannot explain. Such models are used for policy formulation. Identifying the key variables is a challenge in explanatory forecasting models.

AN INTRODUCTION TO BUSINESS RESEARCH METHODS foreCasting trends
142
11.3.2 QUALITATIVE TECHNIQUES
These may be used alone or in conjunction with quantitative techniques and involve the contribution of experts. Such experts may be professional forecasters and planners, or consultants with a deep knowledge of an industrial sector, or facilitators who know how to harness the knowledge of in-company talent to produce forecasts for the medium and long term. Qualitative approaches may be used for strategy formulation and product development. A Dephi study is one such qualitative technique utilizing the judgement of a panel of experts and synthesized into a final report and prediction by the panel facilitator.
11.3.3 CREATIVE TECHNIQUES
These are used broadly when neither of the other sets of techniques can help because there is a lack of historical data. For example, how do we extrapolate trends for new technologies, which have only just arrived? How do we predict macro level changes such as climate change, when vast computing power is needed for the number of potential variables, and much of what is known is estimation not proven knowledge?
The answer is to use the power of the human brain to make connections between the forecasting problem and other knowledge. The use of analogy, for example, i.e. finding a storyline, which may be made to fit the problem in order to explore possible outcomes or add to possible predictions, dates back at last to Aristotle. Analogies may be taken from a different discipline (e.g. biology related to engineering) or fiction (well known plotlines which can be applied to a situation to develop possible outcomes), or simply factual stories of other products, or business decisions. Makridakis in Chapter 9 describes three helpful characteristics, which seem to apply to long term predictions:
• Accurate over the long term but impossible to identify when (e.g. Roger Bacon predicting submarines in 1260).
• Disbelief from most people, even those directly affected, about the potential of new inventions (famous example of the chairman of IBM predicting a maximum demand for computers of 100 in the early 1950s, similar reluctance to predict the spread and use of mobile phones).
• Over-prediction of the benefits and scale of new technology once it has started to spread (this is the “paperless office” type prediction).
Scenario-building is another creative technique in future forecasting, in fact for many global businesses, there are departments specialising in this area of research.

AN INTRODUCTION TO BUSINESS RESEARCH METHODS foreCasting trends
143143
Scenarios are built on some historical information, plus subjective interpretations, hunches and specific assumptions. Their purpose is not necessarily to provide accurate predictions, but to challenge linear models of prediction, since actual change is not usually linear, but most predictive methods produce linear outcomes. Big business must invest in this type of activity to protect its territory and find opportunities before the competition.
11.3.4 FORECASTING STAGES
1. Define the problem and the need2. Collect information – quantitative and qualitative data3. Exploratory analysis – look for patterns in the data, possible trends, seasonality,
cyclical patterns, relationships in the variables4. Select forecasting techniques e.g. exponential smoothing, regression and more
advanced statistical models or opting for qualitative or creative techniques5. Use the model and evaluate the forecasts produced.
EADS unites a leading aircraft manufacturer, the world’s largest helicopter supplier, a global leader in space programmes and a worldwide leader in global security solutions and systems to form Europe’s largest defence and aerospace group. More than 140,000 people work at Airbus, Astrium, Cassidian and Eurocopter, in 90 locations globally, to deliver some of the industry’s most exciting projects.
An EADS internship offers the chance to use your theoretical knowledge and apply it first-hand to real situations and assignments during your studies. Given a high level of responsibility, plenty of
learning and development opportunities, and all the support you need, you will tackle interesting challenges on state-of-the-art products.
We welcome more than 5,000 interns every year across disciplines ranging from engineering, IT, procurement and finance, to strategy, customer support, marketing and sales. Positions are available in France, Germany, Spain and the UK.
To find out more and apply, visit www.jobs.eads.com. You can also find out more on our EADS Careers Facebook page.
Internship opportunities
CHALLENGING PERSPECTIVES

AN INTRODUCTION TO BUSINESS RESEARCH METHODS foreCasting trends
144
11.4 BASIC FORECASTING TOOLS
Here are the popular ones:
• Time series – much of the secondary data discussed in our earlier chapter is produced in this format, so could be used for prediction. Clearly cross-sectional data is all from one time period so cannot be used for time series.
• Graphical summaries – line graphs of a variable against time (horizontal axis), shows trends in historical data, special events, cyclical or seasonal patterns (latter from monthly data). A seasonal plot will use a line graph over the period of a year, with different annual data plotted together to show similarities and differences. A scatter diagram will be useful to show cross-sectional data in how one variable relates to another, this may be of use for explanatory modelling. Where a linear trend can be seen in a graph, a “straight line” forecast can be made (though will not necessarily be accurate!).
• Numerical summaries – univariate statistics e.g. mean, median, mode, standard deviation and bivariate statistics e.g. co-variance and correlation have been discussed in our chapter on quantitative techniques. All help to get to know the data in preparation for forecasting. All statistics can be shown over time. Time series data can compute autocorrelation, which can be shown clearly in a graphical way e.g. correlogram.
• Averaging –a simple forecast method uses an average of monthly data over a time period of some years to be the predicted forecast figure for that month in the next year.
• Prediction intervals – used to give an estimate of the range within with the actual value will fall, if the forecast value and Mean Squared Error has been computed. The formula uses a standard z-value, which is associated with a particular probability level – i.e. in the example z=1.645 is associated with a 90% probability level.
Fn+1 ± z..MSE
• Least squares estimates – a way of estimating values for which the mean squared error (MSE) is at a minimum. It is an estimation of goodness of fit of a relationship between variables.
• Accuracy of linear regression, when using an explanatory model and a particular variable has impact on the forecast. In other words, this is about working out the relationship between one dependent variable (to be forecast) and an independent variable which could explain how the dependent variable changes. If there is more than one independent variable, multiple regression is used. Forecasting is done by understanding the relationship between the dependent and independent variables, such that we can use new values for the independent variable(s) and predict

AN INTRODUCTION TO BUSINESS RESEARCH METHODS foreCasting trends
145
corresponding values for the dependent variable. The dependent variable is often referred to as the “outcome variable” (the thing being predicted) and independent variables are often referred to as “predictor variables” as they are the variables used to make the predictions. The accuracy of multiple regressions improves as the number of non co-linear variables are introduced into the regression equation.
• Transformations and adjustments – include mathematical transformation of the data values (e.g. square root or logarithm) of each value to smooth the variation and make forecasting simpler, calendar adjustments to take account of different lengths of months in some data given per day, adjustments can also be made for numbers of trading days in a month or for inflation or population change. A simple moving average (e.g. averaging the value before during and after the period and using this as the new data value) will provide a simple and understandable smoothing technique to allow patterns in the data to be more visible.
11.5 REGRESSION AND DISCRIMINANT ANALYSIS
Regression Analysis is a quantitative statistical technique often associated with forecasting. It is also used as a predictive technique. Regression attempts to forecast or “predict” the value of an outcome variable (a dependent variable) based upon one (“Simple Regression”) or more (“Multiple Regression”) independent variables in the regression equation. The basic equation for regression analysis is:
Y= a + (b1 * x1) + (b2 * x2) + (bn * xn)
Where: Y = the thing being predicted (the dependent variable), a = the alpha weight (constant) of the equation, b1= the beta weight for each independent variable x1= the actual value for each independent variable (note: Y = the predicted value and Y' = [Y prime] the actual value). The simple correlation between Y and Y' is called the multiple correlation coefficient.
The power of multiple regression increases when there is a weak, or little, correlation between all of the independent variables included in the equation. Multi-collinearity is the term used to describe the amount of correlation among the independent variables. As a researcher, you want the multi-collinearity of the independent variables to be low. The independent variables should be individually related to the dependent variable, but relatively unrelated to each other. Under such conditions, the accuracy of the prediction equation increases.
The purpose of multiple regression analysis is to create a “prediction equation” based upon the relationship between high level (interval or ratio) or dichotomous independent variables. When using dichotomous independent variables, they are referred to as “dummy variables”,

AN INTRODUCTION TO BUSINESS RESEARCH METHODS foreCasting trends
146146
and coded numerically as a 0 (its absence) or a 1 (its presence) of the variable (as illustrated in the gender variable in the example below).
Example: A Marketing Manager believes that the “sales volume” of her workforce is a function of 1) Experience 2) Education and 3) Gender. The manager is doing salary planning and forecasting, is interested in more closely linking pay with performance in her organization. The manager makes some enquiries and finds that the overall average sales volume per month per salesperson is $25,000. She also discovers that there is a $1,500 increase in sales for each year of experience, and a $500 per month increase in sales for each year of “formal” education. She also discovers that women tend to outsell men by $450.00 per month.
The manager wants to predict future job performance of 2 candidates for a salesperson position in the company. What is the expected or predicted monthly sales performance for each of the two candidates?
Candidate 1: has 8 years work experience, a 4 year college degree, and is a female.Candidate 2: has 5 years work experience, a 2 year associate degree, and is a male.
If you’re hoping for a truly modern education, one where you’re encouraged to speak your mind and to think long-term, both when it comes to your own future and the future of the planet. Then the University of Gothenburg is the place for you.
Study a Master’s programme in Gothenburg, Sweden | www.gu.se/education
INNOVATIVELIKE YOU.

AN INTRODUCTION TO BUSINESS RESEARCH METHODS foreCasting trends
147
(Note: education was measured in years of formal education – for Candidate 1: 12 years through high school, + 4 years of college, and for Candidate 2: 12 years of high school + 2 years of college)
Y= a + (b1 * x1) + (b2 * x2) + (bn * xn)
Candidate 1:Y= 25,000 + (1500 * 8) + ( 500 * 3) + (450 * 1)Y= 25,000 + 12,000 + 1,500 + 450Y= $38,950
Candidate 2:Y= 25,000 + (1500 * 5) + (500 * 4) + (450 * 0)Y= 25,000 + 7,500 + 2000 + 0Y= $34,500
This simplified example reveals how regression analysis works. Today, all the data would be collected and entered in a statistical software program (such as IBM SPSS), and all the necessary calculations would be performed. This tedious and lengthy arithmetic process would be instantaneous. As the researcher, your job is to select and define the independent variables, quantify them, and enter them into the statistical software and interpret its outcome. If the company illustrated in the example above had 300 employees on the salesforce, the researcher would need to collect the data on all 3 of the independent variables (experience, education and gender), for all 300 people in the salesforce in order to create the “prediction equation” for future performance of the salesforce. Other independent variables could have been included. Notice that “age” is not an independent variable included in this example. Should it have been? If “age” can be substantiated as a significant variable, it could have been included in formulating the regression equation.
Once the regression equation is formulated, the researcher would then insert the values for the independent variables of a specific case, and using the prediction equation, generate a “predicted” outcome for the specific case. As shown above, Candidate 1 would have a predicted sales performance of $38,950 / month, and Candidate 2 would have a predicted sales performance of $34,500 / month. The researcher’s role is to identify and measure the independent variables, which are related to the outcome (dependent) variable.
Variations of multiple regression (e.g., stepwise regression, hierarchical regression, etc.) allow a researcher to include many independent variables in the data set. The statistical program will then determine which of the independent variables have the least multi-collinearity among each other, but the greatest relationship to the dependent variable, and then generate the most accurate prediction equation possible given the data. For additional details about

AN INTRODUCTION TO BUSINESS RESEARCH METHODS foreCasting trends
148
regression the book Understanding Regression Analysis: An introductory Guide, 2nd edition (Schroeder, Sjoquist & Stephan, 2017) provides an excellent primer on the subject.
Another prediction methodology, similar to multiple regression analysis is multiple discriminant analysis. The major difference between regression analysis and discriminant analysis is that when using discriminant analysis, the outcome variable (the dependent variable) is nominal or ordinal level. In multiple regression analysis, the dependent variable is interval or ratio level.
11.6 MEASURES COMMONLY USED TO EVALUATE FORECASTS & PREDICTIONS
11.6.1 STATISTICAL MEASURES
Comparing forecast and actual figures per time period will give a data series which can be averaged to give mean error of the forecast. However, positive and negative errors will tend to cancel each other, so mean error is likely to be quite small. It should, however, tell us of systematic forecasting error.
Mean Absolute Error is computed the same way but taking all differences between actual and forecast as positive. Mean Squared Error squares each difference and produces a similar clearer picture of the error in forecasting, than the Mean Error.
A more useable error can be calculated through Percentage Error (PE), where each value of the difference between actual and forecast is divided by the actual value, giving a percentage error value. From these PEs, a Mean Percentage Error can be calculated, which is a useful meaningful estimate of error provided there is a meaningful origin to the scale used and the time series does not contain zeros.
The multiple correlation coefficient (R) is used to determine the correlation between the actual value (Y') of the dependent variable and the predicted value (Y) of the dependent variable in a multiple regression analysis. The Pearson Product Moment Correlation Coefficient (r) is most frequently used statistic to calculate this “coefficient of multiple correlation” between the actual and predicted values.

AN INTRODUCTION TO BUSINESS RESEARCH METHODS foreCasting trends
149149
11.6.2 OUT-OF-SAMPLE ACCURACY MEASUREMENT
This method simply divides the data set in two and uses part of it to estimate parameters and set up the forecast model. This is then tested on the second part of the data for accuracy (referred to as the in-sample or training set. The test data can then be used to determine how well the model will actually forecast a new set of data.
11.6.3 COMPARING FORECAST METHODS
The naïve method of making forecasts uses the more recent data as the prediction, (or doing the same but with seasonally adjusted data) and computes the Mean Absolute Error and Mean Absolute Percentage Error of these naïve predictions when compared with actual data. The naïve method is used to compare the results of more sophisticated forecasting techniques to actual results.
© Deloitte & Touche LLP and affiliated entities.
360°thinking.
Discover the truth at www.deloitte.ca/careers
© Deloitte & Touche LLP and affiliated entities.
360°thinking.
Discover the truth at www.deloitte.ca/careers
© Deloitte & Touche LLP and affiliated entities.
360°thinking.
Discover the truth at www.deloitte.ca/careers © Deloitte & Touche LLP and affiliated entities.
360°thinking.
Discover the truth at www.deloitte.ca/careers

AN INTRODUCTION TO BUSINESS RESEARCH METHODS foreCasting trends
150
11.6.4 THEIL’S U-STATISTIC
The Makridakis text (1998) suggested offers a good description of U-statistic. This is essentially a coefficient. Note that the value of the U-statistic suggests the accuracy of a forecast as follows:
U=1 then the naïve forecast is as good as the forecasting technique being evaluated U<1 then the forecasting technique is better than the naïve methodU>1 then the naïve method is better than the forecasting technique.
11.6.5 AUTOCORRELATION FUNCTION (ACF) OF FORECAST ERROR
ACF is used to identify any pattern in errors after a forecasting model has been used. You can calculate the autocorrelation function to see if there is a pattern of error which could be avoided. Again, the Makridakis text (1998) provides a good explanation of detail.
11.7 EXPLORING THE VALUE OF FORECASTING METHODS IN BUSINESS PRACTICE
Statistical methods of forecasting are not nearly as widely used in business as we might expect.
Moving average and exponential smoothing, plus simple linear and multiple regression analysis, are the most widely known methods of quantitative technique for forecasting.
While time series methods are generally found to be more accurate in prediction than explanatory models e.g. using regression, it is the latter which are seen by managers to be the most effective technique.
Makridakis, et al conclude that:
• Simple methods for forecasting are at least as good as complex statistical methods• Some methods are better for short time horizons than others.• Different methods vary in accuracy depending on the method of evaluating accuracy• Averaging of forecasts using more than one method results in more accurate predictions.• Short term predictions can take advantage of inertia in business phenomena and
use this with seasonality and cyclical patterns to make useful forecasts

AN INTRODUCTION TO BUSINESS RESEARCH METHODS foreCasting trends
151
• Medium term predications are likely to be affected greatly by economic and environmental changes, so may vary in effectiveness depending on assumptions about the direction and speed of these changes.
• Long term predictions will decrease the effectiveness of statistical modelling at the business level and the use of creative technique may be the way forward here.
• Key advice for improvements in forecasting includes the keeping of accurate records – without these we have only intuition.
11.8 QUESTIONS FOR SELF REVIEW
1. What are the three main approaches for forecasting in business?2. What is the Delphi method?3. Why is it useful to smooth data values?4. What different naïve methods of forecasting can you suggest?5. Describe two ways in which forecasting accuracy can be evaluated.6. What is the difference between simple and multiple regression analysis?
11.9 REFERENCES
Schroeder, L.D., Sjoquist, D.L., & Stephan, P.E. 2017, Understanding regression analysis: An introductory guide, 2nd edn. Sage Publications, Thousand Oaks, CA.
Makridakis, S. Wheelwright, S.C. & Hyndman, R.J. 1998, Forecasting: methods and applications, 3rd edn. John Wiley and Sons, Hoboken, NJ.

AN INTRODUCTION TO BUSINESS RESEARCH METHODS rePorting researCh results
152152
12 REPORTING RESEARCH RESULTS
12.1 CHAPTER OVERVIEW
12.1.1 LEARNING OUTCOMES
By the end of this topic successful students will be able to:
1. Identify a personal approach to writing a research report2. Understand the differences between writing a report for a business audience and
for academic purposes3. Produce a clearly structured written report4. Produce an oral presentation of key findings5. Recognize different methods of presenting and disseminating research.
Linköping University – Innovative, well ranked, European
Interested in Strategy and Management in International Organisations? Kick-start your career with an English -taught master’s degree.
liu.se/master
Click here!

AN INTRODUCTION TO BUSINESS RESEARCH METHODS rePorting researCh results
153
12.2 YOUR PERSONAL APPROACH TO WRITING A RESEARCH REPORT
Which parts of a research study appeal to you most?
1. Exploring and defining a research problem.2. Reading and reviewing the literature.3. Designing the research methods.4. Conducting the research.5. Analysing data.6. Writing the research report.
Did anyone answer “6”? Probably not!
For most of us it is other parts of the research process, which appeal most, yet without stage 6, no-one else will ever reap the benefit of our work. It is a fundamental principle of research that we must publicise and disseminate what we find in some way, and that way usually involves writing reports.
One of the big issues with writing reports is that we leave it until near the end, believing it to be a simple part of the work, which can be sorted at the last minute, before a deadline. Of course, we are too intelligent really to believe this, but this is how we behave. One good answer to this problem is to plan. Not a rough idea of stages, which gets lost during the research and quickly becomes meaningless, but a proper Gantt chart of activities, showing:
1. how long we expect each activity to take,2. which, if any, are dependent on the completion of other activities,3. what resources are needed for each activity,4. any help needed from others and5. by when each activity will be completed.
Our best students, who complete detailed Gantt charts, are the ones who give us a new updated copy showing actions achieved at every supervisor meeting, who include those supervisor meetings as milestones in the chart, and who plan to start writing way ahead of deadlines. As supervisors, this works well, as it allows us to decide how comfortable we are with their level of writing, and enables us to make vital improvement suggestions at an early stage if they are necessary.
In the book “How to get a PhD” by Phillips and Pugh (2015) they suggest that writing is the only time when we really think (pp. 98–102). Do you agree with this statement?

AN INTRODUCTION TO BUSINESS RESEARCH METHODS rePorting researCh results
154
We are not sure we do, but we do know that writing and thinking are inextricably bound together, so if no other thoughts are happening, start writing.
12.2.1 HOW YOU WRITE
Do you have particular rituals and routines to get yourself started on writing? Most of us do. There is no one right way, we are all different. Some people just write, others need to collect everything they need together first. Others start with a coffee or sit in a particular place to write. What about you?
12.2.2 WHEN YOU WRITE
Do you need to set chunks of time aside? It is rare to be able to write in a sustained way in short pieces of time such as half an hour. Most of us need at least an hour or two to think ourselves into the piece of writing and make some progress. It can then take another half hour of immersion each time you start after a break. It is also important to make sure you are physically and mentally fresh to write. Whether you write best at night or in the day, there will need to be some energy and sustained focus, which usually only comes when you are in good form. The alternative is to wait until pure adrenalin forces you to write at the last minute, when there is no option. Not a great idea, especially for a piece of work like a research report, where, if you are fresh, new and often valuable ideas will come to you as you write.
12.2.3 TOOLS TO HELP YOU WRITE
Simply understanding everything you can do with your word-processing software is a good start. That particularly includes using heading styles in Microsoft Word™, since this saves time if you have to produce a table of contents for your work. If you haven’t used this feature, check it now before you have to write your report.
Other tools include those which can help you get your ideas together, such as mind-mapping software (e.g. Freemind). If you haven’t come across these pieces of software, don’t worry, they are not essential. They are a great aid if you regularly have to produce written work of some length and like the creative approach of mind-mapping. However, it is also very easy to produce a mind map on paper!

AN INTRODUCTION TO BUSINESS RESEARCH METHODS rePorting researCh results
155155
Finally, specific citation software programs can be a great help if you intend to research on a regular basis and need to build a good retrievable archive of references. Packages include Refworks, Endnote and Zotero – all the packages mentioned can be found on the web. A citation software package is simply a tailored database, which prompts you to record all the relevant details of a reference as you enter it, has space for notes on your reading of it, and can automatically work alongside Word to insert text references and an automatically generated bibliography. All you have to do is choose the format. Student versions of these packages are available. If you do not want to go this far, think about how you will keep your references in a retrievable format to save time when writing up. Chapter 2 presented additional details on how to keep track of references and citations using a variety of style manuals.
12.3 THE DIFFERENCES BETWEEN WRITING A REPORT FOR A BUSINESS AUDIENCE AND FOR ACADEMIC PURPOSES
12.3.1 BUSINESS REPORTS
Here there is a need for clarity, brevity and simplicity. Be sure to include an executive summary which focuses on the problem and suggested action. Sometimes there will be a
We will turn your CV into an opportunity of a lifetime
Do you like cars? Would you like to be a part of a successful brand?We will appreciate and reward both your enthusiasm and talent.Send us your CV. You will be surprised where it can take you.
Send us your CV onwww.employerforlife.com

AN INTRODUCTION TO BUSINESS RESEARCH METHODS rePorting researCh results
156
corporate house style to adopt. Bullet points are acceptable, but all recommendations should have a case or rationale made for them. Include charts, data tables or any visual graphic which can help the reader grasp quickly any statistical data.
12.3.2 ACADEMIC REPORTS
There is still a need for a clear, succinct style but using appropriate terminology, for example on research methodology, which will not be everyday language. Avoid using description wherever possible and instead take a critical analytical approach (discussed in the chapter on literature reviews). Pay special attention to academic referencing and avoid plagiarism. Read and use peer-reviewed academic journal articles to set the tone of academic writing.
Find a good academic journal article and consider trying to rate the suitability of the writing, the sections used and the persuasiveness of the article. Remember that in articles there are very strict and short word limits, which means we rarely see a detailed research method description, except where this is the point of the article, and we also rarely see a full literature review, which would be expected in work written for formal academic assignments or research reports for funding bodies, masters’ theses and doctoral dissertations.
12.3.3 ELEMENTS OF AN ACADEMIC RESEARCH REPORT:
The organization of your research report is of utmost importance. But do not overlook a well-designed cover page (and table of content for lengthier works). And while it may seem simple, having a succinct descriptive and interesting title is worth spending some time preparing. You want to capture your audience’s attention from the start, and this is where it begins.
The typical organizational format for a research paper includes the following parts:
Abstract, – written last as this must include a flavour of results, don’t repeat phrases from the main text. If we don’t get the reader’s interest in the short abstract, they are unlikely to read the rest of the report.
Introduction, must immediately grab the reader’s attention, often by a dramatic statement of the problem or situation to be researched.
Background, usually starts with a broad picture and gradually refines it to the narrow focus of the research (a filter).

AN INTRODUCTION TO BUSINESS RESEARCH METHODS rePorting researCh results
157
Literature review, see the earlier chapter on this subject
Research objective(s), hypothesis and method justification, – most of this book has been about this section, but it must not appear as a stand-alone section. Every section including this one should follow logically from the previous one and lead naturally to the next. So, for example, the literature review section should end with a direction for the primary research, which is then picked up in the research method section.
Findings, try to offer the findings of your research in as pure a form as possible. This doesn’t mean giving raw data, it means finding a way to present that data so the characteristics of the data are clear to the reader, without interpreting the data, so that the reader is dependent on your view and cannot see the data for themselves. Visual methods such as charts and tables can summarise and present data effectively, but not pages and pages of them which soon cause overload.
Discussion and analysis, this is the real test of your ability to synthesise what you found in the literature review and in your primary research and to pull out from that synthesis what seem to you to be the most important points. It is not a place to put any description. Writing should be clear but intense – all sentences must add value.
Conclusions, not just a summary of what you found and have already said in the analysis, the conclusions section should step back a little and take an objective view of the outcomes – theoretical and practical – from the whole project – there should be no new references at this stage, but a clearly persuasive account of what has been achieved
Recommendations. – may be detailed and practical or may simply urge further research in an area which has been uncovered by your research. Where practical suggestions are made, they must be feasible, not “blue sky” ideas. Preferably there should be suggestions about how they could be taken forward – sometimes with a tabular implementation plan.
Appendices. In an academic piece of work, the appendices are not there to gain extra marks. They are there for two possible reasons: a) to add information to the main text where word length or focus did not allow their inclusion or b) to maintain a complete record of relevant information, particularly for your future use of this document. Keep appendices to a minimum.

AN INTRODUCTION TO BUSINESS RESEARCH METHODS rePorting researCh results
158158
12.3.4 STYLE AND GRAMMAR
This is important whether you are writing in your first or a second language. In both cases it will be wise to ask someone you trust to sub-edit your text. None of us is our own best editor, as many errors can easily slip through. If you are submitting an initial draft section to a supervisor, then errors are not so critical, but they must not be at a level which obscures the meaning!
If you are concerned about points of pronunciation and grammatical style, the best place to check is an English language national newspaper style sheet. These are available online at the paper’s website e.g. The Times, or The Telegraph in UK. These are often better than out of date grammar textbooks, as they incorporate current changes of accepted style, but do not lead change, reflecting acceptable style in the world of the reader.
12.3.5 BULLET POINTS
This is a key issue for academic work in the 21st century, as students increasingly find bullet points acceptable, and modern business favours the use of bullet points to encapsulate an argument quickly and clearly (in Microsoft Powerpoint™ style). There is nothing wrong with
���������������������� ���� � �
����������������������� ��� ������������������������������������� �� ���� ����� ������������� ��������� ���������������������������������� ���� ����������� ���� �������� ����������������������� ������� ���� ��������� ��� �������� ������������������� ������������������
� ����������������� �� ������������������� �

AN INTRODUCTION TO BUSINESS RESEARCH METHODS rePorting researCh results
159
using bullet points in business reports, they can often cut wordy paragraphs and get straight to the point. However, in academic work it is usual to avoid them if possible, using them only when giving a list of examples which require no further explanation, or summarising the points which are then explained in more detail below. Why? Because an academic reader, specifically a marker of academic work, cannot tell from a bullet point whether you have understood something or merely copied out a list.
12.3.6 USE OF FIRST PERSON
Whether you use the word “I thought or I did…” in your academic writing will vary according to the purpose of the section of writing. However, the general rule is not to use the first person except in two specific cases: first in a reflective section, where it is entirely legitimate to speak in the first person about your learning and experience, and second, in narrative accounts or certain types of qualitative data analysis, where this is a usual convention.
In all other cases, it is best to write objectively from the standpoint of a third person, provided you don’t have to tie yourself up in knots stylistically to achieve this!
12.3.7 A FEW MORE WORDS OF WISDOM
A common issue in academic writing is the use of verb tenses, as much of your writing may be taking place as things happen, results come in etc., thus encouraging you to use the present tense. However, as a general rule, it is better to use a consistent past tense as you are writing up a report of something, which has happened. Again, certain types of qualitative writing will demand a current tense, and of course quotations and transcripts should reflect exactly what was said, however it is usual to spend some time converting text to a past tense so that it reads consistently.
Lengthy sentences and paragraphs can get in the way of meaning. Try to ensure that sentences introduce only one idea, and paragraphs group around one idea, rather than letting them include many, which makes it harder for the reader to understand.
Subheadings can also help to break up long areas of text on a page and should be used where sensible. Most importantly, your academic writing is for a particular purpose: to persuade the reader of your ideas, which requires an engaging, clear and organised style.

AN INTRODUCTION TO BUSINESS RESEARCH METHODS rePorting researCh results
160
12.3.8 LOGICAL STRUCTURE OF RESEARCH REPORTS
A final point: the logic of your written report. For any audience, logical argument and flow from one section to another is vital. In an academic research report, it can be helpful to draft an audit of how specific findings in your research relate to particular literature and particular ideas, which then feature in your conclusions. In this way, all conclusions should be traceable back to the findings they came from and a logical flow established.
If you are not regularly used to writing such research reports or dissertations, then consider logic this way: in a really good piece of fiction writing, the reader is led along by always wanting to know what happens next. How can you apply this to your research report? The introduction should cause the reader to understand why you looked at the literature, what problem you wanted to solve or question you wanted to answer. When we read the literature review, we find out what that told you, but are left understanding that the literature didn’t fully answer all your questions, or perhaps raised new ones. We find this out in the conclusion of the literature review and are left wanting to know how you are going to answer those remaining questions. So we read on to the research method, in which you tell us why you chose this particular way of finding answers to your research questions, and then, in the findings, what you actually found as the answers.
But that isn’t enough. We are often left at the end of the findings section thinking –“how did that relate to what we heard about in the literature?” So we want to read on to the discussion to find out. By the end of the discussion, we know what you found and how it stacked up with the literature, but we are tempted to say “so what?” You answer this in the conclusion and recommendations by explaining what that means for the big questions you raised in your introduction, and what else remains to be done if there are unanswered questions which your research triggered.
All this means that each section concludes with a “cliff-hanger” – an unresolved question or problem which makes the reader want to read more in the next section. Putting in conclusions like this to each section, helps the reader to see the logic of your work.
12.3.9 LOGIC AS A “U” SHAPE.
You may also think about a “U” shape pattern to this structure, where the introduction and context begins at high level with “big picture” issues – maybe about the economy or the state of an industry sector. As you proceed through your research report, you drill down into more detail, so that by the time we read the findings, we are reading very detailed information in a particular context of your research, which you have found at the bottom of the hole you have dug to find out more about your question.
AN INTRODUCTION TO BUSINESS RESEARCH METHODS rePorting researCh results
161161
Then you start to take us back to the surface as you relate this detailed set of findings to the published literature, climbing back up eventually to conclusions at “big picture” level. Now we can see the whole problem again, but now we have your original primary research to add to our knowledge about that problem, and guide us where to go next in further research.
12.4 PRODUCING AN ORAL PRESENTATION OF KEY FINDINGS
In business, it will be usual practice to give an oral presentation of a report, possibly using the report itself as a “leave-behind” for readers to follow-up their undoubted interest in your subject! If using Microsoft Powerpoint™ software to present the gist of your ideas, then it is simple to produce clear and professional-looking slides for projection which set out the background, your objectives, your understanding of the context, your method(s) and your results, together with next steps/recommendations for action. Remember that when presenting orally, we must speak directly to the audience and encourage their involvement. At the least this will involve a pause at some point for questions, but, for preference, time will be designed in to get some audience participation at an earlier stage. Unless you are very familiar with the audience, it is good practice to ask something early on, which tells you a little about their experience of the topic, so that you can involve them in your talk.
Maersk.com/Mitas
�e Graduate Programme for Engineers and Geoscientists
Month 16I was a construction
supervisor in the North Sea
advising and helping foremen
solve problems
I was a
hes
Real work International opportunities
�ree work placementsal Internationaor�ree wo
I wanted real responsibili� I joined MITAS because
www.discovermitas.com

AN INTRODUCTION TO BUSINESS RESEARCH METHODS rePorting researCh results
162
Any presentation will be enhanced by visual aids rather than endless bullet-style slides. Writing the bullets can be helpful for us to remember what we want to get across, but the actual presentation may keep the bullets only for us, and for summary use, and focus on simple and dramatic visuals (photos for preference) which relate to your research, the problem or the outcome. Presenting to an in-company audience means not only a house-style (often branded slides) but also using your researcher’s objectivity to add depth to a focused corporate message. This is quite different from an academic presentation, which will use your objectivity to show your academic credibility and focus on the extent of your knowledge of published sources as well as the research you have achieved yourself.
Whether in the academic written report, the business report or a presentation, well-selected quotations from your research data, which reveal and give a flavour for your findings, are of high value. Not too many, just a few to show your connection with the “real world” which your research was conducted and how it relates to your findings and recommendations.
Whatever you do, you should not use your PowerPoint slides as a script to be read to your audience. Having just concluded your research project, you should now be the master of its content. Use your presentation to capture your audience’s attention and focus in on key points you want to get across to them.
To avoid the concern that slidesets are used constantly by everyone, you could try a different form of presentation such as Prezi, which offers a more visual canvas for your ideas. Or consider a PechaKucha style of presentation. This uses a slideset but on automatic timing, you are allowed 20 slides lasting 20 seconds each. This is an excellent way of ensuring you don’t spend too long on one idea, but it does need plenty of practice (in real time). Make sure you don’t start to apologise if the automatic timing runs faster than you do and you run out of time – professional presenting requires rehearsal to get it right first time.
We have mentioned social media sparsely in this book, but here is where it can come into its own. Professional use of social networks can be a great way to make an impact with your research and create a following. Social media platforms regularly change and mutate, but at the time of writing, it would be wise not to over-use Facebook to try to make serious professional connections – that is not its purpose. However, LinkedIn currently offers a more professional network for summarizing your research and promoting your key ideas. Blogging and micro-blogging (Twitter) can also produce great connections for research. You may want to use a filtering technique, such as Lists in Twitter to make sure you can regularly check professional contacts and posts concerning research without having to wade through lots of personal chat. Bear in mind that social media may not simply be a way of disseminating your research, but could be part of your methodology, particularly if using

AN INTRODUCTION TO BUSINESS RESEARCH METHODS rePorting researCh results
163
snowball sampling or convenience sampling to distribute questions. Make sure the limitations of this technique are clearly stated.
Whatever platforms you choose, make your research report work for you. You began with a big idea and have had to work hard to make it into good research based on valid evidence. Now apply it, use it and promote it to those interested – perhaps your participants/respondents, perhaps an organization who might value your results. See whether your academic supervisor is prepared to co-author a research conference paper on your work, using their connections to support your scholarship. Or if you produced this research for your organization, see who in senior management might value your results. Your business research is only valuable if people get to hear about it.
12.5 QUESTIONS FOR SELF REVIEW
1. Why do we have to write research reports and present our results?2. What are the key differences between writing a business report and writing an
academic report?3. How should a research report and presentation be organized?4. What should be included in a research method section?5. How long should a PowerPoint™ presentation be when delivering the results of
your research study to an academic audience? Why?
12.6 REFERENCES
Phillips, E.M. & Pugh, D.S. 2015, How to get a PhD: a Handbook for students and their supervisors, 6th edn. Open University Press, McGraw edn. Berkshire, UK.
Saunders, M. Lewis, P. & Thornhill, A. 2016, Research methods for business students. 7th edn. Pearson Education Limited, Harlow, England.

AN INTRODUCTION TO BUSINESS RESEARCH METHODS Comments from Peer reviewer
164
COMMENTS FROM PEER REVIEWER
This book makes a great introduction to university students of all business disciplines who undertake research projects. It covers all the important issues and concepts which are essential to developing competent knowledge and skills for research. Its writing is concise but at the same time comprehensive, making this text a highly accessible resource for students who find research methods a mystery.
– Kiefer Lee, Principal Lecturer in Marketing, Sheffield Business School, Sheffield Hallam University.


![[CADERNO] Martelli - Administrativo A](https://img.dokumen.tips/doc/110x75/5695d50e1a28ab9b02a3df56/caderno-martelli-administrativo-a.jpg)


