Embed Size (px)
Citation preview

Public Health Challenges Of Air PollutionKSPCB and CSE Workshop. Bangaluru:22-03-2013p g
D H P hDr.H. ParameshMD, FAAP(USA), FIAP,FIAMS, FIAA, FCAAI
• Sr. Ped. Pulmonologist and Environmentalist. Lakeside Hospital Bangalore• Chairman, Aeroallergens and Human Health, G.O.I• Panelist. Macroeconomics and Health G.O.I• Chairman, State of Environment and action plan G.O.K and World Bankp• Past Chairman TAC. K.S.P.C.B• Founder Chairman of Environment Child Health/Allergy Appl Immul. Chapters of I.A.P• W.H.O Faculty for Environmental Health
Our Bangaluru – Environmental Profile• 920m above sea level. Fastest growing
city in the world (Forbes – 2010)
• Daily temperature – Max:28.9°C Min:18.9°C (07)
• Average Rainfall – 80.8cm per year
• Growth of Bangalore: 69km2 – 1949 741km2 – 2007800 km2 2011800 km – 2011
• We add 20km of built up area per year and loose 20% of green area per year
• Was named as air conditioned city, garden city, pensioners’ paradise Wh i ?What is now?
• Sneezing city, wheezing city and pensioners nightmare city

Bangaluru Urban Agglomeration Zone (BUAZ)
Population:0.1m (1880); 1.6 (1971) 8 678 (2008)
(BUAZ)
(1971); 8.678m(2008)Vehicles:
3.7 million (2011)10 f ld i i h l d d10 fold increase in the last decade10% increase 1 year70% are 2-wheelers (2011)
Fuel Consumption:3-3 ½ fold increase in consumption of automobile fuelSlow traffic emit (10 km/hr) 5 ½ times more CO.Congestion costs ` 3000-4000 Cr/yr. Apart from Health cost
Source: IOCL - 2008,; Dept of Transport, GoK, 2011

LUNGS: THE AMAZING ORGAN
Children Suffer more from air
pollution due to anatomic &
physiological
600 million alveoli
100-200 million branching tubes
reasons
Very thin membrane (0.3 micron)
gShould remain patent all
the time
420 Lt f O
10,000 liters air every day
10,000 liters blood every day
420 Lts of Oxygen350 Lts of Carbon Dioxide
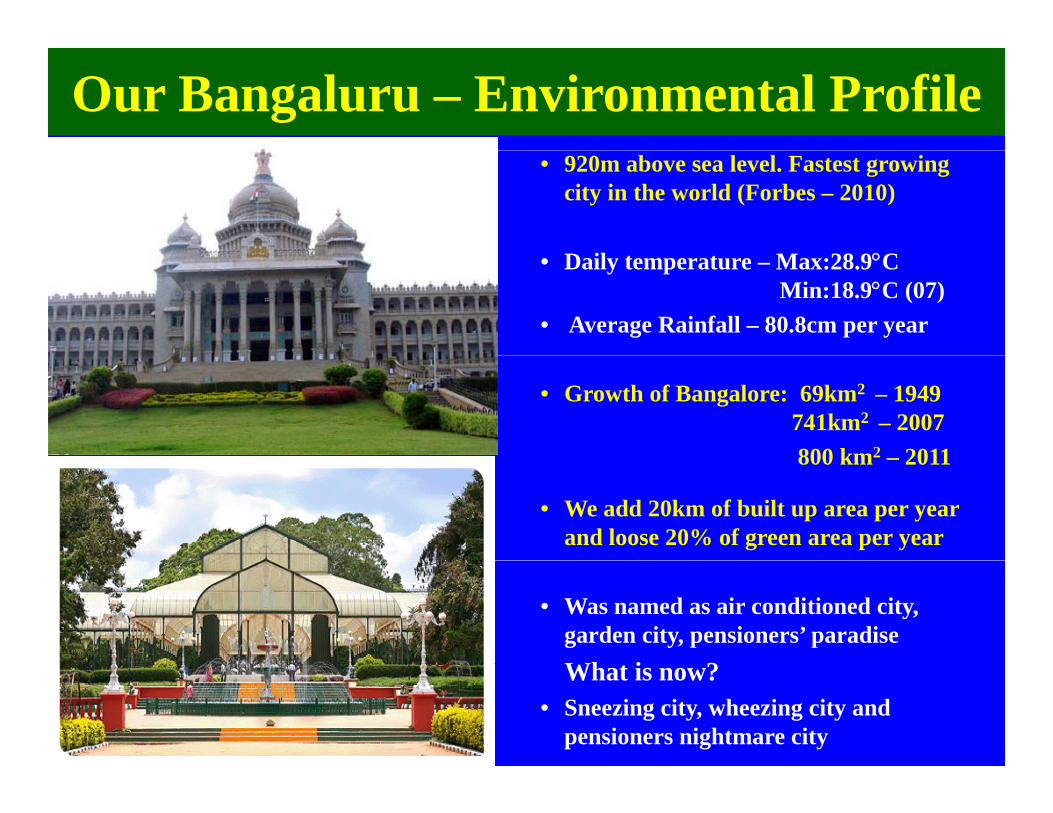
LIFETIME EXPOSURES OF POLLUTANTSLIFETIME EXPOSURES OF POLLUTANTS
Air
Domestic Environments
Drinking Water
Soil : DermalEnvironments
Intra-uterine Occupational Exposure
Birth 6mths 1yr 5yrs 16yrs 45yrs 65

Residential Proximity to main roads during Pregnancy and Risk of Asthmag y
Japanese Birth Cohort Study, 756 pregnant mothers Babies followed for 2 yrs after birthmothers, Babies followed for 2 yrs after birth
<50 mts versus >200 mts
Doctor diagnosed asthma: 4 0 (1 4-11 2)Doctor diagnosed asthma: 4.0 (1.4-11.2)
Doctor diagnosed eczema: 2.3 (1.1-4.6)
Maternal exposure to vehicular pollutants during pregnancy is strongly associated with early childhood asthmay
Air Pollution increases the risk of premature birth by 30%
(Miyake Y et al, Pediatr Allergy Immunol 2010; 21: 22-28)AAP Smart Brief October 10, 2011
y

Prenatal exposure to air pollutants and risk of allergic respiratory symptoms at 1 yearesp ato y sy pto s at yea
• Mothers (n = 333, from Poland) underwent personal ( , ) pmonitoring for air pollutants during the second trimester
l bi i l i• Prenatal ambient air exposure to polyaromatichydrocarbons associated with increased risk of babies (followed over 1 year) developing:(followed over 1 year) developing:
- Cough 4.80-fold- Wheezing 3 83-foldWheezing 3.83 fold- Sore throat 2.56-fold- Ear infections 1.82-foldEar infections 1.82 fold
(Jedrychowski et al, Eur J Epidemiol 2006; 20(9): 775-782)
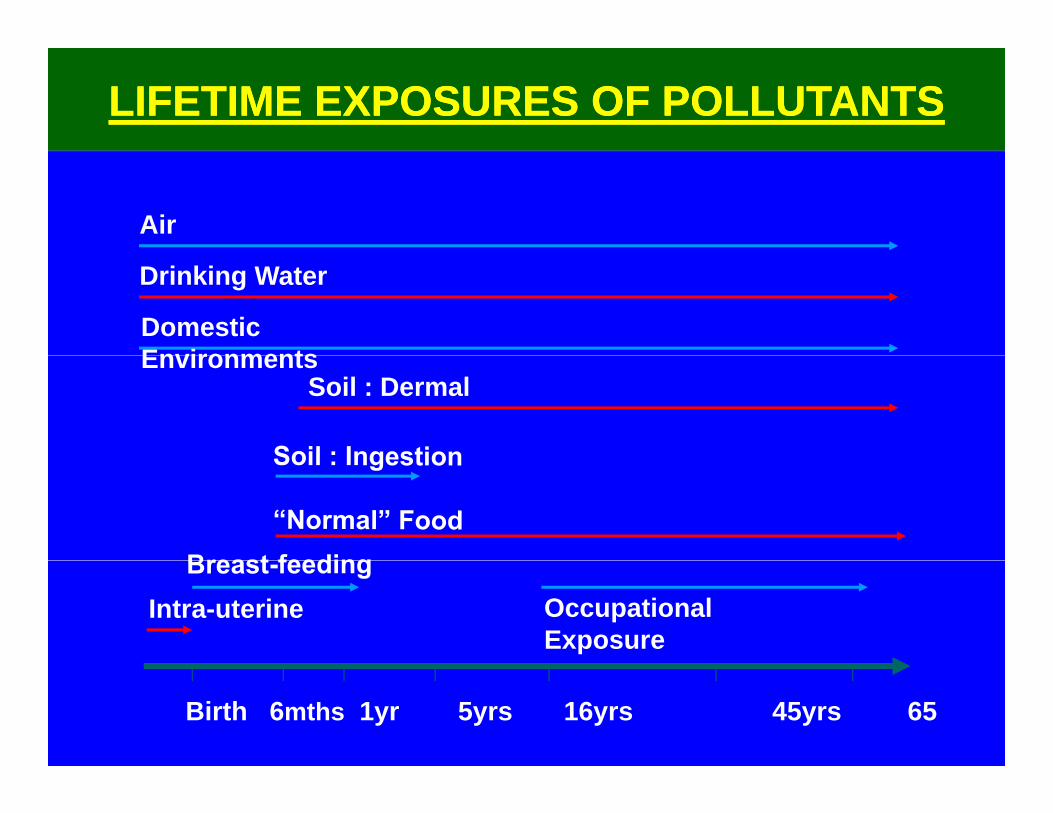
Pollen Allergy
↑ ↑ IgE ↑ ↑ ↑ ↑ IgE↑ ↑ IgE ↑ ↑ ↑ ↑ IgEPollen become more allergenic when these trees grow in an urban environment
(Knox et al, Clin Exp Allergy 1997
Diesel exhaust particles increase allergen-specific IgE levels by up to 50-fold
Takenaka et al, J Allergy Clin Immunol 1995; 95: 103-115)
(Bryce M et al., Int Arch Alergy Immunol 2010; 151: 45-65)
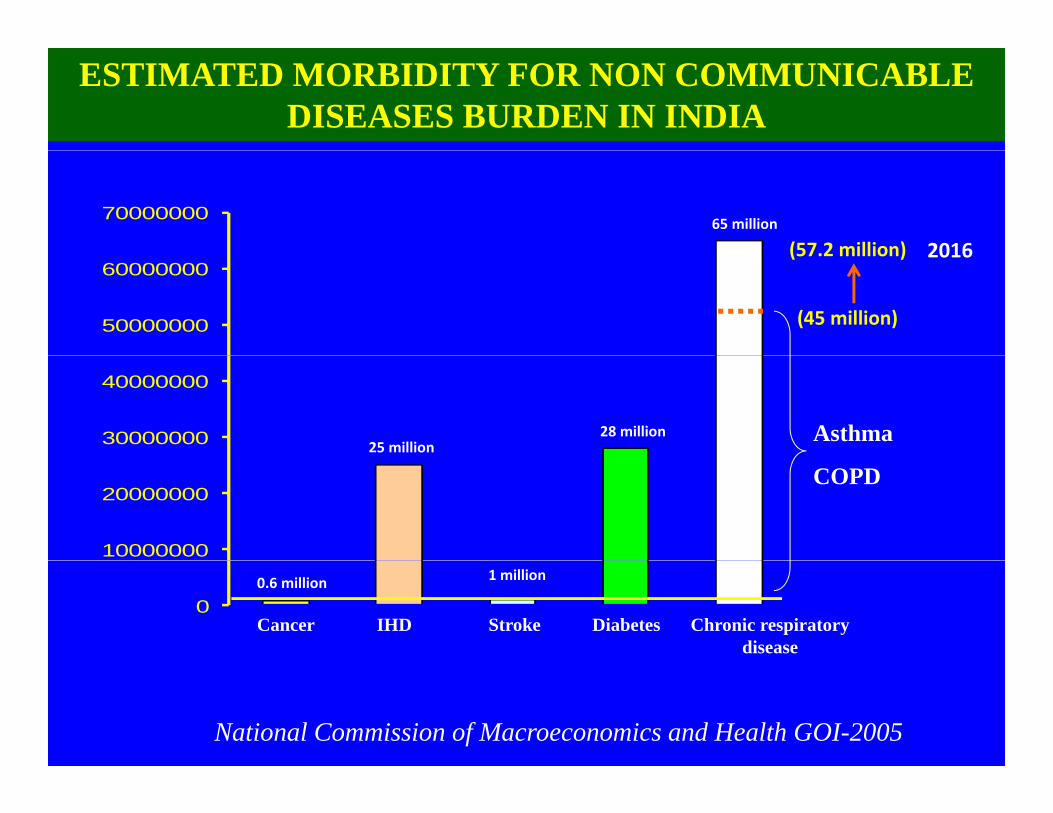
ESTIMATED MORBIDITY FOR NON COMMUNICABLE DISEASES BURDEN IN INDIA
70000000 65 million
(57 2 million) 2016
50000000
60000000
(45 million)
(57.2 million) 2016
30000000
40000000
25 million28 million Asthma
10000000
20000000COPD
0Cancer IHD Stroke Diabetes Chronic respiratory
disease
0.6 million 1 million
National Commission of Macroeconomics and Health GOI-2005
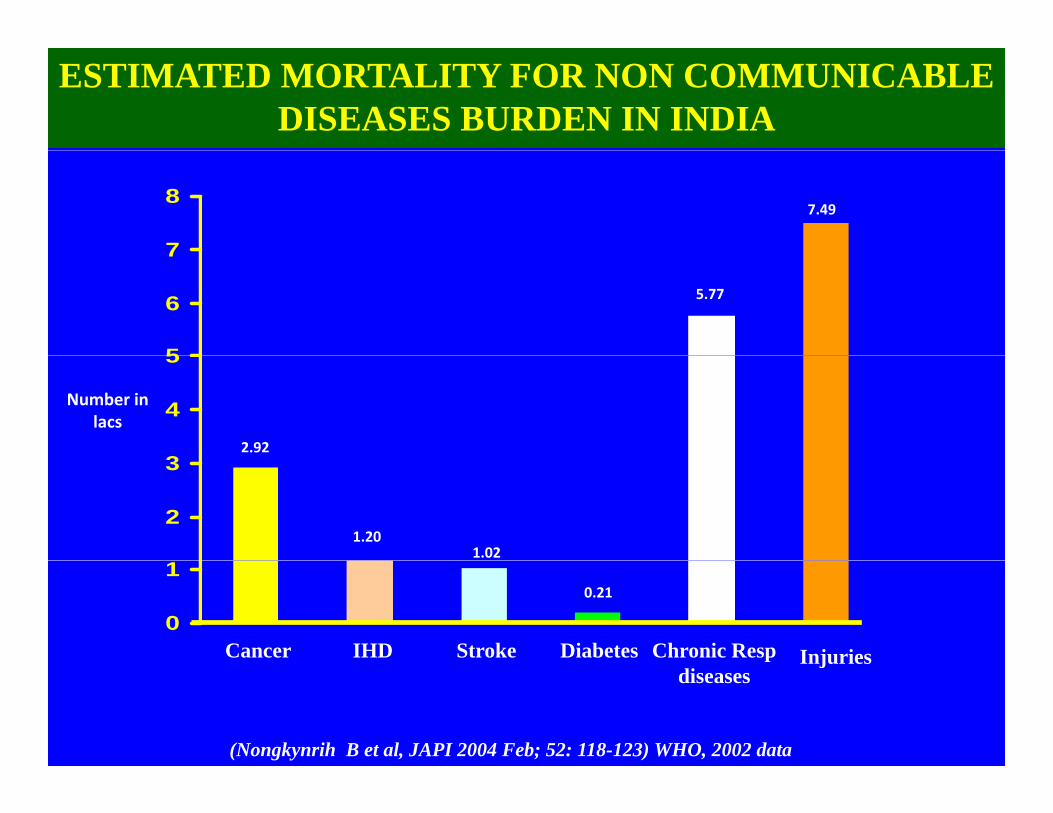
ESTIMATED MORTALITY FOR NON COMMUNICABLE DISEASES BURDEN IN INDIA
7
87.49
5
6
7
5.77
3
4
5
2.92
Number in lacs
2
3
1.201.02
0
1
Cancer IHD Stroke Diabetes Chronic Resp Injuries
0.21
diseasesInjuries
(Nongkynrih B et al, JAPI 2004 Feb; 52: 118-123) WHO, 2002 data
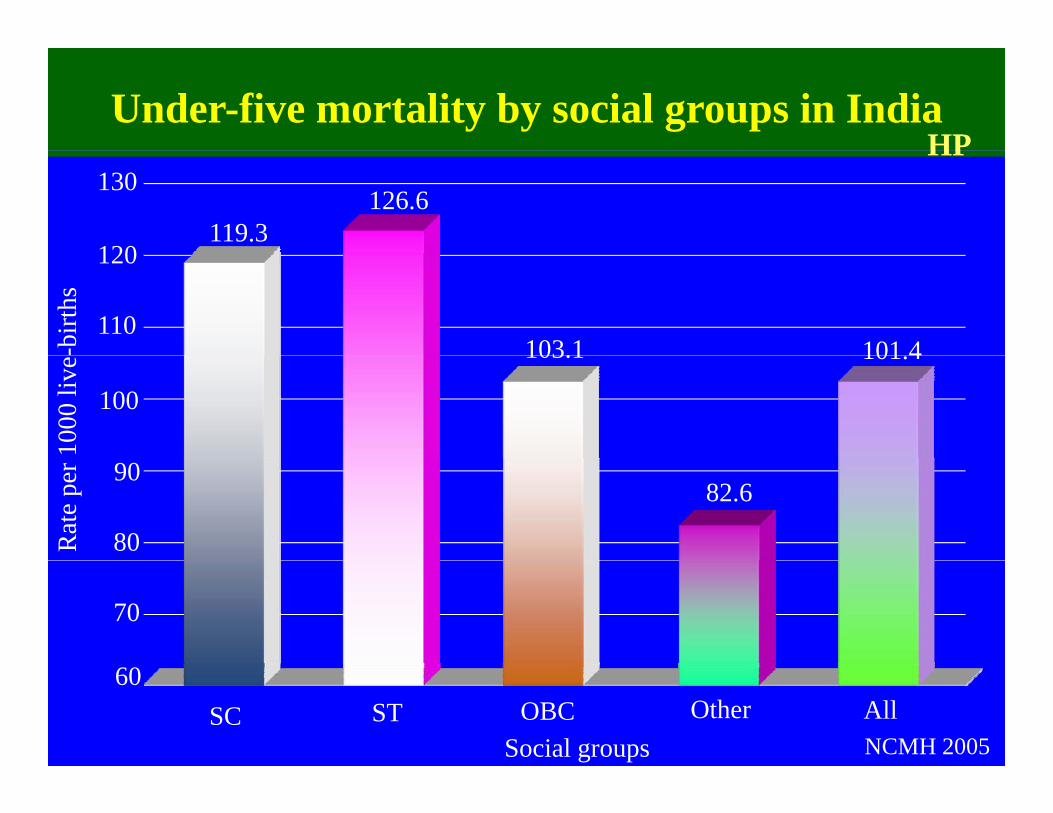
Under-five mortality by social groups in IndiaHP
130
120119.3
126.6
HP
120
110103.1 101 4-b
irths
100
103.1 101.4
1000
live
90
80
82.6
Rat
e pe
r
70
60SC ST OBC Other All
Social groups NCMH 2005

UltrastructuralUltrastructural nasal pathology in children chronicallynasal pathology in children chronicallyand sequentially exposed to and sequentially exposed to air air pollutantspollutants
Electron microscopy of nasal mucosa
PARAMETERS Veracruz(n = 11)
Mexico city(n = 15)
Epithelial shedding 0 14
VERACRUZ CITY
Necrotic cells 0 12
Goblet hyperplasia 0 4
Patchy absent cilia 0 15
Squamous metaplasia 0 8
Intraepithelial PMN 2 15Intraepithelial PMN 2 15
Intraepithelial monocyte 0 3
Particulate matter in i t ll l
0 5
MEXICO CITY
intercellular spaces
Calderon-Garciduenas L et al, AJRCMB 2001; 24: 132-138
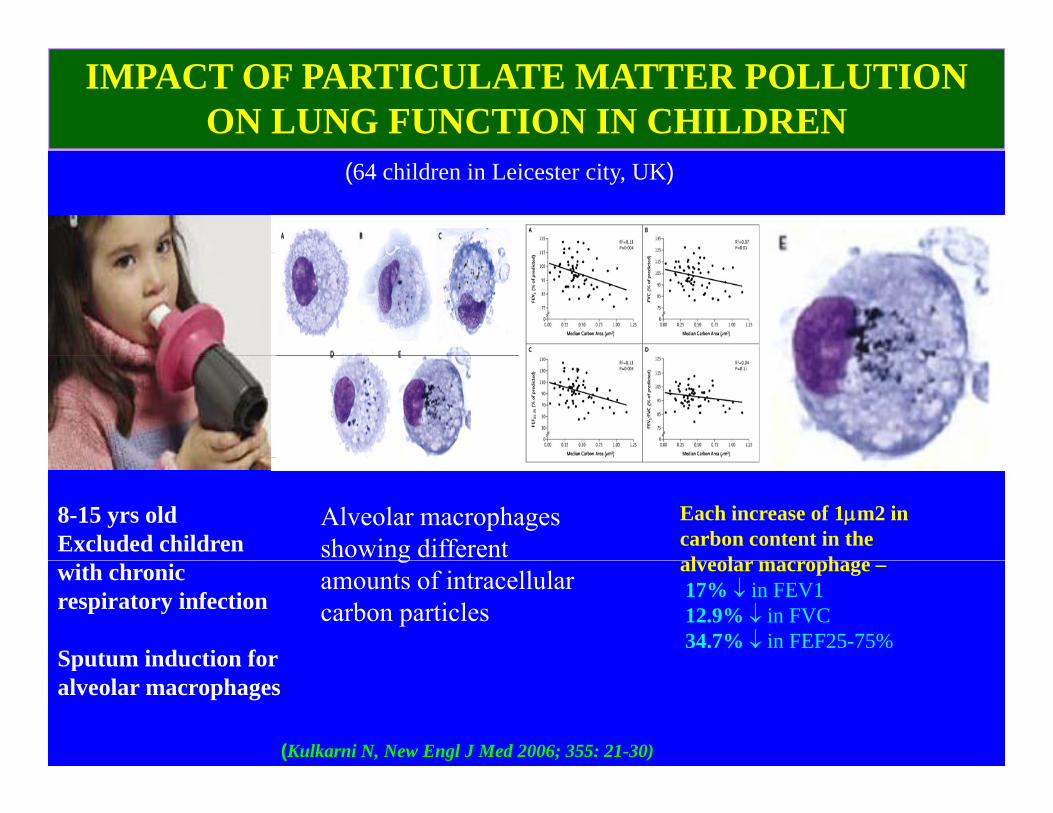
IMPACT OF PARTICULATE MATTER POLLUTION ON LUNG FUNCTION IN CHILDREN
(64 children in Leicester city, UK)
8-15 yrs oldExcluded children
Each increase of 1μm2 in carbon content in the
l l hwith chronic respiratory infection
Sputum induction for
alveolar macrophage –17% ↓ in FEV112.9% ↓ in FVC34.7% ↓ in FEF25-75%
Sputum induction for alveolar macrophages
(Kulkarni N, New Engl J Med 2006; 355: 21-30)

Passage of Inhaled Particles into the Blood Circulation in Humans
Radio-labeled Tc99 particles <100nm
Found in blood within 1within 1 minute and peak after 10-20 mins
(Nemmar et al, Circulation 2002; 105: 411)

Allergic Rhinitis: Magnitudeg g99.6
80
90
100
7581.7
50
60
70
199920112004
30
40
50
22.5 27.5
1999
0
10
2019991994
0
General Population Asthmatics
H Paramesh I.A.P Text book Pediatric - 2013

Prevelence of Snoring/OSAS
8
8%No = 950
6
7
8Age = 2-17yrs
4
5
676
2
3
4
1.05%
0
1
2 1.05%
10
Primary Snoring
OSAS
H Paramesh. Pankaj Sharma OSAS and DNB thesis Study 2010

Sleep disorder breathing (SDB) & CausesCauses
4544.74
No = 950 •Allergic Rhinitis = 58%
35
408% of children had SDB
•Adenoid Hypertrophy = 50%
• Asthma = 35%
25
3021.05
26.32
• Adenoid Hypertrophy = 7.9%&Asthma
10
15
20
7.09ler Scho
oler
Adolescent
• Adenoid Hypertrophy, = 5.2%AR & Asthma
0
5
10 7.09
Tod
dl
Pre
S
Scho
ol
0S l e e p D i s o r d e r e d
b r e a t h i n gH Paramesh. Pankaj Sharma OSAS and DNB thesis Study 2010

Trends in Asthma Prevalence in Bangalore
30
24.50%
29.50%
26.70%25.60%
20
25
18.50%
15 29.50%
26.70% *9%
10.50%
10 18.50%
24.50% 25.60%9%
5 9%10.50%
01979 1984 1989 1994 1999 2004 2009
H. Paramesh; Indian Journal of Pediatrics; Special Issue 2002, 2006•H Paramesh International Conf on Environment and health 2010
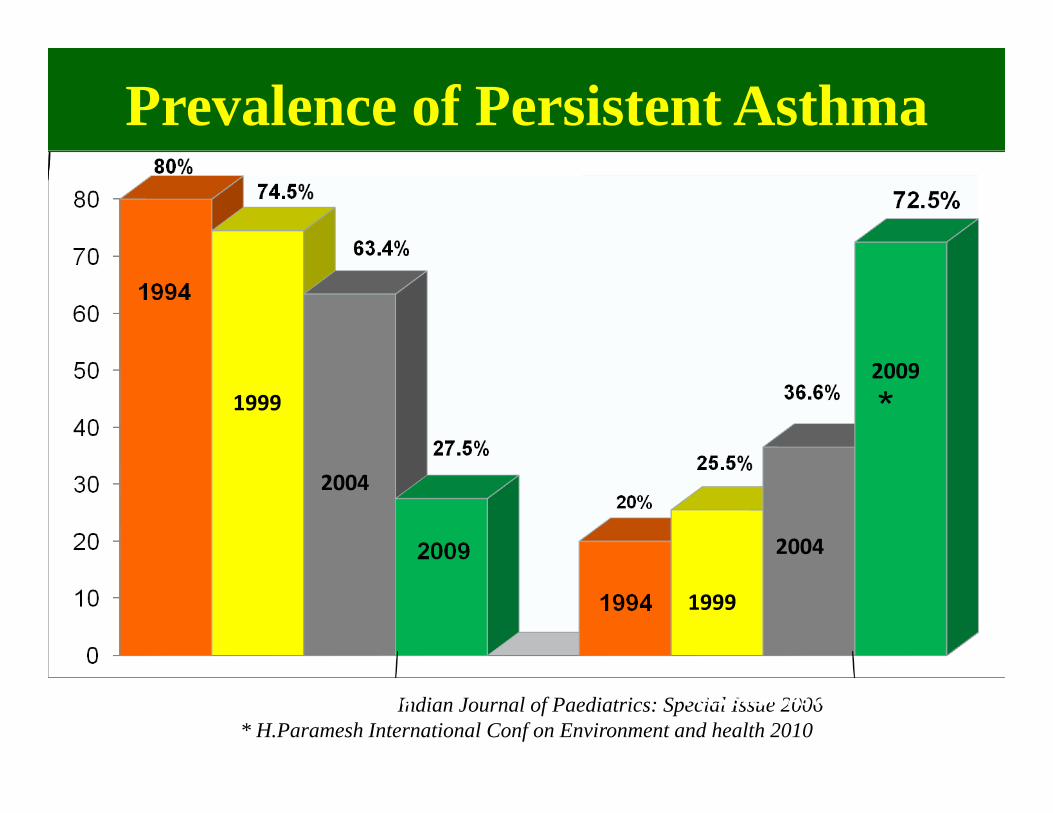
Prevalence of Persistent Asthma
19992009
2004
2004
1999
Dr . H . Paramesh, Indian Journal of Paediatrics: Special Issue 2006* H.Paramesh International Conf on Environment and health 2010
Intermittent Asthma Persistent Asthma

Persistent Asthma Grades and PrevalencePrevalence
H.Paramesh . Ind . J. Ped 2006* H.Paramesh International Conf on Environment and health 2010

Changing Seasonal Pattern of Asthma EpisodesAsthma Episodes
25
30
15
20
19 7%28.8%
5
1019.7%
01994 2004 2010
2.8%
P Value 0.00025 P Value 0 001P Value 0.00025 P Value 0.001Summer Season
Dr. H. Paramesh: International Journal on Env Health 2008 Vol 12, nos ¾H. Paramesh. I.A.P Text book of Ped - 2013

IMPACT OF AMBIENT AIR POLLUTION ON ALLERGIC DISEASES
• Worsening of pre-existing
asthma
Children of heavy traffic school suffer more from asthma; it further increases in low
socioeconomic children• Increased emergency room
visits for asthma exacerbations( 6550)
Asthma prevalence31.14%
socioeconomic children
• Increased hospitalization for
asthma
I d f i h
( n = 6550)
19.35%• Increased use of anti-asthma
medication
• Increased prevalence of Allergic11. 15%
Increased prevalence of Allergic
Rhinitis, Otitis Media and
Sinusitis.
Dr. H. Paramesh; Indian Journal of Paediatrics, 2002; 69(4): 309-312
H.Paramesh I.A.P Text book of Pediatrics -2013
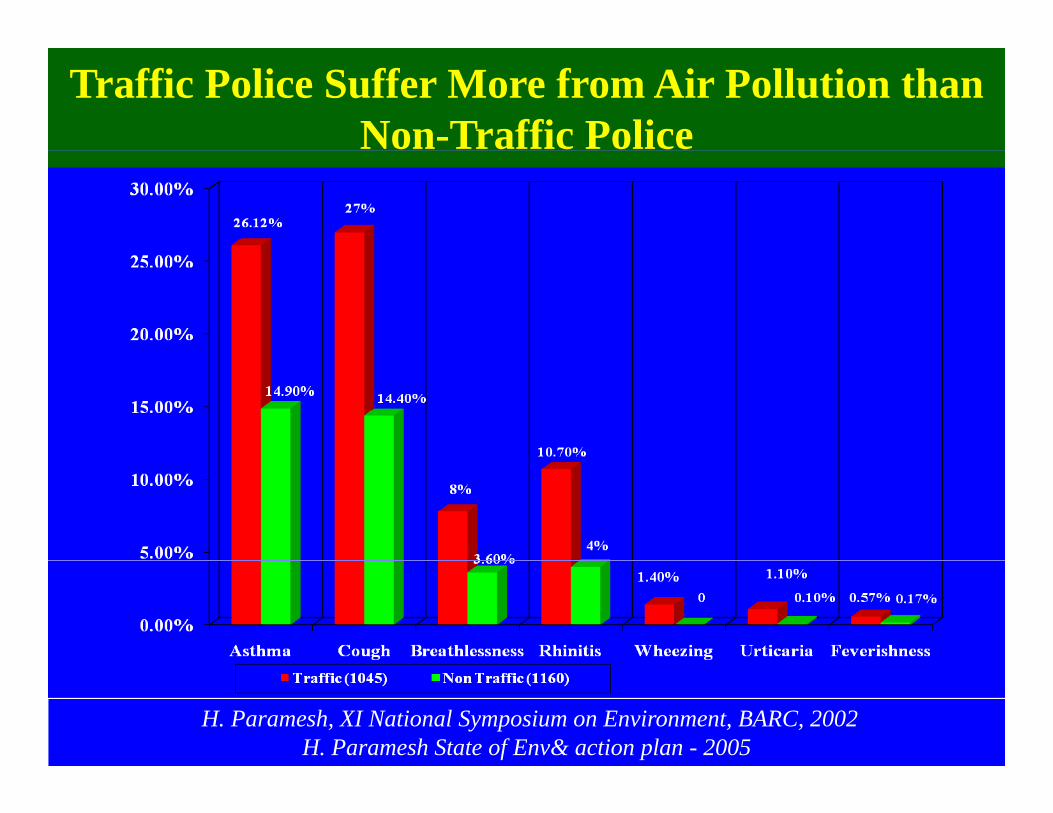
Traffic Police Suffer More from Air Pollution than Non-Traffic Police
H. Paramesh, XI National Symposium on Environment, BARC, 2002H. Paramesh State of Env& action plan - 2005

Distance of living away from the center of the city / asthmacity / asthma
70Nearly 2 ½ times less
50
60 69.2
58.9
suffering of they live 20Km away from the center of the city
30
40
10
20 27.8
2 3 0 8
23.1
0
01-10 Km 10-20 Km 20-30 Km 30-40 Km
2.3 0.810.8 7.5
Traffic Police Non Traffic PoliceSource - H. Paramesh, XI National Symposium on Environment 2002
H. Paramesh State of Environment & action plan - 2005
Traffic Police Non Traffic Police
BARC

E.R visits for Wheezing During Diwali (Light) Festival increased by 100%
Mean Changes in So2 Levels (ppm)increased by 100% (ppm)
Before DiwaliDuring DiwaliAfter Diwali
56
m )
234
vels
( in
ppm
-101
So2 le
vBefore Diwali
During Diwali
After Diwali
P Value : 0.064Ambient SO2 levels reached valuesAmbient SO2 levels reached values 200 times above the safety limits
recommended by WHO H Paramesh 5th Intnl conft env & health - 2010H Paramesh . I.A.P Text book of Pediatric - 2013
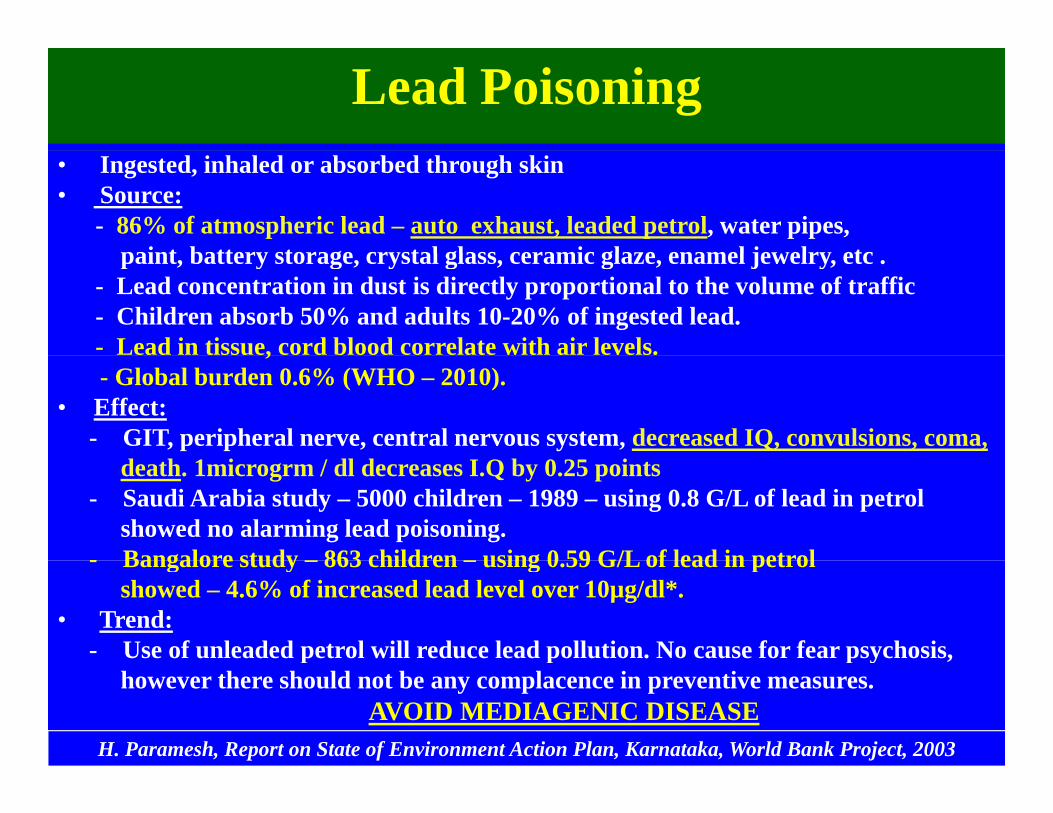
Lead Poisoning• Ingested, inhaled or absorbed through skin• Source:
- 86% of atmospheric lead – auto exhaust, leaded petrol, water pipes,paint battery storage crystal glass ceramic glaze enamel jewelry etcpaint, battery storage, crystal glass, ceramic glaze, enamel jewelry, etc .
- Lead concentration in dust is directly proportional to the volume of traffic - Children absorb 50% and adults 10-20% of ingested lead.- Lead in tissue, cord blood correlate with air levels.,- Global burden 0.6% (WHO – 2010).
• Effect:- GIT, peripheral nerve, central nervous system, decreased IQ, convulsions, coma,
death. 1microgrm / dl decreases I.Q by 0.25 points- Saudi Arabia study – 5000 children – 1989 – using 0.8 G/L of lead in petrol
showed no alarming lead poisoning.- Bangalore study – 863 children – using 0 59 G/L of lead in petrol- Bangalore study – 863 children – using 0.59 G/L of lead in petrol
showed – 4.6% of increased lead level over 10µg/dl*.• Trend:
- Use of unleaded petrol will reduce lead pollution. No cause for fear psychosis, p p p yhowever there should not be any complacence in preventive measures.
AVOID MEDIAGENIC DISEASEH. Paramesh, Report on State of Environment Action Plan, Karnataka, World Bank Project, 2003

IrritantsAero‐biologicals
Indoor Air Pollution
Cigarette smokeo 1994 - 6.0%
Dust mite - 50%5000/g
o 1999 - 7.5% o 2004 - 7.9%
Mosquito Coil - 5 0%
Cockroach - 25.00%
Fungi Pollens - 07.50%Mosquito Coil - 5.0%
° 2002 - 5.0%° 2010 - 7.9%
Other smokes
Pets - 05.00% (2002)05.7% (2010)
Formaldehyde
Viruses - 40.00%
o RSV o Para influenza
Volatile organic compoundso Para influenzao Coronoo Adenoo Rhino
Food - 19.90%
H. Paramesh Indian Journal of Pediatrics – 2002 ,2006

Childhood Pets Linked to Lower All Ri kAllergy Risk
Family pets, in particular dogs, d t b d t t
Pets are not the cause for i d l fneed not be removed to prevent
allergies and in fact may protect against allergies.
increased prevalence of asthma. They are stress
busters
Mclance Matheson etal Journal of Allergy and clinical immunology online July 13,2011
H. Paramesh Indian Jourl of Ped - 2002

Ventilation & Asthma. no - 418
22%The prevelence of asthma in ill ventilated house
2522%P=<0.001
is nearly 3 times more
15
20
8%
10
8%
P=<0.001
5
0 WELL Ventilated ILL Ventilated
Paramesh H Cherian E 5th International Conference on Environment and Childrens health 2010Paramesh I.A.P text book of Ped - 2013

Cigarette Smoking Parents V/s Asthma Prevelence in Children no 418Prevelence in Children no - 418
Nearly 3 fold increase in asthma in a home
40%
50%with tobacco smoking parent
40%
30%
20%
22.8%
10%
20%
8.0%
P 0.018 P 0.004Smoking Non Smoking
Paramesh H Cherian E 5th International Conference on Environment and Childrens health 201Paramesh H. I.A.P Text book of Ped - 2013

Cooking Fuel V/s Prevelence of Asthma in Childrenin Children
55% 47 8% 46 6%48.8%
40%45%50%
47.8% 46.6% No – 418
There is nearly 20 times more asthma with the use of non
20%25%30%35%
asthma with the use of non commercial cooking fuel.
5%10%15%20%
8.3%2.6% 1.2%
5%
Dung Cakes
0.0010.0010.043P< 0.001P< 0.001P< .001
Firewood Kerosine Gas ElectricityAgri WasteDung Cakes Firewood Kerosine Gas Electricity
Paramesh H Cherian E 5th International Conference on Environment and Childrens health 201Paramesh H. I.A.P Text of Ped - 2013
Agri Waste

Asthma v/s Dietary Habits y
17.9%Vegetarians suffer nearly 4% less Asthma than Non vegetarians
No 418
14
16
1814.3%
Asthma than Non vegetarians
10
12
14
269161
4
6
8161
0
2
Veg Non veg gP<0.482
gP<0.545
H. Paramesh I.A.P text book of Ped - 2013

Incidence of Chronic Cough
12
8
10
10.5%
4
6 8%
0
2
1999 20101999 2010
Paramesh H Ped today 1999Paramesh H Cherian E 5th Intnl Conf Env child health 2010
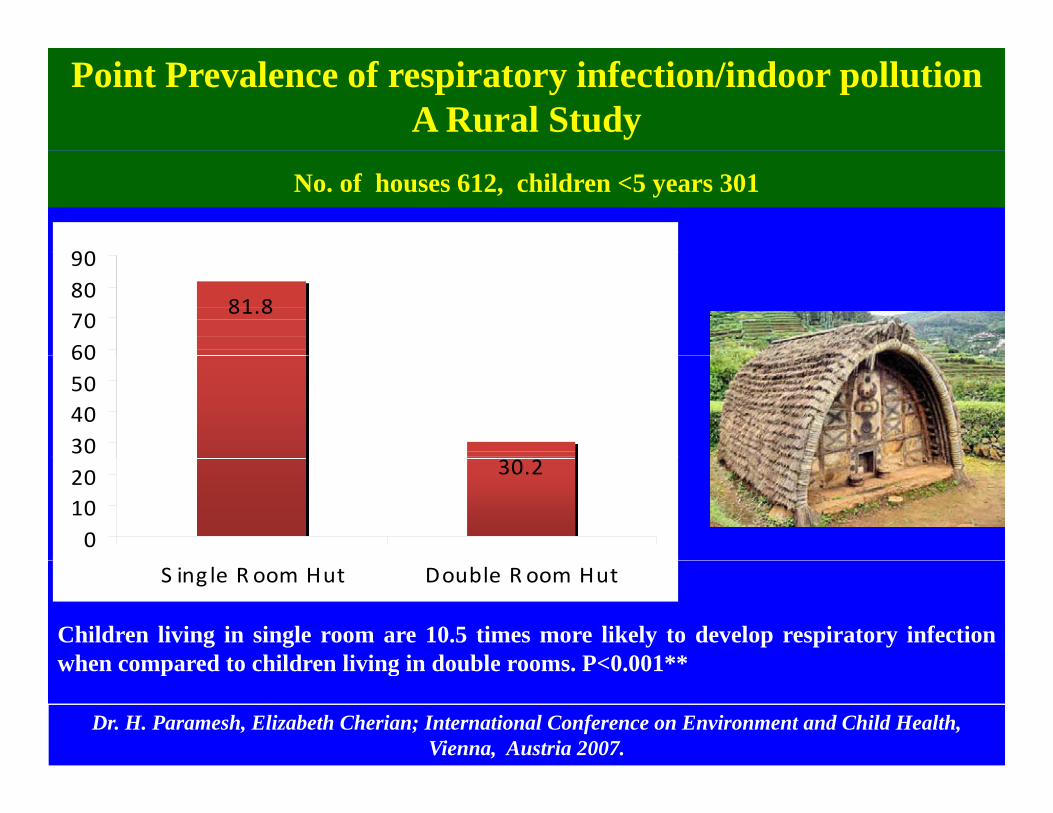
Point Prevalence of respiratory infection/indoor pollutionA Rural Study
No. of houses 612, children <5 years 301
90
81.8
60708090
30405060
30.2
01020
Children living in single room are 10.5 times more likely to develop respiratory infectionwhen compared to children living in double rooms P<0 001**
S ing le R oom Hut Double R oom Hut
when compared to children living in double rooms. P<0.001**
Dr. H. Paramesh, Elizabeth Cherian; International Conference on Environment and Child Health, Vienna, Austria 2007.

Take home messageAir Pollution increases the non communicable respiratory diseases significantly. p y g y
The economic and social burden is horrendous
The environmental degradation is unimaginable
We all have to pay thru our nose, lungs and heart
It is time that the preventive measures are taken atIt is time that the preventive measures are taken at
the earliest, while we are moving forward with less
air pollution which can be sustained.

The Impact of Our Research Work ili d b• Utilized by Supreme Court of India-In appointing Bhurelal Committee to clean up the cities in a time-bound fashion
- Instructions to builders to follow strict guidelines at school environment
• Police personnel study discussed in the Parliament for remedial measures of the air pollution
• Brining legislation to ban tobacco smoke in public places in Karnatakag eg s at o to ba tobacco s o e pub c p aces a ata a• Our work been citied various peer reviewed journals and text books • Instituted lung functions, pulse oximetry and audiometry to all the
employees and public who have been affected by all industries in Karnataka
• Instituted measurement of ozone, ultra-fine-particles(2.5micorons) andInstituted measurement of ozone, ultra fine particles(2.5micorons) and sulphate particles by Bangalore Metro Rail system

What Comes out: Clean up the mess. p

We hold our future in our handsand it is our children
Poster Contest by HRIDAY with support from WHO SEARO
I end with this beautiful reminder to us from a child in India. We must recognize theenvironmental risks to our Politically powerless children and assume our responsibilities forpreventing them, because we hold our future in our hands — and it is our children.
“ A Healthy Breath will always bringHealthy life”
“E h T h d“Each one Teach one and plant one tree”


![WELCOME [cdn.cseindia.org]cdn.cseindia.org/userfiles/20160404-mainstreaming-citywide-sanitati… · Sanitation: • India is The open defecation capital of the world. • 50% of population](https://img.dokumen.tips/doc/110x75/5f6845450dfc88272f3d8beb/welcome-cdn-cdn-sanitation-a-india-is-the-open-defecation-capital-of-the.jpg)