Embed Size (px)
Citation preview

Dr. Michael PakkoChief Economist and State Economic ForecasterInstitute for Economic Advancement, UALR
The Arkansas Economic Outlook
October 15, 2014
Disclaimer: The views expressed are my own, and do not necessarily reflect the positions of the Federal Reserve Bank of St. Louis, the Federal Reserve System, the University of Arkansas at Little Rock, the University of Arkansas System, or the Institute for Economic Advancement.

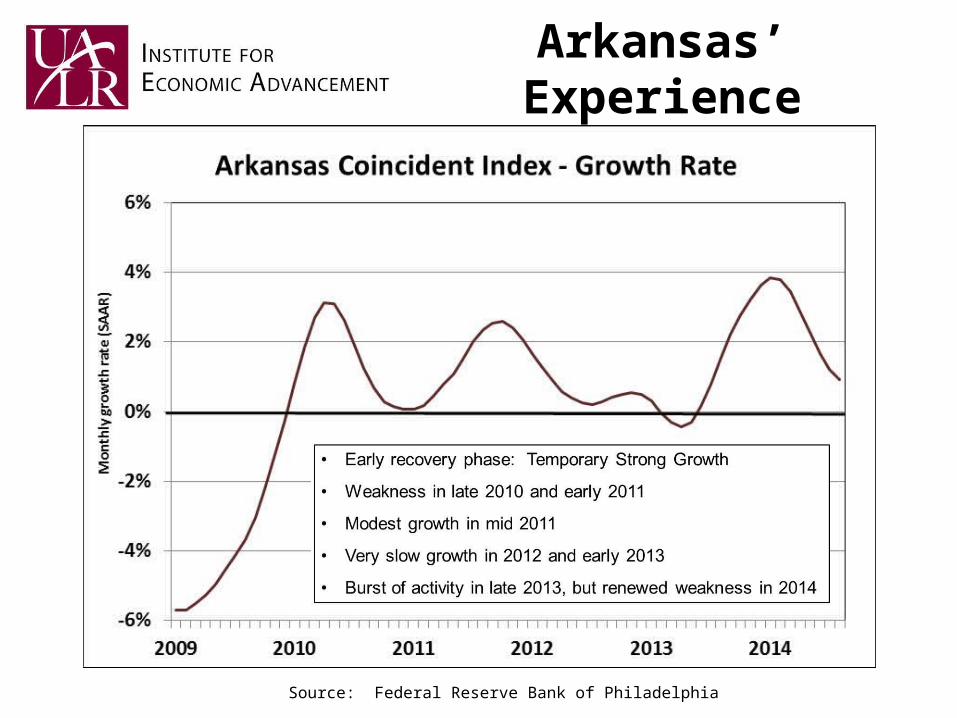
Arkansas’ Experience
Source: Federal Reserve Bank of Philadelphia
Arkansas’ Experience
Source: Federal Reserve Bank of Philadelphia

Arkansas’ Experience
• By some measures, Arkansas is faring better than the rest of the nation
E.g., Personal Income, Proprietors’ Income, Dividends & Interest, etc.
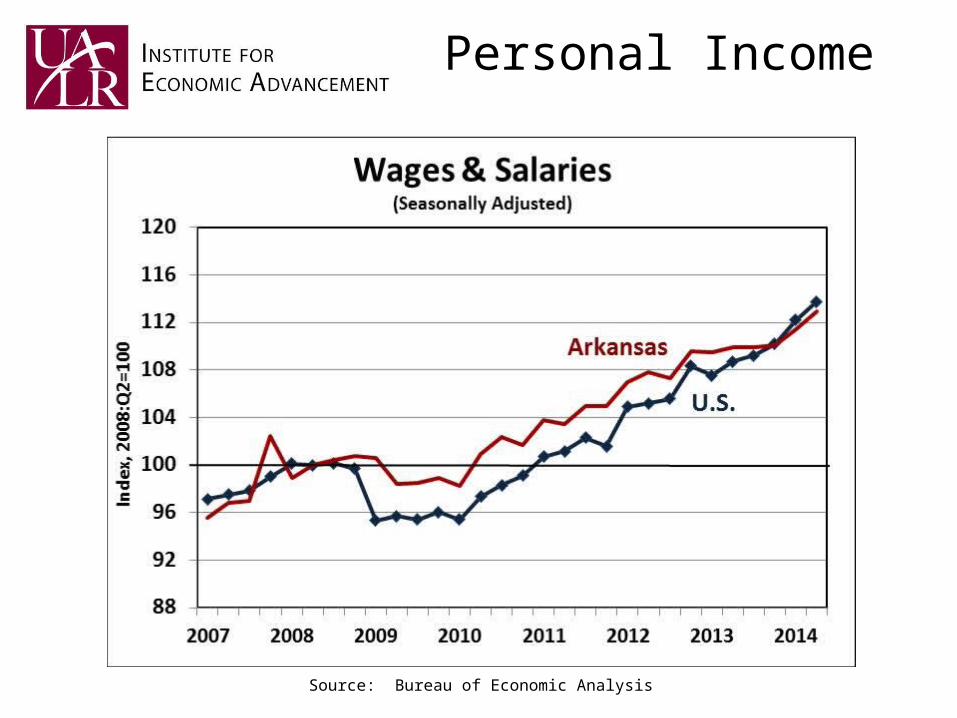
• By other measures, Arkansas is lagging behind E.g., Employment, Wages and Salaries, Labor
Force Participation
• Common element: Weak Labor Market Conditions(even weaker than we thought)
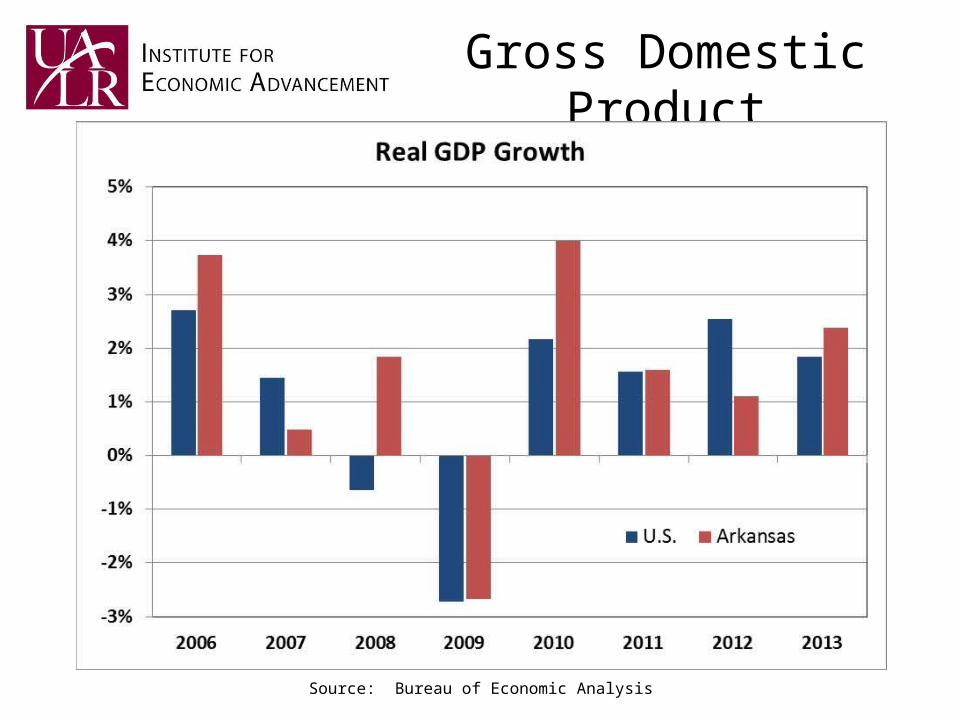
Gross Domestic Product
Source: Bureau of Economic Analysis

Personal Income
Source: Bureau of Economic Analysis

Personal Income
Source: Bureau of Economic Analysis

Personal Income
Source: Bureau of Economic Analysis

Personal Income
Source: Bureau of Economic Analysis
Personal Income
Source: Bureau of Economic Analysis

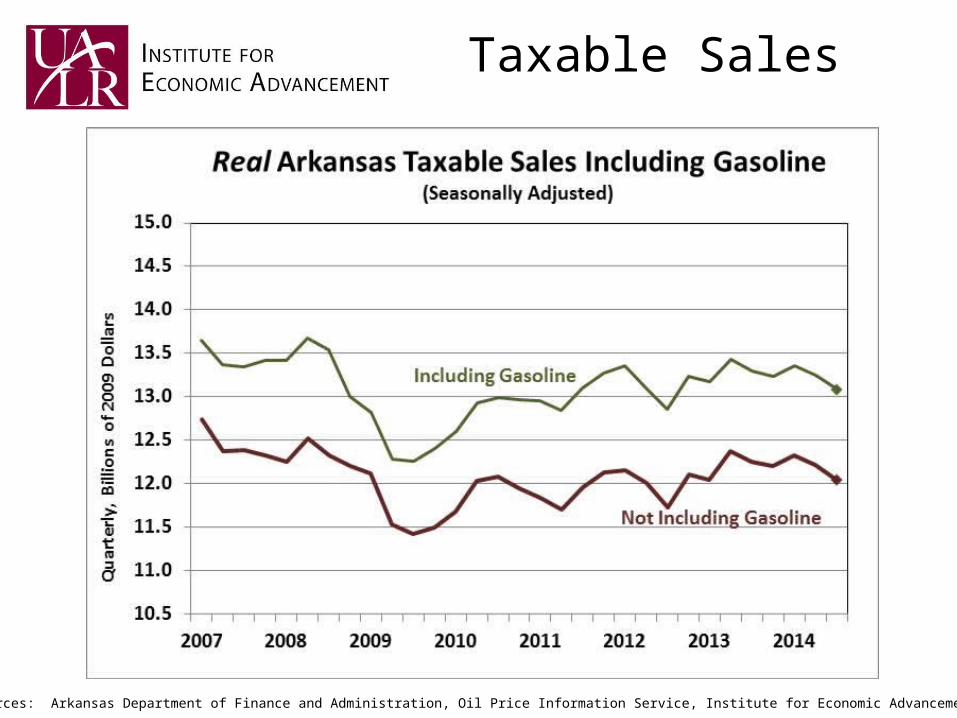
Taxable Sales
Sources: Arkansas Department of Finance and Administration, Oil Price Information Service, Institute for Economic Advancement.
Taxable Sales
Sources: Arkansas Department of Finance and Administration, Oil Price Information Service, Institute for Economic Advancement.

Taxable Sales
Sources: Arkansas Department of Finance and Administration, Oil Price Information Service, Institute for Economic Advancement.

Sources: Arkansas Realtors® Association, Institute for Economic Advancement.
Home Sales

Sources: Arkansas Realtors® Association, Institute for Economic Advancement.
Home Sales

Unemployment
Source: Bureau of Labor Statistics.

Unemployment
Source: Bureau of Labor Statistics.
52
54
56
58
60
62
64
2006 2007 2008 2009 2010 2011 2012 2013 2014
Perc
ent
Employment/Population Ratios
U.S.
Arkansas
56
58
60
62
64
66
68
2006 2007 2008 2009 2010 2011 2012 2013 2014
Perc
ent
Labor Force Participation Rates
U.S.
Arkansas

Unemployment
Source: Bureau of Labor Statistics.

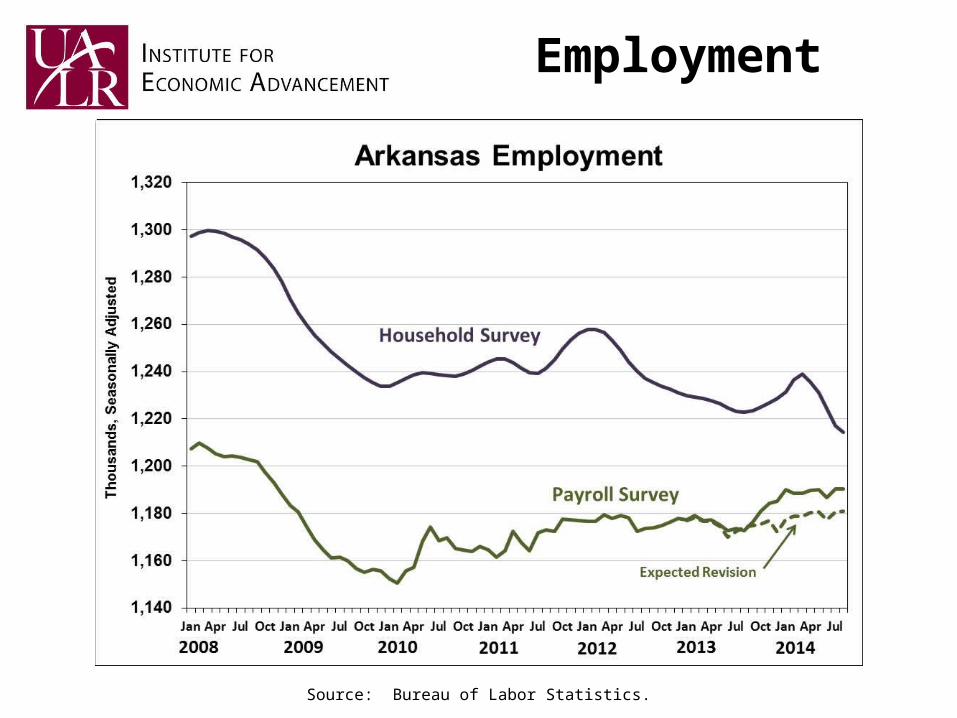
Employment
Source: Bureau of Labor Statistics.

Employment
Source: Bureau of Labor Statistics.

Employment
Source: Bureau of Labor Statistics.
Employment
Source: Bureau of Labor Statistics.

Employment
Source: Bureau of Labor Statistics.

Economic Forecasts
"Prediction is very difficult, especially about the future."- Niels Bohr , Nobel prize-winning physicist.
Forecast Methodology
Model: Arkansas Baseline from Moody’s Analytics. Part of a structural econometric model of the U.S. Economy Linked to US forecast, with relationships estimated by
sector Baseline forecast from Moody’s macroeconomic U.S.
modelAlternative Forecast Paths:
Moody’s Wells Fargo Wall Street Journal Blue Chip Consensus NABE

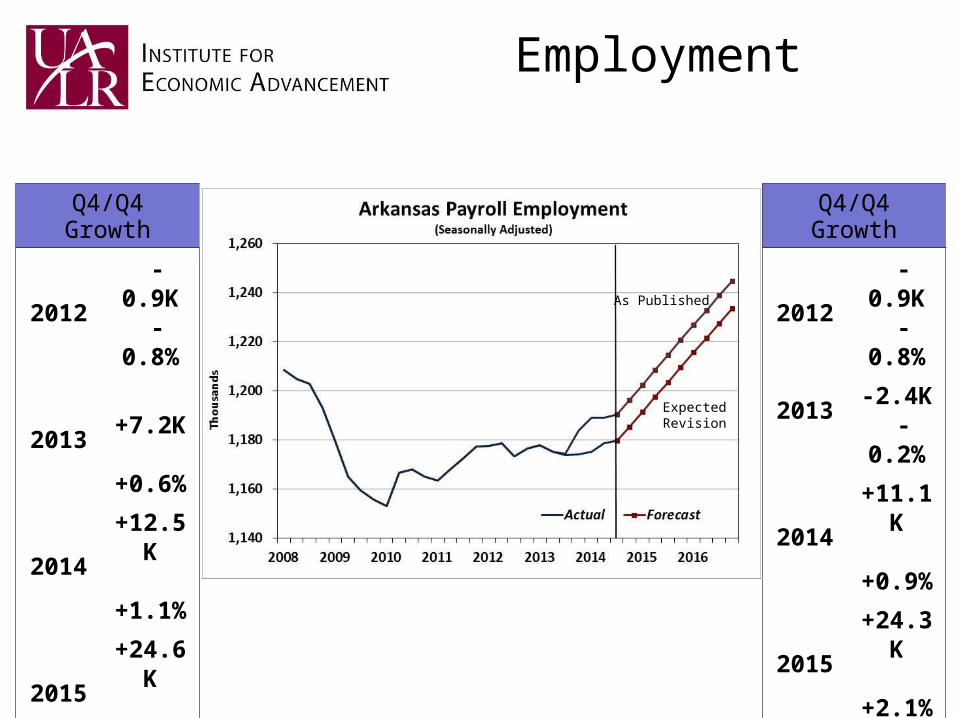
Employment
Q4/Q4 Growth
2012 -0.9K -0.8%
2013 +7.2K +0.6%
2014+12.5K +1.1%
2015+24.6K +2.1%
2016+24.2K +2.0%

Employment
Q4/Q4 Growth
2012 -0.9K -0.8%
2013 -2.4K -0.2%
2014+11.1K +0.9%
2015+24.3K +2.1%
2016+24.0K +2.0%
Including expectedrevision in 2015
Employment
Q4/Q4 Growth
2012 -0.9K -0.8%
2013 +7.2K +0.6%
2014+12.5K +1.1%
2015+24.6K +2.1%
2016+24.2K +2.0%
Q4/Q4 Growth
2012 -0.9K -0.8%
2013 -2.4K -0.2%
2014+11.1K +0.9%
2015+24.3K +2.1%
2016+24.0K +2.0%
As Published
Expected Revision

Unemployment
End of Year (Q4)
2013 7.5
2014 6.0
2015 5.5
2016 5.3

Real GDP

Real GDP
Q4/Q4 Growth (%)
2013 4.1
2014 1.5
2015 2.1
2016 2.0

Personal Income
Q4/Q4 Growth (%)
2013 -1.9
2014 4.1
2015 5.4
2016 5.7
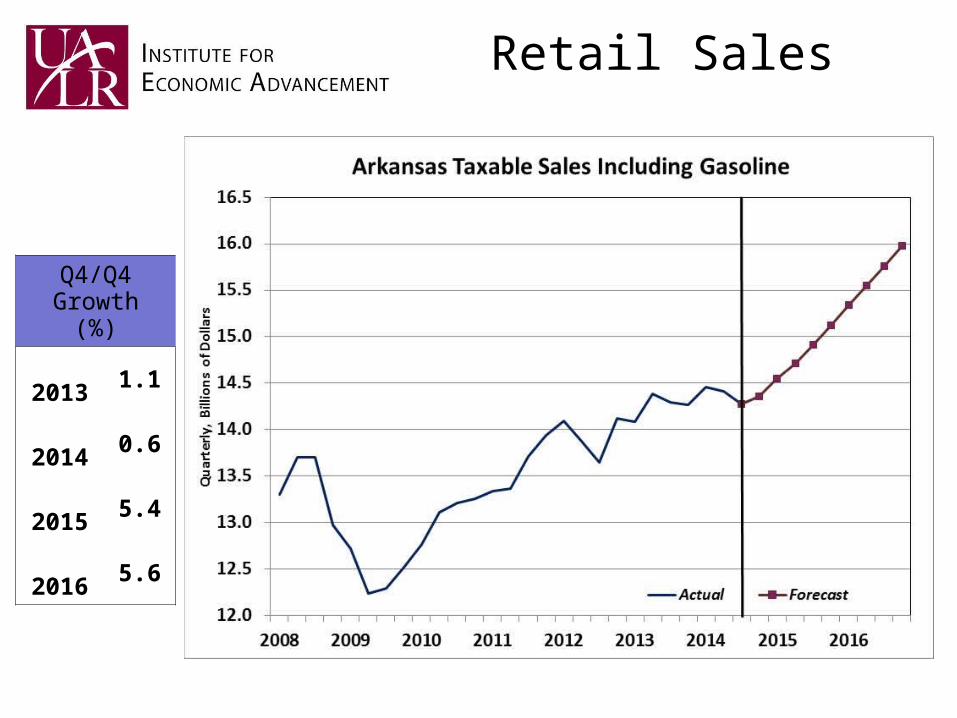
Retail Sales
Q4/Q4 Growth (%)
2013 1.1
2014 0.6
2015 5.4
2016 5.6

Home Sales
Sales(Pct. Change)
201223.3K -0.2%
2013 25.7K 10.1%
201427.8K 8.4%
201530.6K 9.9%
201632.4K 6.0%
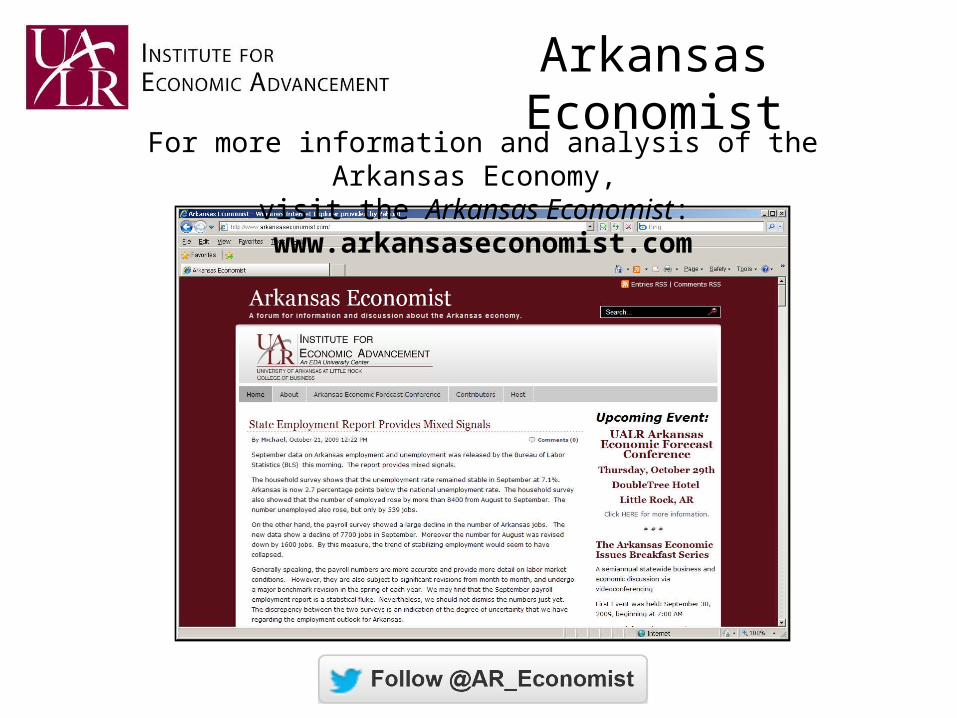
Arkansas Economist
For more information and analysis of the Arkansas Economy, visit the Arkansas Economist: www.arkansaseconomist.com