Embed Size (px)
Citation preview
Dr. Fowler AFM Unit 8-5Linear Correlation
• Be able to construct a scatterplot to show the relationship between two variables.
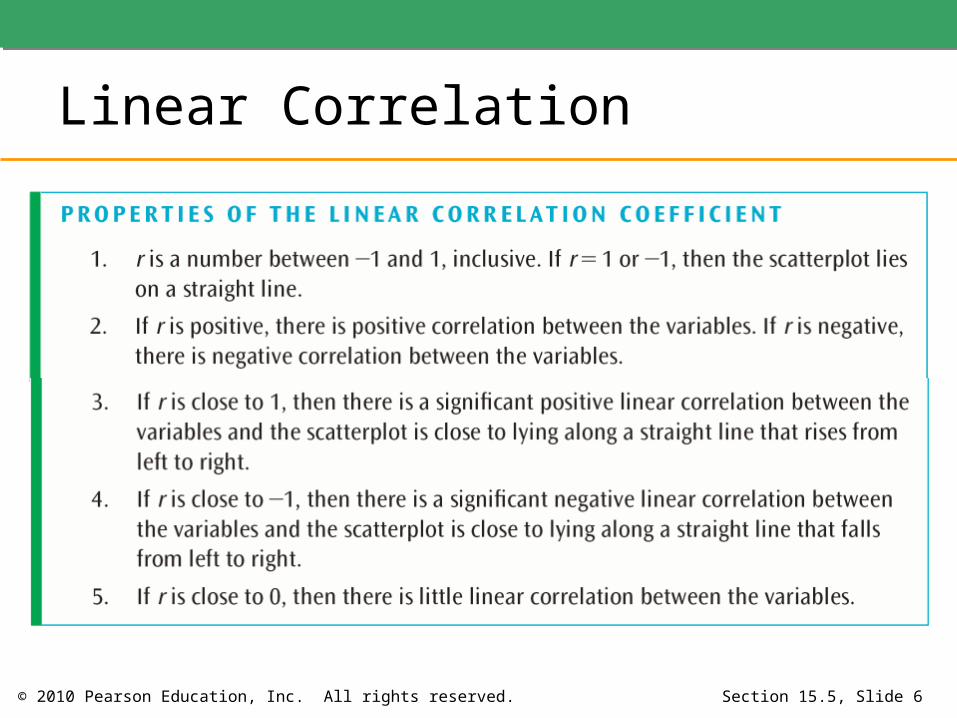
• Understand the properties of the linear correlation coefficient.
• Use linear regression to find the line ofbest fit for a set of data points.

© 2010 Pearson Education, Inc. All rights reserved. Section 15.5, Slide 3
Scatterplots
To determine whether there is a correlation between two variables, we obtain pairs of data, called data points, relating the first variable to the second.
To understand such data, we plot data points in a graph called a scatterplot.
Write all Notes – All slides today – notes are short
© 2010 Pearson Education, Inc. All rights reserved. Section 15.5, Slide 4
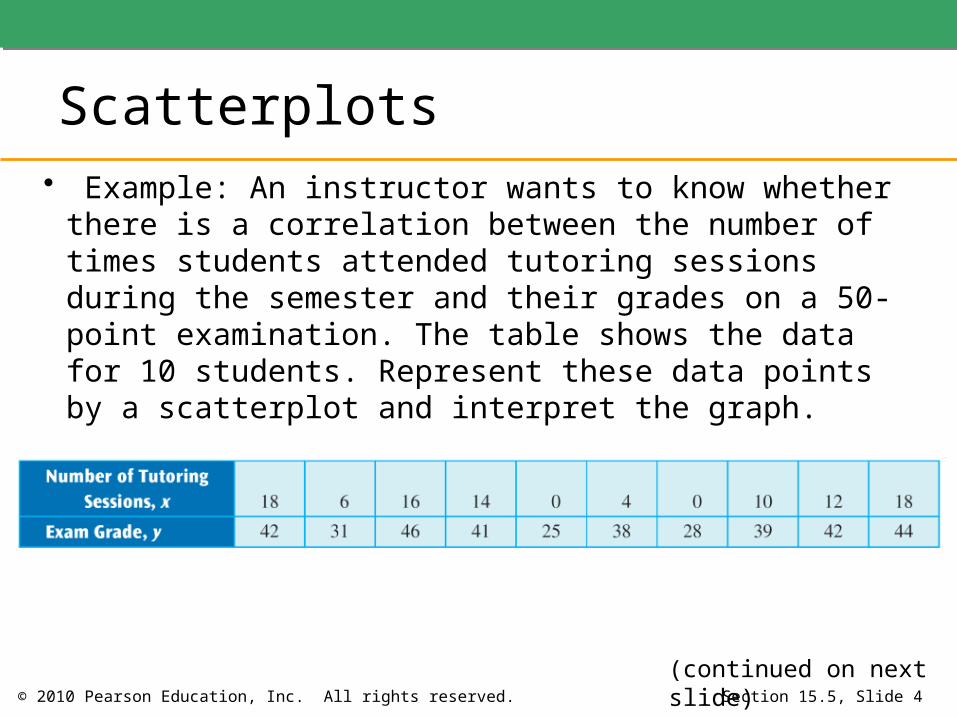
• Example: An instructor wants to know whether there is a correlation between the number of times students attended tutoring sessions during the semester and their grades on a 50-point examination. The table shows the data for 10 students. Represent these data points by a scatterplot and interpret the graph.
Scatterplots
(continued on next slide)
Section 15.5, Slide 5
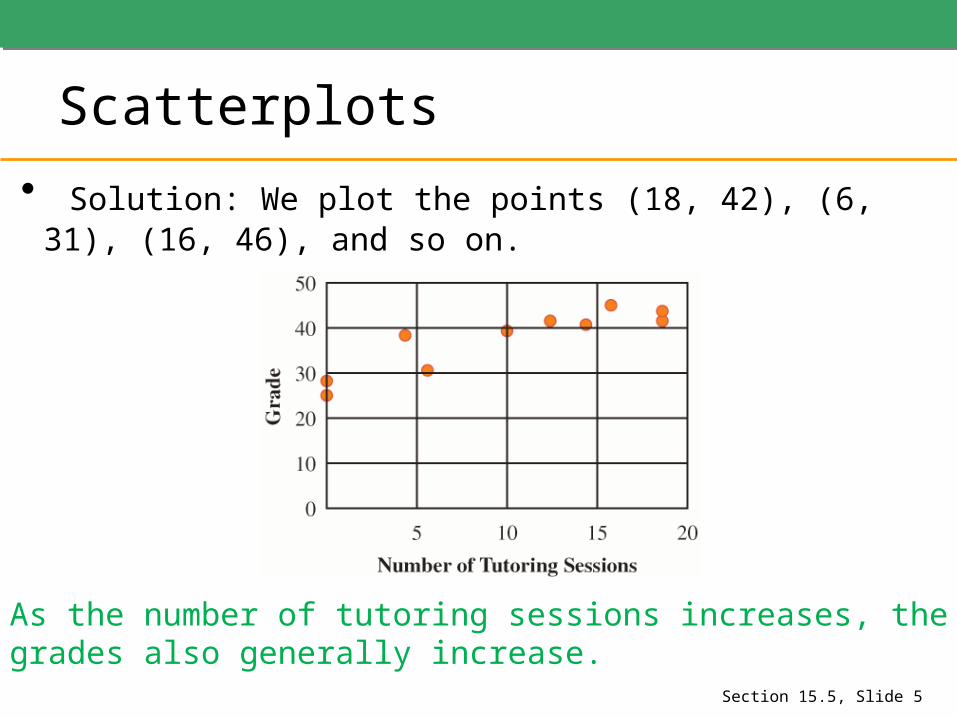
• Solution: We plot the points (18, 42), (6, 31), (16, 46), and so on.
Scatterplots
As the number of tutoring sessions increases, the grades also generally increase.
© 2010 Pearson Education, Inc. All rights reserved. Section 15.5, Slide 6
Linear Correlation
Section 15.5, Slide 7
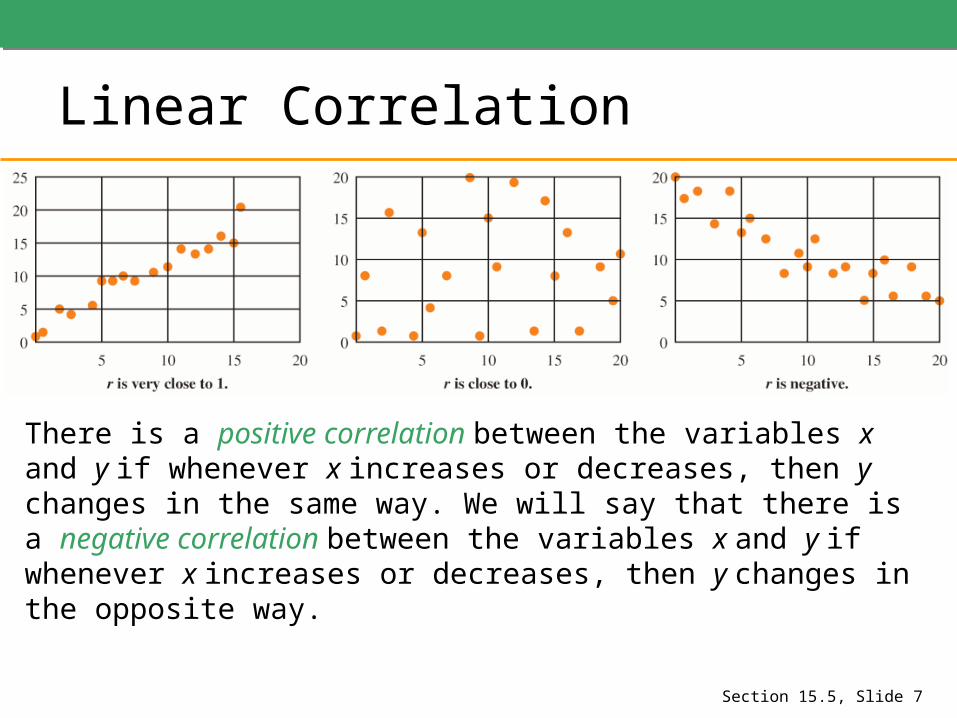
Linear Correlation
There is a positive correlation between the variables x and y if whenever x increases or decreases, then y changes in the same way. We will say that there is a negative correlation between the variables x and y if whenever x increases or decreases, then y changes in the opposite way.
Section 15.5, Slide 8
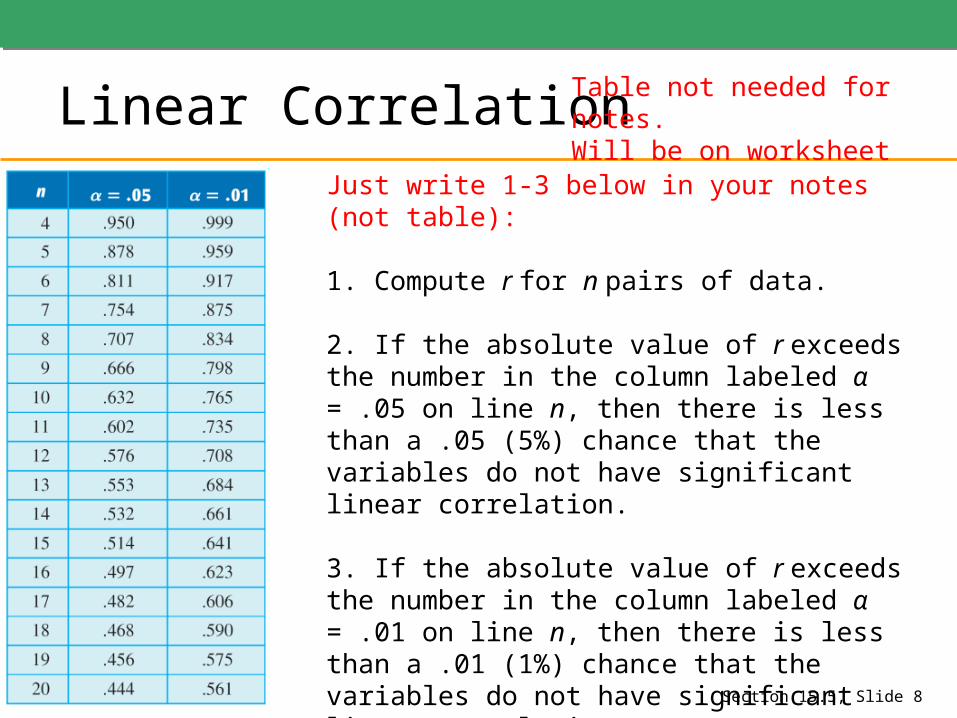
Linear CorrelationJust write 1-3 below in your notes (not table):
1. Compute r for n pairs of data.
2. If the absolute value of r exceeds the number in the column labeled α = .05 on line n, then there is less than a .05 (5%) chance that the variables do not have significant linear correlation.
3. If the absolute value of r exceeds the number in the column labeled α = .01 on line n, then there is less than a .01 (1%) chance that the variables do not have significant linear correlation.
Table not needed for notes.Will be on worksheet

Section 15.5, Slide 9
Linear Correlation
Linear correlation exists between two variables if, when graphed, the points in the graph tend to lie in a straight line. The linear correlation coefficient allows us to compute to what degree the points of a scatterplot lie along a straight line.
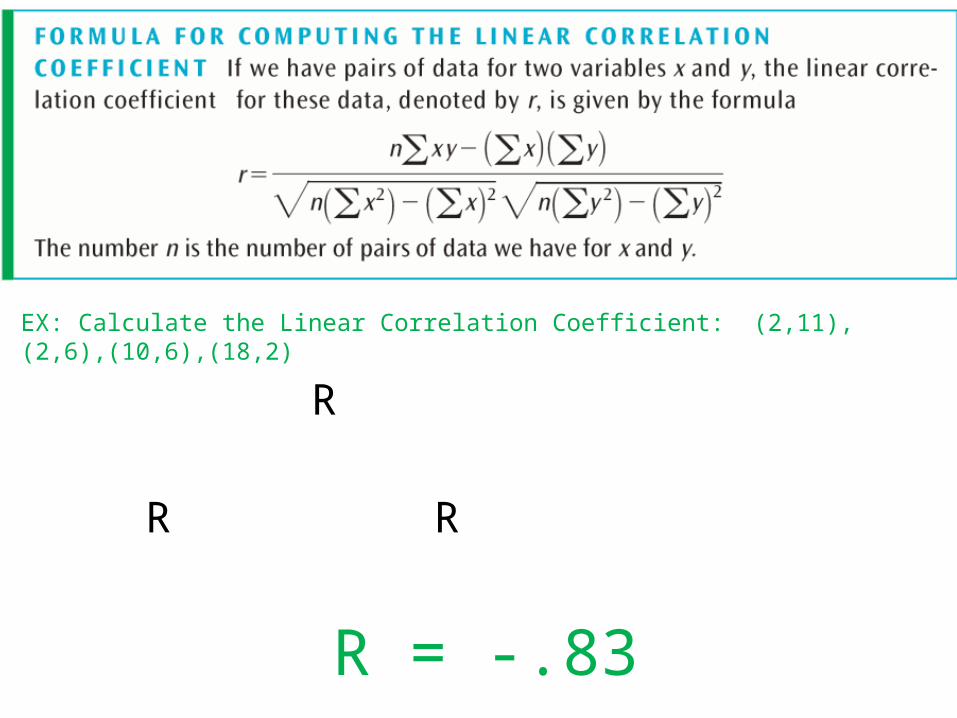
EX: Calculate the Linear Correlation Coefficient: (2,11),(2,6),(10,6),(18,2)
R
R R
R = -.83
© 2010 Pearson Education, Inc. All rights reserved. Section 15.5, Slide 11
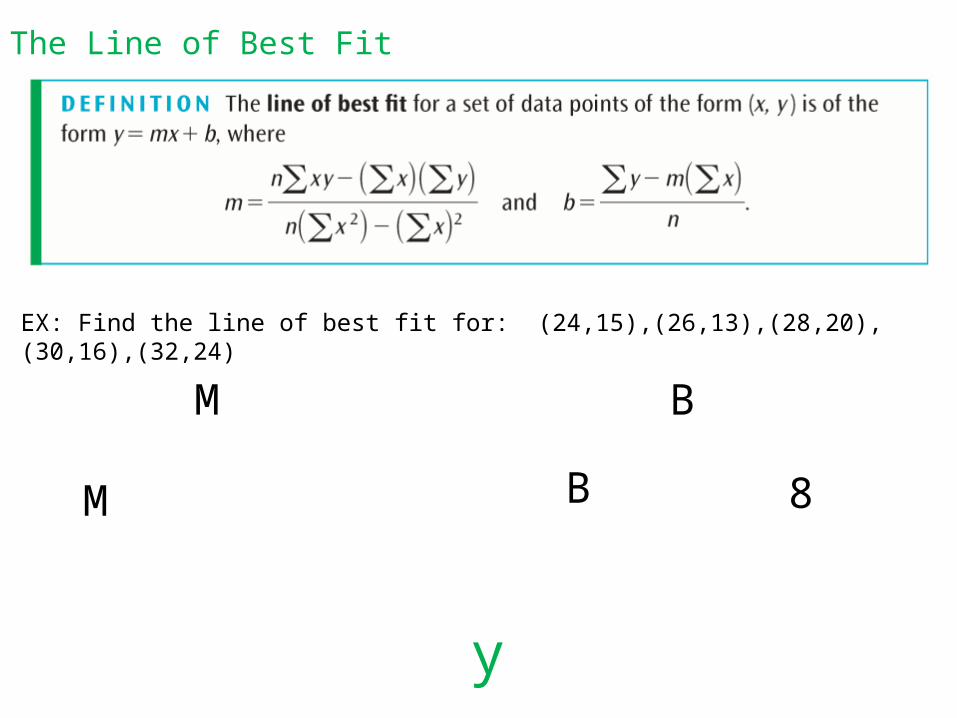
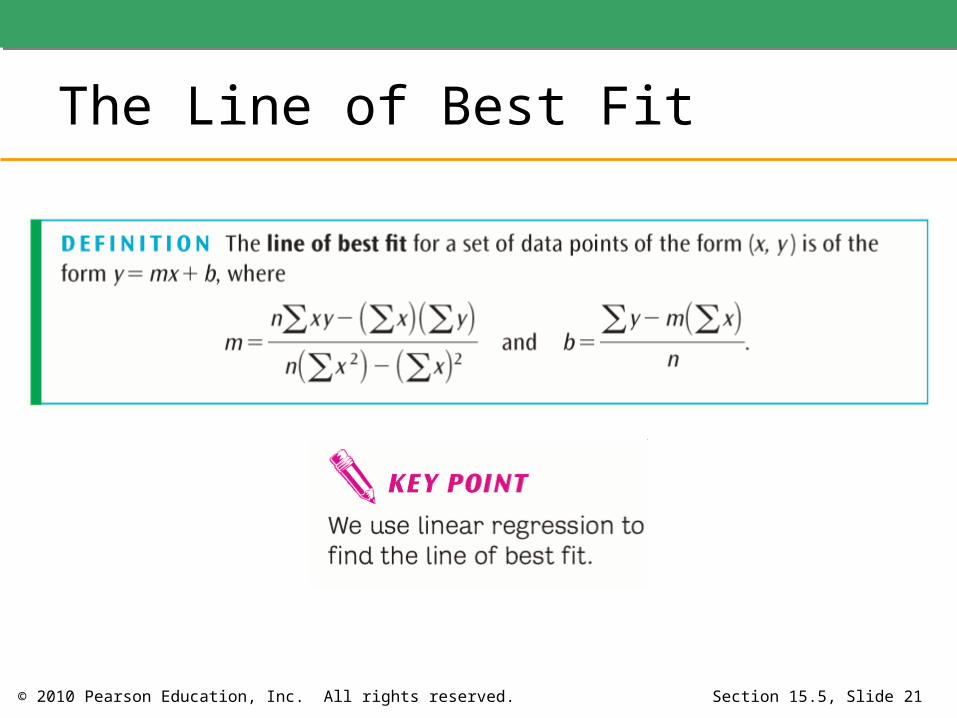
The Line of Best Fit
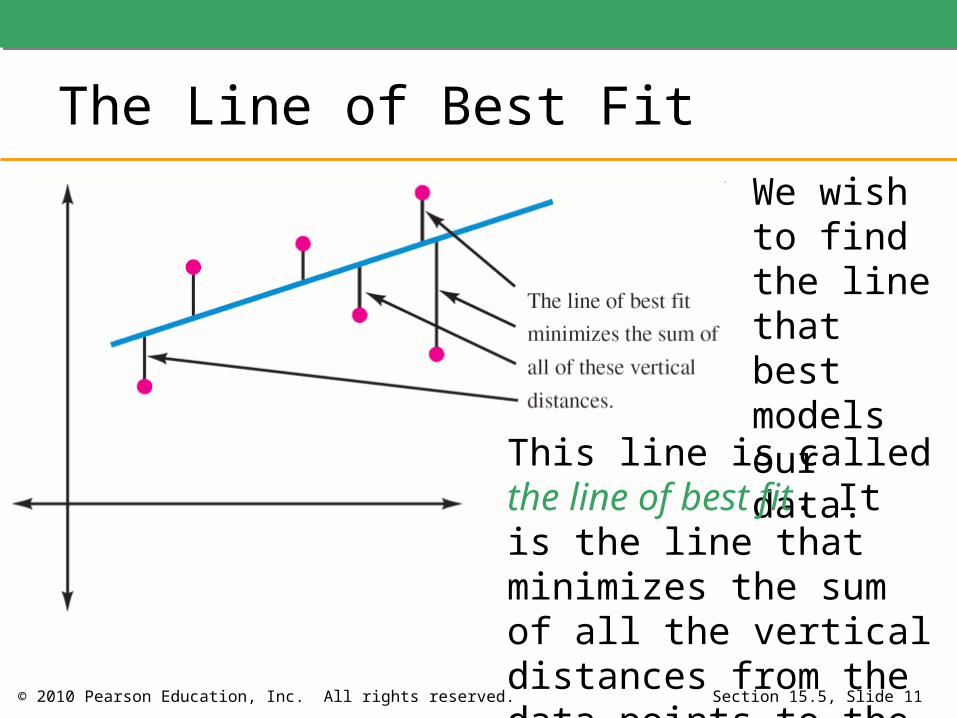
We wish to find the line that best models our data.
This line is called the line of best fit. It is the line that minimizes the sum of all the vertical distances from the data points to the line.
The Line of Best Fit
EX: Find the line of best fit for: (24,15),(26,13),(28,20),(30,16),(32,24)
M
M
B
B 8
y

Excellent Job !!!Well Done

Stop Notes for Today.Do Worksheet
Section 15.5, Slide 15
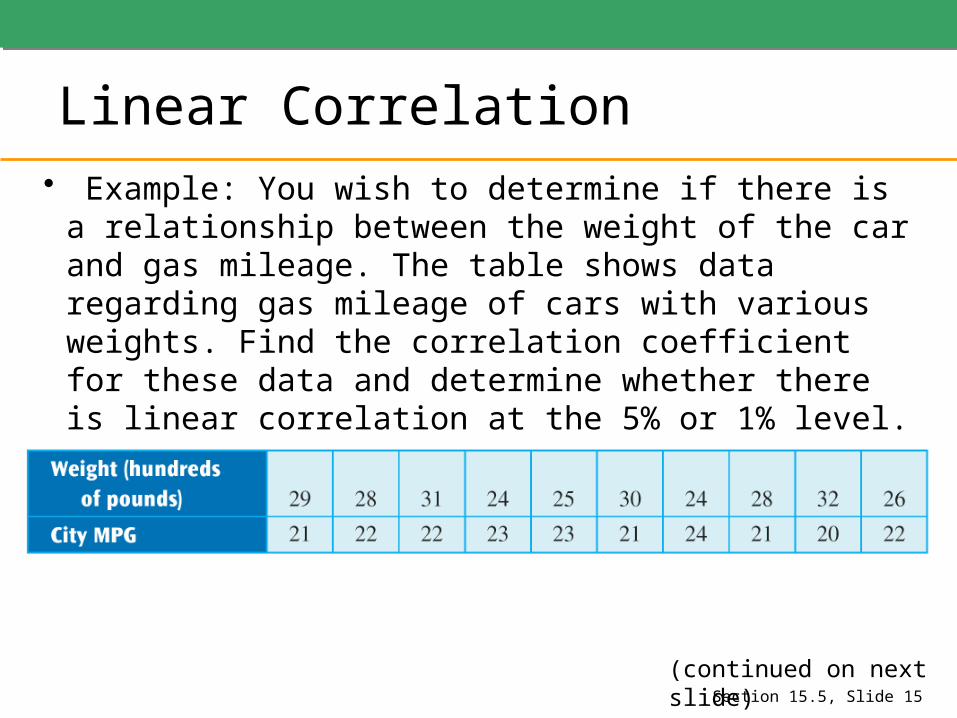
• Example: You wish to determine if there is a relationship between the weight of the car and gas mileage. The table shows data regarding gas mileage of cars with various weights. Find the correlation coefficient for these data and determine whether there is linear correlation at the 5% or 1% level.
Linear Correlation
(continued on next slide)
Section 15.5, Slide 16
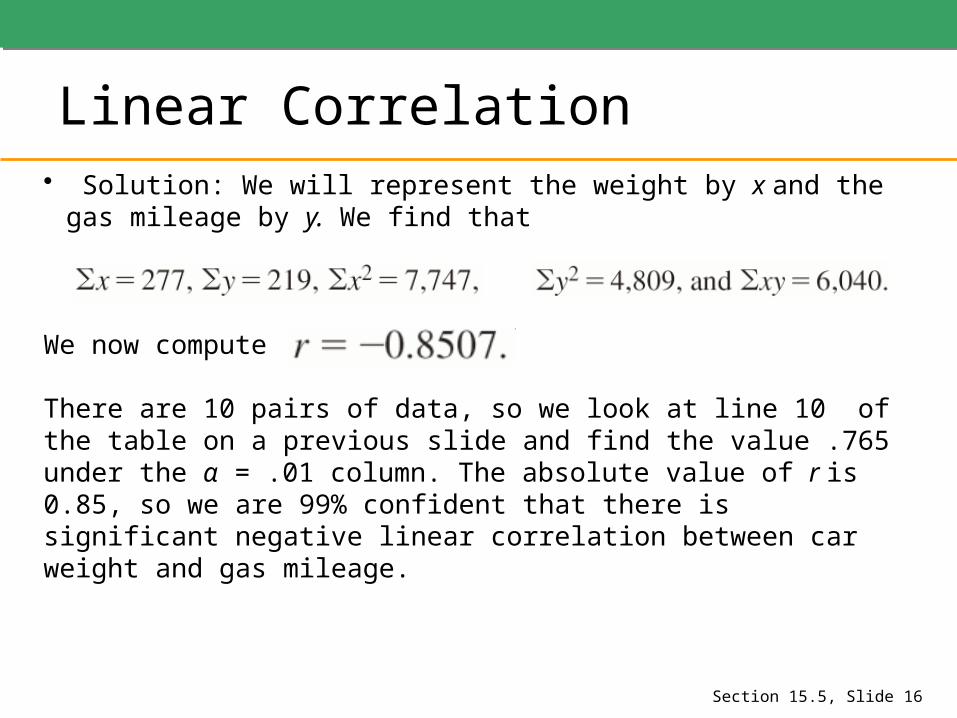
• Solution: We will represent the weight by x and the gas mileage by y. We find that
We now compute
There are 10 pairs of data, so we look at line 10 of the table on a previous slide and find the value .765 under the α = .01 column. The absolute value of r is 0.85, so we are 99% confident that there is significant negative linear correlation between car weight and gas mileage.
Linear Correlation
Section 15.5, Slide 17
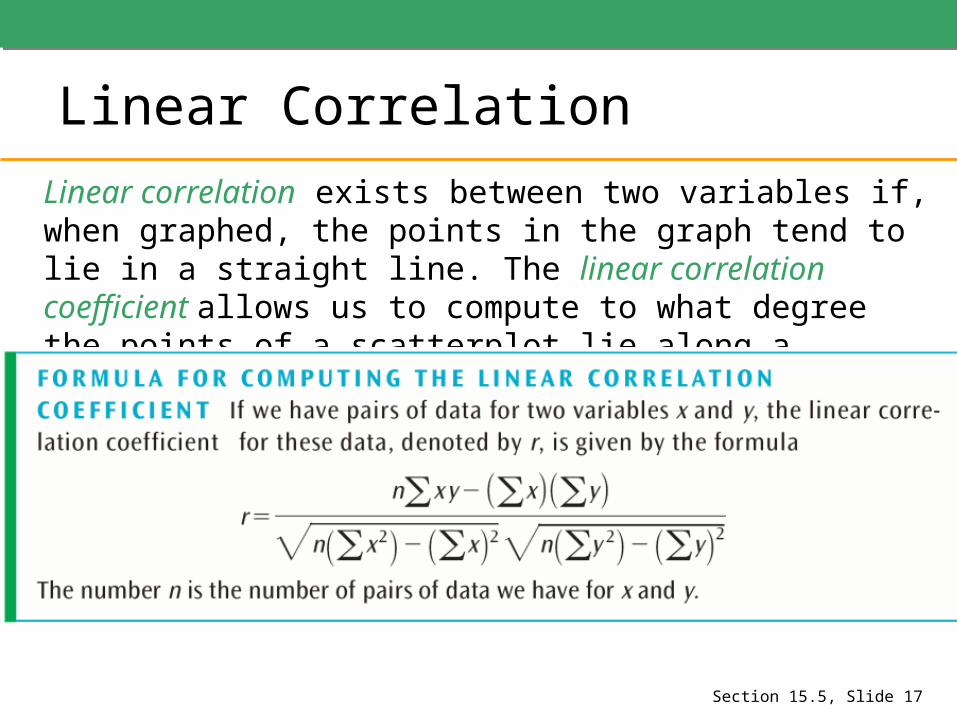
Linear Correlation
Linear correlation exists between two variables if, when graphed, the points in the graph tend to lie in a straight line. The linear correlation coefficient allows us to compute to what degree the points of a scatterplot lie along a straight line.
© 2010 Pearson Education, Inc. All rights reserved. Section 15.5, Slide 18
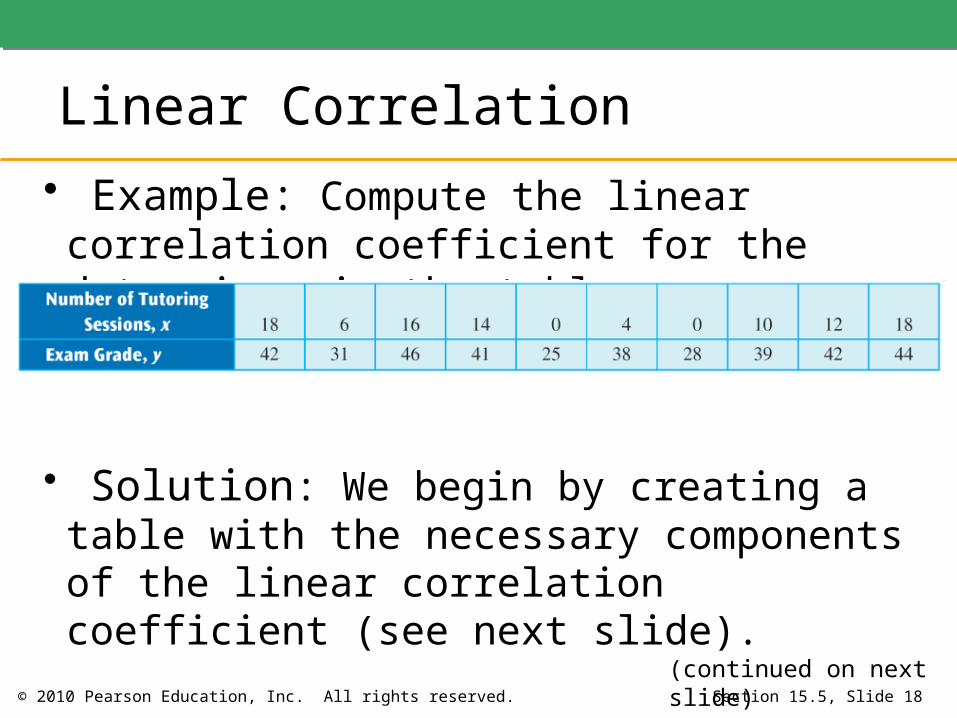
• Example: Compute the linear correlation coefficient for the data given in the table.
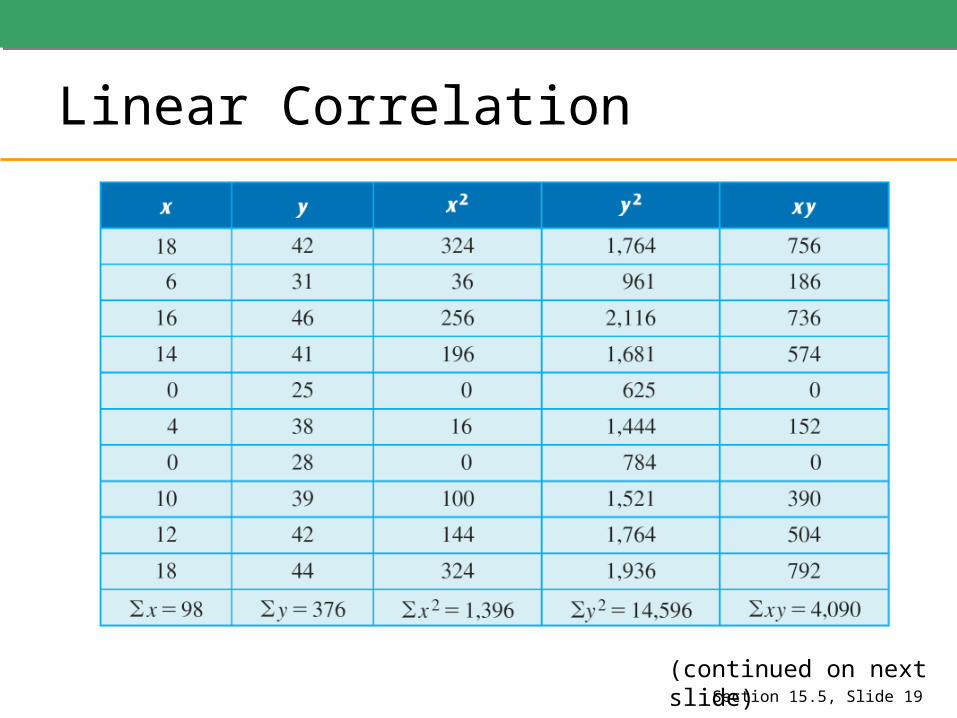
• Solution: We begin by creating a table with the necessary components of the linear correlation coefficient (see next slide).
Linear Correlation
(continued on next slide)
Section 15.5, Slide 19
Linear Correlation
(continued on next slide)
Section 15.5, Slide 20
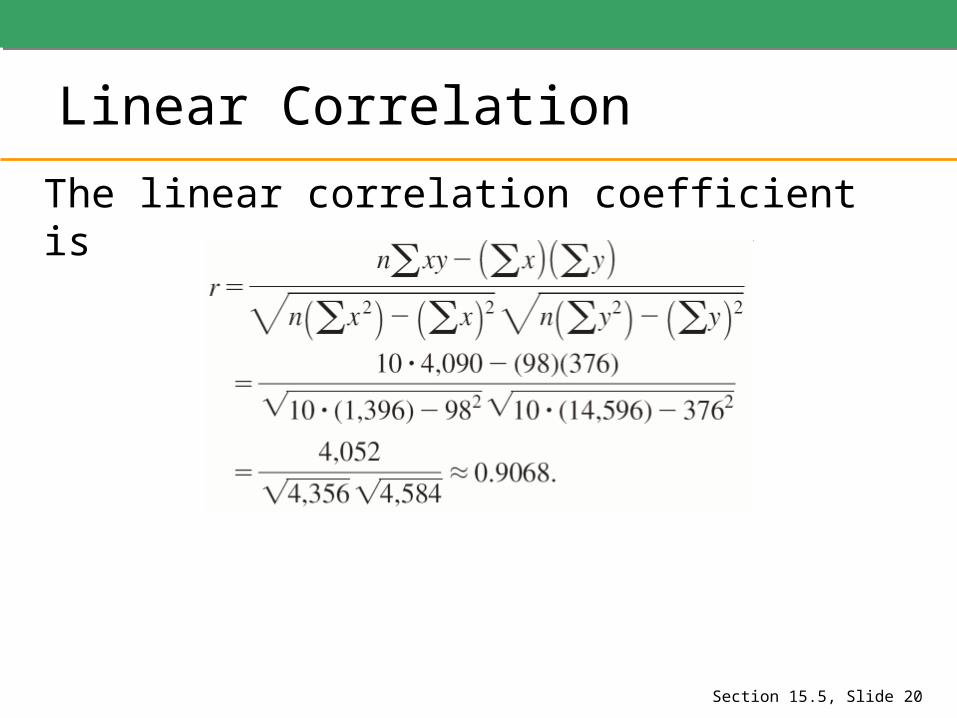
The linear correlation coefficient is
Linear Correlation
© 2010 Pearson Education, Inc. All rights reserved. Section 15.5, Slide 21
The Line of Best Fit
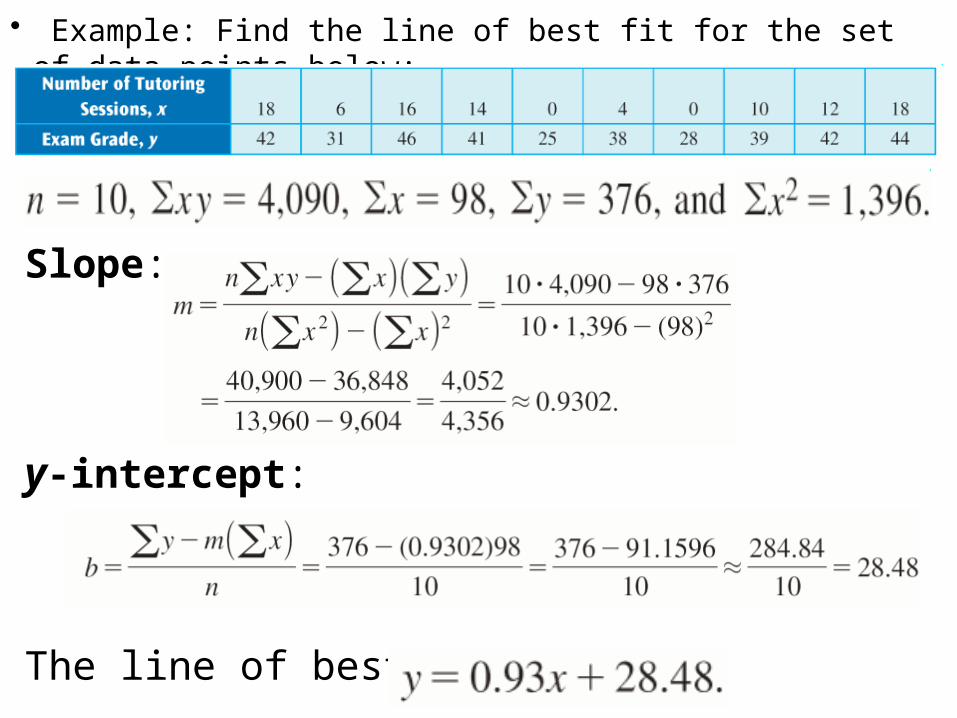
• Example: Find the line of best fit for the set of data points below:
Slope:
y-intercept:
The line of best fit is