Embed Size (px)
Citation preview

Dr. David HughesEmeritus Professor of Food MarketingEmeritus Professor of Food Marketing
International Nuffield Contemporary International Nuffield Contemporary Scholars ConferenceScholars Conference
Institute of Directors
116, Pall Mall, London, UK
Friday, March 2nd, 2012
Some Thoughts on Leadership in the Global Food Industry


Population Projections for Japan and Population Projections for Japan and Proportion of Population 65+ yearsProportion of Population 65+ years
2020
2222
2424
2626
2828
3030
3232
3434
3636
millionmillionpeoplepeople
Proportion pop 65 + years
Source: National Institute of Population & Social Security, Gov. of Japan
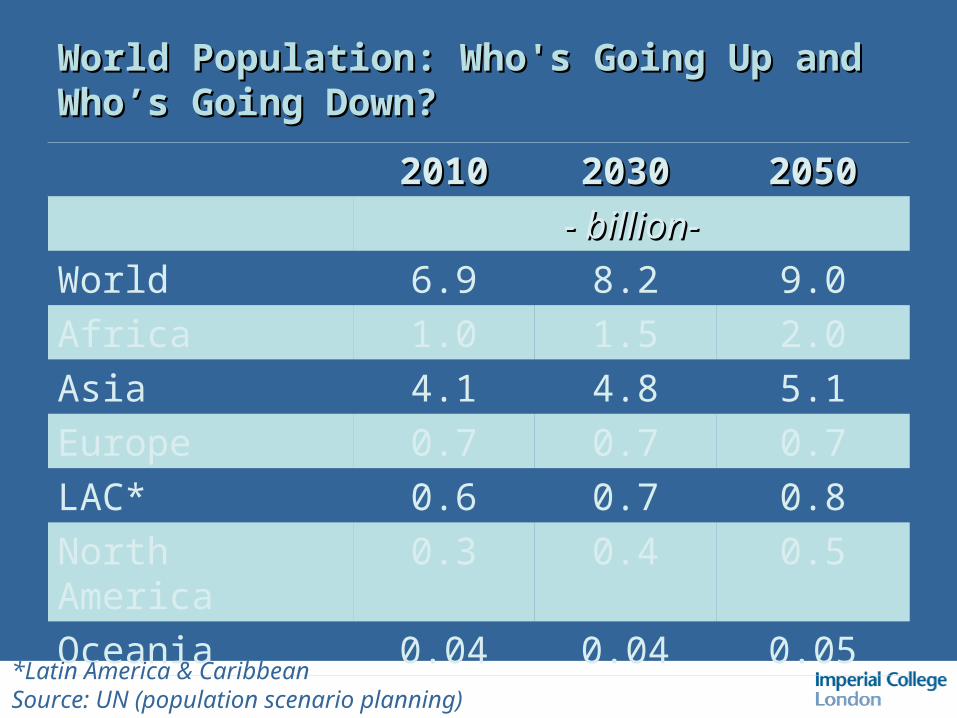
World Population: Who's Going Up and Who’s World Population: Who's Going Up and Who’s Going Down?Going Down?
20102010 20302030 20502050
- billion-- billion-
World 6.9 8.2 9.0
Africa 1.0 1.5 2.0
Asia 4.1 4.8 5.1
Europe 0.7 0.7 0.7
LAC* 0.6 0.7 0.8
North America 0.3 0.4 0.5
Oceania 0.04 0.04 0.05
*Latin America & CaribbeanSource: UN (population scenario planning)
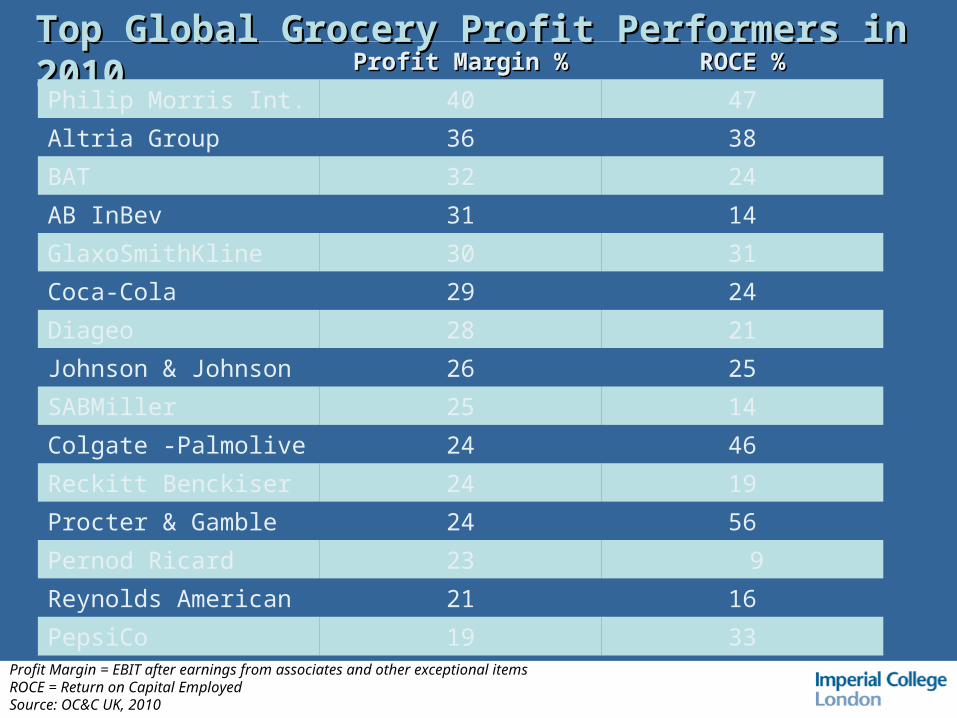
Top Global Grocery Profit Performers in 2010Top Global Grocery Profit Performers in 2010Profit Margin %Profit Margin % ROCE %ROCE %
Philip Morris Int. 40 47
Altria Group 36 38
BAT 32 24
AB InBev 31 14
GlaxoSmithKline 30 31
Coca-Cola 29 24
Diageo 28 21
Johnson & Johnson 26 25
SABMiller 25 14
Colgate -Palmolive 24 46
Reckitt Benckiser 24 19
Procter & Gamble 24 56
Pernod Ricard 23 9
Reynolds American 21 16
PepsiCo 19 33Profit Margin = EBIT after earnings from associates and other exceptional itemsROCE = Return on Capital EmployedSource: OC&C UK, 2010
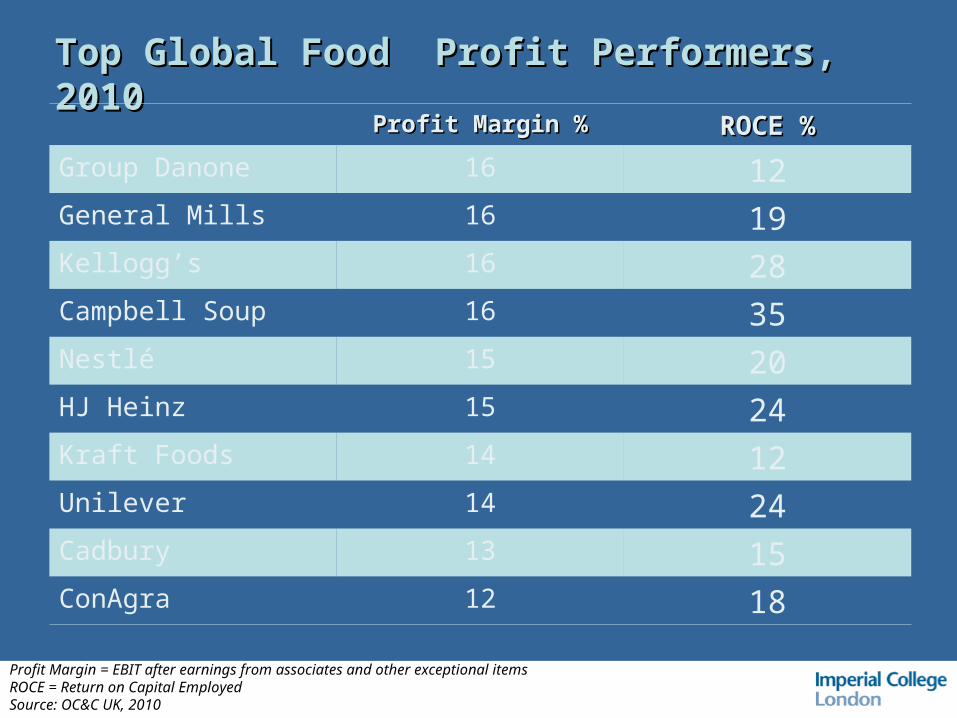
Top Global Food Profit Performers, 2010Top Global Food Profit Performers, 2010
Profit Margin %Profit Margin % ROCE %ROCE %
Group Danone 16 12General Mills 16 19Kellogg’s 16 28Campbell Soup 16 35Nestlé 15 20HJ Heinz 15 24Kraft Foods 14 12Unilever 14 24Cadbury 13 15ConAgra 12 18
Profit Margin = EBIT after earnings from associates and other exceptional itemsROCE = Return on Capital EmployedSource: OC&C UK, 2010
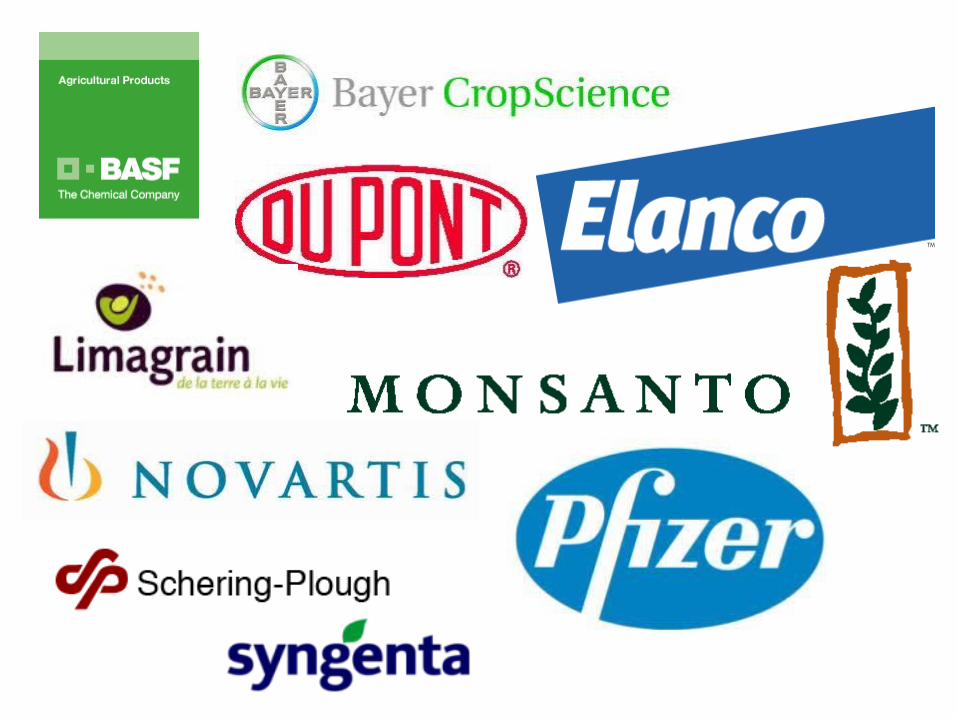

Life Science CompaniesOwnership of Genetic Rights
market powerpolarised
nursery peoplegrowers/farmersdistributorsmanufacturers etc.get squeezed!
Global Food Retailers and Food Service FirmsOwnership of Information on Shopping Behaviour
Proprietary Technology and Demand Chain Proprietary Technology and Demand Chain SqueezeSqueeze

Top Ten Global Food and Drink Brands by Top Ten Global Food and Drink Brands by Brand Value, 2011Brand Value, 2011
Brand Value US$ billionsBrand Value US$ billions
Coca Cola 72
McDonald’s 36
Pepsi Cola 15
Budweiser 12
Nescafé 12
Kellogg’s 11
Heinz 8
Danone 7
Nestlé 7
KFC 6


Leading Farmer-Owned Companies in the Leading Farmer-Owned Companies in the Global Food IndustryGlobal Food Industry• Danish Crown• Arla• Fonterra• Friesland Campina• Kerry• Limagrain • Rabobank
With special mention for The Netherlands and Denmark: two countries that have punched above their weight in international food markets and embraced farmer ownership of the value chain
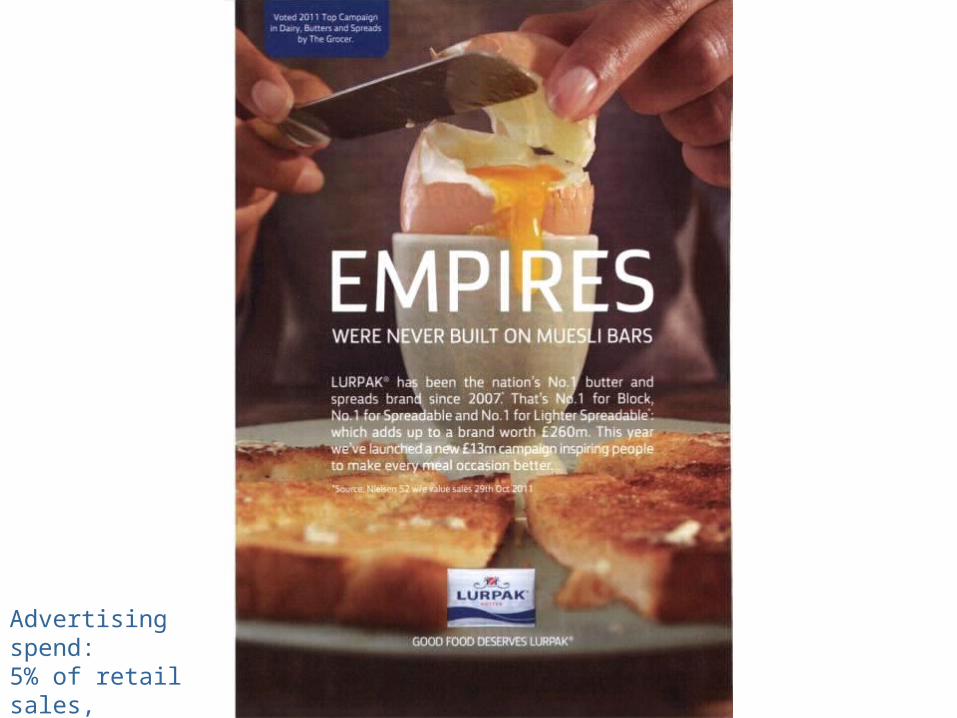
Advertising spend:5% of retail sales,i.e. US$20 million p.a.


An “Expert Brand” in Bone Health
Source: New Nutrition Business, J. Mellentin, 2011


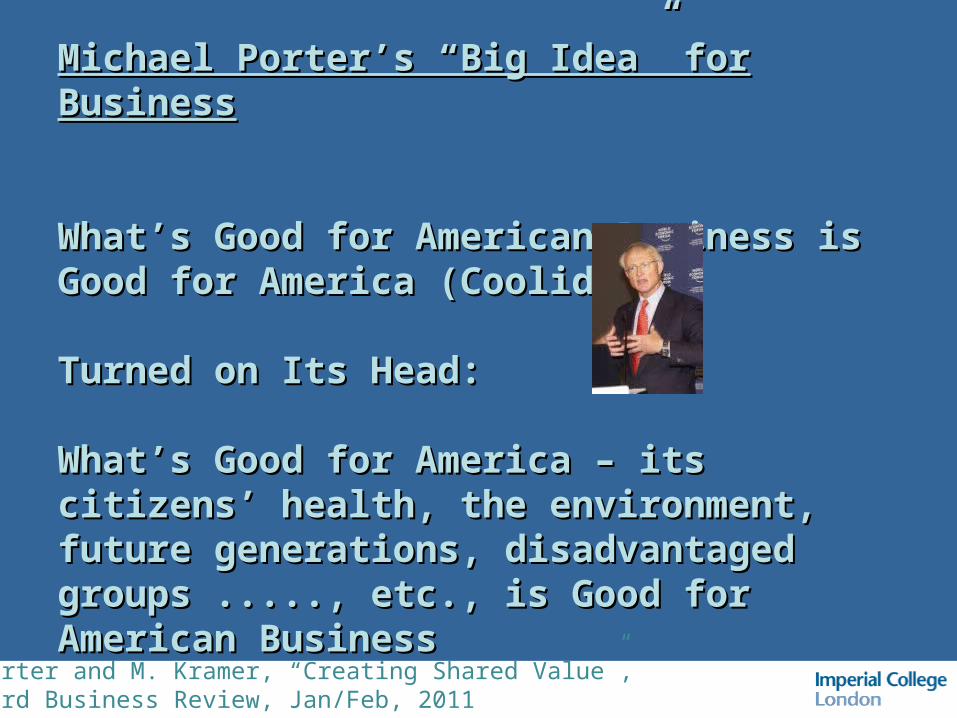
Michael Porter’s “Big Idea” for BusinessMichael Porter’s “Big Idea” for Business
What’s Good for American Business is Good What’s Good for American Business is Good for America (Coolidge?) for America (Coolidge?)
Turned on Its Head:Turned on Its Head:
What’s Good for America – its citizens’ health, What’s Good for America – its citizens’ health, the environment, future generations, the environment, future generations, disadvantaged groups ....., etc., is Good for disadvantaged groups ....., etc., is Good for American BusinessAmerican Business
M. Porter and M. Kramer, “Creating Shared Value”,Harvard Business Review, Jan/Feb, 2011

FAO Global Food Price Index: 1990 to 2012FAO Global Food Price Index: 1990 to 2012
Source: FAO

David Yelland View on Farmers and Leading Public Opinion(Farmers as “The Victims”)

Who is the Boss in the Global Food Industry?Who is the Boss in the Global Food Industry? The Consumer and She Wants it All! The Consumer and She Wants it All!
She wants products which are:She wants products which are:• better for me
– more convenient– better tasting– better price
• better for my well-being and body– feel good – look good– safer for my children
• better for the world and my locale– environment– Third World– my countryside
• better for Bambi/Flipper/Little Nemo/Babe/Bo Peep

CONTACT POINTS:CONTACT POINTS:
e-maile-mail
telephone numberstelephone numbers
office office +44(0)1600 715957
faxfax +44(0)1600 712544
mobilemobile +44(0)7798 558276
Check my latest podcast at www.profdavidhughes.com