Embed Size (px)
Citation preview

Chemical composition and source apportionment of PM1.0 , PM2.5 and PM10-2.5 in the roadside environmentof Hong Kong
Dr. Cheng YanDepartment of Environmental Science and Technology
School of Human Settlements and Civil Engineering
Xi’an Jiaotong University

Background information
� Effects of aerosol on human health, environment, and global climate change
� Hong Kong has been facing two air pollution issues (HKEPD website)
� local street-level pollution (285 vehicle per kilometer of road)
� transport of polluted air from an upwind area
NORT H
SOUT H
WEST EAST
5%
10%
15%
20%
25%
WIND SPEED
(m/s)
>= 11.1
8.8 - 11.1
5.7 - 8.8
3.6 - 5.7
2.1 - 3.6
0.5 - 2.1
Calms: 3.72%
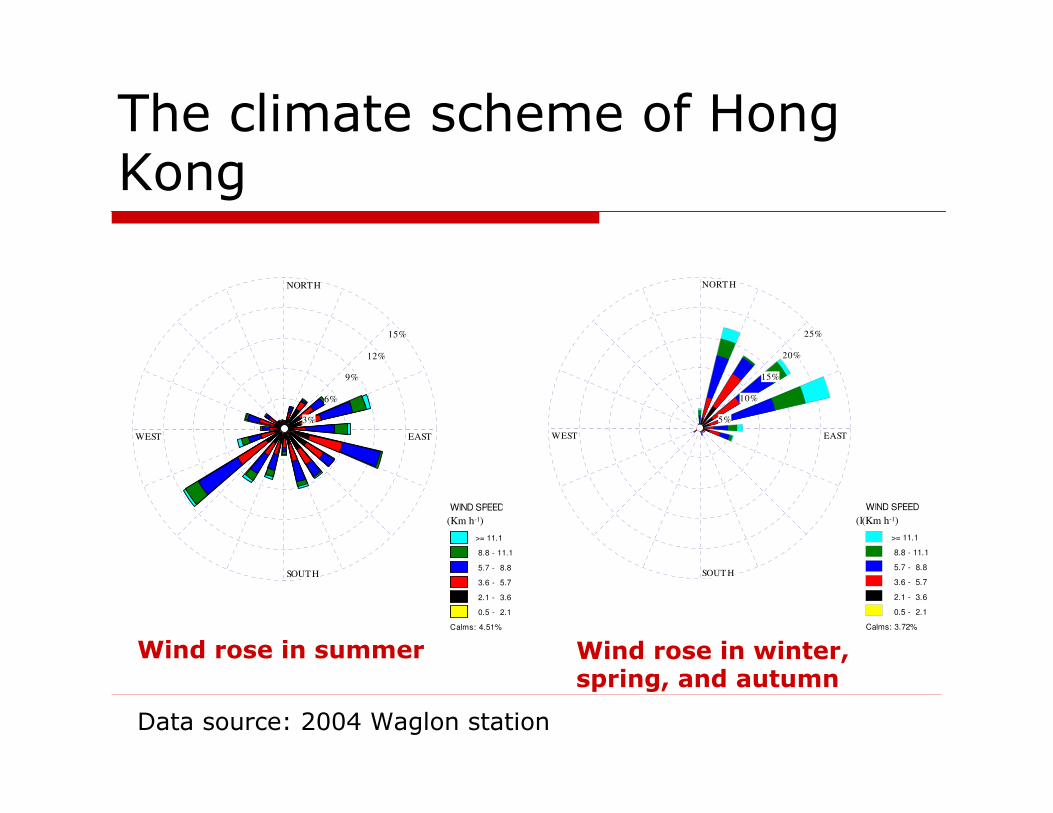
The climate scheme of Hong Kong
Wind rose in summer Wind rose in winter, spring, and autumn
Data source: 2004 Waglon station
NORTH
SOUTH
WEST EAST
3%
6%
9%
12%
15%
WIND SPEED
(m/s)
>= 11.1
8.8 - 11.1
5.7 - 8.8
3.6 - 5.7
2.1 - 3.6
0.5 - 2.1
Calms: 4.51%
(Km h-1) (Km h-1)(Km h-1)

Objective
1. To characterize the chemical properties of particulate matters at PU Supersite;
- Fine particle PM1.0, PM2.5
- Coarse particle PMcoarse (PM10-2.5)
2. To quantify source contributions to fine (PM2.5) and coarse (PM10-2.5) particles at PU Supersite by using PMF and CMB receptor model.

Sampling Location
PolyU (PU) Supersite

PM1.0, PM2.5, and PM10 mass and chemistry by URG Sampler
URG-3000ABC multi-channel samplers
•Two channels for PM1.0, two channels for PM2.5and four channels for PM10
•Collect 24-h PM1.0, PM2.5, and PM10 on quart and Teflon filters simultaneously
•One sample set every seventh day from Oct 2004 to Sept 2005
•Flow rate: 8.3 lpm for each channel
PU Supersite

Continuous PM2.5 and PM10 mass and BC by Kimoto SPM-613D
Kimoto SPM-613D Dichotomous Monitor
•Particle mass was quantified by beta gauge method
•BC was quantified by optical method
•Collect hourly PM2.5, PM10, and BC simultaneously Jan 05 – Dec 05
•Flow rate: 16.7 lpm
PU Supersite

Chemical analysis
� Carbonaceous aerosols (e.g., OC, EC)DRI Model 2001 OC/EC analyzer with flame ionization detectorHKPU
� Water-soluble inorganic ions (e.g., sulfate, nitrate, ammonium, potassium, sodium)
Ion Chromatography (DIONEX 600) with an electrochemical detectorHKPU
� Elements (e.g., 40 elements from Na to U) X-Ray Fluorescence analyzer (XRF, PANalytical Epsilon 5) with an electrochemical detector Desert Research Institute (DRI)

Receptor Models – the Positive matrix factorization (PMF) & the Chemical Mass Balance (CMB)
PMF (Paatero and Tapper, 1994) uses a least squares approach to solve the factor analysis problem by integrating non-negativity constraints into the optimization process and utilizing the error estimates for each data value as point-by-point weights.
CMB (Friedlander, 1973; Watson et al., 2004) quantifies contributions from chemically distinct source types by using a variance weighted least squares solution.
PMF was used to make source apportionment for PM2.5 and PMcoarse at PU Supersite
CMB was used to make source apportionment for PM2.5 at PU Supersite

1. Chemical characteristics of fine and
coarse particles at PU Supersite
- Diurnal variation
- Chemical composition
Results and discussion

Mean mass concentrations of PM1.0, PM2.5, and PMcoarse
R = 0.95
n=356
0
50
100
150
200
0 50 100 150
PM2.5 (µg m-3
)
PM
10 (
µg
m-3
)
PM2.5/PM10 ~70%
PMcoarse/PM10 ~30%
PM1.0/PM2.5 ~80%
N=40
N=56
N=56
N=56
R = 0.46
n=356
0
10
20
30
40
50
60
0 50 100 150
PM2.5 (µg m-3
)
PM
co
arse
(µ
g m
-3)
Data source: Kimoto
Site Method PM1.0 PM2.5 PMcoarse
PUa roadside gravimetrical mass 44.4±6.7 55.5±25.5 25.9±12.2
MKb roadside gravimetrical mass 58.1±18.5
TWb ambient gravimetrical mass 33.9±19.4
HTb suburban gravimetrical mass 23.7±14.8a this study;
b Louie et al., 2005 STE
Mean±sd (µg m-3
)

Diurnal variation of PM2.5 and PMcoarse
35
40
45
50
55
60
65
70
0:0
0
1:0
0
2:0
0
3:0
0
4:0
0
5:0
0
6:0
0
7:0
0
8:0
0
9:0
0
10
:00
11
:00
12
:00
13
:00
14
:00
15
:00
16
:00
17
:00
18
:00
19
:00
20
:00
21
:00
22
:00
23
:00
Co
nce
ntr
atio
n (µ
g m
-3)
Series1
15
17
19
21
23
25
0:0
0
1:0
0
2:0
0
3:0
0
4:0
0
5:0
0
6:0
0
7:0
0
8:0
0
9:0
0
10
:00
11
:00
12
:00
13
:00
14
:00
15
:00
16
:00
17
:00
18
:00
19
:00
20
:00
21
:00
22
:00
23
:00
Time of day (hr)
Co
nce
ntr
atio
n (µ
g m
-3)
Series1
PM2.5
PMcoarse
30
35
40
45
50
55
0 1 2 3 4 5 612
14
16
18
20
22
24
PM
2.5 (µ
g m
-3)
PM2.5
R=0.51
PMcoarse
R=0.98P
Mco
arse
(µg
m-3
)
Wind speed (m s-1)
the median concentrations of PM2.5 and PMcoarse
for each 0.4 m s-1 wind speed bin was usedData source: Kimoto
R PM2.5 PMcoarse
Taxis -0.30 -0.06
Gasoline-fueled vehicles 0.85 0.80
Diesel-fueled vehicles 0.85 0.64
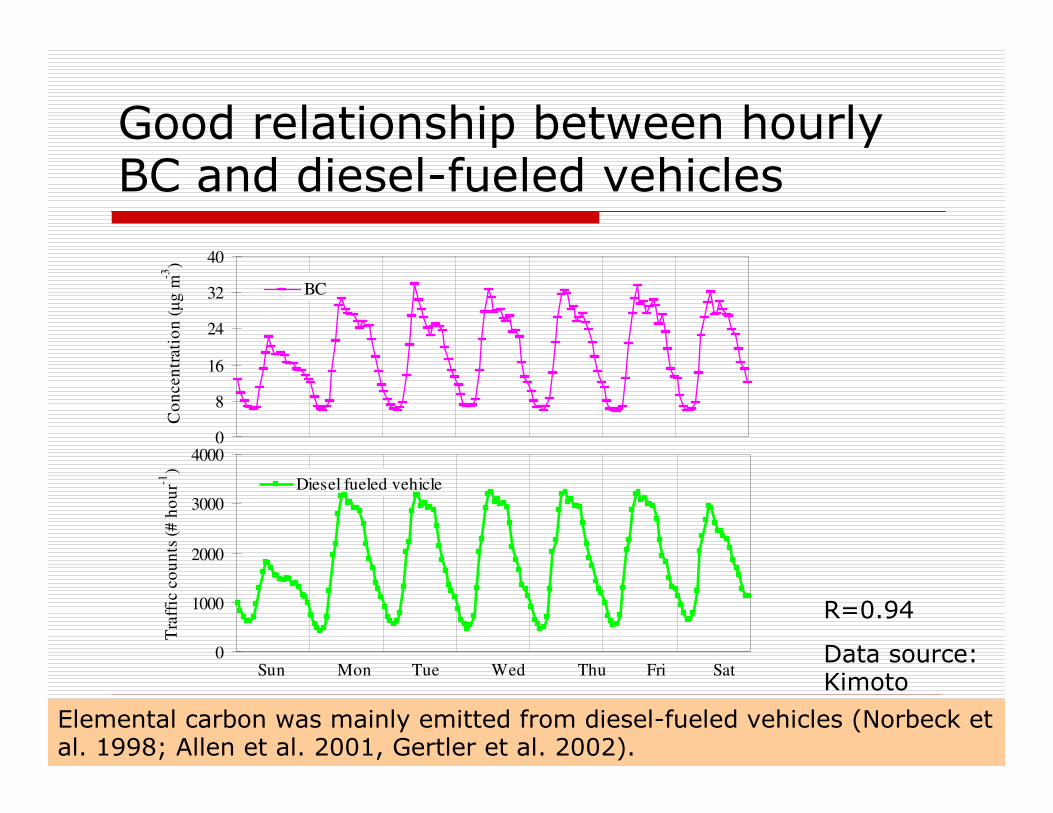
Good relationship between hourly BC and diesel-fueled vehicles
0
8
16
24
32
40
Co
ncen
trati
on
(µ
g m
-3)
BC
0
1000
2000
3000
4000
Tra
ffic
co
un
ts (
# h
ou
r-1)
Diesel fueled vehicle
Sun Mon Tue Wed Thu Fri Sat
R=0.94
Data source: Kimoto
Elemental carbon was mainly emitted from diesel-fueled vehicles (Norbeck et al. 1998; Allen et al. 2001, Gertler et al. 2002).

30%
21%
Sea-salt
6%Ammonium
5%
Nitrate
4%
27%
Unidentified
2%
5%
PM2.5 55.5± 25.5 µg m-3
Mineral dust and trace element
EC
8%
Sulfate
7%
12%
Ammonium
1%
Nitrate
9%
14%17%
32%
PMcoarse 25.9±12.2 µg m-3
Average chemical compositions of fine and coarse particles
Sulfate
OM (OC××××1.4)
EC
OM (OC××××1.4)
Unidentified
Mineral dust
and trace
element Sea-salt 12%
Data source: URG sampler
Other studies also get a large percentage of unidentified materials for PMcoarse

10/29/2004 11/24/2004 1/22/2005 4/12/2005 6/7/2005 7/13/2005 8/9/2005 9/23/2005
5
10
15
20
25
30
35
40
5
10
15
20
25
30
10/29/2004 11/24/2004 1/22/2005 4/12/2005 6/7/2005 7/13/2005 8/9/2005 9/23/2005
-1
0
1
2
3
4
5
6
7
8
0
2
4
6
8
10
12
14
OC
co
nce
ntr
atio
ns
(µg m
-3)
OC
EC
conce
ntr
atio
ns
(µg m
-3)
EC
conce
ntr
atio
ns
(µg m
-3)
PM2.5
EC
OC
co
nce
ntr
atio
ns
(µg
m-3)
Date
OC
EC
PMcoarse
OC/EC ratio: 0.7±0.3
OC/EC ratio: 7.8±14.2
Time series of carbonaceous aerosol in fine and coarse particles

Major sources for particles
� PM2.5
- low OC/EC ratio, high carbon content, good correlation with vehicle number- Vehicle emissions 机动车尾气
� PMcoarse
- high OC/EC ratio, low carbon content, moderate correlation with vehicle number- local sources (tire dust, paved soil dust, and vehicle)

2. Source apportionment by using PMF and CMB receptor models

20%
13%
Tire dust
3%
Paved soil dust
7%
26%
Residual oil
combustion
8%
Unidentified
10%
13%
Source contributions to PM2.5 by PMF receptor model
Diesel-fueled vehicle
Gasoline-fueled vehicle
Secondary aerosol
Coal combustion
Nearby local sources
Transported sources
Yuan et al. (2006)’s study claimed that secondary sulfate and local vehicle emissions gave the largest contribution to PM10 in HK (25% each), followed by secondary nitrate (12%). Contributions from other source types were below 10%.
Unidentified=PM2.5measured – PM2.5predicted
Predicted PM2.5 49.4 µg m-3
Measured PM2.5 55.5 µg m-3

Tire dust
20%
Field
burning+second
ary aerosol
13%
Paved soil dust
17%
Vehicle
11%
Marine aerosol
17%
Unidentified
22%
Source contributions to PMcoarse by PMF receptor model
Nearby Local sources
Unidentified=PMc measured – PMc predicted
Predicted PMcoarse 14.4 µg m-3
Measured PMcoarse 25.9 µg m-3
Transported sources

Comparison of source contributions to PM2.5 between CMB and PMF
Model
µg m-3
% µg m-3
%
Local sourcesa
31.1 56 37.2 67
Transported sourcesb
18.3 33 21.9 39
Over/under estimation 5.5 10 -3.7 -7
Predicted PM2.5 mass 49.4 59.1
Measured PM2.5 mass 55.5 55.5
Annual
PMF CMB
a Local sources include vehicle exhaust, paved road dust, brake lining,
tire dust, and residual oil combustion.b Regional sources include secondary aerosol, field burning, and coal
combustion.

Conclusion
� Overall, ~60% of fine particulate mass is from the nearby local sources and ~30% is from transported sources at PU Supersite.
� The majority (~60%) of coarse particulate mass is from the nearby local sources (tire dust, paved soil dust, and vehicle) and marine aerosol.

Thanks !
Acknowledgment
We would like to acknowledge DRI for the elemental analyses by XRF. This research was supported by Hong Kong Polytechnic University and Research Grants Council of Hong Kong (PolyU 5197/05E and PolyU 5145/03E) and the Area of Strategic Development on Atmospheric and Urban Air Pollution (A516) funded by the Hong Kong Polytechnic University.