Embed Size (px)
Citation preview

DPD
Col
orim
etric
Tes
ting
for
DPD
Col
orim
etric
Tes
ting
for
Chl
orin
eC
hlor
ine U
sing
vac
uum
am
puls
to te
st fo
rto
tal r
esid
ual c
hlor
ine
Mic
ah A
Ber
man

Ove
rvie
wO
verv
iew
DPD
Col
orim
etric
Tes
ting
for C
hlor
ine
Using
vacu
um a
mpu
ls to
test
for t
otal
resid
ual c
hlorin
e
�C
hem
istry
and
ana
lytic
al c
once
pts
�M
etho
dolo
gy�
Proc
edur
e�
Sum
mar
y

Che
mis
try a
nd A
naly
tical
Che
mis
try a
nd A
naly
tical
Con
cept
sC
once
pts

Wha
t is
DPD
?W
hat i
s D
PD?
�D
PD is
N,N
-die
thyl
-p-p
heny
lene
diam
ine
–Th
e a
min
e D
PD re
agen
t rea
cts w
ith c
hlor
ine
stoi
chio
met
rical
ly to
from
a W
ürst
er d
ye a
nd a
nim
ine.
–We
see
the
mag
enta
Wür
ster
dye.

Wha
t’s a
Vac
uum
Am
pul?
Wha
t’s a
Vac
uum
Am
pul?
�A
vac
uum
am
pul i
s ava
cuum
seal
edsp
ectro
phot
omet
ric c
ell.
�Th
e am
pul i
s sna
pped
open
and
a fi
xed
amou
ntflu
id is
dra
wn
into
the
ampu
l.�
Ther
e ar
e of
ten
reag
ents
inth
e am
pul (
like
DPD
).
Ben
efits
Ben
efits
�R
eage
nts i
n va
cuum
ampu
ls a
re n
ot p
rone
toco
ntam
inat
ion
due
anal
yst
hand
ling.
�Le
ss tr
ansf
errin
g an
dm
easu
ring
of s
olut
ions
.So
lutio
ns a
re m
ade
and
read
in th
e sa
me
ampu
l.

Tech
nica
l Con
side
ratio
nsTe
chni
cal C
onsi
dera
tions
�D
o no
t wor
k in
dire
ct su
nlig
ht.
–C
hlor
ine
(am
ong
othe
r hal
ides
) is a
ffec
ted
byin
tens
e lig
ht, l
eadi
ng to
err
ors.
–If
wor
king
out
door
s (on
-site
), be
sure
to w
ork
in th
e sh
ade.

Tech
nica
l Con
side
ratio
nsTe
chni
cal C
onsi
dera
tions
��D
ilute
pre
cise
ly a
nd a
ccur
atel
y.D
ilute
pre
cise
ly a
nd a
ccur
atel
y.–
Solu
tions
less
than
0.1
mg/
l in
conc
entra
tion
are
espe
cial
ly v
ulne
rabl
e to
err
or.
–A
t low
con
cent
ratio
ns, e
rror
s as l
ittle
as 0
.05%
can
chan
ge a
bsor
banc
e m
easu
rem
ents
by
over
15%
.–
Dirt
y gl
assw
are
will
sign
ifica
ntly
eff
ect l
ow-
conc
entra
tion
solu
tions
.
Cla
ss A
aut
omat
ed p
ipet
s
Tech
nica
l Con
side
ratio
nsTe
chni
cal C
onsi
dera
tions
�U
se g
ood
pipe
t tec
hniq
ue.
–Id
eally
, use
a a
utom
ated
cla
ss A
pip
et.
–U
se a
new
pip
et ti
p fo
r eac
h so
lutio
n.–
Nev
er p
ipet
from
the
stoc
k so
lutio
n, th
is c
anco
ntam
inat
e th
e w
hole
lot.
Pou
r the
solu
tion
into
a sm
alle
r bea
ker f
irst.
–If
usi
ng a
pip
et b
ulb,
be
sure
not
to d
raw
solu
tion
into
the
bulb
itse
lf.

Tech
nica
l Con
side
ratio
nsTe
chni
cal C
onsi
dera
tions
�U
se c
onsi
sten
t tec
hniq
ue.
–D
ilutio
ns–
Tim
ing
–R
eadi
ngs
�C
onsi
sten
cy w
ill m
inim
ize
erro
rs a
ndin
crea
se th
e po
tent
ial t
o id
entif
y an
dco
rrec
t err
ors.

Met
hodo
logy
Met
hodo
logy

Appr
oved
and
Acc
epta
ble
Met
hods
Appr
oved
and
Acc
epta
ble
Met
hods
NR
219
EPA
330.
5 or
Std.
Mth
ds.
4500
-Cl G
�N
R 2
19 li
sts S
tand
ard
Met
hods
450
0-C
lG
and
EPA
met
hod
330.
5 as
the
ON
LYac
cept
able
met
hods
for D
PD te
stin
g of
tota
l res
idua
l chl
orin
e.�
NR
809
list
s Std
. Met
hods
450
0-C
l G o
ran
y EP
A a
ppro
ved
met
hod.
Thu
s any
appr
oved
met
hod
can
be u
sed
unde
r NR
809.
NR
809
Std.
Mth
ds.
4500
-Cl G
or
EPA
appr
oved
met
hods
�Th
ese
met
hods
are
ver
yte
chni
cally
dem
andi
ngan
d tim
e co
nsum
ing.
Ther
e ar
e m
any
com
mer
cial
met
hods
avai
labl
e th
at si
mpl
ifyth
e pr
oced
ure.

Appr
oved
and
Acc
epte
d M
etho
dsAp
prov
ed a
nd A
ccep
ted
Met
hods
If y
ou a
re g
oing
to u
se a
com
mer
cial
test
, the
ir m
ust b
e do
cum
enta
tion
that
the
test
met
hod
is a
ppro
ved.
NR
219
EPA
330.
5 OR
Std.
Mth
ds.
4500
-Cl G
If a
com
mer
cial
met
hod
is a
ccep
ted
by th
eU
SEPA
as e
quiv
alen
t to
one
(usu
ally
bot
h) o
f the
met
hods
list
ed in
NR
219,
than
it c
an b
e us
ed fo
rre
porti
ng p
urpo
ses t
o th
e W
DN
R f
or N
R 2
19 (i
nad
ditio
n to
NR
809
).
Let
ter
from
USE
PAin
dica
ting
acce
ptan
ceof
com
mer
cial
test
met
hod
Commercial Test

Appr
oved
and
Acc
epte
d M
etho
dsAp
prov
ed a
nd A
ccep
ted
Met
hods
�H
ach
Met
hod
8021
�H
ach
Met
hod
8167
�H
ach
Met
hod
8370
The
follo
win
g is
a li
st o
f som
e co
mm
erci
al D
PDm
etho
ds th
at a
re U
SEPA
acc
epte
d. T
his l
ist i
sby
nei
ther
exc
lusi
ve n
or c
ompl
ete.
�H
ach
Met
hod
8371
�H
ach
Met
hod
1001
4
NO
TE:
Alth
ough
all
of th
ese
met
hods
use
DPD
, the
ydo
not
nec
essa
rily
use
vacu
um a
mpu
ls.
Whe
n us
ing
a co
mm
erci
al te
st, i
t is
nece
ssar
y to
cite
the
SPEC
IFIC
met
hod
(e.g
.m
etho
d nu
mbe
r) y
ou a
re u
sing
. A
test
cate
gory
is n
ot a
ccep
tabl
e.
Appr
oved
and
Acc
epta
ble
Appr
oved
and
Acc
epta
ble
Met
hods
- A
Not
e of
Cau
tion
Met
hods
- A
Not
e of
Cau
tion
�Th
e co
mm
erci
al m
etho
ds o
ften
glos
s ove
r the
ver
yim
porta
nt a
spec
ts o
f tra
ceab
ility
, cal
ibra
tion,
spik
es,
dupl
icat
es, a
nd o
ther
QA
and
QC
mea
sure
s.�
Usi
ng a
com
mer
cial
met
hod
does
not
exe
mpt
you
from
the
QA
and
QC
est
ablis
hed
in th
e or
igin
al E
PA/S
td.
Met
hods
: C
omm
erci
al M
etho
d +
QA/
QC
= A
ccep
tabl
e Te
stin
g

Com
mer
cial
Met
hods
-C
omm
erci
al M
etho
ds -
Thor
ough
ness
Thor
ough
ness
�Th
e ex
clus
ive
use
ofge
neric
inst
ruct
ions
are
not a
ccep
tabl
e.–
No
true
calib
ratio
n–
No
QC
–N
o sp
ikes
/dup
es�
Thes
e in
stru
ctio
nsar
e us
eful
for q
uick
chec
ks a
nd su
mm
ary
only
Gen
eric
Inst
ruct
ion
Thes
e in
stru
ctio
ns a
re s
impl
istic
. Al
one,
they
are
insu
ffici
ent f
or p
rope
r tes
ting.

Qui
ck T
ests
for C
hlor
ine
Test
ing
Qui
ck T
ests
for C
hlor
ine
Test
ing
�C
olor
whe
els a
reN
OT
acce
ptab
le.
�“P
ocke
t col
orim
eter
s”ar
e N
OT
acce
ptab
le.
–Th
ese
colo
rimet
ers
use
an in
suff
icie
nt,
prep
rogr
amm
edca
libra
tion.
�M
ust u
se tr
uesp
ectro
phot
omet
ers
or c
olor
imet
ers w
itha
USE
PA-a
ccep
ted
met
hod.
Thes
e ar
e N
OT
USE
PA a
ccep
ted

Proc
edur
ePr
oced
ure

Prep
arin
g Po
tass
ium
Prep
arin
g Po
tass
ium
Perm
anga
nate
Sta
ndar
dPe
rman
gana
te S
tand
ard
�In
this
test
a p
otas
sim
per
man
gana
test
anda
rd is
use
d instead
of a
chl
orin
est
anda
rd.
Pota
ssiu
m p
erm
anga
nate
is m
ore
stab
le th
an c
hlor
ine,
and
is u
sed
as a
mor
ere
liabl
e su
bstit
ute
stan
dard
.

Prep
arin
g Po
tass
ium
Prep
arin
g Po
tass
ium
Perm
anga
nate
Sta
ndar
dPe
rman
gana
te S
tand
ard
�O
btai
n ve
ndor
pre
pare
d po
tass
ium
perm
anga
nate
stan
dard
solu
tion
for u
se in
DPD
or F
AS
colo
rimet
ric m
etho
ds.
–St
anda
rd so
lutio
n sh
ould
be
labe
led
0.89
1g/l
pota
ssiu
m p
erm
anga
ntat
e. T
his i
s equ
ival
ent
to 1
g/l (
1000
ppm
) tot
al r
esid
ual c
hlor
ine.
–Th
e st
anda
rd so
lutio
n sh
ould
com
e in
a d
ark
ambe
r gla
ss b
ottle
. Th
is b
ottle
shou
ld b
est
ored
in th
e da
rk, a
way
from
dire
ct su
nlig
ht.

Dar
k bo
ttle
prev
ents
degr
adat
ion
due
to li
ght
Stan
dard
is o
f cor
rect
conc
entra
tion
and
labe
led
appr
opria
tely
Prep
arin
g Po
tass
ium
Prep
arin
g Po
tass
ium
Perm
anga
nate
Sta
ndar
dPe
rman
gana
te S
tand
ard

Prep
arin
g Po
tass
ium
Prep
arin
g Po
tass
ium
Perm
anga
nate
Sta
ndar
dPe
rman
gana
te S
tand
ard
�D
ilute
the
1000
ppm
stoc
k so
lutio
nto
1 p
pm w
orki
ng so
lutio
n (1
:100
0)as
follo
ws:
1) D
ilute
10.
00 m
l sto
ck so
lutio
n to
100.
0 m
l (w
ith d
istil
led
wat
er in
avo
lum
etric
flas
k)2)
Tak
e 1.
00 m
l of t
his n
ewso
lutio
n an
d di
lute
it to
100.
0 m
l.–
Be
sure
to m
ix e
ach
dilu
tion
thor
ough
ly.
Stoc
kso
l.(1
000p
pm)
Wor
king
sol.
(1 p
pm)
Rem
embe
r:Th
e co
ncen
trat
ions
are
equi
vale
nts.
The
yso
lutio
ns a
re n
otA
CTU
ALL
Y ch
lorin
e,bu
t beh
ave
like
chlo
rine
at th
eeq
uiva
lent
conc
entr
atio
n.

Prep
arin
g C
alib
ratio
n St
anda
rds
Prep
arin
g C
alib
ratio
n St
anda
rds
�Fr
esh
wor
king
solu
tion
for u
se in
calib
ratio
n st
anda
rds m
ust b
e pr
epar
edfr
esh
for t
hat d
ay.
�R
ange
of c
alib
ratio
n st
anda
rds m
ust
incl
ude
the
antic
ipat
ed sa
mpl
e ra
nge.
–If
you
exp
ect s
ampl
es b
etw
een
0.03
0 –
0.15
0pp
m (t
ypic
al fo
r was
tew
ater
and
drin
king
wat
er a
naly
sis)
, the
n ca
libra
te fr
om 0
.020
–0.
200
ppm
.�
Do
not p
repa
re c
alib
ratio
n st
anda
rds b
elow
0.02
0 pp
m.
Thes
e w
ill le
ad to
err
or.
�Se
t up
a ta
ble
to h
elp
calc
ulat
e di
lutio
ns

Prep
arin
g C
alib
ratio
n St
anda
rds
Prep
arin
g C
alib
ratio
n St
anda
rds
0.20
ppm
100
ml
20.0
0 m
l
0.10
ppm
100
ml
10.0
0 m
l
0.07
ppm
100
ml
7.00
ml
0.05
ppm
100
ml
5.00
ml
0.03
ppm
100
ml
3.00
ml
Fina
l Con
cent
ratio
nFi
nal V
olum
eW
orki
ng S
olut
ion
1ppm�
Exam
ple
dilu
tion
tabl
e.D
ilute
wor
king
solu
tion
(1pp
m) w
ith D
I wat
er u
p to
the
final
vol
ume
in a
100
ml v
olum
etric
flas
k:

Prep
arin
g C
alib
ratio
n St
anda
rds
Prep
arin
g C
alib
ratio
n St
anda
rds
�C
alib
ratio
n st
anda
rds a
re la
bele
d, fi
lled
to m
enis
cus,
and
thor
ough
ly m
ixed
.
�C
alib
ratio
n bl
ank
(DI w
ater
) is i
nclu
ded,
and
pre
pare
d lik
e al
l oth
er st
anda
rds.
Not
e: th
is p
hoto
grap
h re
flect
sco
ncen
trat
ions
in p
pb, n
ot p
pm

Dev
elop
ing
Cal
ibra
tion
Stan
dard
sD
evel
opin
g C
alib
ratio
n St
anda
rds
�Po
ur a
smal
l am
ount
of
calib
ratio
n st
anda
rd fr
omth
e vo
lum
etric
flas
k in
toa
smal
l bea
ker a
nd p
lace
the
beak
er in
fron
t of t
hefla
sk.
�D
o th
is fo
r eac
hca
libra
tion
stan
dard
,in
clud
ing
the
calib
ratio
nbl
ank
(DI w
ater
).
�B
egin
a ti
mer
– b
reak
one
ampu
l ups
ide
dow
n in
the
beak
ers.
–B
e su
re th
at re
agen
tis
not
in a
mpu
l tip
.–
Bre
ak ti
p ag
ains
tbo
ttom
or w
all o
fbe
aker
.–
Allo
w a
mpu
l to
fill
com
plet
ely
(1-2
s).

How
to B
reak
an
Ampu
lH
ow to
Bre
ak a
n Am
pul
•Rea
gent
is in
tip
of a
mpu
l.•R
eage
nt is
like
ly st
ay in
side
the
brok
en ti
p af
ter i
t bre
aks,
incr
easi
ng c
hanc
e fo
r low
bias
.
•Am
pul i
s han
dled
care
fully
to a
void
reag
ent f
allin
g in
to tip.

How
to B
reak
an
Ampu
lH
ow to
Bre
ak a
n Am
pul
•Bea
ker a
ndam
pul a
retip
ped
to th
esi
de.
•Rea
gent
ism
ore
likel
y to
stay
in th
eam
pul a
nd n
otfa
ll in
to ti
p.
•Am
pul i
s too
ver
tical
.•R
eage
nt is
like
ly to
fall
into
tip
befo
re it
brea
ks.
DPD
Col
or L
evel
sD
PD C
olor
Lev
els
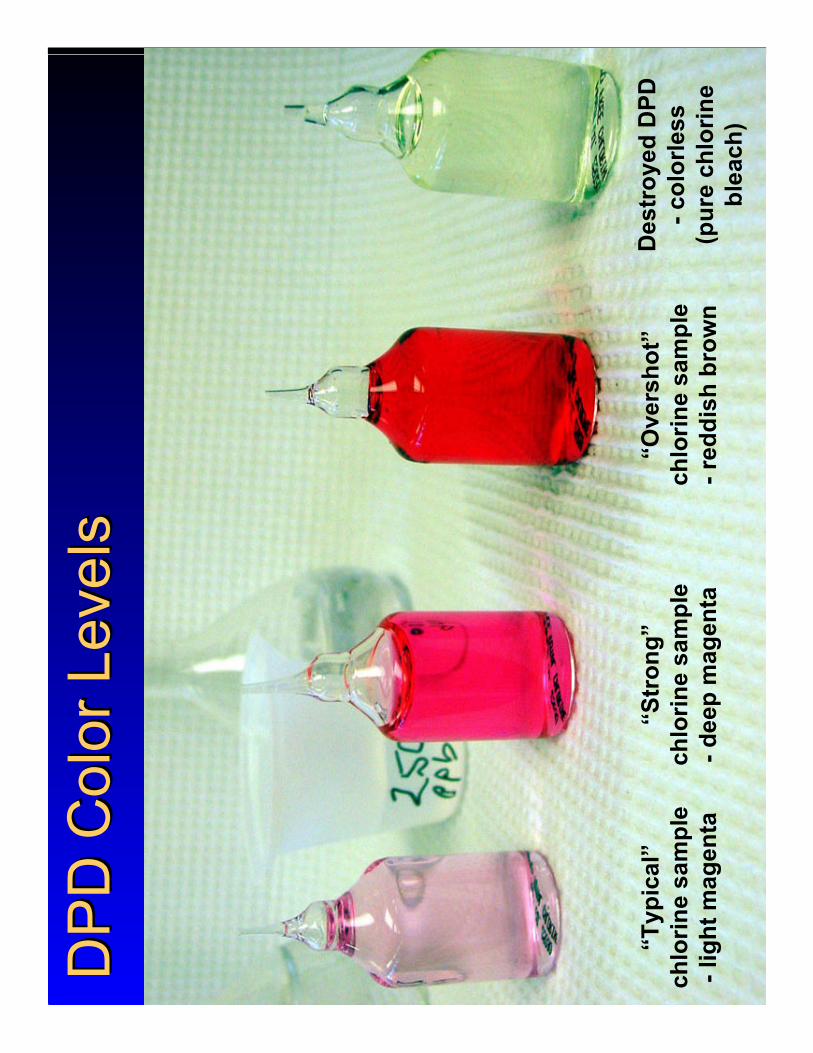
“Typ
ical
”ch
lorin
e sa
mpl
e- l
ight
mag
enta
“Str
ong”
chlo
rine
sam
ple
- dee
p m
agen
ta
“Ove
rsho
t”ch
lorin
e sa
mpl
e- r
eddi
sh b
row
n
Des
troy
ed D
PD- c
olor
less
(pur
e ch
lorin
ebl
each
)

Mak
ing
a C
alib
ratio
n C
urve
Mak
ing
a C
alib
ratio
n C
urve
Zero
ing
the
Spec
troph
otom
eter
Zero
ing
the
Spec
troph
otom
eter
�Ze
ro th
e sp
ectro
phot
omet
er u
sing
the
calib
ratio
n bl
ank,
DI w
ater
–M
ake
sure
the
spec
troph
otom
eter
is se
t to
515
nm.
If th
is is
not
pos
sibl
e, u
se a
wav
elen
gth
betw
een
515
-540
nm
.–
Zero
with
the
sam
e w
ater
that
was
use
d in
crea
ting
the
calib
ratio
n st
anda
rds.
–Po
ur th
e w
ater
from
the
flask
into
a c
lean
sam
ple
cell.
Wip
e th
e ce
ll cl
ean
offin
gerp
rints
.–
Alig
n th
e re
fere
nce
mar
k to
the
light
sour
ce (o
r as a
ppro
pria
te),
and
zero
the
spec
troph
otom
eter
.
Fing
erpr
ints
, du
st,
and
othe
r re
sidu
es c
an b
ias
abso
rban
ce r
eadi
ngs.
Be
sure
to
clea
nly
wip
e of
fth
e op
tical
su
rfac
e of
any
sam
ple
cell
or a
mpu
lth
at is
ana
lyze
d w
ith t
hesp
ectr
opho
tom
eter
.

Wav
elen
gth
set c
orre
ctly
DI
Cal
ibra
tion
blan
k is
insa
mpl
e ce
ll an
dal
igne
d pr
oper
ly
Lig
htsh
ield
rem
oved
Mak
ing
a C
alib
ratio
n C
urve
Mak
ing
a C
alib
ratio
n C
urve
Zero
ing
the
Spec
trom
eter
Zero
ing
the
Spec
trom
eter
Ligh
tsh
ield
inpl
ace
Dev
ice
isze
roed

Mak
ing
a C
alib
ratio
n C
urve
:M
akin
g a
Cal
ibra
tion
Cur
ve:
Rec
ord
Dat
aR
ecor
d D
ata
�R
ecor
d th
eab
sorb
ance
of e
ach
calib
ratio
n st
anda
rd�
This
dat
a is
use
dw
hen
calc
ulat
ing
aca
libra
tion
curv
e.

Mak
ing
a C
alib
ratio
n C
urve
:M
akin
g a
Cal
ibra
tion
Cur
ve:
Det
erm
inin
g r
Det
erm
inin
g r (
corre
latio
n co
effic
ient
)(c
orre
latio
n co
effic
ient
)
�U
se a
cal
cula
tor,
Exce
l, or
oth
er so
ftwar
e.�
In E
xcel
, you
can
use
the
CO
RR
EL fo
rmul
a.�
CO
RR
EL(V
alue
s 1,V
alue
s 2) r
etur
ns th
e co
rrel
atio
n co
effic
ient
, r.
�M
any
scie
ntifi
c ca
lcul
ator
s can
cal
cula
te r
as w
ell.
00.
000
300.
016
500.
029
100
0.05
615
00.
080
200
0.10
025
00.
135
r =0.
9980
79
=CO
RREL
(A1:
A7,B
1:B7
)

�r d
escr
ibes
how
muc
h of
a c
orre
latio
n th
ere
isbe
twee
n th
e tw
o da
ta se
ts.
Clic
k he
re fo
r mor
e in
form
atio
n .�
In th
is c
ase,
it d
escr
ibes
how
linear
the
data
is.
�W
hy sh
ould
the
data
be
linea
r?�
Bec
ause
of B
eer’
s law
.
Mak
ing
a C
alib
ratio
n C
urve
:M
akin
g a
Cal
ibra
tion
Cur
ve:
Abou
t rAb
out r

Mak
ing
a C
alib
ratio
n C
urve
:M
akin
g a
Cal
ibra
tion
Cur
ve:
Beer
’s L
awBe
er’s
Law
�B
eer’
s law
stat
es th
atA
= ε
bcε
=m
olar
abs
orpt
ivity
(how
“po
tent
” th
e dy
e is
)b
=ce
ll pa
th le
ngth
c =
conc
entra
tion
�Si
nce
the
mol
ar a
bsor
ptiv
ity a
nd th
e pa
th le
ngth
are
the
sam
e fo
r all
read
ings
, onl
y th
e th
e co
ncen
tratio
nch
ange
s. T
hus,
if th
e co
ncen
tratio
n do
uble
s, so
shou
ld th
e ab
sorb
ance
(A).
Thi
s is a
linear
rela
tions
hip.
�If
cal
ibra
tion
data
is n
ot li
near
(r <
.995
), th
an th
ere
is a
pro
blem
in e
ither
the
proc
edur
e or
cal
ibra
tion
stsa
ndar
d.

Mak
ing
a C
alib
ratio
n C
urve
:M
akin
g a
Cal
ibra
tion
Cur
ve:
Line
ar R
egre
ssio
nLi
near
Reg
ress
ion
�O
nce
you
know
that
the
data
is v
alid
(r >
.995
),yo
u w
ill n
eed
to c
alcu
late
the
linea
r reg
ress
ion,
or th
e “l
ine
of b
est f
it”.
�Th
is c
an b
e do
neon
a c
alcu
lato
r or
othe
r sof
twar
e.0
0.00
00.
030
0.01
60.
050
0.02
90.
100
0.05
60.
150
0.08
00.
200
0.10
00.
250
0.13
5r
=0.
9980
79=
CO
RR
EL
(A1:
A7,
B1:
B
Cal
ibra
tion
Cur
ve (p
erm
anga
nate
chl
orin
e eq
uiva
lent
)
y =
0.52
2974
x +
0.00
1154
0.00
0
0.02
0
0.04
0
0.06
0
0.08
0
0.10
0
0.12
0
0.14
0
0.16
0 0.00
00.
100
0.20
00.
300
Con
c. (p
pm)
Absorbance

Mak
ing
a C
alib
ratio
n C
urve
:M
akin
g a
Cal
ibra
tion
Cur
ve:
Che
ck C
alib
ratio
nC
heck
Cal
ibra
tion
�C
alib
ratio
n is
val
id w
hen
r > .9
95 a
nd th
ey-
inte
rcep
t (th
e “b
” in
y=m
x+b)
is b
elow
the
limit
of d
etec
tion
(LO
D).
�Th
ere
is e
xten
sive
cal
ibra
tion
info
rmat
ion
on a
vaila
ble
in o
ther
DN
R p
rese
ntat
ions
.C
heck
it o
ut!

Anal
yzin
g a
Sam
ple
Anal
yzin
g a
Sam
ple
–Ze
ro th
e sp
ectro
met
er w
ith D
Iw
ater
–R
ecor
d ab
sorb
ance
of b
lank
(pur
esa
mpl
e)
–R
ecor
d ab
sorb
ance
of d
evel
oped
sam
ple
(sam
ple
+ D
PD in
am
pul).
�Th
ere
are
thre
e st
eps t
o an
alyz
ing
a sa
mpl
e.
Dev
elop
ed sa
mpl
e

�D
evel
oped
(sol
utio
n +
DPD
) sam
ples
or s
tand
ards
shou
ld n
ot b
e re
ad b
efor
e th
ree
min
utes
, or a
fter s
ixm
inut
es.
Rea
d th
em b
etw
een
3-6
min
utes
.�
Set u
p a
timin
g sc
hedu
le to
max
imiz
e ef
ficie
ncy.
�En
sure
that
eac
h sa
mpl
e de
velo
ps fo
r a c
onsi
sten
tam
ount
of t
ime
befo
re it
is re
ad.
Develop Sample # 1 �
Develop Sample # 2 �
Develop Sample # 3 �
Develop Sample # 4 �
Develop Sample # 5 �
Develop Sample # 6 �
Read Sample # 1�
Read Sample # 3�
Read Sample # 2�
Read Sample # 4�An
alyz
ing
a Sa
mpl
e - T
imin
gAn
alyz
ing
a Sa
mpl
e - T
imin
g
etc.
.
Exam
ple
timin
g sc
hedu
le fo
r thr
ee m
inut
e de
velo
ping
tim
e fo
r six
sam
ples
.

Anal
yzin
g a
Sam
ple
Anal
yzin
g a
Sam
ple
�W
hen
anal
yzin
g a
sam
ple
reco
rd b
oth
abso
rban
ces
(bla
nk a
nd d
evel
oped
) on
the
data
shee
t.�
Subt
ract
the
blan
k ab
sorb
ance
from
the
deve
lope
dab
sorb
ance
to g
et th
e ad
just
ed a
bsor
banc
e.�
This
adj
uste
d ab
sorb
ance
cor
rect
s for
any
nat
ural
abso
rban
ce o
f the
sam
ple
or a
mpu
l its
elf.
Sam
ple
no.
Blan
kD
evel
oped
Adj.
Abs.
Out
fall
no. 1
0.00
30.
032
0.02
9O
utfa
ll no
. 20.
003
0.04
80.
045
Out
fall
no. 3
0.00
00.
046
0.04
6O
utfa
ll no
. 40.
002
0.03
50.
033
DEV
ELO
PED
- B
LAN
K =
Adj
uste
d A
bsor
banc
e

Cal
ibra
tion
Cur
ve (p
erm
anga
nate
chl
orin
e eq
uiva
lent
)
y =
0.52
2974
x +
0.00
1154
0.00
0
0.02
0
0.04
0
0.06
0
0.08
0
0.10
0
0.12
0
0.14
0
0.16
0 0.00
00.
100
0.20
00.
300
Con
c. (p
pm)
Absorbance
Anal
yzin
g a
Sam
ple
Anal
yzin
g a
Sam
ple
�Th
e ad
just
edab
sorb
ance
s are
the
only
val
ues t
hat a
reus
ed in
cal
cula
tions
.
[.065
] =
.522
974(
x) +
.011
54
x=.1
02 p
pm[C
orre
cted
Abs
.]=
.5
2297
4(co
nc. o
f sam
ple)
+.0
1154
�Le
t say
, for
inst
ance
, tha
t a sa
mpl
e ha
s a c
orre
cted
abs
orba
nce
of .0
65.
Use
bac
k-ca
lcul
atio
n to
cal
cula
te th
e co
ncen
tratio
n of
sam
ple,
usi
ng th
elin
ear r
egre
ssio
n eq
uatio
n. S
olve
for (
x).
�Th
ese
valu
es a
re“p
lugg
ed”
into
the
linea
r reg
ress
ion
equa
tion
to g
et a
conc
entra
tion.

Sum
mar
ySu
mm
ary
�M
ake
sure
to u
se a
n U
SEPA
acc
epte
dm
etho
d, a
nd b
e ab
le to
cite
whi
ch m
etho
dth
at is
.�
Be
sure
to c
alib
rate
car
eful
ly.
Che
ck th
atca
libra
tion
is v
alid
(>.9
95).
�D
eter
min
e lin
e of
bes
t fit.
�U
se e
quat
ion
from
line
of b
est f
it to
bac
k-ca
lcul
ate
abso
rban
ces f
rom
sam
ples
.


Addi
tiona
l Inf
orm
atio
nAd
ditio
nal I
nfor
mat
ion
Abou
t Low
Lev
el T
estin
gAb
out L
ow L
evel
Tes
ting
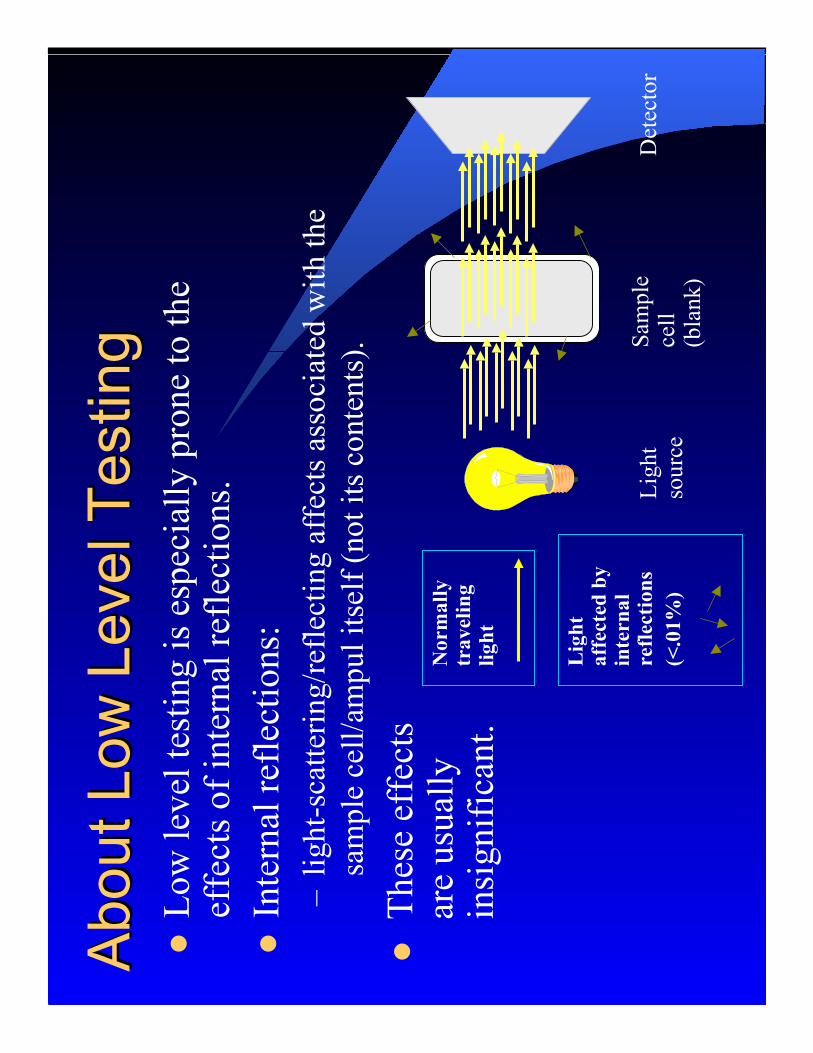
�Lo
w le
vel t
estin
g is
esp
ecia
lly p
rone
to th
eef
fect
s of i
nter
nal r
efle
ctio
ns.
�In
tern
al re
flect
ions
:–
light
-sca
tterin
g/re
flect
ing
affe
cts a
ssoc
iate
d w
ith th
esa
mpl
e ce
ll/am
pul i
tsel
f (no
t its
con
tent
s).
Ligh
tso
urce
Det
ecto
rSa
mpl
ece
ll(b
lank
)
Nor
mal
lytr
avel
ing
light
Lig
htaf
fect
ed b
yin
tern
alre
flect
ions
(<.0
1%)
�Th
ese
effe
cts
are
usua
llyin
sign
ifica
nt.

Typi
cal
Typi
cal S
pect
roph
otom
etry
Spec
troph
otom
etry
Typi
cal B
lank
—Li
ttle
abso
rban
ce
—M
ost o
f the
ligh
t goe
sth
roug
h
Typi
cal (
deve
lope
d) S
ampl
e
—Si
gnifi
cant
Abs
orba
nce
—A
sign
ifica
nt a
mou
nt o
flig
ht is
abs
orbe
dStrong signal
Weaker Signal
�A
bsor
banc
e
=
Stro
ng
-W
eak = st
rong
�U
ncer
tain
ty d
ue to
diff
eren
t int
erna
l ref
lect
ions
is in
sign
ifica
nt
�Id
eally
, the
re is
a si
gnifi
cant
diff
eren
ce b
etw
een
the
blan
k an
dsa
mpl
e. T
he ra
ndom
diff
eren
ces i
n sc
atte
ring
effe
cts o
f diff
eren
tce
lls is
insi
gnifi
cant
.

Low
-Lev
el
Low
-Lev
el S
pect
roph
otom
etry
Spec
troph
otom
etry
Bla
nk
—Li
ttle
abso
rban
ce
—M
ost o
f the
ligh
t goe
sth
roug
h
Low
abs
orba
nce
sam
ple
—Li
ttle
abso
rban
ce
—M
ost o
f the
ligh
t goe
sth
roug
hStrong signal
Strong Signal
�A
bsor
banc
e
=
Stro
ng
-
Stro
ng =
~~ 00
�U
ncer
tain
ty d
ue to
diff
eren
t int
erna
l ref
lect
ions
is m
ore
sign
ifica
nt
�Th
e bl
ank
and
the
sam
ple
are
near
ly id
entic
al�
Diff
ernc
es b
etw
een
cells
bec
ome
sign
ifica
nt.

Low
-Lev
el
Low
-Lev
el S
pect
roph
otom
etry
Spec
troph
otom
etry
::M
inim
izin
g In
tern
al R
efle
ctio
nsM
inim
izin
g In
tern
al R
efle
ctio
ns�
Use
reag
ent-f
ree
ampu
ls fo
r bla
nk a
nd/o
r zer
o–
Bla
nk a
mpu
ls a
re id
entic
al to
DPD
am
puls
, but
cont
ain
no D
PD re
agen
t–
Min
imiz
es th
e di
ffer
ence
s in
inte
rnal
refle
ctio
nsbe
twee
n re
adin
gs–
This
is so
mew
hat m
ore
cost
ly (~
50
cent
s per
bla
nkam
pul)
but w
ill im
prov
e re
sults
.

Low
-Lev
el
Low
-Lev
el S
pect
roph
otom
etry
Spec
troph
otom
etry
::M
inim
izin
g In
tern
al R
efle
ctio
nsM
inim
izin
g In
tern
al R
efle
ctio
ns�
Use
cel
ls th
at w
/ 25m
m+
path
leng
th–
Cel
ls sm
alle
r tha
n 25
mm
acr
oss w
illyi
eld
low
abs
orba
nces
. In
tern
alre
flect
ions
will
be
mor
e si
gnifi
cant
.�
Avo
id d
ilutin
g sa
mpl
e–
Dilu
ting
the
sam
ple
will
furth
erde
crea
se it
s abs
orba
nce.
�U
se fl
ow-th
roug
h ce
ll to
eliminate
erro
rs d
ue to
inte
rnal
refle
ctio
n.–
Cos
tly, b
ut si
gnifi
cant
ly im
prov
esre
sults
.
Sam
ple
Cel
l
> 25
mm

Abou
t rAb
out r
�Le
t’s lo
ok a
t the
men
of H
appy
ville
. D
ata
was
col
lect
edco
ncer
ning
hei
ght a
nd w
eigh
t. It
is sh
own
belo
w.
Heigh
tAver
age
Weig
ht5'
2"14
2.1
5'' 4
"14
7.7
5' 6"
156.
05'
8"16
4.3
5' 10
"17
2.1
6' 0"
179.
66'
2"18
8.1
6' 4"
199.
0
Can
you
pre
dict
the
wei
ght o
f a 5
’9”
pers
on fr
om th
is d
ata?

Abou
t rAb
out r
�C
an y
ou p
redi
ct th
e w
eigh
t of a
5’9
” pe
rson
from
this
dat
a?
Heigh
tAver
age
Weig
ht5'
2"14
2.1
5'' 4
"14
7.7
5' 6"
156.
05'
8"16
4.3
5' 10
"17
2.1
6' 0"
179.
66'
2"18
8.1
6' 4"
199.
0
Sure
, the
dat
a is
pre
dict
able
and
is v
ery
linea
r. B
ydr
awin
g a
line
thro
ugh
the
poin
ts o
n a
grap
h, w
e ca
npr
edic
t the
wei
ght o
f the
ave
rage
5’9
” m
ale.
Aver
age
Mal
e W
eigh
t in
Som
ewhe
revi
lle
130
140
150
160
170
180
190
200
210
5' 2"
5'' 4"
5' 6"
5' 8"
5' 10"
6' 0"
6' 2"
6' 4"
Heig
ht (f
t/in)
Weight (pds)
5' 9"
168.
4
168.
4

Abou
t rAb
out r
�W
e ca
n as
sum
e th
at th
e lin
e w
e dr
ew th
roug
h th
e po
ints
isa
good
indi
cato
r of r
ealit
y be
caus
e it
lies c
lose
to e
very
poin
t. r
desc
ribes
how
wel
l the
line
des
crib
es th
e tru
e da
ta(r
ealit
y).
Heigh
tAver
age
Weig
ht5'
2"14
25''
4"
148
5' 6"
156
5' 8"
164
5' 10
"17
26'
0"18
06'
2"18
96'
4"19
9
Aver
age
Mal
e W
eigh
t in
Hap
pyvi
lle
130
140
150
160
170
180
190
200
210
5' 2"
5'' 4"
5' 6"
5' 8"
5' 10"
6' 0"
6' 2"
6' 4"
Heig
ht (f
t/in)
Weight (pds)
5' 9"
168.
4Th
is lin
e is n
o go
od
Neith
er is
this
line

Abou
t rAb
out r
�Le
t’s lo
ok a
t som
e ot
her d
ata.
Thi
s tim
e w
e w
illco
llect
dat
a on
the
num
ber o
f chi
ldre
n m
en in
Hap
pyvi
lle h
ave.
The
resu
lts a
re sh
own
belo
w�
Can
you
pre
dict
how
man
y ch
ildre
n th
e av
erag
e5’
9” m
an h
as?
Heig
htAv
erag
e #
of C
hild
ren
5' 2"
3.2
5'' 4
"5.
35'
6"3.
85'
8"2.
05'
10"
6.1
6' 0"
3.3
6' 2"
1.9
6' 4"
4.3

Abou
t rAb
out r
�C
an y
ou p
redi
ct h
ow m
any
child
ren
the
aver
age
5’9”
man
has?
Heig
htAv
erag
e #
of
Chi
ldre
n5'
2"
3.2
5'' 4
"5.
35'
6"
3.8
5' 8
"2.
05'
10"
6.1
6' 0
"3.
36'
2"
1.9
6' 4
"4.
3
Aver
age
No. o
f Chi
ldre
n in
Som
ewhe
revi
lle
01234567
5' 2"
5'' 4"
5' 6"
5' 8"
5' 10"
6' 0"
6' 2"
6' 4"
Heig
ht (f
t/in)
Children
Prob
ably
not
, the
dat
a is
unp
redi
ctab
le b
ecau
se it
is n
ot li
near
. In
fact
it is
not
ord
ered
at a
ll. I
t wou
ld b
e di
ffic
ult f
indi
ng A
NY
line
that
com
es c
lose
to a
ll th
e po
ints
. This
is th
e be
st fi
tting
line
-- b
arel
y
5' 9"
3.7?�

Abou
t rAb
out r
The
abili
ty fo
r a li
ne to
clo
sely
fit th
e da
ta is
its c
orre
latio
nco
effic
ient
, or
r val
ue.
r is
valu
ed b
etw
een
0 an
d 1,
0m
eani
ng N
O c
orre
latio
n an
d 1
mea
ning
per
fect
cor
rela
tion.
Mos
t sci
entif
ical
ly d
ata
falls
betw
een
the
two.
Aver
age
No. o
f Chi
ldre
n in
Som
ewhe
revi
lle
r = 0
.132
6
01234567
5' 2"
5'' 4"
5' 6"
5' 8"
5' 10"
6' 0"
6' 2"
6' 4"
Heig
ht (f
t/in)
Children
Aver
age
Weig
htHe
ight
Aver
age
# of
Child
ren
142
5' 2"
3.2
148
5'' 4
"5.
315
65'
6"3.
816
45'
8"2.
017
25'
10"
6.1
180
6' 0"
3.3
189
6' 2"
1.9
199
6' 4"
4.3
Aver
age
Mal
e W
eigh
t in
Som
ewhe
revi
lle
r = 0
..998
4
130
140
150
160
170
180
190
200
210
5' 2"
5'' 4"
5' 6"
5' 8"
5' 10"
6' 0"
6' 2"
6' 4"
Heig
ht (f
t/in)
Weight (pds)
Thus
, we
can
say
that
ther
e IS
aco
rrel
atio
nbe
twee
n he
ight
and
wei
ght,
but t
here
isN
OT
a co
rrel
atio
nbe
twee
n he
ight
and
no. o
f chi
ldre
n.
stro
ng c
orre
latio
nw
eak
corr
elat
ion

�So
wha
t doe
s thi
s hav
e to
do
with
che
mis
try?
�Th
e am
ount
of W
ürst
er d
ye p
rodu
ced
from
the
DPD
reag
ent i
s dire
ctly
pro
porti
onal
toth
e am
ount
of c
hlor
ine
in th
e sa
mpl
e. T
heco
lore
d dy
e is
resp
onsi
ble
for t
he a
bsor
banc
eat
520
nm.
�Th
us B
eer’
s law
tells
us t
hat t
he a
bsor
banc
eof
a sa
mpl
e w
ith e
xces
s DPD
will
be
dire
ctly
prop
ortio
nal t
o th
e am
ount
of c
hlor
ine
in it
.�
We
use
r to
chec
k ho
w w
ell B
eer’
s law
isw
orki
ng u
nder
spec
ific
labo
rato
ry c
ondi
tions
.
Abou
tAb
out rr