Embed Size (px)
Citation preview

Discussion Papers
Quantifying Impacts of Consumption Based Charge for Carbon Intensive Materials on ProductsStefan Pauliuk, Karsten Neuhoff, Anne Owen and Richard Wood
1570
Deutsches Institut für Wirtschaftsforschung 2016

Opinions expressed in this paper are those of the author(s) and do not necessarily reflect views of the institute. IMPRESSUM © DIW Berlin, 2016 DIW Berlin German Institute for Economic Research Mohrenstr. 58 10117 Berlin Tel. +49 (30) 897 89-0 Fax +49 (30) 897 89-200 http://www.diw.de ISSN electronic edition 1619-4535 Papers can be downloaded free of charge from the DIW Berlin website: http://www.diw.de/discussionpapers Discussion Papers of DIW Berlin are indexed in RePEc and SSRN: http://ideas.repec.org/s/diw/diwwpp.html http://www.ssrn.com/link/DIW-Berlin-German-Inst-Econ-Res.html

1
Inclusion of consumption of carbon intensive materials in emissions trading ‐ quantifying the impact across commodity groups
Stefan Pauliuk,1 Karsten Neuhoff,2 Anne Owen,3 and Richard Wood4
April 21st, 2016
After the Paris Climate Agreement, it is anticipated that carbon prices will differ across
regions for some time. If countries use free allowance allocation as carbon leakage
protection, only a fraction of carbon prices are passed through to consumers particularly by
carbon intensive materials producers. Adding a consumption charge based on benchmarks
applied to the material content can reinstate the carbon price signal. The paper investigates
the implications of such a consumption charge for industry and consumers based on
material flow analysis and material flow cost accounting. The material‐related carbon
liabilities for production, import, export, and consumption are estimated for 4000
commodity groups that contain one or more of the five bulk materials steel, aluminium,
plastics, paper, and cement. Assuming an underlying carbon price of 30 Euros per ton of
CO2, the total charge to European final consumers is estimated to be about 17 billion EUR.
The total charges levied on imports and those waived for exports are each of similar size and
roughly amount to half of the total charge to European final consumers. To reduce
administrative efforts, the charge is not levied on imported products for which the value of
the consumption charge compared to product price falls below a threshold. Thus
administrative efforts for 77 to 83% of imports could be avoided while still 85% to 90% of
import‐related carbon liabilities are included.
Keywords: Material flow analysis, Material flow cost accounting, Carbon Pricing, Inclusion of
Consumption, EU Emissions Trading System,
JEL classifications: F18 ‐ Trade and Environment, H23 ‐ Externalities; Redistributive Effects;
Environmental Taxes and Subsidies, Q56 ‐ Environment and Development; Environment and
Trade; Sustainability; Environmental Accounting
1) Faculty for Environment and Natural Resources, University of Freiburg, D‐79106 Freiburg, Germany, [email protected]‐freiburg.de
2) DIW Berlin, D‐10117 Berlin, [email protected]
3) School of Earth and Environment, University of Leeds, Leeds. LS2 9JT, United Kingdom, [email protected]
4) Industrial Ecology Programme, Norwegian University of Science and Technology (NTNU), N‐7491 Trondheim, Norway, [email protected]

2
1.Introduction
In Emission Trading Systems allowances are allocated for free to producers of carbon
intensive materials like steel, aluminium, paper, plastics, and cement. This free allocation
addresses concerns that additional costs for carbon emissions could result in relocation of
production or investment decisions towards regions with lower carbon prices, so called
carbon leakage (European Commission, 2016). The allocation of the allowances is based on
benchmarks so as to preserve incentives for efficiency improvements of primary production.
To ensure leakage protection and limit surplus allocation, the allocation is linked to activity
level requirements and production volumes. Together with the convergence of prices
through international trade this reduces the share of the carbon cost that is passed through
to material prices and reduces the economic incentives for more efficient usage of these
materials and material substitution. As final consumers do not pay for incremental costs,
also the business case for the development of technologies for material production at
incremental costs but with lower carbon emissions is reduced.
A consumption‐based charge for emissions intensive materials can re‐establish price signals
for more climate‐efficient material use in the manufacturing sectors and for end users
(Neuhoff et al., 2016). The administrative burden of its implementation can, if designed in
the right way, be moderate and does not provide disincentives for using recycled material or
material with lower carbon footprint.
The administration cost is limited by focusing on carbon intensive materials with the biggest
emission share. Complexity of tracing and monitoring is further reduced by using only one
emissions benchmark for each material, irrespective of the production process. This also
ensures compatibility with the rules of consumption charges. The benchmark for each
material should thus reflect the carbon intensity of the marginal unit of production to serve
final demand. With such a uniform approach, an appropriate incentive is provided
encouraging the use of higher value materials, materials substitution, or efficient material
use; any one potentially saving the emissions linked to this marginal unit. Incentives for
efficient production of materials by installations covered by the ETS continue to be provided
by the coverage of installations for material production and their electricity providers.
Installations incur costs for emissions above benchmark level and can benefit from
outperforming the benchmark.
We provide a quantitative analysis of the economic and administrative implications of
adding such a consumption charge to an ETS system (‘Inclusion of consumption’, IoC). Our
analysis gives an estimate of the total volume of liabilities created, the significance of
imports and exports, and the distribution of liabilities across commodity groups. We
motivate our analysis with three research questions, listed below. The analysis focuses on
the carbon intensive materials steel, aluminium, plastics, paper, and cement.

3
First, we investigate how big the liabilities are that are generated in the material production
industries and during import, and how big are the liabilities acquitted by final consumers or
exporters.
Second, we estimate the size of the liabilities relative to the product prices to get an idea of
how large price signals could be and to understand the impacts on product prices. This
estimate is the basis for the design of a de‐minimis rule for product categories on which at
the time of import no liability for the consumption charge needs to be created. The
objective of the de‐minimis rule is a limitation of administrative costs without creating
undue advantages along the value chain. We ask what price changes are to be expected if a
uniform system‐wide carbon liability for materials was implemented and how the price
changes are distributed across commodity groups.
Third, to keep the administrative burden low and the scheme effective, we assess how the
liabilities are distributed across the commodity groups. This includes identifying which
commodity groups are entirely made of steel, aluminium, plastics, paper, or cement: Their
associated liabilities can be determined from their weight alone.
2.Methodology
We applied a combination of material flow analysis (MFA) and material flow cost accounting
(MFCA) to estimate absolute and relative liabilities (Guenther, Jasch, Schmidt, Wagner, &
Huisingh, 2012; Kytzia, Faist, & Baccini, 2004; Pauliuk, Majeau‐Bettez, & Müller, 2015; A.
Schmidt, Götze, & Sygulla, 2014; M. Schmidt, 2014).
As basis for our estimates we used the Europe‐wide statistics on production, import, and
export of manufactured goods (ProdCom), which is published by EuroStat annually for 4047
commodity groups in a refined NACEv2 classification (Eurostat, 2013). ProdCom statistics
are reported in value units (EUR, layer 1) and volume units (kg for bulk materials, pieces for
most manufactured goods, m² for textiles…, layer 2). The geographical scope is the EU28,
the reference year we chose is 2012, the most recent year for which complete data were
available.
Figure 1 shows the system definition. For each investigated commodity, we determined the
apparent consumption with the market balance (equation 1):
Consumption = Production + Import – Export (1)
The system in Figure 1 was quantified for the flows of the different commodities for the
reference year 2012 and with the EU28 as regional scope. Quantification was done for the
monetary, physical, mass, and the five material layers for steel, aluminium, plastics, paper,
and cement.

4
Figure 1. System definition. The drawing shows the global market for a selected commodity X. In
total, 4047 such markets were considered.
We briefly describe the calculation scheme applied to the commodity markets and
introduce the central parameters for the MFCA, which are explained in detail below. Figure
2 shows the scheme of calculations that was applied to the flows shown in Figure 1.
In a first step, we filled data gaps for the physical ProdCom account. Then, we converted all
physical units to kg by multiplying the physical units with a conversion factor kg/unit. Then,
we multiplied the mass flows of the 4047 categories with a group‐by‐group estimate of the
material content for the six materials studied. We multiplied the so‐obtained flows of
embedded materials with the respective carbon emissions benchmarks for the six materials,
and obtained the carbon charge embedded in the product flows by multiplying the
embodied carbon emissions by the carbon price.
The five main results of the calculations are shown as grey boxes in Figure 2. We present the
equations for each of them:
2 2
Rel. embodied carbon = 1 unit × kg/unit × Material content × Carbon intensity
[ / ] = 1 [ / ] [ / ] [ / ] CO COkg kg unit kg unit kg kg kg kg (1)
2 2
Embodied carbon = Volume × kg/unit × Material content × Carbon intensity
[ ] = [ ] [ / ] [ / ] [ / ] CO COkg unit kg unit kg kg kg kg (2)
2
Rel. embodied liability = 1 unit × kg/unit × Material content × Carbon intensity × Carbon price
[€ / ] = 1 [ / ] [ / ] [ / ] [COkg unit kg unit kg kg kg kg 2
€ / ] COkg (3)
2
Embodied liability = Volume × kg/unit × Material content × Carbon intensity × Carbon price
[€] = [ ] [ / ] [ / ] [ / ] [€ /COunit kg unit kg kg kg kg kg 2] CO
(4)
Finally, by dividing the total embedded liability by the monetary value of the flow, we
obtained the ratio of liability to value, or – if the liability is paid – the relative price change
Rel. price change = 100 × Total liability / Value
[%] = 100 [€] / [€] (5)

5
For each of the five quantities, a sensitivity analysis was performed, and low, medium, and
high estimates were calculated, depending on possible variations in material content. A
ranking of the material content by group, the total liabilities by group, and the price changes
by group helped us to identify which commodities are the most and the least affected by
the emissions inclusion scheme, and our findings inform the discussion on threshold levels
and economy‐wide impacts. The quantitative results were obtained with a Python script.
Figure 2: Calculation scheme for the estimation of liabilities and price changes for the 4047 ProdCom commodity groups.
3.Datacollectionandrefinement
To estimate total liabilities we needed physical production and trade volumes at high
commodity resolution. These data were obtained from the ProdCom database (Eurostat,
2013). To be compatible with the ProdCom categorization we also estimated the relative
liabilities in the same classification. The ProdCom database is neither complete nor fully
reliable, and we had to estimate missing physical data and correct the price estimates. Our
treatment of the ProdCom raw data is documented here.

6
PhysicalandmonetaryproductionaccountsMonetary production and trade accounts are usually the ones with the best coverage, and
we used these data as our reference. These data were not corrected and no check for
completeness was performed. Physical data were often incomplete, however, and we
estimated some of the missing data. First, we aggregated both monetary and physical flows
to the 4‐digit NACEv2 classification, which includes 240 commodity groups at the 4 digit
level. For commodity groups with nonzero monetary flows but where no physical
production account was present, we used the monetary production figure multiplied with
the kg/EUR intensity of the corresponding 4‐digit aggregation of the ProdCom database to
estimate a proxy production mass flow. For some groups, no export and import‐related
physical data are present, and we then use the 4‐digit aggregation of the trade data to
determine a proxy in the same way as described above. In cases where there were no
physical trade data in the 4‐digit aggregation, we take the 4‐digit production account as
proxy to estimate the kg/EUR ratio for this aggregated group. With this method a mass flow
account could be estimated for about 25% of the 4047 groups. For some groups, however,
no physical data were present at all, and these groups (Table 1) were excluded from our
analysis.
Table 1. List of 4‐digit ProdCom groups where no physical data were available and that were
therefore excluded from our analysis.
NACE v2 Code Name Potentially relevant for IoC
1330 Dying and printing services No (Service)
1420 Articles of fur skins No
1812 Printed newspapers, books, maps, etc. Yes
1814‐1820 Printing and reproduction services No (Service)
2120 Medicaments and Vaccines No
2550 Die‐forged, drop‐forged, and extruded metal parts Yes
2561 Metallic coating and painting services No (Service)
2562 Turned metal parts Yes
2999 Flashlights, image and cinematic projectors etc. Yes
3212 Goldsmiths’ wares, other articles of precious metals No
3311‐3320 Maintenance, repair, and installation services No (Service)
With the monetary account remaining unrefined due to a lack of reference data, some
groups for manufactured products showed unrealistically high relative liabilities for
production flows, which were in some cases much higher than the relative liabilities for the
pure bulk materials. For example, ‘Weirs, sluices, lock‐gates, landing stages, fixed docks and
other maritime and waterway structures, of iron or steel, Structures and parts of structures
of iron or steel, n.e.s.’ (26601230) showed a relative liability of about 22%, whereas for
finished steel, it is only about 8%. Another example is ‘Artificial monofilament of <= 67
decitex […]’ (25112355), for which a relative price change for production of about 18% was
reported, whereas for plastics/polymers, it was only about 1.6 %. These reason for these
large relative liabilities stems from unrealistically low original average prices per kg in the
ProdCom Database and from uncertainties regarding the conversion from the physical units
to kg.
7
The large relative liabilities did not result from all ProdCom accounts, which is a further
indication for incomplete or erroneous data. For example, the calculated relative liabilities
for the import and export accounts, (not the production account) of ‘Artificial monofilament
of <= 67 decitex […]’ (20602400) was below 0.2%, which is more realistic since the relative
liability of plastics is about 1.6% and the degree of fabrication of artificial monofilaments is
higher than the one of plastics.
We considered those cases where the calculated relative liabilities are significantly higher
than the values for the pure bulk materials as outliers, and assume that in reality, products
from these groups would not experience such a large price increase under an
implementation of the consumption based charge. Therefore in the Python script we
performed the following refinement: For production, import, and export accounts, we
checked whether the relative liability was larger than the sum of the relative liabilities of the
constituting materials, weighted by their respective material content. If this was the case,
we checked whether the group is a pure bulk material. If yes, we replaced the calculated
value by the reference value for this bulk material, which are presented below. If not, we
took the relative liability of the 4‐digit aggregation as proxy.
Conversionofphysicalunitsintokg(kg/unit)The production and trade volumes of most manufactured goods and all vehicles are not
reported in kg, as required for the material content estimation, but in other physical units
including pieces (for manufactured goods, electronic components, or vehicles), square
metres (m², for textiles or glass), or compensated gross tonnage (CGT, for ships). All these
units had to be converted into kg in order to determine the material embedded in the mass
flows. There are no official or established data sets for the weight per unit for different
commodity groups. Although the classification is very detailed, the physical inhomogeneity
within a single group can be significant. Consider, for example, the group ‘Bodies for lorries,
vans, buses, coaches, tractors, dumpers and special purpose motor vehicles including
completely equipped and incomplete bodies, vehicles for the transport of <=10 persons’
(29201050). It is not possible to say what the exact mass of an item in this group is, not only
because it contains the bodies of different types of vehicles (lorries, coaches, tractors), but
mainly, because it not only contains completely equipped bodies, but also incomplete
bodies. Moreover, the composition of this group will change depending on where and when
it is measured. The import of this group to France in 2012 is likely to have a very different
composition from the production flow for this group in Sweden in the same year. The
kg/unit conversion factors that we compiled and estimated are therefore to be seen as
guidance values only that shall give a rough indication of the mass flows produced and
traded. This rough estimate is sufficient to give an overview of the magnitude of liabilities
embedded in manufactured goods and the relative price changes that are to be expected. It
cannot replace, however, the determination of the liability and the price change for a
specific good at a specific point in the economy.

8
Materialcontentforsteel,Al,copper,plastics,paper,andcement,groupbygroupThere are no official or established data sets for the material content of different
commodity groups. Although the classification is very detailed, the physical inhomogeneity
within a single group can be significant. Consider, for example, the group ‘Motor vehicles
with a petrol engine > 1500 cm³’ (29102230). Neither is it not possible to say what the exact
mass of an item in this group is, nor can we specific the material content with high accuracy.
The reason behind the first item is that the engine volume can take any reasonable value
larger than 1500 cm³ or the specific technology or degree of equipment of the vehicle is not
specified. The reason behind the second item is that there is considerable freedom in the
choice of materials. Next to steel, the vehicles could contain considerable amounts of
aluminium, carbon fibre or other fibre‐reinforced composites (Allwood et al., 2012;
Modaresi, Pauliuk, Løvik, & Müller, 2014). We applied a so‐called ‘bottom‐up’ approach
when determining the content of steel, aluminium, copper, plastics, paper, and cement of
the 4047 commodity groups, and assessed the uncertainty of our estimates.
Many groups, including agricultural products or minerals, clearly do not contain any of the
six materials within the scope. The material content of those groups was set to zero. Others,
for example, steel or plastic bulk commodities, have a definite material content of close to
100%. The material content of those groups was set to values between 96% and 100% to
take into account the content of possible alloy elements or other additives. For all other
groups, including all manufactured products, our estimation of material content group by
group relies on expert knowledge and previous experience in tracing steel, aluminium, and
cement through the world economy using the SITC1 classification (Liu & Müller, 2013;
Müller et al., 2013; Pauliuk, Wang, & Müller, 2013). Moreover, we could use the peer‐
reviewed published results of the STAF project for estimating the steel and aluminium
content of manufactured goods (Graedel et al., 2004; Johnson, Schewel, & Graedel, 2006).
The results of the previous studies were matched to the NACEv2 classification and then
checked group‐by‐group and refined where necessary. Uncertainties were estimated and in
the dataset. In general, uncertainty is lowest for product groups with very high content of a
specific material (down to +/‐ 5 percentage points), and highest for manufactured products
with only minute amounts of materials.
Carbonemissionsbenchmarksforsteel,aluminium,plastics,paper,andcementTo estimate the embodied GHG emissions in the five materials, we constructed process
chains for the production of each material, in which the material or its precursors
accumulate embodied GHG emissions (Figure A1). To quantify the emissions in the process
chain of the products we combined process inventory data from the Ecoinvent life cycle
database (Ecoinvent Centre, 2014) with current process‐specific EU‐ETS benchmarks for
direct emissions (European Commission, 2011) and electricity use (European Commission,
2012a, 2012b). The existence or non‐existence of EU‐ETS benchmarks defined the scope of
the process chain. This combination of EU‐ETS process benchmarks with a simple product
system model gave us product‐specific benchmarks for the carbon emissions embodied in
the five materials. For each material a specific system for its primary production was drawn
and all relevant EU‐ETS benchmarks were included (Figure A1). The resulting product‐

9
specific benchmarks are listed and explained below (in tons of CO2‐eq. per ton of material).
For all electricity use a benchmark of 0.76 t CO2 per MWh was used, which is the EU‐ETS
benchmark of electricity generation in West Central Europe, and which lies roughly in the
middle of the spectrum of the carbon intensity of European power production (European
Commission, 2012a, 2012b).
Steel: 1.78: The process chain for steel contains the production of coke and iron ore
sinter with their respective EU‐ETS benchmarks, the blast furnace, which is also
included (EU Directive, L130/19), and the basic oxygen furnace with subsequent casting
and rolling, for which the EU‐ETS specifies a benchmark for electricity use (2012/C
387/06, and EU Communication, C158/22). We assumed that all iron is supplied by pig
iron from the blast furnace.
Aluminium: 12.82: The process chain for aluminium production contains the production
of refined aluminium oxide and the associated electricity generation, the production of
the anodes for the alumina reduction process, and the electrolysis with process
emissions (EU Directive, L130/20) and associated electricity generation (2012/C
387/06). Electricity‐related emissions for the electrolysis contribute with about 10.8
tons to the total product benchmark.
Cement: 0.69: For grey cement klinker a benchmark for the rotary kiln of 0.766 is given
(EU Directive, L130/20). The clinker content of cement varies and the exact benchmark
for cement is therefore subject to debate. We assumed a system‐wide klinker content
of cement of 90% according to ecoinvent, which gives a benchmark for cement of 0.69.
Electricity‐related emissions, for example in the klinker mill, are not included in the EU‐
ETS.
Paper: 0.40: For paper production we included both the paper and the pulp mill.
According to Ecoinvent about one ton of pulp is required per ton of paper. For pulp we
took the average of the EU‐ETS benchmarks for long and short fibre pulp (0.06 and 0.12)
and for paper we took the average of the EU‐ETS benchmarks for newsprint and fine
paper (0.298 and 0.318, EU Directive, L130/24 + 25).
Plastics: 1.5. Polyvinyl chloride (PVC) is the only plastic for which the EU‐ETS covers the
polymerization process. A process chain for PVC was constructed using stoichiometric
data on the vinyl chloride monomer content of PVC (100%) and the chlorine content of
vinyl chloride (57%). Electricity‐related emissions for chlorine production as well as
direct emissions from the monomer production and the polymerization steps were
included as well (EU Directive, L130/28). The product‐related benchmark was found to
be 1.50, and the main contributor is the chorine production step with ca. 70%. No
analogue calculation for the other major plastics, including polyethylene (PE),
polypropylene (PP), and polystyrene (PS) could be performed since the polymerization
of these plastics is apparently not directly reflected in EU‐ETS benchmarks. A
comparison of the cradle‐to‐gate CO2 emissions of the four plastics from Ecoinvent data
showed that PVC (with 2.3 kg CO2 per kg PVC) is in the middle of the spectrum of CO2
intensities (1.5 kg CO2 per kg PE, 1.7 kg CO2 per kg PP, and 2.7 kg CO2 per kg PS). We
therefore used the PVC product benchmark as proxy for plastics, acknowledging that

10
this assumption needs to be refined in the future and that actual plastics‐related
embodied emissions that are within the scope of the EU‐ETS might be lower than the
benchmark used in this work.
The resulting product‐related benchmarks comprising the relevant production steps are
listed in Table 2.
Table 2. Emissions benchmarks used for determining the volume of liabilities incurred and acquitted.
Material
Emissions benchmark for
primary production (kg CO2/kg)
Reference Liability for 100% material content
(EUR/ton)
Steel 1.78 EU‐ETS, ecoinvent 53 Aluminium 12.82 EU‐ETS, ecoinvent 385 Plastics 1.50 EU‐ETS, ecoinvent 45 Paper 0.40 EU‐ETS, ecoinvent 12 Cement 0.69 EU‐ETS, ecoinvent 21
Carbon price (Euro/kg of CO2)
0.03 Assumption
The carbon price was assumed to be at 30 €/ton CO2, or 3 Cent/kg CO2, which is a
hypothetical but possible price for the next decades, when deep decarbonisation may take
place.
With a given carbon benchmark for a material, one can calculate the maximum absolute
price change due to the carbon liabilities for materials for a ton of product, which would
occur if the product consisted to 100% of the given material (equ. 7).
Max. price change / kg = Carbon footprint / kg * carbonprice / kg (6)
Results for the maximum absolute price change (or the liabilities for pure materials) are
shown in the rightmost column of Table 2. With the given emissions benchmarks and carbon
price, they range from 12 Euro/ton for paper to 385 Euro/ton for aluminium.
CommoditypricesTo convert the carbon footprints per monetary unit of output into emissions benchmarks
per mass (t/t), we divided the monetary benchmarks by the average price of supplying one
ton of material. We used average commodity prices for the reference year 2007, which
were obtained from a number of price index databases (Table 3). The reference year 2007
was chosen for compatibility reasons, as we also used the multi‐regional input output model
EXIOBASE for the analysis of the consumption based charge, and these data have 2007 as
their reference year.
11
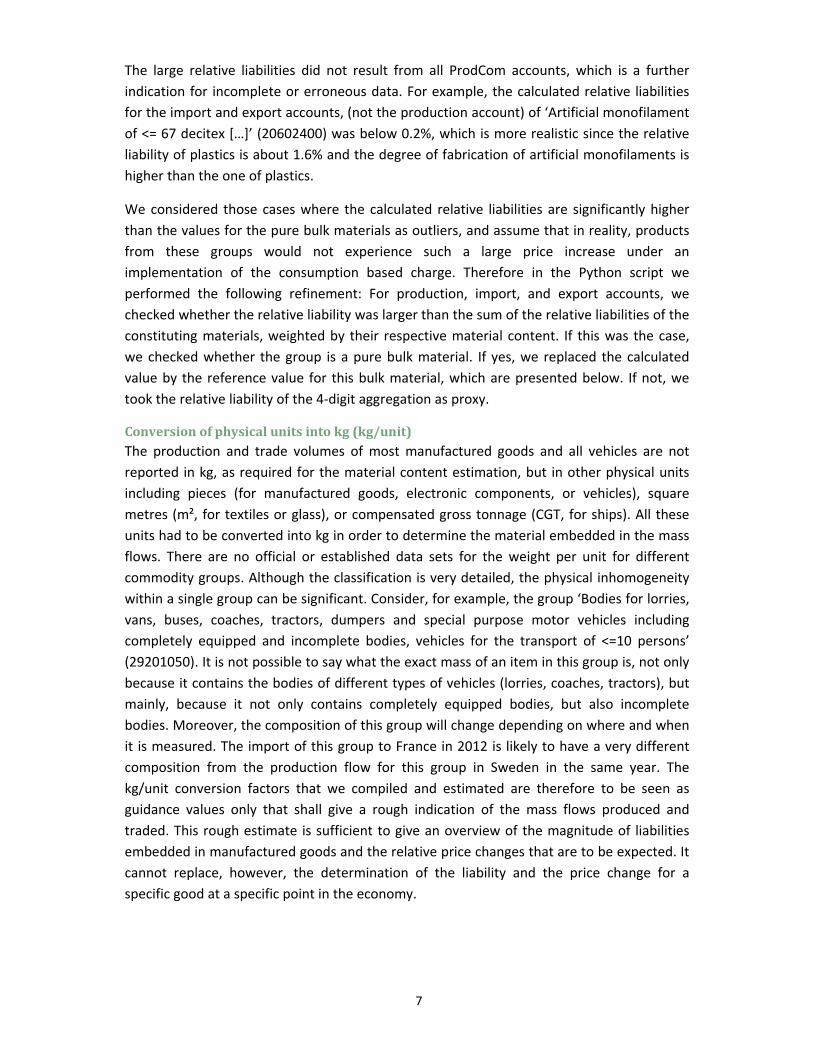
Table 3. Average commodity prices and references.
Material
Average price, 2007, MEUR/ton Reference
Steel 0.000475 http://www.indexmundi.com/commodities/?commodity=cold‐rolled‐steel&months=300¤cy=eur
Aluminium 0.001900 http://www.indexmundi.com/commodities/?commodity=aluminum&months=300¤cy=eur
Plastics 0.000825 http://www.plastemart.com/lme_prices.asp?pricedate=2/10/2007
Paper 0.000800 Metsä Board's 1Q 2014 interim report presentation
Cement 0.000075 http://minerals.usgs.gov/minerals/pubs/commodity/cement/myb1‐2007‐cemen.pdf
TotalproductionvolumesTable 4 shows the total production volumes for the six materials studied. These values were
used to estimate the total liabilities generated during production.
Table 4. Production volumes of the six materials studied, EU28, 2012, in Mt.
Material
Total production, EU28, 2012, Mt Reference
Steel 160 WorldSteel: Steel Statistical Yearbook, 2015
Aluminium 3.6 http://www.world-aluminium.org/statistics/
Plastics 57 http://www.plasticseurope.org/documents/document/20150227150049-final_plastics_the_facts_2014_2015_260215.pdf
Paper 100 http://www.cepi.org/system/files/public/documents/publications/statistics/2015/Key%20Statistics%202014%20FINAL.pdf
Cement 170 http://www.cembureau.be/sites/default/files/Cement%20production%20in%20CB%20and%20EU28.pdf
4.Resultsanddiscussion
AsystemsperspectiveoncommodityflowsunderInclusionofconsumptionA consumption charge is applied to all goods sold to domestic consumers, irrespective of
location of production or type of production process. Thus it also applies to imported goods
so that final consumers see the same price signal for both imported and domestically
produced goods. On the other hand, there should be no charge imposed on exported goods.
These requirements lead to a scheme of liability creation and acquitting associated with
material‐intensive commodity flows (Figure 3). At the point of production, a liability is
created for each material that falls under the scheme (case (1) in Figure 3). The liability is
also created if the relevant materials are imported (case 6, 7, 8). The material‐related
liability is calculated as the product of the weight of material produced, the material‐specific
carbon benchmark, and the current carbon price. Companies can register for duty
suspension agreement (DSA). In this case companies can acquire and handle materials with
the charge without payments for the liability. They pass the liability along the value chain
with the products sold.
Firms within the DSA can choose to pay the liabilities (case 4, 5) or pass it on to registered
parties (case 2, 3). Firms will likely chose to directly pay the liability to avoid administrative

12
efforts if price changes are minute or products are not intended for exports. Hence
domestic consumers will bear the consumption charge, irrespective of location or process of
the production. This creates incentives for final consumers, but probably more relevant,
intermediate consumers – namely manufacturers – to use materials more efficiently or
substitute with less carbon intensive options.
To avoid charges on foreign consumers, the liability is acquitted if materials or products are
exported (case (6)). However, if domestic firms that chose not to participate in DSA export
products, then the liability can no longer be acquitted. To avoid incentives for fraud,
financial compensation of previously incurred consumption charges is not envisaged (case
(10)).
The central policy design choice that will determine the administrative efforts and incentives
that result from the consumption charge is the definition of the de‐minimis rule. For which
product categories do importers not incur a liability and are consumers of imported
products therefore exempt from the consumption charge?

13
Figure 3: Scheme of commodity and liability flows under the inclusion of consumption. The different cases (1)‐(10) are explained in the text above
Totalliabilitylinkedtodomesticproduction,consumption,importsandexportsIn 2012, industry within the EU28 countries produced about 160 Mt of steel, 3.6 Mt of
aluminium, 57 Mt of plastics, 100 Mt of paper, and 170 Mt of cement (Table 5). With the
given EU‐ETS emissions benchmarks and an assumed carbon price of 30 €/ton of CO2, these
production volumes correspond to liabilities of about 8500 MEUR for steel, 1400 MEUR for
aluminium, 2500 MEUR for plastics, 1200 MEUR for paper, and 3600 MEUR for cement. The
liabilities per ton of material differ substantially across materials, which is a result of
differences in carbon intensity. For paper and cement the charge is 12 and 21 €/ton
respectively, for plastics and steel 45 and 53 €/ton, and for aluminium about 385 €/ton.

14
Table 5: Material production, EU‐ETS benchmarks, and total liabilities created, EU28, 2012. Data sources are listed in the methods section.
Material
Total production, EU28, 2012, Mt
EU-ETS benchmark t CO2-eq/t
Liability per ton (EUR)
Total liability created within EU28 (MEUR)
Steel 160 1.780 53 8500
Aluminium 3.6 12.82 385 1400
Plastics 57 1.5 45 2500
Paper 100 0.4 12 1200
Cement 170 0.69 21 3600 Carbon price: EUR/t of CO2
30 Sum 17200
The total volume of liabilities for the five materials in 2012 was about 17.000 MEUR. In
addition to the liabilities for production, Table 6 shows our estimates of the liabilities
created during import and acquitted during export. In import flows, aluminium‐ and steel‐
related liabilities each account for more than one third of the total. For export steel‐related
liabilities dominate with a share of more than 50%. The total trade‐related liabilities roughly
balance. Total liabilities (right column) were calculated as liabilities created plus import‐
related minus export‐related liabilities. The first estimate of the magnitude of the total
liabilities acquitted shows that total revenues of about 17.5 billion Euros would be
generated with a carbon price of 30 €/ton and 2012 production levels. Of this amount,
about 43% would stem from steel‐related liabilities, followed by 20% for cement.
Aluminium‐ and plastics‐related liabilities would contribute with about 16% each, and paper
about 6%.
Table 6: Total liabilities created and acquitted, EU28, 2012.
Material
Liability created within EU28 (MEUR)
Liability created during import (MEUR)
Liability acquitted during export (MEUR)
Liability paidby EU28 consumers (MEUR)
Steel 8500 3500 4450 7550
Aluminium 1400 3500 2200 2700
Plastics 2500 1700 1400 2800
Paper 1200 60 190 1050
Cement 3600 56 260 3400
Sum 17200 8800 8500 17500
With the given benchmarks and a carbon price of 30 €/t of CO2, the material‐related
financial burden for final consumers within the EU would be in the range of 15‐20 billion
Euros.
The values presented in Tables 5 and 6 are only rough estimates, which depend on the
actual material content of the traded commodities. Table 7 gives an impression of the
possible variation of the trade‐related liabilities as a result of variations in the material
content of commodity groups. The sensitivity analysis showed that relative uncertainties of

15
±15% to ±25% are associated with variations in the content of steel, aluminium, and plastics
of traded goods. This variation is a result of our ignorance of the exact material content of
aggregated commodity groups such as motor vehicles, textile machines, or agricultural
equipment. Paper and cement, which are mostly traded in pure form, exhibit no such
variation.
In order to handle the variation of the material content in practice, one can imagine that a
default material content is defined for each commodity group, which is then used to
determine the default liability. If an importer can document a lower or different material
composition, only then would the liabilities created be adjusted.
Table 7: Total liabilities incurred at point of import and acquitted at point of export, for low, medium, and high estimates of material content, respectively. Scope: EU28, production levels of 2012, carbon price 30 €/ton. All values in MEUR.
All values in MEUR
Import (incurred liabilities) Export (acquitted liabilities)
low medium high Low medium high
Steel 3041 3539 3734 3910 4459 4624
Aluminium 2669 3470 3958 1147 2196 2833
Plastics 1309 1684 2010 1126 1368 1529
Paper 59 59 59 186 187 187
Cement 56 57 57 257 261 265
Total 7136 8808 9818 6625 8470 9439
With the total amounts of liabilities known, we now turn our focus on how the liabilities per
unit of product compare to commodity prices.
PriceschangesfordifferentcommoditygroupsWith the average commodity prices, the EU‐ETS benchmarks, and the carbon benchmark
the relative liabilities for the five materials were calculated as the ratio between liability per
ton and the material price per ton.Table 8 summarizes our findings for commodity prices, the emissions benchmarks, the
liabilities per ton, and the relative price changes that would result. Relative liabilities are
lowest for paper (about 1.5%) and plastics (about 6%). Higher relative liabilities result for
steel (11%), aluminium (20%), and cement (28%).
If the price of a commodity per kg is known, the emissions‐related liability can be expressed
in % of that price. If delivered to a final consumer or a company outside the duty suspension
agreement (DSA), the liability would be paid and the price of the commodity would change
accordingly.

16
Table 8. Relative liabilities for pure bulk commodities.
Material Average price, 2007, MEUR/ton
EU-ETS benchmark t CO2-eq/t
Liability per ton (EUR)
Relative liability / price change (%)
Steel 0.000475 1.780 53.4 11.2
Aluminium 0.001900 12.82 384.6 20.2
Plastics 0.0008250 1.5 45.0 5.5
Paper 0.000800 0.4 12.0 1.5
Cement 0.000075 0.69 20.7 27.6
Carbon price: EUR/t of CO2
30
Figure 4 shows typical relative liabilities (price changes) for selected commodities that
contain only one material (Figure 4a) and manufactured goods that contain significant
amounts of steel, aluminium, and plastics (Figure 4b). Relative price changes reach from
about 28% for cement clinker1 to about 8% for flat‐rolled non‐alloy steel, 17% for aluminium
alloy plates, about 3% for ethylene polymers and approximately 1% for uncoated paper.
Figure 4. Typical relative liabilities (price changes) for selected commodities, production in the EU28 in 2012. In plot b) price changes are depicted for high (narrow column, left), medium (wide column, centre), and low (narrow column, right) values of material content.
1 ProdCom reports a price of about 150 €/t, which is about twice the world market price of 75 €/t reported by the USGS and confirmed by experts. We disregarded the ProdCom data and took the USGS value as the reference.

17
Figure 4a also shows the relative liabilities (price changes) for manufactured goods that
consist solely of one of the six materials being evaluated. These products show price
changes between 9% for concrete building blocks (cement content estimated to be 20%),
about 5% for sanitary ware of aluminium, about 0.3% of saw blades for working metal (steel
content 95%), and roughly 1% for plastic boxes. The relative price changes of the
manufactured products are consistently lower than those of the bulk materials, which is a
consequence of the higher shares of value added in these products compared to the bulk
materials.
Figure 4b shows the typical ranges of relative liabilities (price changes) for manufactured
consumer products and industrial equipment. The price change for these types of goods
typically lies between 0.1% and 1.5%. For most manufactured goods with significant
liabilities, aluminium and steel are the largest contributors, followed by plastics. The
sensitivity analysis shows that because of large possible variations in the material content of
product groups, a direct consequence of their diversity, the resulting price changes form a
range of possible values rather than specific fixed values.
To further illustrate the progression of liabilities along the value chain, we study the
example of a typical European passenger vehicle of a weight of 1300 kg, a basic price of
10000 €, a steel content of 800 kg, an aluminium content of 100 kg, and a plastic content of
200 kg (Modaresi et al., 2014). We consider three stages of the value chain: raw material
production where liabilities are created, component manufacture represented by gearbox
and seat manufacturing, and the car manufacturing plant (Figure 5).
Figure 5. Simplified value chain of a passenger vehicle. Three materials (steel, aluminium, and plastics) and two components (gearbox and seats) are considered. The figure shows the material contained (in kg), the total liability (in €), and the liability as fraction of the basic price (in %) for the sum total (bold face), and for steel (dark blue), aluminium (light blue), and plastics (brown), respectively.

18
The relative liability decreases at every step in the value chain, as the share of cumulative
valued added of the products’ prices becomes larger. While finished steel has a relative
liability of about 11%, the gearbox has one of about 1.3%, and in the car, steel‐related
liabilities account for only for 0.43% of the basic price. With current benchmarks and a
carbon price of 30 €/t, each buyer of a car would have to pay for material‐related liabilities
of about 90 €, of which 43 € are associated with steel, 38 € with aluminium, and about 9 €
with plastics. Because of the possible variations of the material composition of cars, these
values are rough indicators only that show the order of magnitude of liabilities. The largest
price signal is sent to the first users of finished materials, and these users often are also the
ones who make the design choices; for example, the car seat manufacturer shown in
Figure 5.
We now present the overview of expected commodity price changes for the entire EU28.
Figure 6 shows a histogram plot of the number of ProdCom categories that experience a
certain price change if sold to a consumer within the EU28. The EU ProdCom database
contains data on production volumes, imports, and exports for 4047 commodity groups,
both in in monetary units (EUR) and in physical units (kg or pieces) (Eurostat, 2013).
ProdCom data can be used to estimate relative liabilities for only those groups where both
physical and economic production data are reported.
Figure 6. Histogram of the number of ProdCom groups with a certain relative liability (in %). Results are shown for the 2012 production flows within the EU28, five materials, and the sum total of the relative liabilities of the five materials.

19
This includes 3294 of 4047 groups for the production account. Out of the 4047 groups in the
ProdCom database, 2573 groups for steel and 4029 groups for cement show a price change
of 0 to 0.01%. The vast majority of the remaining groups for steel, aluminium, and plastics
show price changes between 0.01 and 5%; these are groups where the materials were used
in the manufacturing of products (metals and plastics). Cement and paper, which are often
sold in pure form to final consumers (or concrete for cement), tend to carry higher relative
liabilities.
The largest relative liabilities and associated price signals would occur for cement, with
relative liabilities of up to 28%, followed by aluminium with up to 20%, steel with up to 11%,
plastics with up to 6%, and paper with up to 2%. One can also say that cement is cheap
compared to its embedded carbon liabilities, whereas plastics is already relatively expensive
compared to its carbon intensity.
Table 9 shows the same information as displayed in Figure 6, in a histogram where the 4047
ProdCom groups are allocated into bins according to their relative liability (liability per kg in
% of product price per kg). Results include total production, primary material production,
import, and export flows and the relative liabilities associated with the five materials and
the sum total, broken down in intervals from < 0.01% to 50%.
Table 9: The 4047 ProdCom groups sorted by liability per unit relative to price for the production flows of the EU28 in 2012.
Production Ste
el, l
ow
Ste
el, m
ediu
m
Ste
el,
hig
h
Al,
low
Al,
med
ium
Al,
hig
h
Cem
ent,
lo
w
Cem
ent,
m
ediu
m
Cem
ent,
hig
h
To
tal,
low
To
tal,
med
ium
To
tal,
hig
h
< 0.01% 2703 2573 2544 3818 2981 2906 4030 4029 4029 1897 1793 1780
0.01%-0.02% 82 89 75 25 139 91 0 0 0 108 62 39
0.02%-0.05% 187 163 153 45 209 190 1 1 0 196 162 132
0.05%-0.1% 154 177 174 34 170 173 0 0 1 233 175 156
0.1%-0.2% 193 185 192 28 203 188 0 0 0 275 242 223
0.2%-0.5% 250 284 310 30 164 233 0 0 0 420 459 441
0.5%-1% 144 191 191 15 69 120 2 2 1 293 343 377
1%-2% 104 133 150 8 50 59 3 2 1 270 380 422
2%-5% 131 152 154 13 27 44 6 7 7 210 267 290
5%-10% 87 89 93 15 19 26 2 2 3 113 127 145
10%-20% 12 11 11 15 15 16 0 1 2 28 33 38
20%-50% 0 0 0 1 1 1 3 3 3 4 4 4
The distribution in Table 9 gives a clear hint on that relatively few commodity groups include
the bulk of the total liabilities, and Table 9 and Figure 6 show that relative liabilities are
below 1% for more than 85% of all commodity groups.

20
Commoditygroupswithonlyonematerial–andwithminutesharesofmaterialsTable 10 shows the number of commodity groups whose material content lies above the
four thresholds of 0, 0.1, 0.5, and 0.95, respectively. Results are given for the low, medium,
and high estimate of material content, respectively.
The vast majority of the commodity groups with material content larger than 0.95 are the
pure bulk material groups like ‘Tubes and pipes, of non‐circular cross‐section, seamless, and
hollow profiles, seamless, of steel’ (24201400) or ‘Polyvinyl chloride, not mixed with any
other substances, in primary forms’ (20163010). For aluminium, plastics, paper, and cement,
the number of categories with pure materials (>0.95) is rather insensitive to the possible
variations in material content. Steel represents an exception, as for the high material
content estimate, 334 groups are included, which is 60 groups more than for the average
estimate. The reason is that there are several groups of manufactured products, mostly
machines, containing a very high average share of steel (around 0.8) and that can
sometimes be made almost entirely out of steel. Examples include ‘Machines for working
wire (excluding draw‐benches, thread rolling machines)’ (28413450) or ‘Centrifugal pumps
with a discharge outlet diameter > 15 mm, multi‐stage (including self‐priming)’ (28131460).
Table 10. Number of commodity groups in ProdCom in NACEv2 classification, whose material content exceeds 0, 0.1, 0.5, and 0.95 kg/kg, respectively. The total number of groups in the ProdCom NACEv2 classification is 4047. The table shows the counts for the lower (left), medium (middle, bold), and higher (right) estimates for material content.
Total Entries not 0 Entries > 0.1 Entries > 0.5 Entries > 0.95
Iron/steel
4047
1699‐1832‐1832 1544‐1733‐1761 966‐1403‐1512 274‐274‐334
Al 297‐1387‐1387 71‐88‐360 35‐50‐50 26‐26‐32
Plastics 1091‐1941‐1941 902‐1012‐1161 348‐400‐612 278‐278‐300
Paper 136‐136‐136 135‐136‐136 133‐133‐134 116‐116‐116
Cement 19‐20‐20 19‐19‐19 4‐4‐4 4‐4‐4
Table 10 also shows that less than half of the commodity groups have noteworthy
concentrations of the five materials. If one would use a content of 10% as threshold for
inclusion in the scheme, still, 1544‐1761 commodity groups would have to be considered for
steel, 902‐1161 for plastics, 71‐360 for aluminium, 135‐136 for paper, and 19 for cement.
Quite a large number of groups consists of more than 50% of a certain material, this affects
966‐1512 groups for iron/steel, 35‐50 for aluminium, 348‐612 for plastics, about 134 for
paper, and only 4 for cement.
Commodities with insignificant amount of the five materials covered by the consumption
based charge mostly belong to one of the following groups: agricultural products (other
than paper/pulp), chemicals (other than plastics), ceramics, nonferrous metals (other than
aluminium), and services.

21
CommoditygroupsaccordingtotheircontributiontototalliabilityCement and aluminium lead the list of production‐related liabilities, ranked by liabilities
embedded for the EU28 in 2012. (See Table A1 in the Annex). Aluminium (unwrought, alloy
bars, and rods) and steel (flat rolled) lead the list of import‐related liabilities (Table A2 in the
Annex). About 13 of the top fifty groups in the production table are finished steel
commodities and about 10 groups are finished aluminium metal groups. About 15 out of 50
groups are manufactured products or parts thereof, led by ‘weirs and lock‐gates’ (place 6,
probably due to a mistake in the physical flow account), ‘gear boxes and parts thereof’
(place 8), and ‘motor vehicles with petrol engines’ (place 11).
More than 50% of the 4047 ProdCom commodity groups contribute with less than 100,000
EUR to the total production‐related liabilities (Table 11). In contrast, the number of groups
with production liabilities of 10 MEUR or more is limited to 252‐298 for steel, 53‐132 for
aluminium, 131‐175 for plastics, 30 for paper, and 12‐13 for cement. Table 11 shows that
there is at least one commodity group for each of the five materials that contains liabilities
of 100 MEUR or more.
Table 11: The 4047 ProdCom groups sorted by amount of liability for the production flows inside the EU28 in 2012.
Production Ste
el, l
ow
Ste
el, m
ediu
m
Ste
el,
hig
h
Al,
low
Al,
med
ium
Al,
hig
h
Cem
ent,
lo
w
Cem
ent,
m
ediu
m
Cem
ent,
hig
h
To
tal,
low
To
tal,
med
ium
To
tal,
hig
h
< 0.1 MEUR 2926 2798 2761 3851 3210 3128 4031 4030 4030 2215 2056 2008
0.1-0.5 MEUR 304 330 329 63 351 303 1 0 0 478 426 390
0.5-1 MEUR 138 153 162 25 110 149 1 1 1 207 237 236
1-5 MEUR 324 350 353 41 228 265 2 2 2 486 532 559
5-10 MEUR 103 133 144 14 39 70 0 2 1 191 241 235
10-50 MEUR 162 183 196 26 64 79 3 2 2 306 360 410
50-100 MEUR 35 45 44 9 17 21 1 2 2 68 88 93
100-500 MEUR 48 48 51 11 21 24 5 5 6 79 86 92
500-1000 MEUR 6 6 6 5 5 6 1 1 1 12 16 18
> 1000 MEUR 1 1 1 2 2 2 2 2 2 5 5 6
We further explore the distribution of liabilities across commodity groups in Table 12, where
we show the minimum number of ProdCom categories that need to be included in the
scheme to cover the indicated percentage of total liability. These results were obtained by
ranking all commodity groups by contained total liability for the five materials. Table 12 also
shows the value of imports or exports that relates to the trade in these product categories.

22
Table 12. Result of a ranking of all 4047 commodity groups by the amount of liabilities contained. The table shows the minimum number of categories that cover a certain percentage of all liabilities contained in imported and exported commodities, and the value of trade in these product categories.
Import Export
Percentage of liability
Number of ProdCom categories included
Value of imports included, billion EUR
Number of ProdCom categories included
Value of exports included, billion EUR
5 1 4 2 77
10 2 8 4 81
15 2 8 6 83
20 3 11 10 88
25 5 14 15 107
30 9 17 22 128
35 15 32 29 137
40 23 51 38 150
45 32 68 48 165
50 45 84 61 197
55 62 98 78 227
60 83 125 100 249
65 110 141 129 275
70 148 170 165 305
75 198 200 214 336
80 266 286 280 377
85 364 337 371 424
90 517 401 515 524
95 798 517 771 654
100 2251 750 2251 999
If the commodity groups with the largest associated liabilities were monitored first, 90%
coverage of trade‐related liabilities could be achieved by including between 500 and 550
groups. Since trade volumes can change quickly and other groups contain higher relative
liabilities, the scheme should potentially not only include those groups with historically high
total liabilities but also those groups with high relative liabilities, which we identify in the
last step of our analysis.
CombinedanalysisFinally, we summarize our findings on the distribution of liabilities across commodity groups
and the possible relative price changes by showing how liabilities are distributed across
imported (Figure 7) and exported (Figure 8) commodities.
All import and export flows are ranked according to their relative liability (in %) and then
this relative liability was plotted over the cumulative imports and exports. This means that
the area of each bar represents the total liabilities embedded in the trade of this particular
group, broken down into the five materials studied.
In contrast to table 12, in Figures 7 and 8 also product groups are identified with a low
overall size, but a significant liability measured as share of the product price.

23
Figure 7. Imports into the EU28 in 2012, cumulative, sorted by relative liability or price change (%).
Steel (blue) and aluminium (green), as well as products consisting mostly thereof dominate
the liabilities created during import and waved during export. Trade of plastics (red), and
paper (orange) also plays a role as there are some commodity groups that consist entirely of
these two materials.
Pure bulk material groups of cement, steel, and aluminium, with relative liabilities of more
than 5%, are mostly found on the left side of the curves; parts and components, such as
road wheels or pneumatic tyres, are found in the middle with relative liabilities between 1
and 2 %; and manufactured goods with a relative liabilities of below 1% can be found on the
right side.
The liability as share of product price exceeds 1% in about 950 commodity groups that
account together for 17% of imports. These 17% of imports comprise 86% of all import‐
related liabilities. To increase the coverage to 90% of all trade‐related liabilities in imports,
product categories with a liability share of product price exceeding 0,73% need to be
included, accounting for about 1100 ProdCom commodity groups and 21% of total imports
by value.

24
Figure 8. Exports from the EU28 in 2012, cumulative, sorted by relative liability (price change) (%).
For practical implementation it might be warranted to consider all import categories
exceeding a product price increase threshold of, for example, 1%, and then to then add
additional product categories exceeding the 0,73% threshold where this would be necessary
to avoid incentives for shifting final assembly of products to foreign territory. Thus the total
number of considered product categories may be between 900 and 1100 comprising 17% to
21% of total imports. If initially coverage is limited to a sub‐set of the materials that
comprise the bulk of emissions and thus also mitigation potential, for example steel,
aluminium and cement, then the number and share of product categories considered could
be reduced.
5.Conclusion
We studied how liabilities from including the consumption of five materials (steel,
aluminium, plastics, paper, and cement) in the EU‐ETS are distributed across the 4047
commodity groups, and how commodity prices would change if liabilities were to be paid by
final consumers.
With current EU‐ETS benchmarks and a carbon price of 30 €/ton of CO2, the total liability
attributed to European consumers would be in the order of 17 billion € per year. Import‐
and export‐related liabilities roughly balance, they account each for about 8.5 billion € per

25
year or roughly 50% of the total amount of liabilities acquitted by consumers within the
EU28.
For the manufactured goods, liabilities and price changes were computed using physical
ProdCom data, which are often incomplete and which had to be converted from per unit to
per kg. If price changes were higher than prices changes for pure bulk material commodities,
these results were considered outliers and they were replaced by the average price change
for the aggregated commodity group on the 4‐digit NACE level.
We found that liabilities are unequally distributed across commodity groups. Expressed in
terms of commodity prices, liabilities for finished steel, finished aluminium, and cement
product groups are between 11% and 28%. Relative liabilities for most manufactured goods
are below 2%.
For domestically manufactured products, the liability is traced from the inputs of the basic
materials and will thus be accurately reflected. For imported products, a default material
content could be set for each group, and liabilities would be determined using that content.
Lower liabilities would only be created if the material content is reported.
A de‐minimis rule reduces administrative requirements by defining product categories for
which at the time of import no liability for the consumption charge is incurred. This should
both retain effective incentives and avoid undue discrimination between domestic and
foreign produced materials. For the five materials considered we find that coverage of 85%‐
90% of the liability for the consumption charge relating to imports can be ensured if 900‐
1100 ProdCom product categories are covered comprising 17%‐21% of imports by value. If,
during an initial stage of the scheme, coverage was limited to a sub‐set of the materials that
comprise the bulk of emissions and thus also mitigation potential, for example steel,
aluminium and cement, then the number and share of product categories considered could
be reduced.
Roughly 50% of the groups in the monitored fraction are pure bulk material groups, which
contain 95% or more of one material and whose liabilities can be determined directly from
the commodity weight. For the remaining groups material content exhibits significant
variations, especially within the groups for manufactured products. The uncertainty of
material content for manufactured goods is a result of the inhomogeneity within the already
highly disaggregated product categories.
Overall we find that availability and quality of data is well suited to support a policy design
that allocates responsibility for carbon to consumers based on benchmarks. Anticipation of
this charge allocated to carbon intensive material choices also creates incentives along the
value chain. Responsibility for emissions from materials production exceeding the
benchmark needs to remains with producers that therefore need to remain covered in the
emission trading systems.

26
Annex
Figure A1. System definition for the derivation of product‐specific emissions benchmarks for the five materials studied. The process chains were built using data from ecoinvent (Ecoinvent Centre, 2014) and stoichiometric information. The EU‐ETS emissions benchmarks for processes define the scope of the process chains and the emissions multipliers.

27
Table A1. Top 50 commodity groups, ranked by liabilities created at the moment of production, for the five materials. Unit: MEUR. Scope: EU28, 2012. Column 2 shows the ProdCom code. Note: This table comprises consecutive steps of the value chain and therefore contains double‐counted liabilities.
Liability, production, MEUR, EU28, 2012 Steel Al Plast. Paper Cement TOTALPortland cement 23511210 0 0 0 0 2986 2986 Ready‐mixed concrete 23631000 0 0 0 0 2119 2119 Aluminium alloy plates 24422450 0 1295 0 0 0 1295 Flat‐rolled products of iron 24103110 1268 0 0 0 0 1268 Unwrought aluminium alloys 24421155 0 1038 0 0 0 1038 Maritime and waterway structs. 25112355 915 0 0 0 0 915 Aluminium alloy bars, rods 24422250 0 910 0 0 0 910 Gear boxes and their parts 29323033 430 442 26 0 0 898 Hot dipped metal coated sheet 24105130 821 0 0 0 0 821 Hot rolled concrete reinforcing 24106210 814 0 0 0 0 814 Motor vehicles with a petrol eng. 29102230 367 264 95 0 0 726 Ingots, other primary forms 241021Z0 711 0 0 0 0 711 Aluminium plates, sheets 24422430 0 668 0 0 0 668 Motor vehicles with a diesel 29102330 328 236 85 0 0 649 Aluminium structure and parts 25112370 0 647 0 0 0 647 Unwrought aluminium alloys 24421153 0 639 0 0 0 639 Other hydraulic cements 23511290 0 0 0 0 629 629 Aluminium doors 25121050 0 597 0 0 0 597 Other parts and accessories 29323090 281 289 17 0 0 586 Uncoated cold rolled sheet 241041Z0 547 0 0 0 0 547 Uncoated cold rolled sheet 24104110 541 0 0 0 0 541 "Instruments and appliances 32501370 254 110 128 0 0 492 Other wire rod 24106190 478 0 0 0 0 478 "Casks, drums, cans, boxes 25921240 82 373 0 0 0 455 Connections and contacts 27331370 180 235 11 0 0 426 Parts and of vehicle bodies 29322090 198 204 12 0 0 414 Flat‐rolled products, of iron 24103150 404 0 0 0 0 404 Aluminium foil of a thickness 24422500 0 395 0 0 0 395 Polypropylene, in primary forms 20165130 0 0 388 0 0 388 Flat semi‐finished products 24102110 368 0 0 0 0 368 Other ingots, primary forms 24102122 357 0 0 0 0 357 Flat‐rolled products 24103510 335 0 0 0 0 335 Base metal closures, stoppers 25921370 60 275 0 0 0 335 Light metal castings for vehicles 24531010 0 335 0 0 0 335 Prefabricated structural comp. 23611200 0 0 0 0 332 332 Plastic carboys, bottles, flasks 22221450 0 0 330 0 0 330 Goods vehicles with a diesel 29104110 214 58 45 0 0 316 Vehicles with spark‐ignition eng. 29102100 158 114 41 0 0 313 Iron or steel doors, thresholds 25121030 308 0 0 0 0 308 Ingots, other primary forms 24102121 307 0 0 0 0 307 Hot rolled flat products in coils 241033Z0 306 0 0 0 0 306 Prefabricated buildings, of iron 25111030 286 0 0 0 0 286 Articles for the conveyance 22221950 0 0 277 0 0 277 Other electric conductors 27321380 0 240 28 0 0 269 Suspension systems and parts 29323050 127 130 8 0 0 265 Polyethylene 20161050 0 0 263 0 0 263 Sacks and bags of polymers 22221100 0 0 262 0 0 262 Ingots, other primary forms 241023Z0 259 0 0 0 0 259 Unwrought non‐alloy aluminium 24421130 0 259 0 0 0 259 Other structures of steel 25112350 257 0 0 0 0 257

28
Table A2. Top 50 commodity groups, ranked by liabilities created at the moment of import, for six materials. Unit: MEUR. Scope: EU28, 2012. Column 2 shows the ProdCom code.
Liability, import, MEUR, EU28, 2012 Steel Al Plast. Paper Cement TOTALUnwrought aluminium alloys 24421153 0 824 0 0 0 824 Unwrought non‐alloy aluminium 24421130 0 748 0 0 0 748 Flat semi‐finished products 24102110 315 0 0 0 0 315 Flat‐rolled products of iron 24103110 187 0 0 0 0 187 Aluminium alloy plates, sheets 24422450 0 181 0 0 0 181 Aluminium alloy bars, rods 24422250 0 110 0 0 0 110 Pig iron and spiegeleisen 24101100 98 0 0 0 0 98 Aluminium plates, sheets 24422430 0 95 0 0 0 95 Non‐alloy aluminium wire 24422330 0 92 0 0 0 92 T‐shirts, singlets and vests 14143000 0 0 85 0 0 85 Flat‐rolled products, of iron 24103150 80 0 0 0 0 80 Goods vehicles with diesel eng. 29104110 54 14 11 0 0 79 Aluminium foil 24422500 0 75 0 0 0 75 Ferro‐chromium 24101260 74 0 0 0 0 74 Hot dipped metal coated sheet 24105130 71 0 0 0 0 71 Vehicles with spark‐ignition eng. 29102100 33 24 9 0 0 66 Uncoated cold rolled sheet 241041Z0 60 0 0 0 0 60 Articles of aluminium, n.e.c. 25992955 0 59 0 0 0 59 Motor vehicles with diesel eng. 29102330 29 21 8 0 0 58 Ferrous products 24101300 57 0 0 0 0 57 Ingots, other primary forms 241021Z0 52 0 0 0 0 52 Static converters 27115070 22 28 1 0 0 51 Parts for machines 27116100 20 27 1 0 0 48 Polyethylene 20161050 0 0 47 0 0 47 Other transformers, n.e.c. 27114240 19 25 1 0 0 46 Organic coated sheet 24105140 44 0 0 0 0 44 Motor vehicles with petrol eng. 29102230 22 16 6 0 0 44 Unwrought aluminium alloys 24421155 0 44 0 0 0 44 Linear polyethylene 20161035 0 0 44 0 0 44 Parts suitable for machines 28114200 21 22 1 0 0 44 Agrarian tyres; other 22111400 0 0 44 0 0 44 New pneumatic rubber tyres 22111100 0 0 43 0 0 43 Synthetic rubber 20171090 0 0 39 0 0 39 Parts of machinery of HS 84.25 28221930 31 6 1 0 0 38 Brakes and servo‐brakes 29323020 18 18 1 0 0 38 Polypropylene, in primary forms 20165130 0 0 37 0 0 37 Metal furniture 31091100 24 12 0 0 0 36 Other electric conductors 27321380 0 31 4 0 0 35 Parts and accessories 28414030 23 10 1 0 0 34 Women's or girls' briefs 14141420 0 0 33 0 0 33 Hot rolled concrete rebar 24106210 33 0 0 0 0 33 Other wire rod (non‐alloy steel) 24106190 32 0 0 0 0 32 Portland cement 23511210 0 0 0 0 32 32 Parts of air and vacuum pumps 28133200 23 6 1 0 0 31 Women's or girls' jerseys 14391072 0 0 29 0 0 29 Aluminium structure and parts 25112370 0 29 0 0 0 29 Electric motors 27111010 12 16 1 0 0 29 Road wheels and parts 29323040 13 14 1 0 0 28 Parts for earthmoving equipmt. 28926150 18 8 1 0 0 27 Sum total 1513 2557 450 0 32 4552

29
Table A3. Top 50 commodity groups, ranked by liabilities created at the moment of export, for six materials. Unit: MEUR. Scope: EU28, 2012. Column 2 shows the ProdCom code.
Liability, export, MEUR, EU28, 2012 Steel Al Plast. Paper Cement TOTAL Motor vehicles with petrol eng. 29102230 188 135 49 0 0 372 Hot rolled concrete rebar 24106210 240 0 0 0 0 240 Aluminium alloy plates, sheets 24422450 0 224 0 0 0 224 Flat‐rolled products of iron 24103110 185 0 0 0 0 185 Portland cement 23511210 0 0 0 0 151 151 Industrial use engines 28111375 36 103 1 0 0 140 Other trailers and semi‐trailers 29202300 65 67 4 0 0 135 Flat‐rolled products, of iron 24103150 107 0 0 0 0 107 Flat semi‐finished products 24102110 105 0 0 0 0 105 Aluminium foil 24422500 0 101 0 0 0 101 Hot dipped metal coated sheet 24105130 91 0 0 0 0 91 Cement clinker 23511100 0 0 0 0 83 83 Motor vehicles with diesel eng. 29102330 40 29 10 0 0 80 Line pipe 24202110 79 0 0 0 0 79 Goods vehicles 29104140 46 13 10 0 0 69 Parts 28114200 33 34 2 0 0 69 Ingots, other primary forms 241021Z0 66 0 0 0 0 66 Aluminium alloy bars, rods 24422250 0 61 0 0 0 61 Uncoated cold rolled sheet 241041Z0 60 0 0 0 0 60 Alternators 27112670 25 33 2 0 0 59 Spark‐ignition engines 399900Z2 28 29 2 0 0 58 Vehicles 29102100 29 21 8 0 0 58 Tinplate, other tinned sheet 24105110 58 0 0 0 0 58 Other wire rod 24106190 57 0 0 0 0 57 Aluminium plates, sheets 24422430 0 57 0 0 0 57 H‐sections 24107130 56 0 0 0 0 56 Polyvinyl chloride 20163010 0 0 54 0 0 54 Goods vehicles with diesel eng. 29104110 36 10 8 0 0 53 Articles of aluminium, n.e.c. 25992955 0 52 0 0 0 52 Parts suitable for machines 27116100 22 29 1 0 0 52 Casing, tubing and drill pipe 24201250 52 0 0 0 0 52 Unwrought aluminium alloys 24421155 0 52 0 0 0 52 Maritime structures 25112355 50 0 0 0 0 50 Other electric conductors 27321380 0 44 5 0 0 49 Railway material (of steel) 24107500 48 0 0 0 0 48 Flat‐rolled products 24103510 48 0 0 0 0 48 I‐sections 24107120 45 0 0 0 0 45 Multi‐phase AC motors 27112590 19 25 1 0 0 45 Polyethylene 20161050 0 0 45 0 0 45 Flat‐rolled products 24103530 44 0 0 0 0 44 Vehicle compression‐ign. engs. 29101300 21 21 1 0 0 43 Polymers of propylene 20165150 0 0 42 0 0 42 Bodies for lorries, vans, buses 29201050 20 20 1 0 0 41 Parts for trailers, semi‐trailers 29203090 19 20 1 0 0 40 Tubes and pipes 24201370 39 0 0 0 0 39 Liquid dielectric transformers 27114180 16 21 1 0 0 38 Acrylic polymers 20165390 0 0 38 0 0 38 Aluminium structure and parts 25112370 0 38 0 0 0 38 Synthetic rubber 20171090 0 0 38 0 0 38 Sum total 2070 1237 360 0 234 3901
30
References
Allwood, J. M., Cullen, J. M., Carruth, M. A., Cooper, D. R., McBrien, M., Milford, R. L., … Patel, A. C. H. (2012). Sustainable Materials: with both eyes open. Cambridge, UK: UIT Cambridge, UK.
Ecoinvent Centre. (2014). ecoinvent Version 3. Dübendorf, Switzerland. Retrieved May 10, 2014, from http://www.ecoinvent.org/database/ecoinvent‐version‐3/
European Commission. (2011). Commission decision, of 27 April 2011, determining transitional Union‐wide rules for harmonised free allocation of emission allowances pursuant to Article 10a of Directive 2003/87/EC of the European Parliament and of the Council, Official Journal of the E. Brussels.
European Commission. (2012a). Communication C387 from the Commission amending the Communication from the Commission Guidelines on certain State aid measures in the context of the greenhouse gas emission allowance trading scheme post‐2012. Brussels.
European Commission. (2012b). Guidelines on certain State aid measures in the context of the greenhouse gas emission allowance trading scheme post 2012.
European Commission. (2016). Carbon Leakage. Retrieved February 2, 2016, from http://ec.europa.eu/clima/policies/ets/cap/leakage/index_en.htm
Eurostat. (2013). Prodcom ‐ Statistics by Product. Retrieved August 30, 2013, from http://epp.eurostat.ec.europa.eu/portal/page/portal/prodcom/introduction
Graedel, T. E., Van Beers, D., Bertram, M., Fuse, K., Gordon, R. B., Gritsinin, A., … Vexler, D. (2004). Multilevel cycle of anthropogenic copper. Environmental Science & Technology, 38(4), 1242–1252.
Guenther, E., Jasch, C., Schmidt, M., Wagner, B., & Huisingh, D. (2012). Material Flow Cost Accounting. Journal of Cleaner Production, 29‐30(2012), 291–292. doi:10.1016/j.jclepro.2012.01.025
Johnson, J., Schewel, L., & Graedel, T. E. (2006). The Contemporary Anthropogenic Chromium Cycle. Environmental Science and Technology, 40(22), 7060–7069.
Kytzia, S., Faist, M., & Baccini, P. (2004). Economically extended—MFA: a material flow approach for a better understanding of food production chain. Journal of Cleaner Production, 12(8‐10), 877–889. doi:10.1016/j.jclepro.2004.02.004
Liu, G., & Müller, D. B. (2013). Centennial evolution of aluminum in‐use stocks on our aluminized planet. Environmental Science & Technology, 47(9), 4882–8. doi:10.1021/es305108p
Modaresi, R., Pauliuk, S., Løvik, A. N., & Müller, D. B. (2014). Global carbon benefits of material substitution in passenger cars until 2050 and the impact on the steel and aluminum industries. Environmental Science & Technology, 48(18), 10776–10784. doi:10.1021/es502930w
Müller, D. B., Liu, G., Løvik, A. N., Modaresi, R., Pauliuk, S., Steinhoff, F. S., & Brattebø, H. (2013). Carbon emissions of infrastructure development. Environmental Science & Technology, 47(20), 11739–46. doi:10.1021/es402618m
Neuhoff, K., Ismer, R., Acworth, W., Ancygier, A., Haußner, M., Fischer, C., … Zipperer, V. (2016). Inclusion of Consumption of carbon intensive materials in emissions trading – An option for carbon pricing post‐2020. Climate Strategies Report (forthcoming), London, UK.
Pauliuk, S., Majeau‐Bettez, G., & Müller, D. B. (2015). A General System Structure and Accounting Framework for Socioeconomic Metabolism. Journal of Industrial Ecology, 19(5), 728–741. doi:DOI: 10.1111/jiec.12306
Pauliuk, S., Wang, T., & Müller, D. B. (2013). Steel all over the world: Estimating in‐use stocks of iron for 200 countries. Resources, Conservation and Recycling, 71, 22–30. doi:10.1016/j.resconrec.2012.11.008
Schmidt, A., Götze, U., & Sygulla, R. (2014). Extending the scope of Material Flow Cost Accounting – methodical refinements and use case. Journal of Cleaner Production, 1–13. doi:10.1016/j.jclepro.2014.10.039
Schmidt, M. (2014). The interpretation and extension of Material Flow Cost Accounting (MFCA) in the context of environmental material flow analysis. Journal of Cleaner Production, 1–10. doi:10.1016/j.jclepro.2014.11.038