Embed Size (px)
Citation preview

Intermodal TerminalF E A S I B I L I T Y S T U D Y
D O W N T O W N M I A M I
DECEMBER 2013 - PREPARED BY:
MIAMI INTERMODAL TERMINALMIAMI INTERMODAL TERMINAL

The Miami-Dade MPO has set a policy that assures that no person shall on the basis of race, color, national origin, sex, age, disability, family, or religious status, as provided by Title VI of the Civil Rights Act of 1964, the Civil Rights Restoration Act of 1987, and the Florida Civil Rights Act of 1992, be excluded from participation in, be denied the
benefits of, or be otherwise subjected to discrimination or retaliation under any program or activity. It is the policy of the Miami-Dade MPO to comply with all of the requirements of the Americans with Disabilities Act. To request this document in accessible format please call (305) 375-1881. If you are interested in participating in the
transportation planning process, please contact the Miami-Dade MPO at (305) 375-4507, [email protected], or www.miamidade.gov/mpo.
The preparation of this report has been funded in part from the U.S. Department of Transportation (USDOT), the Federal Highway Administration (FHWA), and the Federal Transit Administration (FTA), the State Planning and Research Program (Section 505 of Title 23, U.S. Code), and Miami-Dade County, Florida. The contents of this report do
not necessarily reflect the official views or policy of the U. S. Department of Transportation.
MIAMI INTERMODAL TERMINAL
D O W N T O W N M I A M I I N T E R M O D A L T E R M I N A L F E A S I B I L I T Y S T U D Y
MIAMI INTERMODAL TERMINAL
Table of Contents
PA G E i
INTRODUCTION AND STUDY OBJECTIVES ................................... Pg. 01Future Multi-Modal Needs .................................................................................... Pg. 01 Study Coordination and Deliverables ............................................................... Pg. 02
DATA GATHERING AND ANALYSIS ..................................................... Pg. 03
LITERATURE RESEARCH OF COMPARABLE PROJECTS ................. Pg. 05
SITE SELECTION PROCESS AND RESULTS .......................................... Pg. 06Process Description ................................................................................................. Pg. 06Site Selection Process Flow Diagram ................................................................ Pg. 07Site Selection Methodology ................................................................................. Pg. 08Site Selection Resulting Analysis ........................................................................ Pg. 09
CONCEPTUAL APPROACH AND PROGRAMMING ..................... Pg. 14Downtown Miami Intermodal Terminal Space Program ............................ Pg. 15Preliminary Space Planning Program ............................................................... Pg. 15
PRELIMINARY ECONOMIC AND MARKET ANALYSIS ............... Pg. 19Knowledge for Implementation .......................................................................... Pg. 19Average Daily Ridership (by mode - 2011) ...................................................... Pg. 20Retail Demand from Transit (by mode - 2011) ............................................... Pg. 20Retail Demand from Primary Market Area (PMA) Resident ....................... Pg. 21Summary of Retail Demand (by segment) ..................................................... Pg. 21
PRELIMINARY STREET CLOSURE/TRAFFIC ANALYSIS .............. Pg. 22
SITE DEVELOPMENT CONCEPT ALTERNATIVES .......................... Pg. 29Step 1: Architectural Studies ................................................................................ Pg. 29Step 2: Site Plan Developement .......................................................................... Pg. 30Step 3: Evaluation and Developement of the Preferred Site .................... Pg. 30The “All Aboard Florida” Impact - A Change in Direction ........................... Pg. 54
FINAL SITE DEVELOPMENT CONCEPT ................................................. Pg. 65
RECOMMENDATION AND ACTION PLAN ....................................... Pg. 81Master Program ......................................................................................................... Pg. 82Transit Modifications ............................................................................................... Pg. 83Transit Impacts Mitigation .................................................................................... Pg. 84Phasing Requirements ............................................................................................ Pg. 85Strategic Management Decisions ....................................................................... Pg. 85Downtown Miami Bus Terminal .......................................................................... Pg. 86Summary and Closing ............................................................................................. Pg. 86
APPENDIX ......................................................................................................... Pg. 87

MIAMI INTERMODAL TERMINAL
D O W N T O W N M I A M I I N T E R M O D A L T E R M I N A L F E A S I B I L I T Y S T U D Y
MIAMI INTERMODAL TERMINAL
PA G E i i
THIS PAGE INTENTIONALLY LEFT BLANK

MIAMI INTERMODAL TERMINAL
D O W N T O W N M I A M I I N T E R M O D A L T E R M I N A L F E A S I B I L I T Y S T U D Y
MIAMI INTERMODAL TERMINAL
PA G E 1
Introduction and Study ObjectivesFUTURE MULTI-MODAL NEEDSJacobs was selected by the Miami-Dade Metropolitan Planning Organization (MPO) to prepare this study to consider a new ‘downtown’ location to serve Miami-Dade County’s future multi-modal needs. A key measure of success for the MPO in moving this region of South Florida forward was to ensure this study clearly communicated the ‘vision’ for this type of development opportunity to partner agencies, and to the general public. Succinctly stated, the major objectives of the Downtown Miami Intermodal Terminal Feasibility Study, utilizing a multi-disciplinary team, working with the MPO and its partners, were to:
1) Establish the feasibility of developing an intermodal terminal facility in the Downtown Miami area, at the candidate sites initially identified, and conduct an evaluation to make a recommendation for the location of the preferred site; and,
2) Explore conceptual development scenarios for an integrated transit/pedestrian mall at the preferred site, including the use of visualization tools, the financial feasibility of the mixed-use facility, and ultimately resulting in development and construction recommendations, along with a ‘next steps’ action plan.
The overall intention of the project approach for the Intermodal Terminal Feasibility Study was to reflect the MPO’s and the Stakeholders’
strategic transportation vision for the greater community. Included in the study’s planning process and framework were ‘benchmark’ criteria to facilitate an integrated intermodal facility that accommodates not only motorized vehicular travel, but pedestrians, bicycles and the possibility of incorporating other exciting, complimentary, supportive mixed-use facilities and spaces.
The study included three general phases, which were sub-divided into separate individual work phases to meet the general objectives outlined above, as well as the scope of work required by the MPO’s issued Task Work Order. These were as follows:
I. Baseline Assessment and InventoryThis phase commenced with MPO and Study Advisory Committee (SAC) included clarification of the project scope, program, vision, goals and objectives. Then baseline data collection and analysis procedures were conducted to develop an understanding of the project planning parameters, previous planning studies as well as accomplishment of an exhaustive inventory of existing assets and conditions in the study area. This phase also included a literature research step to identify other national examples of best practices in the study, planning and development of intermodal terminals, as well as transit/pedestrian facilities similar in scope and/or size that could be implemented in Miami-Dade County.
AERIAL VIEW OF THE STUDY AREA THAT INCLUDES THE DOWNTOWN GOVERNMENT CENTER

MIAMI INTERMODAL TERMINAL
D O W N T O W N M I A M I I N T E R M O D A L T E R M I N A L F E A S I B I L I T Y S T U D Y
MIAMI INTERMODAL TERMINAL
FUTURE MULTI-MODAL NEEDS (co n t i n u e d )II. Design ConsiderationsUtilizing the validated vision, goals and needs of the project as well as the detailed data gathered and analyzed in the first phase, the major effort for this second phase of work was geared towards a logical and fact-driven site selection process. The completion of this process focused on three very specific candidate sites, with a final priority ranking used to conduct simple ‘site test fit’ exercises for each. This phase also provided a conceptual design approach and preliminary development “program” for the intermodal facility, defining the building and site components needed to make it successful, and a strategy for integrating it into the existing urban context. A Preliminary economic and market analysis was included in this phase to ensure the approach and program were realistic based on current local and regional real estate demands.
III. Development Plan Options and Recommendations
An evaluation of the site development options was conducted in this final phase of work to evaluate, determine and validate the highest and best site for the intermodal facility. A variety of site development concepts was explored, evaluated and the preferred course of action was selected through a collaborative process. This preferred course of action was augmented and supported by component plans for potential pedestrian street closure options, traffic analysis and economic/financial implications. The final site development concept was then detailed and provided in a visual format easily understood by public and non-design stakeholders. This phase concluded the study with final recommendations and ‘next step’ action items which outlines general strategies to move the project towards future implementation.
STUDY COORDINATION AND DELIVERABLESIn coordination with the MPO and the project Manager (PM) for this Task Work order, a Study Advisory Committee (SAC) was formed at commencement of the study to include representatives of the Miami-Dade Transit (MDT), the Florida Department of Transportation (FDOT), Miami-Dade Expressway Authority (MDX), Public Works Department, City of Miami and the Downtown Development Authority (DDA), among others. The SAC participated throughout the study by attending periodically scheduled meetings to discuss relevant issues regarding the development and progress review of the study. Feedback from the SAC was also solicited via e-mail and ‘WebEx’ format teleconference where specific comments or data was required.
The members of the SAC are listed on the chart on the following page for reference. Following the SAC directory, a summary list of the project study meetings and events is provided.
Recognizing that there were already significant and long-term input initiatives pertaining to this area of the City, Miami-Date Transit, regional transportation and multi-modal plans by the MPO, the Miami CRA, and MDT as well as others, it was our intention to absorb and build upon these in the SAC sessions, infusing the “lessons learned” and/or evolved out of those into this process and move forward in an informed and sensitive manner.
At the completion of the study, the final results were presented with recommendations of this study to the SAC and other MPO committees. The final outcome of this study’s comprehensive team approach was to develop a final feasibility report that will be a unified and agency supported solution that meets the needs, goals, and objectives of the tansit users and downtown community, with the supporting ‘roadmap’ on how to move towards a future intermodal terminal implementation. The study ‘deliverables’ include twenty (25) copies of this Final Report, and a Power Point Presentation with the highlights of the study. Electronic copies of these items were also submitted in CD format to be posted in the MPO Website and for further reproduction and distribution. All of these materials are additionally available in PDF format for distribution and use to the general public in this universally available and readable file type.
PA G E 2
METRORAIL AND METROMOVER VISIT THE DOWNTOWN GOVERNMENT CENTER

MIAMI INTERMODAL TERMINAL
D O W N T O W N M I A M I I N T E R M O D A L T E R M I N A L F E A S I B I L I T Y S T U D Y
MIAMI INTERMODAL TERMINAL
Data Gathering and Analysis
PA G E 3
This task involved the acquisition and review of relevant transportation related data that was utilized in the analysis phase of the project. Existing transit and highway data necessary to conduct the study was collected including the following items by category:
a. Transit - The data collected in this sub-task will served to determine the required capacity of the proposed facility for MDT buses, which included:• Number of routes servicing Downtown• Route alignment• Route length• Travel time• Headway• Service hours• Buses in service (peak and off-peak)• Passenger movement by route• Passengers’ load during peak and
off peak periods
b. Roadway - The data collected in this sub-task will serve to determine the impact of closing a segment of NW 1st Street and the traffic flow around the recommended facility. The following is a list of the data that was collected:• Traffic volume along the streets in the
adjacent area to the proposed facility• Level of Service (LOS)• Street configuration and jurisdiction• Cross sections• Location of traffic signals and utilities
c. Miscellaneous information - This information assisted in developing the other elements of the proposed facility, and included:• Number of taxi companies• Number of taxis servicing Downtown Miami• Number of jitney routes• Number of jitney-vans in Downtown Miami• Bicycle and Pedestrian facilities located near
Downtown Miami• Any other useful information to assist in the
development of the study
TASK EXECUTIONThe task began by coordinating with MDT regarding the existing transit routes servicing the downtown area. Specifically documented were the route alignment, lengths, and published travel times. Additionally documented were the headways (by time of day), the service hours and the number of buses in service during the peak and off-peak hours, and the average number of passengers served by time of day and day of week for each route within the study area. This transit data was summarized in the project’s first technical SAC presentation with raw data included in the appendix of this report.
Roadway data was also obtained for the project study area. The City of Miami, Miami-Dade County, and the Florida Department of Transportation were contacted regarding the availability of traffic data on the subject roadways within the study area. At a minimum, daily (Annual Average Daily Traffic Volumes) and peak hour traffic volumes for the most recent available year were obtained for the roadway links and documented in tabular and graphical format. Additionally collected were intersection turning movement counts, historical traffic counts for the purposes of documenting growth (or decline) trends, heavy vehicle percentages, peak hour factors, and directional distributions. With that available information, it was possible to document the current roadway link and intersection Levels of Service (LOS). The roadway configuration (i.e. number and type of lanes, presence of sidewalks, etc.), jurisdiction and signal locations was documented and field verified. The presence and location of major utilities was obtained from databases maintained by the City and the County. This roadway related information was also summarized in the project’s first technical SAC presentation with raw data included in the appendix of this report.
Other information such as taxi and jitney companies servicing the downtown area was obtained from Regulatory and Economic Resources Department (RER). Bicycle and pedestrian facility information (e.g. sidewalks, bicycle lanes, multi–use shared paths, lockers, etc.) was obtained from the City and the County and documented in graphical format. This information was also included in the project’s first technical SAC presentation.

MIAMI INTERMODAL TERMINAL
D O W N T O W N M I A M I I N T E R M O D A L T E R M I N A L F E A S I B I L I T Y S T U D Y
MIAMI INTERMODAL TERMINAL
All of the data collected and documented in the above focus areas was utilized in the following site selection and programming tasks, and analyzed in coordination with the economic and market analysis sub-consultant, to determine the ultimate capacities necessary for a facility of this type.
PA G E 4
SHARED PATHWAYS AND INTERSECTION AT THE GOVERNMENT CENTER
Secondarily the impacts of the project on the surrounding site contextual development patterns, for both existing conditions and future impacts, were summarized at the completion of this task, to inform the feasibility analysis and conceptual approach processes that followed.

MIAMI INTERMODAL TERMINAL
D O W N T O W N M I A M I I N T E R M O D A L T E R M I N A L F E A S I B I L I T Y S T U D Y
MIAMI INTERMODAL TERMINAL
Literature Research of Comparable Projects
PA G E 5
The benchmarking of other similar intermodal facilities was an important step in the first phase of work on this study. By developing a point of reference in which to measure the Miami-Dade facility against, it was possible to establish standards that proved valuable in our evaluation of the conceptual development alternatives. This task commenced with a literature research step to identify other national examples of best practices in the study, planning and development of intermodal terminals, as well as transit/pedestrian facilities similar in scope and/or size that could be implemented in Miami-Dade County. Further, this benchmarking process helped identify opportunities and set achievable goals using real-world paradigms by showing where other intermodal programming approaches have been successfully studied and implemented.
As part of this task studies conducted in the past by Miami-Dade Transit (MDT) and the MPO, pertinent ordinances and regulations for taxis and jitneys, requirements for ADA, bicycle and pedestrian facilities, among other
available information were all reviewed. These are referenced in the Study Appendix, but due to their size not included in full as part of this report. Through the completion of this task specific projects, concepts, strategies, state-of-the-art technologies and physical improvements that could integrate well with the existing transportation modes/systems in Miami-Dade County (Metrobus, Metrorail, Metromover, taxis and jitneys) were identified. Where these benchmark sites integrated bicycle and pedestrian improvements, parking garages for private cars and bicycles, commercial and office areas, and any other recreational alternative to attract more visitors, the analysis proceeded to evaluate how a similar strategy might work in Downtown Miami.
The detailed summary of the Literature Research conducted includes evaluations of the identified example intermodal projects and strategies. These were then used as the basis for programming in the subsequent Preliminary Programming stage, preparation of the Site Conceptual Development Alternatives, and the Final Recommendations.
THE METROMOVER GLIDES INTO THE GOVERNMENT CENTER STATION

MIAMI INTERMODAL TERMINAL
D O W N T O W N M I A M I I N T E R M O D A L T E R M I N A L F E A S I B I L I T Y S T U D Y
MIAMI INTERMODAL TERMINAL
PA G E 6
Site Selection Process and ResultsE VALUATION APPROACHBased on the data gathered and benchmark literature reviewed in the fist phase of work, the Jacobs team commenced the Site Selection Process in coordination with the MD-MPO Project manager and in consultation with the SAC. The initial focus in this task was to confirm the study area boundary for candidate sites, and then conduct a logical and data driven evaluation to select at least three (3) potential sites for the location of the proposed intermodal terminal with the highest probability of success. A matrix style evaluation comparing the selected sites was then developed taking into consideration, at a minimum, the following general factors:• Land availability (by current use and/or
vacancy)• Connectivity to transit hubs: MetroRail and
MetroMover stations• Accessibility to major employment centers• Roadway and transit impacts• Traffic circulation (all modes)• Travel time improvements for transit routes• Potential change in travel patterns• Impacts in the land use (efficiency,
adjacencies, etc.)• Greatest potential for integration of
transportation services
The intent of this evaluation approach was to identify for the sites specific locations where concerns and ranking factors contributed positively or negatively to the potential development success of the proposed facility. Field inspections were also conducted to observe each considered site and collect the necessary data (tangible or intangible) for further evaluation and analysis. The final result of this process was geared towards making a recommendation of the location(s) of the preferred site for the intermodal facility, including the justification for the selection and a list of pros and cons for each site.
PROCESS DESCRIPTIONUtilizing an industry-setting, innovative and unique approach for site selection, MPO & SAC customized site selection criteria were developed and organized to comprehensively address the physical, human and business environments which were then defined via quantifiable thresholds for ‘scoring’.
This information was applied and incorporated into a detailed database using Geographic Information Systems (GIS) software. The criteria were then physically mapped to identify the ideal intermodal terminal location that is exclusive to the program and operational needs of this region and area of Miami-Dade County.
The detailed site selection approach that was used for this study may be further described as follows, and included seven distinct steps, with 5 - 7 covered in other sections of this report:
1. Identified site selection criteria• Property requirements including minimum
size, minimum shape, area for future expansion
• Location requirements including minimum distance or maximum distance from other operations, public services, roads and rail roads, or other development, etc.
• Characteristics of land including maximum slopes, visual buffers, natural conditions that affect construction
• All transportation and transit related movement
• Environmental constraints • Security concerns• Utility and infrastructure requirements
2. Determined the Preferred Development Program• Size, number, and types of buildings• Parking requirements• Security requirements including
requirements for access security, standoffs and setbacks, etc.

MIAMI INTERMODAL TERMINAL
D O W N T O W N M I A M I I N T E R M O D A L T E R M I N A L F E A S I B I L I T Y S T U D Y
MIAMI INTERMODAL TERMINAL
PROCESS DESCRIPTION (co n t i n u e d )3. Applied criteria to candidate sites to narrow
a ‘short list’ of candidate site in the study area boundary
4. Conducted site visits and site analysis on candidate sites to select the 3 best sites
5. Develop site concepts (test fits) on best sites to determine site’s ability to accommodate program considering all program requirements
6. Determine suitability, pros and cons, summary of significant constraints
7. Evaluate best sites to determine final preferred site (evaluation process to select final preferred site)
The following Flow Diagram succinctly illustrates the process, and the key interaction positions of the SAC while working towards the identificationof the best candidate sites:
Flow DiagramMASTER SITE SELECTION CRITERIA
DATA COLLECTION
REFINE SITE SELECTION CRITERIA
PROXIMIM ANALYSIS (BUFFERS)
ASSIGN DESIRABILITY SCORES (SCALE -3 to 3)
COMPOSITE MAP (HEAT MAP)
PARCEL OVERLAY AND IDENTIFY SITE
SAC INPUT
GEO
SPAT
IAL
AN
ALY
SIS
SAC INPUT
PA G E 7

MIAMI INTERMODAL TERMINAL
D O W N T O W N M I A M I I N T E R M O D A L T E R M I N A L F E A S I B I L I T Y S T U D Y
MIAMI INTERMODAL TERMINAL
PA G E 8
S ITE SELEC TION ME THODOLOGYWith the overall goal of the Site Selection Methodology focused on identifying the highest and best development site, there are guiding objectives that were referenced to ensure the selected site will minimize cost, schedule and risk:– Maximize return on investment– Minimize waste (during development and
future operations)– Shortened decision period– Ensure the project can be executed related to
site-work, infrastructure, construction logistics, and operations
– Maximize users and employees safety and security
This process was created to provide a logical, defensible decision-making system of criteria that could be agreed upon among multiple stakeholders. By utilizing holistic evaluation criteria prior to actual land evaluation it is possible to streamline the process from a practical position and thereby remove “emotional” decision-making. This results in a clearly identified optimal solution, and minimizes future stakeholder and public objections.
The Site Selection Criteria utilized in the process were considered in two general type categories; Mandatory, which could be considered as an ‘elimination’ factor, and Secondary, which may not be critical enough to act as an eliminator, but could be considered a ‘flag’ issue. The scale of analysis is then further investigated at 3 levels: ‘High’ level for the ‘Areas of Consideration’ (AOC) phase where the data is regionally readily available; a more defined ‘Detailed’ level which includes locally available data; and ‘Site Test Fit’ phase level where only specific site data is available, usually by survey. Both short and long range development considerations were also evaluated to understand the implications (for this study) of the existing, as well as planned short and long-term area-wide projects related to the transportation systems this facility will ultimately serve.
The following outline indicates the four major areas for site selection scoring criteria utilized in this study:Site Location Requirements criteria were evaluated in the following categories:
– Surrounding Area Influences and Characteristics
– Surrounding Amenities– Transportation– Safety and Security
Demographics and Economic Development criteria were evaluated in the following categories:
– Residential– Work Force– Local Economic Development Initiatives
Site Specific Requirements were evaluated in the following categories:
– Land and Availability– Geography / Characteristics – Environmental Considerations– Security– Utility and Infrastructure Requirements– Construction Logistics– Operations and Maintenance
Business Environment characteristics were evaluated in the following categories:
– Regulations– Public Support
Referring to the tables provided in the Appendix, the results of the criteria evaluation conducted in coordination with the SAC are detailed by category in the first 7-page table (Site Selection Criteria), and the selection criteria score assigned each is indicated in the second 2-page table ( Desirability Scores).
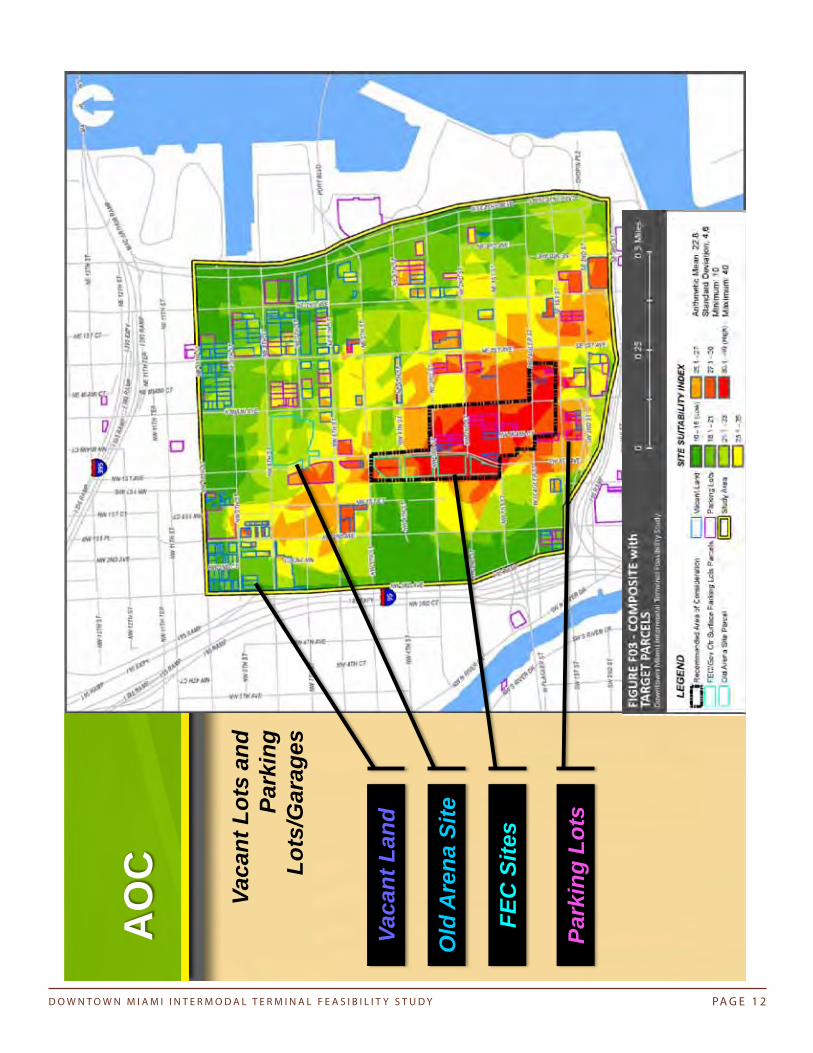
S ITE SELEC TION RESULTING ANALYSISWith the Site Selection Criteria and Site Desirability Scores confirmed and agreed upon through the SAC evaluation process, we were able to take the final step and complete the GIS based analysis of the property in the site study area limits. This is the final step in the selection process that confers a logical sequence to arrive at the best possible sites to consider. Referring to the sequence of maps shown on the following four (4) pages, you can see the resulting ‘heat map’ that identifies by red and orange hues the best scoring locations.
Then we utilize this map to overlay a ‘vacant parcels’ map to further identify the most logical candidate sites since their current use pose no limitations on redevelopment or impacts to the built environment. These sites may in-fact have active uses even if not encumbered by vertical facilities (parking lots for example), but their transition to a higher or more intense use as contemplated for the new intermodal terminal would generally reap higher economic value to

MIAMI INTERMODAL TERMINAL
D O W N T O W N M I A M I I N T E R M O D A L T E R M I N A L F E A S I B I L I T Y S T U D Y
MIAMI INTERMODAL TERMINAL
the area. Secondarily these sites may generally have a much lower cost of acquisition, and potentially a decreased chance of environmental hurdles to overcome for redevelopment as compared to older, higher density developed sites with long historically complex use profiles.
Once these GIS analysis layers are overlayed and weighted for scoring, the resulting ‘Heat Map’
PA G E 9
compilation was generated. It depicts the property in the study area that focused the final site selection towards the best candidate sites. The last sequence identified the array of available parcels that were studied for site test fits, and ultimately focused onto the 3 final sites that Site Development Concept Alternatives were prepared for.

D O W N T O W N M I A M I I N T E R M O D A L T E R M I N A L F E A S I B I L I T Y S T U D Y
AO
C Com
posi
te:
Dev
elop
men
t S
uita
bilit
y
Red
+O
rang
esM
ost D
esira
ble
Gre
ens
Leas
t D
esira
ble
PA G E 1 0

D O W N T O W N M I A M I I N T E R M O D A L T E R M I N A L F E A S I B I L I T Y S T U D Y
AO
C Expa
nded
and
R
ecom
men
ded
Are
as o
f C
onsi
dera
tion
Rec
omm
ende
dA
OC
Expa
nded
A
OC
PA G E 1 1
D O W N T O W N M I A M I I N T E R M O D A L T E R M I N A L F E A S I B I L I T Y S T U D Y
AO
C
Vaca
nt L
ots
and
Park
ing
Lots
/Gar
ages
Vaca
nt L
and
Old
Are
na S
ite
FEC
Site
s
Park
ing
Lots
PA G E 1 2

D O W N T O W N M I A M I I N T E R M O D A L T E R M I N A L F E A S I B I L I T Y S T U D Y
AO
C
Rec
omm
ende
d A
OC
Enla
rged
Vie
w
Rec
omm
enda
tion
to
Fina
lize
Site
Sel
ectio
n:
1)FE
C/G
ov C
trPa
rcel
s•O
ne O
wne
r•G
reat
est C
ontig
uous
A
crea
ge•G
reat
est A
genc
y Su
ppor
t•G
reat
est P
rogr
amm
ing
Flex
ibili
ty a
nd F
utur
e Ex
pans
ion
Pote
ntia
l•C
lose
Pro
xim
ity to
Ex
istin
g an
d Fu
ture
Tr
ansi
t Lin
es•F
ocus
tim
e +
budg
et o
n pr
ogra
mm
ing
and
conc
eptu
al d
esig
n
PA G E 1 3

MIAMI INTERMODAL TERMINAL
D O W N T O W N M I A M I I N T E R M O D A L T E R M I N A L F E A S I B I L I T Y S T U D Y
MIAMI INTERMODAL TERMINAL
Conceptual Approach and Programming
PA G E 1 4
To proceed with the development of three (3) approaches for the construction of the intermodal facility, rather than focus on a single site, the study design team agreed to tackle options for the 3 preferred sites identified in the previous Site Selection phase. These approaches considered:• All developments at ground level• Construction of a multi-floor building• Connectivity and integration with existing
transportation services• Incorporation of commercial and recreational
activities within the terminal• Provision of parking spaces to replace the
existing parking spaces
TASK EXECUTIONIn a climate of uncertainty and instability, any conceptual development study needs to be given comprehensive thought - particularly essential when considering a large-scale capital project, and the potential impact on the existing built private properties surrounding it. Often this type of investigation can generate a staggering amount of information when more than one alternative is explored, with 3 to be developed in this project study. For this approach to become useful, it must be carefully organized and prioritized to best suit the project goals and objectives. The ideal project program must be evident and clearly understood by every stakeholder.
The study design team in consultation with the ultimate users representatives, and other ‘problem solving specialists’, worked together with the SAC to define the goals, identify the special constraints, and establish the requirements of the project. An interactive analysis process was used to focus the effort so that all relevant information was considered and critical issues were addressed. The results were a consensus-based decision, based on a comprehensive analysis, which was
formulated on a thorough determination of the minimum program requirements. To accomplish this strategic process the Conceptual Approach task was completed as an interactive analysis with the MPO and MDT guiding the outlined steps as follows:
Basis of Programming (Operational Analysis and Space Planning)
The basis of programming and design established the feasible development program for a facility of this type, and was confirmed in coordination with the economic and market assessment work. An initial project development program provided for near-term development of a proposed ‘Phase 1’, to be followed by later full build-out for future needs associated with the serving transit systems growing ridership projections. Involvement of the key operational stakeholders leadership representatives was critical and included the following criteria:• Articulation of the facility vision, goals and
supporting pedestrian transit mall. • Definition of space needs and functional
requirements that the site must support.• Development of space standards that are driven
by existing people metrics and their functional needs.
• Calculation of optimum area requirements per function for each use.
• Illustration of the optimized relationship between each use.
• Development of non-site specific, prototypical facility solutions for both transit and private development uses, including optimal vertical development criteria & relationships.
• Design criteria packages for development of the conceptual architectural & site plans.
The original program for the new downtown terminals as provided by MDT on the next page:

MIAMI INTERMODAL TERMINAL
D O W N T O W N M I A M I I N T E R M O D A L T E R M I N A L F E A S I B I L I T Y S T U D Y
MIAMI INTERMODAL TERMINAL
Working with the SAC, and based on the economic and market analysis completed in the previous task, a Preliminary Space Program was developed, and some initial spatial concepts of what this program might require in terms of land area. This sequence of analysis is provided in the presentation tables below:
PA G E 1 5
Downtown Miami Intermodal Terminal Space Program
Transportation Quantity Comments
Bus Bays 14 to 20 4 to 6 bus bays for articulated buses
Taxis 6 to 8 Existing 7 spaces near Government Center in three different locations
Jitneys 2 to 4 Total 78 vehicles being operated by six (6) Jitney Companies
Car Share 10 Based on workers/day time population (50,000 jobs in 2035)
Bike Share 25 Based on workers/day time population (50,000 jobs in 2035)
Car Parking TBDIf located on an existing parking lot, will provide either the same number of parking spaces or make appropriate adjustments given alternatives
City of Miami Trolley 1 Could use one of the bays for MDT buses
Greyhound 1
Charter Bus TBD Charter buses are not regulated by the County
Preliminary Space Planning/Program
1.0 Customer Service Building GSF
1.1 Vestibule - Main 400
1.2 Ticketing Lobby 300
1.3 Waiting Area 900
1.4 Visitor’s Center/Display Area 300
1.5 Driver/Crew Room 400
1.6 Community Conference Room 800
1.7 Storage Room 200
1.8 Public Restrooms 800
1.9 Telephone and Other Services 120
1.10 Mechanical Equipment Room 180
Total 4,400
2.0 Administration
2.1 Administration Office 200
2.2 Service Counter (TVM’s and/or Window) 80
2.3 Open File/Work Area 120
2.4 Storage Room 80
2.5 Shared Workstation 120
Total 600

MIAMI INTERMODAL TERMINAL
D O W N T O W N M I A M I I N T E R M O D A L T E R M I N A L F E A S I B I L I T Y S T U D Y
MIAMI INTERMODAL TERMINAL
The final facility program was refined through the SAC process, enlarging it somewhat to accommodate additional program elements that were considered integral to an intermodal terminal by the team. This formed the basis of the Site Development Concept Alternatives prepared in the following task, and led to the final selected Scheme, which was designed to meet these program requirements. The chart below captures that program.
PA G E 1 6
Preliminary Space Planning/Program (continued)
3.0 Security GSF
3.1 Security Office 200
3.2 Service Counter 60
3.3 Equipment Storage Room 80
Total 340
4.0 Service - Support
4.1 Janitor/Supply Closet 160
4.2 Restroom - Drivers 240
Total 400
Subtotal all GSF 5,740
18,500
12,760
1.11 Lease Area - Retail 6,380
1.12 Lease Area - Food Services 6,380
Total Enclosed Area 18,500
5.0 Bus Bays GSF
5.1 2 - Off Street Days - 60’ Articulated Bus 960’/bay 1,920
5.2 Layover Positions 60’ Articulated Bus 1,440
5.3 12 - Off-Street Bays - 40’ bus 21,600
5.4 4 - Layover Bays 40’ Bus 1,920
5.5 Internal Bus Circulation Area 28,500
Total 55,380
6.0 Site
6.1 Stops/Boarding Areas 20,000
6.2 Outside Sitting/Landscape Areas 12,500
6.3 Pedestrian Access 8,000
6.4 Bike Parking and Access 2,850
6.5 Kiss and Ride 5,200
6.6 Taxi and Jitney Service Areas 5,200
6.7 Staff Parking - 8 spaces 2,080
Total 53,830
2.51 Acre Total Site 109,210
2.93 Acre Total Required 127,710

MIAMI INTERMODAL TERMINAL
D O W N T O W N M I A M I I N T E R M O D A L T E R M I N A L F E A S I B I L I T Y S T U D Y
MIAMI INTERMODAL TERMINAL
PA G E 1 7
Preliminary Space Program - New Downtown Intermodal Terminal
Facilities
1.0 Customer Service Building SF
1.1 Vestibule - Main 400
1.2 Ticketing Lobby 300
1.3 Waiting Area 900
1.4 Lease Area - Retail 800
1.5 Lease Area - Food Services 1200
1.6 Vistor’s Center/Display Area 300
1.7 Driver/Crew Room 400
1.8 Community Room 800
1.9 Storage Room 200
1.10 Public Rest Rooms 800
1.11 Telephones and Other Services 120
1.12 Mechanical Equipment Room 180
Total 6,400
2.0 Administration
2.1 Administartion Office 200
2.2 Service Counter 80
2.3 Open File/Work Area 120
2.4 Storage Room 80
2.5 Shared Workstation 120
Total 600
3.0 Security
3.1 Security Office 200
3.2 Service Counter 60
3.3 Equipment Storage Room 80
Total 340
4.0 Service - Support
4.1 Janitor/Supply Closet 160
4.2 Restroom - Drivers 240
Total 400
Total Enclosed Area 7,740
Intermodal HubsCharacteristics that define them are as follows:– Exhibits high forecast boardings and
alightings within the future 2035 transit network;
– An area surrounded by higher density mixed use developments including downtown areas, transit oriented development pattern (TOD), see County Future Land Use Plan; and
– Provide connections for two or more high capacity (fixed guideway) transit lines.
Strategies for intermodal Hubs include:– Enclosed shelters for travelers;– Real-time passenger information systems;– Unique architecture and signage;– Surface or structured parking as
appropriate;– Integration with surrounding
development;– Pedestrian linkage improvements with a
half-mile radius;– Bicycle linkage improvements within a
two-mile radius;– Restrooms and community spaces as
appropriate;– Public art;– Access priority to bike/pedestrian and
transit patrons over other modes;– Secure and weather protected waiting
areas;– Accommodations for potential bike
share/car share programs;– Pre-board ticketing options and Jitney/
Taxi bays.

MIAMI INTERMODAL TERMINAL
D O W N T O W N M I A M I I N T E R M O D A L T E R M I N A L F E A S I B I L I T Y S T U D Y
MIAMI INTERMODAL TERMINAL
PA G E 1 8
Preliminary Space Program - New Downtown Intermodal Terminal (continued)
Bus Operations
5.0 Bus Bays SF
5.1 2 - Off-Street Bays - 60’ Articulated Bus 960’/bay 1,920
5.2 2 - Layover Positions 60’ Articulated Bus 1,440
5.3 12 - Off-Street Bays - 40’ Bus 21,600
5.4 4 - Layover Bays 40’ Bus 1,920
Total 26,880
6.0 Site
6.1 Stops/Boarding Areas 10,752
6.2 Outside Sitting/Landscape Areas 8,064
6.3 Pedestrian Access 5,376
6.4 Bike Access 2,688
6.5 Kiss and Ride 5,200
6.6 Taxi Service 2,600
6.7 Staff Parking - 8 Spaces 2,080
6.8 Short-term Parking - 80 Spaces 20,800
6.9 Long-term Parking - 420 Spaces 109,200
Total 166,760
4.45 Acre Total Site 193,640
4.62 Acre Total Required 201,380

MIAMI INTERMODAL TERMINAL
D O W N T O W N M I A M I I N T E R M O D A L T E R M I N A L F E A S I B I L I T Y S T U D Y
MIAMI INTERMODAL TERMINAL
Preliminary Economic and Market Analysis
PA G E 1 9
KNOWLEDGE FOR IMPLEMENTATIONThe objectives for this task item in the study focused on conducting an analysis to identify:
a. The feasibility of incorporating office, commercial and/or other transit supported uses in the proposed terminal, as well as the programmatic implications of such..
b. A Preliminary Market Analysis to determine the potential needs of the study area (demands) by use, and the longer term development opportunities that could evolve as the terminal facility would be implemented.
It was recognized that this portion of the study needed to capture a measure of “knowledge for implementation” so there was a confidence that the development feasibility analysis, as well as the subsequent financial feasibility was based on a realistic market background. In the effort to assist the consulting team and the MPO with economic, market and cost/benefit analyses utilized to assess the feasibility of the proposed intermodal facility, the additional skills of an economic and market specialist sub-consultant were utlized to complete a significant portion of this work. Their findings provided an additional innovation to the site selection process, and then the subsequent facility conceptual development / programming / analysis processes. The research utilized in this study area began with the transit data collected during the initial phase of work, and was augmented by local market background knowledge to identify potential for integrating mixed use development into an intermodal site, considering both primary and secondary demand factors. The analysis screened pertinent economic and demographic factors affecting the market area, and resulted in establishing the real, primary uses that could be successful if programmed into the intermodal facility and/or related site development. This level of ‘market support’ was analyzed in 3 key use areas by conducting a limited supply and demand analysis to draw conclusions as to appropriate size and phasing of the non-transit elements of the project. Specifically excluded was new residential development uses due to the limited land use and zoning allowances for the candidate sites in the ‘area of consideration’.
• Retail (including Entertainment & Recreation uses) This demand was driven from three Primary Market Area (PMA) sources:
1. Local and regional residents, also known as PMA residents (which consider primary and seasonal households)
2. Downtown workers (PMA Office workers) and visitors (both for business and tourism)
3. Supporting commuters / transit riders who utilize the system(s) daily for destination and transfer trips
• Office uses Based on the pertinent economic and market factors affecting the primary office market area, the study focused on an ‘overview’ of both regional and local office market trends, including a comprehensive supply vs. demand analysis.
• Mixed-Use opportunities This was more focused on the more mid to longer term transit oriented uses that could be in demand as the intermodal center matures. This included ‘hotel’ demand, especially as it related to potential for a limited service business center product type, not currently served in the Downtown Miami sub-market. When considering the additional retail uses that could be supported by the transit ridership in a mixed-use venue, it would in-turn provide enhanced service opportunities for new residents that would be attracted to the intermodal center. The current City of Miami zoning in the study area does in fact permit high-rise units that could be included above, or in conjunction with the hotel units. These potential residential uses could share common amenities with the hotel tower, and ‘round out’ a fully integrated TOD program.
The following pages present the findings of this study section, and were used as the basis for programming in the subsequent Preliminary Programming, preparation of the Site Conceptual Development Alternatives, and the Final Recommendations.

MIAMI INTERMODAL TERMINAL
D O W N T O W N M I A M I I N T E R M O D A L T E R M I N A L F E A S I B I L I T Y S T U D Y
MIAMI INTERMODAL TERMINAL
PA G E 2 0
Average Daily Ridership ( By Mode-2011 )
RIDERSHIP SUMMARY• Estimated transit use for Downtown Center
– 5 - minute walk
• Total average daily ridership estimated at roughly 31,000 – Estimated 45% “transfer” rate
• Adjusted average daily rider/station visitor at 17,000
6,260MetroRail
6,100MetroBus
4,650MetroMover
METROMOVER METROBUS METRORAIL
Retail Demand from Transit ( By Mode-2011 )
Annual Purchasesby Category
Percent CaptureStation Site
Total Purchasesby Category
Annual SalePer SF
Potential Demand (SF)
Drinks/Dinner $601 20% $2,041,000 $375 5,400
Lunch/Breakfast $1,155 5% $981,000 $375 2,600
FoodStore $1,109 20% $3,769,000 $295 12,800
Pharmacy/Convenience $739 20% $2,512,000 $450 5,600
Mall TypeMerchandise $2,587 15% $6,596,000 $285 23,100
Total $15,899,000 49,500
Source: Jacobs; Lambert Advisory; Urban Land Institute; ISCC
Note: Estimates herein are weighted average based upon preliminary analysis of rider expenditure by mode of transit and annual store sales.
MIAMI INTERMODAL TERMINAL
D O W N T O W N M I A M I I N T E R M O D A L T E R M I N A L F E A S I B I L I T Y S T U D Y
MIAMI INTERMODAL TERMINAL
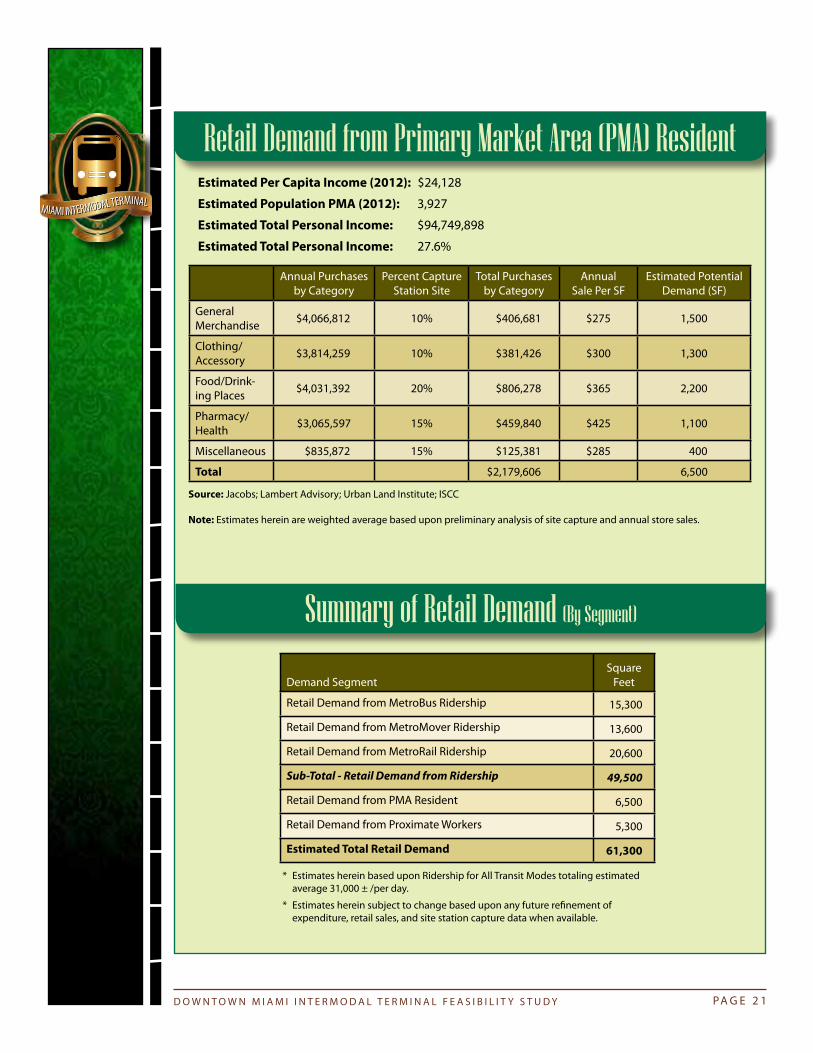
PA G E 2 1
Summary of Retail Demand (By Segment)
Demand SegmentSquare
Feet
Retail Demand from MetroBus Ridership 15,300
Retail Demand from MetroMover Ridership 13,600
Retail Demand from MetroRail Ridership 20,600
Sub-Total - Retail Demand from Ridership 49,500
Retail Demand from PMA Resident 6,500
Retail Demand from Proximate Workers 5,300
Estimated Total Retail Demand 61,300
* Estimates herein based upon Ridership for All Transit Modes totaling estimated average 31,000 ± /per day.
* Estimates herein subject to change based upon any future refinement of expenditure, retail sales, and site station capture data when available.
Annual Purchasesby Category
Percent CaptureStation Site
Total Purchasesby Category
Annual Sale Per SF
Estimated PotentialDemand (SF)
GeneralMerchandise $4,066,812 10% $406,681 $275 1,500
Clothing/Accessory $3,814,259 10% $381,426 $300 1,300
Food/Drink-ing Places $4,031,392 20% $806,278 $365 2,200
Pharmacy/Health $3,065,597 15% $459,840 $425 1,100
Miscellaneous $835,872 15% $125,381 $285 400
Total $2,179,606 6,500
Source: Jacobs; Lambert Advisory; Urban Land Institute; ISCC
Note: Estimates herein are weighted average based upon preliminary analysis of site capture and annual store sales.
Estimated Per Capita Income (2012): $24,128
Estimated Population PMA (2012): 3,927
Estimated Total Personal Income: $94,749,898
Estimated Total Personal Income: 27.6%
Retail Demand from Primary Market Area (PMA) Resident

MIAMI INTERMODAL TERMINAL
D O W N T O W N M I A M I I N T E R M O D A L T E R M I N A L F E A S I B I L I T Y S T U D Y
MIAMI INTERMODAL TERMINAL
Preliminary Street Closure/Traffic Analysis
PA G E 2 2
To evaluate the feasibility of implementing a pedestrian-transit mall in conjunction with the intermodal terminal facility, the data collected in the first phase of the study was used to evaluate the feasibility of closing NW 1st Street from NW 1st Avenue to NW 2nd Avenue. With the original intent to develop a pedestrian/transit mall along this segment, the evolving alternative conceptual options and schemes also considered other street segments for closure and/or transit only restrictions. In particular 2 additional segments of NW 1st Avenue were critical to the potential success of Schemes #2 and #3, so that a pedestrian safe and operationally ‘clean’ transit route could be considered. The opportunity to look at an expanded Transit Mall that would connect the County Government facilities to the close-by Federal Judicial facilities, and even ultimately the Overtown Transit Village (OTV) was a worthy exercise. As part of this task, the study proceeded with the following evaluations:
a. Conducted the necessary traffic analysis to determine the feasibility of implementing the 3 optional street closures
b. Analyzed traffic and transit impacts on the existing traffic circulation patterns
c. Integrated rational route adjustments for the impacts for the bicycle and pedestrian circulation patterns
d. Evaluated potential uses for the restricted areae. Identified the pros and cons of the proposed
optional street closures
TASK EXECUTIONTo complete this extended work, a traffic engineering specialist was brought on-board to perform a limited Qualitative TIA (traffic impact analysis) for the alternative street segments. This was based on the preliminary development program, to gauge impacts, so this work should be updated once the final development scheme is concluded.
The full Qualitative TIA is included as an appendix item of this report (due to its’ size). The following is a summary of their analysis approach and results:• Extended multiple scenarios were studied, but 2
in particular are the most related to the current alternative Schemes (#2 and #3 reference links in their report)
• This approach compares ‘apples to apples’ for the links analyzed
• The roadway links & intersections were analyzed for;– Impacts of potential road closures– With transit and emergency vehicles to
remain• Virtually all links were below 1,000 VPH in peak
hour volumes in 2011, which is an acceptable LOS by County standards
• The potential to exacerbate existing traffic conditions was lowest with NW 1st Street
• The number of bus routes affected was virtually the same for NW 1st Street and NW 1st Avenue (only 1 route difference by current programming/schedules)
• The potential to limit pedestrian circulation conflicts was also lowest with NW 1st Street by a wide margin
• Overall ‘scores’ result in the NW 1st Street closure as the best option by more than 50% in a qualitative analysis.

MIAMI INTERMODAL TERMINAL
D O W N T O W N M I A M I I N T E R M O D A L T E R M I N A L F E A S I B I L I T Y S T U D Y
MIAMI INTERMODAL TERMINAL
PA G E 2 3

MIAMI INTERMODAL TERMINAL
D O W N T O W N M I A M I I N T E R M O D A L T E R M I N A L F E A S I B I L I T Y S T U D Y
MIAMI INTERMODAL TERMINAL
PA G E 2 4

MIAMI INTERMODAL TERMINAL
D O W N T O W N M I A M I I N T E R M O D A L T E R M I N A L F E A S I B I L I T Y S T U D Y
MIAMI INTERMODAL TERMINAL
PA G E 2 5

MIAMI INTERMODAL TERMINAL
D O W N T O W N M I A M I I N T E R M O D A L T E R M I N A L F E A S I B I L I T Y S T U D Y
MIAMI INTERMODAL TERMINAL
THIS PAGE INTENTIONALLY LEFT BLANK
PA G E 2 6

MIAMI INTERMODAL TERMINAL
D O W N T O W N M I A M I I N T E R M O D A L T E R M I N A L F E A S I B I L I T Y S T U D Y
MIAMI INTERMODAL TERMINAL
TASK EXECUTION (co n t i n u e d )The feasibility of closing NW 1st Street from NW 1st Avenue to NW 2nd Avenue was also evaluated from a transportation and traffic circulation standpoint in a graphic context. The existing transportation network (roadways, transit routes, sidewalks, bicycle paths, etc.) will need to be analyzed from an operation standpoint to identify possible enhancement improvements to limit the impact of the proposed street closure in terms of altered traffic and transit patterns. These altered patterns and improvements can offer operational changes that result in better transit customer services by organizing the circulation patterns in a safer design. The resulting traffic / transit volumes could then accommodated without drastically affecting the
resulting levels of service (for the transit uses). Specific areas of projected congestion and failing levels of service identified during more detailed studies, once the project master plan moves into a schematic design phase, should be considered and potential mitigation solutions that are ‘structurally improvement’ based could be developed to solve any new impacts not identified in this limited evaluation study.
Some of the proposed pedestrian/transit mall improvement options are depicted in the sketch sections below that were included in the alternate Conceptual Development Schemes for the NW 1st Street corridor:
OPTION 1As depicted in Scheme 1, with two-way transit circulation
OPTION 2As depicted in our ‘pedestrian only’ Scheme 6A
PA G E 2 7

MIAMI INTERMODAL TERMINAL
D O W N T O W N M I A M I I N T E R M O D A L T E R M I N A L F E A S I B I L I T Y S T U D Y
MIAMI INTERMODAL TERMINAL
PA G E 2 8
Based upon the conclusions of the vehicular and pedestrian analysis, it was recommended that the MPO explore further detailed concepts and potential uses for the pedestrian mall and restricted area. An important component of any successful pedestrian-oriented area is a careful and targeted market and demographic analysis to determine the volume, type and behaviors of the potential users to accurately identify potential uses. These additional analyses should be part of the
comprehensive way to approach redevelopment zones in urban areas and ensure an energized, vibrant and activated pedestrian development.
The ultimate development of the pedestrian mall should take into consideration all forms of transportation as well as the need for circulation related to emergency, maintenance vehicles and other necessary movement.
OPTION 3As depicted in our Final Scheme

MIAMI INTERMODAL TERMINAL
D O W N T O W N M I A M I I N T E R M O D A L T E R M I N A L F E A S I B I L I T Y S T U D Y
MIAMI INTERMODAL TERMINAL
Site Development Concept Alternatives
PA G E 2 9
After completing the Site Selection process, and narrowing the candidate sites down to the 3 key ‘best’ parcel locations, all just east of the Government Center, the study proceeded with a series of planning studies to ‘test fit’ the development approach for each site. These Concept Alternatives were prepared to consider possible options for:• MDT operations and facilities on the ground
floor as well as the associated access and circulation needs of bike and pedestrian users
• Mixed-use, multi-floor logical development opportunities above the terminal operations that were supported by the Preliminary Economic & Market Analysis
• Connectivity of existing transportation/transit infrastructure
• Public and ‘green’ space integration• Provisions for taxi, jitney and public parking
support which may have been affected by the new terminal, or is anew demand because of it
The work in this phase of the study was conducted in 3 generalized steps as described below:
STEP 1 : ARCHITEC TURAL STUDIESUtilizing the outcome of the Conceptual Approach and Programming as a ‘Preliminary Basis for Design’ a preliminary facility spatial
program was developed and refined to allocate minimum building square footages, circulation, and relationship/adjacency criteria in alternative plans and conceptual illustrations format. After this spatial program was confirmed with the MPO as adequate, a simple facility ‘massing’ layout was prepared for use in site planning. This diagram was produced at scale, and included typical information to address orientation of the facilities, as well as the necessary access & circulation relationships to the site. This was reviewed and approved by MPO for use in the subsequent planning & facility design process.
Next a ‘Preliminary Conceptual Design’ alternatives were prepared for the facilities on the preferred alternative sites, in conjunction with the site planning effort described below. They were based on the approved Preliminary Basis for Design, and were refined to respond to the specific site conditions such as the probable building location, site circulation, environmental criteria and local zoning regulations. Once and after the selected site configuration alternative & final development program were confirmed through the evaluation process at the end of this task, a single set of conceptual design alternatives drawings were prepared to depict the generalized functional site structure, building form and character for purposes of providing final site development concepts for the final selected site.

MIAMI INTERMODAL TERMINAL
D O W N T O W N M I A M I I N T E R M O D A L T E R M I N A L F E A S I B I L I T Y S T U D Y
MIAMI INTERMODAL TERMINAL
PA G E 3 0
STEP 2 : S ITE PLAN DE VELOPMENTThe site layouts developed during this phase also utilized Architectural ‘massing’ studies to explore the maximum build-out alternatives, establishing the appropriate use relationships, and connectivity patterns for efficient site function. The plans assumed alternative scenarios that included private property acquisitions as identified by the MPO for the facility placement, and the incorporation of publicly-available right-of-way for the development of the transit/pedestrian mall. After an understanding of site-specific existing conditions were achieved, a series of development options were created and applied to the preferred sites indicating placement of facilities and links to exterior transit functions (and other urban context uses) as needed. The development options looked at alternatives for the arrangement of facilities and functions.
Evaluation criteria were applied and a recommendation was made for the preferred option. Factors that were considered in the site planning process include vehicular and pedestrian access & circulation, parking, utility and infrastructure, site amenities work, security or other risks, and other relevant site issues.
STEP 3 : E VALUATION AND DE VELOPMENT OF THE PREFERRED SITEAs the conceptual design alternatives of the proposed facility were developed, the minimum conceptual design factors that were included for evaluation purposes are listed as follows, but were not limited to:a. Roadways
• Traffic impact to adjacent streets• Roadway improvements necessary to alleviate
traffic congestion created by the construction of this facility
b. Transit• Transit service changes to accommodate
MDT routes• Parking for Bus• Bus shelters• Bus stops• Drivers and MDT staff area• Transit booths and/or kiosks
(information and tickets)
c. The Intermodal ‘Mixed-Use’ Facility• Type of facility• Connectivity and accessibility to Metrorail
and Metromover• Parking garage• Commercial and retail space• Office space• Common grounds/Public spaces• Kiss and Ride, Taxi, Jitney, other loading areas
d. Amenities• Passenger information• Bathrooms• Waiting areas• Others
e. Non-Motorized• Bicycle and pedestrian accessibility• Bicycle racks and parking• Bicycle lockers• Sidewalks• Pedestrian crossings
f. Miscellaneous• Economic impact to the adjacent area• Aesthetic design• Landscaping• ADA compliance• Lighting• Safety• Security

MIAMI INTERMODAL TERMINAL
D O W N T O W N M I A M I I N T E R M O D A L T E R M I N A L F E A S I B I L I T Y S T U D Y
MIAMI INTERMODAL TERMINAL
TASK EXECUTIONAfter the preferred architectural facility concept and site configurations were finalized and selected through the work in this Task, a final site development package for each candidate site was developed, allowing for the evaluation of the multiple site criteria/features as outlined above. These final site development concepts and the feature options were presented to the MPO and SAC in a work session to receive feedback and modify the plans accordingly for its’ ultimate feasibility evaluation. This phase included illustrative drawings and massing models depicting the ultimate built out of the Multi-modal Facility, the relationship to adjacent transportation and multi-modal nodes, circulation, infrastructure, parking elements, natural and context elements. The plans also addressed the parameters for a phased implementation, pertinent regulations, and strategies to develop the property balanced with projected operations.
Working corroboratively, this final site design and features options were ‘benchmark’ to the evaluation criteria that were created from the goals and objectives developed in the earlier phases of the project. The resulting plans and illustrations that
follow summarize the final preferred facility and transit / pedestrian site plans for all 3 sites that are logical and defensible, upon which the MPO can realistically develop ‘next step’ strategies to get the project approved, funded and implemented. The product of this Task was utilized for the completion of the Final Site Development Concept task of this project, leading towards our final set of Recommendations, and the concurrent Action Plan.
To understand the potential development concepts for the 3 initial preferred sites, a summary of study’s objective –‘Vision’ for the area will help frame the context of the Alternative Concept Schemes. The initial parcels that appeared to be the most likely candidate sites based on the results of the Site Selection task are depicted in the photographic image below. These sites were examined through close coordination with not only the SAC, but also the ‘major players’ of the SAC that will have direct ‘stakeholder’ and/or ownership/operations interest in the intermodal facility. These included MDT, SFRTA and their efforts on the South Florida East Coast Corridor (SFECC) project, and the FECI as related to the All Aboard Florida (AAF) terminal project.
PA G E 3 1

MIAMI INTERMODAL TERMINAL
D O W N T O W N M I A M I I N T E R M O D A L T E R M I N A L F E A S I B I L I T Y S T U D Y
MIAMI INTERMODAL TERMINAL
This illustrates the potential downtown parcels in the study area that were initially considered for the new intermodal terminal, and/or other visionary and regionally important transit oriented development (TOD) opportunities. They are identified as follows:• Lots 1 & 2: A Regional Terminal location
possibility with direct Metrorail/Metromover connections to MIA and the Port of Miami (POM).
• Lot 3: A potentail rail terminal site with direct connection possible to the Metromover, Federal Courthouse, and possible high-rise development above the terminal for residential and mixed-use retail & commercial uses.
• Lots 4, 5 & 8: Primary Intermodal Terminal location that could be dveeloped with TOD amenities and green areas to enhance an urban ‘transit mall’ for the 2-block region.
• Lots 6 & 7: Sites with high TOD potential for hotel or office space and service amenities for occupants and transit users.
This also illustrates the potential extent of Pedestrain/Linear Transit Mall opportunites along NW 1st Avenue, and the additional opportunity to covert NW 1st Street to an exclusive transit ‘Boulevard’ for cross access at the Governement Center/Miami Library & Historical Museum.The blue cross-street markers indicate remaining E-W vehicular routes with key Transit Mall nodes highlighted that hold potential for creative intersection treatments.
During the coordination efforts mentioned above, the task also captured the summary of existing transit services in the downtown study area. The following mapped image indicates the routes, termial and ridership information. This Diagram when taken in the context of potential transit users that could be served, clearly summarizes the objective that the primary study sites would meet; providing convenience to access all services under one terminal facility, with ample associated service amenities development opportunities.
PA G E 3 2

MIAMI INTERMODAL TERMINAL
D O W N T O W N M I A M I I N T E R M O D A L T E R M I N A L F E A S I B I L I T Y S T U D Y
MIAMI INTERMODAL TERMINAL
PA G E 3 3
Total Routes served - 23 routes Terminal locations served Miami Dade College (4) Governemental Center (6) Overtown Transit Village (3) Downtown CBD (10)
Daily Ridership by mode Metrobus - 106,294 passengers daily Metrorail - 13,976 passengers daily Metromover - 10,036 passengers daily
(by November 2012 statistics)

MIAMI INTERMODAL TERMINAL
D O W N T O W N M I A M I I N T E R M O D A L T E R M I N A L F E A S I B I L I T Y S T U D Y
MIAMI INTERMODAL TERMINAL
PREFERRED ALTERNATIVE SCHEME CONCEPTSAlternative Scheme #1The first alternative site explored was the existing private lot (FECI) on the west side of NW 1st Avenue directly in front of the Government Center (GC). It acts as a ‘front door’ to the GC due to the existing large surface parking facilities used by most of the visitors on a daily basis. It includes the old NW 2nd Street dead-end ROW parcel, and conceptually considered the potential realignment of the NW 1st Avenue ‘dog leg’ between 1st and 2nd Streets that could be accomplished if NW 1st Avenue was converted to a transit mall not open to private vehicles.
This concept affords some advantages unique to this location/site: • Full development of the Intermodal Terminal
with direct connection to the Metrorail and Metromover station platforms at the GC;
• Potential co-use with the future TriRail Coastal Link terminal;
• 22 bus stop locations, with expansion potential on NW 1st Avenue, and good separation of taxi/jitney and kiss & ride locations outside the terminal perimeter;
• The building program for MDT services and the needed/related commercial market uses can be accommodated on a multi-level platform directly above the terminal;
• Traffic rerouted off the closed section of NW 1st Avenue could be easily looped from 1st to 2nd Streets (and/or reversed) to limit disruption to downtown circulation by the single block transit closure; and,
• Would limit disructions to NW 1st and 3rd Streets as significant E-W connectors.
Through the SAC evaluation process, there were also discussions about a few potential disadvantages of this site. The key reasons why it possibly could not be recommended include:• If the SFEEC Coastal Link terminal and the All
Aboard Florida terminal would both be proposed as ground level designs, there could be little room left for the MDT bus facility;
• Conversely, if both of those terminals are proposed as 2nd level platform types at this location, it would limit the above grade other uses/services development potential and could pose significant structural design impacts on the ground level MDT terminal; and,
• The need to use additional curbside areas of NW 1st Avenue to accommodate MDT’s expansion in the future would be very limited if NW 1st Avenue was not converted to a transit only pedestrian street in coordination with this scheme.
.
PA G E 3 4

MIAMI INTERMODAL TERMINAL
D O W N T O W N M I A M I I N T E R M O D A L T E R M I N A L F E A S I B I L I T Y S T U D Y
MIAMI INTERMODAL TERMINAL
PA G E 3 5
DO
WN
TOW
N M
IAM
I IN
TERM
OD
AL
TERM
INA
L - S
CHEM
E 1

MIAMI INTERMODAL TERMINAL
D O W N T O W N M I A M I I N T E R M O D A L T E R M I N A L F E A S I B I L I T Y S T U D Y
MIAMI INTERMODAL TERMINAL
PA G E 3 6
DOWNTOWN MIAMI INTERMODAL TERMINAL FEASIBILITY STUDY
212.19.12
PRELIMINARY SPACE PROGRAM - SCHEME 1

MIAMI INTERMODAL TERMINAL
D O W N T O W N M I A M I I N T E R M O D A L T E R M I N A L F E A S I B I L I T Y S T U D Y
MIAMI INTERMODAL TERMINAL
PA G E 3 7
DOWNTOWN MIAMI INTERMODAL TERMINAL FEASIBILITY STUDY
312.19.12
NW 1st AVENUE
NE 1st STREET
NE 3rd STREET
3D DIAGRAM - SCHEME 1

MIAMI INTERMODAL TERMINAL
D O W N T O W N M I A M I I N T E R M O D A L T E R M I N A L F E A S I B I L I T Y S T U D Y
MIAMI INTERMODAL TERMINAL
PA G E 3 8
DOWNTOWN MIAMI INTERMODAL TERMINAL FEASIBILITY STUDY
412.19.12
3D DIAGRAMATIC AERIAL VIEW - SCHEME 3
NE 3rd STREET
NE 1st STREET
NW 1st
AVENUE
3D DIAGRAMATIC AERIAL VIEW - SCHEME 1

MIAMI INTERMODAL TERMINAL
D O W N T O W N M I A M I I N T E R M O D A L T E R M I N A L F E A S I B I L I T Y S T U D Y
MIAMI INTERMODAL TERMINAL
PA G E 3 9
Alternative Scheme #2The next alternative site explored was the existing private lot (partially developed) on the east side of NW 1st Avenue and adjacent to the Miami Parking Authority Garage between 2nd and 3rd Streets.
This concept would establish 2 ‘transit only’ strips on and adjacent to the east side of NW 1st Avenue between 2nd and 3rd Streets, moving all intermodal terminal facilities off the FECI property. Remaining bus stops along the west side of 1st Avenue south of 2nd Street (in the angled connector) could be utilized for the MDT Metromover rail shuttle parking area and/or regular bus layover positions. This concept affords some advantages unique to this location/site: • Full development of the Intermodal Terminal
close to the Miami Parking Authority garage for shared commuter use;
• The ability to develop an elevated terminal connection integrated into an above-street urban plaza space, directly to the AAF station, Metrorail, Metromover, and the Government Center itself;
• The Building program for MDT services and the needed/related commercial market uses can be accommodated on a multi-level platform adjacent to the parking garage; and,
• Traffic rerouted off the closed section of NW 1st Avenue could be easily looped from 1st to 2nd Streets (and/or reversed) to limit disruption to downtown circulation by the single block transit closure.
Through the SAC evaluation process, there were also discussions why this option was not the most preferred. The key reasons why it was not a recommended include:• All Aboard Florida will have their signature
building as part of their terminal, at their preferred location, directly across the street, so the impact of the bus bays fronting their building would limit commercial activity and detract from the enhanced pedestrian environment that such a terminal facility should present;
• With the AAF options being considered to move the elevated rail terminal further north to front the lot adjacent to the Federal building, no direct bus to rail connection will be possible; and,
• The need to use additional blocks of NW 1st Avenue to accommodate additional buses to meet MDT’s expanding requirement for bus bays (perhaps as high as 30) could not be accommodated in a unified approach utilizing this concept.

MIAMI INTERMODAL TERMINAL
D O W N T O W N M I A M I I N T E R M O D A L T E R M I N A L F E A S I B I L I T Y S T U D Y
MIAMI INTERMODAL TERMINAL
PA G E 4 0
THIS PAGE INTENTIONALLY LEFT BLANK

MIAMI INTERMODAL TERMINAL
D O W N T O W N M I A M I I N T E R M O D A L T E R M I N A L F E A S I B I L I T Y S T U D Y
MIAMI INTERMODAL TERMINAL
PA G E 4 1

MIAMI INTERMODAL TERMINAL
D O W N T O W N M I A M I I N T E R M O D A L T E R M I N A L F E A S I B I L I T Y S T U D Y
MIAMI INTERMODAL TERMINAL
PA G E 4 2
DOWNTOWN MIAMI INTERMODAL TERMINAL FEASIBILITY STUDY
212.19.12

MIAMI INTERMODAL TERMINAL
D O W N T O W N M I A M I I N T E R M O D A L T E R M I N A L F E A S I B I L I T Y S T U D Y
MIAMI INTERMODAL TERMINAL
DOWNTOWN MIAMI INTERMODAL TERMINAL FEASIBILITY STUDY
312.19.12
NE 3rd STREET
NE 2nd STREET
NE 1st STREET
NE 1st AVENUE
PA G E 4 3

MIAMI INTERMODAL TERMINAL
D O W N T O W N M I A M I I N T E R M O D A L T E R M I N A L F E A S I B I L I T Y S T U D Y
MIAMI INTERMODAL TERMINAL
DOWNTOWN MIAMI INTERMODAL TERMINAL FEASIBILITY STUDY
412.19.12
3D DIAGRAMATIC AERIAL VIEW - SCHEME 2
NE 3rd STREET
NE 1st AVENUE
NE 3rd STREET
NE 2rd STREET
PA G E 4 4

MIAMI INTERMODAL TERMINAL
D O W N T O W N M I A M I I N T E R M O D A L T E R M I N A L F E A S I B I L I T Y S T U D Y
MIAMI INTERMODAL TERMINAL
PA G E 4 5
Alternative Scheme #3Located on the South and West sides of the Government Center, this alternative uses NW 1st Street as the primary location for the terminal, with NW 1st converted to a two-way transit and emergency vehicle restricted use street. It would require the entire use of the South half of the ‘Stephen P. Clark Center West Park, supplanting the southern sculpture court, but would maintain the central fountain plaza off NW 2nd Avenue. It also requires the conversion of the existing ADA lot
east of the Miami Library and Historical Museum to a 2-way bus stop terminal, but maintaining the existing service access to the Museum. This scheme would provide;
• A total of 25 bus bays, • Including 5 articulated bays,• 8 taxi-jitney spots, and• A 3 spot ‘Kiss & Ride’ drop-off zone.

MIAMI INTERMODAL TERMINAL
D O W N T O W N M I A M I I N T E R M O D A L T E R M I N A L F E A S I B I L I T Y S T U D Y
MIAMI INTERMODAL TERMINAL
THIS PAGE INTENTIONALLY LEFT BLANK
PA G E 4 6

MIAMI INTERMODAL TERMINAL
D O W N T O W N M I A M I I N T E R M O D A L T E R M I N A L F E A S I B I L I T Y S T U D Y
MIAMI INTERMODAL TERMINAL
PA G E 4 7
DOWNTOWN MIAMI INTERMODAL TERMINAL - SCHEME 3

MIAMI INTERMODAL TERMINAL
D O W N T O W N M I A M I I N T E R M O D A L T E R M I N A L F E A S I B I L I T Y S T U D Y
MIAMI INTERMODAL TERMINAL
PA G E 4 8
DOWNTOWN MIAMI INTERMODAL TERMINAL FEASIBILITY STUDY
212.19.12
PRELIMINARY SPACE PROGRAM - SCHEME 3

MIAMI INTERMODAL TERMINAL
D O W N T O W N M I A M I I N T E R M O D A L T E R M I N A L F E A S I B I L I T Y S T U D Y
MIAMI INTERMODAL TERMINAL
PA G E 4 9
DOWNTOWN MIAMI INTERMODAL TERMINAL FEASIBILITY STUDY
312.19.12
NW 1
st A
VENUE
NW 1st STREET
NW 2nd AVEN
UE
3D DIAGRAM - SCHEME 3

MIAMI INTERMODAL TERMINAL
D O W N T O W N M I A M I I N T E R M O D A L T E R M I N A L F E A S I B I L I T Y S T U D Y
MIAMI INTERMODAL TERMINAL
PA G E 5 0
3D DIAGRAMATIC AERIAL VIEW - SCHEME 3

MIAMI INTERMODAL TERMINAL
D O W N T O W N M I A M I I N T E R M O D A L T E R M I N A L F E A S I B I L I T Y S T U D Y
MIAMI INTERMODAL TERMINAL
PA G E 5 1
Alternative Scheme #3 (continued)The site area at the SW of the Government center could also accommodate a small component of single or multi-story transit oriented service and retail space. The alternative illustrates this as organized around a new central pedestrian plaza, with the potential to create a second+ level pedestrian bridge cross-over directly to the west side entrance of the Government Center, for protected access to the Metro stations inside. The ‘transit street’ could also be designed to be covered with some contemporary approaches already developed in other national terminals that serve similar systems. Some of these ideas are depicted below.
As the SAC evaluated this alternative it became clear why it was not a recommended solution. The key hurdles to the success of this concept included;• Not an appropriate use of the front of the
Government Center,• No a good organization and distribution for the
bus bays (too spread out from a central transit services facility),
• 2-way bus routes that complicate pedestrian circulation and safety, and
• Commingling of MDT bus and taxi/jitney circulation, which is not desirable.

MIAMI INTERMODAL TERMINAL
D O W N T O W N M I A M I I N T E R M O D A L T E R M I N A L F E A S I B I L I T Y S T U D Y
MIAMI INTERMODAL TERMINAL
PAG E 5 2
Alternative Scheme #4 Through further discussions and meetings with FECI on the All Aboard Florida terminal developments, a 4th Alternative lot location was propsed. This location, as depicted below is located on the lots west of MDT main offices at the Overtown Traffic Village (OTV).
In the diagram, the current daily ridership quantities are provided by the key numbers as follows:
1. OTV – 2,481 passengers on Metrobus, and 1,894 pasengers on Metrorail (not served by Metromover).
2. Government Center – 103,813 passengers combined on Metrorail, Metrobus & Metromover.
Through the SAC evaluation process, a decision was quickly achieved that this option was not viable, and was disregarded for further concept development. The key reasons why it was not a recommended included:
• Too far from the riders main destinations, with currently only 4.2% daily passenger traffic through OTV as compared to the Government center;
• Federal implications regarding Title VI issues; and
• Would require drastic changes in the service routes provided by MDT and ridership patterns that could have system-wide disruptive effects.

MIAMI INTERMODAL TERMINAL
D O W N T O W N M I A M I I N T E R M O D A L T E R M I N A L F E A S I B I L I T Y S T U D Y
MIAMI INTERMODAL TERMINAL
PAG E 5 3
Alternative Scheme #5Two other locations that were considered but not explored as full ‘separate, stand-alone’ concepts include those depicted on the following photographic illustrations:• The use of the entire West of the Government
Center West Park lot, in combination with the NW 1st Street as a converted transit street; and
• A unified reconfiguration and redevelopment of the lots east of the Metrorail tracks along the west side NW 1st Avenue all the way from SW 1st Street to NW 1st Street, including the existing MDT Flagler Terminal facility.

MIAMI INTERMODAL TERMINAL
D O W N T O W N M I A M I I N T E R M O D A L T E R M I N A L F E A S I B I L I T Y S T U D Y
MIAMI INTERMODAL TERMINAL
THE “ALL ABOARD FLORIDA” IMPAC T - A CHANGE IN DIREC TIONAlternative Scheme #6After completing the development and evaluations of the 3 primary site development alternatives, as well as the 4th and 5th Alternative site locations for the new intermodal terminal options, the MPO was notified of the evolving potential of a new downtown Miami terminal for the Florida East Coast Railroad (FECI) ‘All Aboard Florida’ train (AAF). This was for a new ‘higher’ speed commuter rail service that would connect from Miami to Orlando, along the FECI east coat line, with service stops in Ft. Lauderdale and West Palm Beach as well. For reference purposes a sample of news articles published during the study period related to this project are included in the appendix. Although given limited access to the FECI process, it was clear from this point with the MPO’s directives that a new
terminal alternative would need to be developed, since 2 of the 3 preferred candidate sites and Concept Schemes were utilizing the FECI property, or would be significantly affected by their planned development concepts.
To help frame this impact, and clarify the SAC’s understanding of the proposed AAF Miami Terminal, the following several diagrams are included in this study as provided by FECI. These illustrate the complete utilization of the parcels on the east side of the Governmental Center. This 3-D illustration shows the position and scale of the proposed terminal. It clearly identifies that the preferred study site and Concept Alternative Schemes #1 & #2 cannot be implemented.
PA G E 5 4
FECI - ALL ABOARD FLORIDAGOVERNMENT CENTER TERMINAL STATION (elevated)

MIAMI INTERMODAL TERMINAL
D O W N T O W N M I A M I I N T E R M O D A L T E R M I N A L F E A S I B I L I T Y S T U D Y
MIAMI INTERMODAL TERMINAL
PA G E 5 5
FECI - ALL ABOARD FLORIDAGOVERNMENT CENTER TERMINAL STATION (elevated)

MIAMI INTERMODAL TERMINAL
D O W N T O W N M I A M I I N T E R M O D A L T E R M I N A L F E A S I B I L I T Y S T U D Y
MIAMI INTERMODAL TERMINAL
The plan view of the same AAF Terminal proposal also shows the significant impact on the preferred study site and Concept Alternative Scheme #2; even though the site itself is not utilized, the plan for Scheme #2 to use the NW 1st Avenue western frontage for 8 bus positions is no longer viable.
The remaining Scheme, #3, which utilized the redesign of NW 1st Street into a new Pedestrian-Transit Mall, was the only valid concept left at that point. And with that realization, the study proceeded to consider how the capacity of that alternative could be enhanced, since the existing bus positions on NW 1st Avenue would be lost to the FECI Terminal development. Working in the favor of this approach was the street closure analysis (for private vehicles) provided by C. H. Perez, summarizing that of all the street blocks studied, this selection had the lowest impact on the surrounding downtown Miami roadway network.
This revised alternate scheme also was the first to consider how it might be possible to utilize the existing County owned and operated ‘ADA’ surface parking lot to the east of the Miami-Dade Cultural Center. With the ADA spots easily relocated to the north side of the Government Center, and the potential relocation of the existing sculpture plaza to the Government Center Plaza open-space, it would be possible to add 7 more bus-stop positions. These could be easily linked by enhanced pedestrian routes to the NW 1st Street Terminal site. Next a potential secondary loop around the mixed-use transit oriented building block at the SW corner of the Government Center Terminal block was considered, which as illustrated provides 6 more bus-stop positions, and incorporates taxi and jitney stop locations off NW 2nd Avenue to alleviate congestion.
Based on the constraints and limitations of Alternative Scheme #3, a new site was identified
in coordination with FECI. This new site is located on the SE corner of NW 2nd Avenue and NW 3rd Street, on the northern 1/3 of the West Park site. This is also over the existing Daycare center, and existing County Commissioners parking area. It was proposed as a ground-level bus terminal with a multi-level parking garage to be constructed above. The plans on the following 3 pages illustrate the AAF proposal as provided by FECI without modification.
While this location as submitted by FECI for the All Aboard parking garage above the new MDT terminal was initially considered as a viable option, the layout as submitted was insufficient in several objectives:• This location provides for only 14 bus bays (MDT requested 27 bus bays);
• Only one-way entrance and exit paths for the busses, which limits route flexibility, and was also less efficient in the number of stop positions generated;
• The bus stop positions were all designed for standard (40’) bus sizes, and MDT has a substantial and growing need to accommodate 60’ articulated buses in the terminal;
• Daycare relocated adjacent/part of the terminal (too close for noise and pollution – children’s safety could be affected)
• No provision for accommodation of bike facilities;
• Severe impact on the central Fountain Plaza to the south, impacted by the Daycare drop-off loop which all SAC members agreed was an important ‘front door’ public space that needed to be preserved to the greatest extent possible; and,
• Generally poor and/or undefined pedestrian circulation routes.
PA G E 5 6

MIAMI INTERMODAL TERMINAL
D O W N T O W N M I A M I I N T E R M O D A L T E R M I N A L F E A S I B I L I T Y S T U D Y
MIAMI INTERMODAL TERMINAL
PA G E 5 7

MIAMI INTERMODAL TERMINAL
D O W N T O W N M I A M I I N T E R M O D A L T E R M I N A L F E A S I B I L I T Y S T U D Y
MIAMI INTERMODAL TERMINAL
PA G E 5 8

MIAMI INTERMODAL TERMINAL
D O W N T O W N M I A M I I N T E R M O D A L T E R M I N A L F E A S I B I L I T Y S T U D Y
MIAMI INTERMODAL TERMINAL
PA G E 5 9

MIAMI INTERMODAL TERMINAL
D O W N T O W N M I A M I I N T E R M O D A L T E R M I N A L F E A S I B I L I T Y S T U D Y
MIAMI INTERMODAL TERMINAL
THIS PAGE INTENTIONALLY LEFT BLANK
PA G E 6 0

MIAMI INTERMODAL TERMINAL
D O W N T O W N M I A M I I N T E R M O D A L T E R M I N A L F E A S I B I L I T Y S T U D Y
MIAMI INTERMODAL TERMINAL
PA G E 6 1
Alternative Scheme #7For the initial concept development to address the new Terminal Garage scheme in line with the AAF proposal (improvement of Alternative #6), it was necessary to create a more efficient layout for the bus layout and circulation on the ground floor. This is depicted in the first of the following 3 diagrams. • This scheme achieved 20 bus stop positions in
a dual directional circulation pattern• 4 of these positions were allocated for 60’
articulated buses• It was also organized around a central
pedestrian spine-collector walkway that tied into the existing semi-covered walkway on the west side of the Government Center
The scheme was then further expanded to consider the potential layout for the entire portion
of the open property west of the Government Center, and identify where the possible relocation of the Daycare Center could be accommodated. The second of the following 2 diagrams shows the context for this entire block, and utilized a ‘multi-use’ type building arrangement for the SW corner that could be programmed for the Daycare, other governmental and/or transit customer supporting retail uses. Additionally it preserved the ‘front door’ fountain plaza at 2nd Street, and allowed for the location of a new surface parking lot near the corner building that could accommodate Commissioner parking, provide parking for the Daycare center, and illustrated how the entire block could function safely and efficiently with ample pedestrian circulation separated from the perimeter vehicular circulation needs.
1. Provide additional bus bays for: 16 standard buses 4 articulated buses 1 shuttle bus
2. Provide for: 7,775 sf for Daycare 7,500 sf for MDT office space
3. Separate Daycare from terminal4. Improve pedestrian circulation5. Provide Bike Plaza

MIAMI INTERMODAL TERMINAL
D O W N T O W N M I A M I I N T E R M O D A L T E R M I N A L F E A S I B I L I T Y S T U D Y
MIAMI INTERMODAL TERMINAL
PAG E 6 2
This scheme had a few drawbacks when vetted with the MPO and MDT, and these include:• The multi-use (mixed uses) building does not
really present a completely secure operational environment for the Daycare center; and no outdoor playground areas were possible for secure operation
• The bus circulation at the east end of the terminal garage was too tight;
• There was not sufficient room under the terminal garage structure to include the programmatically required MDT building service areas;
• No provisions for bike parking and/or services were included;
• The new surface parking lot was a ‘dead-end’ configuration which did not allow for ‘drop-off’ circulation at the Daycare center; and,
• MDT requested at least 2 more 60’ articulated bus stop positions.
After further review and refinement in consultation with MDT to accomplish their final requests, and working towards a Final Concept Alternative, this Scheme #7 was developed to add 7 bus bays in front of the Government Center Building (NW 1st Street) for layover use, and the approach for a fully independent and separate Daycare Center was refined.
Other options were identified that could be explored during the Final Concept Alternative and include:• Use (reconfiguration) of the existing MDT
Flagler terminal; • Use of lot east of the Miami Library & Historical Museum to expand capacity for future MDT needs;
• Potential use of both lots referred to above for the construction of a MDT Transit Oriented Development (TOD); project to support the service needs of the facility and surrounding area users.

MIAMI INTERMODAL TERMINAL
D O W N T O W N M I A M I I N T E R M O D A L T E R M I N A L F E A S I B I L I T Y S T U D Y
MIAMI INTERMODAL TERMINAL
PAG E 6 3
DOWNTOWN MIAMI INTERMODAL TERMINAL - SCHEME 7

MIAMI INTERMODAL TERMINAL
D O W N T O W N M I A M I I N T E R M O D A L T E R M I N A L F E A S I B I L I T Y S T U D Y
MIAMI INTERMODAL TERMINAL
PA G E 6 4
DOWNTOWN MIAMI INTERMODAL TERMINAL - SCHEME 7

MIAMI INTERMODAL TERMINAL
D O W N T O W N M I A M I I N T E R M O D A L T E R M I N A L F E A S I B I L I T Y S T U D Y
MIAMI INTERMODAL TERMINAL
Following the process described in the Site Development Concept Alternatives section the study proceeded towards the development of a series of ‘final’ alternatives to address the issues that had resulted from the All Aboard Florida (AAF) proposals by FECI. This modified approach to completing the project was managed by the MPO allowing the Final Concept to evolve into a solution that best met the needs of MDT for its’ short and long-term transit needs. Additionally this change in direction was made to facilitate the on-going negotiations between the County and FECI that would permit the ‘Terminal Garage’ option to be jointly developed, serving MDT’s needs and the desired public parking facility FECI had proposed for their AAF Miami Station.
The depicted original FECI proposal for the Terminal Garage, which was the basic starting point of our development of Final Site Development Concept Scheme, unfortunately did not meet the MDT long-term bus stop and layover needs, but had other positive conceptual ideas incorporated into this scheme: • Effectively illustrated how the public garage
could be constructed above the MDT terminal while preserving the existing loading and service area to the Government Center
• Incorporation of some ground floor building areas to accommodate the MDT customer and service needs
• A design that would allow direct ground floor and upper level direct (bridge) access to the existing Metrorail/Metromover Government Center station
Following the critical evaluation of Scheme 7, it was evident that a good basis to develop schemes further was now defined, but that all of these issues needed to be addressed. So the process proceeded with several iterations of a new Scheme. This plan is provided on the following page, and was specifically detailed to resolve the short-comings of Scheme 7. To accommodate the changes, Scheme 8 incorporated the following design modifications:• The circulation area allocation at the east end of the terminal garage was expanded
• The bus stop positions were reduced due to this shift to 20 positions, but now four (4) larger 60’ articulated bus size positions were included (2 in each route approach direction)
• Building area modules under the terminal garage structure were allocated for the programmatically required MDT building service areas
• The Daycare center was redesigned and provided its’ own assigned parcel; additionally the outdoor playground areas were accommodated and were able to be secured
• The new surface parking area was enlarged, and reconfigured to allow ‘loop’ circulation, including a designated ‘drop-off’ lane
• A new ‘Bike Plaza’ was incorporated, and adjacent building area was identified for potential use as a bike service facility for commuters that could provide showers, lockers, bike storage and vendor supported bike servicing; large outdoor bike racks were also facilitated by this design
PA G E 6 5
Final Site Development Concept

MIAMI INTERMODAL TERMINAL
D O W N T O W N M I A M I I N T E R M O D A L T E R M I N A L F E A S I B I L I T Y S T U D Y
MIAMI INTERMODAL TERMINAL
SCALE:
DOWNTOWN MIAMI INTERMODAL TERMINAL - SCHEME 5 1"=80'
N
07.12.2013
16 STD BUS4 ARTICULATED BUS1 COMM. SHUTTLE7775 S.F. DAYCARE7500 S.F. METRO SVC4 EXD. STAIRS & ELEVATORS
PA G E 6 6SCALE:
DOWNTOWN MIAMI INTERMODAL TERMINAL - SCHEME 5 1"=80'
N
07.12.2013
16 STD BUS4 ARTICULATED BUS1 COMM. SHUTTLE7775 S.F. DAYCARE7500 S.F. METRO SVC4 EXD. STAIRS & ELEVATORS
DOWNTOWN MIAMI INTERMODAL TERMINAL - SCHEME 8

MIAMI INTERMODAL TERMINAL
D O W N T O W N M I A M I I N T E R M O D A L T E R M I N A L F E A S I B I L I T Y S T U D Y
MIAMI INTERMODAL TERMINAL
Throughout July, August and September (2013), work continued through several refinements of this Final Scheme, to address new and focused operational issues with the Concept. It was also decided in consultation with MDT, now proceeding with joint but independent FECI meetings, that perhaps a larger program for bus accommodations would be necessary than the original 20 position program. The design team agreed to extend some consideration of a larger ‘transit block’ context, and develop some alternatives that could accommodate perhaps 25-30 passenger positions.
With the larger context now including the existing MDT Flagler Terminal lot, and then examining an ‘optional’ block on the east side of the M-D Cultural Center, it was possible to develop concepts that approach the larger bus service capacity requested. It was also important to look at the very lengthy pedestrain circulation pattern that would be required to ‘unify’ this approach. This is where the reintegration of the NW 1st Street Pedestrian-Transit Mall proved to be of new value. Additionally MDT was looking to resolve ‘layover’ problems for their bus fleet operating in the general terminal area, needing a place for their ‘resting’ position of sometimes 10-15 minutes where they would not interfere with more intense and tightly scheduled passenger services. From this point the design team commenced with a conceptual refinement process of alternatives development and evaluations with MPO and MDT towards an acceptable Final Site Development Concept.
With this final ‘refinement’ task underway the last set of alternatives was prepared to present a set of ‘options’ that could be phased in sequence with the new Terminal Garage. This sequence of designs sought to not only increase operational capacity, but lay the groundwork for a full transit block linking the old MDT Flagler Terminal all the way through to the new FECI jointly developed Terminal Garage. Referring to the Scheme 8 sequence of plans presented on the following 3 pages, it is easy to identify the key design differences (options) illustrated in each.
Scheme 8 – This plan shows the full transit block with both ‘optional’ NW 1st Avenue transit blocks on the east. • The Terminal Garage follows the same concept
design as the previous Scheme, but provides greater detail of the building facilities possible
under the Garage footprint, including the expanded Bike Plaza. 20 bus positions are still provided, but now 7 are able to accommodate a 60’ articulated bus size.
• The Daycare Center portion is clearly detailed, and the idea of an ‘Art Wall’ has been incorporated to provide privacy and security for the playgrounds, but also afford a link to the Cultural Center, for community art installations, and serve as an entry icon at the base of the existing pedestrian access bridge across NW 1st Street.– The parking area associated with the Daycare
would be redesigned to accommodate the relocated ADA spots from the existing Cultural Center East block.
• The reconfiguration on NW 1st Street for enhanced pedestrian use by widening of the walkways would be accomodated by a narrow ‘Transit & Emergency vehicle Only’ street cross-section; 6 optional layover or passenger service positions along it are included, with an indication of possible covering / shelter structure above. This street would also be resurfaced to a more decorative and pedestrian-scale appropriate paving treatment(s).
• The reconfigured Flagler Terminal Lot would incorporate the use of SW 1st Court into the bus block, and permit the entire passenger loading area to be covered. It includes 8 service positions, with 1 available for a 60’ articulated bus. – Additionally approximately 1,100 square
feet of new MDT service buildings could be accommodated to provide limited driver and passenger needs since it so remote from the new, main Terminal Garage.
– This block would be linked for pedestrians with new enhanced crosswalks at Flagler and NW 1st Street, in the same alignment as the current ‘under-metrorail’ concourse.
• The new Cultural Center East optional lot would suppliant the existing County operated ADA lot, and the existing sculpture plaza to facilitate 6 new passenger loading positions, with 1 available for a 60’ artculated bus. It would also need to maintain the existing service drive access to the Cultural Center, which is why the lot has a reduced yield as compared to the reconfigured Flagler lot. – The alignment of this block’s bus circulation
would link directly to the Flagler lot for continuous cross-block circulation needs.
PA G E 6 7

MIAMI INTERMODAL TERMINAL
D O W N T O W N M I A M I I N T E R M O D A L T E R M I N A L F E A S I B I L I T Y S T U D Y
MIAMI INTERMODAL TERMINAL
– No new MDT service buildings would be accommodated on this lot, assuming this lot would work in unison with the reconfigured Flagler lot.
– This block would be linked for pedestrians as well with new enhanced crosswalks at Flagler and NW 1st Street, in the same alignment as the current ‘under-metrorail’ concourse.
– The area along NW 1st Avenue could accommodate ‘Kiss & Ride’ and/or taxi-jitney service positions.
Scheme 8A – This plan is essentially a modification of Scheme 8, but with the new Cultural Center East optional lot eliminated.• The reconfigured Flagler Terminal Lot would also be modified, recovering the SW 1st Court for taxi and jitney use; this keeps the bus position yield at 8, with 2 able to accommodate a 60’ articulated bus. – The new MDT service building would need
to be reduced to a single facility at now only 600 square feet to provide limited driver and passenger needs.
• It would also be possible to sacrifice one of the southbound lanes on NW 1st Avenue to recover 3 more bus positions if the City and County can mitigate the traffic impacts with other circulation/intersection improvements.
• The reconfiguration on NW 1st Street for enhanced pedestrian use in this scheme eliminates all bus use, and only keeps the through-route open for ‘Transit & Emergency vehicle Only’; This street would also be resurfaced to a more decorative and pedestrian-scale appropriate paving treatment(s), with enhanced green areas to be added along the street frontage of the Government Center.
• The parking at the Daycare would not need to accommodate the relocated ADA spots, so it would be recovered for standard vehicle use, still accommodating a ‘drop-off’ lane at the Daycare entrance.
Scheme 8B – This plan is a ‘hybrid’ of Scheme 8 and 8A. • It keeps the Terminal Garage and the Daycare
block the same as depicted in 8A. • Then it recovers the design for the modified NW
1st Street Pedestrian -Transit Mall to coincide with Scheme 8, yielding 6 layover or alternate passenger positions.
• The new Cultural Center East optional lot is still included as in Scheme 6, but the reconfigured Flagler lot utilizes the layout from 8A
• Overall this Scheme yields the highest bus positions; 43 total (passenger and/or layover, including 13 able to accommodate a 60’ articulated bus size.
PA G E 6 8

MIAMI INTERMODAL TERMINAL
D O W N T O W N M I A M I I N T E R M O D A L T E R M I N A L F E A S I B I L I T Y S T U D Y
MIAMI INTERMODAL TERMINAL
PA G E 6 9
DOWNTOWN MIAMI INTERMODAL TERMINAL - SCHEME 8
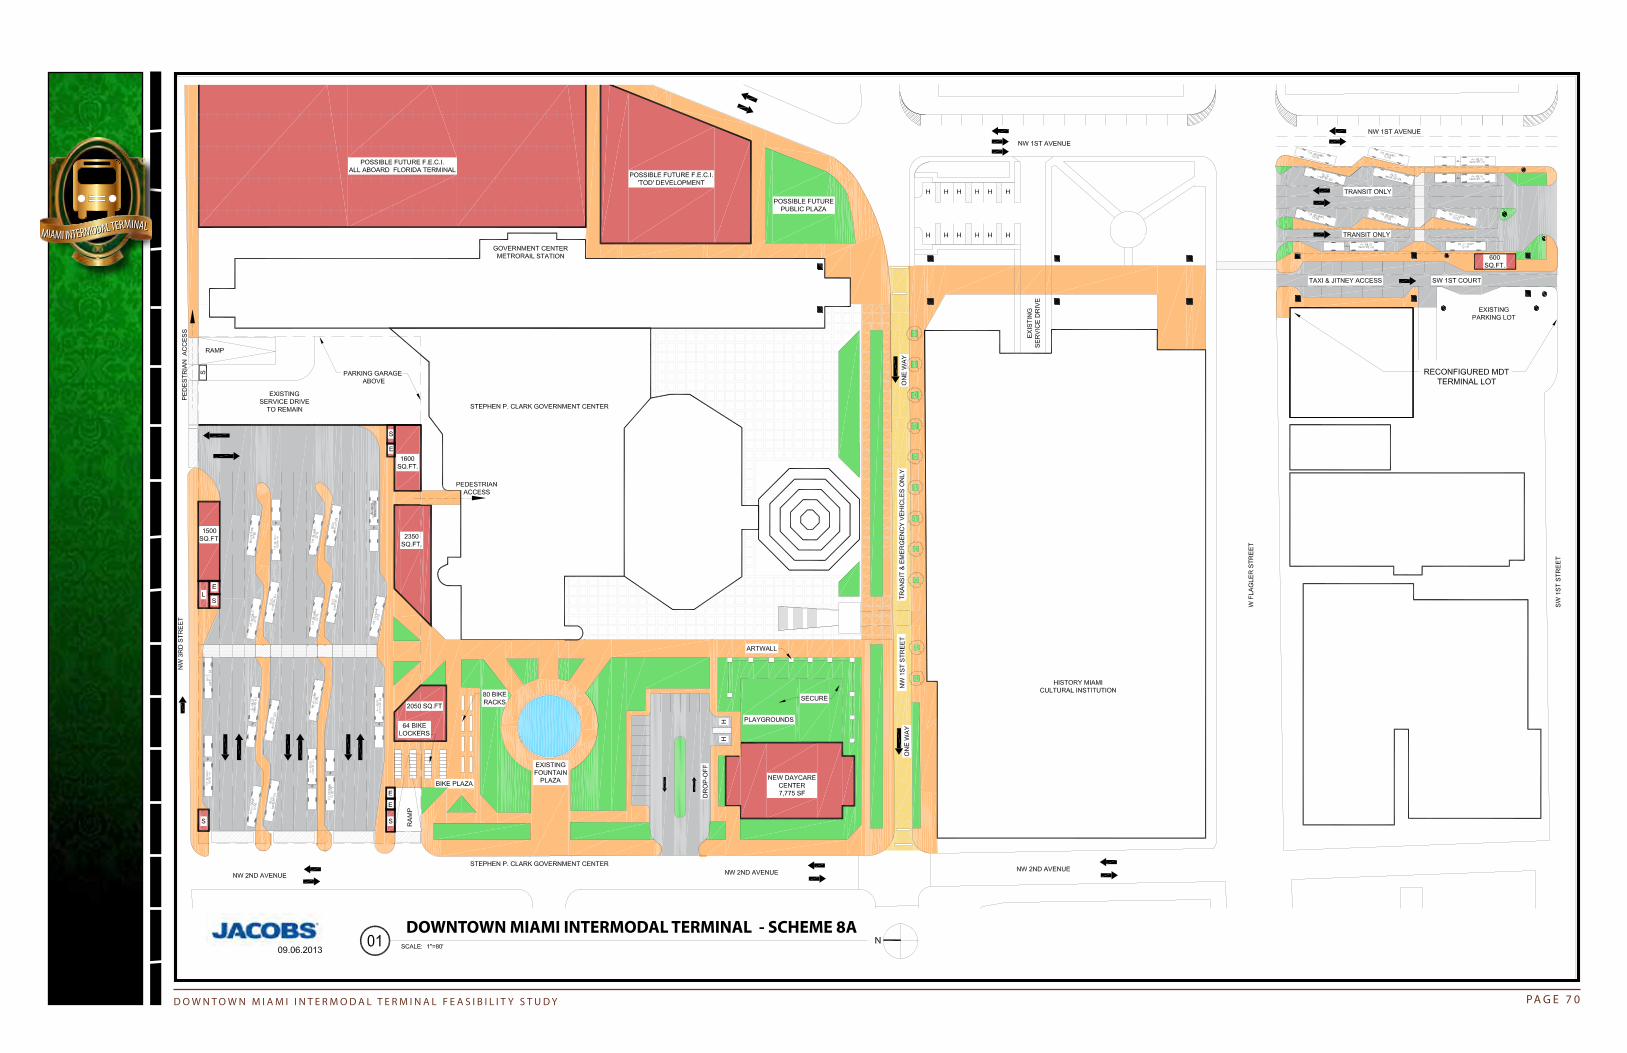
MIAMI INTERMODAL TERMINAL
D O W N T O W N M I A M I I N T E R M O D A L T E R M I N A L F E A S I B I L I T Y S T U D Y
MIAMI INTERMODAL TERMINAL
PA G E 7 0
DOWNTOWN MIAMI INTERMODAL TERMINAL - SCHEME 8A

MIAMI INTERMODAL TERMINAL
D O W N T O W N M I A M I I N T E R M O D A L T E R M I N A L F E A S I B I L I T Y S T U D Y
MIAMI INTERMODAL TERMINAL
PA G E 7 1
DOWNTOWN MIAMI INTERMODAL TERMINAL - SCHEME 8B

MIAMI INTERMODAL TERMINAL
D O W N T O W N M I A M I I N T E R M O D A L T E R M I N A L F E A S I B I L I T Y S T U D Y
MIAMI INTERMODAL TERMINAL
THIS PAGE INTENTIONALLY LEFT BLANK
PAG E 7 2

MIAMI INTERMODAL TERMINAL
D O W N T O W N M I A M I I N T E R M O D A L T E R M I N A L F E A S I B I L I T Y S T U D Y
MIAMI INTERMODAL TERMINAL
PAG E 7 3
Once the Final Site Development Concept was refined and approved by the MPO Project Manager, a primary visualization tool was used to show the proposed development in a 3-D environment. The following technique illustrated the conceptual development of the Intermodal facility based on real pictures of the existing conditions, to show the differences between the existing conditions and the proposed recommendation.
This design works together in a digital format for easy understanding of the project when viewed in context with the Final Schemes 8, 8A & 8B. The ‘just above’ street level view shows the final development of the garage and bus terminal building facades and streetscape with appropriate landscape and hardscape elements as described in the Final Concept outline.
This is a highly stylized image that was prepared to illustrate the potential of the new Terminal Garage and Daycare buildings in a contemporary setting that dignifies the public spaces on the Government Center block. It is possible to envision these
facilities as complimentary to the surrounding architectural context of downtown Miami. For example, considering the almost completed Juvenile Justice Center that lies just north, across 3rd Street from the Terminal Garage site, one can see a clear precedent for a well articulated building ‘skin’ complimenting its’ unique contemporary style. The garage must present an equal value to the civic realm.
The need for cross ventilation affords the perfect opportunity to explore a ‘perforated’ design that meets functional requirements and at the same time enhances its’ surroundings by treating it as an anchor building. The skin could be lightweight, semi-metalic durable finish with a long life and extremely low maintenance requirements. Additionally it could even include planting accommodations to support a vertical green lining. The design should be instantly recognizable as a new downtown icon and enhance perceived value for the intermodal terminal well beyond the usual ‘detractions’ many associate with such facilities.
THE TERMINAL GARAGE SITE IS CLEARLY INCLUDED IN THE LOWER LEFT OF THIS RENDERING OF THE NEW JUVENILE JUSTICE CENTER

MIAMI INTERMODAL TERMINAL
D O W N T O W N M I A M I I N T E R M O D A L T E R M I N A L F E A S I B I L I T Y S T U D Y
MIAMI INTERMODAL TERMINAL
PA G E 7 4
The new Daycare Center building in the foreground likewise is an opportunity to enhance the civic and public realm in its’ design execution. The very nature of the use has an element of play we all naturally associate with. The initial idea of surrounding the playgrounds with an ‘art wall’ could be extended to the building façade itself. This idea could even be expanded to design a dynamic and even possibly an electronically or lighted changing exterior. The building itself could ‘play’ with the public space surrounding it. Additional opportunities for controlling natural lighting into the building without sacrificing privacy could be afforded by such a design approach. There are even roof / skylighting options that could also be explored to bring light into the building core
In summary, the final design approach strives to elevate the possibility that the ultimate architectural styles created, and the contractibility criteria for publicly funded projects do not have to be mutually exclusive objectives. And where a project such as this is benefitting from a new public-private partnership to carry it through to implementation, a single ‘message’ image like the final rendering presented in this report helps keep all parties open to unique solutions.
Proceeding towards the completion of this study and Final Report, final reviews meetings were
conducted with the MPO and MDT to reconfirm the validity of the Final Site Development Concept, especially in light of the on-going FECI negotiations. In late September, the FINAL Scheme was completed and is included as the last page in this section. The result was a plan that took a small step back from the previous Scheme 6 versions. The characteristics and minor modifications include the following::• It keeps the Terminal Garage and the Daycare
block the same as depicted in 8A & 8B. • It recovers the design for the modified NW
1st Street Pedestrian -Transit Mall to coincide with Scheme 6, yielding 7 layover or alternate passenger positions. And depicts the potential extent of covered shelters over the bus parking locations and pedestrian circulation areas directly behind each.
• With the target bus positions of 20 ‘service’ spots and 7 ‘layover’ spots met through the Terminal Garage and NW 1st Street Pedestrian -Transit Mall, the new Cultural Center East optional lot is no longer needed, nor the existing Flagler Terminal lot; these were removed from the plan, and restored to their current configurations.
• Through generalized communications with MDT, it is now possible to consider alternate development plans for some TOD options at the Flagler lot once the new Terminal garage is complete.

MIAMI INTERMODAL TERMINAL
D O W N T O W N M I A M I I N T E R M O D A L T E R M I N A L F E A S I B I L I T Y S T U D Y
MIAMI INTERMODAL TERMINAL
PA G E 7 5
ILLU
STRA
TIVE
REN
DER
ING
OF
THE
INTE
RMO
DAL
TER
MIN
AL A
T TH
E D
OW
NTO
WN
GO
VERN
MEN
T CE
NTE
R

MIAMI INTERMODAL TERMINAL
D O W N T O W N M I A M I I N T E R M O D A L T E R M I N A L F E A S I B I L I T Y S T U D Y
MIAMI INTERMODAL TERMINAL
THIS PAGE INTENTIONALLY LEFT BLANK
PA G E 7 6

MIAMI INTERMODAL TERMINAL
D O W N T O W N M I A M I I N T E R M O D A L T E R M I N A L F E A S I B I L I T Y S T U D Y
MIAMI INTERMODAL TERMINAL
PA G E 7 7

MIAMI INTERMODAL TERMINAL
D O W N T O W N M I A M I I N T E R M O D A L T E R M I N A L F E A S I B I L I T Y S T U D Y
MIAMI INTERMODAL TERMINAL
PA G E 7 8
DOWNTOWN MIAMI INTERMODAL TERMINAL FEASIBILITY STUDY
3D DIAGRAMMATIC AERIAL VIEW - FINAL SCHEME
NW 2ND AVENUE
NW 3RD STREET
NW 1ST STREET

MIAMI INTERMODAL TERMINAL
D O W N T O W N M I A M I I N T E R M O D A L T E R M I N A L F E A S I B I L I T Y S T U D Y
MIAMI INTERMODAL TERMINAL
PA G E 7 9
DOWNTOWN MIAMI INTERMODAL TERMINAL
3D DIAGRAM - FINAL SCHEME
NW 2ND AVENUE
NW 3RD STREET
NW 1ST STREET

MIAMI INTERMODAL TERMINAL
D O W N T O W N M I A M I I N T E R M O D A L T E R M I N A L F E A S I B I L I T Y S T U D Y
MIAMI INTERMODAL TERMINAL
PA G E 8 0
THIS PAGE INTENTIONALLY LEFT BLANK

MIAMI INTERMODAL TERMINAL
D O W N T O W N M I A M I I N T E R M O D A L T E R M I N A L F E A S I B I L I T Y S T U D Y
MIAMI INTERMODAL TERMINAL
Recommendations and Action Plan
PA G E 8 1
At the completion of this study the MPO and MDT sought to develop a set of recommendations and the steps needed for the construction of the proposed intermodal facility and the transit/pedestrian mall along NW 1st Street based on the Final Concept Scheme.
Through the completion of the planning tasks completed in the study, the results present a clear recognition that the programming and planning process Miami-Dade MPO had engaged in was now critical to making the Intermodal Terminal Facility a success, bringing the MPO’s vision to integrate all transportation services onto one unified site a reality. From this study’s perspective, successful design initiatives, regardless of the application, must achieve a ‘balance’ between function and contextual aesthetics. Balance defines the success of a project because a project that is purely functional, yet aesthetically and/or lacking community and market support, actually loses value. The study utilized all necessary professional disciplines to guide the appropriate aspects of the project study, and incorporated this balanced approach into the final design.
Based on the preparation, study and evaluation of all the various “options, preferences and solutions” in the project, it is appropriate to complete the study by answering the ultimate question; “How do we get there?” The following Recommendations
and Action Plan summarizes the requested action items envisioned at the study commencement, which have now been confirmed through the study as the best approach to proceed forward with to the project’s implementation strategies. These are logically based on the final validated intermodal facility concept.
Following the collaborative process utilized during this study, this preferred course of action that has been arrived at should be supported by individual component implementation plans for each of the following categories. These are ‘summary’ or ‘general’ in context, and would be further detailed in typical preliminary and schematic design phases for the new facility once agreements with FECI have been finalized, and responsibility for individual action items can be assigned..• Master program for all new facilities, site development components, as well as ancillary/adjacent related site modifications and renovations
• Transit Modifications• Traffic Impacts Mitigation• Phasing as needed to be addressed in a Project
Schedule• Strategic management decisions (by agency/
party) to support individually the components of full project implementation.

MIAMI INTERMODAL TERMINAL
D O W N T O W N M I A M I I N T E R M O D A L T E R M I N A L F E A S I B I L I T Y S T U D Y
MIAMI INTERMODAL TERMINAL
PAG E 8 2
MASTER PROGRAMThe Final Concept Scheme for the new intermodal terminal that was developed, evaluated and vetted with the MPO, MDT and the SAC, and provides for the following operational characteristics at the new MDT ‘terminal garage’ and the ‘layover’ bays designed into the new NW 1st Street Pedestrian-Transit Mall:
TYPE SERVICE LAYOVER TOTAL
STD 13 1 14
ART 7 6 13
TOTAL 20 7 27
BUS BAYS PROVIDED
STD = 40” - 45” COACHART = 60’ ARTICULATED BUS
The building facilities included in this desired Scheme were aligned with the original Conceptual Approach and Program, and provide the following ground floor development opportunites to support the MDT operations. These are ‘gross square foot’ (GSF) measurements, and exclude the elevators and stairways (spaces) that are operationally necessary for the new terminal garage above:
Miami-Dade MPOFinal Space Program - New Downtown Intermodal Center
Ground Floor Building Facilities
Government Center Side Modules Total 3950 NW 3rd Street Side Module Total 15001.0 Administration
A. South - Small Building Module Total 1600 1.1 Administration Office 250 B. South - Large Building Module Total 2350 1.2 Service Counter 80
1.0 Customer Service Building SF 1.3 Open File / Work Area 1201.1 Vestibule - Main 400 1.4 Storage Room 1501.2 Ticketing Lobby 300 1.5 Shared Workstation 1601.3 Waiting Area 900 Total 7601.4 Visitor's Center / Display Area 150 2.0 Security1.5 Driver / Crew Room 400 2.1 Security Office 2001.6 Community Room 500 2.2 Service Counter 601.7 Storage Room 200 2.3 Equipment Storage Room 801.8 Public Rest Rooms 800 Total 3401.9 Telephones & Other Services 120 3.0 Service - Support
1.10 Mechanical Equipment Room 180 3.1 Janitor / Supply Closet 160Total 3950 3.2 Rest Room - Drivers 240
Total 400Bike Plaza Module Total 2050
1.0 Vendor Administration & Service New Daycare Center Total 77751.1 Administration Office 150 1.0 Single Operator / 2 age groups1.2 Service Counter 200 1.1 Administration & Instructor Offices 5001.3 Open Work Area 350 1.2 Visitor's Reception / Lobby Area 2501.4 Equipment/Supplies Storage Room 150 1.3 Infants / Early Development classrooms 2400
Total 850 1.4 Toddlers / Pre-K classrooms 36002.0 Public Spaces 1.5 Restrooms / Changing 3752.1 Restrooms, Lockers, Showers, Changing (M&F) 850 1.6 Warming Kitchen / Food Svc. Prep 5002.2 Flexible gathering/break space 350 1.7 Equipment/Supplies Storage Room 150
Total 1200 Total 7775
Total Enclosed Building Areas 15275

MIAMI INTERMODAL TERMINAL
D O W N T O W N M I A M I I N T E R M O D A L T E R M I N A L F E A S I B I L I T Y S T U D Y
MIAMI INTERMODAL TERMINAL
PAG E 8 3
TRANSIT MODIFICATIONSThis aerial diagram below illustrates the initial route accommodations that would be assigned to the new Terminal Garage. It also indicates the likely routes that would remain at the existing MDT Flagler Terminal until the future redevelopment plans for a TOD center at that location can be further investigated. Ultimately, MDT’s desire for the relocation of all ‘downtown’ destination routes into the new Terminal Garage at the Government Center can be accommodated through schedule re-timing and flexible bus bay programming. The additional implementation of the layover facilities on NW 1st Street (as described in the following
subsection) will further support this transition into a single facility, and allow for possible future expansion if necessary.
All of these Transit Modifications should be supported by an advanced system of electronic public information boards in the garage terminal and at strategic out-lying transit block locations. The design, engineering and implementation of this system will need to be programmed by MDT towards operational commencement with the opening of the new terminal garage.

MIAMI INTERMODAL TERMINAL
D O W N T O W N M I A M I I N T E R M O D A L T E R M I N A L F E A S I B I L I T Y S T U D Y
MIAMI INTERMODAL TERMINAL
PA G E 8 4
TRAFFIC IMPAC TS MITIGATIONWith the planned transition of NW 1st Street into a New Pedestrian-Transit Mall, strategic steps and services are necessary to prepare for this operational change. This will include: • Design and engineering of the necessary roadway modifications to re-purpose NW 1st Street from NW 1st Avenue to NW 2nd Avenue as a One-way, westbound only route for the exclusive use of Transit and Emergency vehicles.
• Detailed Study, Design and engineering of new Traffic control devices, and possible new signalization for vehicle access and control entering and exiting the limited use street, especially to prohibit access by private vehicles.
• Re-evaluation through a detailed traffic analysis of the potential vehicle impacts on West Flagler Street and NW 3rd Street, and/or other surrounding public ROW’s due to partial street closing of NW 1st Street. Additionally impacts on pedestrian and bicycle circulation facilities by the street closures and the intermodal
facility itself should be included in this detailed analysis.
• Design and engineering of the potential new flexible layover shelters; this will allow for temporary event passenger use, or long-term transition to these bays for permanent passenger use should future MDT system growth demand a quick adaptation.
• Design and engineering of pedestrian scale improvements in the new NW 1st Street Pedestrian-Transit Mall ROW.
• Redesign and engineering of the Government Center public plaza frontage along NW 1st Street to accommodate the new form of, and facilities related to the ‘layover’ bays, including the opportunities to integrate new green space, public ‘comfort-safety-security’ improvements, and most importantly new cross-walk provisions.

MIAMI INTERMODAL TERMINAL
D O W N T O W N M I A M I I N T E R M O D A L T E R M I N A L F E A S I B I L I T Y S T U D Y
MIAMI INTERMODAL TERMINAL
PA G E 8 5
PHASING REQUIREMENTSKey to the success of what really is a new ‘intermodal transit block’ surrounding the Government Center, will be early and continued coordination with FECI on their new ‘All Aboard Florida’ Miami Terminal development schedule. To envision the planning and development of the MDT facilities and the associated other improvements necessary in the transit block the following key timing thresholds are recommended:• The First phase must focus on the design and
engineering to plan for relocation of, and construction of the new Daycare Center
• The New surface parking area to serve the Daycare Center must be included in the first phase, but can serve as a construction staging area during the first phase
• The new terminal garage for MDT (and the ground floor building facilities) would be designed and engineered under an integrated plan for the FECI terminal service garage to be constructed above it
• Associated improvements necessary on NW 2nd Avenue and NW 3rd Street would also need to be designed and engineered under an integrated plan with FECI terminal service garage; while the timeframe for these improvements may be shorter than the garage itself, their schedule should be coordinated to reach a simultaneous completion, while not impending the construction access required for the garage
• The last phase would include the design and engineering of the necessary roadway modifications to re-purpose NW 1st Street from NW 1st Avenue to NW 2nd Avenue as a One-way, westbound only route for the exclusive use of Transit and Emergency vehicles, as described in the Traffic Impacts Mitigation section above.
STRATEGIC MANAGEMENT DECISIONSTo help identify the general responsibilities and decision points that must be considered by the involved agencies and parties for this new intermodal transit facility at the M-D Government Center, the following outline identifies some strategic steps that would be recommended to proceed. These are organized by general priority, but many are likely to be conducted simultaneously. The next phase of this project could in-fact evolve towards a Public-Private
Partnership with FECI and would have its’ own criteria for proceeding, which were not a study component of this project. That process could also result in ‘re-ordering’ of the step priorities, with the focus on an accelerated timeline to facilitate a Design-Build proposal, allowing the project to proceed simultaneously with the development schedule that FECI has planned for their new All Aboard Florida Miami terminal.• The First step must proceed with the completion
of development and operational agreements with FECI, clarifying the planned development strategy for the project.
• From the cursory information provided through this study, it appears Miami-Dade County and FECI leadership are actively proceeding now simultaneously with the conclusion of this study.
• Initial proposals would seem to confirm the minimum criteria for development to be included in the future formalized agreement that was provided by the MDT representatives; this chart has been provided at the end of this sub-section for current reference.
• The existing Daycare Center service operator/vendor must be included in early coordination efforts to insure the relocation program for that facility is well organized, and the proposed facility program is validated.
• MDC Facilities Management division should be included to plan for the management of, and lead the strategic planning of the necessary Government Center modifications necessary to support the new terminal, and the related site improvements such as the Daycare Center and the future Bike Service Center.
• MDT has obviously been completely integrated into this study, and the leadership negotiations currently underway with FECI, but their planning efforts will also need to focus on temporary route impacts that could occur during construction, as well as the future route realignments once the facilities are operational. Additionally short-term and long-term capitol budget impacts needs to be evaluated where there could be system expenditures for improvements that are not going to be included in the FECI agreement .
• MDC Traffic Management division should be coordinating on the future roadway modifications required for the terminal, as well as the temporary construction phase circulation accommodations that will be necessary.

MIAMI INTERMODAL TERMINAL
D O W N T O W N M I A M I I N T E R M O D A L T E R M I N A L F E A S I B I L I T Y S T U D Y
MIAMI INTERMODAL TERMINAL
PA G E 8 6
• MDC Publis Works should be actively engaged to begin planning for the necessary utilities infrastructure modifications that may be necessary.
• Miami Parking Authority, the likely operator of the new terminal garage, needs to begin planning for its’ future operational needs, as well as the construction phase access accommodations that could impact public parking operations and revenue.
• Coordination with the MD Cultural Affairs division maybe necessary to plan for construction phase impacts to the Museum and Public Library, and future transit impacts once the NW 1st Street Pedestrian-Transit Mall is implemented.
• The DDA should be engaged to coordinate the potential preparation of master plan for the ‘Downtown Central Station Village’. This approach could help ensure that the surrounding land uses and roadway/transportation network support the new terminal.
DOWNTOWN MIAMI BUS TERMINALAugust 26, 2013 - Provided by MDT
SERVICE LAYOVER TOTAL
Bus Bays(40’ Standard and 45’ Coach)
12 1 13
Bus Bays(60’ Articulated)
8 6 14
Total 20 7 27
BUS BAYS REQUIREMENTS
• Require a total of 27 Bus Bays (13 that accommodate Commuter Coach Buses and 14 that accommodate Articulated Buses)
• Absolute minimum of 20 Bus Bays (12 coach bays and 8 articulated bays) must be accommodated in the terminal
CUSTOMER SERVICE• Passenger Waiting Area with covered Seating/Benches
• Ticket Vending Machine/Kiosk Area• Display for Real-Time Bus Tracking• Video/Audio Displays• Visitor Center/Display Area• Self-Maintaining Public Restrooms• Public Telephones• Fully integrate the bus terminal with Government
Center, Metrorail, Metromover, and all future transportation modes including the planned All Aboard Florida terminal, the All Aboard future Beach Corridor Station (Bay Link), consistent with the present MPO Beach Corridor Study results.
SECURITY• Security Office• Service Counter• Equipment Storage Room• Cameras for monitoring Bus Terminal
SERVICE SUPPORT• Driver/Crew Room and Self-Maintaining
Restroom• Janitor/Supply Closet• Bus Supervisor Booth• Staff Parking - 8 spaces (can be accommodated
within garage)
SITE• Bicycle Parking• Bicycle commuter station• Unified Signage System• Kiss-and-Ride Area• Convert existing NW 1st Street bus drop-off area
to accommodate 7 saw-tooth bays.• Separate Taxi and Jitney Areas• Landscaping• Green areas need to be considered, including
a ‘green roof’ for the transit terminal garage to comply with the County’s GreenPrint policy
• Lighting• Apply Crime Prevention through Environmental
Design Principles
SUMMARY AND CLOSINGThe Final Recommendations & Action Plan are the culmination of the significant work undertaken throughout the planned, and then extended/alternate schedule that evolved under this Task Work Order project. This Final Report is intended to document the entire process; data collected and studied, feedback received, alternatives explored, evaluations completed, all ultimately leading to the completed and preferred Final site development scenario. This final section of the report was focused on presenting the results of the process, with final recommendations that clearly and succinctly define the path towards the ultimate development plan. The outline presented for the process going forward into the next stages of design and construction were intended for general consideration. While they may not include all the detailed strategies and steps that could and should be evaluated by the MPO and the other County agencies that will undertake the unified planning and development process to follow in partnership with FECI, the important ‘comprehensive’ steps have been provided to help guide the process utilizing this study as a benchmark planning guide.

MIAMI INTERMODAL TERMINAL
D O W N T O W N M I A M I I N T E R M O D A L T E R M I N A L F E A S I B I L I T Y S T U D Y
MIAMI INTERMODAL TERMINAL
Appendix
PA G E 8 7
EXECUTIVE SUMMARY BY C.H. PEREZ AND ASSOCIATES
STUDY ADVISORY COMMITTEE .................................................................................................... Pg. 89
PROJECT MEETINGS AND HISTORY OF EVENTS ................................................................. Pg. 90
DATA GATHERING AND ANALYSIS SUMMARY ..................................................................... Pg. 91
LITERATURE RESEARCH SUMMARY ............................................................................................ Pg. 93St Louis Gateway Transportation Center ........................................................................................................ Pg. 95
St Louis County Shaw Park Avenue Transit Center/Garage .................................................................... Pg. 97
Oklahoma City Transportation HUB/TOD Master Plan ............................................................................. Pg. 99
Downtown Denton Transit Center and TOD ................................................................................................. Pg. 101
Metro Intermodal Terminal Assessment ........................................................................................................ Pg. 103
Greenville Intermodal Transportation Center Feasibility Study ............................................................ Pg. 120
SITE SELECTION CRITERIA TABLE ................................................................................................. Pg. 163
SITE SELECTION CRITERIA “DESIRABILITY” SCORES .......................................................... Pg. 170
SITE SELECTION ANALYSIS MAPS ................................................................................................ Pg. 172
SAMPLE “ALL ABOARD FLORIDA” PUBLISHED ARTICLES:Miami Herald - All Aboard Florida seeks downtown Miami property for train hub ....................... Pg. 195
Orlando Sentinel - Orlando to Miami train needs just one more deal before it can roll .............. Pg. 197
Orlando Sentinel - Orlando to Miami train could generate $145 million ......................................... Pg. 199
SunSentinel - Fast rail on track .......................................................................................................................... Pg. 200
Miami Today - Rail economic stimulus on fast track to chug into downtown ................................. Pg. 201
South Florida Business Journal - FEC’s review of rail station sites signals opportunities ............ Pg. 202
DOWNTOWN INTERMODAL QUALITATIVE TIA ..................................................................... Pg. 203
MIAMI INTERMODAL TERMINAL
D O W N T O W N M I A M I I N T E R M O D A L T E R M I N A L F E A S I B I L I T Y S T U D Y
MIAMI INTERMODAL TERMINAL
THIS PAGE INTENTIONALLY LEFT BLANK
PA G E 8 8

D O W N T O W N M I A M I I N T E R M O D A L T E R M I N A L F E A S I B I L I T Y S T U D Y PA G E 8 9
STUDY ADVISORY COMMIT TEE
# Name Dept. E-Mail Address Phone #
1 Jesus Guerra - PM MPO [email protected] 111 NW 1st Street, Suite 920 Miami, FL 33128 (305) 375-2069
2 Lilia Medina City of Miami [email protected] 444 SW 2nd Avenue
Miami, FL 33133 (305) 416-1080
3 Thomas Rodrigues City of Miami [email protected] 3500 Pan American Drive
Miami, FL 33133 (305) 416-1080
4 Sarah Ingle DDA [email protected] 200 S Biscayne Boulevard, Suite 229 Miami, FL 33131 (305) 579-6675
5 Kevin Little FEC [email protected] 6875 NW 58th Street, Miami, FL 33166 (305) 970-8169
6 Ed Carson FDOT [email protected] 1000 NW 111th Ave, Room 6114 Miami, FL 33172 (305) 470-5255
7 Chris Dube FDOT [email protected] 1000 NW 111th Avenue, Miami, FL 33172 (305) 470-5295
8 Nilia Cartaya MDT [email protected] 701 NW 1st Court, Miami, FL 33136 (786) 469-5283
9 Monica Cejas MDT [email protected] 701 NW 1st Court, Suite 1500 Miami, FL 33136 (786) 469-5290
10 Eva Kunath MDT [email protected] 701 NW 1st Court, Suite 1500 Miami, FL 33136 (786) 469-5554
11 Isabel Padron MDT [email protected] 701 NW 1st Court, Suite 1500 Miami, FL 33136 (786) 469-5260
12 Bob Pearsall MDT [email protected] 701 NW 1st Court, Suite 1200 Miami, FL 33136 (786) 469-5163
13 Alfred Lurigados MDX [email protected] 3790 NW 21st Street Miami, FL (305) 637-3277
14 Rolando Jimenez PW&WM [email protected] 111 NW 1st Street, Suite 1510 Miami, FL 33128 (305) 375-5681
15 Leo Oña PW&WM [email protected] 111 NW 1st Street, Suite 1510 Miami, FL 33128 (305) 375-1909
16 Napoleon Somoza RER [email protected] 111 NW 1st Street Miami, FL 33128 (305) 375-2835

D O W N T O W N M I A M I I N T E R M O D A L T E R M I N A L F E A S I B I L I T Y S T U D Y PA G E 9 0
PROJEC T MEE TINGS AND HISTORY OF E VENTS L ISTS
DATE EVENTS
October 2013 Delivery of Final Report and Final SAC Presentation
September 24, 2013 Final Concept Scheme review with MPO and MDT Project Managers
September 6, 2013 Delivery of Final Development Concept
August 2013 Development of additional/optional site concepts for existing Flagler lot
July 24, 2013 Project PM Review Meeting - Final input for extended “Transit Block” scheme to include existing Flagler lot redevelopment to increase capacity
May 30, 2013 Project PM Review Meeting – Discuss final concept strategy and TWO report completion plan
February 15, 2013 Project PM Review Meeting – Follow up to SAC to discuss FEC/All Aboard Florida impacts & strategy discussion for project completion
January 9, 2013 SAC Presentation – Alternatives with FEC/All Aboard Florida impacts
October 18, 2012 Project Review meeting – With MDT and PM – Bus terminal needs and alternatives discussion
October 2, 2012 Project PM Review Meeting – Final Architectural Conceptual Approach Review & strategy discussion for project completion
August 23, 2012 Project PM Review Meeting - Architectural Conceptual Alternatives Review and strategy discussion for project progress work
August 17, 2012 Project PM Review Meeting - Architectural Conceptual Alternatives Review and strategy discussion for project progress work
July 11, 2012 PTAC – Project advisory/update
May 4, 2102 ULI – Project presentation / Envisioning South Florida’s Future Mobility – Goods and People
April 18, 2012 Project Update meeting and review – With Flagler Development team for their planned All Aboard Florida downtown Miami station
April 5, 2012 Project PM Review Meeting - Project status review & prep for Flagler/All Aboard Florida coordination meeting
March 15, 2012 Project PM Review Meeting - Project status review & follow up strategy discussion for subsequent study tasks
March 7, 2012 SAC Presentation – Site Alternatives Analysis results
February 15, 2012 Project PM Review Meeting – Site Selection AOC Map Review
November 16, 2011 SAC Presentation – Study overview, purpose and approach; Study area boundary; SAC role and input needed; Site Selection methodology
November 9, 2011 Project PM Review Meeting – Project Status and pre-SAC strategy discussion
October 26, 2011 Project PM Review Meeting – Site selection criteria, plan of action for 1st SAC
August 11, 2011 NTP for TWO #19 (GPC IV-19) – Study commencement

MIAMI INTERMODAL TERMINAL
D O W N T O W N M I A M I I N T E R M O D A L T E R M I N A L F E A S I B I L I T Y S T U D Y
MIAMI INTERMODAL TERMINAL
PA G E 9 1

MIAMI INTERMODAL TERMINAL
D O W N T O W N M I A M I I N T E R M O D A L T E R M I N A L F E A S I B I L I T Y S T U D Y
MIAMI INTERMODAL TERMINAL
PAG E 9 2

MIAMI INTERMODAL TERMINAL
D O W N T O W N M I A M I I N T E R M O D A L T E R M I N A L F E A S I B I L I T Y S T U D Y
MIAMI INTERMODAL TERMINAL
LITERATURE RESEARCH REFERENCE PROJEC TS STUDIES AND SUMMARY OF F INDINGSThrough 2-22-2012
PAG E 9 3

MIAMI INTERMODAL TERMINAL
D O W N T O W N M I A M I I N T E R M O D A L T E R M I N A L F E A S I B I L I T Y S T U D Y
MIAMI INTERMODAL TERMINAL
THIS PAGE INTENTIONALLY LEFT BLANK
PA G E 9 4

D O W N T O W N M I A M I I N T E R M O D A L T E R M I N A L F E A S I B I L I T Y S T U D Y PA G E 9 5
50 51
ST. LOUIS G ATEWAY TRANSPORTATION CENTERST. LOUIS, MISSOURI
The Gateway Transportation Center is the City’s state-of-the-art multimodal transportation hub providing a clean,
safe, and friendly transportation center with 24-hour operations staff and security year-round.
CLIENT:City of St. Louis
SERVICES:Full Architectural / Engineering Services
SCOPE OF WORk:New Transit Facility & Parking Structure
DESIGN FEES:$600,000
CONSTRUCTION COST:$7.4M
COMPLETION DATE:2008
REFERENCE:
Tom Behan, Chief EngineerConstruction, City of St. Louis, MO
314.589.6608
The St. Louis Gateway Transportation Center is an intermodal hub for local residents and visitors to the city. It provides for
inter-city trips involving rail (Amtrak and future high-speed rail to Chicago), bus (Greyhound), and air (airline ticketing and
direct connections to Lambert-St. Louis International Airport via MetroLink light rail transit). The center also provides for intra-
city trips on MetroLink, MetroBus (via transfer improvements at the civic center station), and by auto (car rental).
As the prime consultant, Jacobs provided project management and had overall responsibility for initial concept planning,
environmental studies and documentation, and preliminary and final civil, site, and structural design through its project team of architects, engineers, and financial planning firms. In addition to the Center, the project involved the design of
roadways, a highway bridge, cast-in-place and mechanically stabilized earth retaining walls, traffic signalization and
synchronization, train platforms, railroad track and turnouts, and related train facilities.
REPRESENTATIVE PROJECTS: Transit Facilities

D O W N T O W N M I A M I I N T E R M O D A L T E R M I N A L F E A S I B I L I T Y S T U D Y PA G E 9 650 51
ST. LOUIS G ATEWAY TRANSPORTATION CENTERST. LOUIS, MISSOURI
The Gateway Transportation Center is the City’s state-of-the-art multimodal transportation hub providing a clean,
safe, and friendly transportation center with 24-hour operations staff and security year-round.
CLIENT:City of St. Louis
SERVICES:Full Architectural / Engineering Services
SCOPE OF WORk:New Transit Facility & Parking Structure
DESIGN FEES:$600,000
CONSTRUCTION COST:$7.4M
COMPLETION DATE:2008
REFERENCE:
Tom Behan, Chief EngineerConstruction, City of St. Louis, MO
314.589.6608
The St. Louis Gateway Transportation Center is an intermodal hub for local residents and visitors to the city. It provides for
inter-city trips involving rail (Amtrak and future high-speed rail to Chicago), bus (Greyhound), and air (airline ticketing and
direct connections to Lambert-St. Louis International Airport via MetroLink light rail transit). The center also provides for intra-
city trips on MetroLink, MetroBus (via transfer improvements at the civic center station), and by auto (car rental).
As the prime consultant, Jacobs provided project management and had overall responsibility for initial concept planning,
environmental studies and documentation, and preliminary and final civil, site, and structural design through its project team of architects, engineers, and financial planning firms. In addition to the Center, the project involved the design of
roadways, a highway bridge, cast-in-place and mechanically stabilized earth retaining walls, traffic signalization and
synchronization, train platforms, railroad track and turnouts, and related train facilities.
REPRESENTATIVE PROJECTS: Transit Facilities

D O W N T O W N M I A M I I N T E R M O D A L T E R M I N A L F E A S I B I L I T Y S T U D Y PA G E 9 748 49
ST. LOUIS COUNT y ShAW PARk AVENUE TRANSIT CENTER / G ARAGECLAY TON, MISSOURI
The structure forms a gateway into Clayton and is a dynamic facility linking different modes of transportation.
CLIENT:St. Louis County
SERVICES:Full Architectural / Engineering Services
SCOPE OF WORk:New Ground-Up Facility
DESIGN FEES:$1.4M
CONSTRUCTION COST:$15M
COMPLETION DATE:2003
REFERENCE:
Jerry Wild, County Design Project Manager St. Louis County ph 314.651.2567
Jacobs provided A/E services for the 1,200-car parking facility and transit center. The garage is located above the
transit center. The Clayton MetroBus Transfer Center has an efficient center island for right-hand passenger drop off and is connected to MetroLink via a pedestrian bridge and
corridor. The facility is sited on the southern edge of Clayton’s central business district and is highly visible from surrounding
residential neighborhoods, adjacent commercial office buildings, and vehicular traffic on nearby main arteries. The
aesthetic approach is one that is progressive, innovative, and “cutting edge” but responds using materials common
to adjacent buildings. The structure forms a gateway into Clayton and is a dynamic facility linking different modes
of transportation. Durability is provided by maintaining a minimum slope of 0.25 inch per foot, drains that are self-
cleaning and clog-resistant, and enhanced concrete systems using silica fume. The structure is reinforced using epoxy
coated reinforcing and fully encapsulated post tensioning. Security is provided by maximizing lighting, open site lines,
glass-backed elevators and glass-enclosed stair towers, and emergency call stations at each egress point on each level.
REPRESENTATIVE PROJECTS: Transit Facilities

D O W N T O W N M I A M I I N T E R M O D A L T E R M I N A L F E A S I B I L I T Y S T U D Y PA G E 9 848 49
ST. LOUIS COUNT y ShAW PARk AVENUE TRANSIT CENTER / G ARAGECLAY TON, MISSOURI
The structure forms a gateway into Clayton and is a dynamic facility linking different modes of transportation.
CLIENT:St. Louis County
SERVICES:Full Architectural / Engineering Services
SCOPE OF WORk:New Ground-Up Facility
DESIGN FEES:$1.4M
CONSTRUCTION COST:$15M
COMPLETION DATE:2003
REFERENCE:
Jerry Wild, County Design Project Manager St. Louis County ph 314.651.2567
Jacobs provided A/E services for the 1,200-car parking facility and transit center. The garage is located above the
transit center. The Clayton MetroBus Transfer Center has an efficient center island for right-hand passenger drop off and is connected to MetroLink via a pedestrian bridge and
corridor. The facility is sited on the southern edge of Clayton’s central business district and is highly visible from surrounding
residential neighborhoods, adjacent commercial office buildings, and vehicular traffic on nearby main arteries. The
aesthetic approach is one that is progressive, innovative, and “cutting edge” but responds using materials common
to adjacent buildings. The structure forms a gateway into Clayton and is a dynamic facility linking different modes
of transportation. Durability is provided by maintaining a minimum slope of 0.25 inch per foot, drains that are self-
cleaning and clog-resistant, and enhanced concrete systems using silica fume. The structure is reinforced using epoxy
coated reinforcing and fully encapsulated post tensioning. Security is provided by maximizing lighting, open site lines,
glass-backed elevators and glass-enclosed stair towers, and emergency call stations at each egress point on each level.
REPRESENTATIVE PROJECTS: Transit Facilities

D O W N T O W N M I A M I I N T E R M O D A L T E R M I N A L F E A S I B I L I T Y S T U D Y PA G E 9 9
22 23
OkLAhOMA CIT y TRANSPORTATION hUB / TOD MASTER PLAN OkLAhOMA CIT Y, OkLAhOMA
The vision is to create a plan for a new transportation center and gateway for Oklahoma City and the surrounding
region that promotes mobility, enhances the image of public transportation, and creates a catalyst for economic
development.
CLIENT:The Association of Central Oklahoma Governments (ACOG)
SERVICES:Planning, Architecture, and Funding Planning
SCOPE OF WORk:Master Planning and Conceptual Design
DESIGN FEES:$300,000
CONSTRUCTION COST:$121M
COMPLETION DATE:2010
REFERENCE:Doug Rex, Director of Transportation
ACOGph 405.234.2264
The Association of Central Oklahoma Governments (ACOG) is developing a vision, operations and finance plan for a
new multimodal transit hub located in downtown Oklahoma City. The project includes site selection, ridership analysis,
financial planning and concept design of the transit hub and related transit oriented development. Transit modes
serving the project include a streetcar system commuter rail, Amtrak, and commuter rail. Jacobs developed an inclusive
design process involving all transportation providers, elected officials, property owners and the public for input and
consensus building on site selection criteria, site alternatives, economic development and the context and civic presence of the facility. The architectural concept integrates the existing
historic Sante Fe Station with a new transit hall and signature station design creating a new gateway to Oklahoma City.
REPRESENTATIVE PROJECTS: Transit Facilities

D O W N T O W N M I A M I I N T E R M O D A L T E R M I N A L F E A S I B I L I T Y S T U D Y PA G E 1 0 0
22 23
OkLAhOMA CIT y TRANSPORTATION hUB / TOD MASTER PLAN OkLAhOMA CIT Y, OkLAhOMA
The vision is to create a plan for a new transportation center and gateway for Oklahoma City and the surrounding
region that promotes mobility, enhances the image of public transportation, and creates a catalyst for economic
development.
CLIENT:The Association of Central Oklahoma Governments (ACOG)
SERVICES:Planning, Architecture, and Funding Planning
SCOPE OF WORk:Master Planning and Conceptual Design
DESIGN FEES:$300,000
CONSTRUCTION COST:$121M
COMPLETION DATE:2010
REFERENCE:Doug Rex, Director of Transportation
ACOGph 405.234.2264
The Association of Central Oklahoma Governments (ACOG) is developing a vision, operations and finance plan for a
new multimodal transit hub located in downtown Oklahoma City. The project includes site selection, ridership analysis,
financial planning and concept design of the transit hub and related transit oriented development. Transit modes
serving the project include a streetcar system commuter rail, Amtrak, and commuter rail. Jacobs developed an inclusive
design process involving all transportation providers, elected officials, property owners and the public for input and
consensus building on site selection criteria, site alternatives, economic development and the context and civic presence of the facility. The architectural concept integrates the existing
historic Sante Fe Station with a new transit hall and signature station design creating a new gateway to Oklahoma City.
REPRESENTATIVE PROJECTS: Transit Facilities

D O W N T O W N M I A M I I N T E R M O D A L T E R M I N A L F E A S I B I L I T Y S T U D Y PA G E 1 0 1
28 29
Denton Downtown Transit Center – new photos
DOWNTOWN DENTON TRANSIT CENTER & TOD DENTON, TEXAS
The development of this multimodal transit facility will have a significant impact on Denton residents for many
years to come and will serve as a catalyst for redevelopment of the downtown area.
CLIENT:City of Denton
SERVICES:Planning, Architecture, and Engineering
SCOPE OF WORk:Master Planning, Preliminary and Final Design
DESIGN FEES:$360,000
CONSTRUCTION COST:$1.8M
COMPLETION DATE:2010
REFERENCE:herman Lawson, Facilities Director
ph 940.249.7755
Jacobs developed a transit oriented development (TOD) master plan and provided full design services for the
intermodal transit center for downtown Denton. The center was designed in conjunction with the introduction of passenger
rail service by Denton County Transportation Authority (DCTA). The TOD master plan took advantage of bus and rail passenger
service, a developing arts district and publicly held land to create new infill development around the station area. The development plan included infill of art and entertainment
venues, a streetscape plan for hickory Avenue connecting the station to downtown Denton and mixed-use development on
large privately held parcels.
A 45-foot clock tower and landscaped public plaza area are the main focal points for the transit center and are designed
to serve as an outdoor performance venue for local musicians and artists, and to compliment the DCTA rail platform.
The transit center includes a bus drop off lane, parking, and a 3,000 square-foot enclosed passenger waiting area with
transit related retail. The project was organized around a central plaza and gateway tower feature deriving its form the
original Denton Depot that once occupied the site.
REPRESENTATIVE PROJECTS: Transit Facilities

D O W N T O W N M I A M I I N T E R M O D A L T E R M I N A L F E A S I B I L I T Y S T U D Y PA G E 1 0 228 29
Denton Downtown Transit Center – new photos
DOWNTOWN DENTON TRANSIT CENTER & TOD DENTON, TEXAS
The development of this multimodal transit facility will have a significant impact on Denton residents for many
years to come and will serve as a catalyst for redevelopment of the downtown area.
CLIENT:City of Denton
SERVICES:Planning, Architecture, and Engineering
SCOPE OF WORk:Master Planning, Preliminary and Final Design
DESIGN FEES:$360,000
CONSTRUCTION COST:$1.8M
COMPLETION DATE:2010
REFERENCE:herman Lawson, Facilities Director
ph 940.249.7755
Jacobs developed a transit oriented development (TOD) master plan and provided full design services for the
intermodal transit center for downtown Denton. The center was designed in conjunction with the introduction of passenger
rail service by Denton County Transportation Authority (DCTA). The TOD master plan took advantage of bus and rail passenger
service, a developing arts district and publicly held land to create new infill development around the station area. The development plan included infill of art and entertainment
venues, a streetscape plan for hickory Avenue connecting the station to downtown Denton and mixed-use development on
large privately held parcels.
A 45-foot clock tower and landscaped public plaza area are the main focal points for the transit center and are designed
to serve as an outdoor performance venue for local musicians and artists, and to compliment the DCTA rail platform.
The transit center includes a bus drop off lane, parking, and a 3,000 square-foot enclosed passenger waiting area with
transit related retail. The project was organized around a central plaza and gateway tower feature deriving its form the
original Denton Depot that once occupied the site.
REPRESENTATIVE PROJECTS: Transit Facilities

D O W N T O W N M I A M I I N T E R M O D A L T E R M I N A L F E A S I B I L I T Y S T U D Y PA G E 1 0 3
Prepared forU.S. Department of Transportation
Federal Transit AdministrationThe Metropolitan Transit Authority of Harris County
Prepared byLOPEZGARCIA GROUP
1825 Market Center Boulevard, Suite 150Dallas, TX 75207
December 2006
Intermodal TerminalEnvironmental AssessmentFinal

D O W N T O W N M I A M I I N T E R M O D A L T E R M I N A L F E A S I B I L I T Y S T U D Y PA G E 1 0 4

D O W N T O W N M I A M I I N T E R M O D A L T E R M I N A L F E A S I B I L I T Y S T U D Y PA G E 1 0 5
FINDING OF NO SIGNIFICANT IMPACT
Project: METRO Intermodal Terminal Applicant: Metropolitan Transit Authority of Harris County Project Location: Houston, Texas
Project Description The Metropolitan Transit Authority of Harris County (METRO) is proposing to construct an Intermodal Terminal (IT) that will act as a major hub for METRO’s service area, enabling residents, visitors and workers to easily transfer between the different modes of transit—buses, light rail, and guided rapid transit (GRT). The proposed project involves the development of a multi-modal, multi-use, multi-story transit facility adjacent to the Near Northside neighborhood of downtown Houston. It is centered at the junction of the Union Pacific Railroad (UPRR) and Main Street, approximately 1,600 feet north of IH 10. The general project area will be bounded by the UPRR line Right-of-Way (ROW), Keene Street, Harrington Street and Burnett Streets on the north; Hardy Road on the east; IH 10/US 90 on the south; and White Oak Bayou on the west.
The proposed facility will be designed to house passenger waiting and transfer facilities for the existing and projected volume of local buses that serve the immediate area. It will also provide access to Light Rail Transit (LRT) and Guided Rapid Transit (GRT) platforms; bicycle storage facilities; and passenger and driver amenities, including parking, public restrooms, retail and concessions. Improvements to several surrounding roads will be required to provide safe and convenient access for buses and the public.
An Environmental Assessment (EA), in coordination with the Federal Transit Administration (FTA), was prepared to evaluate the potential impacts and benefits of the facility to the social, physical and natural communities. The IT was evaluated as an independent facility. The implementation of other transit modes to serve this facility, such as the North Corridor LRT/GRT and potential future East End and Southeast Corridor GRT were considered in this analysis. The impacts of this connectivity were included in appropriate sections of this environmental assessment.
Alternatives ConsideredIn 2003, voters in the METRO service area approved METRO Solutions, which is a comprehensive transit plan that provides a range of technologies and services to address the varying mobility needs of specific corridors and the community at large through 2025. In support of METRO Solutions, in 2005 the Houston Downtown Management District initiated an inter-governmental agency study, referred to as the Houston Intermodal Center/Multimodal Terminal Feasibility Study.
Seven zones within the Houston metropolitan region were initially identified as candidates suitable for the IT. Evaluation criteria for the regional analysis included:

D O W N T O W N M I A M I I N T E R M O D A L T E R M I N A L F E A S I B I L I T Y S T U D Y PA G E 1 0 6
proximity to major activity centers, access to the freeway system, and the ability to accommodate future transportation projects. An area just north of downtown was selected as the preferred location for a full-capacity intermodal terminal. Within this zone, a Location Analysis was conducted to determine the preferred location of the facility based on three criteria: transportation and mobility, economic opportunity and investment, and site characteristics. An area just north of downtown was selected as the preferred location for a full-capacity intermodal terminal. As a result of the Location Analysis, the White Oak and Hardy Yards sub-areas were identified as best suited to meet the purpose and need of the proposed project. The EA evaluated a no-build alternative and a build alternative at this site based on conceptual plans designed by METRO.
Agency Coordination and Public Involvement Three public meetings were conducted regarding this project. The general public and interested parties were made aware of and invited to participate in the meetings through a project website, newsletters, and newspaper advertisements.
The first meeting occurred on August 18, 2005, and was attended by 32 stakeholders and members of the community. Several displays including case study examples, study goals and objectives, site selection criteria, results of the regional location analysis, and possible sites within the preferred location were provided. Members of the study team were on hand to answer questions. A formal presentation illustrating examples of intermodal terminals, study scope of work, study goals and objectives, results of the regional location analysis, site safety design concepts, and a schedule of future public meetings was conducted.
The second meeting occurred on April 4, 2006. This meeting was attended by 83 citizens. The meeting was conducted in an open house format and consisted of boards and maps of the project area as well as the environmental assessment process. Attendees were encouraged to complete a comment form.
The third meeting was conducted on June 8, 2006 and was attended by 120 members of the community. A presentation of the conceptual design of the facility and the results of the EA were provided. The welcome and introductions were presented in English and Spanish. After the 20-minute presentation, questions were addressed at five stations, manned by project technical staff, with specialized information boards. A court reporter was on-hand to record public comment and comment cards were also available.
METRO also sought and received comments from various public agencies. Agency coordination letters are included in the EA as an appendix.
Determination and Findings METRO prepared an Environment Assessment in compliance with the National Environmental Policy Act (NEPA), and in accordance with FTA regulations and guidelines, 23 CFR Part 771. The EA described the project’s potential for significant impact.

D O W N T O W N M I A M I I N T E R M O D A L T E R M I N A L F E A S I B I L I T Y S T U D Y PA G E 1 0 7
After reviewing the EA and supporting documents, as well as public comments, FTA finds under 23 CFR 771.121 that the proposed project will have no significant impact on the environment. The record provides sufficient evidence and analysis for determining that an Environmental Impact Statement (EIS) is not required.
The EA analysis determined that there will be no significant adverse impacts to land use and economics, parkland, threatened and endangered species, air quality, or traffic and transportation. Therefore, these sections of the EA will not be discussed further in this document.
Property Acquisitions and Displacements The construction of the proposed IT facility will require the displacement of four residents and eight businesses. In order to mitigate the impacts of these displacements, METRO will adhere to all federal guidelines regarding acquisition and relocation assistance including the Uniform Relocation Assistance and Real Property Acquisition Policies Act of 1970 (42USC 4601). For all real property acquired, METRO will compensate the property owner for the fair market value of their property and for damages to any remaining parcel(s). Relocation benefits will be provided for all businesses and residents (owner occupants and tenants) that are displaced by acquisition.
Visual and Aesthetics Potential impacts to the Near Northside Neighborhood and North Main Street were identified during the EA process. In order to mitigate these potential impacts, coordination with the Near Northside Neighborhood will occur during final design.
Soils and Geology Construction activities will result in removal of vegetation, exposure of the soil, loss of topsoil productivity in areas not currently paved and short-term increased susceptibility to wind and water erosion. Best management practices will be utilized to minimize the impacts including but not limited to silt fencing, vegetative filter strips, straw bale dikes and diversion ditches.
Natural Communities There will be some loss of vegetation in the White Oak Bayou, according to the EA analysis. METRO will commit to further assessment and planning for tree preservation and replacement in order to mitigate this vegetation loss.
Water Resources Construction of the IT project could cause minor sediment run off into surface water. Also, minor increases in automobile related chemicals, modifications to the existing storm sewer system, and minor impacts in shallow ground water quality during construction could occur. METRO will comply with the Texas Pollutant Discharge Elimination System (TPDES) General Permit for Storm Water Discharges from Construction Activities. METRO will also develop and implement a Storm Water

D O W N T O W N M I A M I I N T E R M O D A L T E R M I N A L F E A S I B I L I T Y S T U D Y PA G E 1 0 8
Pollution Prevention Plan. Finally, temporary and permanent storm water BMPs will be utilized before, during, and following construction to avoid or minimize the addition of contaminants to storm water.
Noise and Vibration No severe noise impacts will occur to adjacent properties. However, moderate impacts for residents on Burnett Street from increased vehicle traffic could occur. No projected vibration impacts were determined. In order to mitigate the noise impacts, possible mitigation techniques that METRO could implement include but are not limited to, noise barriers and sound insulation.
Hazardous Materials Phase I Environmental Site Assessments (ESAs) of the project area concluded several properties within the project limits are potential sources of contamination. There are two locations of high concern and twenty-two areas of moderate concern in relation to hazardous materials. The areas directly impacted will be determined during final design and mitigation will be determined at each individual property at this time. METRO commits to conducting a Phase II ESA during final design, and, if necessary a Phase III ESA.
Cultural Resources For projects receiving federal funding, partial funding, permitting, or licensing, the project is subject to regulations defined in Section 106 of the National Historic Preservation Act (NHPA) of 1966, as amended. Section 106 of the NHPA requires that the federal agency, or the agency acting on its behalf, take into account the undertaking’s effects on historic properties. The responsibilities are outlined in Protection of Historic Properties, 36 CFR 800. Historic properties are defined as those buildings, structures, objects, sites and districts that are listed in, or eligible for listing in, the NRHP. The NRHP is an inventory of listed historic resources that is maintained by the Secretary of the Interior.
Historic resources located on land owned or controlled by the State of Texas, or one of its cities, counties, or other political subdivisions, are protected by the Antiquities Code of Texas. Under the Antiquities Code, any historic property located on publicly owned land may be determined eligible as a State Archaeological Landmark (SAL). Conditions for formal landmark designation are defined in Chapter 26 of the Texas Historical Commission’s (THC) Rules of Practice and Procedure for the Antiquities Code of Texas.
Federal transportation projects must also consider a project’s effects on a historic property, park, recreation area, or wildlife management area that is located within publicly owned land. These resources are known as Section 4(f) properties. Regulations for implementing the Section 4(f) process are defined in Section 4(f) of the Department of Transportation (DOT) Act of 1966 (23 CFR 771.135 Section 4(f)).
The THC concurred that 24 historic age properties will sustain adverse impacts as a result of the proposed project. No known archaeological resources are currently known to exist

D O W N T O W N M I A M I I N T E R M O D A L T E R M I N A L F E A S I B I L I T Y S T U D Y PA G E 1 0 9
within the project area. A Memorandum of Agreement (MOA) for historic age and any discovered archeological resources was executed by the Federal Transit Administration, METRO, and the Texas State Historic Preservation Officer on December 12, 2006. The MOA is included in Appendix E of the EA.
Section 4(f) Evaluation As noted the implementation of the Intermodal Terminal project would impact several eligible historic resources as described in the Determination of Effects Report for the Intermodal Terminal in Houston, Texas. The report and FTA’s finding are included in Appendix F of the EA.
Safety and Security Additional transit and vehicle traffic in the area could result in additional safety concerns related to safety of pedestrian traffic and pedestrian/vehicle interfaces. Also, there may be impact to emergency vehicle response times. Coordination will occur with fire, police, and emergency services to minimize impact to response times. Crossing approaches will be signalized, and METRO will incorporate Crime Prevention Through Environmental Design (CPTED) practices during final design. All construction impacts will be limited in duration and temporary. Best management practices will be implemented and carried out to minimize short term impacts.
Environmental Justice Title VI of the Civil Rights Act of 1964 and Federal Executive Order 12898 of 1994 “Federal Actions to Address Environmental Justice in Minority Populations and Low-Income Populations,” prohibit discriminatory practices and mandate the equal distribution of benefits and burdens in programs receiving federal funds. The project study area is comprised of portions of five census block groups (1000, 2101, 2102, 2103, and 5101with a total population of 4,441 persons, according to the 2000 Census. The majority of the study area population is reported to be 67.06 percent Hispanic origin with a 42.52 percent a racial minority. More than 26% of the study area population is considered to be below the poverty threshold.
The implementation of the IT would potentially produce adverse short-term construction impacts and long-term impacts on the minority populations in the Near Northside neighborhood, particularly those residents near Burnett Street. The most adverse impact that was identified in the EJ analysis will occur along Main Street where four residences and one business would be displaced north of the Judge Alfred Hernandez Tunnel. The adverse impacts identified would be mitigated using measures described in this EA. In view of this and the considerable project benefits and local support for implementing the IT, the adverse impacts will not be disproportionate to the positive benefits that the project will offer to low income, Hispanic, and minority populations within the study area. Public input related to the project’s benefits and impacts has been solicited throughout the study attracting many low income, Hispanic and minority community members at a number of public meetings.

D O W N T O W N M I A M I I N T E R M O D A L T E R M I N A L F E A S I B I L I T Y S T U D Y PA G E 1 1 0

D O W N T O W N M I A M I I N T E R M O D A L T E R M I N A L F E A S I B I L I T Y S T U D Y PA G E 1 1 1
Environmental Assessment for the
Intermodal Terminal Houston, Texas
Prepared for
The Metropolitan Transit Authority of Harris County
Prepared by
LOPEZGARCIA GROUP 1825 Market Center Blvd., Suite 150
Dallas, Texas 75207
December 2006

D O W N T O W N M I A M I I N T E R M O D A L T E R M I N A L F E A S I B I L I T Y S T U D Y PA G E 1 1 2
Executive Summ
ary
Executive Summary

D O W N T O W N M I A M I I N T E R M O D A L T E R M I N A L F E A S I B I L I T Y S T U D Y PA G E 1 1 3
Environmental Assessment Intermodal Terminal Executive Summary
December 2006 ES-1
EXECUTIVE SUMMARY
The subject of this Environmental Assessment (EA) is the design and construction of an Intermodal Terminal (IT) project located north of downtown Houston. The National Environmental Policy Act (NEPA) of 1969 requires that federal agencies prepare an EA for any major federal action to determine if the project would have a significant impact on the environment. An EA was prepared by the Metropolitan Transit Authority of Harris County (METRO) under its responsibilities as the local lead agency to implement the IT. This EA documents all comments received during public meetings and reflects key decisions made by the METRO Board of Directors. This document has been submitted in coordination with the Federal Transit Administration (FTA), the lead federal agency.
The purpose of the EA is to inform the affected agencies and the public of potential environmental, social and economic impacts associated with the proposed IT and the No-Build Alternative. The No-Build Alternative represents the base condition for identifying impacts associated with the proposed project. The EA serves as the primary document to facilitate review of the proposed project by federal, state and local agencies and the general public. The EA documents the purpose and need for the project and describes the alternatives considered. It addresses in detail the anticipated transportation and environmental impacts of the project and identifies any appropriate mitigation measures that may be required to minimize such impacts.
A series of public meetings was conducted within the study area for interested parties including private citizens, community groups, the business community, elected officials and public agencies. The EA reflects the decisions made by the METRO Board of Directors and also includes responses to comments received during the public meetings. It is anticipated that the completion of the Final EA will result in a Finding of No Significant Impact (FONSI) by the FTA, permitting the project to be advanced to final design and construction.
This Executive Summary highlights the most noteworthy findings of the Final EA relative to the document’s major headings:
Purpose and Need, Alternatives Considered, Affected Environment, and Environmental Consequences.
PURPOSE AND NEED METRO’s multi-modal transit system is early in its ultimate development. The success of the Main Street Light Rail Transit (LRT) and extensive High Occupancy Vehicle system, demonstrates the region’s commitment to supporting

D O W N T O W N M I A M I I N T E R M O D A L T E R M I N A L F E A S I B I L I T Y S T U D Y PA G E 1 1 4
Environmental Assessment Executive Summary Intermodal Terminal
December 2006 ES-2
further transportation enhancements. As this multi-modal system further develops, the IT would serve the following purposes:
increase regional connectivity/transit effectiveness, offer an alternative to single-occupancy vehicle (SOV) travel, and improve access and increase economic development opportunities.
As the Houston region continues to expand, the impact on its associated infrastructure will be stretched. For transportation, surface streets will become further congested; travel time will be increased for drivers and transit riders; and air quality will further deteriorate. METRO Solutions is one component of the region’s efforts to address these transportation issues. The specific transit investment of the proposed IT in the north downtown area would meet the following needs:
Provide increased connections of major employment, entertainment, commercial and educational activity centers throughout the region;
Improve air quality by reducing traffic congestion near the downtown area; Improve transit service through reduced travel time and increased
reliability; Contribute to improvements in unacceptable regional air quality; and Improve regional mobility through effective and efficient transit.
ALTERNATIVES CONSIDERED In 2005, the Houston Downtown Management District initiated an inter-governmental agency analysis of the transit needs in the METRO service area through the use of a feasibility study referred to as the Houston Intermodal Center/Multimodal Terminal Feasibility Study. This study was conducted in support of METRO Solutions, the region’s comprehensive long range transit plan and was financed with contributions from METRO, the Texas Department of Transportation (TxDOT), the City of Houston, the Main Street Coalition and Midtown Management District. This effort was guided by a 32-member steering committee composed of neighborhood representatives, University of Houston – Downtown staff, City of Houston and Harris County officials and representatives from private transportation entities. This analysis sought to solicit input from stakeholders regarding how they might use the facility, determine the best location for the facility and build a cohesive group of IT stakeholders who would support funding applications for the facility.
A Regional Location Analysis was undertaken to identify areas within the Houston region that would be suitable to locate the proposed IT. The analysis was based on information developed from multiple transportation providers and the project’s steering committee. Seven general areas were identified within the region as candidates for accommodating the proposed facility (Figure 2-1). The Regional Location Analysis identified a Zone A (North Downtown) as the highest ranking alternative site for the following reasons:
connectivity to the greatest number of existing transportation infrastructure elements in the region,

D O W N T O W N M I A M I I N T E R M O D A L T E R M I N A L F E A S I B I L I T Y S T U D Y PA G E 1 1 5
Environmental Assessment Intermodal Terminal Executive Summary
December 2006 ES-3
connectivity to the greatest number of proposed transportation infrastructure elements in the region,
best overall proximity to major regional activity centers, greatest amount of vacant and/or underutilized land in close proximity to
existing and proposed transportation infrastructure and most consistent land use patterns, which are compatible with the
development of an IT.
The feasibility study further refined the possible locations within Zone A. To further evaluate seven sub-areas (Figure 2-2), an evaluation matrix for three primary goals (transportation and mobility, economic opportunity and investment and site characteristics), was developed and is provided below (Table ES-1).
As a result of the Location Analysis, the White Oak and Hardy Yards sub-areas were identified by the Feasibility Study as best suited to meet the purpose and need of the proposed project.

D O W N T O W N M I A M I I N T E R M O D A L T E R M I N A L F E A S I B I L I T Y S T U D Y PA G E 1 1 6
Environmental Assessment Executive Summary Intermodal Terminal
December 2006 ES-4
Table ES-1. Sub-Area Evaluation Matrix Site
CriteriaWhiteOak
Hardy Yards
WilsonProperty
IH10/US
59East
Bayou BusBarn
PostOffice
Transportation and Mobility
1.1 Operation and Maintenance Cost
1.2 Intermodal Connectivity 1.3 Accessibility 1.4 Travel Time Savings Economic Opportunity and Investment
2.1 Consistency with Land Use Patterns
2.2Proximity to Existing and Planned Development
2.3Proximity to Developed and Re-developable Land
2.4 Resident/Neighborhood Sentiment
2.5 Business Community Sentiment
2.6 Environmental Impacts Site Characteristics
3.1 Positive Community Impact
3.2 Avoid Business and Resident Relocations
3.3 Personal Security
3.4 Environmental Clearance/Remediation
Environmental review to be conducted following selection of preferred sites at METRO.
3.5 Visibility 3.6 Capital Cost 3.7 Ease of Site Acquisition
3.8 Ability to Phase Construction
Key: Very Good Good Poor Source: Houston Intermodal Center/Multimodal Terminal Feasibility Study (2005).
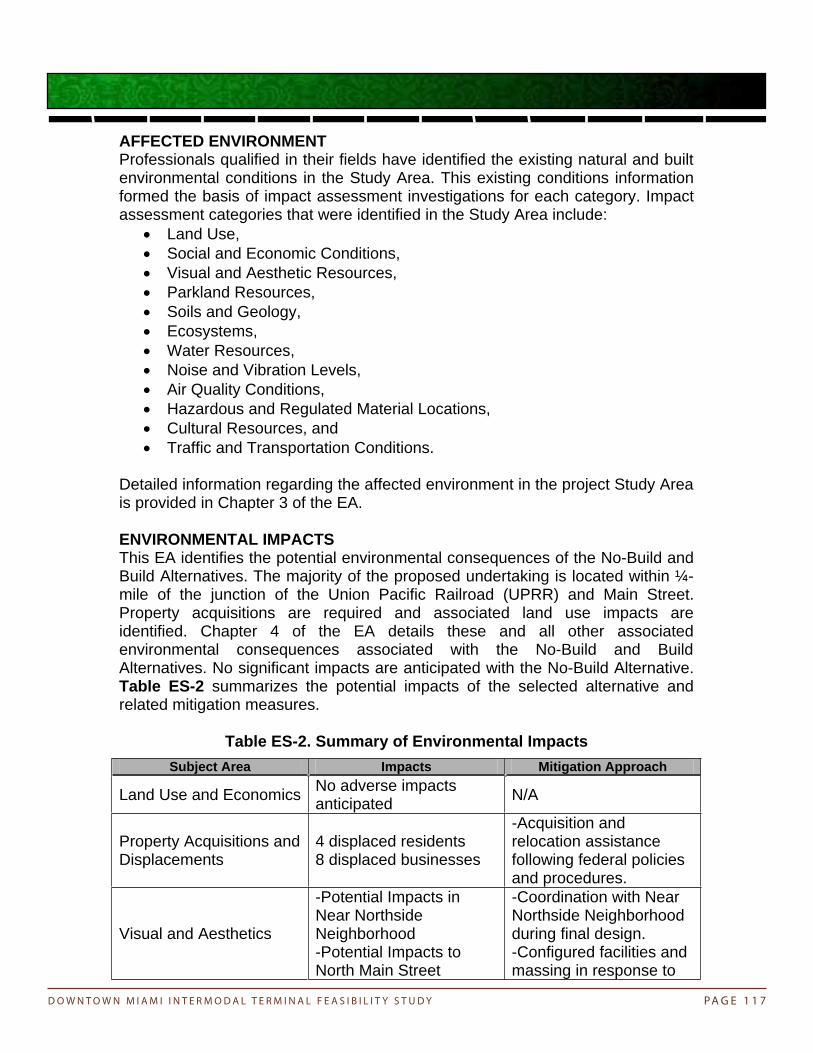
D O W N T O W N M I A M I I N T E R M O D A L T E R M I N A L F E A S I B I L I T Y S T U D Y PA G E 1 1 7
Environmental Assessment Intermodal Terminal Executive Summary
December 2006 ES-5
AFFECTED ENVIRONMENT Professionals qualified in their fields have identified the existing natural and built environmental conditions in the Study Area. This existing conditions information formed the basis of impact assessment investigations for each category. Impact assessment categories that were identified in the Study Area include:
Land Use, Social and Economic Conditions, Visual and Aesthetic Resources, Parkland Resources, Soils and Geology, Ecosystems, Water Resources, Noise and Vibration Levels, Air Quality Conditions, Hazardous and Regulated Material Locations, Cultural Resources, and Traffic and Transportation Conditions.
Detailed information regarding the affected environment in the project Study Area is provided in Chapter 3 of the EA.
ENVIRONMENTAL IMPACTS This EA identifies the potential environmental consequences of the No-Build and Build Alternatives. The majority of the proposed undertaking is located within ¼-mile of the junction of the Union Pacific Railroad (UPRR) and Main Street. Property acquisitions are required and associated land use impacts are identified. Chapter 4 of the EA details these and all other associated environmental consequences associated with the No-Build and Build Alternatives. No significant impacts are anticipated with the No-Build Alternative. Table ES-2 summarizes the potential impacts of the selected alternative and related mitigation measures.
Table ES-2. Summary of Environmental Impacts Subject Area Impacts Mitigation Approach
Land Use and Economics No adverse impacts anticipated N/A
Property Acquisitions and Displacements
4 displaced residents 8 displaced businesses
-Acquisition and relocation assistance following federal policies and procedures.
Visual and Aesthetics
-Potential Impacts in Near Northside Neighborhood-Potential Impacts to North Main Street
-Coordination with Near Northside Neighborhood during final design. -Configured facilities and massing in response to

D O W N T O W N M I A M I I N T E R M O D A L T E R M I N A L F E A S I B I L I T Y S T U D Y PA G E 1 1 8
Environmental Assessment Executive Summary Intermodal Terminal
December 2006 ES-6
neighborhood context. Parkland No significant Impacts N/A
Soils and Geology
-Project construction activities would include removal of vegetation, exposure of the soil, loss of topsoil productivity in areas not currently paved and short-term increased susceptibility to wind and water erosion.
-Best management practices (BMPs) would be utilized, such as silt fencing, vegetative filter strips, straw bale dikes and diversion ditches.
Natural Communities -Loss of vegetation in the White Oak Bayou
-Commitment to further assessment and planning for tree preservation and replacement
Threatened and Endangered species No significant Impacts N/A
Water Resources
-Construction could cause minor sediment run off into surface water. -Minor increase in automobile related chemicals-Modifications to the existing storm sewer systems-Minor impacts in shallow groundwater quality during construction
-Compliance with the Texas Pollutant Discharge Elimination System (TPDES) General Permit for Storm Water Discharges from Construction Activities -Develop and implement a Storm Water Pollution Prevention Plan -Temporary and permanent storm water control measures (BMPs) would be utilized before, during and following construction to avoid or minimize the addition of contaminants to storm water
Noise and Vibration
-No severe noise impacts to adjacent properties. -Moderate impacts for residents on Burnett Street from increased vehicle traffic -No projected vibration impacts
-Possible mitigation measures such as noise barriers and sound insulation
Air Quality -No adverse impacts N/A Hazardous Materials -2 locations of high -Areas impacted to be

D O W N T O W N M I A M I I N T E R M O D A L T E R M I N A L F E A S I B I L I T Y S T U D Y PA G E 1 1 9
Environmental Assessment Intermodal Terminal Executive Summary
December 2006 ES-7
concern-22 locations of moderate concern
determined during final design-Mitigation needs dependent on impacts at each individual property
Cultural Resources Adverse impacts to 24 properties expected
As stipulated in MOA between THC, FTA, and METRO
Traffic and Transportation -No adverse impacts N/A
Safety and Security -Pedestrian/vehicleinterface-Pedestrian safety
-Coordination with fire, police, emergency services-Crossing approaches to be signed -Incorporate Crime Prevention Through Environmental Design
Construction Impacts -Temporary and limited duration impacts -Institute BMP
Environmental Justice -Potentially adverse impacts to Near Northside neighborhood
-Coordinate and mitigate with community

D O W N T O W N M I A M I I N T E R M O D A L T E R M I N A L F E A S I B I L I T Y S T U D Y PA G E 1 2 0

D O W N T O W N M I A M I I N T E R M O D A L T E R M I N A L F E A S I B I L I T Y S T U D Y PA G E 1 2 1

D O W N T O W N M I A M I I N T E R M O D A L T E R M I N A L F E A S I B I L I T Y S T U D Y PA G E 1 2 2

D O W N T O W N M I A M I I N T E R M O D A L T E R M I N A L F E A S I B I L I T Y S T U D Y PA G E 1 2 3
•
•
•
•
•
•
•
•
•
•
•
•
•

D O W N T O W N M I A M I I N T E R M O D A L T E R M I N A L F E A S I B I L I T Y S T U D Y PA G E 1 2 4
•

D O W N T O W N M I A M I I N T E R M O D A L T E R M I N A L F E A S I B I L I T Y S T U D Y PA G E 1 2 5
• • • • • •
• • • • • • •
• •
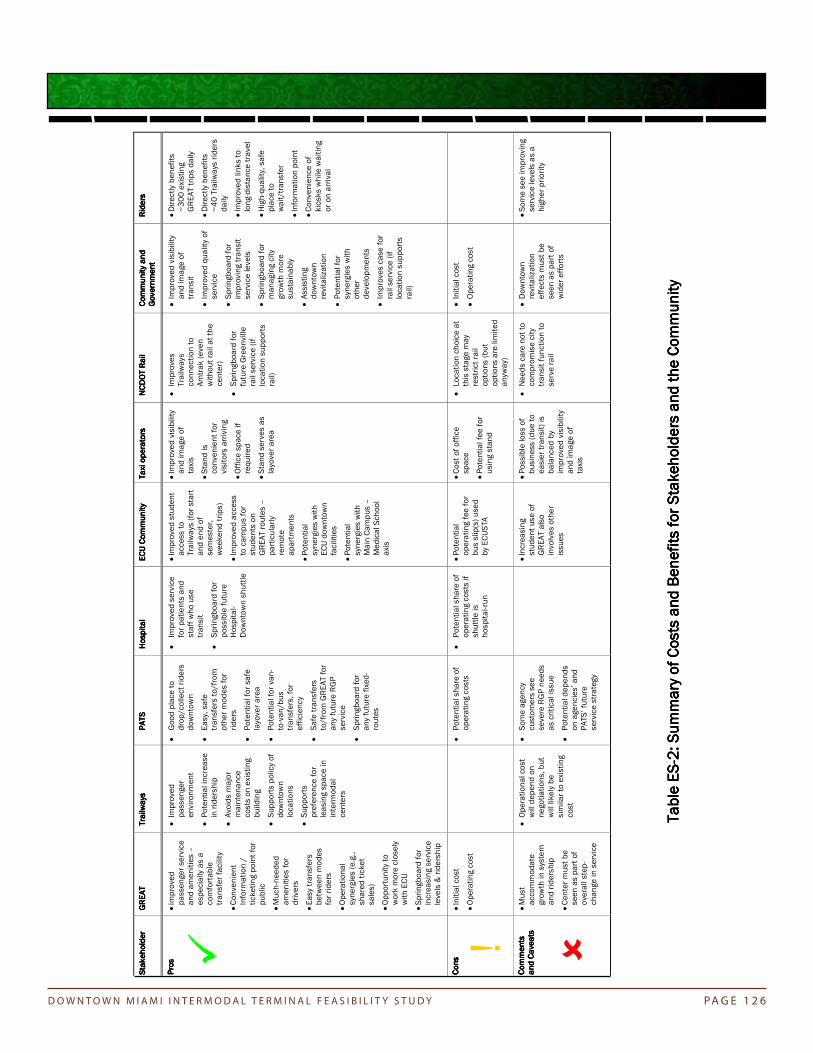
D O W N T O W N M I A M I I N T E R M O D A L T E R M I N A L F E A S I B I L I T Y S T U D Y PA G E 1 2 6
•
•
•
•
•
•
•
•
•
•
•
•
•
•
•
•
•
•
•
•
•
•
•
•
•
•
•
•
•
•
•
•
•
•
•
•
•
•
•
•
•
•
•
•
•
•
•
•
•
•
•
•
•
•
•
•
•
•
•
•
•
•
•

D O W N T O W N M I A M I I N T E R M O D A L T E R M I N A L F E A S I B I L I T Y S T U D Y PA G E 1 2 7

D O W N T O W N M I A M I I N T E R M O D A L T E R M I N A L F E A S I B I L I T Y S T U D Y PA G E 1 2 8

D O W N T O W N M I A M I I N T E R M O D A L T E R M I N A L F E A S I B I L I T Y S T U D Y PA G E 1 2 9
•
•
•
•
•
•
•
•
•
•
•
•
•
•
•
•
•
•

D O W N T O W N M I A M I I N T E R M O D A L T E R M I N A L F E A S I B I L I T Y S T U D Y PA G E 1 3 0
†

D O W N T O W N M I A M I I N T E R M O D A L T E R M I N A L F E A S I B I L I T Y S T U D Y PA G E 1 3 1
•
•
•
•
•

D O W N T O W N M I A M I I N T E R M O D A L T E R M I N A L F E A S I B I L I T Y S T U D Y PA G E 1 3 2
•
•
•
•
•

D O W N T O W N M I A M I I N T E R M O D A L T E R M I N A L F E A S I B I L I T Y S T U D Y PA G E 1 3 3

D O W N T O W N M I A M I I N T E R M O D A L T E R M I N A L F E A S I B I L I T Y S T U D Y PA G E 1 3 4

D O W N T O W N M I A M I I N T E R M O D A L T E R M I N A L F E A S I B I L I T Y S T U D Y PA G E 1 3 5
•
•
•
•

D O W N T O W N M I A M I I N T E R M O D A L T E R M I N A L F E A S I B I L I T Y S T U D Y PA G E 1 3 6

D O W N T O W N M I A M I I N T E R M O D A L T E R M I N A L F E A S I B I L I T Y S T U D Y PA G E 1 3 7
•
•
•

D O W N T O W N M I A M I I N T E R M O D A L T E R M I N A L F E A S I B I L I T Y S T U D Y PA G E 1 3 8

D O W N T O W N M I A M I I N T E R M O D A L T E R M I N A L F E A S I B I L I T Y S T U D Y PA G E 1 3 9

D O W N T O W N M I A M I I N T E R M O D A L T E R M I N A L F E A S I B I L I T Y S T U D Y PA G E 1 4 0

D O W N T O W N M I A M I I N T E R M O D A L T E R M I N A L F E A S I B I L I T Y S T U D Y PA G E 1 4 1
•
•
•
•

D O W N T O W N M I A M I I N T E R M O D A L T E R M I N A L F E A S I B I L I T Y S T U D Y PA G E 1 4 2

D O W N T O W N M I A M I I N T E R M O D A L T E R M I N A L F E A S I B I L I T Y S T U D Y PA G E 1 4 3

D O W N T O W N M I A M I I N T E R M O D A L T E R M I N A L F E A S I B I L I T Y S T U D Y PA G E 1 4 4
•
•
•
•

D O W N T O W N M I A M I I N T E R M O D A L T E R M I N A L F E A S I B I L I T Y S T U D Y PA G E 1 4 5

D O W N T O W N M I A M I I N T E R M O D A L T E R M I N A L F E A S I B I L I T Y S T U D Y PA G E 1 4 6

D O W N T O W N M I A M I I N T E R M O D A L T E R M I N A L F E A S I B I L I T Y S T U D Y PA G E 1 4 7
•

D O W N T O W N M I A M I I N T E R M O D A L T E R M I N A L F E A S I B I L I T Y S T U D Y PA G E 1 4 8
•
•

D O W N T O W N M I A M I I N T E R M O D A L T E R M I N A L F E A S I B I L I T Y S T U D Y PA G E 1 4 9

D O W N T O W N M I A M I I N T E R M O D A L T E R M I N A L F E A S I B I L I T Y S T U D Y PA G E 1 5 0

D O W N T O W N M I A M I I N T E R M O D A L T E R M I N A L F E A S I B I L I T Y S T U D Y PA G E 1 5 1

D O W N T O W N M I A M I I N T E R M O D A L T E R M I N A L F E A S I B I L I T Y S T U D Y PA G E 1 5 2
•
•

D O W N T O W N M I A M I I N T E R M O D A L T E R M I N A L F E A S I B I L I T Y S T U D Y PA G E 1 5 3

D O W N T O W N M I A M I I N T E R M O D A L T E R M I N A L F E A S I B I L I T Y S T U D Y PA G E 1 5 4

D O W N T O W N M I A M I I N T E R M O D A L T E R M I N A L F E A S I B I L I T Y S T U D Y PA G E 1 5 5

D O W N T O W N M I A M I I N T E R M O D A L T E R M I N A L F E A S I B I L I T Y S T U D Y PA G E 1 5 6
•
•
•

D O W N T O W N M I A M I I N T E R M O D A L T E R M I N A L F E A S I B I L I T Y S T U D Y PA G E 1 5 7

D O W N T O W N M I A M I I N T E R M O D A L T E R M I N A L F E A S I B I L I T Y S T U D Y PA G E 1 5 8

D O W N T O W N M I A M I I N T E R M O D A L T E R M I N A L F E A S I B I L I T Y S T U D Y PA G E 1 5 9

D O W N T O W N M I A M I I N T E R M O D A L T E R M I N A L F E A S I B I L I T Y S T U D Y PA G E 1 6 0

D O W N T O W N M I A M I I N T E R M O D A L T E R M I N A L F E A S I B I L I T Y S T U D Y PA G E 1 6 1

D O W N T O W N M I A M I I N T E R M O D A L T E R M I N A L F E A S I B I L I T Y S T U D Y PA G E 1 6 2

D O W N T O W N M I A M I I N T E R M O D A L T E R M I N A L F E A S I B I L I T Y S T U D Y
SITE SELEC TION CRITERIA TABLE
10-21-11
High (3) High (3)
(Fatal Flaws) Med (2)
HLA = High Level Analysis; DA = Detailed Analysis
Low (3)
Item DescriptionArea of
Consideration Site Test Fit
SITE LOCATION REQUIREMENTS
Surrounding Area and Characteristics
Impact/Compatibility on Adjacent Community
Minimize impact to adjacent neighborhoods and parks
Surrounding area character Positive / Negative related to Design Guidelines
Compatibility with Local Zoning / Land Use
Maximize compatibility with local zoning including building height, maximum lot coverage, public review times / schedule, parking, floor area ratio, and noise ordinances.
HLA DA
Amenities
Restaurants Location, Type, Proximity
Retail Location, Type, Proximity
Lodging Location, Type, Proximity
Civic Space (Governmental Functions Location, Type, Proximity
Conference Center Location, Type, Proximity
Sports Arena Location, Type, Proximity
Higher Education Institutions Location, Type, Proximity
Cultural Centers/Museums Location, Type, Proximity
Parks and Open Space Location, Type, Proximity
Community/Fitness Center Location, Type, Proximity
Transportation (Connectivity/Traffic Circulation/ Travel Patterns)
Airport Shuttle Proximity Distance to Routes
Commuter Rail Line (Future/FEC)
Proximity Distance
Accessibility: Max Distance Ease of access
Freight Rail Line
Proximity Distance
Metrobus Proximity to stations
Current level of service
Metrorail Proximity to stations
Current level of service
Metromover Proximity to stations
Current level of service
PA G E 1 6 3

D O W N T O W N M I A M I I N T E R M O D A L T E R M I N A L F E A S I B I L I T Y S T U D Y PA G E 1 6 4
SITE SELEC TION CRITERIA TABLE
10-21-11
High (3) High (3)
(Fatal Flaws) Med (2)
HLA = High Level Analysis; DA = Detailed Analysis
Low (3)
Item DescriptionArea of
Consideration Site Test Fit
Transportation (Connectivity/Traffic Circulation/ Travel Patterns) Continued
Bus Proximity to bus stops
Current level of service
Parking Garages Proximity to nearest garages (desired or not desired?)
Capacity of garages
Cruise Ship Port Proximity Distance (desired or not desired?)
Proximity to Interstates
Proximity to interstate highways and interchanges (min distance)
Accessibility (distance/maneuverability)
Roads
Impact on Adjacent Roadways Minimize required upgrades, street closings and modifications to existing roadways
Street Configuration
Street Jurisdiction
Traffic
Extreme Congestion Avoid areas of extreme traffic congestion
High Crash Location Avoid areas of high automobile/pedestrian conflicts
Tour/Charter Bus Service Proximity to tour/charter bus services
Walking Routes
Sidewalks Present or not present along route
Condition Good, Fair, Poor
Width Good, Fair, Poor
Connectivity Connectivity to other major walking paths/routes
Pedestrian Crossing Signals Present or not present along route
ADA Compliance Compliant or not compliant along route
Traffic Volume Traffic volume along the streets in the adjacent area to the proposed facility

D O W N T O W N M I A M I I N T E R M O D A L T E R M I N A L F E A S I B I L I T Y S T U D Y PA G E 1 6 5
SITE SELEC TION CRITERIA TABLE
10-21-11
High (3) High (3)
(Fatal Flaws) Med (2)
HLA = High Level Analysis; DA = Detailed Analysis
Low (3)
Item DescriptionArea of
Consideration Site Test Fit
Transportation (Connectivity/Traffic Circulation/ Travel Patterns) Continued
Bicycling Routes
Bike Lanes Present or not present along route
Condition Good, Fair, Poor
Width Good, Fair, Poor
Bike Racks Parking/Bike Racks
Connectivity Connectivity to other major biking paths/routes
ROW Availability Ability to modify the road to accommodate bikes
Traffic Volume Traffic volume along the streets in the adjacent area to the proposed facility
Safety and Security
Public SafetyEmergency response must meet 3 minute (?) response average and be capable of handling explosive detection and containment and moderate HAZMAT events (OPSS)
Risk and Hazards
Gas and Oil transmission line 8” or larger Proximity and amount of generated risk
Hazardous Material Storage Sites Proximity and amount of generated risk
DEMOGRAPHICS AND ECONOMIC DEVELOPMENT
Residential
Proximity Current residential density
Projected Growth
Work Force
Proximity Current major places of employment
Projected Growth
Local Economic Development Compliment local economic development and planning initiatives, tax incentives, and consider compatibility. HLA DA

D O W N T O W N M I A M I I N T E R M O D A L T E R M I N A L F E A S I B I L I T Y S T U D Y PA G E 1 6 6
SITE SELEC TION CRITERIA TABLE
10-21-11
High (3) High (3)
(Fatal Flaws) Med (2)
HLA = High Level Analysis; DA = Detailed Analysis
Low (3)
Item DescriptionArea of
Consideration Site Test Fit
SITE REQUIREMENTS
Land Availability
Overall Property Size Overall total size sufficient per program
Property Ownership Type of ownership structure
Adjacent Property Availability Amount and proximity of other properties available for purchase/expansion
Zoning/Land Use Rezoning or LUPA of property required to allow desired use
Site Geometry Can accommodate the general minimum development site length and width
Geography/Characteristics
Topography/Drainage The vertical contour promotes good drainage. Good is most favorable (flat/gently sloped).
Elevation General site elevation (above min. floodplain)
Soils/Geology General sub-surface characteristics (also considering groundwater issues)
Accessibility Accessible for vehicular, service, and delivery entrances HLA DA
Land Use Compatibility An appropriate “best” use context
Impact to adjacent area Positive/Negative (existing surrounding uses)
Impact from adjacent area Positive/Negative (existing surrounding uses)
Surrounding area character Positive/Negative (existing context)
Segregation of Uses/Site Zoning Ability to separate users and create distinct spaces and user zones
Surrounding Negative Influences Sound
Surrounding Negative Influences Odor
Development Form and Mass Impacts Appropriate scale to existing adjacent development
Image and Visibility Presence and visual recognition/Views In and Out

D O W N T O W N M I A M I I N T E R M O D A L T E R M I N A L F E A S I B I L I T Y S T U D Y PA G E 1 6 7
SITE SELEC TION CRITERIA TABLE
10-21-11
High (3) High (3)
(Fatal Flaws) Med (2)
HLA = High Level Analysis; DA = Detailed Analysis
Low (3)
Item DescriptionArea of
Consideration Site Test Fit
Environmental Hazards and Issues
Natural DisastersRisks caused by extreme natural forces likely to cause property damage and/or increase design criteria and construction costs.
Flood Hazard Areas (100-year) Presence, frequency and risk
Storm Surge/Wind Velocity Zone Presence, frequency and risk
Hurricane/Evacuation Zone Presence, frequency and risk
Endangered Species (Plant and Animal)
The presence of endangered plant or animal species that would restrict redevelopment area or delay construction
Wetlands/Fragile Ecosystems Presence, percent coverage, and level of impact to developable area HLA DA
Coastal or Inland Waterway Proximity and impact
Vegetative Coverage Avoidance of removal of significant areas of vegetation
Tree Preservation Ordinances Requirement of tree preservation, replacement, or banking
Cultural Resources (Artifacts) The presence of human, historical, cultural, or other remains that would restrict developable area or delay construction
Environmental Contamination Presence of contaminants that would require mitigation/GIS level map analysis
Security
Security
Physical Setbacks Ability to mitigate threat with setbacks
Access Control Ability to control main points of site access
Sabotage Ability to mitigate the threat of sabotage
Utilities
Power
Available Capacity Three Phase power feed to cover planned program service needs
Redundancy Service redundancy available at the site/feed alternatives
Future Sourcing Are there opportunities for future sustainable energy sources
Natural Gas Availability and Capacity

D O W N T O W N M I A M I I N T E R M O D A L T E R M I N A L F E A S I B I L I T Y S T U D Y PA G E 1 6 8
SITE SELEC TION CRITERIA TABLE
10-21-11
High (3) High (3)
(Fatal Flaws) Med (2)
HLA = High Level Analysis; DA = Detailed Analysis
Low (3)
Item DescriptionArea of
Consideration Site Test Fit
Utilities (continued)
Sanitary Sewer
Capacity (now and future) Assigned Service Plant
Redundancy System redundancy vs site main redundancy
Recycled Water Availability
Costs Service impact fees
Potable Water
Capacity (now and future) Assigned Service Plant
Redundancy System redundancy vs site main redundancy
Pressure Fire service pressure at hydrant(s)
Fire Protection Water Availability
Ground Water Well Availability Depth and quality
Costs Service impact fees
Storm System
Capacity (now and future) Outfall service lines availability
Redundancy System redundancy vs site main redundancy
Surface, piped, or both
Quality Treatment Regs. Treatment of water after capture
Costs Service impact fees
Drainage/Flood Control Presence of surrounding area flood control system(s) to prevent or mitigate flooding of a potential site and access roads HLA
Construction
Cut and Fill Amount of grading likely required for construction
Impact to Environment Minimized construction impact to the environment, vegetation, significant trees, or other natural features
Demolition Amount of demolition necessary for new construction
Ease of Construction Ability to easily stage and execute construction
Safety of Construction Ability to provide a safe, secured construction environment. Avoid injury of public during construction activities (safe thoroughfare).

D O W N T O W N M I A M I I N T E R M O D A L T E R M I N A L F E A S I B I L I T Y S T U D Y PA G E 1 6 9
SITE SELEC TION CRITERIA TABLE
10-21-11
High (3) High (3)
(Fatal Flaws) Med (2)
HLA = High Level Analysis; DA = Detailed Analysis
Low (3)
Item DescriptionArea of
Consideration Site Test Fit
Construction (continued)
Timing/Schedule - Approvals and Permits
Ability to begin construction sooner versus later on specific site, per specific regulations
Timing/Schedule - Property Rights Acquisition and/or Assembly timing affects on schedule
Operations and Maintenance
Repairs and Support Services Availability and proximity of the site to transit support (maintenance) services
Continuation of Operations Minimization of negative impacts to daily operations due to maintenance interruptions
Functional Relationships
Optimized Internal Efficiencies Proximity/size site optimized to internal program components
Optimized Internal Movement Configuration of site to accommodate optimized internal transit movements without conflicts
Optimized Internal Operations Configuration of site to the optimized transit staffing locations
Sustainability
Redevelopment and Rehabilitation Maximizes the ability to promote adjacent sites/area redevelopment opportunities
Water quality Site allows full program development without degradation to surrounding water bodies
Recycling Site can accommodate/promote recycling
LEED Self certifying (LEED Redevelopment site criteria, or SSI)
BUSINESS ENVIRONMENT
Regulations
Easements Presence of existing easements (or future required) that impact the site
Rights of Way Presence of ROW’s (or future ROW dedication requirements) that impact the site
Public Support Likelyhood of agency and public support related to the project site/ surrounding uses

D O W N T O W N M I A M I I N T E R M O D A L T E R M I N A L F E A S I B I L I T Y S T U D Y
SITE SELECTION CRITERIA “DESIRABILITY” SCORES
Category GIS Analysis (Buffer/Query) Score
Transportation
Bus Terminal
Less than 264 feet (1 min. walk) 3
265 feet to 792 feet (3 min. walk) 2
793 feet to 1320 feet (5 min. walk) 1
Bus Routes
Low (1 to 3 bus routes) - 250 feet 1
Medium (4 to 6 bus routes) - 500 feet 2
High (More than 7 bus routes) - 1000 feet 3
MetroRail
Less than 264 feet (1 min. walk) 3
265 feet to 792 feet (3 min. walk) 2
793 feet to 1320 feet (5 min. walk) 1
MetroMover
Less than 264 feet (1 min. walk) 3
265 feet to 792 feet (3 min. walk) 2
793 feet to 1320 feet (5 min. walk) 1
InterstatesLess than 2640 feet (or half-mile) 3
More than 2640 feet (or half-mile) 1
Jitney and Taxis
1 space 1
2-3 spaces 2
6 or more spaces 3
Freight TrainLess than 250 feet -3
251 feet to 500 feet -1
Landuse
Vacant Lots and Parking
No 1
Yes 3
CompatibleLanduse
No 1
Yes 3
Jobs
Less than 600 1
601 jobs to 900 jobs 2
More than 901 jobs 3
PA G E 1 7 0

D O W N T O W N M I A M I I N T E R M O D A L T E R M I N A L F E A S I B I L I T Y S T U D Y PA G E 1 7 1
Category GIS Analysis (Buffer/Query) Score
Economic Development
Enterprise ZonesOutside 1
Inside 3
EmpowermentZones
Outside 1
Inside 3
CommunityRedevelopment
Outside 1
Inside 3
Environment
Floodplain100-year floodplain -3
500-year floodplain -1
ContaminatedSites
Yes 1
No 3
Community Facility
Civic Buildings
Less than 264 feet (1 min. walk) 3
265 feet to 792 feet (3 min. walk) 2
793 feet to 1320 feet (5 min. walk) 1
Cultural Centers
Less than 264 feet (1 min. walk) 3
265 feet to 792 feet (3 min. walk) 2
793 feet to 1320 feet (5 min. walk) 1
Higher Education
Less than 264 feet (1 min. walk) 3
265 feet to 792 feet (3 min. walk) 2
793 feet to 1320 feet (5 min. walk) 1
Sports Arena
Less than 264 feet (1 min. walk) 2
265 feet to 792 feet (3 min. walk) 1
793 feet to 1320 feet (5 min. walk) 3
Parks
Less than 264 feet (1 min. walk) 3
265 feet to 792 feet (3 min. walk) 2
793 feet to 1320 feet (5 min. walk) 1
Emergency ResponseLess than 2640 feet (or half-mile) 3
More than 2640 feet (or half-mile) 1

D O W N T O W N M I A M I I N T E R M O D A L T E R M I N A L F E A S I B I L I T Y S T U D Y
!(
!(
!(
!(
!(
!(
!(
!( !(
!(
!(
!(
!(
!(
!(
I 95 EXPY
NE 1ST AVE
NE 2N
D AV
E
NW 3RD AVE
N MIAMI AVE
NW 1ST AVE
NW 2ND AVE
SW 1ST ST
NW 5TH ST
NW 6TH ST
NW 8TH ST
I 395 EXPY
NW 3RD ST
NW 11TH ST
BISCAYNE BLVD
NW 10TH ST
NE 13TH ST
NE 8TH ST
NW 3RD CT
SE 1ST ST
NE 1ST ST
NW 7TH ST
NW 5TH AVE
NW 1ST ST
NE 2ND ST
SE 2ND ST
NE 3RD ST
I 95 RAMP
NW 9TH ST
S MIAMI AVE
SW 2ND AVE
SW 6TH ST
SW 2ND ST
NW 11TH TER
SW 5T
H AV
E
NW 4TH AVE
NE 5TH ST
PORT BLVD
SW 3RD ST
NE 6TH ST
SW 5TH ST
NW 13TH ST
NE 9TH ST
SE 5TH ST
E FLAGLER ST
NE 7TH ST
NE 11TH ST
NW 12TH ST
SE 2ND AVE
NE 10TH ST
SW 4TH ST
NW 4TH ST
SW 4TH AVE
NW 2ND ST
SE 4TH ST
SE 3R
D AV
E
SE 6TH ST
NW N RIVER DR
MACARTHUR CSWY
W FLAGLER ST
NE 12TH ST
NW 1ST PL
SE 3RD ST
SE 1ST AVE
MAC ARTHUR RAMP
SW N RIVER DR
NE 4TH ST
I 395 RAMP
S BISCAYNE BLVD
SW 3R
D AV
E
NE 3RD AVE
BISCAYNE BOULEVARD WAY
SW S RIVER DR
NW S RIVER DR
CHOPIN PLZ
BRIC
KELL
AVE
NE 1ST CT
NE MIAMI CT
SW 1ST AVE
NE 11TH TER
NW 1S
T CT
NW 4T
H CT
NW 2ND CT
SW 1S
T CT
NW M
IAMI CT
NW 1S
T CT
NW 1ST CT
W FLAGLER ST
NW 1S
T AVE
NW M
IAMI
CT
SW 3RD ST
I 95 EXPY
NW 2N
D CT
I 95 RAMP
NW 9TH ST
NW 2ND CT
SW 6TH ST
I 395 RAMP
SW 2ND ST
NE 12TH ST
NW 2ND ST
I 395 RAMP I 395 RAMP
I 95 RAMPI 95 RAMP
NE 4TH ST
I 95 R
AMP
NW 2ND AVE
SW 4TH ST
NW 4TH ST
I 95 RAMP
NW 1ST CT
NW 11TH TERI 395 RAMP
NW 4TH ST
NE MIAMI CT
I 95 RAMP
SW 1ST AVE
NW 4TH CT
RIVERWALK
PARK WEST
FIFTH STREET
THIRD STREET
MIAMI AVENUE
FIRST STREET
FREEDOM TOWER
COLLEGE NORTH
KNIGHT CENTER
BAYFRONT PARK
ELEVENTH STREET
COLLEGE/BAYSIDE
BICENTENIAL PARK
ARENA/STATE PLAZA
GOVERNMENT CENTER
§̈¦95
§̈¦395 [
Study Area
!( MetroMover Stations
MetroMover
LEGEND
FIGURE B01 - METRO MOVERDowntown Miami Intermodal Terminal Feasibility Study
0 0.25 0.5 Miles
1 Minute Walk - 264ft
3 Minute Walk - 792ft
5 Minute Walk - 1320ft
PA G E 1 7 2

D O W N T O W N M I A M I I N T E R M O D A L T E R M I N A L F E A S I B I L I T Y S T U D Y
!(
!(OVERTOWN
GOVERNMENT CENTER
I 95 EXPY
NE 1ST AVE
NE 2N
D AV
E
NW 3RD AVE
N MIAMI AVE
NW 1ST AVE
NW 2ND AVE
SW 1ST ST
NW 5TH ST
NW 6TH ST
NW 8TH ST
I 395 EXPY
NW 3RD ST
NW 11TH ST
BISCAYNE BLVD
NW 10TH ST
NE 13TH ST
NE 8TH ST
NW 3RD CT
SE 1ST ST
NE 1ST ST
NW 7TH ST
NW 5TH AVE
NW 1ST ST
NE 2ND ST
SE 2ND ST
NE 3RD ST
I 95 RAMP
NW 9TH ST
S MIAMI AVE
SW 2ND AVE
SW 6TH ST
SW 2ND ST
NW 11TH TER
SW 5T
H AV
E
NW 4TH AVE
NE 5TH ST
PORT BLVD
SW 3RD ST
NE 6TH ST
SW 5TH ST
NW 13TH ST
NE 9TH ST
SE 5TH ST
E FLAGLER ST
NE 7TH ST
NE 11TH ST
NW 12TH ST
SE 2ND AVE
NE 10TH ST
SW 4TH ST
NW 4TH ST
SW 4TH AVE
NW 2ND ST
SE 4TH ST
SE 3R
D AV
E
SE 6TH ST
NW N RIVER DR
MACARTHUR CSWY
W FLAGLER ST
NE 12TH ST
NW 1ST PL
SE 3RD ST
SE 1ST AVE
MAC ARTHUR RAMP
SW N RIVER DR
NE 4TH ST
I 395 RAMP
S BISCAYNE BLVD
SW 3R
D AV
E
NE 3RD AVE
BISCAYNE BOULEVARD WAY
SW S RIVER DR
NW S RIVER DR
CHOPIN PLZ
BRIC
KELL
AVE
NE 1ST CT
NE MIAMI CT
SW 1ST AVE
NE 11TH TER
NW 1S
T CT
NW 4T
H CT
NW 2ND CT
SW 1S
T CT
NW M
IAMI CT
NW 1S
T CT
NW 1ST CT
W FLAGLER ST
NW 1S
T AVE
NW M
IAMI
CT
SW 3RD ST
I 95 EXPY
NW 2N
D CT
I 95 RAMP
NW 9TH ST
NW 2ND CT
SW 6TH ST
I 395 RAMP
SW 2ND ST
NE 12TH ST
NW 2ND ST
I 395 RAMP I 395 RAMP
I 95 RAMPI 95 RAMP
NE 4TH ST
I 95 R
AMP
NW 2ND AVE
SW 4TH ST
NW 4TH ST
I 95 RAMP
NW 1ST CT
NW 11TH TERI 395 RAMP
NW 4TH ST
NE MIAMI CT
I 95 RAMP
SW 1ST AVE
NW 4TH CT
§̈¦95
§̈¦395 [
Study Area
!( MetroRail Stations
MetroRail
LEGEND
FIGURE B02 - METRORAILDowntown Miami Intermodal Terminal Feasibility Study
0 0.25 0.5 Miles
1 Minute Walk - 264ft
3 Minute Walk - 792ft
5 Minute Walk - 1320ft
PA G E 1 7 3

D O W N T O W N M I A M I I N T E R M O D A L T E R M I N A L F E A S I B I L I T Y S T U D Y
")Existing Downtown Bus Terminal
I 95 EXPY
NE 1ST AVE
NE 2N
D AV
E
NW 3RD AVE
N MIAMI AVE
NW 1ST AVE
NW 2ND AVE
SW 1ST ST
NW 5TH ST
NW 6TH ST
NW 8TH ST
I 395 EXPY
NW 3RD ST
NW 11TH ST
BISCAYNE BLVD
NW 10TH ST
NE 13TH ST
NE 8TH ST
NW 3RD CT
SE 1ST ST
NE 1ST ST
NW 7TH ST
NW 5TH AVE
NW 1ST ST
NE 2ND ST
SE 2ND ST
NE 3RD ST
I 95 RAMP
NW 9TH ST
S MIAMI AVE
SW 2ND AVE
SW 6TH ST
SW 2ND ST
NW 11TH TER
SW 5T
H AV
E
NW 4TH AVE
NE 5TH ST
PORT BLVD
SW 3RD ST
NE 6TH ST
SW 5TH ST
NW 13TH ST
NE 9TH ST
SE 5TH ST
E FLAGLER ST
NE 7TH ST
NE 11TH ST
NW 12TH ST
SE 2ND AVE
NE 10TH ST
SW 4TH ST
NW 4TH ST
SW 4TH AVE
NW 2ND ST
SE 4TH ST
SE 3R
D AV
E
SE 6TH ST
NW N RIVER DR
MACARTHUR CSWY
W FLAGLER ST
NE 12TH ST
NW 1ST PL
SE 3RD ST
SE 1ST AVE
MAC ARTHUR RAMP
SW N RIVER DR
NE 4TH ST
I 395 RAMP
S BISCAYNE BLVD
SW 3R
D AV
E
NE 3RD AVE
BISCAYNE BOULEVARD WAY
SW S RIVER DR
NW S RIVER DR
CHOPIN PLZ
BRIC
KELL
AVE
NE 1ST CT
NE MIAMI CT
SW 1ST AVE
NE 11TH TER
NW 1S
T CT
NW 4T
H CT
NW 2ND CT
SW 1S
T CT
NW M
IAMI
CT
I 95 EXPY
NW 1S
T CT
NW 1S
T AVE
NW 2N
D CT
I 95 RAMP
W FLAGLER ST
SW 2ND ST
NE MIAMI CT
I 95 RAMP
NW 2ND CT
I 395 RAMP
NW 4TH CT
SW 6TH ST
I 395 RAMP
SW 4TH ST
NE 12TH ST
NW 2ND ST
I 395 RAMP
NW 1ST CT
I 95 RAMP
NW 9TH ST
I 95 R
AMP
NW 2ND AVE
NW 4TH ST
I 95 RAMP
NW 11TH TER
NE 4TH ST
SW 3RD ST
NW 4TH ST
I 395 RAMP
I 95 RAMP
SW 1ST AVE
NW 1ST CT
§̈¦95
§̈¦395 [
Study Area
") Existing Downtown Bus Terminal
Bus Route Frequency - High
Bus Route Frequency - Medium
Bus Route Frequency - Low
LEGEND
FIGURE B03 - BUS ROUTE FREQUENCY &EXISTING DOWNTOWN BUS TERMINALDowntown Miami Intermodal Terminal Feasibility Study
0 0.25 0.5 Miles
1 Minute Walk - 264ft
3 Minute Walk - 792ft
5 Minute Walk - 1320ft
PA G E 1 7 4

D O W N T O W N M I A M I I N T E R M O D A L T E R M I N A L F E A S I B I L I T Y S T U D Y
$+
$+
$+
$+
$+
$+
Southbound On Ramp at NW 3rd Ct
Southbound Off Ramp at NW 3rd Ct
Downtown Distributor Off Ramp
Northbound-Southbound On Ramp at Miami AveI 95 EXPY
NE 1ST AVE
NE 2N
D AV
E
NW 3RD AVE
N MIAMI AVE
NW 1ST AVE
NW 2ND AVE
SW 1ST ST
NW 5TH ST
NW 6TH ST
NW 8TH ST
I 395 EXPY
NW 3RD ST
NW 11TH ST
BISCAYNE BLVD
NW 10TH ST
NE 13TH ST
NE 8TH ST
NW 3RD CT
SE 1ST ST
NE 1ST ST
NW 7TH ST
NW 5TH AVE
NW 1ST ST
NE 2ND ST
SE 2ND ST
NE 3RD ST
I 95 RAMP
NW 9TH ST
S MIAMI AVE
SW 2ND AVE
SW 6TH ST
SW 2ND ST
NW 11TH TER
SW 5T
H AV
E
NW 4TH AVE
NE 5TH ST
PORT BLVD
SW 3RD ST
NE 6TH ST
SW 5TH ST
NW 13TH ST
NE 9TH ST
SE 5TH ST
E FLAGLER ST
NE 7TH ST
NE 11TH ST
NW 12TH ST
SE 2ND AVE
NE 10TH ST
SW 4TH ST
NW 4TH ST
SW 4TH AVE
NW 2ND ST
SE 4TH ST
SE 3R
D AV
E
SE 6TH ST
NW N RIVER DR
MACARTHUR CSWY
W FLAGLER ST
NE 12TH ST
NW 1ST PL
SE 1ST AVE
MAC ARTHUR RAMP
SW N RIVER DR
NE 4TH ST
I 395 RAMP
S BISCAYNE BLVD
SW 3R
D AV
E
NE 3RD AVE
BISCAYNE BOULEVARD WAY
SW S RIVER DR
NW S RIVER DR
CHOPIN PLZ
BRIC
KELL
AVE
NE 1ST CT
NE MIAMI CT
SW 1ST AVE
NE 11TH TER
NW 1ST CT
NW 4T
H CT
NW 2ND CT
SW 1S
T CT
NW M
IAMI CT
I 95 RAMP
NW M
IAMI
CT
I 95 EXPY
NW 2ND CT
NW 1S
T AVE
I 95 RAMP
I 95 RAMP
SW 2ND ST
SW 6TH ST
NW 2N
D CT
NW 4TH ST
I 395 RAMP
W FLAGLER ST
NW 2ND ST
I 395 RAMP I 395 RAMP
NW 1S
T CT
NE 4TH ST
NW 9TH ST
NW 1ST CT
I 95 R
AMP
NW 4TH ST
I 95 RAMP
NE 12TH ST
NW 2ND AVE
NW 11TH TERI 395 RAMP
SW 3RD ST SW 4TH ST
NE MIAMI CT
I 95 RAMP
SW 1ST AVE
NW 4TH CT
Northbound Off Ramp at NW 3rd Ave
Northbound On Ramp at NW 3rd Ave
§̈¦95
§̈¦395 [
Study Area
$+ Interstate On/Off Ramps
Interstate On/Off Ramp Setback - 2640ft
LEGEND
FIGURE B04 - INTERSTATE ON/OFF RAMPSDowntown Miami Intermodal Terminal Feasibility Study
0 0.25 0.5 Miles
PA G E 1 7 5

D O W N T O W N M I A M I I N T E R M O D A L T E R M I N A L F E A S I B I L I T Y S T U D Y
I 95 EXPY
NE 1ST AVE
NE 2N
D AV
E
NW 3RD AVE
N MIAMI AVE
NW 1ST AVE
NW 2ND AVE
SW 1ST ST
NW 5TH ST
NW 6TH ST
NW 8TH ST
I 395 EXPY
NW 3RD ST
NW 11TH ST
BISCAYNE BLVD
NW 10TH ST
NE 13TH ST
NE 8TH ST
NW 3RD CT
SE 1ST ST
NE 1ST ST
NW 7TH ST
NW 5TH AVE
NW 1ST ST
NE 2ND ST
SE 2ND ST
NE 3RD ST
I 95 RAMP
NW 9TH ST
S MIAMI AVE
SW 2ND AVE
SW 6TH ST
SW 2ND ST
NW 11TH TER
SW 5T
H AV
E
NW 4TH AVE
NE 5TH ST
PORT BLVD
SW 3RD ST
NE 6TH ST
SW 5TH ST
NW 13TH ST
NE 9TH ST
SE 5TH ST
E FLAGLER ST
NE 7TH ST
NE 11TH ST
NW 12TH ST
SE 2ND AVE
NE 10TH ST
SW 4TH ST
NW 4TH ST
SW 4TH AVE
NW 2ND ST
SE 4TH ST
SE 3R
D AV
E
SE 6TH ST
NW N RIVER DR
MACARTHUR CSWY
W FLAGLER ST
NE 12TH ST
NW 1ST PL
SE 3RD ST
SE 1ST AVE
MAC ARTHUR RAMP
SW N RIVER DR
NE 4TH ST
I 395 RAMP
S BISCAYNE BLVD
SW 3R
D AV
E
NE 3RD AVE
BISCAYNE BOULEVARD WAY
SW S RIVER DR
NW S RIVER DR
CHOPIN PLZ
BRIC
KELL
AVE
NE 1ST CT
NE MIAMI CT
SW 1ST AVE
NE 11TH TER
NW 1S
T CT
NW 4T
H CT
NW 2ND CT
SW 1S
T CT
NW M
IAMI CT
NW 1S
T CT
NW 1ST CT
W FLAGLER ST
NW 1S
T AVE
NW M
IAMI
CT
SW 3RD STI 95 EXPY
NW 2N
D CT
I 95 RAMP
NW 9TH ST
NW 2ND CT
SW 6TH ST
I 395 RAMP
SW 2ND ST
NE 12TH ST
NW 2ND ST
I 395 RAMP I 395 RAMP
I 95 RAMPI 95 RAMP
NE 4TH ST
I 95 R
AMP
NW 2ND AVE
SW 4TH ST
NW 4TH ST
I 95 RAMP
NW 1ST CT
NW 11TH TERI 395 RAMP
NW 4TH ST
NE MIAMI CT
I 95 RAMP
SW 1ST AVE
NW 4TH CT
§̈¦95
§̈¦395 [
Study Area
Striped Bike Lanes
Paved Path
Paved Shoulder
LEGEND
FIGURE B05 - BICYCLE FACILITIESDowntown Miami Intermodal Terminal Feasibility Study
0 0.25 0.5 Miles
?
PA G E 1 7 6
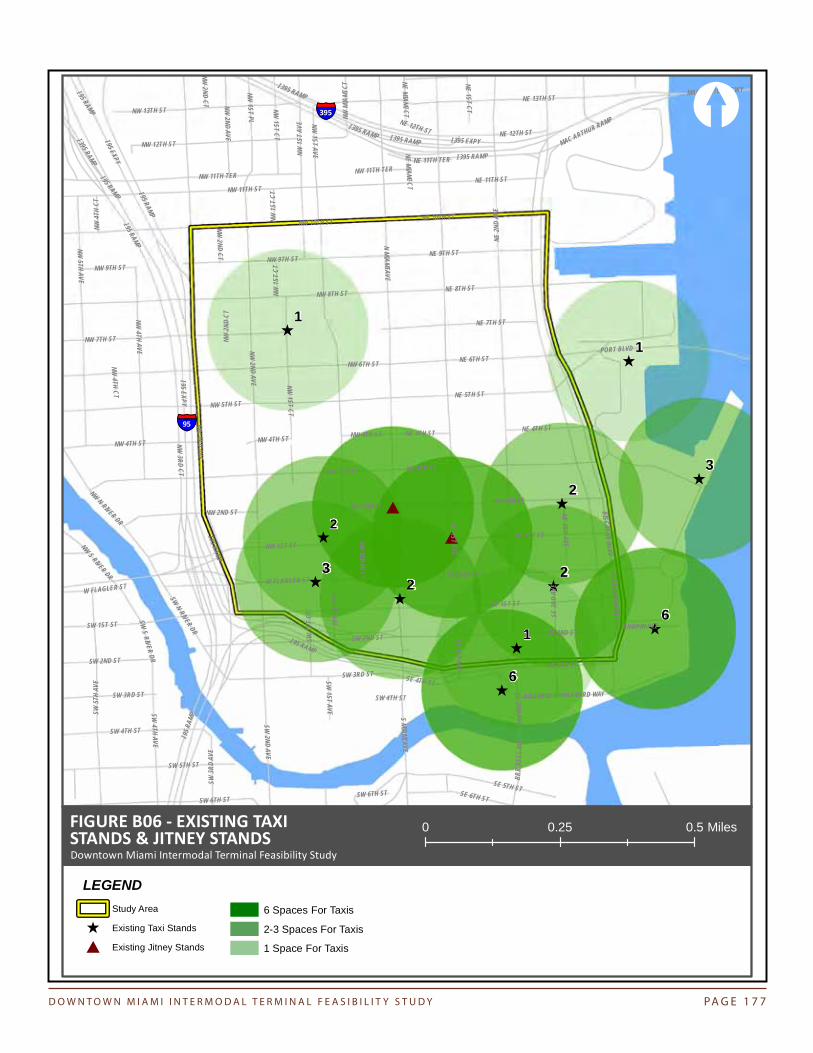
D O W N T O W N M I A M I I N T E R M O D A L T E R M I N A L F E A S I B I L I T Y S T U D Y
#
#
^
^
^
^
^
^
^
^
^
^
^1
3
3
1
6
6
2
1
2
2
2
I 95 EXPY
NE 1ST AVE
NE 2N
D AV
E
NW 3RD AVE
N MIAMI AVE
NW 1ST AVE
NW 2ND AVE
SW 1ST ST
NW 5TH ST
NW 6TH ST
NW 8TH ST
I 395 EXPY
NW 3RD ST
NW 11TH ST
BISCAYNE BLVD
NW 10TH ST
NE 13TH ST
NE 8TH ST
NW 3RD CT
SE 1ST ST
NE 1ST ST
NW 7TH ST
NW 5TH AVE
NW 1ST ST
NE 2ND ST
SE 2ND ST
NE 3RD ST
I 95 RAMP
NW 9TH ST
S MIAMI AVE
SW 2ND AVE
SW 6TH ST
SW 2ND ST
NW 11TH TER
SW 5T
H AV
E
NW 4TH AVE
NE 5TH ST
PORT BLVD
SW 3RD ST
NE 6TH ST
SW 5TH ST
NW 13TH ST
NE 9TH ST
SE 5TH ST
E FLAGLER ST
NE 7TH ST
NE 11TH ST
NW 12TH ST
SE 2ND AVE
NE 10TH ST
SW 4TH ST
NW 4TH ST
SW 4TH AVE
NW 2ND ST
SE 4TH ST
SE 3R
D AV
E
SE 6TH ST
NW N RIVER DR
MACARTHUR CSWY
W FLAGLER ST
NE 12TH ST
NW 1ST PL
SE 3RD ST
SE 1ST AVE
MAC ARTHUR RAMP
SW N RIVER DR
NE 4TH ST
I 395 RAMP
S BISCAYNE BLVD
SW 3R
D AV
E
NE 3RD AVE
BISCAYNE BOULEVARD WAY
SW S RIVER DR
NW S RIVER DR
CHOPIN PLZ
BRIC
KELL
AVE
NE 1ST CT
NE MIAMI CT
SW 1ST AVE
NE 11TH TER
NW 1S
T CT
NW 4T
H CT
NW 2ND CT
SW 1S
T CT
NW M
IAMI CT
NW 1S
T CT
NW 1ST CT
W FLAGLER ST
NW 1S
T AVE
NW M
IAMI
CT
SW 3RD STI 95 EXPY
NW 2N
D CT
I 95 RAMP
NW 9TH ST
NW 2ND CT
SW 6TH ST
I 395 RAMP
SW 2ND ST
NE 12TH ST
NW 2ND ST
I 395 RAMP I 395 RAMP
I 95 RAMPI 95 RAMP
NE 4TH ST
I 95 R
AMP
NW 2ND AVE
SW 4TH ST
NW 4TH ST
I 95 RAMP
NW 1ST CT
NW 11TH TERI 395 RAMP
NW 4TH ST
NE MIAMI CT
I 95 RAMP
SW 1ST AVE
NW 4TH CT
§̈¦95
§̈¦395 [
Study Area
^ Existing Taxi Stands
# Existing Jitney Stands
LEGEND
FIGURE B06 - EXISTING TAXISTANDS & JITNEY STANDSDowntown Miami Intermodal Terminal Feasibility Study
0 0.25 0.5 Miles
6 Spaces For Taxis
2-3 Spaces For Taxis
1 Space For Taxis
PA G E 1 7 7

D O W N T O W N M I A M I I N T E R M O D A L T E R M I N A L F E A S I B I L I T Y S T U D Y
U.S. Post Office
County Courthouse
Federal Courthouse
Stephen P Clark Government Center
I 95 EXPY
NE 1ST AVE
NE 2N
D AV
E
NW 3RD AVE
N MIAMI AVE
NW 1ST AVE
NW 2ND AVE
SW 1ST ST
NW 5TH ST
NW 6TH ST
NW 8TH ST
I 395 EXPY
NW 3RD ST
NW 11TH ST
BISCAYNE BLVD
NW 10TH ST
NE 13TH ST
NE 8TH ST
NW 3RD CT
SE 1ST ST
NE 1ST ST
NW 7TH ST
NW 5TH AVE
NW 1ST ST
NE 2ND ST
SE 2ND ST
NE 3RD ST
I 95 RAMP
NW 9TH ST
S MIAMI AVE
SW 2ND AVE
SW 6TH ST
SW 2ND ST
NW 11TH TER
SW 5T
H AV
E
NW 4TH AVE
NE 5TH ST
PORT BLVD
SW 3RD ST
NE 6TH ST
SW 5TH ST
NW 13TH ST
NE 9TH ST
SE 5TH ST
E FLAGLER ST
NE 7TH ST
NE 11TH ST
NW 12TH ST
SE 2ND AVE
NE 10TH ST
SW 4TH ST
NW 4TH ST
SW 4TH AVE
NW 2ND ST
SE 4TH ST
SE 3R
D AV
E
SE 6TH ST
NW N RIVER DR
MACARTHUR CSWY
W FLAGLER ST
NE 12TH ST
NW 1ST PL
SE 3RD ST
SE 1ST AVE
MAC ARTHUR RAMP
SW N RIVER DR
NE 4TH ST
I 395 RAMP
S BISCAYNE BLVD
SW 3R
D AV
E
NE 3RD AVE
BISCAYNE BOULEVARD WAY
SW S RIVER DR
NW S RIVER DR
CHOPIN PLZ
BRIC
KELL
AVE
NE 1ST CT
NE MIAMI CT
SW 1ST AVE
NE 11TH TER
NW 1S
T CT
NW 4T
H CT
NW 2ND CT
SW 1S
T CT
NW M
IAMI
CT
I 95 EXPY
NW 1S
T CT
NW 1S
T AVE
NW 2N
D CT
I 95 RAMP
W FLAGLER ST
SW 2ND ST
NE MIAMI CT
I 95 RAMP
NW 2ND CT
I 395 RAMP
NW 4TH CT
SW 6TH ST
I 395 RAMP
SW 4TH ST
NE 12TH STI 395 RAMP
NW 1ST CT
I 95 RAMP
NW 9TH ST
I 95 R
AMP
NW 2ND AVE
NW 4TH ST
I 95 RAMP
NW 11TH TER
NE 4TH ST
SW 3RD ST
I 395 RAMP
I 95 RAMP
SW 1ST AVE
NW 1ST CT
§̈¦95
§̈¦395 [
Study Area
Civic Buildings
LEGEND
FIGURE C01 - CIVIC SPACEDowntown Miami Intermodal Terminal Feasibility Study
0 0.25 0.5 Miles
1 Minute Walk - 264ft
3 Minute Walk - 792ft
5 Minute Walk - 1320ft
PA G E 1 7 8
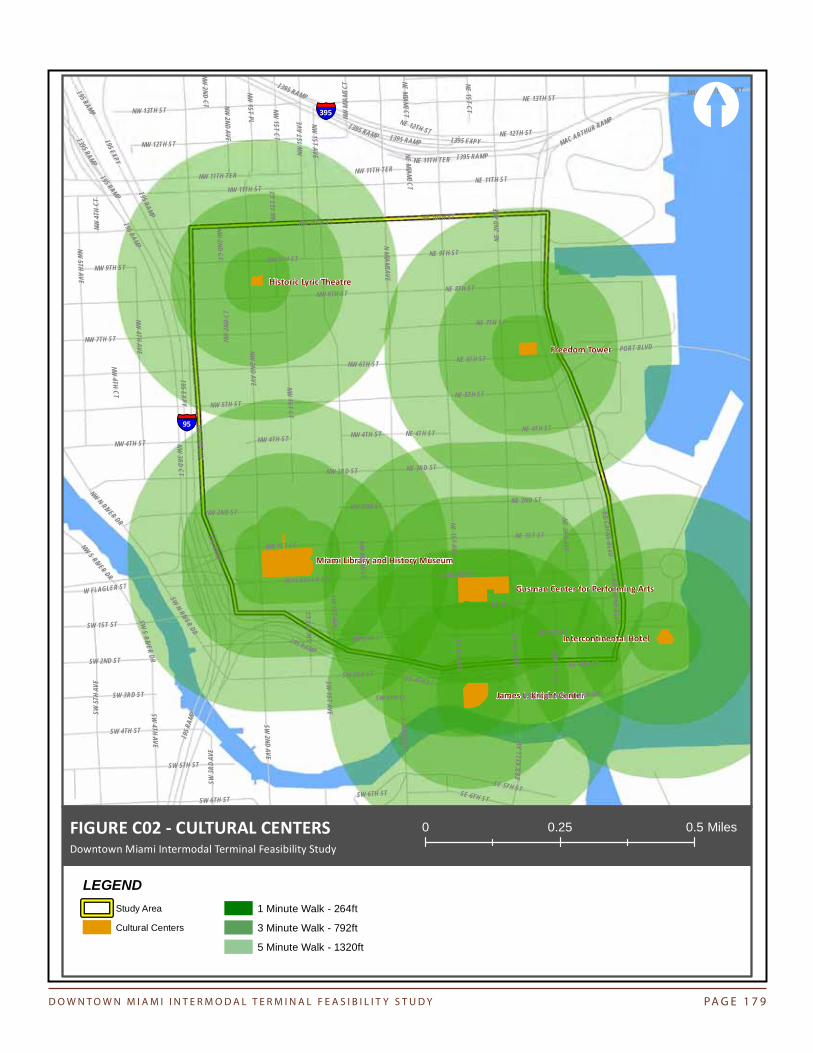
D O W N T O W N M I A M I I N T E R M O D A L T E R M I N A L F E A S I B I L I T Y S T U D Y
Miami Library and History MuseumMiami Library and History Museum
Historic Lyric Theatre
James L. Knight Center
Intercontinental Hotel
Gusman Center for Performing Arts
Freedom Tower
I 95 EXPY
NE 1ST AVE
NE 2N
D AV
E
NW 3RD AVE
N MIAMI AVE
NW 1ST AVE
NW 2ND AVE
SW 1ST ST
NW 5TH ST
NW 6TH ST
NW 8TH ST
I 395 EXPY
NW 3RD ST
NW 11TH ST
BISCAYNE BLVD
NW 10TH ST
NE 13TH ST
NE 8TH ST
NW 3RD CT
SE 1ST ST
NE 1ST ST
NW 7TH ST
NW 5TH AVE
NW 1ST ST
NE 2ND ST
SE 2ND ST
NE 3RD ST
I 95 RAMP
NW 9TH ST
S MIAMI AVE
SW 2ND AVE
SW 6TH ST
SW 2ND ST
NW 11TH TER
SW 5T
H AV
E
NW 4TH AVE
NE 5TH ST
PORT BLVD
SW 3RD ST
NE 6TH ST
SW 5TH ST
NW 13TH ST
NE 9TH ST
SE 5TH ST
E FLAGLER ST
NE 7TH ST
NE 11TH ST
NW 12TH ST
SE 2ND AVE
NE 10TH ST
SW 4TH ST
NW 4TH ST
SW 4TH AVE
NW 2ND ST
SE 4TH ST SE 3R
D AV
E
SE 6TH ST
NW N RIVER DR
MACARTHUR CSWY
W FLAGLER ST
NE 12TH ST
NW 1ST PL
SE 3RD ST
SE 1ST AVE
MAC ARTHUR RAMP
SW N RIVER DR
NE 4TH ST
I 395 RAMP
S BISCAYNE BLVD
SW 3R
D AV
E
NE 3RD AVE
BISCAYNE BOULEVARD WAY
SW S RIVER DR
NW S RIVER DR
BRIC
KELL
AVE
NE 1ST CT
NE MIAMI CT
SW 1ST AVE
NE 11TH TER
NW 1ST CT
NW 4T
H CT
NW 2ND CT
SW 1S
T CT
NW M
IAMI CT
I 95 EXPY
NW 1S
T AVE
NW M
IAMI
CT
I 95 RAMP
W FLAGLER ST
SW 2ND ST
NE MIAMI CT
I 95 RAMP
NW 2N
D CT
I 395 RAMP
NW 2ND CT
SW 6TH ST
I 395 RAMP
SW 4TH ST
NE 12TH ST
NW 2ND ST
I 395 RAMP
NW 1S
T CT
I 95 RAMP
NW 9TH ST
NW 1ST CT
I 95 R
AMP
NW 2ND AVE
NW 4TH ST
I 95 RAMP
NW 11TH TER
NE 4TH ST
SW 3RD ST
NW 4TH ST
I 395 RAMP
I 95 RAMP
SW 1ST AVE
NW 4TH CT
§̈¦95
§̈¦395 [
Study Area
Cultural Centers
LEGEND
FIGURE C02 - CULTURAL CENTERSDowntown Miami Intermodal Terminal Feasibility Study
0 0.25 0.5 Miles
1 Minute Walk - 264ft
3 Minute Walk - 792ft
5 Minute Walk - 1320ft
PA G E 1 7 9

D O W N T O W N M I A M I I N T E R M O D A L T E R M I N A L F E A S I B I L I T Y S T U D Y
Miami Dade College
FIUI 95 EXPY
NE 1ST AVE
NE 2N
D AV
E
NW 3RD AVE
N MIAMI AVE
NW 1ST AVE
NW 2ND AVE
SW 1ST ST
NW 5TH ST
NW 6TH ST
NW 8TH ST
I 395 EXPY
NW 3RD ST
NW 11TH ST
BISCAYNE BLVD
NW 10TH ST
NE 13TH ST
NE 8TH ST
NW 3RD CT
SE 1ST ST
NE 1ST ST
NW 7TH ST
NW 5TH AVE
NW 1ST ST
NE 2ND ST
SE 2ND ST
NE 3RD ST
I 95 RAMP
NW 9TH ST
S MIAMI AVE
SW 2ND AVE
SW 6TH ST
SW 2ND ST
NW 11TH TER
SW 5T
H AV
E
NW 4TH AVE
NE 5TH ST
PORT BLVD
SW 3RD ST
NE 6TH ST
SW 5TH ST
NW 13TH ST
NE 9TH ST
SE 5TH ST
E FLAGLER ST
NE 7TH ST
NE 11TH ST
NW 12TH ST
SE 2ND AVE
NE 10TH ST
SW 4TH ST
NW 4TH ST
SW 4TH AVE
NW 2ND ST
SE 4TH ST
SE 3R
D AV
E
SE 6TH ST
NW N RIVER DR
MACARTHUR CSWY
W FLAGLER ST
NE 12TH ST
NW 1ST PL
SE 3RD ST
SE 1ST AVE
MAC ARTHUR RAMP
SW N RIVER DR
NE 4TH ST
I 395 RAMP
S BISCAYNE BLVD
SW 3R
D AV
E
NE 3RD AVE
BISCAYNE BOULEVARD WAY
SW S RIVER DR
NW S RIVER DR
CHOPIN PLZ
BRIC
KELL
AVE
NE 1ST CT
NE MIAMI CT
SW 1ST AVE
NE 11TH TER
NW 1S
T CT
NW 4T
H CT
NW 2ND CT
SW 1S
T CT
NW M
IAMI CT
NW 1S
T CT
NW 1ST CT
W FLAGLER ST
NW 1S
T AVE
NW M
IAMI
CT
SW 3RD STI 95 EXPY
NW 2N
D CT
I 95 RAMP
NW 9TH ST
NW 2ND CT
SW 6TH ST
I 395 RAMP
SW 2ND ST
NE 12TH ST
NW 2ND ST
I 395 RAMP I 395 RAMP
I 95 RAMPI 95 RAMP
NE 4TH ST
I 95 R
AMP
NW 2ND AVE
SW 4TH ST
NW 4TH ST
I 95 RAMP
NW 1ST CT
NW 11TH TERI 395 RAMP
NW 4TH ST
NE MIAMI CT
I 95 RAMP
SW 1ST AVE
NW 4TH CT
§̈¦95
§̈¦395 [
Study Area
Higher Education Buildings
LEGEND
FIGURE C03 - HIGHER EDUCATIONINSTITUTIONSDowntown Miami Intermodal Terminal Feasibility Study
0 0.25 0.5 Miles
1 Minute Walk - 264ft
3 Minute Walk - 792ft
5 Minute Walk - 1320ft
PA G E 1 8 0

D O W N T O W N M I A M I I N T E R M O D A L T E R M I N A L F E A S I B I L I T Y S T U D Y
American Airlines Arena
I 95 EXPY
NE 1ST AVE
NE 2N
D AV
E
NW 3RD AVE
N MIAMI AVE
NW 1ST AVE
NW 2ND AVE
SW 1ST ST
NW 5TH ST
NW 6TH ST
NW 8TH ST
I 395 EXPY
NW 3RD ST
NW 11TH ST
BISCAYNE BLVD
NW 10TH ST
NE 13TH ST
NE 8TH ST
NW 3RD CT
SE 1ST ST
NE 1ST ST
NW 7TH ST
NW 5TH AVE
NW 1ST ST
NE 2ND ST
SE 2ND ST
NE 3RD ST
I 95 RAMP
NW 9TH ST
S MIAMI AVE
SW 2ND AVE
SW 6TH ST
SW 2ND ST
NW 11TH TER
SW 5T
H AV
E
NW 4TH AVE
NE 5TH ST
PORT BLVD
SW 3RD ST
NE 6TH ST
SW 5TH ST
NW 13TH ST
NE 9TH ST
SE 5TH ST
E FLAGLER ST
NE 7TH ST
NE 11TH ST
NW 12TH ST
SE 2ND AVE
NE 10TH ST
SW 4TH ST
NW 4TH ST
SW 4TH AVE
NW 2ND ST
SE 4TH ST
SE 3R
D AV
E
SE 6TH ST
NW N RIVER DR
MACARTHUR CSWY
W FLAGLER ST
NE 12TH ST
NW 1ST PL
SE 3RD ST
SE 1ST AVE
MAC ARTHUR RAMP
SW N RIVER DR
NE 4TH ST
I 395 RAMP
S BISCAYNE BLVD
SW 3R
D AV
E
NE 3RD AVE
BISCAYNE BOULEVARD WAY
SW S RIVER DR
NW S RIVER DR
CHOPIN PLZ
BRIC
KELL
AVE
NE 1ST CT
NE MIAMI CT
SW 1ST AVE
NE 11TH TER
NW 1S
T CT
NW 4T
H CT
NW 2ND CT
SW 1S
T CT
NW M
IAMI CT
NW 1S
T CT
NW 1ST CT
W FLAGLER ST
NW 1S
T AVE
NW M
IAMI
CT
SW 3RD STI 95 EXPY
NW 2N
D CT
I 95 RAMP
NW 9TH ST
NW 2ND CT
SW 6TH ST
I 395 RAMP
SW 2ND ST
NE 12TH ST
NW 2ND ST
I 395 RAMP I 395 RAMP
I 95 RAMPI 95 RAMP
NE 4TH ST
I 95 R
AMP
NW 2ND AVE
SW 4TH ST
NW 4TH ST
I 95 RAMP
NW 1ST CT
NW 11TH TERI 395 RAMP
NW 4TH ST
NE MIAMI CT
I 95 RAMP
SW 1ST AVE
NW 4TH CT
§̈¦95
§̈¦395 [
Study Area
American Airlines Arena
LEGEND
FIGURE C04 - SPORTS ARENADowntown Miami Intermodal Terminal Feasibility Study
0 0.25 0.5 Miles
1 Minute Walk - 264ft
3 Minute Walk - 792ft
5 Minute Walk - 1320ft
PA G E 1 8 1

D O W N T O W N M I A M I I N T E R M O D A L T E R M I N A L F E A S I B I L I T Y S T U D Y
Paul S Walker Park
Miami River Walk
Lummus Park
Lummus Park
Jose Marti Park
Jose Marti Park
Jose Marti Park
Henry Reeves Park
Grand Central Park
Gibson Park Recreation
Fort Dallas Mini Park
Bicentennial Park
Bayfront Park
I 95 EXPY
NE 1ST AVE
NE 2N
D AV
E
NW 3RD AVE
N MIAMI AVE
NW 1ST AVE
NW 2ND AVE
SW 1ST ST
NW 5TH ST
NW 6TH ST
NW 8TH ST
I 395 EXPY
NW 3RD ST
NW 11TH ST
BISCAYNE BLVD
NW 10TH ST
NE 13TH ST
NE 8TH ST
NW 3RD CT
SE 1ST ST
NE 1ST ST
NW 7TH ST
NW 5TH AVE
NW 1ST ST
NE 2ND ST
SE 2ND ST
NE 3RD ST
I 95 RAMP
NW 9TH ST
S MIAMI AVE
SW 2ND AVE
SW 6TH ST
SW 2ND ST
NW 11TH TER
SW 5T
H AV
E
NW 4TH AVE
NE 5TH ST
PORT BLVD
SW 3RD ST
NE 6TH ST
SW 5TH ST
NW 13TH ST
NE 9TH ST
SE 5TH ST
E FLAGLER ST
NE 7TH ST
NE 11TH ST
NW 12TH ST
SE 2ND AVE
NE 10TH ST
SW 4TH ST
NW 4TH ST
SW 4TH AVE
NW 2ND ST
SE 4TH ST
SE 3R
D AV
E
SE 6TH ST
NW N RIVER DR
MACARTHUR CSWY
W FLAGLER ST
NE 12TH ST
NW 1ST PL
SE 3RD ST
SE 1ST AVE
MAC ARTHUR RAMP
SW N RIVER DR
NE 4TH ST
I 395 RAMP
S BISCAYNE BLVD
NE 3RD AVE
BISCAYNE BOULEVARD WAY
SW S RIVER DR
NW S RIVER DR
CHOPIN PLZ
NE 1ST CT
NE MIAMI CT
SW 1ST AVE
NE 11TH TER
NW 1S
T CT
NW 4T
H CT
NW 2ND CT
SW 1S
T CT
NW M
IAMI CT
NW 1S
T CT
NW 1ST CT
W FLAGLER ST
NW 1S
T AVE
NW M
IAMI
CT
SW 3RD STI 95 EXPY
NW 2N
D CT
I 95 RAMP
NW 9TH ST
NW 2ND CT
SW 6TH ST
I 395 RAMP
SW 2ND ST
NE 12TH ST
NW 2ND ST
I 395 RAMP I 395 RAMP
I 95 RAMP
I 95 RAMP
NE 4TH ST
I 95 R
AMP
NW 2ND AVE
SW 4TH ST
NW 4TH ST
I 95 RAMP
NW 1ST CT
NW 11TH TERI 395 RAMP
NW 4TH ST
NE MIAMI CT
I 95 RAMP
SW 1ST AVE
NW 4TH CT
§̈¦95
§̈¦395 [
Study Area
Parks
LEGEND
FIGURE C05 - PARKSDowntown Miami Intermodal Terminal Feasibility Study
0 0.25 0.5 Miles
1 Minute Walk - 264ft
3 Minute Walk - 792ft
5 Minute Walk - 1320ft
PA G E 1 8 2

D O W N T O W N M I A M I I N T E R M O D A L T E R M I N A L F E A S I B I L I T Y S T U D Y
I 95 EXPY
NE 1ST AVE
NE 2N
D AV
E
NW 3RD AVE
N MIAMI AVE
NW 1ST AVE
NW 2ND AVE
SW 1ST ST
NW 5TH ST
NW 6TH ST
NW 8TH ST
I 395 EXPY
NW 3RD ST
NW 11TH ST
BISCAYNE BLVD
NW 10TH ST
NE 13TH ST
NE 8TH ST
NW 3RD CT
SE 1ST ST
NE 1ST ST
NW 7TH ST
NW 5TH AVE
NW 1ST ST
NE 2ND ST
SE 2ND ST
NE 3RD ST
I 95 RAMP
NW 9TH ST
S MIAMI AVE
SW 2ND AVE
SW 6TH ST
SW 2ND ST
NW 11TH TER
SW 5T
H AV
E
NW 4TH AVE
NE 5TH ST
PORT BLVD
SW 3RD ST
NE 6TH ST
SW 5TH ST
NW 13TH ST
NE 9TH ST
SE 5TH ST
E FLAGLER ST
NE 7TH ST
NE 11TH ST
NW 12TH ST
SE 2ND AVE
NE 10TH ST
SW 4TH ST
NW 4TH ST
SW 4TH AVE
NW 2ND ST
SE 4TH ST
SE 3R
D AV
E
SE 6TH ST
NW N RIVER DR
MACARTHUR CSWY
W FLAGLER ST
NE 12TH ST
NW 1ST PL
SE 3RD ST
SE 1ST AVE
MAC ARTHUR RAMP
SW N RIVER DR
NE 4TH ST
I 395 RAMP
S BISCAYNE BLVD
SW 3R
D AV
E
NE 3RD AVE
BISCAYNE BOULEVARD WAY
SW S RIVER DR
NW S RIVER DR
CHOPIN PLZ
BRIC
KELL
AVE
NE 1ST CT
NE MIAMI CT
SW 1ST AVE
NE 11TH TER
NW 1S
T CT
NW 4T
H CT
NW 2ND CT
SW 1S
T CT
NW M
IAMI CT
NW 1S
T CT
NW 1ST CT
W FLAGLER ST
NW 1S
T AVE
NW M
IAMI
CT
SW 3RD STI 95 EXPY
NW 2N
D CT
I 95 RAMP
NW 9TH ST
NW 2ND CT
SW 6TH ST
I 395 RAMP
SW 2ND ST
NE 12TH ST
NW 2ND ST
I 395 RAMP I 395 RAMP
I 95 RAMPI 95 RAMP
NE 4TH ST
I 95 R
AMP
NW 2ND AVE
SW 4TH ST
NW 4TH ST
I 95 RAMP
NW 1ST CT
NW 11TH TERI 395 RAMP
NW 4TH ST
NE MIAMI CT
I 95 RAMP
SW 1ST AVE
NW 4TH CT
§̈¦95
§̈¦395 [
Study Area
Vacant Land
Parking Lots
LEGEND
FIGURE C06 - VACANT LAND &PARKING LOTSDowntown Miami Intermodal Terminal Feasibility Study
0 0.25 0.5 Miles
Note: The Vacant Land and Parking Lot layers were created from DOR codesin the Parcel file. Some polygons do not appear to accurately reflect the actualland use. The data may be old, or the DOR codes may be inaccurate. Furtheranalysis is required.
PA G E 1 8 3

D O W N T O W N M I A M I I N T E R M O D A L T E R M I N A L F E A S I B I L I T Y S T U D Y
I 95 EXPY
NE 1ST AVE
NE 2N
D AV
E
NW 3RD AVE
N MIAMI AVE
NW 1ST AVE
NW 2ND AVE
SW 1ST ST
NW 5TH ST
NW 6TH ST
NW 8TH ST
I 395 EXPY
NW 3RD ST
NW 11TH ST
BISCAYNE BLVD
NW 10TH ST
NE 13TH ST
NE 8TH ST
NW 3RD CT
SE 1ST ST
NE 1ST ST
NW 7TH ST
NW 5TH AVE
NW 1ST ST
NE 2ND ST
SE 2ND ST
NE 3RD ST
I 95 RAMP
NW 9TH ST
S MIAMI AVE
SW 2ND AVE
SW 6TH ST
SW 2ND ST
NW 11TH TER
SW 5T
H AV
E
NW 4TH AVE
NE 5TH ST
PORT BLVD
SW 3RD ST
NE 6TH ST
SW 5TH ST
NW 13TH ST
NE 9TH ST
SE 5TH ST
E FLAGLER ST
NE 7TH ST
NE 11TH ST
NW 12TH ST
SE 2ND AVE
NE 10TH ST
SW 4TH ST
NW 4TH ST
SW 4TH AVE
NW 2ND ST
SE 4TH ST
SE 3R
D AV
E
SE 6TH ST
NW N RIVER DR
MACARTHUR CSWY
W FLAGLER ST
NE 12TH ST
NW 1ST PL
SE 3RD ST
SE 1ST AVE
MAC ARTHUR RAMP
SW N RIVER DR
NE 4TH ST
I 395 RAMP
S BISCAYNE BLVD
SW 3R
D AV
E
NE 3RD AVE
BISCAYNE BOULEVARD WAY
SW S RIVER DR
NW S RIVER DR
CHOPIN PLZ
BRIC
KELL
AVE
NE 1ST CT
NE MIAMI CT
SW 1ST AVE
NE 11TH TER
NW 1S
T CT
NW 4T
H CT
NW 2ND CT
SW 1S
T CT
NW M
IAMI CT
NW 1S
T CT
NW 1ST CT
W FLAGLER ST
NW 1S
T AVE
NW M
IAMI
CT
SW 3RD STI 95 EXPY
NW 2N
D CT
I 95 RAMP
NW 9TH ST
NW 2ND CT
SW 6TH ST
I 395 RAMP
SW 2ND ST
NE 12TH ST
NW 2ND ST
I 395 RAMP I 395 RAMP
I 95 RAMPI 95 RAMP
NE 4TH ST
I 95 R
AMP
NW 2ND AVE
SW 4TH ST
NW 4TH ST
I 95 RAMP
NW 1ST CT
NW 11TH TERI 395 RAMP
NW 4TH ST
NE MIAMI CT
I 95 RAMP
SW 1ST AVE
NW 4TH CT
§̈¦95
§̈¦395 [
Study Area
Allowed by PZB Exception
Allowed by Admin. Warrant
LEGEND
FIGURE C07 - COMPATIBLE LAND USESDowntown Miami Intermodal Terminal Feasibility Study
0 0.25 0.5 Miles
PA G E 1 8 4

D O W N T O W N M I A M I I N T E R M O D A L T E R M I N A L F E A S I B I L I T Y S T U D Y
[
Study Area
LEGEND
FIGURE C08 - HIGH EMPLOYMENT ZONESDowntown Miami Intermodal Terminal Feasibility Study
0 0.25 0.5 Miles
TAZ - 2010 Employment0 - 100
101 - 200
201 - 300
301 - 400
401 - 500
501 - 600
601 - 700
701 - 800
801 - 900
901+
PA G E 1 8 5

D O W N T O W N M I A M I I N T E R M O D A L T E R M I N A L F E A S I B I L I T Y S T U D Y
!(
!(
MIAMI STATION 1
Miami (Headquarters)
I 95 EXPY
NE 1ST AVE
NE 2N
D AV
E
NW 3RD AVE
N MIAMI AVE
NW 1ST AVE
NW 2ND AVE
SW 1ST ST
NW 5TH ST
NW 6TH ST
NW 8TH ST
I 395 EXPY
NW 3RD ST
NW 11TH ST
BISCAYNE BLVD
NW 10TH ST
NE 13TH ST
NE 8TH ST
NW 3RD CT
SE 1ST ST
NE 1ST ST
NW 7TH ST
NW 5TH AVE
NW 1ST ST
NE 2ND ST
SE 2ND ST
NE 3RD ST
I 95 RAMP
NW 9TH ST
S MIAMI AVE
SW 2ND AVE
SW 6TH ST
SW 2ND ST
NW 11TH TER
SW 5T
H AV
E
NW 4TH AVE
NE 5TH ST
PORT BLVD
SW 3RD ST
NE 6TH ST
SW 5TH ST
NW 13TH ST
NE 9TH ST
SE 5TH ST
E FLAGLER ST
NE 7TH ST
NE 11TH ST
NW 12TH ST
SE 2ND AVE
NE 10TH ST
SW 4TH ST
NW 4TH ST
SW 4TH AVE
NW 2ND ST
SE 4TH ST
SE 3R
D AV
E
SE 6TH ST
NW N RIVER DR
MACARTHUR CSWY
W FLAGLER ST
NE 12TH ST
NW 1ST PL
SE 3RD ST
SE 1ST AVE
MAC ARTHUR RAMP
SW N RIVER DR
NE 4TH ST
I 395 RAMP
S BISCAYNE BLVD
SW 3R
D AV
E
NE 3RD AVE
BISCAYNE BOULEVARD WAY
SW S RIVER DR
NW S RIVER DR
CHOPIN PLZ
BRIC
KELL
AVE
NE 1ST CT
NE MIAMI CT
SW 1ST AVE
NE 11TH TER
NW 1S
T CT
NW 4T
H CT
NW 2ND CT
SW 1S
T CT
NW M
IAMI CT
NW 1S
T CT
NW 1ST CT
W FLAGLER ST
NW 1S
T AVE
NW M
IAMI
CT
SW 3RD STI 95 EXPY
NW 2N
D CT
I 95 RAMP
NW 9TH ST
NW 2ND CT
SW 6TH ST
I 395 RAMP
SW 2ND ST
NE 12TH ST
NW 2ND ST
I 395 RAMP I 395 RAMP
I 95 RAMPI 95 RAMP
NE 4TH ST
I 95 R
AMP
NW 2ND AVE
SW 4TH ST
NW 4TH ST
I 95 RAMP
NW 1ST CT
NW 11TH TERI 395 RAMP
NW 4TH ST
NE MIAMI CT
I 95 RAMP
SW 1ST AVE
NW 4TH CT
[
Study Area !( Police Station
!( Fire StationPolice Station Setback - 2640ftFire Station Setback - 2640ft
LEGEND
FIGURE C09 - EMERGENCY RESPONSEDowntown Miami Intermodal Terminal Feasibility Study
0 0.25 0.5 Miles
PA G E 1 8 6

D O W N T O W N M I A M I I N T E R M O D A L T E R M I N A L F E A S I B I L I T Y S T U D Y
SE Overtown/Park West
I 95 EXPY
NE 1ST AVE
NE 2N
D AV
E
NW 3RD AVE
N MIAMI AVE
NW 1ST AVE
NW 2ND AVE
SW 1ST ST
NW 5TH ST
NW 6TH ST
NW 8TH ST
I 395 EXPY
NW 3RD ST
NW 11TH ST
BISCAYNE BLVD
NW 10TH ST
NE 13TH ST
NE 8TH ST
NW 3RD CT
SE 1ST ST
NE 1ST ST
NW 7TH ST
NW 5TH AVE
NW 1ST ST
NE 2ND ST
SE 2ND ST
NE 3RD ST
I 95 RAMP
NW 9TH ST
S MIAMI AVE
SW 2ND AVE
SW 6TH ST
SW 2ND ST
NW 11TH TER
SW 5T
H AV
E
NW 4TH AVE
NE 5TH ST
PORT BLVD
SW 3RD ST
NE 6TH ST
SW 5TH ST
NW 13TH ST
NE 9TH ST
SE 5TH ST
E FLAGLER ST
NE 7TH ST
NE 11TH ST
NW 12TH ST
SE 2ND AVE
NE 10TH ST
SW 4TH ST
NW 4TH ST
SW 4TH AVE
NW 2ND ST
SE 4TH ST
SE 3R
D AV
E
SE 6TH ST
NW N RIVER DR
MACARTHUR CSWY
W FLAGLER ST
NE 12TH ST
NW 1ST PL
SE 3RD ST
SE 1ST AVE
MAC ARTHUR RAMP
SW N RIVER DR
NE 4TH ST
I 395 RAMP
S BISCAYNE BLVD
SW 3R
D AV
E
NE 3RD AVE
BISCAYNE BOULEVARD WAY
SW S RIVER DR
NW S RIVER DR
CHOPIN PLZ
BRIC
KELL
AVE
NE 1ST CT
NE MIAMI CT
SW 1ST AVE
NE 11TH TER
NW 1ST CT
NW 4T
H CT
NW 2ND CT
SW 1S
T CT
NW M
IAMI CT
I 95 EXPY
NW 1S
T AVE
NW M
IAMI
CT
I 95 RAMP
W FLAGLER ST
SW 2ND ST
NE MIAMI CT
I 95 RAMP
NW 2N
D CT
I 395 RAMP
NW 2ND CT
SW 6TH ST
I 395 RAMP
SW 4TH ST
NE 12TH ST
NW 2ND ST
I 395 RAMP
NW 1S
T CT
I 95 RAMP
NW 9TH ST
NW 1ST CT
I 95 R
AMP
NW 2ND AVE
NW 4TH ST
I 95 RAMP
NW 11TH TER
NE 4TH ST
SW 3RD ST
NW 4TH ST
I 395 RAMP
I 95 RAMP
SW 1ST AVE
NW 4TH CT
[
Study AreaSE Overtown/Park West Community Redevelopment Area
LEGEND
FIGURE C10 - COMMUNITYREDEVELOPMENT AREASDowntown Miami Intermodal Terminal Feasibility Study
0 0.25 0.5 Miles
PA G E 1 8 7

D O W N T O W N M I A M I I N T E R M O D A L T E R M I N A L F E A S I B I L I T Y S T U D Y
NORTH CENTRAL
I 95 EXPY
NE 1ST AVE
NE 2N
D AV
E
NW 3RD AVE
N MIAMI AVE
NW 1ST AVE
NW 2ND AVE
SW 1ST ST
NW 5TH ST
NW 6TH ST
NW 8TH ST
I 395 EXPY
NW 3RD ST
NW 11TH STBISCAYNE BLVD
NW 10TH ST
NE 13TH ST
NE 8TH ST
NW 3RD CT
SE 1ST ST
NE 1ST ST
NW 7TH ST
NW 5TH AVE
NW 1ST ST
NE 2ND ST
SE 2ND ST
NE 3RD ST
I 95 RAMP
NW 9TH ST
S MIAMI AVE
SW 2ND AVE
SW 6TH ST
SW 2ND ST
NW 11TH TER
SW 5T
H AV
E
NW 4TH AVE
NE 5TH ST
PORT BLVD
SW 3RD ST
NE 6TH ST
SW 5TH ST
NW 13TH ST
NE 9TH ST
SE 5TH ST
E FLAGLER ST
NE 7TH ST
NE 11TH ST
NW 12TH ST
SE 2ND AVE
NE 10TH ST
SW 4TH ST
NW 4TH ST
SW 4TH AVE
NW 2ND ST
SE 4TH ST
SE 3R
D AV
E
SE 6TH ST
NW N RIVER DR
MACARTHUR CSWY
W FLAGLER ST
NE 12TH ST
NW 1ST PL
SE 3RD ST
SE 1ST AVE
MAC ARTHUR RAMP
SW N RIVER DR
NE 4TH ST
I 395 RAMP
S BISCAYNE BLVD
SW 3R
D AV
E
NE 3RD AVE
BISCAYNE BOULEVARD WAY
SW S RIVER DR
NW S RIVER DR
CHOPIN PLZ
BRIC
KELL
AVE
NE 1ST CT
NE MIAMI CT
SW 1ST AVE
NE 11TH TER
NW 1S
T CT
NW 4T
H CT
NW 2ND CT
SW 1S
T CT
NW M
IAMI CT
NW 1S
T CT
NW 1ST CT
W FLAGLER ST
NW 1S
T AVE
NW M
IAMI
CT
SW 3RD STI 95 EXPY
NW 2N
D CT
I 95 RAMP
NW 9TH ST
NW 2ND CT
SW 6TH ST
I 395 RAMP
SW 2ND ST
NE 12TH ST
NW 2ND ST
I 395 RAMP I 395 RAMP
I 95 RAMPI 95 RAMP
NE 4TH ST
I 95 R
AMP
NW 2ND AVE
SW 4TH ST
NW 4TH ST
I 95 RAMP
NW 1ST CT
NW 11TH TERI 395 RAMP
NW 4TH ST
NE MIAMI CT
I 95 RAMP
SW 1ST AVE
NW 4TH CT
[
Study AreaNorth Central Empowerment Zone
LEGEND
FIGURE C11 - EMPOWERMENT ZONESDowntown Miami Intermodal Terminal Feasibility Study
0 0.25 0.5 Miles
PA G E 1 8 8

D O W N T O W N M I A M I I N T E R M O D A L T E R M I N A L F E A S I B I L I T Y S T U D Y
CENTRAL
I 95 EXPY
NE 1ST AVE
NE 2N
D AV
E
NW 3RD AVE
N MIAMI AVE
NW 1ST AVE
NW 2ND AVE
SW 1ST ST
NW 5TH ST
NW 6TH ST
NW 8TH ST
I 395 EXPY
NW 3RD ST
NW 11TH STBISCAYNE BLVD
NW 10TH ST
NE 13TH ST
NE 8TH ST
NW 3RD CT
SE 1ST ST
NE 1ST ST
NW 7TH ST
NW 5TH AVE
NW 1ST ST
NE 2ND ST
SE 2ND ST
NE 3RD ST
I 95 RAMP
NW 9TH ST
S MIAMI AVE
SW 2ND AVE
SW 6TH ST
SW 2ND ST
NW 11TH TER
SW 5T
H AV
E
NW 4TH AVE
NE 5TH ST
PORT BLVD
SW 3RD ST
NE 6TH ST
SW 5TH ST
NW 13TH ST
NE 9TH ST
SE 5TH ST
E FLAGLER ST
NE 7TH ST
NE 11TH ST
NW 12TH ST
SE 2ND AVE
NE 10TH ST
SW 4TH ST
NW 4TH ST
SW 4TH AVE
NW 2ND ST
SE 4TH ST
SE 3R
D AV
E
SE 6TH ST
NW N RIVER DR
MACARTHUR CSWY
W FLAGLER ST
NE 12TH ST
NW 1ST PL
SE 3RD ST
SE 1ST AVE
MAC ARTHUR RAMP
SW N RIVER DR
NE 4TH ST
I 395 RAMP
S BISCAYNE BLVD
SW 3R
D AV
E
NE 3RD AVE
BISCAYNE BOULEVARD WAY
SW S RIVER DR
NW S RIVER DR
CHOPIN PLZ
BRIC
KELL
AVE
NE 1ST CT
NE MIAMI CT
SW 1ST AVE
NE 11TH TER
NW 1S
T CT
NW 4T
H CT
NW 2ND CT
SW 1S
T CT
NW M
IAMI CT
NW 1S
T CT
NW 1ST CT
W FLAGLER ST
NW 1S
T AVE
NW M
IAMI
CT
SW 3RD STI 95 EXPY
NW 2N
D CT
I 95 RAMP
NW 9TH ST
NW 2ND CT
SW 6TH ST
I 395 RAMP
SW 2ND ST
NE 12TH ST
NW 2ND ST
I 395 RAMP I 395 RAMP
I 95 RAMPI 95 RAMP
NE 4TH ST
I 95 R
AMP
NW 2ND AVE
SW 4TH ST
NW 4TH ST
I 95 RAMP
NW 1ST CT
NW 11TH TERI 395 RAMP
NW 4TH ST
NE MIAMI CT
I 95 RAMP
SW 1ST AVE
NW 4TH CT
[
Study AreaCentral Enterprise Zone
LEGEND
FIGURE C12 - ENTERPRISE ZONESDowntown Miami Intermodal Terminal Feasibility Study
0 0.25 0.5 Miles
PA G E 1 8 9

D O W N T O W N M I A M I I N T E R M O D A L T E R M I N A L F E A S I B I L I T Y S T U D Y
I 95 EXPY
NE 1ST AVE
NE 2N
D AV
E
NW 3RD AVE
N MIAMI AVE
NW 1ST AVE
NW 2ND AVE
SW 1ST ST
NW 5TH ST
NW 6TH ST
NW 8TH ST
I 395 EXPY
NW 3RD ST
NW 11TH STBISCAYNE BLVD
NW 10TH ST
NE 13TH ST
NE 8TH ST
NW 3RD CT
SE 1ST ST
NE 1ST ST
NW 7TH ST
NW 5TH AVE
NW 1ST ST
NE 2ND ST
SE 2ND ST
NE 3RD ST
I 95 RAMP
NW 9TH ST
S MIAMI AVE
SW 2ND AVE
SW 6TH ST
SW 2ND ST
NW 11TH TER
SW 5T
H AV
E
NW 4TH AVE
NE 5TH ST
PORT BLVD
SW 3RD ST
NE 6TH ST
SW 5TH ST
NW 13TH ST
NE 9TH ST
SE 5TH ST
E FLAGLER ST
NE 7TH ST
NE 11TH ST
NW 12TH ST
SE 2ND AVE
NE 10TH ST
SW 4TH ST
NW 4TH ST
SW 4TH AVE
NW 2ND ST
SE 4TH ST
SE 3R
D AV
E
SE 6TH ST
NW N RIVER DR
MACARTHUR CSWY
W FLAGLER ST
NE 12TH ST
NW 1ST PL
SE 3RD ST
SE 1ST AVE
MAC ARTHUR RAMP
SW N RIVER DR
NE 4TH ST
I 395 RAMP
S BISCAYNE BLVD
SW 3R
D AV
E
NE 3RD AVE
BISCAYNE BOULEVARD WAY
SW S RIVER DR
NW S RIVER DR
CHOPIN PLZ
BRIC
KELL
AVE
NE 1ST CT
NE MIAMI CT
SW 1ST AVE
NE 11TH TER
NW 1S
T CT
NW 4T
H CT
NW 2ND CT
SW 1S
T CT
NW M
IAMI CT
NW 1S
T CT
NW 1ST CT
W FLAGLER ST
NW 1S
T AVE
NW M
IAMI
CT
SW 3RD STI 95 EXPY
NW 2N
D CT
I 95 RAMP
NW 9TH ST
NW 2ND CT
SW 6TH ST
I 395 RAMP
SW 2ND ST
NE 12TH ST
NW 2ND ST
I 395 RAMP I 395 RAMP
I 95 RAMPI 95 RAMP
NE 4TH ST
I 95 R
AMP
NW 2ND AVE
SW 4TH ST
NW 4TH ST
I 95 RAMP
NW 1ST CT
NW 11TH TERI 395 RAMP
NW 4TH ST
NE MIAMI CT
I 95 RAMP
SW 1ST AVE
NW 4TH CT
§̈¦95
§̈¦395 [
Study Area
100-Yr Floodplain
500-Yr Floodplain
LEGEND
FIGURE D01 - FLOODPLAINSDowntown Miami Intermodal Terminal Feasibility Study
0 0.25 0.5 Miles
PA G E 1 9 0

D O W N T O W N M I A M I I N T E R M O D A L T E R M I N A L F E A S I B I L I T Y S T U D Y
I 95 EXPY
NE 1ST AVE
NE 2N
D AV
E
NW 3RD AVE
N MIAMI AVE
NW 1ST AVE
NW 2ND AVE
SW 1ST ST
NW 5TH ST
NW 6TH ST
NW 8TH ST
I 395 EXPY
NW 3RD ST
NW 11TH ST
BISCAYNE BLVD
NW 10TH ST
NE 13TH ST
NE 8TH ST
NW 3RD CT
SE 1ST ST
NE 1ST ST
NW 7TH ST
NW 5TH AVE
NW 1ST ST
NE 2ND ST
SE 2ND ST
NE 3RD ST
I 95 RAMP
NW 9TH ST
S MIAMI AVE
SW 2ND AVE
SW 6TH ST
SW 2ND ST
NW 11TH TER
SW 5T
H AV
E
NW 4TH AVE
NE 5TH ST
PORT BLVD
SW 3RD ST
NE 6TH ST
SW 5TH ST
NW 13TH ST
NE 9TH ST
SE 5TH ST
E FLAGLER ST
NE 7TH ST
NE 11TH ST
NW 12TH ST
SE 2ND AVE
NE 10TH ST
SW 4TH ST
NW 4TH ST
SW 4TH AVE
NW 2ND ST
SE 4TH ST
SE 3R
D AV
E
SE 6TH ST
NW N RIVER DR
MACARTHUR CSWY
W FLAGLER ST
NE 12TH ST
NW 1ST PL
SE 3RD ST
SE 1ST AVE
MAC ARTHUR RAMP
SW N RIVER DR
NE 4TH ST
I 395 RAMP
S BISCAYNE BLVDSW
3RD
AVE
NE 3RD AVE
BISCAYNE BOULEVARD WAY
SW S RIVER DR
NW S RIVER DR
CHOPIN PLZ
BRIC
KELL
AVE
NE 1ST CT
NE MIAMI CT
SW 1ST AVE
NE 11TH TER
NW 1S
T CT
NW 4T
H CT
NW 2ND CT
SW 1S
T CT
NW M
IAMI CT
NW 1S
T CT
NW 1ST CT
W FLAGLER ST
NW 1S
T AVE
NW M
IAMI
CT
SW 3RD STI 95 EXPY
NW 2N
D CT
I 95 RAMP
NW 9TH ST
NW 2ND CT
SW 6TH ST
I 395 RAMP
SW 2ND ST
NE 12TH ST
NW 2ND ST
I 395 RAMP I 395 RAMP
I 95 RAMPI 95 RAMP
NE 4TH ST
I 95 R
AMP
NW 2ND AVE
SW 4TH ST
NW 4TH ST
I 95 RAMP
NW 1ST CT
NW 11TH TERI 395 RAMP
NW 4TH ST
NE MIAMI CT
I 95 RAMP
SW 1ST AVE
NW 4TH CT
§̈¦95
§̈¦395 [
Study Area
Freight Rail
LEGEND
FIGURE D02 - FREIGHT RAILDowntown Miami Intermodal Terminal Feasibility Study
0 0.25 0.5 Miles
Freight Rail Setback - 250ft
Freight Rail Setback - 500ft
PA G E 1 9 1

D O W N T O W N M I A M I I N T E R M O D A L T E R M I N A L F E A S I B I L I T Y S T U D Y
!
!
!
!
!
!
!
!!!
!
!
!
!
!
!INGRAHAM BLDG.
NEW WORLD TOWERLEAMINGTON HOTEL
FREEDOM TOWER CMIAMI REVIEW, INC
GSA FLEET MANAGEMENT
BAYFRONT AUTO REPAIR
MDCC-NIERENBERG PROPERTYPARKLEIGH APARTMENT HOUSE
USA GSA FEDERAL COURTHOUSE
DOWNTOWN AUTO SERVICE CENTER
CITY OF MIAMI - SAWYER PROP.
DCPS-NEVA KING COOPER (UST#2)
CITY OF MIAMI-POLICE MOTOR POOL
CITY OF MIAMI/PROPOSED CHILDRENS COURTHOUSE
I 95 EXPY
NE 1ST AVE
NE 2N
D AV
E
NW 3RD AVE
N MIAMI AVE
NW 1ST AVE
NW 2ND AVE
SW 1ST ST
NW 5TH ST
NW 6TH ST
NW 8TH ST
I 395 EXPY
NW 3RD ST
NW 11TH ST
BISCAYNE BLVD
NW 10TH ST
NE 13TH ST
NE 8TH ST
NW 3RD CT
SE 1ST ST
NE 1ST ST
NW 7TH ST
NW 5TH AVE
NW 1ST ST
NE 2ND ST
SE 2ND ST
NE 3RD ST
I 95 RAMP
NW 9TH ST
S MIAMI AVE
SW 2ND AVE
SW 6TH ST
SW 2ND ST
NW 11TH TER
SW 5T
H AV
E
NW 4TH AVE
NE 5TH ST
PORT BLVD
SW 3RD ST
SW 5TH ST
NW 13TH ST
NE 9TH ST
SE 5TH ST
E FLAGLER ST
NE 7TH ST
NE 11TH ST
NW 12TH ST
SE 2ND AVE
NE 10TH ST
SW 4TH ST
NW 4TH ST
SW 4TH AVE
NW 2ND ST
SE 4TH ST SE 3R
D AV
E
SE 6TH ST
NW N RIVER DR
MACARTHUR CSWY
W FLAGLER ST
NE 12TH ST
NW 1ST PL
SE 3RD ST
SE 1ST AVE
MAC ARTHUR RAMP
SW N RIVER DR
NE 4TH ST
I 395 RAMP
S BISCAYNE BLVDSW
3RD
AVE
NE 3RD AVE
BISCAYNE BOULEVARD WAY
SW S RIVER DR
NW S RIVER DR
CHOPIN PLZ
BRIC
KELL
AVE
NE 1ST CT
NE MIAMI CT
SW 1ST AVE
NE 11TH TER
NW 1ST CT
NW 4T
H CT
NW 2ND CT
SW 1S
T CT
NW M
IAMI CT
I 95 EXPY
NW 1S
T AVE
NW M
IAMI
CT
I 95 RAMP
W FLAGLER ST
SW 2ND ST
NE MIAMI CT
I 95 RAMP
NW 2N
D CT
I 395 RAMP
NW 2ND CT
SW 6TH ST
I 395 RAMP
SW 4TH ST
NE 12TH ST
NW 2ND ST
I 395 RAMP
NW 1S
T CT
I 95 RAMP
NW 9TH ST
NW 1ST CT
I 95 R
AMP
NW 2ND AVE
NW 4TH ST
I 95 RAMP
NW 11TH TER
NE 4TH ST
SW 3RD ST
I 395 RAMP
I 95 RAMP
SW 1ST AVE
NW 4TH CT
§̈¦95
§̈¦395 [
Study Area
! Contaminated Sites in the Study Area
Contaminated Parcels in the Study Area
LEGEND
FIGURE D03 - CONTAMINATED SITESDowntown Miami Intermodal Terminal Feasibility Study
0 0.25 0.5 Miles
PA G E 1 9 2

D O W N T O W N M I A M I I N T E R M O D A L T E R M I N A L F E A S I B I L I T Y S T U D Y PA G E 1 9 3
AOC
Composite:Development
Suitability
Red + OrangesMost Desirable
GreensLeast
Desirable
D O W N T O W N M I A M I I N T E R M O D A L T E R M I N A L F E A S I B I L I T Y S T U D Y
THIS PAGE INTENTIONALLY LEFT BLANK
PA G E 1 9 4
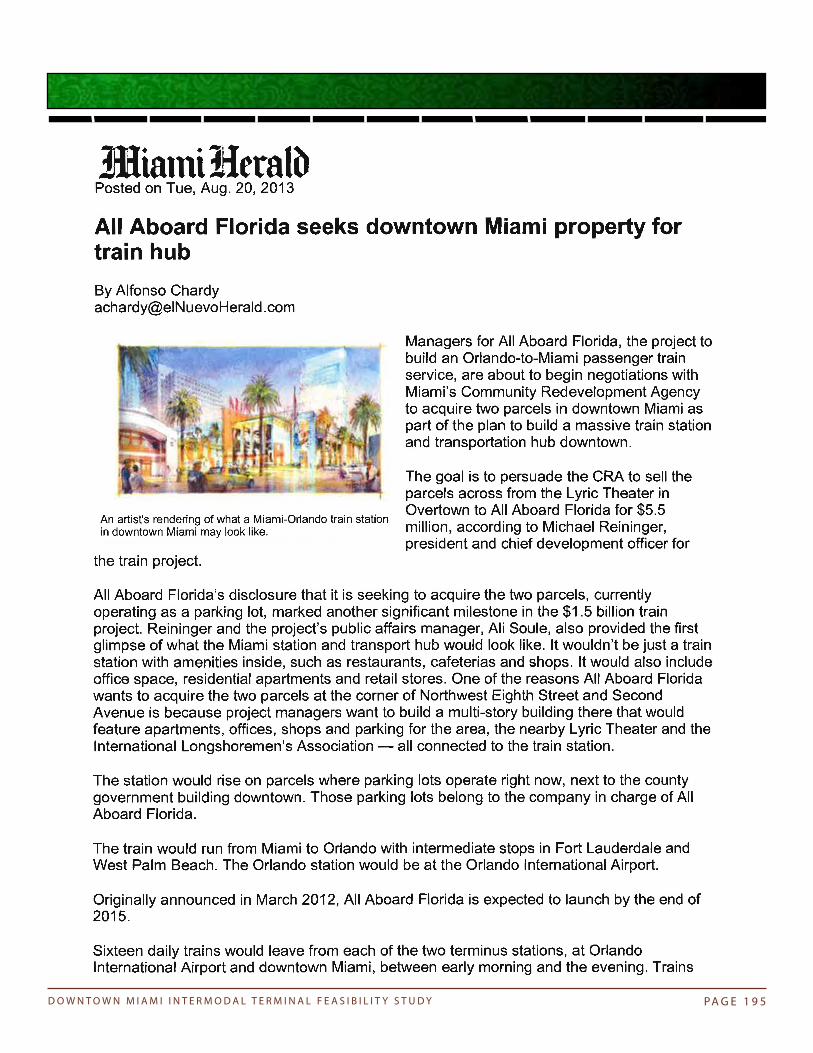
D O W N T O W N M I A M I I N T E R M O D A L T E R M I N A L F E A S I B I L I T Y S T U D Y PA G E 1 9 5

D O W N T O W N M I A M I I N T E R M O D A L T E R M I N A L F E A S I B I L I T Y S T U D Y PA G E 1 9 6

D O W N T O W N M I A M I I N T E R M O D A L T E R M I N A L F E A S I B I L I T Y S T U D Y PA G E 1 9 7

D O W N T O W N M I A M I I N T E R M O D A L T E R M I N A L F E A S I B I L I T Y S T U D Y PA G E 1 9 8

D O W N T O W N M I A M I I N T E R M O D A L T E R M I N A L F E A S I B I L I T Y S T U D Y PA G E 1 9 9
Orlando-to-Miami train could generate $145 million
December 25, 2012 By Dan Tracy, Orlando Sentinel

D O W N T O W N M I A M I I N T E R M O D A L T E R M I N A L F E A S I B I L I T Y S T U D Y PA G E 2 0 0
Fast rail on trackMiami-Orlando passenger line set to debut in 2015BY MICHAEL TURNBELL Staff writer
Monday, December 10, 2012 - SunSentinel
A new passenger rail service is on track to begin in 2015, whisking trav-elers from Miami to Orlando, while offering hourly trains, gourmet meals and Wi-Fi. The $1 billion project will gener-ate about 1,200 construction jobs and 400 permanent jobs – as well as some inconveniences for motorists. They’ll have to wait often at railroad cross-ings and in a few instances find anoth-er route because three crossings will close to accommodate stations. The trains will stop in Miami, Fort Lauderdale, West Palm Beach and Or-lando International Airport, making the 230-mile trip in 3 hours. The ser-vice is not geared towards commuters but business travelers and tourists. Florida East Coast Industries, a Coral Gables based railroad and real estate company, insists it can build and operate the project – dubbed All Aboard Florida – without any public subsidy. “We wouldn’t be doing this is we didn’t think it was viable,” said Husein Cumber, who is leading the project. Here is what to expect and how it may affect you. When will construction begin? In 2013. Will Additional tracks be built? A second track would be added to about 50 of the 66 miles between Miami and West Palm Beach. Single tracks would remain on seven bridg-es. No additional right of way is re-quired along the FEC’s existing line. Which crossings could close? In Fort Lauderdale Northwest Sec-ond Street would close at the tracks if the preferred station size is cho-sen. Second Street is home to the city’s main fire station just west of the tracks. In downtown West Palm
Beach, Evernia and Dature streets would close at the tracks. An official announcement about the station sites may come in early 2013. Will crossings be improved? Yes; 134 of the 138 crossings between Miami and West Palm Beach will be enhanced with raised medians and full-closure gates, similar to what was done when Tri-Rail added a second track. What about train horns? The city of Fort Lauderdale is consid-ering applying for quite zones, which will require additional safety measures and federal approval to determine that safety wouldn’t be compromised if horns were silenced. Other municipali-ties may do the same. Stationary way-side horns, which direct horn blasts to the roadway, also are possible, How fast would trains travel? South of West Palm Beach, trains would average 60 mph up to 79 mph – the speed of Tri-Rail and Amtrak. North of there, the maximum would be 110 mph. Between Cocoa and Orlando, as high as 125 mph. How long would the trip take and how does it compare? Figure on 3 hours from Miami, 2 hours 20 minutes from Fort Lauderdale and 1 hour 45 minutes from West Palm Beach. Officials say that meets or beats driving times. Amtrak takes about 5 hours from Miami. How many trains a day? There will be 16 to 19 trains each way, or about one per hour. Won’t more trains delay drivers at crossings? It should take the passenger trains about 52 seconds to get through most crossings. How much will it cost to ride? Officials speculate a one-way ticket will cost less than $100 from Miami to
Orlando, and less from Fort Lauder-dale and West Palm Beach. What about connections when I get off the train? In Fort Lauderdale, a proposed downtown streetcar will pass the sta-tion. Broward County Transit’s cen-tral bus terminal is next door. In West Palm Beach trolleys will pick up pas-sengers at the station. Tri-Rail is a few blocks to the west. The Miami station will be next to two Metrorail stations and two Metromover stops. At Orlan-do International Airport, future plans call for SunRail commuter train to be extended to the station. But in the short-term, shuttles will be provided for key destinations. How many people will ride? Projections show about 1,827 board-ing daily in Fort Lauderdale, 1,998 in West Palm Beach and 1,868 in Miami by 2030. Can I take the train to commute between Miami, Fort Lauderdale and West Palm Beach? Pricing probably will preclude that. The service is designed as an intra-state service rather than a commuter rail service. How will the trains get from the coast, where the FEC runs to Or-lando? A 40-mile spur is planned from Co-coa to Orlando International Airport. Who’s paying for the service? All Aboard Florida is footing the $1 billion cost. However, it is eligible to apply for federal financing for track construction and improvements.
[email protected],954-356-4155, Twitter@MikeTurnbell

D O W N T O W N M I A M I I N T E R M O D A L T E R M I N A L F E A S I B I L I T Y S T U D Y PA G E 2 0 1
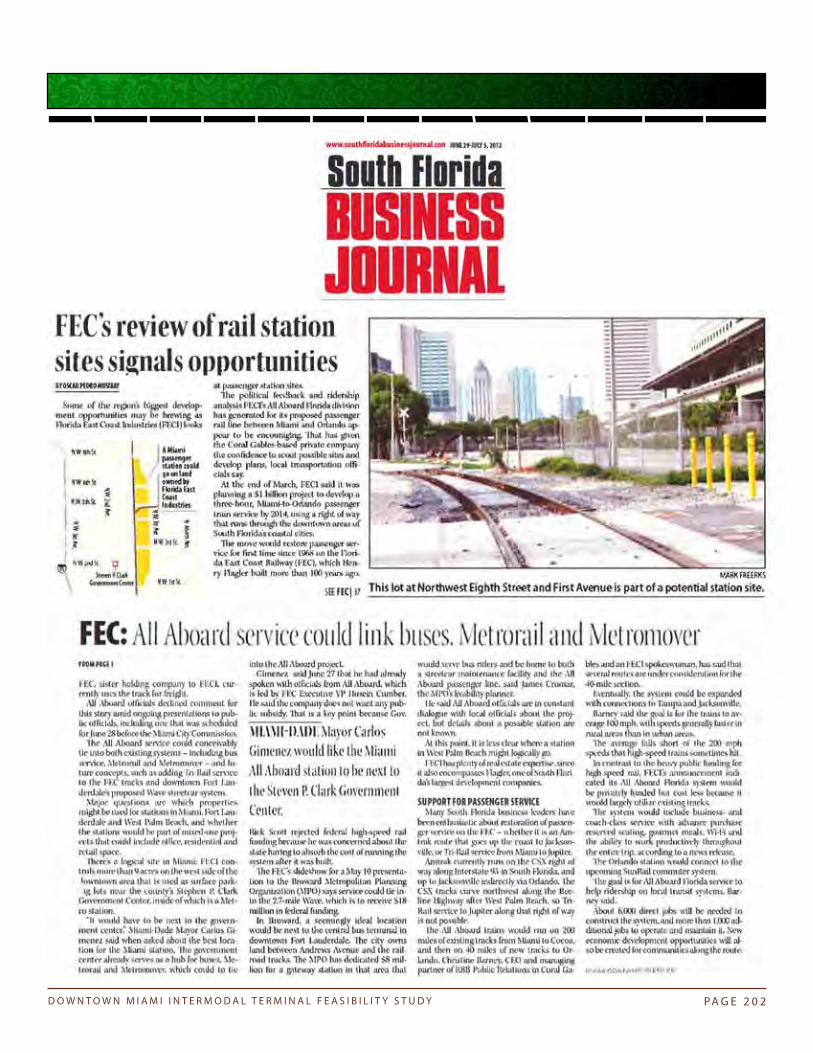
D O W N T O W N M I A M I I N T E R M O D A L T E R M I N A L F E A S I B I L I T Y S T U D Y PA G E 2 0 2

D O W N T O W N M I A M I I N T E R M O D A L T E R M I N A L F E A S I B I L I T Y S T U D Y PA G E 2 0 3
C H Perez and Associates Consulting Engineers, Inc. 9594 NW 41 Street, Suite 201
Doral, Florida 33178
ENGINEERS AND SURVEYORS DEDICATED TO TRANSPORTATION
CA 25976 / LB 7360
Draft Executive Summary - Downtown Intermodal Qualitative TIA August 2012
T:\MPO GPC-subs to Jacobs\DownTown Intermodal Facility\Report\Exec_Summary_082012-draft.docx Page 1
TO: Jesus Guerra, P.E. / Miami-Dade MPO Project Manager Brett A. Nein, ASLA / Jacobs Project Manager
FROM: Carlos Francis, P.E., PTOE /CHP Project Manager
DATE: August 10, 2012
SUBJECT: Draft Executive Summary - Downtown Intermodal Terminal
Qualitative Traffic Impact Assessment As requested, C. H. Perez & Associates Consulting Engineers, Inc (P&A) as a sub consultant to Jacobs Engineering Group, Inc., a consultant to the Miami-Dade MPO, has prepared this executive summary for a qualitative traffic impact assessment of a proposed intermodal terminal for downtown Miami. The terminal would include a pedestrian/transit mall. Various locations are being considered for the terminal that will require up to three scenarios of possible road closures to be considered relative to the impact on the existing traffic circulation. The qualitative traffic assessment was undertaken to determine the feasibility of the proposed downtown intermodal terminal from a traffic impact perspective. STUDY AREA Based on the information presented by Jacobs to the Urban Land Institute Conference on May 4, 2012 regarding the proposed intermodal facility and subsequent internal discussions among members of the project team, the following three road closure scenarios in downtown Miami were assessed independent of each other:
1. NW 1st Avenue – Road closure from NW 5th Street to NW 3rd Street 2. NW 1st Avenue – Road closure from NW 3rd Street to NW 1st Street 3. NW 1st Street – Road closure from NW 2nd Avenue to NW 1st Avenue
A study area was developed to include roadway links and intersections likely to be impacted by diverted traffic as a result of these potential road closures considering the existing one-way/two-way traffic circulation system in downtown area. Figures ES1 through ES 3 depict the study area and the likely alternative traffic circulation routes that could result from the closures.

LEGEND Roadway Direction of Travel Signalized Intersection
Special Land Uses
Likely Diverted Traffic
Road Closure
Figure ES 1
TRAFFIC CIRCULATION SKETCH - SCENARIO 1
DOWNTOWN INTERMODAL TERMINAL T:\MPO GPC-subs to Jacobs\DownTown Intermodal Facility\Report\Scenario_1_circulation.docx
NW 6th Street
NW 5th Street
NW 3rd Street
NW 1st Street
Flagler Street
NE 1st Street
NE 2nd Street
NE 3rd Street
NE 5th Street
NE 6th Street
NE 4th Street
Flagler Street
NW
2nd
Ave
NW
1st
Ave
NM
iam
i A
ve
NE 1
stA
ve
NW 4th Street
Christ Fellowship
Church
Wilkie D. Ferguson Federal US Court
House
Miami Police
Dept. & Law
Enforcement High School
US Federal Court House
David W. Dyer Bldg.
Stephen P. Clark Government Center
Cultural Center
West Lot
Parking Garage
Miami-Dade College Wolfson Campus.

LEGEND Roadway Direction of Travel Signalized Intersection
Special Land Uses
Likely Diverted Traffic
Road Closure
Figure ES 2
TRAFFIC CIRCULATION SKETCH - SCENARIO 2
DOWNTOWN INTERMODAL TERMINAL T:\MPO GPC-subs to Jacobs\DownTown Intermodal Facility\Report\Scenario_2_circulation_sketch.docx
NW 6th Street
NW 5th Street
NW 3rd Street
NW 1st Street
Flagler Street
NE 1st Street
NE 2nd Street
NE 3rd Street
NE 5th Street
NE 6th Street
NE 4th Street
Flagler Street
NW
2nd
Ave
NW
1st
Ave
NM
iam
i A
ve
NE 1
stA
ve
NW 4th Street
Christ Fellowship
Church
Wilkie D. Ferguson Federal US Court
House
Miami Police
Dept. & Law
Enforcement High School
US Federal Court House
David W. Dyer Bldg.
Stephen P. Clark Government Center
Cultural Center
West Lot
Parking Garage
Miami-Dade College Wolfson Campus.

LEGEND Roadway Direction of Travel Signalized Intersection
Special Land Uses
Likely Diverted Traffic
Road Closure
Figure ES 3
TRAFFIC CIRCULATION SKETCH - SCENARIO 3
DOWNTOWN INTERMODAL TERMINAL T:\MPO GPC-subs to Jacobs\DownTown Intermodal Facility\Report\Scenario_3_circulation_sketch.docx
NW 6th Street
NW 5th Street
NW 3rd Street
NW 1st Street
Flagler Street
NE 1st Street
NE 2nd Street
NE 3rd Street
NE 5th Street
NE 6th Street
NE 4th Street
Flagler Street
NW
2nd
Ave
NW
1st
Ave
NM
iam
i A
ve
NE 1
stA
ve
NW 4th Street
Christ Fellowship
Church
Wilkie D. Ferguson Federal US Court
House
Miami Police
Dept. & Law
Enforcement High School
US Federal Court House
David W. Dyer Bldg.
Stephen P. Clark Government Center
Cultural Center
West Lot
Parking Garage
Miami-Dade College Wolfson Campus.

C H Perez and Associates Consulting Engineers, Inc. 9594 NW 41 Street, Suite 201
Doral, Florida 33178
ENGINEERS AND SURVEYORS DEDICATED TO TRANSPORTATION
CA 25976 / LB 7360
Draft Executive Summary - Downtown Intermodal Qualitative TIA August 2012
T:\MPO GPC-subs to Jacobs\DownTown Intermodal Facility\Report\Exec_Summary_082012-draft.docx Page 5
DATA GATHERING Existing traffic data for roadways within the study area were gathered to the extent available from Miami-Dade County Public Works Department, Miami-Dade MPO, the Florida Department of Transportation, the City of Miami and the Miami-Dade Transit Tables ES1 and ES2 on the following pages, contain summaries of roadways and intersections respectively within the study area for which data were available. Only roadways and intersections for which data were available were included in these summaries. Table ES1 depicts actual link peak-hour volumes whereas Table ES 2 denotes the time periods for which turning movement volumes (TMVs) were available.
[THIS AREA WAS INTENTIONALLY LEFT BLANK]
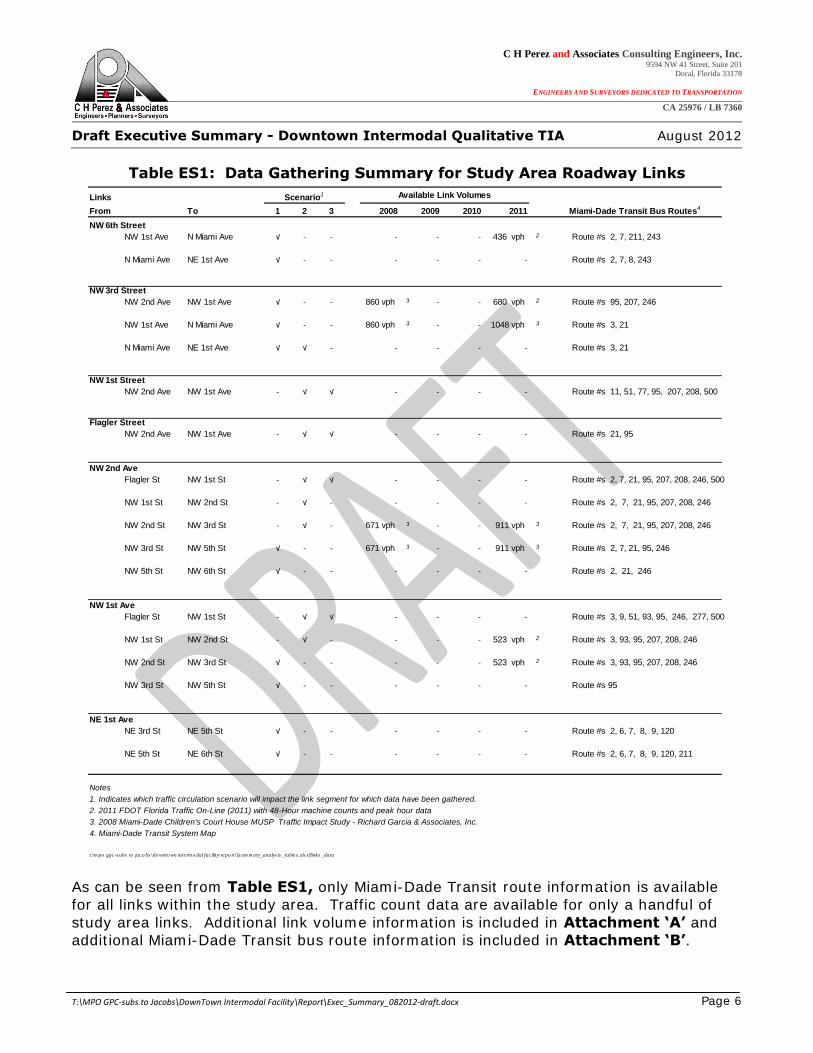
C H Perez and Associates Consulting Engineers, Inc. 9594 NW 41 Street, Suite 201
Doral, Florida 33178
ENGINEERS AND SURVEYORS DEDICATED TO TRANSPORTATION
CA 25976 / LB 7360
Draft Executive Summary - Downtown Intermodal Qualitative TIA August 2012
T:\MPO GPC-subs to Jacobs\DownTown Intermodal Facility\Report\Exec_Summary_082012-draft.docx Page 6
Table ES1: Data Gathering Summary for Study Area Roadway Links
As can be seen from Table ES1, only Miami-Dade Transit route information is available for all links within the study area. Traffic count data are available for only a handful of study area links. Additional link volume information is included in Attachment ‘A’ and additional Miami-Dade Transit bus route information is included in Attachment ‘B’.
Links
From To 1 2 3 2008 2009 2010 2011
NW 6th Street
NW 1st Ave N Miami Ave √ - - - - - 436 vph 2 Route #s 2, 7, 211, 243
N Miami Ave NE 1st Ave √ - - - - - - Route #s 2, 7, 8, 243
NW 3rd Street
NW 2nd Ave NW 1st Ave √ - - 860 vph 3 - - 680 vph 2 Route #s 95, 207, 246
NW 1st Ave N Miami Ave √ - - 860 vph 3 - - 1048 vph 3 Route #s 3, 21
N Miami Ave NE 1st Ave √ √ - - - - - Route #s 3, 21
NW 1st Street
NW 2nd Ave NW 1st Ave - √ √ - - - - Route #s 11, 51, 77, 95, 207, 208, 500
Flagler Street
NW 2nd Ave NW 1st Ave - √ √ - - - - Route #s 21, 95
NW 2nd Ave
Flagler St NW 1st St - √ √ - - - - Route #s 2, 7, 21, 95, 207, 208, 246, 500
NW 1st St NW 2nd St - √ - - - - - Route #s 2, 7, 21, 95, 207, 208, 246
NW 2nd St NW 3rd St - √ - 671 vph 3 - - 911 vph 3 Route #s 2, 7, 21, 95, 207, 208, 246
NW 3rd St NW 5th St √ - - 671 vph 3 - - 911 vph 3 Route #s 2, 7, 21, 95, 246
NW 5th St NW 6th St √ - - - - - - Route #s 2, 21, 246
NW 1st Ave
Flagler St NW 1st St - √ √ - - - - Route #s 3, 9, 51, 93, 95, 246, 277, 500
NW 1st St NW 2nd St - √ - - - - 523 vph 2 Route #s 3, 93, 95, 207, 208, 246
NW 2nd St NW 3rd St √ - - - - - 523 vph 2 Route #s 3, 93, 95, 207, 208, 246
NW 3rd St NW 5th St √ - - - - - - Route #s 95
NE 1st Ave
NE 3rd St NE 5th St √ - - - - - - Route #s 2, 6, 7, 8, 9, 120
NE 5th St NE 6th St √ - - - - - - Route #s 2, 6, 7, 8, 9, 120, 211
Notes
1. Indicates which traffic circulation scenario will impact the link segment for which data have been gathered.
2. 2011 FDOT Florida Traffic On-Line (2011) with 48-Hour machine counts and peak hour data
3. 2008 Miami-Dade Children's Court House MUSP Traffic Impact Study - Richard Garcia & Associates, Inc.
4. Miami-Dade Transit System Map
t:\m po gpc-s ubs to jaco bs \do wnto wn interm o dal fac ility\repo rt\[s um m ary_analys is _tables .xls x]links _data
Available Link Volumes
Miami-Dade Transit Bus Routes4
Scenario1

C H Perez and Associates Consulting Engineers, Inc. 9594 NW 41 Street, Suite 201
Doral, Florida 33178
ENGINEERS AND SURVEYORS DEDICATED TO TRANSPORTATION
CA 25976 / LB 7360
Draft Executive Summary - Downtown Intermodal Qualitative TIA August 2012
T:\MPO GPC-subs to Jacobs\DownTown Intermodal Facility\Report\Exec_Summary_082012-draft.docx Page 7
Table ES2: Data Gathering Summary for Study Area Roadway Intersections
Additional turning movement volume information is included as Attachment ‘C’.
Intersections 1 2 3 2008 2009 2010 2011
NW 6th St
at N Miami Ave √ - - - AM/PM2 - -
NW 5th St
at NW 2nd Ave √ - - PM3 AM/PM2 - PM3
at NW 1st Ave √ - - PM3 AM/PM2 - PM3
at N Miami Ave √ - - - AM/PM2
NW 4th St
at NW 2nd Ave √ - - PM3 - - PM3
NW 3rd St
at NW 2nd Ave √ √ - PM3 - PM4 PM3
at NW 1st Ave √ √ - PM3 - - PM3
NW 2nd St
at NW 2nd Ave - √ - - - PM4 PM3
Notes
1. Indicates which traffic circulation scenario will impact the intersection for which data have been gathered.
2. Southeast Overtown Parkwest DRI
3. 2008 Miami-Dade Children's Court House MUSP Traffic Impact Study - Richard Garcia & Associates, Inc.
4. 2010 West Lot Multi-Use Facility MUSP Traffic Impact Study - Richard Garcia & Associates, Inc.
t:\m po gpc-s ubs to jaco bs \do wnto wn interm o dal fac ility\repo rt\[s um m ary_analys is _tables .xls x]inters ec tio n_data
Available TMCsScenario1

C H Perez and Associates Consulting Engineers, Inc. 9594 NW 41 Street, Suite 201
Doral, Florida 33178
ENGINEERS AND SURVEYORS DEDICATED TO TRANSPORTATION
CA 25976 / LB 7360
Draft Executive Summary - Downtown Intermodal Qualitative TIA August 2012
T:\MPO GPC-subs to Jacobs\DownTown Intermodal Facility\Report\Exec_Summary_082012-draft.docx Page 8
FIELD REVIEWS The period selected for the field review was based on the peak period recorded in the 2011 traffic counts gathered from the 2011 FDOT Traffic On-Line website which shows the peak period predominantly occurring between the typical 4:00PM and 6:00 PM period at the three FDOT count sites within the study area. Consequently, a field review was conducted between 4:00 PM and 6:00 PM on Wednesday August 8, 2012. In addition, a supplemental field review was conducted on Thursday August 9, 2012, during the 12:00 PM to 1:00 PM lunch period to observe traffic conditions during that period. The findings are summarized below: PM Period
Traffic conditions throughout the study area appeared to be moderate with no major constraints observed. No significant delay was observed for turning vehicles. No signal phase failures were observed at signalized intersections throughout the study area.
Northbound traffic on NE 1st Avenue (at the eastern end of the study area) was steady, a significant proportion of which most likely comprised vehicles headed towards I-395.
On NW 1st Street between NW 2nd Avenue and NW 1st Avenue, significant pick-up, drop-off activity was observed in the area of the Miami-Dade metro bus terminal. General pedestrian activity in this area appeared to be high.
On NW 2nd Avenue, within the vicinity of the NW 2nd Street intersection near the West Lot Parking Garage and the Stephen P. Clark Government Center, light to moderate pedestrian activity (crossing NW 2nd Avenue between the two buildings) was observed.
A concentration of what appeared to be indigent individuals was observed loitering along NW 6th Street between NW 1st avenue and NE 1st Avenue.
Midday Period Conditions similar to the PM peak period were observed during the Midday period. Photos 1 and 2 capture some of the highlights of the traffic conditions just described.
[THIS AREA WAS INTENTIONALLY LEFT BLANK]

C H Perez and Associates Consulting Engineers, Inc. 9594 NW 41 Street, Suite 201
Doral, Florida 33178
ENGINEERS AND SURVEYORS DEDICATED TO TRANSPORTATION
CA 25976 / LB 7360
Draft Executive Summary - Downtown Intermodal Qualitative TIA August 2012
T:\MPO GPC-subs to Jacobs\DownTown Intermodal Facility\Report\Exec_Summary_082012-draft.docx Page 9
Photo 1: Northbound NE 2nd Ave at NW 6th St
Photo 2: Westbound NE 1st St Between NW 2nd Ave and NW 1st Ave
Steady northbound traffic
Steady pick-up/drop-off activity at bus terminal
Government Center
Cultural Center

C H Perez and Associates Consulting Engineers, Inc. 9594 NW 41 Street, Suite 201
Doral, Florida 33178
ENGINEERS AND SURVEYORS DEDICATED TO TRANSPORTATION
CA 25976 / LB 7360
Draft Executive Summary - Downtown Intermodal Qualitative TIA August 2012
T:\MPO GPC-subs to Jacobs\DownTown Intermodal Facility\Report\Exec_Summary_082012-draft.docx Page 10
QUALITATIVE IMPACT ASSESSMENT For the purposes of qualitatively assessing the traffic impacts of the three potential road closure scenarios, the following performance metrics were established:
Potential to exacerbate existing traffic constraints Number of bus re-routes Potential for increased conflicts with pedestrian traffic
Following is a brief discussion of the utility of each performance metric in assessing each road closure scenario given the nature and level of available data that were gathered as previously described: Potential to Exacerbate Existing Traffic Constraints
This performance metric relies upon the availability of turning movement volumes at all affected intersections along the alternate routes for each scenario in order to assess the relative change in turning movement volumes that could result from diverted traffic associated with the road closure. In addition, the availability of peak hour link volumes could help determine how much additional capacity remains on a given link segment along an alternate route and thereby provide a basis for assessing the relative impacts that could result from likely traffic diversions. As can be seen in Tables ES 1 and ES 2 the coverage of turning movement volume data and link data is spotty throughout the study area. Notwithstanding, while the data coverage is still spotty, the likely alternate routes that result from the road closure in Scenario 1 (i.e. NW 1st Avenue between NW 3rd Street and NW 5th Street) comprise most of the available turning movement and link data gathered. Figure ES4 (on the next page) presents an excerpt from a traffic impact study performed by Richard Garcia & Associates, Inc., for the 2008 Miami-Dade Children's Court House MUSP. The excerpt depicts turning movement volume information that was developed for intersections on NW 2nd Avenue and on NW 1st Avenue that are located along the likely traffic diversion routes that would result from the road closure under Scenario 1. As can be seen, significant increases in traffic turning movement volumes would most likely result for the following:
NW 3rd Street at NW 1st Avenue – On the northbound and westbound approaches NW 3rd Street at NW 2nd Avenue – On the westbound approach NW 5th Street at NW 2nd Avenue – On the northbound approach NW 5th Street at NW 1st Avenue – On the southbound and eastbound approaches
While a reanalysis of the impacted intersections is outside the scope of this assessment, a cursory review of the level of traffic diversion indicates that traffic patterns at the impacted intersection would be significantly altered. However, it is possible that an

C H Perez and Associates Consulting Engineers, Inc. 9594 NW 41 Street, Suite 201
Doral, Florida 33178
ENGINEERS AND SURVEYORS DEDICATED TO TRANSPORTATION
CA 25976 / LB 7360
Draft Executive Summary - Downtown Intermodal Qualitative TIA August 2012
T:\MPO GPC-subs to Jacobs\DownTown Intermodal Facility\Report\Exec_Summary_082012-draft.docx Page 11
operational analysis would find that adequate intersection capacity is available given that the level of service at these intersections were found to be operating at between LOS ‘A’
and ‘C’ in the TIA performed by Richard Garcia & Associates, Inc.. See Attachment ‘C’.
Figure ES 4: Likely Traffic Diversions for Road Closure – Scenario 1
Since, unlike Scenario 1, a similar level of available traffic volume data does not exist along alternate routes for the other two scenarios, it is not possible to perform an apples to apples comparison between the alternatives by just reviewing the volume data presented in Figure ES 4. As a consequence, a more qualitative approach was used in assessing this performance metric for each scenario by considering the relative number of intersections that would likely be impacted by diverted traffic under each scenario.
246
24
6 0
537
209
60
5
34
1
189
Change in traffic as a result of diversion
Legend
Road Closure
0 58
96
Source: Miami-Dade County Children’s Courthouse MUSP - RGA

C H Perez and Associates Consulting Engineers, Inc. 9594 NW 41 Street, Suite 201
Doral, Florida 33178
ENGINEERS AND SURVEYORS DEDICATED TO TRANSPORTATION
CA 25976 / LB 7360
Draft Executive Summary - Downtown Intermodal Qualitative TIA August 2012
T:\MPO GPC-subs to Jacobs\DownTown Intermodal Facility\Report\Exec_Summary_082012-draft.docx Page 12
Number of Bus Re-Routes This performance metric relies upon the availability of bus route information on all impacted links in order to assess the number of bus routes that would have to be re-routed as a result of the road closure in each scenario. As can be seen in Table ES 1, bus route information is available on all links throughout the study area. Potential For Increased Conflicts with Pedestrian Traffic This performance metric relies upon the identification of roadway links that already experience or have the propensity for relatively high pedestrian activity where increased conflicts could result if vehicular traffic increases as a result of road closures. As described in the Field Review section of this report, on NW 1st Street between NW 2nd Avenue and NW 1st Avenue, general pedestrian activity in this area appeared to be high and was due mainly to the significant pick-up, drop-off activity that occurred in the area of the Miami-Dade metro bus terminal. In addition it is anticipated, that during special events at the cultural center on the south side of NW 1st Street, increased pedestrian activity is likely along this link of NW 1st Street. Although not observed during the field reviews, it is also anticipated that on occasion, N Miami Avenue between NE 3rd Street and NE 5th Street could experience significant pedestrian traffic between the two federal court buildings on the east and west side of the street, thus making this roadway segment susceptible to increased pedestrian/vehicular conflicts resulting from traffic diversions due to road closure described in Scenario 1. For each performance metric, the following scoring system was developed using a scale of 1 to 5 where a score of 1 represents the least impact and a score of 5 represents the greatest impact. The road closure scenario that received the highest aggregate score would be deemed the least attractive and considered to be the alternative with the highest potential for traffic impact. Table ES3 on the next page presents a summary of the performance matrix used to assess each road closure scenario.
[THIS AREA WAS INTENTIONALLY LEFT BLANK]

C H Perez and Associates Consulting Engineers, Inc. 9594 NW 41 Street, Suite 201
Doral, Florida 33178
ENGINEERS AND SURVEYORS DEDICATED TO TRANSPORTATION
CA 25976 / LB 7360
Draft Executive Summary - Downtown Intermodal Qualitative TIA August 2012
T:\MPO GPC-subs to Jacobs\DownTown Intermodal Facility\Report\Exec_Summary_082012-draft.docx Page 13
Table ES3: Performance Matrix
As can be seen from Table ES3, of the three road closure scenarios reviewed, Scenario 3, which involves the road closure of NW 1st Street between NW 2nd Avenue and NW 1st Avenue is likely to have the least traffic impact with a relative score of 8. With a relative score of 12, Scenario 2 which involves the road closure of NW 1st Avenue between NW 1st Street and NW 3rd Street is projected to have the greatest impact.
[THIS AREA WAS INTENTIONALLY LEFT BLANK]
Performance Metric 1 2 3
Potential to Exacerbate Existing Traffic Constraints1, 2 5 3 2
Number of bus re-routes3 1 4 5
Potential For Increased Conflicts with Pedestrian Traffic4 3 5 1
Total Score9 12 8
Notes
t:\m po gpc-s ubs to jaco bs \do wnto wn interm o dal fac ility\repo rt\[s um m ary_analys is _tables .xls x]qualitative_as s es s m ent
2. While no operational analyses were performed, the relative performance of each scenario was assessed based on the
number of intersections that would likely be impacted by diverted traffic as a result of the road closure.
3. Scenario 1 impacts one bus route; Scenario 2 impacts six bus routes; Scenario 3 impacts seven bus routes
4. Scenario 2 will lead to the highest instance of diverted traffic onto NW 1st Street between NW 2nd Avenue and NW 1st
Avenue which as noted previously, has a high incidence of pedestrian activity. Scenario 1 has the potential to create
significant conflict due to the link segment on N Miami Avenue between NE 3rd Street and NW 5th Street that traverses federal
cour buildings on either side.
Scenario
1. As noted in the field review, no major traffic constraints were observed.

C H Perez and Associates Consulting Engineers, Inc. 9594 NW 41 Street, Suite 201
Doral, Florida 33178
ENGINEERS AND SURVEYORS DEDICATED TO TRANSPORTATION
CA 25976 / LB 7360
Draft Executive Summary - Downtown Intermodal Qualitative TIA August 2012
T:\MPO GPC-subs to Jacobs\DownTown Intermodal Facility\Report\Exec_Summary_082012-draft.docx Page 14
CONCLUSION & RECOMMENDATIONS Based on the foregoing qualitative traffic impact assessment of potential road closures associated with the proposed intermodal terminal for downtown Miami, it was determined that the scenario that involves the road closure of NW 1st Street between NW 2nd Avenue and NW 1st Avenue (Scenario 3) will likely result in the least traffic impact in the downtown area according to the three performance metrics established in this assessment. Notwithstanding, it should be noted that prior to making any final determination on the preferred location of the downtown intermodal terminal and hence the associated road closure scenario, an in-depth traffic analysis is recommended. The in-depth traffic analysis should include an Origin-Destination survey to better quantify the proportion of likely diverted traffic whereupon an do operational analysis of affected intersection can be undertaken to determine change in intersection delay by movement, approach and overall intersection performance.
Attachments: A. Roadway Link Volumes B. Miami-Dade Transit Bus Route System Map C. Turning Movement Volumes

C H Perez and Associates Consulting Engineers, Inc. 9594 NW 41 Street, Suite 201
Doral, Florida 33178
ENGINEERS AND SURVEYORS DEDICATED TO TRANSPORTATION
CA 25976 / LB 7360
Draft - Executive Summary August 2012
T:\MPO GPC-subs to Jacobs\DownTown Intermodal Facility\Report\Exec_Summary_082012-draft.docx A
ATTACHMENT A
(ROADWAY LINK VOLUMES)

2011 FDOT TRAFFIC ONLINE


COUNTY: 87STATION: 8156DESCRIPTION: NE/NW 6TH ST, 200' EAST OF N MIAMI AVESTART DATE: 06/21/2011START TIME: 2200---------------------------------------- DIRECTION: WTIME 1ST 2ND 3RD 4TH TOTAL----------------------------------------0000 11 11 7 3 320100 9 3 2 2 160200 3 1 2 2 80300 3 2 7 2 140400 1 2 0 4 70500 0 2 13 7 220600 15 17 12 19 630700 16 27 32 46 1210800 30 41 36 44 1510900 37 40 48 67 1921000 48 65 42 53 2081100 33 61 76 86 2561200 86 65 69 82 3021300 70 57 59 62 2481400 76 60 52 58 2461500 74 68 71 79 2921600 98 85 98 91 3721700 142 100 84 90 4161800 114 81 75 62 3321900 52 38 33 33 1562000 29 21 26 23 992100 41 15 20 18 942200 30 15 20 6 712300 9 6 9 10 34----------------------------------------24-HOUR TOTALS: 3752---------------------------------------- PEAK VOLUME INFORMATION
HOUR VOLUMEA.M. 845 169P.M. 1630 431DAILY 1630 431
TRUCK PERCENTAGE 10.31 NAN 10.31----------------------------------------------------------------------------------------------------------
CLASSIFICATION SUMMARY DATABASE
DIR 1 2 3 4 5 6 7 8 9 10 11 12 13 14 15 TOTTRK TOTVOL W 35 2890 440 261 81 19 2 2 22 0 0 0 0 0 0 387 3752
----------------------------------------------------------------------------------------------------------
GENERATED BY SPS 5.0.21

COUNTY: 87STATION: 8156DESCRIPTION: NE/NW 6TH ST, 200' EAST OF N MIAMI AVESTART DATE: 06/22/2011START TIME: 2200---------------------------------------- DIRECTION: WTIME 1ST 2ND 3RD 4TH TOTAL----------------------------------------0000 10 8 4 5 270100 12 1 2 1 160200 0 1 1 2 40300 2 2 2 1 70400 2 3 0 3 80500 0 2 14 10 260600 9 8 12 19 480700 25 24 25 32 1060800 33 42 41 43 1590900 36 41 54 64 1951000 51 58 57 55 2211100 65 73 94 83 3151200 96 60 71 71 2981300 63 71 72 74 2801400 75 72 87 90 3241500 98 88 86 78 3501600 104 87 109 98 3981700 146 82 101 86 4151800 76 93 56 53 2781900 48 63 28 37 1762000 23 42 29 30 1242100 34 29 27 23 1132200 27 20 17 7 712300 15 11 14 9 49----------------------------------------24-HOUR TOTALS: 4008---------------------------------------- PEAK VOLUME INFORMATION
HOUR VOLUMEA.M. 845 174P.M. 1615 440DAILY 1615 440
TRUCK PERCENTAGE 11.15 NAN 11.15----------------------------------------------------------------------------------------------------------
CLASSIFICATION SUMMARY DATABASE
DIR 1 2 3 4 5 6 7 8 9 10 11 12 13 14 15 TOTTRK TOTVOL W 31 3083 447 279 95 32 1 7 33 0 0 0 0 0 0 447 4008
----------------------------------------------------------------------------------------------------------
GENERATED BY SPS 5.0.21

COUNTY: 87STATION: 8254DESCRIPTION: NW 3RD ST, 200' EAST OF NW 2ND AVENUESTART DATE: 06/21/2011START TIME: 2200--------------------------------------------------------------------------------------- DIRECTION: E DIRECTION: W COMBINEDTIME 1ST 2ND 3RD 4TH TOTAL 1ST 2ND 3RD 4TH TOTAL TOTAL---------------------------------------------------------------------------------------0000 4 5 0 7 16 | 21 8 5 4 38 | 540100 1 3 0 1 5 | 1 4 2 1 8 | 130200 1 2 1 4 8 | 3 3 4 2 12 | 200300 0 2 1 2 5 | 4 4 1 2 11 | 160400 0 4 3 4 11 | 2 3 2 4 11 | 220500 6 10 12 21 49 | 3 1 7 3 14 | 630600 9 14 37 38 98 | 14 12 16 14 56 | 1540700 33 56 86 109 284 | 22 26 24 43 115 | 3990800 98 79 76 90 343 | 51 32 45 41 169 | 5120900 96 97 92 18 303 | 44 62 41 84 231 | 5341000 15 22 49 58 144 | 67 75 72 74 288 | 4321100 56 55 53 50 214 | 73 77 80 81 311 | 5251200 60 56 66 64 246 | 90 81 80 69 320 | 5661300 67 49 61 52 229 | 83 66 77 67 293 | 5221400 51 51 50 45 197 | 82 70 73 87 312 | 5091500 56 41 40 32 169 | 87 87 80 89 343 | 5121600 30 33 45 32 140 | 116 86 97 144 443 | 5831700 34 46 29 30 139 | 145 137 83 86 451 | 5901800 18 21 29 14 82 | 72 62 42 39 215 | 2971900 8 16 10 15 49 | 27 29 26 17 99 | 1482000 7 6 13 11 37 | 20 20 18 21 79 | 1162100 3 7 11 11 32 | 23 12 10 12 57 | 892200 5 11 7 7 30 | 14 11 12 12 49 | 792300 8 4 7 0 19 | 8 2 14 7 31 | 50---------------------------------------------------------------------------------------24-HOUR TOTALS: 2849 3956 6805--------------------------------------------------------------------------------------- PEAK VOLUME INFORMATION DIRECTION: E DIRECTION: W COMBINED DIRECTIONS HOUR VOLUME HOUR VOLUME HOUR VOLUMEA.M. 845 375 830 192 845 563P.M. 1215 253 1630 523 1630 680DAILY 845 375 1630 523 1630 680
TRUCK PERCENTAGE 5.58 1.74 3.35----------------------------------------------------------------------------------------------------------
CLASSIFICATION SUMMARY DATABASE
DIR 1 2 3 4 5 6 7 8 9 10 11 12 13 14 15 TOTTRK TOTVOL E 21 2273 396 118 31 6 0 2 2 0 0 0 0 0 0 159 2849 W 37 3196 654 8 51 7 1 2 0 0 0 0 0 0 0 69 3956
----------------------------------------------------------------------------------------------------------
GENERATED BY SPS 5.0.21

COUNTY: 87STATION: 8254DESCRIPTION: NW 3RD ST, 200' EAST OF NW 2ND AVENUESTART DATE: 06/22/2011START TIME: 2200--------------------------------------------------------------------------------------- DIRECTION: E DIRECTION: W COMBINEDTIME 1ST 2ND 3RD 4TH TOTAL 1ST 2ND 3RD 4TH TOTAL TOTAL---------------------------------------------------------------------------------------0000 5 5 1 3 14 | 15 8 0 6 29 | 430100 3 0 1 0 4 | 4 1 3 1 9 | 130200 1 1 0 5 7 | 1 1 6 1 9 | 160300 2 1 0 4 7 | 4 0 2 9 15 | 220400 1 1 4 6 12 | 1 0 2 2 5 | 170500 2 11 11 17 41 | 1 3 3 3 10 | 510600 16 20 26 46 108 | 16 9 10 11 46 | 1540700 27 53 83 104 267 | 18 28 33 49 128 | 3950800 98 78 89 101 366 | 43 45 42 43 173 | 5390900 94 105 79 79 357 | 40 50 69 53 212 | 5691000 73 62 62 61 258 | 63 66 77 80 286 | 5441100 74 57 59 54 244 | 69 80 87 70 306 | 5501200 64 46 60 72 242 | 102 60 70 64 296 | 5381300 71 59 48 57 235 | 73 69 80 93 315 | 5501400 59 60 52 48 219 | 74 78 105 68 325 | 5441500 44 43 35 31 153 | 92 114 97 91 394 | 5471600 32 40 35 42 149 | 113 94 124 142 473 | 6221700 35 35 34 29 133 | 155 111 102 65 433 | 5661800 28 23 16 13 80 | 82 62 50 30 224 | 3041900 16 14 18 14 62 | 28 28 33 16 105 | 1672000 12 12 16 8 48 | 14 23 23 24 84 | 1322100 10 8 13 12 43 | 30 31 7 8 76 | 1192200 7 2 3 7 19 | 13 13 1 9 36 | 552300 3 3 3 6 15 | 14 7 6 5 32 | 47---------------------------------------------------------------------------------------24-HOUR TOTALS: 3083 4021 7104--------------------------------------------------------------------------------------- PEAK VOLUME INFORMATION DIRECTION: E DIRECTION: W COMBINED DIRECTIONS HOUR VOLUME HOUR VOLUME HOUR VOLUMEA.M. 830 389 845 202 845 581P.M. 1230 262 1630 532 1630 679DAILY 830 389 1630 532 1630 679
TRUCK PERCENTAGE 5.38 1.91 3.42----------------------------------------------------------------------------------------------------------
CLASSIFICATION SUMMARY DATABASE
DIR 1 2 3 4 5 6 7 8 9 10 11 12 13 14 15 TOTTRK TOTVOL E 28 2430 459 120 44 1 0 0 1 0 0 0 0 0 0 166 3083 W 28 3255 661 1 67 4 4 1 0 0 0 0 0 0 0 77 4021
----------------------------------------------------------------------------------------------------------
GENERATED BY SPS 5.0.21

COUNTY: 87STATION: 8204DESCRIPTION: NW 1ST AVE, 200' SOUTH OF NW 3RD STREETSTART DATE: 06/21/2011START TIME: 0700--------------------------------------------------------------------------------------- DIRECTION: N DIRECTION: S COMBINEDTIME 1ST 2ND 3RD 4TH TOTAL 1ST 2ND 3RD 4TH TOTAL TOTAL---------------------------------------------------------------------------------------0000 4 0 5 6 15 | 10 5 2 9 26 | 410100 2 4 0 2 8 | 5 4 0 6 15 | 230200 1 1 0 1 3 | 0 5 3 3 11 | 140300 2 1 2 0 5 | 2 0 2 5 9 | 140400 1 0 1 2 4 | 1 0 1 7 9 | 130500 2 1 1 5 9 | 8 7 17 27 59 | 680600 4 8 6 8 26 | 19 22 39 52 132 | 1580700 19 28 26 32 105 | 46 64 93 125 328 | 4330800 37 36 41 34 148 | 99 104 102 119 424 | 5720900 40 43 38 38 159 | 128 127 102 97 454 | 6131000 34 48 43 47 172 | 96 83 92 69 340 | 5121100 37 44 38 46 165 | 68 67 70 77 282 | 4471200 52 39 53 55 199 | 74 83 76 83 316 | 5151300 54 38 49 49 190 | 75 78 92 88 333 | 5231400 48 55 48 49 200 | 73 90 73 78 314 | 5141500 45 53 47 40 185 | 86 67 73 61 287 | 4721600 41 34 55 61 191 | 59 46 64 69 238 | 4291700 55 41 44 24 164 | 70 62 57 51 240 | 4041800 25 20 14 13 72 | 34 33 53 38 158 | 2301900 13 14 12 8 47 | 27 27 31 13 98 | 1452000 5 5 3 5 18 | 19 16 15 10 60 | 782100 8 1 4 3 16 | 13 14 16 14 57 | 732200 5 3 6 5 19 | 4 7 8 7 26 | 452300 5 2 1 0 8 | 9 7 7 4 27 | 35---------------------------------------------------------------------------------------24-HOUR TOTALS: 2128 4243 6371--------------------------------------------------------------------------------------- PEAK VOLUME INFORMATION DIRECTION: N DIRECTION: S COMBINED DIRECTIONS HOUR VOLUME HOUR VOLUME HOUR VOLUMEA.M. 830 158 830 476 830 634P.M. 1630 212 1330 343 1330 544DAILY 1630 212 830 476 830 634
TRUCK PERCENTAGE 1.69 6.53 4.91----------------------------------------------------------------------------------------------------------
CLASSIFICATION SUMMARY DATABASE
DIR 1 2 3 4 5 6 7 8 9 10 11 12 13 14 15 TOTTRK TOTVOL N 36 1819 237 3 25 6 0 1 0 1 0 0 0 0 0 36 2128 S 63 3386 517 151 116 7 0 1 1 0 0 0 1 0 0 277 4243
----------------------------------------------------------------------------------------------------------
GENERATED BY SPS 5.0.21

COUNTY: 87STATION: 8204DESCRIPTION: NW 1ST AVE, 200' SOUTH OF NW 3RD STREETSTART DATE: 06/22/2011START TIME: 0700--------------------------------------------------------------------------------------- DIRECTION: N DIRECTION: S COMBINEDTIME 1ST 2ND 3RD 4TH TOTAL 1ST 2ND 3RD 4TH TOTAL TOTAL---------------------------------------------------------------------------------------0000 5 1 2 5 13 | 8 12 1 9 30 | 430100 2 0 1 1 4 | 7 1 4 3 15 | 190200 0 0 1 2 3 | 1 1 2 1 5 | 80300 1 1 3 7 12 | 2 3 1 4 10 | 220400 0 0 0 2 2 | 1 5 1 9 16 | 180500 1 2 1 2 6 | 5 6 16 17 44 | 500600 2 5 10 16 33 | 24 29 35 55 143 | 1760700 23 21 28 37 109 | 48 81 85 122 336 | 4450800 45 32 36 46 159 | 123 102 102 110 437 | 5960900 46 44 38 39 167 | 117 96 113 106 432 | 5991000 43 32 42 38 155 | 95 87 89 72 343 | 4981100 43 50 33 43 169 | 86 64 53 78 281 | 4501200 39 39 28 43 149 | 74 67 69 79 289 | 4381300 32 35 41 47 155 | 86 60 65 49 260 | 4151400 42 47 40 60 189 | 76 70 78 69 293 | 4821500 42 36 44 42 164 | 76 69 60 54 259 | 4231600 47 31 47 68 193 | 67 72 63 66 268 | 4611700 66 59 32 35 192 | 67 66 42 36 211 | 4031800 18 17 19 15 69 | 43 35 42 22 142 | 2111900 12 10 3 7 32 | 16 16 22 17 71 | 1032000 6 7 12 6 31 | 10 13 16 12 51 | 822100 10 4 4 7 25 | 8 11 11 5 35 | 602200 3 0 1 3 7 | 10 9 5 10 34 | 412300 7 1 2 3 13 | 3 6 5 9 23 | 36---------------------------------------------------------------------------------------24-HOUR TOTALS: 2051 4028 6079--------------------------------------------------------------------------------------- PEAK VOLUME INFORMATION DIRECTION: N DIRECTION: S COMBINED DIRECTIONS HOUR VOLUME HOUR VOLUME HOUR VOLUMEA.M. 845 174 745 449 845 610P.M. 1630 240 1215 301 1630 502DAILY 1630 240 745 449 845 610
TRUCK PERCENTAGE 1.61 7.22 5.33----------------------------------------------------------------------------------------------------------
CLASSIFICATION SUMMARY DATABASE
DIR 1 2 3 4 5 6 7 8 9 10 11 12 13 14 15 TOTTRK TOTVOL N 40 1758 220 4 22 5 0 2 0 0 0 0 0 0 0 33 2051 S 43 3191 503 176 107 5 0 3 0 0 0 0 0 0 0 291 4028
----------------------------------------------------------------------------------------------------------
GENERATED BY SPS 5.0.21

MIAMI-DADE COUNTY CHILDREN’S COURTHOUSE MUSP

MIAMI-DADE COUNTY CHILDREN’S COURTHOUSE MUSP Traffic Impact Study
5 �
Richard Garcia & Associates, Inc.
FROM TO V/C LOS
W Flagler St NW 8 St NB E 1LD-Non State 851 1361 427 598 763 0.44 C
NW 8 St W Flagler St SB E 1LD-Non State 851 1361 244 341 1020 0.25 C
N Miami Ave N River Dr EB E 1LD-Non State 851 1361 348 487 874 0.36 C
N River Dr N Miami Ave WB E 2LD-Non State 1720 2752 512 717 2035 0.26 C
W Flagler St NW 8 St NB E 1LD-Non State 851 1361 466 653 708 0.48 C
NW 8 St W Flagler St SB E 1LD-Non State 851 1361 266 373 988 0.27 C
N Miami Ave N River Dr EB E 1LD-Non State 851 1361 380 532 829 0.39 C
N River Dr N Miami Ave WB E 2LD-Non State 1720 2752 560 784 1968 0.28 C
W Flagler St NW 8 St NB E 1LD-Non State 851 1361 466 653 708 0.48 C
NW 8 St W Flagler St SB E 1LD-Non State 851 1361 266 373 988 0.27 C
N Miami Ave N River Dr EB E 1LD-Non State 851 1361 380 532 829 0.39 C
N River Dr N Miami Ave WB E 2LD-Non State 1720 2752 560 784 1968 0.28 C
W Flagler St NW 8 St NB E 1LD-Non State 851 1361 606 849 512 0.62 D
NW 8 St W Flagler St SB E 1LD-Non State 851 1361 305 427 933 0.31 C
N Miami Ave N River Dr EB E 1LD-Non State 851 1361 380 532 829 0.39 C
N River Dr N Miami Ave WB E 2LD-Non State 1720 2752 668 935 1817 0.34 C
EXCESS
PERSON
TRIP
CAPACITY
ROADWAY PERSON TRIP
NW 2nd Avenue
NW 3rd Street
NW 2nd Avenue
WITH PROJECT AND BACKGROUND & COMMITTED TRAFFIC
WITH BACKGROUND & COMMITTED TRAFFIC
NW 2nd Avenue
NW 3rd Street
WITH BACKGROUND TRAFFIC (2011)
ROADWAY MODE
ROADWAY
VEHICULAR
VOLUME
EXISTING CONDITION (Seasonally Adjusted)
NW 3rd Street
PERSON-
TRIP
CAPACITY
@ 1.6 PPV
PERSON-
TRIP
VOLUME
@ 1.4 PPV
NW 2nd Avenue
ROADWAY
DIR
MIAMI
ADOPTED
LOS
CORRIDOR
TYPE
ROADWAY
VEHICULAR
CAPACITY
NW 3rd Street
Table 2: PM Person Trip Corridor Analysis Summary (One-Way Analysis)
In conclusion, the results of the analysis contained in this report finds that the levels of service thresholds
are maintained within the LOS standard of E for the Person-Trip methodology for the roadway segment.
Additionally, all the intersections analyzed have acceptable Level of Service. The results indicated the
intersections analyzed will be within the LOS standard of E threshold. As such, sufficient roadway
person-trip capacity exists to support this development.

C H Perez and Associates Consulting Engineers, Inc. 9594 NW 41 Street, Suite 201
Doral, Florida 33178
ENGINEERS AND SURVEYORS DEDICATED TO TRANSPORTATION
CA 25976 / LB 7360
Draft - Executive Summary August 2012
T:\MPO GPC-subs to Jacobs\DownTown Intermodal Facility\Report\Exec_Summary_082012-draft.docx B
ATTACHMENT B
(MIAMI-DADE TRANSIT BUS ROUTE SYSTEM MAP)


C H Perez and Associates Consulting Engineers, Inc. 9594 NW 41 Street, Suite 201
Doral, Florida 33178
ENGINEERS AND SURVEYORS DEDICATED TO TRANSPORTATION
CA 25976 / LB 7360
Draft - Executive Summary August 2012
T:\MPO GPC-subs to Jacobs\DownTown Intermodal Facility\Report\Exec_Summary_082012-draft.docx C
ATTACHMENT C
(TURNING MOVEMENT VOLUMES)

SOUTHEAST OVERTOWN PARKWEST DRI
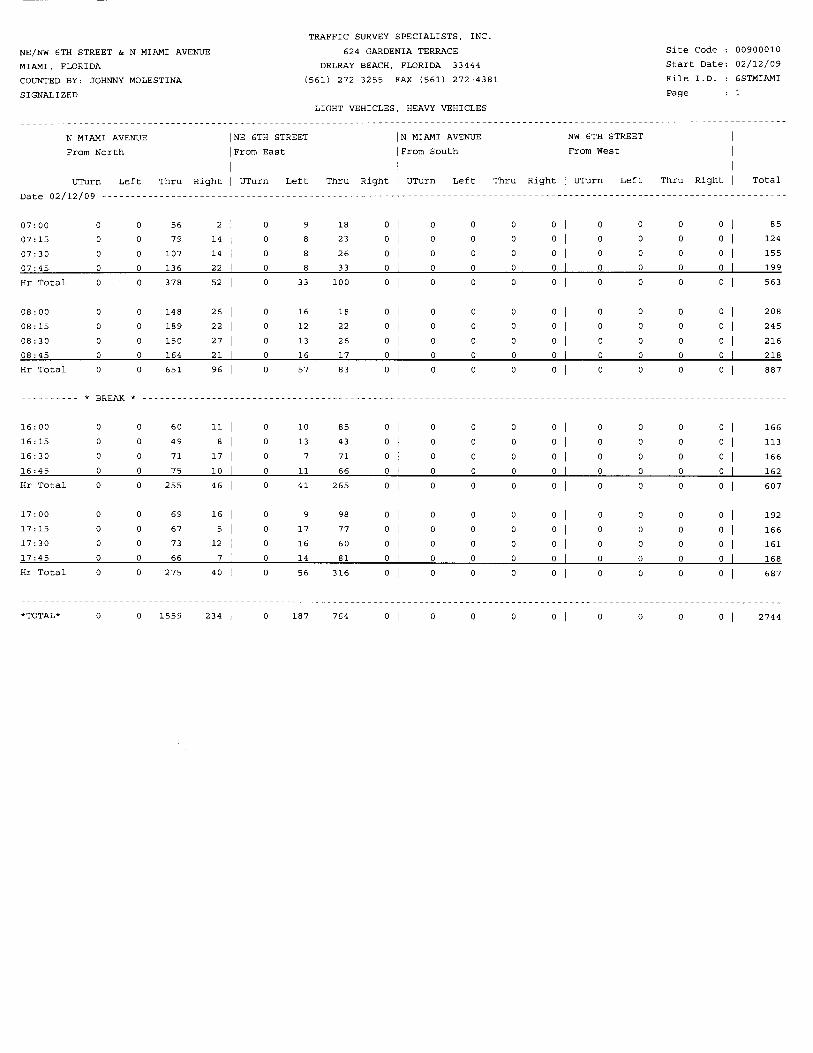

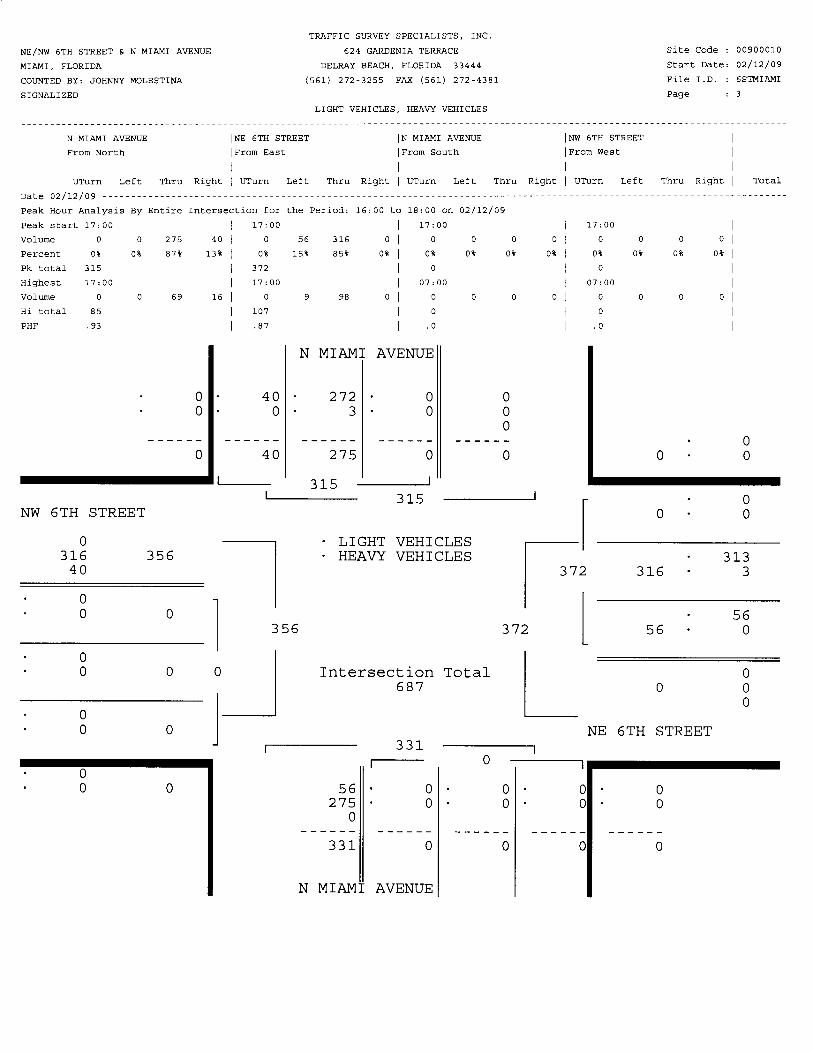

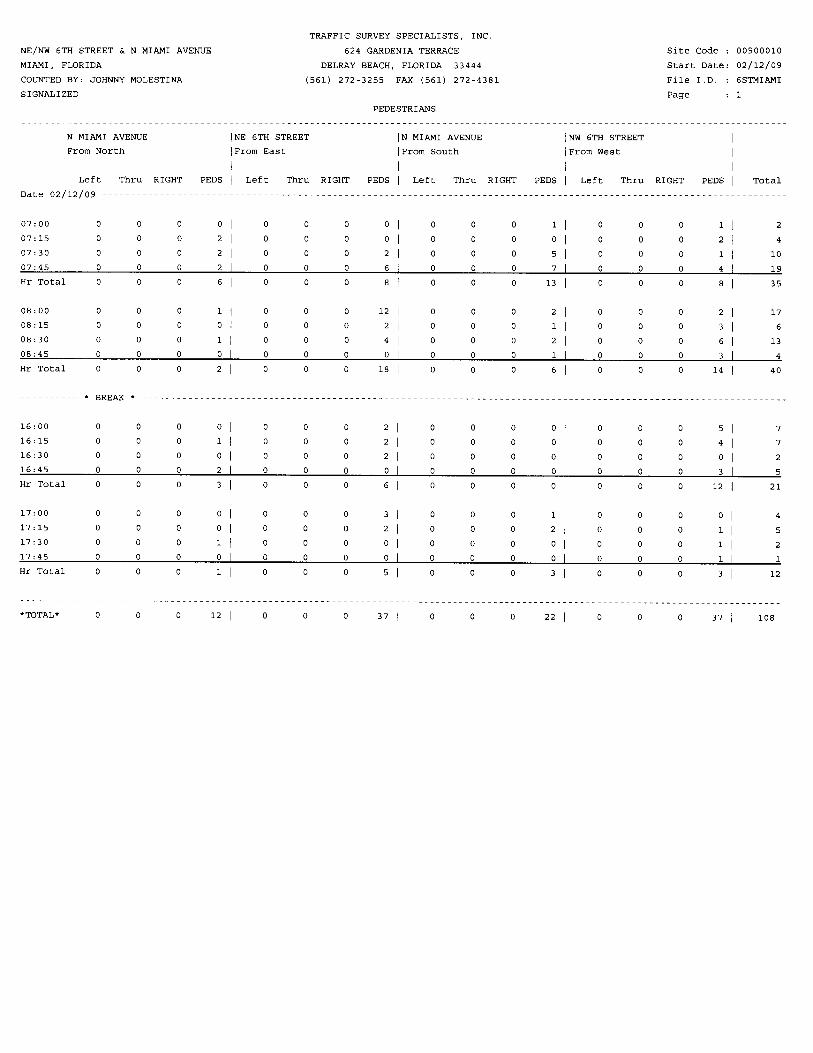


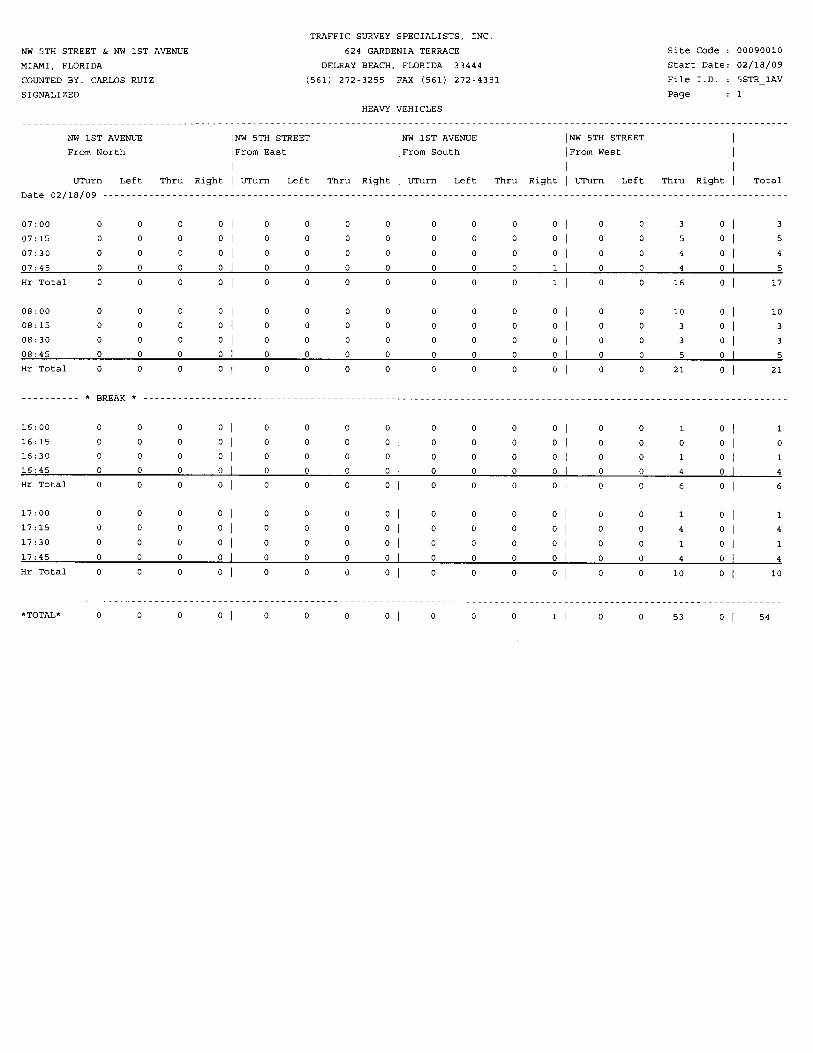
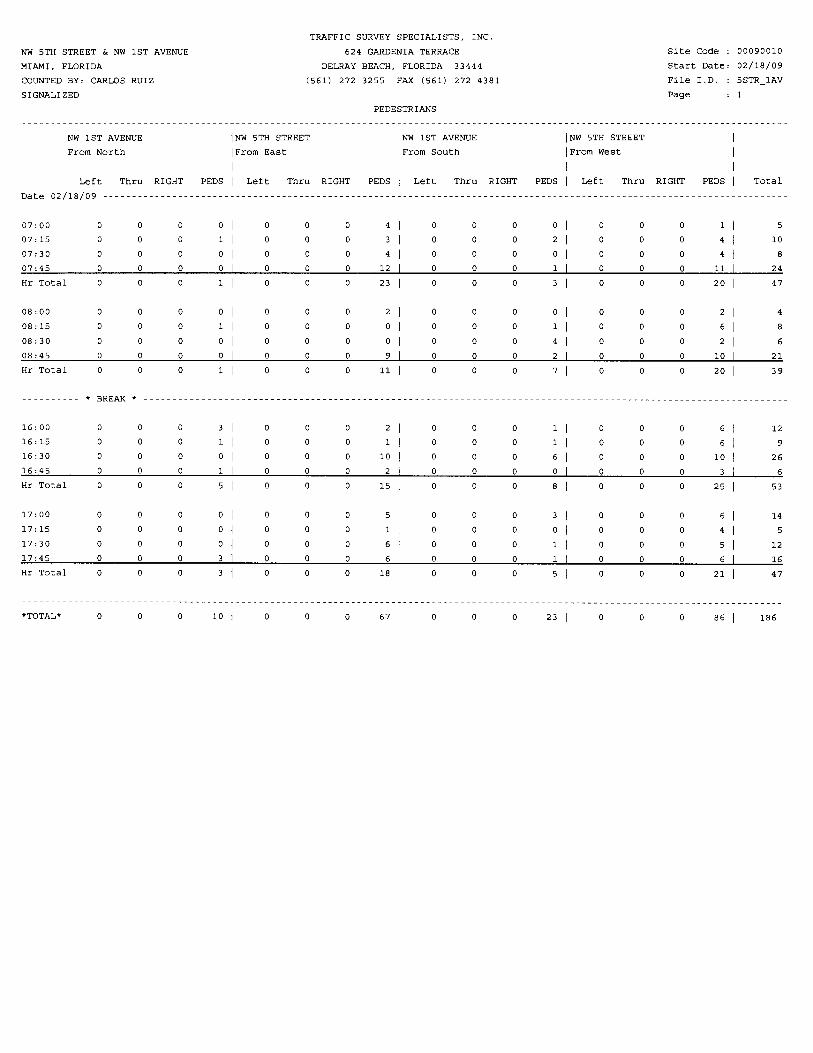


MIAMI-DADE COUNTY CHILDREN’S COURTHOUSE MUSP

MIAMI-DADE COUNTY CHILDREN’S COURTHOUSE MUSP TRAFFIC IMPACT STUDY
10 �
Richard Garcia & Associates, Inc.
Manual Turning Movement Counts (TMC) were taken at the nearby intersections surrounding the subject
site. Figure 3 is a graphical representation of the existing PM TMC’s that have been seasonally adjusted
for peak annual conditions.
Figure 3: Existing PM Peak Hour TMC's (2008)
Geometry
♦ NW 1st Avenue
NW 1st Avenue is a four lane divided non-state road. It provides connectivity in the north-
south direction. On-street parking is not permitted.
♦ NW 2nd Avenue
NW 2nd Avenue is a two lane divided non-state road. It provides connectivity in the north- south direction. On-street parking is permitted, however bus routes/stops do exist within this corridor.

MIAMI-DADE COUNTY CHILDREN’S COURTHOUSE MUSP Traffic Impact Study
19 �
Richard Garcia & Associates, Inc.
Delay LOS
20.1 C
19.2 B
22.6 C
7.2 A
18.9 B
0.2 A
0.1 A
3.4 A
1.2 A
Proposed (2011)Intersection
NW 1st Avenue & NW 3rd Street
NW 1st Avenue & NW 5th Street
NW 2nd Avenue & NW 5th Street
NW 4th Street & Driveway 1
NW 4th Street & Security Driveway (OUT)
NW 4th Street & Driveway 2
NW 3rd Street & Driveway 3
NW 2nd Avenue & NW 3rd Street
NW 2nd Avenue & NW 4th Street
Figure 7: Proposed PM Peak Hour TMC’s (2011)
Table 9: PM Proposed Level of Service (LOS)
Using the TMC’s from figure 7 the approaching volumes were determined at the site driveways. The
driveways volumes were determined by the trip distribution analysis according to the ingress and egress
calculations from the trip generation. Lastly, the LOS analysis for the driveways resulted in a range
between 0.1 to 3.4 seconds of delay which it is equivalent to level of service A Appendix H contains the
supporting documentation.

WEST LOT MULTI-USE FACILITY MUSP