Embed Size (px)
DESCRIPTION
Institute of Food and Agricultural Sciences. Downscaling GCMs to local and regional levels. Guillermo A. Baigorria e-mail: *[email protected] http://plaza.ufl.edu/gbaigorr/GB/. SECC-WMO joint Meeting on - PowerPoint PPT Presentation
Citation preview

SECC – CCSP MeetingNovember 7, 2008
Downscaling GCMsDownscaling GCMs to local and regional levels to local and regional levels
Institute of Food and Agricultural Sciences
Guillermo A. BaigorriaGuillermo A. Baigorriae-mail:e-mail: [email protected]@ifas.ufl.edu
http://plaza.ufl.edu/gbaigorr/GB/http://plaza.ufl.edu/gbaigorr/GB/
SECC-WMO joint Meeting on SECC-WMO joint Meeting on Climate Change Impacts and Adaptations to Agriculture, Forestry and FisheriesClimate Change Impacts and Adaptations to Agriculture, Forestry and Fisheries
at the National and Regional Levels at the National and Regional LevelsOrlando, Florida, USA, 18-21 November 2008Orlando, Florida, USA, 18-21 November 2008

SECC – CCSP MeetingNovember 7, 2008
James W. JonesJames W. JonesUniversity of FloridaUniversity of Florida
Muthuvel ChelliahMuthuvel ChelliahNOAA – Climate Prediction CenterNOAA – Climate Prediction Center
SECC-WMO joint Meeting on SECC-WMO joint Meeting on Climate Change Impacts and Adaptations to Agriculture, Forestry and FisheriesClimate Change Impacts and Adaptations to Agriculture, Forestry and Fisheries
at the National and Regional Levels at the National and Regional LevelsOrlando, Florida, USA, 18-21 November 2008Orlando, Florida, USA, 18-21 November 2008
James J. O’BrienJames J. O’BrienCenter for Ocean-Atmospheric Prediction Center for Ocean-Atmospheric Prediction
Studies – Florida State UniversityStudies – Florida State University
Dong W. ShinDong W. ShinCenter for Ocean-Atmospheric Prediction Center for Ocean-Atmospheric Prediction
Studies – Florida State UniversityStudies – Florida State University
James W. HansenJames W. HansenInternational Research Institute International Research Institute
for Climate and Societyfor Climate and Society

SECC – CCSP MeetingNovember 7, 2008
GB
GBGB
1 m 0.5 km 10 km
20 km 100 km 400 km
Regional NumericalClimate Model
Global NumericalClimate Model
Radardata
Spatial resolutionSpatial resolution
Weather stationdata
Low High Low HighLow High
Low High Low High
GB

SECC – CCSP MeetingNovember 7, 2008
GB
GB
Sp
ace
Sp
ace
PastPast
Weather stationWeather stationnetworknetwork
RadarRadar
dayyear~
400x
400
km2
1x1
m2
Historical Record
Climate month
Low High
FutureFuture
ClimateSeasonalclimate
RCMRCM
G/RCMG/RCM
GCMGCM
Operational levelOperational levelfor crop andfor crop andenvironmental environmental modelingmodeling
ReanalysisReanalysis
G/RCM’s hindcastsG/RCM’s hindcasts G/RCM’s forecastsG/RCM’s forecasts
GB

SECC – CCSP MeetingNovember 7, 2008
To present the different statistical downscaling
methods developed, extended and used by
the Southeast Climate Consortium (SECC)
ObjectiveObjective
GB
SECC – CCSP MeetingNovember 7, 2008
Observed latent heat flux anomalies (July)Observed latent heat flux anomalies (July)W mW m-2-2
8
6
4
2
0
-2
-4
-6
-8
-10
-12
Observed mean surfaceObserved mean surface temperature anomalies (July)temperature anomalies (July)
00
-0.2-0.2
-0.4-0.4
-0.6-0.6
-0.8-0.8
-1.0-1.0
°C°C
Weather station network Weather station network
SECC – CCSP MeetingNovember 7, 2008
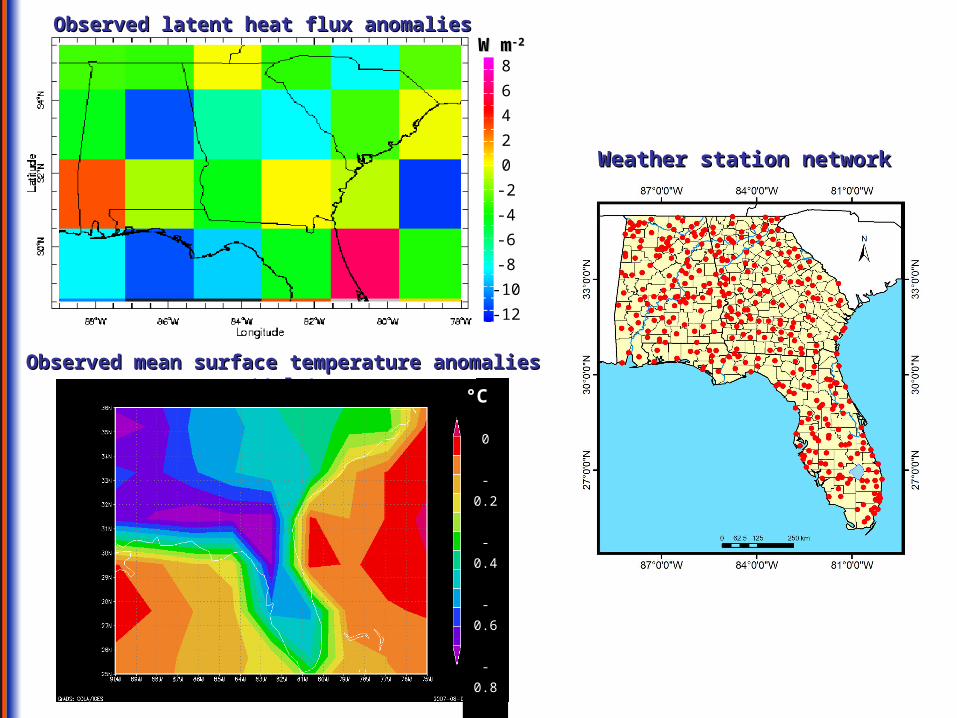
Observed latent heat flux anomalies (July)Observed latent heat flux anomalies (July)W mW m-2-2
8
6
4
2
0
-2
-4
-6
-8
-10
-12
Observed mean surfaceObserved mean surface temperature anomalies (July)temperature anomalies (July)
00
-0.2-0.2
-0.4-0.4
-0.6-0.6
-0.8-0.8
-1.0-1.0
°C°C
Weather station network Weather station network

SECC – CCSP MeetingNovember 7, 2008
0
10
20
30
40
Mar Apr May Jun Jul Aug Sep
0
3
6
9
Mar Apr May Jun Jul Aug Sep
0.0
0.2
0.4
0.6
0.8
1.0
Mar Apr May Jun Jul Aug Sep
0
30
60
90
120
150
180
Mar Apr May Jun Jul Aug Sep
County: DeKalbCounty: DeKalb
pp
qq ss
Gamma distributionGamma distribution Beta distributionBeta distribution Gaussian distributionGaussian distribution
0
10
20
30
40
50
Mar Apr May Jun Jul Aug Sep
0
4
8
12
16
Mar Apr May Jun Jul Aug Sep
x(rainfall)(rainfall) (Incoming solar radiation)(Incoming solar radiation) (Max. and Min. Temperatures)(Max. and Min. Temperatures)
GB
Observed parameterObserved parameterForecasted parameter Forecasted parameter (5(5thth, 25, 25thth, 75, 75thth, 95, 95thth percentiles percentiles from 20 ensemble members) from 20 ensemble members)
xx

SECC – CCSP MeetingNovember 7, 2008
Bias correction based on cumulative probability distributionsBias correction based on cumulative probability distributions
(a) Frequency correction(a) Frequency correction
(b) Amount correction(b) Amount correction
Observed climatologyRaw hindcast
Observed climatologyFreq. corrected
Observed climatologyFreq. corrected
Frequency correctedHindcast value
Frequency & amount correctedHindcast value
x
F(x)
x
F(x)
x
F(x)
x
F(x)
Observed climatologyFreq. & amountcorrected
GB
Baigorria, GA, Jones, JW, Shin, DW, Mishra, A, O’Brien, JJ. 2007. Assessing uncertainties in crop model simulations using daily bias-corrected regional circulation model outputs. Climate Res. 34(3): 211-222

SECC – CCSP MeetingNovember 7, 2008
GCM’s Nov-Dec-Jan rainfall dataGCM’s Nov-Dec-Jan rainfall data
GB
mm0 10 20 30 40 50
Baigorria, GA, Hansen, JW, Ward, N, Jones, JW, O’Brien, JJ. 2008. Assessing predictability of cotton yields in the Southeastern USA based on regional atmospheric circulation and surface temperatures. J. Applied Meteorol. Climatol. 47(1): 76-91
To extract the To extract the historical recordhistorical record
Time series NDJ’s Rainfall

SECC – CCSP MeetingNovember 7, 2008
GCM’s Nov-Dec-Jan rainfall dataGCM’s Nov-Dec-Jan rainfall data
GeospatialGeospatialaggregationaggregation
GB
mm0 10 20 30 40 50
Baigorria, GA, Hansen, JW, Ward, N, Jones, JW, O’Brien, JJ. 2008. Assessing predictability of cotton yields in the Southeastern USA based on regional atmospheric circulation and surface temperatures. J. Applied Meteorol. Climatol. 47(1): 76-91

SECC – CCSP MeetingNovember 7, 2008
Historical recordHistorical recordof daily valuesof daily values
Weather station network Weather station network
• Rainfall• Max temp• Min temp
Historical recordHistorical recordof Monthly valuesof Monthly values
• Rainfall• Max temp• Min temp
Te
mp
ora
l a
gg
reg
ati
on
Ge
os
pa
tia
la
gg
reg
ati
on
GB

SECC – CCSP MeetingNovember 7, 2008
GCM’s NDJ rainfall dataGCM’s NDJ rainfall data Weather station network Weather station network
Cross-validated monthly forecasts Cross-validated monthly forecasts GB
SECC – CCSP MeetingNovember 7, 2008
GB
1981
1983
1985
1987
1989
1991
1993
1995
1997
1999
2001
2003
2005
Yea
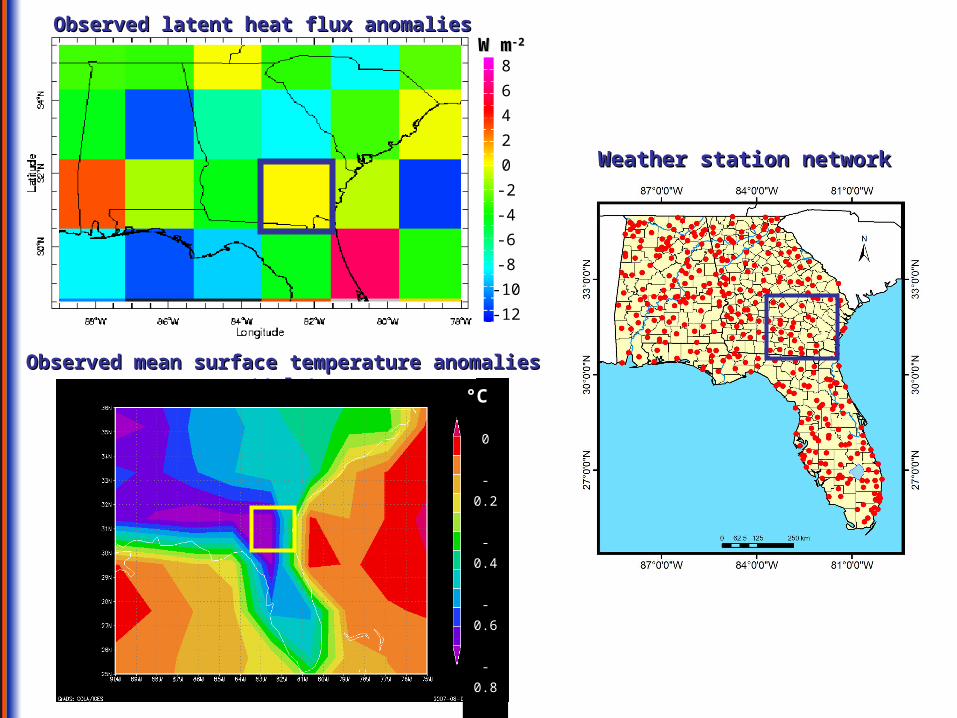
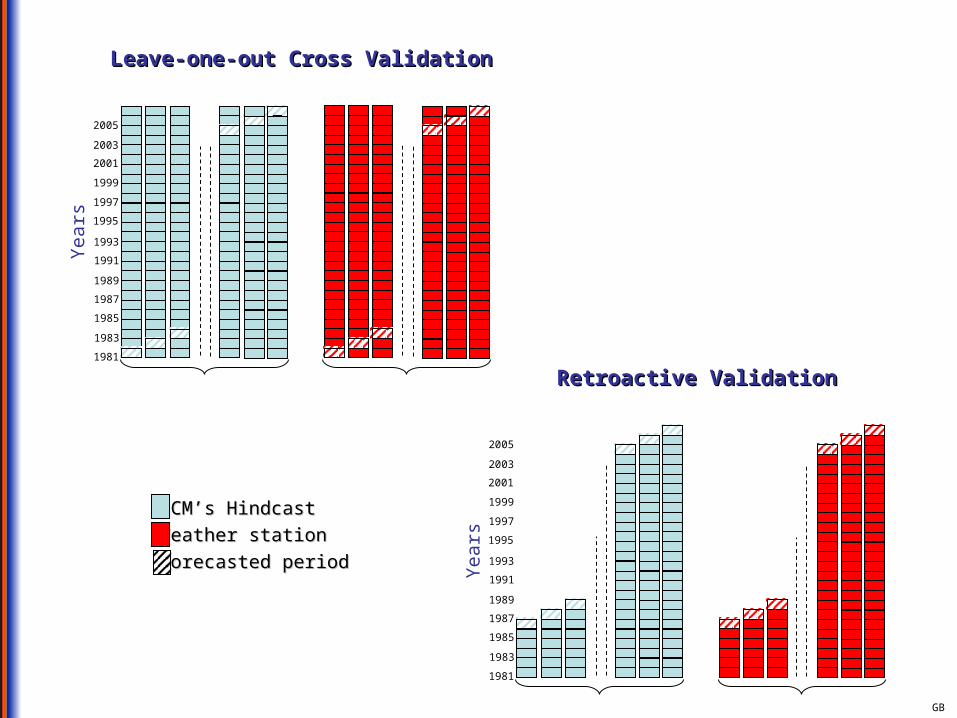
rsLeave-one-out Cross ValidationLeave-one-out Cross Validation
1981
1983
1985
1987
1989
1991
1993
1995
1997
1999
2001
2003
2005
Yea
rs
Retroactive ValidationRetroactive Validation
GCM’s HindcastGCM’s Hindcast
Weather stationWeather station
Forecasted periodForecasted period

SECC – CCSP MeetingNovember 7, 2008
Weather station network Weather station network
Historical recordHistorical recordof daily valuesof daily values
• Rainfall• Max temp• Min temp
Weather GeneratorWeather Generator
WeatherWeatherGeneratorGenerator
parametersparameters
Pa
ram
ete
re
sti
ma
tio
n
• Rainfall• Max temp• Min temp
• Rainfall• Max temp• Min temp
• Rainfall• Max temp• Min temp
• Rainfall• Max temp• Min temp
• Rainfall• Max temp• Min temp
• Rainfall• Max temp• Min temp
• Rainfall• Max temp• Min temp
Temporal downscaling
Ensemble of daily values based on the climatology for each weather station Ensemble of daily values based on the climatology for each weather station GB
rvv ˆv96.1 96.1
0 1
sofTotal
sfollowingsofP
sofTotal
sfollowingsofP
'1 #
'1 '1 #ˆ
'0 #
'0 '1 #ˆ
11
01
Temperature, Incoming solar radiation,Rainfall amount:
Rainfall events:Two-state First-order Markov Chain
SECC – CCSP MeetingNovember 7, 2008
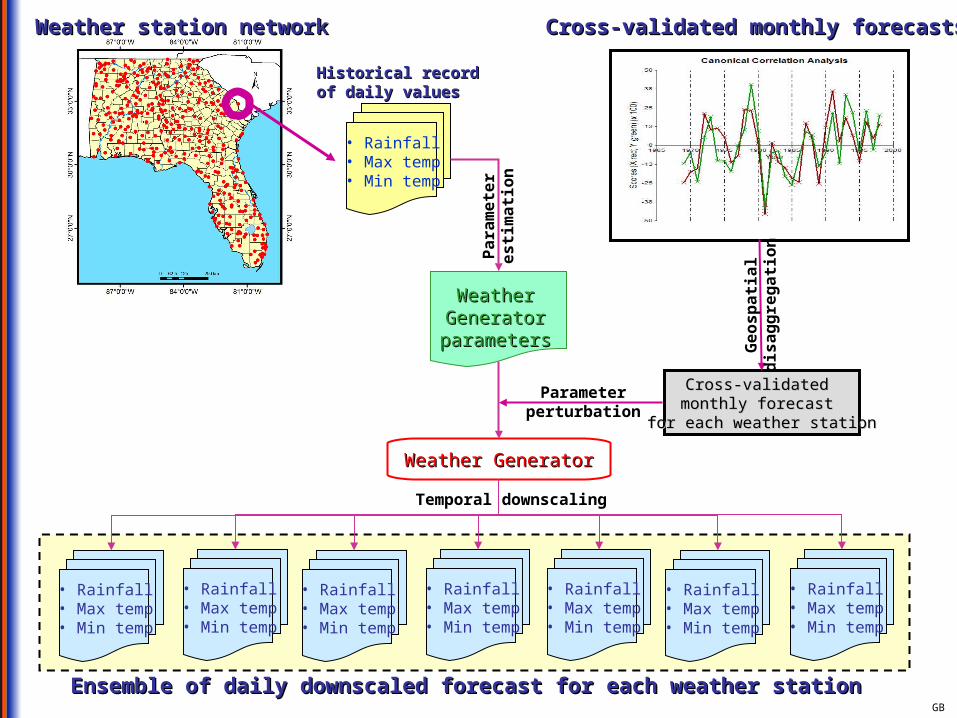
Weather station network Weather station network
Historical recordHistorical recordof daily valuesof daily values
• Rainfall• Max temp• Min temp
Weather GeneratorWeather Generator
WeatherWeatherGeneratorGenerator
parametersparameters
Pa
ram
ete
re
sti
ma
tio
n
Parameterperturbation
• Rainfall• Max temp• Min temp
• Rainfall• Max temp• Min temp
• Rainfall• Max temp• Min temp
• Rainfall• Max temp• Min temp
• Rainfall• Max temp• Min temp
• Rainfall• Max temp• Min temp
• Rainfall• Max temp• Min temp
Temporal downscaling
Ensemble of daily downscaled forecast for each weather station Ensemble of daily downscaled forecast for each weather station
Cross-validated monthly forecasts Cross-validated monthly forecasts
Cross-validated Cross-validated monthly forecast monthly forecast
for each weather stationfor each weather station
Ge
os
pa
tia
ld
isa
gg
reg
ati
on
GB
SECC – CCSP MeetingNovember 7, 2008
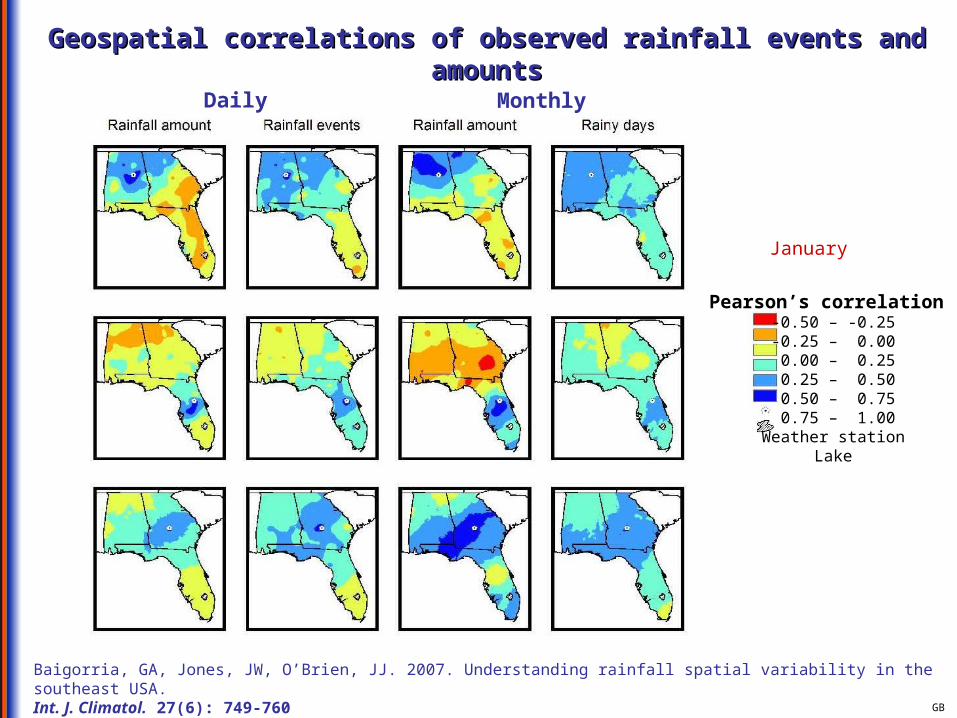
-0.50 – -0.25-0.25 – 0.00 0.00 – 0.25 0.25 – 0.50 0.50 – 0.75 0.75 – 1.00
Weather stationLake
Pearson’s correlation
Geospatial correlations of observed rainfall events and amountsGeospatial correlations of observed rainfall events and amounts
Daily Monthly
January
GB
Baigorria, GA, Jones, JW, O’Brien, JJ. 2007. Understanding rainfall spatial variability in the southeast USA.Int. J. Climatol. 27(6): 749-760

SECC – CCSP MeetingNovember 7, 2008
5050thth
5050thth 5050thth
5050thth
2525thth percentile percentile
5050thth percentile percentile
7575thth percentile percentile
Statistical distribution of Statistical distribution of downscaled datadownscaled data
Weather stationWeather station
RegionRegion
Spatial Aggregation of Downscaled Data Spatial Aggregation of Downscaled Data Using Point Weather GeneratorsUsing Point Weather Generators
Overestimation of worst and best scenariosOverestimation of worst and best scenariosGB

SECC – CCSP MeetingNovember 7, 2008
5050thth
5050thth
2525thth5050thth 2525thth
5050thth 2525thth
2525thth
2525thth percentile percentile
5050thth percentile percentile
7575thth percentile percentile
Statistical distribution of Statistical distribution of downscaled datadownscaled data
Weather stationWeather station
RegionRegion
Spatial Aggregation of Downscaled Data Spatial Aggregation of Downscaled Data Using Point Weather GeneratorsUsing Point Weather Generators
Overestimation of worst and best scenariosOverestimation of worst and best scenariosGB

SECC – CCSP MeetingNovember 7, 2008
5050thth 7575thth
5050thth
2525thth
7575thth
5050thth 2525thth
7575thth
5050thth 2525thth 7575thth
2525thth
2525thth percentile percentile
5050thth percentile percentile
7575thth percentile percentile
Statistical distribution of Statistical distribution of downscaled datadownscaled data
Weather stationWeather station
RegionRegion
Spatial Aggregation of Downscaled Data Spatial Aggregation of Downscaled Data Using Point Weather GeneratorsUsing Point Weather Generators
Overestimation of worst and best scenariosOverestimation of worst and best scenariosGB

SECC – CCSP MeetingNovember 7, 2008
-0.2
0.0
0.2
0.4
0.6
0.8
1.0
0.0 0.2 0.4 0.6 0.8 1.0
-0.2
0.0
0.2
0.4
0.6
0.8
1.0
0.0 0.2 0.4 0.6 0.8 1.0
-0.2
0.0
0.2
0.4
0.6
0.8
1.0
0.0 0.2 0.4 0.6 0.8 1.0
-0.2
0.0
0.2
0.4
0.6
0.8
1.0
0.0 0.2 0.4 0.6 0.8 1.0
Observed Pearson’s correlations (r)Observed Pearson’s correlations (r)
Gen
erat
ed r
Gen
erat
ed r
Generated rainfall for seven weather stations for a thousand yearsGenerated rainfall for seven weather stations for a thousand years
Rainfall amountsRainfall amountsRainfall eventsRainfall events
WGENWGEN WGENWGEN
GiSTGiST GiSTGiST
1:1
1:1
1:1
1:1
December-January-FebruaryMarch-April-MayJune-July-AugustSeptember-October-November
GB

SECC – CCSP MeetingNovember 7, 2008
-0.2
0.0
0.2
0.4
0.6
0.8
1.0
0.0 0.2 0.4 0.6 0.8 1.0
-0.2
0.0
0.2
0.4
0.6
0.8
1.0
0.0 0.2 0.4 0.6 0.8 1.0
-0.2
0.0
0.2
0.4
0.6
0.8
1.0
0.0 0.2 0.4 0.6 0.8 1.0
-0.2
0.0
0.2
0.4
0.6
0.8
1.0
0.0 0.2 0.4 0.6 0.8 1.0
Observed Pearson’s correlations (r)Observed Pearson’s correlations (r)
Gen
erat
ed r
Gen
erat
ed r
Generated temperatures for seven weather stations for a thousand yearsGenerated temperatures for seven weather stations for a thousand years
Minimum temperatureMinimum temperatureMaximum temperatureMaximum temperature
WGENWGEN WGENWGEN
GiSTGiST GiSTGiST
1:1
1:1
1:1
1:1
December-January-FebruaryMarch-April-MayJune-July-AugustSeptember-October-November
GB

SECC – CCSP MeetingNovember 7, 2008
0
100
200
300
400
500
600
700
800
900
1 8 15 22 29
Point weather generatorPoint weather generator
Geospatial weather generatorGeospatial weather generator
Days
Days
Generated rainfall for seven weather stations for 31 daysGenerated rainfall for seven weather stations for 31 days
Acc
umul
ated
rai
nfal
l (m
m)
Acc
umul
ated
rai
nfal
l (m
m)
Wea
ther
sta
tions
with
rai
nfal
lW
eath
er s
tatio
ns w
ith r
ainf
all
0
1
2
3
4
5
6
7
1 8 15 22 29
0
1
2
3
4
5
6
7
1 8 15 22 29
GB

SECC – CCSP MeetingNovember 7, 2008
Spatial Aggregation of Downscaled Data Spatial Aggregation of Downscaled Data Using a Geospatial Weather GeneratorUsing a Geospatial Weather Generator
Weather stationWeather station
RegionRegion
InterpolationInterpolation
7575thth percentile percentile
5050thth percentile percentile
2525thth percentile percentile
GB

SECC – CCSP MeetingNovember 7, 2008
ConclusionsConclusions
GB
1. There is no best statistical downscaling method.
2. The best method depends on the Geospatio-temporal
resolution of the input data (GCM, RCM or Reanalysis),
and the Geospatio-temporal resolution of the output
data needed.

SECC – CCSP MeetingNovember 7, 2008
ConclusionsConclusions
GB
3. But always, it is necessary to perform the downscaling
incorporating the uncertainty produced by the method.
This can be achieved by generating several equally
probable realizations and to assign probability levels
to the results.
4. For regional assessment, it is important to incorporate
the geospatial correlations among places to avoid
overestimating the worst and the best scenarios.

SECC – CCSP MeetingNovember 7, 2008
Downscaling GCMsDownscaling GCMs to local and regional levels to local and regional levels
Institute of Food and Agricultural Sciences
Guillermo A. BaigorriaGuillermo A. Baigorriae-mail:e-mail: [email protected]@ifas.ufl.edu
http://plaza.ufl.edu/gbaigorr/GB/http://plaza.ufl.edu/gbaigorr/GB/
SECC-WMO joint Meeting on SECC-WMO joint Meeting on Climate Change Impacts and Adaptations to Agriculture, Forestry and FisheriesClimate Change Impacts and Adaptations to Agriculture, Forestry and Fisheries
at the National and Regional Levels at the National and Regional LevelsOrlando, Florida, USA, 18-21 November 2008Orlando, Florida, USA, 18-21 November 2008