Embed Size (px)
Citation preview
1
Decreased Effective Macromolecular Crowding in Escherichia coli Adapted to 1
Hyperosmotic Stress 2
3
Boqun Liu,a,b Zarief Hasrat,a Bert Poolman,a,c# Arnold J. Boersmaa,d# 4
a Department of Biochemistry, Groningen Biomolecular Sciences and Biotechnology Institute, 5
University of Groningen, Groningen, The Netherlands 6
b Jilin Provincial Key Laboratory of Nutrition and Functional Food, Jilin University, 7
Changchun, People's Republic of China 8
c Zernike Institute for Advanced Materials, University of Groningen, Groningen, The 9
Netherlands 10
d DWI-Leibniz Institute for Interactive Materials, Aachen, Germany 11
12
Running Head: Macromolecular Crowding under Hyperosmotic Stress 13
# Address Correspondence to: Bert Poolman, [email protected] and Arnold J. Boersma, 14
Keywords: macromolecular crowding, osmotic stress, excluded volume, biochemical 16
organization of cytoplasm, energy status, FRET-based sensors 17
18
19
20
21
22
JB Accepted Manuscript Posted Online 4 March 2019J. Bacteriol. doi:10.1128/JB.00708-18Copyright © 2019 Liu et al.This is an open-access article distributed under the terms of the Creative Commons Attribution 4.0 International license.
on Decem
ber 22, 2020 by guesthttp://jb.asm
.org/D
ownloaded from

2
ABSTRACT Escherichia coli adapts to changing environmental osmolality to survive and 23
maintain growth. It has been shown that GFP diffusion in cells adapted to osmotic upshifts is 24
higher than expected from the increase in biopolymer volume fraction. To better understand 25
the physicochemical state of the cytoplasm in adapted cells, we now follow the 26
macromolecular crowding during adaptation with FRET-based sensors. We apply an osmotic 27
upshift and find that, after an initial increase, the apparent crowding decreases over the 28
course of hours, to arrive at a value lower than before the osmotic upshift. Crowding relates 29
to cell volume until cell division ensues, after which a transition in the biochemical 30
organization occurs. Analysis of single cells by microfluidics shows that changes in cell 31
volume, elongation and division are most likely not the cause for the transition in 32
organization. We further show that the decrease in apparent crowding upon adaptation is 33
similar to the apparent crowding in energy-depleted cells. Based on our findings in 34
combination with literature data, we suggest that adapted cells have indeed an altered 35
biochemical organization of the cytoplasm, possibly due to different effective particle-size 36
distributions and concomitant nanoscale heterogeneity. This could potentially be a general 37
response to accommodate higher biopolymer fractions yet retaining crowding homeostasis, 38
and could apply to other species or conditions as well. 39
IMPORTANCE Bacteria adapt to ever changing environmental conditions such as osmotic 40
stress and energy limitation. It is not well understood how biomolecules reorganize 41
themselves inside Escherichia coli under these conditions. An altered biochemical 42
organization would affect macromolecular crowding, which could influence reaction rates and 43
diffusion of macromolecules. In cells adapted to osmotic upshift, protein diffusion is indeed 44
faster than expected on the basis of the biopolymer volume fraction. We now probe the 45
effects of macromolecular crowding in cells adapted to osmotic stress or depleted in 46
metabolic energy with a genetically encoded fluorescence-based probe. We find that the 47
effective macromolecular crowding in adapted and energy-depleted cells is lower than in 48
unstressed cells, indicating major alterations in the biochemical organization of the 49
cytoplasm. 50
on Decem
ber 22, 2020 by guesthttp://jb.asm
.org/D
ownloaded from
3
INTRODUCTION 51
The environment induces changes in the internal organization of a cell, for example during 52
nutrient depletion or osmotic changes. Nutrient depletion halts diffusion of 100 nm-sized 53
particles,(1) while osmotic stress decreases the diffusion of 10 nm-sized proteins.(2, 3) Cells 54
adapt to environmental stresses to resume growth, but their internal structure may be 55
changed. For instance, the lateral diffusion coefficient of GFP in cells adapted to osmotic 56
stress is higher than expected from the biopolymer volume fraction.(4) The cytoplasmic 57
structure, or biochemical organization, can influence GFP diffusion in various ways, for 58
example by changing the microscopic viscosity, association of proteins with (non)specific 59
binding partners, the presence of barriers such as membrane invaginations, or sieving 60
effects by for example the nucleoid or transertions.(2, 4-6) Thus, the change in diffusion 61
indicates that the biochemical organization has undergone a change, but the nature of this 62
transition is not well understood. 63
One important aspect of cell physiology is macromolecular crowding,(7-10) which influences 64
lateral diffusion but also induces excluded volume effects. The steric repulsion between a 65
high concentration of biomacromolecules (“crowders”) reduces the configurational entropy of 66
these crowders. A biochemical reaction (“tracer”) that takes place in this environment 67
reduces its volume to maximize the configurational entropy for the crowders. This effect can 68
especially drive large complexes together where crowders are excluded from the volumes in 69
between the tracers (overlap volumes). In this manner, the excluded volume provides an 70
additional force to sort biomolecules to provide biochemical organization by favoring 71
(supra)molecular complexes and membraneless compartments. Excluded volume effects are 72
increased when for example: (i) the crowders are actually mobile and can increase their 73
translational degrees of freedom; and (ii) when they are smaller in size than the tracer.(11) 74
Thus, immobile crowders and/or crowders that are larger than the tracer is display less of the 75
crowding effect in the classical sense but can induce confinement, where the shape of the 76
confinement enforces a shape onto the tracer, instead of the minimum volume obtained in 77
on Decem
ber 22, 2020 by guesthttp://jb.asm
.org/D
ownloaded from
4
classical crowding. Macromolecular crowding, or excluded volume effects, therefore does not 78
necessarily correlate with the biopolymer volume fraction. 79
Macromolecular crowding is one of the main parameters that changes when the volume of a 80
cell changes, which can occur when the medium osmolality changes. Upon osmotic upshift, 81
the cells immediately shrink and many cells counteract this by taking up potassium ions, 82
which is best documented for E. coli.(12-14) Subsequently, E. coli synthesizes or takes up 83
available compatible solutes, and adjusts the proteome to adapt to the osmotic upshift. 84
Researchers showed that in E. coli over 300 genes are up- or downregulated by osmotic 85
upshift.(15-17) E. coli further increases its RNA/protein ratio due to an increase in ribosome 86
content when adapted to high osmotic strength,(18) possibly to compensate for the 87
decreased rate of translation. 88
We apply here a set of FRET-based sensors that enable quantification of macromolecular 89
crowding during adaptation to osmotic stress. The sensors have shown excellent 90
performance in quantification of crowding during osmotic stress in mammalian cells,(19-21) 91
and allow detailed analysis of crowding in the bacterium Escherichia coli.(19, 22) The 92
sensors vary in size, with crGE being the largest probe with a linker region that contains two 93
α-helices and three random coils in between the fluorescent proteins that form a FRET pair 94
(mCerulean3 as donor and mCitrine as acceptor). The crE6G2 sensor contains a linker with 95
two α-helices and a small random coil, while the crG18 probe contains a single long random 96
coil. 97
Using these probes, we show here that macromolecular crowding increases upon osmotic 98
upshift and returns within 2-5 hours to a level lower than the crowding prior the osmotic shift. 99
We explain the lower effective excluded volume with the hypothesis that the biochemical 100
organization of the cytoplasm is significantly altered, with components that exert less 101
excluded volume effects for molecules in the size-range of our molecular probes. 102
103
on Decem
ber 22, 2020 by guesthttp://jb.asm
.org/D
ownloaded from
5
MATERIALS AND METHODS 104
Cell growth and confocal imaging. Cell preparation, growth, and imaging were performed 105
as described in (19, 22). Briefly, the pRSET A vector containing the synthetic gene encoding 106
either crGE, crE6G2 or crG18 was transformed into E. coli BL21(DE3). The cells were 107
incubated at 30 °C, shaking at 200 rpm, in 10 mL MOPS medium pH 7.2 with 20mM glucose 108
and grown overnight. The next day, the cells were diluted into 50 mL of fresh medium to 109
OD600=0.05. When the OD600 reached 0.1 – 0.2, the cells were imaged. Subsequently, the 110
concentration of NaCl was raised to 300 mM by addition of pre-warmed 3M NaCl in MOPS 111
medium, and the cells were imaged to follow their recovery. The OD600 was monitored in 112
time, and the cell culture was diluted with pre-warmed medium (MOPS medium + 300 mM 113
NaCl) to reduce the OD600 every time from 0.3 to 0.1. For imaging, a 0.5 mL sample of cells 114
expressing one of the probes was combined with 0.5 mL of cells that contained monovalent 115
streptavidin in pRSET A (blank). A parallel culture was maintained under the same conditions 116
to provide the blank cells. The combined cells were 10× concentrated by centrifugation and 117
resuspended. Subsequently, 10 µL of the cells was transferred to a glass slide modified with 118
(3-aminopropyl) triethoxysilane and imaged on a laser-scanning microscope (Zeiss LSM 119
710). The probes were excited using a 405-mm LED, and the emission was split into a 450–120
505 (mCerulean3) and 505–797 nm (FRET) channel. The fluorescence intensities for each 121
cell were determined in ImageJ, and background originating from the blank cells was 122
subtracted. 123
Imaging in a microfluidics chamber. The microfluidic chamber (CellASIC ONIX Microfluidic 124
Plates) was pre-warmed overnight at 30 °C on the laser-scanning confocal microscope. The 125
E. coli BL21(DE3) with desired crowding probe and the control strain containing monovalent 126
streptavidin were grown overnight to an OD600 of 0.1-0.3, which is still in the exponential 127
growth phase, and they were then diluted to OD600=0.01 in MOPS-glucose minimal medium 128
and subsequently loaded in the microfluidic chamber. After loading, the cells were incubated 129
with 0.1× MOPS-glucose medium (MOPS-glucose medium diluted 10× with 0.16 M NaCl) at 130
on Decem
ber 22, 2020 by guesthttp://jb.asm
.org/D
ownloaded from
6
30 °C for 2h. After 2h, the medium in the microfluidics was replaced by 0.1×MOPS-glucose 131
medium that contained an additional 0.3 M NaCl on top of the 0.16 M. Alternatively, we used 132
600 mM and 1 M sorbitol instead of the 0.3M NaCl for osmotic upshift in the microfluidic 133
chamber. The images were collected and analyzed as described above. 134
Cell volume determination. The volume of the cytoplasm was determined by 135
PhotoActivated Localization Microscopy (PALM). The gene encoding LacY was fused to 136
YPet which can switch “on” or “off” during imaging in PALM.(23) The gene encoding LacY-137
YPet was cloned into the pACYC vector and transformed into E. coli BL21(DE3). The cells 138
(inoculated from a single colony) were grown at 30 °C, shaking at 200 rpm, in 10 mL MOPS 139
medium with 20 mM glucose, overnight. The next day, at OD600 = 0.2, the cells were induced 140
with 0.1% L-rhamnose. One hour after induction, the cells were imaged by PALM microscopy 141
before and after addition of 300 mM NaCl. 142
Coverslips were cleaned with 5 M KOH in a sonication bath for 30 minutes, and washed with 143
demineralized water and acetone (Aldrich). Next, the coverslips were plasma-cleaned for 10 144
min, and subsequently coated with 2% (v/v) (3-Aminopropyl) trioxysilane (Aldrich) in acetone 145
for 30 minutes. The coverslips were washed with demineralized water and left drying. 146
For PALM, a home-built inverted microscope based on an Olympus IX-81 with a high 147
numerical aperture objective (100 X, NA= 1.49, oil immersion, Olympus, UApo) was used. 148
Solid-state lasers were from Coherent (Santa Clara, USA): 514 nm (Sapphire 514, 100 mW). 149
Imaging was performed in semi-TIRF mode with the angle of light exiting the objective 150
adjusted to create a light sheet restricted to the bottom few micrometers of the specimen. 151
The fluorescence was recorded using an electron multiplying charge-coupled device (EM-152
CCD camera) from Hamamatsu, Japan, model C9100-13. For data acquisition and analysis, 153
LacY-YPet was continuously illuminated at 517 nm and 3000 frames were recorded with 30 154
ms for each frame. The data was analyzed with a home-written ImageJ script, in which the 155
reconstructed images of each fluorescent molecule are represented as a single spot at its 156
determined coordinates, with a brightness that corresponds to the localization accuracy.(23) 157
on Decem
ber 22, 2020 by guesthttp://jb.asm
.org/D
ownloaded from

7
Preparation of cell lysate. The E. coli BL21(DE3) cells were incubated in 10 mL MOPS with 158
20 mM glucose at 30 °C and shaking at 200 rpm overnight, and then diluted to 1 L of fresh 159
medium to OD600=0.02. When the OD600 reached 0.2, half of the culture was lysed 160
immediately, while the other half was lysed after incubation for 5 h with 300 mM NaCl. To 161
lyse the cells, the cultures were harvested by centrifugation (3000 xg, 30 minutes). The pellet 162
was resuspended in 10 mM NaPi, 100 mM NaCl, pH 7.4, containing proteinase inhibitor 163
(cOmplete™, Mini, EDTA-free). Cells were lysed by sonication for 2 minutes, with alternating 164
5 seconds sonication and 5 seconds cooling, and then centrifuged (20,000xg, 10 min). The 165
supernatant was immediately used for the fluorescence measurements. 166
Fluorometry. Fluorescence emission spectra were measured with a Fluorolog-3 (Jobin 167
Yvon) spectrofluorometer. A 1.0 mL solution (10 mM NaPi, 100 mM NaCl, 2 mg/ml BSA, pH 168
7.4) was added to a quartz cuvette and its fluorescence emission spectrum was recorded 169
after excitation at 420 nm (A). Subsequently, purified sensor was added, mixed by pipette, 170
and the fluorescence was recorded (B). The desired amount of small molecule or cell lysate 171
was added, mixed by pipette, and the fluorescence was recorded again (C). The background 172
spectrum A, prior to the addition of the probe, was subtracted from B or C. 173
OD600 measurements during FCCP treatment. A 96-well plate (Greiner) containing four 174
batches of each of the different culture/condition combinations (200 µL/well), with the 175
remaining wells filled with either filter-sterilized MOPS-glucose minimal medium or MQ water. 176
The plate was covered with gas permeable film and mounted on a plate reader (BioTek 177
PowerWave 340). While shaking the plate at 30 °C, the absorbance at 600 nm was read 178
every minute for 3.5 hours using Gen 5 software. After the plate reader measurement, the 179
OD600 values were referenced to the average of the absorbance values for MQ water, for 180
each specific time point. 181
182
183
on Decem
ber 22, 2020 by guesthttp://jb.asm
.org/D
ownloaded from

8
RESULTS 184
Macromolecular crowding decreases after an osmotic upshift. To determine the 185
crowding during adaptation to an osmotic upshift, we added 300 mM NaCl to exponentially 186
growing E. coli BL21(DE3) and allowed the cells to adapt to the increased medium 187
osmolarity. To monitor the macromolecular crowding, we expressed the crGE probe under 188
leaky expression of the T7 promoter, which prevents maturation artifacts as we described 189
previously.(24) To compare our results with literature data, we performed the experiments in 190
MOPS-glucose medium.(2, 4, 18) We find that under these conditions, the osmotic upshift 191
initially decreases the OD600 of the cell culture, which slowly recovers to pre-upshift levels 192
over about an hour. After this, the cultures maintain a steady growth rate throughout the 193
experiments (Fig. 1A). 194
We took samples from the main culture for analysis by confocal fluorescence microscopy and 195
excited the crGE probe at 405 nm, and determined the emission between 450-505 nm for 196
mCerulean3 and 505-795 nm for the FRET channel, as described previously.(19) Before the 197
upshift, the FRET/mCerulean3 is 1.06 ± 0.009 (s.e.m.; n = 98; s.d.=0.07), which immediately 198
increases to 1.12 ± 0.01 (s.e.m.; n = 98) upon addition of 300 mM NaCl (Fig. 1B). These 199
FRET/mCerulean3 ratios are equivalent to 21 % w/w and 30 % w/w Ficoll, respectively.(19) 200
The FRET/mCerulean3 ratio follows the OD600 by returning to the pre-upshift level within 1 h. 201
After this, the FRET/mCerulean3 decreases further to 1.00 ± 0.006 (s.e.m.; n = 90) over an 202
additional 1-2 h, where it remains for at least 23 h. This FRET/mCerulean3 ratio is equivalent 203
to 13 % w/w Ficoll.(19) We maintain the cells in the exponential phase of growth by 204
continuously refreshing the medium. The observations are similar for the crG18 sensor that 205
contains a different linker (Fig. S1).(22) We find that addition of 100 mM NaCl does not lead 206
to significant changes, while the addition of 500 mM NaCl provides a decrease similar to 300 207
mM NaCl (Fig. S2). This apparent threshold coincides with the occurrence of membrane 208
invaginations when 300 and 500 mM NaCl is added, which does not occur with 100 mM 209
NaCl (see also (25) and (2)). 210
on Decem
ber 22, 2020 by guesthttp://jb.asm
.org/D
ownloaded from
9
To confirm that the ratiometric FRET reports genuine changes in excluded volume, rather 211
than e.g. binding of specific molecules to the sensors, we performed a series of control 212
experiments. We investigated the influence of cell lysate on purified sensor (Fig. S3). We 213
lysed E. coli with or without 300 mM NaCl and did not find an effect of the cell-free lysate of 7 214
mg of total protein/ml on purified crG18. Hence, cytoplasmic macromolecules do not 215
specifically interact with the sensors. The same applies for small molecule (metabolites, 216
osmolytes) that are abundant in E. coli (19, 22, 26). To confirm that the probes are not 217
truncated in osmotically stressed cells, we performed SDS-PAGE analysis. The gels show 218
intact probes in control and osmotically stressed cells (Fig. S4). To assess whether the 219
mCitrine fluorescence is not quenched by acidification of the cells during adaptation, we 220
excited the mCitrine directly at 488 nm, and we did not find a decrease in intensity (Fig. S5). 221
To show that the ratiometric FRET signal is independent of the maturation of the fluorescent 222
proteins,(24) we exchanged the mCerulean3 with the faster maturing mTurquoise2 (crTC2) 223
and obtained a qualitatively similar readout (Fig. S6). Also exchanging the acceptor to 224
cpmVenus (crcpGE) did not lead to a different result, excluding effects specific to the 225
fluorescent proteins. 226
Next, we benchmarked the diffusion of the probes against GFP under conditions of osmotic 227
stress and adaptation by fluorescence recovery after photobleaching (FRAP) (Fig. 1E). The 228
median diffusion coefficient decreases from 5.6(±1.6) µm2/s to 1.6(±1.3), and subsequently 229
increases 4h after addition of NaCl to 4.2 (±0.3). The changes in diffusion do not reflect the 230
FRET of the sensor precisely, likely because factors such as immobile barriers influence 231
diffusion differently.(27) These diffusion coefficients compare to 14.1(±3.8), 1.7(±1.1) and 232
10.3(±3.1), respectively, for diffusion of GFP.(4) The last data value was obtained at 1.02 233
Osm, while our osmolarity cumulates to 0.88 Osm (the osmolarity of MOPS medium + 300 234
mM NaCl). The difference in diffusion coefficients of crGE and GFP correspond with the 235
differences in sizes, but, importantly, the relative changes in mobility indicate that they probe 236
similar biochemical organization of the cytoplasm. 237
on Decem
ber 22, 2020 by guesthttp://jb.asm
.org/D
ownloaded from
10
Macromolecular crowding relates to cell length until cells divide 238
Macromolecular crowding should relate to the volume of a cell when the number of inert 239
biomacromolecules is constant. To investigate whether the decrease in crowding indeed 240
relates to volume changes and cell growth, we determined the cell length and volume during 241
adaptation. To estimate the volume of the cells, we performed PALM measurements using 242
the inner membrane protein LacY fused to YPet. We find that the volume decreases by 30% 243
immediately after adding 300 mM NaCl (Fig. 1F), while three hours after the osmotic upshift 244
the volume has recovered to ~1.8 fL, which is 82% of the value before the upshift. When 245
measuring the length of the cells from brightfield images by confocal microscopy (Fig. 1C), 246
we find that cells immediately become shorter by 20 % upon addition of 300 mM NaCl, and 247
the length returns to the value before the osmotic upshift after 30 minutes. After 60-90 248
minutes, the average cell length starts to increase. Afterwards, when most cells divide 249
(doubling time of 2h), apparently in a synchronized manner, the average cell length 250
decreases. After this, the average length remains short in the adapted cells. The decrease in 251
length is more pronounced than in volume, which implies that the adapted cells have an 252
increased diameter. Yet, the overall trend is similar for both the cell length and volume. We 253
find that the crowding relates reciprocally with cell length and cell volume (Fig. 1D). After ~2 254
h, which coincides with the moment the cells divide, the relation between crowding and cell 255
volume no longer holds. We find these trends for both the crGE and the crG18 (Fig. S1). 256
Hence, the results indicate that the crowding as anticipated is proportional to the cell volume 257
after the osmotic upshift, but the relationship changes when cells adapt to the osmotic stress. 258
Elongation or division are not needed to change crowding 259
To assess whether cell elongation or division are strictly correlated with crowding during 260
adaptation to osmotic stress, we studied individual cells in microfluidics devices. This allows 261
comparison of cells that adapt to those that do not, and we can dissect whether or not cell 262
division influences the levels of crowding. E. coli cells growing in 0.1× MOPS-glucose 263
medium (supplemented with 160 mM NaCl) in microfluidic devices can be analyzed for at 264
on Decem
ber 22, 2020 by guesthttp://jb.asm
.org/D
ownloaded from
11
least 6 h (Fig. S7). We observed less fluctuation in apparent crowding when cells grew in 265
0.1× MOPS-glucose compared to undiluted MOPS-glucose medium, for which we currently 266
do not have an explanation. Exogenous morpholinopropanesulfonate (MOPS) accumulates 267
in E. coli(29) and may disturb its physiology. We found that the growth rate in 0.1× MOPS-268
glucose and MOPS-glucose medium are similar in a liquid culture, which is ~0.5 h-1. Hence, 269
for all the experiments in the microfluidic chamber, we incubated the cells in 0.1× MOPS-270
glucose, supplemented with 160 mM NaCl to obtain the same osmolarity as MOPS-glucose 271
medium. 272
We incubated the cells in the microfluidic chamber for 2 h, after which we replaced the 273
medium with 0.1× MOPS-glucose with 460 mM NaCl (hence 300 mM extra). To confirm that 274
crowding changes are independent of the type of crowding sensor, we compared the FRET 275
signals of crGE, crE6G2 and crG18 during the osmotic upshift. We find a similar decrease in 276
ratiometric FRET as observed in the experiments in batch culture. We further applied an 277
osmotic upshift with sorbitol, showing a similar response as equiosmolar amounts of sodium 278
chloride (Fig. S8). We counted the number of cells and noted that the cell number increased 279
steadily until the osmotic upshift, after which the osmotic stress reduces the increase 280
temporally (Fig. S9). 281
We previously found that of the three probes crE6G2 was most sensitive to changes in 282
macromolecular crowding.(22) Single cell analyses provides a significant amount of noise 283
(Fig. 2AC), yet for most cells the trend in the FRET/mCerulean3 ratio could clearly be 284
distinguished with crE6G2, allowing comparison of crowding with cell length and division time 285
(Fig. 2B). The single cells showed a transient decrease in length in the first 5 minutes after 286
osmotic upshift, which coincides with the presence of membrane invaginations. After 5 to 10 287
minutes, the cells started to elongate again. Upon addition of 300 mM NaCl, the shape of the 288
FRET/mCerulean3 response of individual cells is similar to that of ensemble measurements. 289
Although the single cell FRET/mCerulean3 data are noisy, we infer that cell division is not 290
strictly correlated with the macromolecular crowding: Cell division appears to be rather 291
on Decem
ber 22, 2020 by guesthttp://jb.asm
.org/D
ownloaded from
12
stochastic and unrelated to the FRET/mCerulean3 curve, which is similar for most of the 292
cells. Furthermore, when we compiled data of cells that grew and compared those that did 293
not grow, we do not observe a significant difference in crowding levels (Fig. 2D). In both 294
cases we find the decrease to be significant (p<0.05, student´s t test). Hence, elongation and 295
division do not necessarily drive the decrease in crowding upon adaptation to 300 mM NaCl, 296
but they coincide with the crowding changes on the population level. 297
Energy decoupling also decreases crowding 298
Next, we determined the crowding in cells that were deprived of energy by using a 299
protonophore (FCCP) to dissipate the electrochemical proton gradient, and thereby deplete 300
the cells of ATP. Energy-depleted E. coli cells undergo a transition in their internal 301
organization that hampers diffusion of 100 nm-sized but not 10 nm-sized particles.(1) Our 302
probes are in the 10 nm size range, that is, our probes behave as a disordered protein with a 303
distance between the centers of the fluorescent proteins of ~5-10 nm. Therefore, if crowding 304
would be the only factor influencing diffusion, 10 nm particles should not experience a 305
change in crowding because their diffusion does not change. If, on the other hand, native 306
biomacromolecules are assembled into larger structures, e.g. resulting in a transition of the 307
cytoplasm from a fluid into a more solid-like “colloidal glassy” state (1, 30), an inert 10 nm 308
particle could experience less crowding. Such a state could be enhanced by the depletion of 309
ATP, because ATP has been implicated as biological hydrotrope to enhance the solubility of 310
proteins (31). 311
Because the effectiveness of protonophores depends on various factors (e.g. membrane 312
concentration, E. coli strain, carbon source, medium pH), we first assessed the FCCP 313
concentration required to halt cell growth and found that 100 µM was necessary under our 314
experimental conditions (Fig. 3A). Next, we applied FCCP to exponentially growing E. coli 315
cells that contained the crGE probe, and measured the FRET/mCerulean3 ratios (Fig. 3B). 316
The measurements were performed within two minutes after addition of FCCP. We find that 317
the FRET/mCerulean3 ratio drops upon addition of FCCP and reaches values comparable to 318
on Decem
ber 22, 2020 by guesthttp://jb.asm
.org/D
ownloaded from
13
those of cells adapted to 300 mM NaCl. We thus conclude that the effective excluded volume 319
probed by crGE of 300 mM NaCl-adapted and energy-depleted cells are similar. 320
DISCUSSION 321
We have used previously developed crowding sensors to probe changes in excluded volume 322
of E. coli cells upon osmotic stress and energy depletion. We show that the effective 323
excluded volume of E. coli increases upon osmotic upshift, but subsequently decreases to 324
values below those of unstressed cells. We find that in the first 1-2h the changes in crowding 325
relate in a reciprocal manner to the cytoplasmic volume. When cells adapt to osmotic upshift 326
conditions (300 mM NaCl), the apparent crowding levels become lower than those of 327
unstressed cells. 328
Simply based on the biopolymer volume fraction, one would expect an increased 329
macromolecular crowding in cells that have adapted to growth at increased osmolarities. Yet, 330
Konopka et al. already showed for the first time that the diffusion of GFP was too high 331
compared to what was expected from the biopolymer volume fraction.(4) This in combination 332
with our result confirms that the biopolymer volume fraction is not the sole determinant of 333
crowding effects, which can be expected from theory(8) and suggests that there is a 334
structural change in the cytoplasm. Indeed, the group of Hwa recently showed that cells 335
adapted to hyperosmotic stress have a higher ribosome to overall protein ratio than before 336
osmotic stress.(18) This could explain the altered dependence on the volume fraction: 337
Ribosomes are about 20 nm in diameter while our probes contain a disordered domain and 338
are in the range of 5-10 nm, and thus should exert less of a classical excluded volume effect 339
compared to a smaller protein crowder. Moreover, if the ribosome is attached to mRNA, its 340
effective size is much larger and it would not diffuse freely, which is needed for classical 341
crowding effects. The group of Holt recently investigated the size-dependence of crowding 342
induced by ribosomes in yeast cells (32) and showed that an increased ribosome 343
concentration reduced the lateral diffusion of particles in a size-dependent manner: 40 nm 344
particles had a lower diffusion coefficient than 20 nm particles, while diffusion of 5 nm sized 345
on Decem
ber 22, 2020 by guesthttp://jb.asm
.org/D
ownloaded from
14
particles was not influenced. Thus, an increase in ribosome to overall protein ratio at the 346
same biopolymer volume fraction would diminish the crowding effect. 347
The reciprocal relation between the cell volume and crowding during the first 1-2 hours after 348
the osmotic upshift shows that the macromolecular crowding behaves in a manner that one 349
would expect from concentrating and diluting a solution of inert crowders. After this, or 350
concomitantly, a major change in the biochemical transition may occur and the relation 351
between cell volume and apparent crowding no longer holds. We cannot make a precise 352
comparison of these time scales with literature data given that the media, strain, and 353
magnitude of the upshift varies between experiments. But compatible solutes have a 354
significant influence, a role that the MOPS in our medium could assume.(29) The initial 355
response of cell elongation or volume growth after osmotic upshifts has been reported to 356
occur within a few minutes,(33-35) similar to what we observed in microfluidics for cell length. 357
The time course of the crowding transition of 1-2 hours is in the range of biopolymer 358
synthesis (and changing the proteome) and proceeds throughout the cell division stage. 359
Therefore, even though cell elongation resumes rapidly after shock, a new proteome needs 360
to be synthesized to arrive at a new crowding homeostasis over longer periods. The change 361
in crowding may be assisted by the biosynthesis of e.g. trehalose, which has been reported 362
to accumulate to maximum values in up to an hour in E. coli grown in medium without 363
compatible solutes.(36) Although the DNA content can increase under hyperosmotic 364
stress,(37) especially under higher osmotic shocks than we use, we do not consider the DNA 365
a classical crowder due to its large size and immobility. However, DNA could have an indirect 366
effect by reducing the total available volume for other crowders or act through confinement 367
mechanisms. Together, the kinetics of cell length and crowding suggest that the crowding 368
changes are initially governed by cell volume, after which the cytoplasm arrives at a new 369
state through biopolymer synthesis. 370
Although we consider an increase in the ribosome fraction of the total biopolymer content a 371
likely source of the decrease in effective macromolecular crowding, other phenomena could 372
on Decem
ber 22, 2020 by guesthttp://jb.asm
.org/D
ownloaded from
15
contribute. For example, we show here that energy dissipation decreases the effective 373
excluded volume as well, which is an effect that occurs within 2 minutes, which is too fast for 374
major changes in the proteome or/and ribosome content. Here, we achieve perhaps a state 375
where the cytoplasm is more gel-like or colloidal glassy and thus leaves more uncrowded 376
spaces for the probes to occupy.(38) Moreover, even if the sensor and the cytoplasm were 377
homogeneously mixed, crowder self-associations would decrease the excluded volume 378
effect of the crowders.(11) Such a state could be enhanced by the absence of ATP that 379
potentially acts as a hydrotope and solubilizes the proteome.(31) Hence, different 380
biochemical states of the cytoplasm could yield the same effective excluded volume. 381
CONCLUSION 382
Cells adapt to external stress to maintain cell growth. We mapped the changes in 383
macromolecular crowding during adaptation to an osmotic upshift, a condition previously 384
shown to alter the biochemical organization of the cell. We show that the cells indeed arrive 385
at a new state where the effect of the excluded volume is decreased, which may be caused 386
by alteration in the particle size distribution in the cytoplasm or change in biochemical 387
organization. This would provide a mechanism to adopt higher biopolymer volume fractions 388
while maintaining an effective crowding homeostasis with excluded volume effects tuned by 389
the particle size and/or mobility. 390
ACKNOWLEDGEMENTS 391
This work was supported by the China Scholarship Council grant to B.L., The Netherlands 392
Organization for Scientific Research program grant TOP-PUNT (project number 13.006) and 393
an ERC Advanced Grant (ABCVolume) to B.P., and The Netherlands Organization for 394
Scientific Research Vidi grant (723.015.002) to A.J.B. 395
REFERENCES 396
1. Parry BR, Surovtsev IV, Cabeen MT, O'Hern CS, Dufresne ER, Jacobs-Wagner C. 2014. The 397 bacterial cytoplasm has glass-like properties and is fluidized by metabolic activity. Cell 398 156:183-94. 399
on Decem
ber 22, 2020 by guesthttp://jb.asm
.org/D
ownloaded from
16
2. Konopka MC, Shkel IA, Cayley S, Record MT, Weisshaar JC. 2006. Crowding and confinement 400 effects on protein diffusion in vivo. J Bacteriol 188:6115-23. 401
3. Mika JT, van den Bogaart G, Veenhoff L, Krasnikov V, Poolman B. 2010. Molecular sieving 402 properties of the cytoplasm of Escherichia coli and consequences of osmotic stress. Mol 403 Microbiol 77:200-7. 404
4. Konopka MC, Sochacki KA, Bratton BP, Shkel IA, Record MT, Weisshaar JC. 2009. Cytoplasmic 405 protein mobility in osmotically stressed Escherichia coli. J Bacteriol 191:231-7. 406
5. van den Bogaart G, Hermans N, Krasnikov V, Poolman B. 2007. Protein mobility and diffusive 407 barriers in Escherichia coli: consequences of osmotic stress. Mol Microbiol 64:858-71. 408
6. Mika JT, Poolman B. 2011. Macromolecule diffusion and confinement in prokaryotic cells. 409 Curr Opin Biotechnol 22:117-26. 410
7. Zhou HX, Rivas G, Minton AP. 2008. Macromolecular crowding and confinement: 411 biochemical, biophysical, and potential physiological consequences. Annu Rev Biophys 412 37:375-97. 413
8. Rivas G, Minton AP. 2016. Macromolecular Crowding In Vitro, In Vivo, and In Between. 414 Trends Biochem Sci 41:970-981. 415
9. van den Berg J, Boersma AJ, Poolman B. 2017. Microorganisms maintain crowding 416 homeostasis. Nat Rev Microbiol 15:309-318. 417
10. Rivas G, Minton AP. 2018. Toward an understanding of biochemical equilibria within living 418 cells. Biophys Rev 10:241-253. 419
11. Hall D, Minton AP. 2003. Macromolecular crowding: qualitative and semiquantitative 420 successes, quantitative challenges. Biochim Biophys Acta 1649:127-39. 421
12. Record MT, Jr., Courtenay ES, Cayley DS, Guttman HJ. 1998. Responses of E. coli to osmotic 422 stress: large changes in amounts of cytoplasmic solutes and water. Trends Biochem Sci 423 23:143-8. 424
13. Wood JM. 2015. Bacterial responses to osmotic challenges. J Gen Physiol 145:381-8. 425 14. Shabala L, Bowman J, Brown J, Ross T, McMeekin T, Shabala S. 2009. Ion transport and 426
osmotic adjustment in Escherichia coli in response to ionic and non-ionic osmotica. Environ 427 Microbiol 11:137-48. 428
15. Cheung KJ, Badarinarayana V, Selinger DW, Janse D, Church GM. 2003. A microarray-based 429 antibiotic screen identifies a regulatory role for supercoiling in the osmotic stress response of 430 Escherichia coli. Genome Res 13:206-15. 431
16. Zhao P, Zhou Z, Zhang W, Lin M, Chen M, Wei G. 2015. Global transcriptional analysis of 432 Escherichia coli expressing IrrE, a regulator from Deinococcus radiodurans, in response to 433 NaCl shock. Mol Biosyst 11:1165-71. 434
17. Metris A, George SM, Mulholland F, Carter AT, Baranyi J. 2014. Metabolic shift of Escherichia 435 coli under salt stress in the presence of glycine betaine. Appl Environ Microbiol 80:4745-56. 436
18. Dai X, Zhu M, Warren M, Balakrishnan R, Okano H, Williamson JR, Fredrick K, Hwa T. 2018. 437 Slowdown of Translational Elongation in Escherichia coli under Hyperosmotic Stress. MBio 9. 438
19. Boersma AJ, Zuhorn IS, Poolman B. 2015. A sensor for quantification of macromolecular 439 crowding in living cells. Nat Methods 12:227-9, 1 p following 229. 440
20. Sukenik S, Ren P, Gruebele M. 2017. Weak protein-protein interactions in live cells are 441 quantified by cell-volume modulation. Proc Natl Acad Sci U S A 114:6776-6781. 442
21. Gnutt D, Brylski O, Edengeiser E, Havenith M, Ebbinghaus S. 2017. Imperfect crowding 443 adaptation of mammalian cells towards osmotic stress and its modulation by osmolytes. Mol 444 Biosyst 13:2218-2221. 445
22. Liu B, Aberg C, van Eerden FJ, Marrink SJ, Poolman B, Boersma AJ. 2017. Design and 446 Properties of Genetically Encoded Probes for Sensing Macromolecular Crowding. Biophys J 447 112:1929-1939. 448
23. van den Berg J, Galbiati H, Rasmussen A, Miller S, Poolman B. 2016. On the mobility, 449 membrane location and functionality of mechanosensitive channels in Escherichia coli. Sci 450 Rep 6:32709. 451
on Decem
ber 22, 2020 by guesthttp://jb.asm
.org/D
ownloaded from
17
24. Liu B, Mavrova SN, van den Berg J, Kristensen SK, Mantovanelli L, Veenhoff LM, Poolman B, 452 Boersma AJ. 2018. Influence of Fluorescent Protein Maturation on FRET Measurements in 453 Living Cells. ACS Sens 3:1735-1742. 454
25. Mika JT, Schavemaker PE, Krasnikov V, Poolman B. 2014. Impact of osmotic stress on protein 455 diffusion in Lactococcus lactis. Mol Microbiol 94:857-70. 456
26. Liu BQ, Poolman B, Boersma AJ. 2017. Ionic Strength Sensing in Living Cells. Acs Chemical 457 Biology 12:2510-2514. 458
27. Schavemaker PE, Boersma AJ, Poolman B. 2018. How Important Is Protein Diffusion in 459 Prokaryotes? Front Mol Biosci 5:93. 460
28. Schavemaker PE, Smigiel WM, Poolman B. 2017. Ribosome surface properties may impose 461 limits on the nature of the cytoplasmic proteome. Elife 6. 462
29. Cayley S, Record MT, Jr., Lewis BA. 1989. Accumulation of 3-(N-morpholino)propanesulfonate 463 by osmotically stressed Escherichia coli K-12. J Bacteriol 171:3597-602. 464
30. Mittasch M, Gross P, Nestler M, Fritsch AW, Iserman C, Kar M, Munder M, Voigt A, Alberti S, 465 Grill SW, Kreysing M. 2018. Non-invasive perturbations of intracellular flow reveal physical 466 principles of cell organization. Nat Cell Biol 20:344-351. 467
31. Patel A, Malinovska L, Saha S, Wang J, Alberti S, Krishnan Y, Hyman AA. 2017. ATP as a 468 biological hydrotrope. Science 356:753-756. 469
32. Delarue M, Brittingham GP, Pfeffer S, Surovtsev IV, Pinglay S, Kennedy KJ, Schaffer M, 470 Gutierrez JI, Sang D, Poterewicz G, Chung JK, Plitzko JM, Groves JT, Jacobs-Wagner C, Engel 471 BD, Holt LJ. 2018. mTORC1 Controls Phase Separation and the Biophysical Properties of the 472 Cytoplasm by Tuning Crowding. Cell 174:338-349 e20. 473
33. Rojas E, Theriot JA, Huang KC. 2014. Response of Escherichia coli growth rate to osmotic 474 shock. Proc Natl Acad Sci U S A 111:7807-12. 475
34. Pilizota T, Shaevitz JW. 2012. Fast, multiphase volume adaptation to hyperosmotic shock by 476 Escherichia coli. PLoS One 7:e35205. 477
35. Pilizota T, Shaevitz JW. 2014. Origins of Escherichia coli growth rate and cell shape changes at 478 high external osmolality. Biophys J 107:1962-1969. 479
36. Dinnbier U, Limpinsel E, Schmid R, Bakker EP. 1988. Transient accumulation of potassium 480 glutamate and its replacement by trehalose during adaptation of growing cells of Escherichia 481 coli K-12 to elevated sodium chloride concentrations. Arch Microbiol 150:348-57. 482
37. Dai X, Zhu M. 2018. High Osmolarity Modulates Bacterial Cell Size through Reducing Initiation 483 Volume in Escherichia coli. mSphere 3. 484
38. Spitzer J, Poolman B. 2013. How crowded is the prokaryotic cytoplasm? FEBS Lett 587:2094-485 8. 486
487
488
489
on Decem
ber 22, 2020 by guesthttp://jb.asm
.org/D
ownloaded from
18
490
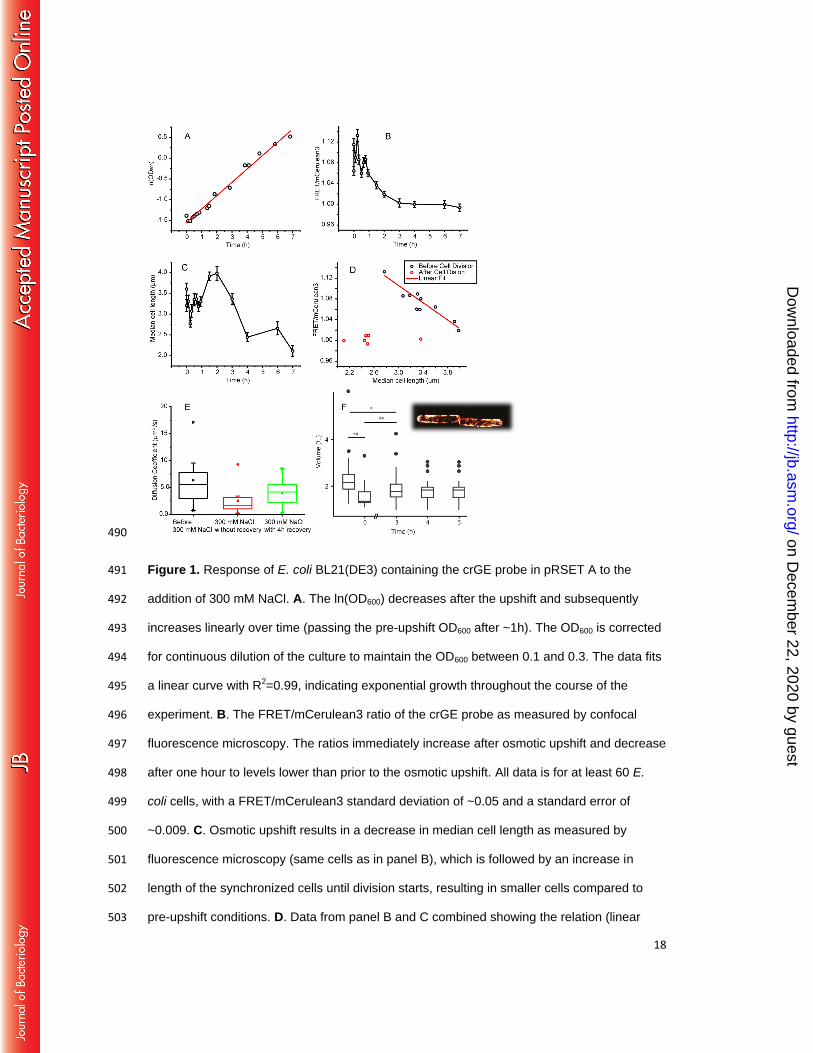
Figure 1. Response of E. coli BL21(DE3) containing the crGE probe in pRSET A to the 491
addition of 300 mM NaCl. A. The ln(OD600) decreases after the upshift and subsequently 492
increases linearly over time (passing the pre-upshift OD600 after ~1h). The OD600 is corrected 493
for continuous dilution of the culture to maintain the OD600 between 0.1 and 0.3. The data fits 494
a linear curve with R2=0.99, indicating exponential growth throughout the course of the 495
experiment. B. The FRET/mCerulean3 ratio of the crGE probe as measured by confocal 496
fluorescence microscopy. The ratios immediately increase after osmotic upshift and decrease 497
after one hour to levels lower than prior to the osmotic upshift. All data is for at least 60 E. 498
coli cells, with a FRET/mCerulean3 standard deviation of ~0.05 and a standard error of 499
~0.009. C. Osmotic upshift results in a decrease in median cell length as measured by 500
fluorescence microscopy (same cells as in panel B), which is followed by an increase in 501
length of the synchronized cells until division starts, resulting in smaller cells compared to 502
pre-upshift conditions. D. Data from panel B and C combined showing the relation (linear 503
on Decem
ber 22, 2020 by guesthttp://jb.asm
.org/D
ownloaded from
19
approximation: R2=0.82) between the FRET/mCerulean3 ratio and the median cell length 504
(black circles), which holds until the cells divide. After that, the FRET/mCerulean3 remains 505
low (red circles), which is after t=3h in panel B and C. E. Lateral diffusion of the crGE probe 506
in unstressed, and 300 mM NaCl stressed and adapted cells. The FRAP measurements 507
were carried out as described previously.(28) Displayed are the box plots generated for 508
measurements of 10-20 cells, each from the same culture to allow comparison. Box 509
represents 25-75% of the data range, whiskers is within the 1.5 interquartile range, bar in the 510
box is median, square is average, and stars are outliers. F. Cell volume changes during 511
hyperosmotic stress. E. coli BL21(DE3) expressing LacY-YPet was used and the contours 512
from single-molecule localizations by PALM were used to obtain the volumes of the cells 513
(see caption). Untreated cells are measured at t = -1h in MOPS-glucose; to capture the data 514
point at t = 0h, the cells were resuspended in MOPS medium without potassium and glucose 515
to prevent recovery, and subsequently treated with 300 mM NaCl. For time points 3, 4 and 516
5h cells were left to adapt to 300 mM NaCl in regular MOPS-glucose medium. For each data 517
point, ~30 cells were imaged and analyzed (*P<0.05, **P<0.005, paired sample t-test). 518
519
520
521
522
on Decem
ber 22, 2020 by guesthttp://jb.asm
.org/D
ownloaded from
20
523
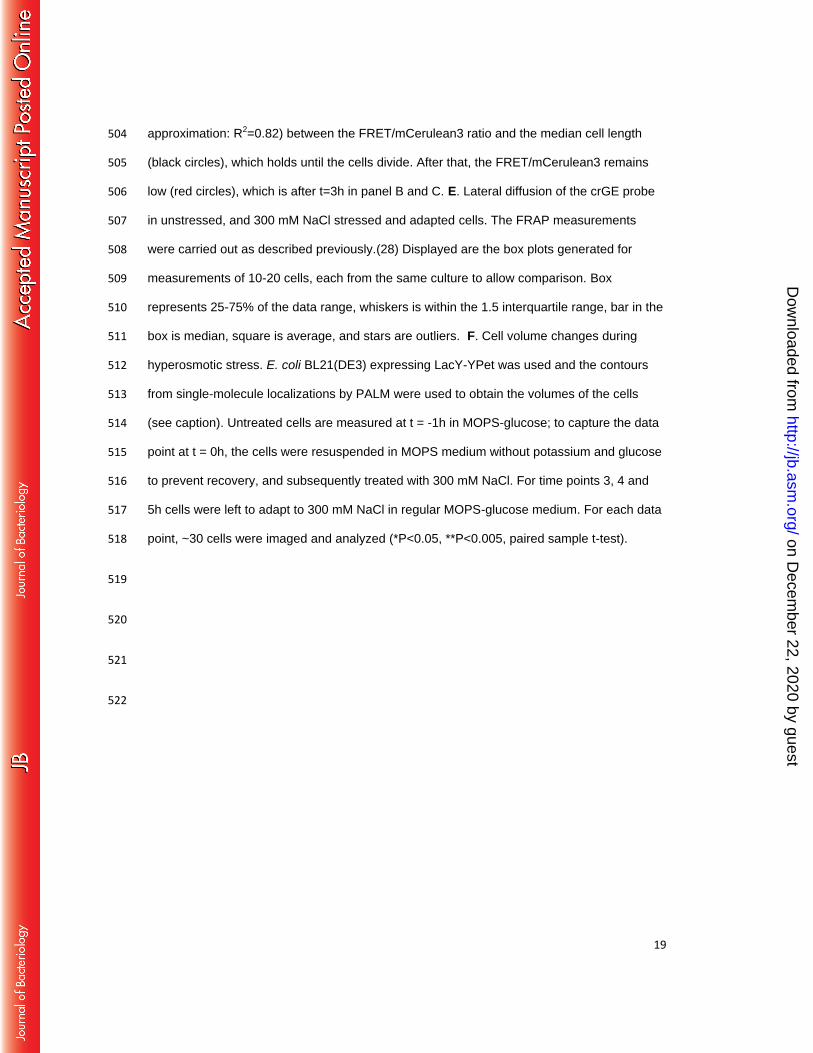
Figure 2. Single cell analysis in microfluidics, monitored by confocal microscopy. At 2h, the 524
medium flown into the chamber that holds the cells was changed from 0.1×MOPS +160 mM 525
NaCl to 0.1×MOPS +460 mM NaCl (net increase 300 mM NaCl). The E. coli BL21(DE3) cells 526
contained the crE6G2 sensor in pRSET A. A. Fluorescence intensity of a single cell over 527
time; the emission from the mCerulean3 and the FRET channel are shown. B. Cell length of 528
the same cell analyzed in panel A, showing elongation and cell division and a small transient 529
decrease in cell length following the osmotic upshift at t=2h. The time between cell divisions 530
varies significantly. C. The FRET/mCerulean3 ratio of the same cell, showing a qualitatively 531
similar time course of the crowding as in the batch experiments. D. Average of the population 532
of cells that grow after osmotic upshift (n=9) compared with cells that do not grow (n=4). 533
Shaded areas are the corresponding standard deviations. 534
on Decem
ber 22, 2020 by guesthttp://jb.asm
.org/D
ownloaded from
21
535
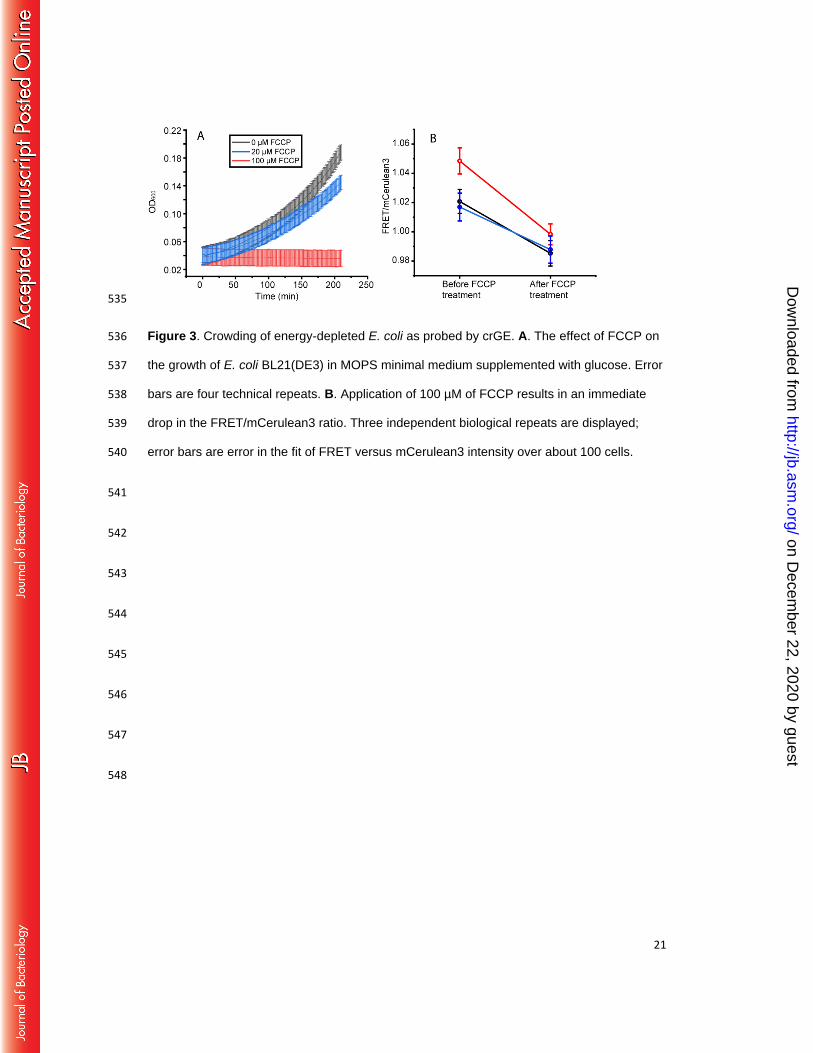
Figure 3. Crowding of energy-depleted E. coli as probed by crGE. A. The effect of FCCP on 536
the growth of E. coli BL21(DE3) in MOPS minimal medium supplemented with glucose. Error 537
bars are four technical repeats. B. Application of 100 µM of FCCP results in an immediate 538
drop in the FRET/mCerulean3 ratio. Three independent biological repeats are displayed; 539
error bars are error in the fit of FRET versus mCerulean3 intensity over about 100 cells. 540
541
542
543
544
545
546
547
548
on Decem
ber 22, 2020 by guesthttp://jb.asm
.org/D
ownloaded from
22
549
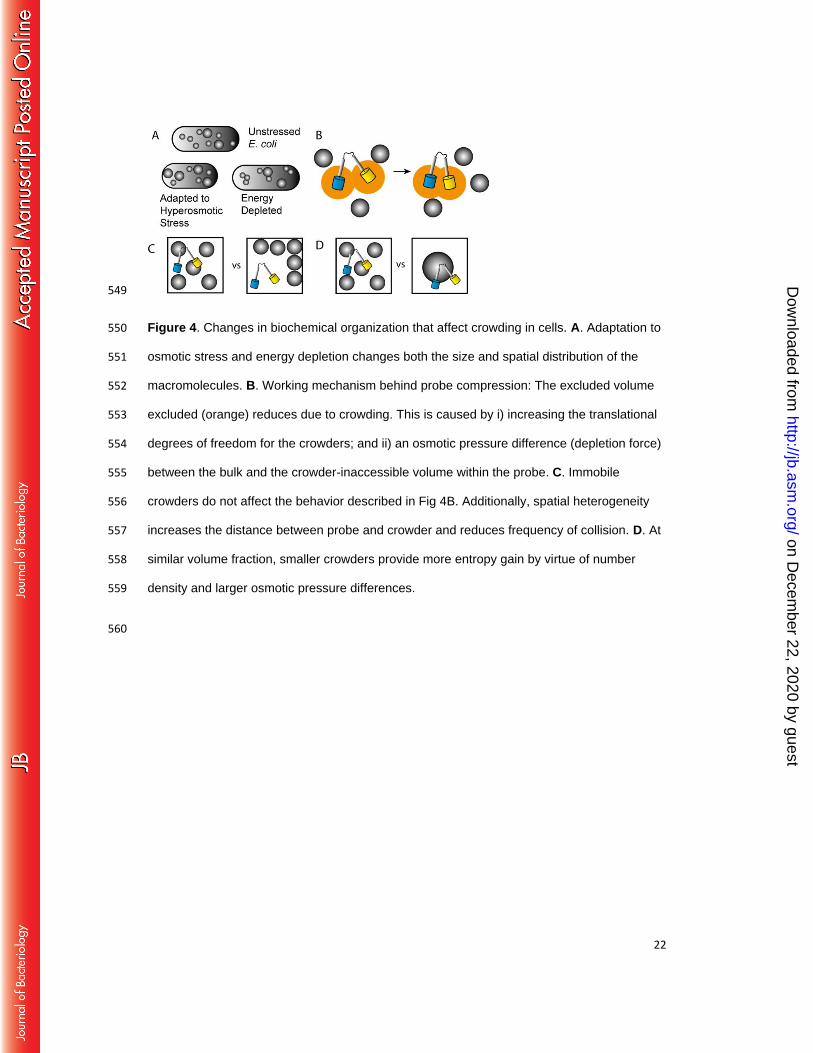
Figure 4. Changes in biochemical organization that affect crowding in cells. A. Adaptation to 550
osmotic stress and energy depletion changes both the size and spatial distribution of the 551
macromolecules. B. Working mechanism behind probe compression: The excluded volume 552
excluded (orange) reduces due to crowding. This is caused by i) increasing the translational 553
degrees of freedom for the crowders; and ii) an osmotic pressure difference (depletion force) 554
between the bulk and the crowder-inaccessible volume within the probe. C. Immobile 555
crowders do not affect the behavior described in Fig 4B. Additionally, spatial heterogeneity 556
increases the distance between probe and crowder and reduces frequency of collision. D. At 557
similar volume fraction, smaller crowders provide more entropy gain by virtue of number 558
density and larger osmotic pressure differences. 559
560
on Decem
ber 22, 2020 by guesthttp://jb.asm
.org/D
ownloaded from


![Spatiotemporal Measurement of Osmotic Pressures by FRET ......[29c, 32] In fact, ratiometric FRET sensors have previously been used to quantify macromolecular crowding in living cells,[33]](https://img.dokumen.tips/doc/110x75/60a1ef668908c0375c6607bc/spatiotemporal-measurement-of-osmotic-pressures-by-fret-29c-32-in-fact.jpg)