Embed Size (px)
Citation preview

Employers Skill Survey:Existing Survey Evidence and its use in the Analysis of Skill Deficiencies

EMPLOYERS SKILL SURVEY
Existing Survey Evidence and its use in the Analysis of Skill Deficiencies
Neil BlakeJohannah DodsSarah Griffiths
Business Strategies 192 Vauxhall Bridge Road London, SW1V 1DX
Tel: 020 7630 5959 Fax: 020 7828 1408
September 2000
Existing Survey Evidence
3

Existing Survey Evidence
4
FOREWORD
The Secretary of State for Education and Employment established theSkills Task Force to assist him in developing a National Skills Agenda. An important part of this remit was to provide evidence on the nature,extent and pattern of skill needs and shortages and their likely futuredevelopment. The research evidence assembled by the Task Force wassummarised in "Skills for all: Research Report from the National SkillsTask Force", published in June 2000.
An important contribution to the evidence was made by a major programme of new research. This included two employer surveys, detailed case studies in seven different industries and a reviewof existing surveys. We are grateful to all those who participated in this research and so contributedto the work of the task force. This report provides more detailed information on one element of thisresearch. Details of associated reports are listed in the rear of this publication.
It should be noted that the views expressed, and any recommendations made, within this report arethose of the individual authors only. Publication does not necessarily mean that either the Skills TaskForce or DfEE endorse the views expressed.
Existing Survey Evidence
5

Existing Survey Evidence
6

Existing Survey Evidence
7
Contents Introduction 9
Glossary 11
1 Summary 12
2 The Main Surveys 13
3 Evidence on Answering Practises 19
4 Basic Survey Interpretation 23
5 Statistical Analysis & Estimation 31
6 Implications 46
Annex: Current Survey Questions 47

Existing Survey Evidence
8

Existing Survey Evidence
9
INTRODUCTION
In this paper we address four questions:
• What surveys of skill deficiencies are currently produced in the UK?
• How do respondents answer the questions in the surveys?
• What can we learn from basic written reports and analysis of the survey results?
• Do more sophisticated analytical methods alter our view of the value of the survey information?
In the paper’s final section we draw some brief conclusions about how useful survey information is for the identification of skill deficiencies.
Any comments should be sent to: Dr Neil BlakeEmail: [email protected] Fax: 0171 828 1408

Existing Survey Evidence
10

Existing Survey Evidence
11
GLOSSARY
This is a technical paper, and as such it inevitably includes some technical terms. Generallythese are explained as they arise. However, some are widely used throughout the text andit may be helpful to explain their standard meanings here. Note that as part of our researchwe asked survey respondents about what they understood some of these terms to mean;the results were sometimes very different to the meanings given below.
Balance - A commonly-used way of presenting survey evidence, the balance is the difference betweenthe weighted percentage of respondents replying ‘more’ or ‘up’ to a question minus the percentagerelying ‘less’ or ‘down’. This makes possible use of a single number, with either a positive or negativevalue, to represent the answer to any question. Balances are typically used where survey respondentsare asked how an economic variable has changed or is expected to change over time. A positivevalue can be interpreted as a rise in the variable concerned, while a negative value represents a fall.However, even in those surveys where balances are widely reported, percentage results are oftengiven for skills questions (e.g. the percentage of firms reporting a significant skills shortage).
Generic Skills - These are transferable skills which can be used across occupational groups. These consist partially of ‘Key Skills’ such as communication, numeracy, problem solving, teamworking, IT and improving one’s own learning and performance. However, the term also applies to reasoning skills, work process management skills and personal values and attitudes such asmotivation, discipline, judgement, leadership and initiative.
Vocational Skills - Specific ‘technical’ skills needed to work within an occupation or occupationalgroup. Some vocational skills, such as foreign language ability, may be transferable acrossoccupational groups.
Job Specific Skills - These are skills specific to a particular job or employer and are not entirelytransferable within that occupation. These might include the ability to operate a specific piece ofequipment or familiarity with the employer’s specific working methodologies.
Skill Shortage - A situation where there is a genuine shortage in the accessible external labourmarket of the type of skill being sought, and which leads to a difficulty in recruitment. Not allrecruitment difficulties are the result of skill shortages.
Skill Gap - This arises where a deficiency in the skills of existing employees or new recruits reducesbusiness performance, rather than being manifested in a current recruitment difficulty.
Skill Deficiency - This term encompasses both skill shortages and skill gaps.

1. SUMMARY
• Many surveys are produced within the UK that address, or at least touch upon, issues to do with skill deficiencies. But the interpretation of these surveys is bedevilled by differences inmethodology, terminology, and phraseology, and also by some of the inherent ambiguities in the subject, and by suspicions over how respondents understand the terminology of questions.
• For example, about 60 per cent of respondents in the CBI manufacturing survey thought that the question regarding whether or not skilled labour was likely to limit output over the next fourmonths was concerned with difficulties in recruiting the right skilled labour, while 45 per centsaw it as reference to problems in relation to their current workforce.
• In the Skill Needs in Britain survey, a limited survey of respondents indicates that most felt their own knowledge of the skill needs, vacancies and training in their organisation was eitherexcellent or very good. Opinions were split about whether the questions were easy to answer:just under half had thought the questions had been thought provoking. Eight out of the ninerespondents were sure that they had only answered questions that they were well qualified todeal with.
• There was a general consensus that a skills gap is the difference between the skill levels ofemployees and what is required by the job, while all respondents defined a skill shortage as a lack of skilled people compared to what was needed. All respondents to the question saidthat a “suitably skilled person” was someone who had the right qualifications and experience for the job.
• Respondents were asked which actions they had taken in response to hard to fill vacancies. Most found it hard to remember their past actions.
• Such surveys and their more local counterparts are generally written up in a fairly descriptiveway. While informative, that approach means that explanations for survey phenomenon can only be conjectured. For formal hypothesis testing, more rigorous methods are needed. Anexample is given in this paper, and despite anxieties over existing surveys and the ways in which respondents often miss the intended meaning of the survey design, it appears that some important and robust conclusions can be drawn.
• Our analysis suggests that, for both manufacturing and services, there are negative associationsbetween skills shortages/recruitment difficulties and both output and employment.
• In the case of manufacturing, an increase of one percent in the number of respondents citingskills as a constraint on output is associated with an eventual fall in employment by about oneper cent.
• In the case of services, an increase of one percent in the number of respondents citing recruitmentdifficulties is associated with an eventual fall in employment by something between 1/2 and 3/4of a per cent.
• In both cases the feedback from lower employment to the skills shortages/recruitment difficultiesmeans that the actual responses to the questions understates the true extent of the problem.
• That implies in turn that it is important that future research should focus on understanding howskill needs, and skill deficiencies, evolve over time. That requires the separation of cyclical andstructural trends, but also a richer understanding of how employers respond to skill deficiencies.
Existing Survey Evidence
12

2. THE MAIN SURVEYSMany surveys are produced within the UK which address, or at least touch upon, issues to do withskill deficiencies. Many TECs have commissioned surveys of their local areas, and sectoral bodiesincluding the NTOs have done the same for their sectors. There have also been surveys on labourmarket issues such as flexible employment or social inclusion, and some of these have addressedskills issues.
The interpretation of these surveys is bedevilled by differences in methodology, terminology, andphraseology, and also by some of the inherent ambiguities in the subject (the perennial problem is “what do we really mean by the expression ‘skill’?”). Often two surveys that appear to be similaruse markedly different wording, which makes comparisons difficult. As a result, those who seek tointerpret the surveys can find it difficult to know what significance to attach to particular results.
Particularly problematic is the lack of decent time series for most skill surveys. Three notableexceptions are the Skill Needs in Great Britain (and since 1998 in Northern Ireland) survey and the more general business surveys conducted by the CBI and the British Chambers of Commerce.Between them, these three represent the fullest information available to date on the evolutionthrough time of skill deficiencies, although the Skill Needs in Britain survey is currently being replaced by the much fuller Extent, Causes and Implications of Skills Deficiencies survey, andchanges may occur at some point in the future with respect to the other surveys.
2.1 Skill Needs in Great Britain and Northern IrelandThis survey is intended to collect information about:
• the scale and pattern of employers’ recruitment difficulties and the skill gaps perceived in existing staff
• employers’ commitment to training, and
• employers’ awareness of and participation in initiatives related to training and skills.
The survey has been carried out on behalf of the DfEE annually between 1990 and 1998 and covers medium and large sized employers in Great Britain (defined as those in establishments with25 or more employees). It is intended to provide a snapshot of skill needs at the time of the survey.During the last survey, a parallel study was conducted for the first time amongst small, medium andlarge employers in Northern Ireland, although results for Great Britain are still given in the report inorder to allow comparison with previous surveys.
Survey Method and Sample Design: Each annual survey consists of around 4,000 telephoneinterviews in Great Britain and, in 1998, of about 400 telephone interviews in Northern Ireland. All public and private business sectors, with the exception of Agriculture, Forestry & Fishing, arecovered in the survey. The sampling methodology has changed over the years, but for Great Britain in 1998 it was designed to achieve a representative distribution across Government Office Region,industry sector and establishment size.
Existing Survey Evidence
13

Existing Survey Evidence
14
Reporting of Results: Results in the 1998 survey were grossed up to percentage data usingpopulation estimates derived from the Census of Employment (although again the method haschanged since the survey began). Results are therefore representative of employers in the UK with 25 or more employees.
Questions: The survey contains a series of questions relevant to analysis of skill shortages and skillgaps. Not all employers are expected to answer all questions. For example, if the existence of hardto fill vacancies is indicated, the employer is asked to answer follow-up questions, but if not theinterviewer moves in to the next section. Some examples of the questions asked in the survey aregiven below, using the precise wording adopted in the 1998 survey:
SNB1.2. Do you currently have any vacancies at this location which are proving hard-to-fill?a) Yes; b) No
SNB1.3. Which of the following reasons that I am going to read out are the causes of your hard-to-fill vacancies?
a) Not enough suitably skilled people; b) Not enough people interested in doing this type of job; c) Too much competition from other employers; d) Company doesn’t pay enough; e) Lack of technical or practical skills; f) Lack of basic ability to build upon; g) Poor attitude, motivation, or personality; h) Lack of the qualifications you demand; i) Lack of the work experience you demand; j) Inflexibility and unwillingness to accept change; k) Other; l) Don’t Know
SNB2. I’d like you to tell me the specific occupations in which you currently have vacancies at thislocation that are proving hard-to-fill?
SNB4. Thinking back over the past twelve months, have you had any vacancies at this location thatwere hard-to-fill that do not exist now?
a) Yes; b) No
SNB5. Which of these would you say is the more important reason for your not having had anyhard-to-fill vacancies at this location over the last twelve months?
a) You have not been doing much recruitment; b) You have not had any problems finding recruits
SNB7. Turning now to the overall skills needed at your location to keep it running effectively, wouldyou say that the need for skills in your average employee was… ?
a) Decreasing; b) Static; c) Increasing
SNB8. Would you say that there is a significant gap between the type of skills that your currentemployees have now, and those they need to meet your current business objectives?
a) Yes; b) No

Existing Survey Evidence
15
SNB9. Which, if any, of these skills do you think are generally lacking in your existing employees?a) Technical or practical skills; b) Literacy skills; c) Numeracy skills; d) Management skills; e) Customer handling skills; f) General communication skills; g) Computer literacy or knowledge of information technology; h) Team working skills; i) Problem solving skills; j) Managing own development
2.2 The CBI Industrial Trends Survey The CBI Industrial Trends Survey (ITS) was first introduced in 1958, and covers only manufacturingfirms. Detailed cover includes: total UK manufacturing; small, medium and large companies; 12broad industry groups1; and, 50 individual industries. Since 1972 it has been conducted on aquarterly basis (having been published three times a year between 1958 and 1971). The mostrecent survey was in January 2000.
Survey Method and Sample Design: The most recent surveys cover 800-1,500 UK firms in allmanufacturing sectors, and with no upper or lower limit on firm size. The survey is conducted by post. The results are weighted according to industrial sector, net output and employment size. The data can be disaggregated to the level of 50 industrial sectors, 11 regions and 4 size bands.
The below table summarises the survey respondents in July 1999 and July 1989 by employee sizegroup. Although the proportion of respondents within each size group is not in itself representative,the survey results are weighted to take this into account.
Reporting of Results: Much of the survey concentrates on how variables have changed and how theyare expected to change in future and past months. In contrast to the Skill Needs in Britain Survey,most of the questions put to each employer are not quantitative but are concerned with the existenceand direction of recent and imminent trends. Such results are typically presented and analysed inthe form of balances (see glossary). However, the questions most directly relevant to analysis of skilldeficiencies are reported in the form of percentages.
1 The twelve broad industry groups are: food, drink and tobacco; chemicals; metal manufacture; mechanical engineering; electrical and instrument engineering;motor vehicles and other transport equipment; metal products; textiles; other manufacturing; paper, printing and publishing; and, all other manufacturing.
Table 1: Summary of CBI ITS Survey Respondents
CBI ITS Issue: Respondents split by employment size group: Total Respondents (count)
0 - 199 200 - 499 500 - 4,999 5,000 and over
July 1989 57% 23% 18% 2% 1336
July 1999 70% 19% 10% 1% 895

Existing Survey Evidence
16
Questions: All firms in the survey are asked to answer question 14, which is most directly relevant toanalysis of skill deficiencies, and question 16c, which relates to labour constraints more generally.Question 4, 6 and 8 are also worth noting since they can be used as a proxy for the economic cycle.These questions are as follows:
Question 14. What factors are likely to limit your output over the next four months. Please tick the most important factor or factors?
a) Orders or sales; b) Skilled labour; c) Other labour; d) Plant capacity; e) Credit or finance; f) Materials or components; g) Other
Question 16c. Which factors are likely to limit (wholly or partly) your capital expenditureauthorisation over the next twelve months?
a) Inadequate net return on proposed investment; b) Shortage of internal finance; c) Inability to raise external finance; d) Cost of finance; e) Uncertainty about demand; f) Shortage of labour including Managerial and Technical staff; g) Other (please specify); h) N/A
Question 4. Is your present level of output below capacity (i.e. are you working below a satisfactoryfull rate of operation?)
a) Yes; b) No; c) N/A
ITS question 6. What has been the trend in the numbers employed over the past 4 months?a) Up; b) Same; c) Down; d) N/A
ITS question 8. What has been the trend in output over the past 4 months?a) Up; b) Same; c) Down; d) N/A

Existing Survey Evidence
17
2.3 The British Chambers of Commerce Quarterly Economic SurveyThe BCC survey covers both manufacturing and services firms, although results for each are givenseparately. The survey is quarterly and has been run since 1985, however, the results were neitherrepresentative of all UK regions nor weighted until 1989.
Survey Method and Sample Design: Each survey covers around 9,000 companies, roughly 40 percent of which are manufacturing companies and the rest are in the services sector. This makes itthe largest survey of its type in the UK, although the size of the sample has increased significantlyover time (see Table 2). There is no fixed database of companies: the British Chamber of Commercehas 60 affiliated member chambers covering the UK, each of whom chooses how to poll its members.The survey is conducted via a postal questionnaire. The below table summarises the survey respondentsin the second quarter of 1999 and 1989 by employee size group (however, only the total number of respondents was available for 1989). As is indicated in Table 2, the survey includes firms of allsizes, although the core sample is more representative of smaller firms than the CBI sample. Totalresponses have been weighted according to the actual distribution of companies by size within theUK to try to ensure representative results.
Reporting of Results: As with the ITS, many of the results are presented in balances. However,responses to the questions outlined below are all intended to present a snapshot view, and are in the form of percentages.
Questions: All firms in the survey are asked to answer the questions that are most relevant to analysisof skill deficiencies. Other questions are also worth noting since they can be used as a proxy for theeconomic cycle. These questions are as follows.
BCC7a. Have you attempted to recruit staff over the past 3 months?Yes/No
BCC7c. Did you experience any difficulties finding suitable staff? Yes/No
Table 2: Summary of BCC Survey Respondents
BCC Issue: Respondents split by employment size group: Total Respondents (count)
Manufacturing 0 - 19 20 - 199 200 - 499 500 and over
2nd quarter 1989 n.a. n.a. n.a. n.a. 1616
2nd quarter 1999 36% 53% 7% 4% 3534
Non- 0 - 19 20 - 199 200 - 499 500 and overmanufacturing
2nd quarter 1989 n.a. n.a. n.a. n.a. 1653
2nd quarter 1999 57% 36% 4% 3% 5267

Existing Survey Evidence
18
BCC7d. If yes, for which of the following categories?a) Skilled manual and technical;b) Professional and managerial;c) Clerical;d) Un and semi-skilled
BCC1. Excluding seasonal variation, domestic sales over the past 3 months are:Up / Down / Same
BCC 5.Over the past 3 months your workforce has:Increased / Remained Constant / Decreased
BCC10. Are you currently operating at:Full capacity / Below full capacity
The key point to be made here is that the kind of analysis that we have described can be suggestive ofexplanations for phenomenon but little more than that. The real need is for hypothesis testing, andthat requires more formal techniques. We discuss some such techniques in the following section, inthe context of the time series evidence from the CBI and the BCC that we described earlier.
2.4 Summary of the Main SurveysAlthough many surveys are produced in the UK that address skill deficiencies, the interpretation ofthem is bedevilled by differences in methodology, terminology, phraseology and ambiguities in thesubject. In addition, it is particularly difficult to find decent time-series for most skill surveys. Threenotable exceptions to the latter problem are the Skill Needs in Great Britain (and since 1998 inNorthern Ireland) survey and the more general business surveys conducted by the CBI and the BritishChambers of Commerce.
The Skill Needs in Great Britain (and since 1998 in Northern Ireland) survey has been carried out onbehalf of the DfEE annually between 1990 and 1998 and covers medium and large sized employersin Great Britain (defined as those in establishments with 25 or more employees). Results in the1998 survey were grossed up to percentage data using population estimates derived from theCensus of Employment (although the method has changed since the survey began). Results aretherefore representative of employers in the UK with 25 or more employees.
The CBI Industrial Trends Survey (ITS) has been running for the longest period. It was first introducedin 1958, and covers only manufacturing firms. The sample tends to be more representative of largeremploying firms. However, this is allowed for by weighting the results accordingly.
The BCC survey covers both manufacturing and services firms, although results for each are givenseparately. The survey has been run since 1985. Contrary to the CBI Industrial Trends Survey, thesample has tended to be biased toward smaller employing firms. However, since 1989, the resultshave been weighted to ensure they are representative of the UK.
Existing Survey Evidence
19
3. EVIDENCE ON ANSWERING PRACTISES
To understand the results of these surveys it is helpful to know a little about how they are typicallyanswered. As with much survey work, however, the evidence on this is disappointingly slim.
3.1 The Industrial Trends SurveyThe skills question in the Industrial Trends survey asks respondents whether a shortage of skilledlabour is likely to limit their output over the next four months. However, it is quite possible that thequestion could be interpreted as referring to internal skill gaps as well as or instead of skill shortages(commonly measured by external recruitment difficulties). Indeed, in principle Question 1b could beinterpreted as a reference to a shortage of skilled labour at that location, within the company as awhole (if applicable), in the local economy, in the economy at large, or some combination of the four.
Answers to this question could therefore involve either implicit or explicit references to both (internal)skill gaps and (external) skill shortages by employers in the survey. (The same could be said forquestion 2f, but the use of the word “shortage” possibly places a greater emphasis on quantitativerather than qualitative difficulties, and it is unlikely that this question is answered with specificreference to skilled labour.)
To investigate this the CBI has carried out occasional research into answering practises.2 In 1998companies were asked to make an assessment of how they identify skilled labour as a constraint on output. Nearly 60 per cent of companies thought that skilled labour as a constraint on outputreflected their difficulties in recruiting the right skilled labour while 45 per cent saw it as a problem in relation to their current workforce.3 In other words, companies were slightly more likely to see the question as referring to skill shortages than skill gaps. The research also showed that mostrespondents understood “skilled labour” to refer to technical/managerial staff as well as to skilledproduction line or craft workers.
It is also worth noting what respondents understood by the reference in the question to the impact ofskill shortages ‘over the next four months’. The CBI’s analysis suggests that just over half of respondentstook this to mean ‘the four months as a whole compared with the previous four months’ while a fifthof companies defined the time as applying ‘from the beginning to the end of the four-month period’.Around 10 per cent compared the four months as a whole with the same period a year ago, andsixteen per cent employed some combination of the three options. Such factors again have importantpotential consequences for statistical analysis, although the CBI report that the findings are broadlyconsistent over time, so at least the consistency of responses may not be seriously affected.
3.2 Skill Needs in Great Britain and Northern Ireland 1998In Summer 1999, for the purposes of this paper, we contacted a number of past respondents toSNIB and found twenty who were prepared to carry out follow up telephone interviews on theiranswering practices.4 We attempted to achieve a fairly wide spread of employers in the economy as a whole, although concentrating primarily on those who reported hard-to-fill vacancies or skill gaps.In total, 9 people were interviewed: 6 in manufacturing and 3 in services. The spread of responsesis illustrated in Table 3.
2 “How do Companies Respond to the CBI’s Industrial Trend Survey?”, Sudhir Junankar, CBI Economic Situation Report, January 1990; “40 Years on: How doCompanies Respond to the CBI’s Industrial Trend Survey?”, Ranjiv Mann and Sudhir Junankar, CBI Economic Situation Report, November 1998.3 It should be noted that respondents were allowed to select more than one answer in relation to this question, and hence, the proportion of respondents toselect each answer can sum to more than 100 per cent.4 We are grateful to IFF Research for enabling us to conduct this part of the research.

Existing Survey Evidence
20
3.2.1 Overview of ResponsesThis exercise was never intended to be a piece of definitive research, and the sample was clearlysmall and not completely representative. However, some broad conclusions can probably be drawn:
The majority of respondents felt that their knowledge of the skill needs, vacancies and training intheir organisation was either excellent or very good. Only two thought it average. When asked aboutthe skill needs in the industry as a whole, knowledge was more likely to be rated as good or average,with only one respondent rating it poor. Knowledge of skilled labour in the labour market as a wholetended to be less highly rated again - four thought it poor or very poor and only two thought it good.
When asked about the Skill Needs in Britain Survey questions, most respondents did not have clearmemories of the questionnaire. Two thirds considered the questions thought provoking and justunder half had thought the questions easy to answer. However, a third could not remember whetherthe questions got to the heart of their subjects. Eight out of the nine respondents were sure thatthey had only answered questions that they were well qualified to deal with.
Table 3: Summary of Responses
Sector No of Employees
25-49 50-99 100-199 200-499 500+ TOTAL
Manufacturing 2 1 - 1 2 6
Services - 2 - 1 - 3
TOTAL 2 3 0 2 2 9
Table 4: Summary of Respondents’ Rating of Knowledge of Skills, Vacancies & Training
BASE=9
Excellent/ Good Fair/ Poor Very Very Good Average Poor
Skill needs within organisation 4 3 2
Current vacancies within organisation 6 3
Training provision within organisation 5 2 2
Skill needs within their industry 1 4 3 1
Availability of skilled labour in labour 2 3 3 1 1market as a whole

Existing Survey Evidence
21
All except one respondent felt able to give definitions of skill gaps and skill shortages, and thesedefinitions were broadly similar. There was a general consensus that a skill gap was the differencebetween the skill levels of employees and what was required by job and the business with onerespondent defining it as a skilled job that was not filled. Two respondents (both human resourcespecialists) specifically mentioned that a skill gap identified a training need. All respondents defineda skill shortage as a lack of skilled people compared to what is needed.
There was also a great deal of similarity between the definitions of a hard to fill vacancy. This mainlyinvolved being unable to find people with the right qualifications, skills and/or experience needed forthe job. Only one person could not define a hard to fill vacancy and one defined a hard to fill vacancyas one where people did not stay in the job very long. For those that were asked further aboutfactors that caused hard to fill vacancies, all but one replied that other factors other than thosementioned had such a small influence as to be considered unimportant.
Similar definitions were also given for a suitably skilled person with all respondents to the questiondescribing a suitably skilled person as someone who has the right qualifications and experience forthe job. This definition had changed for half of those responding to this question and for differentreasons. For one it was the result of employing a wider range of occupations and for the other it was a lowering of requirements in order to suit what was more readily available in the labour market.
Definitions of an interested person were also similar across respondents with most reporting that itwas someone that was motivated to actually do the job for the rewards on offer. When respondentshad mentioned a shortage of interested applicants, all had meant a shortage in the number ofapplicants for the job - they had not meant that the applicants had appeared to be unmotivated or unenthusiastic.
Table 5: Summary of Responses on Skills need in Britain Questions
BASE=9
Agreed Disagreed Don’t know/can’t remember
I found the questions easy to answer 4 4 1
I found the questions thought-provoking 6 1 2
I thought that the questions did not really get to the heart of the subject they were covering 2 4 3
I only answered questions whichI felt well qualified to deal with 8 1

Respondents were asked which actions they had taken in response to hard to fill vacancies. Most found it hard to remember their past actions. When prompted, further answers were given inall but one case. When asked how the wording of the question affected their answer, the majoritydid not know how to respond. One could not say at all and 3 others felt it was probably becausetheir initial answers were actions they normally take and the other factors were more unusual and so not remembered straight away. The reverse was the case for one respondent who mentioned the more unusual action first and had to be prompted for the more regular actions usually taken in recruitment.
The question on how to define an average employee was not initially understood by about half ofrespondents and most required further prompting. One respondent could not define an averageemployee, as there was too much variety in their organisation and one used the whole workforce as a proxy for the average. The rest however, had similar ideas as to what constituted an averageemployee. This was the main occupation or the “workers” or “rank and file” rather than management.Only one respondent mentioned age. This was the same across manufacturing and service sectorfirms, with the exception of one of the latter where the average employee was defined in more abstractterms such as by the degree of their commitment.
For those respondents asked whether the economic cycle had been taken into account when reportinga rise in skill needs last year, the response was mixed. Both manufacturing firms with more than 500employees had been referring to the increase in skill needs as a result of the changes in technologyand products in their organisation. Another manufacturing firm (25-49 employees) also citedtechnology as the driver of increasing skill needs. Three respondents had just been reporting what they had been experiencing at the time and had not taken the economic cycle into account.
Tables 5 and 6 summarise the responses to questions regarding respondents’ personal knowledge ofskills in their organisation, industry and labour market as a whole; their views on the Skill Needs inBritain Survey itself, and the respondents’ response to hard to fill vacancies.
Existing Survey Evidence
22
Table 6: Actions taken to fill hard to fill Vacancies
BASE=9
Initial Prompted answers answers
Increasing salary to make job more attractive 2 1
Training existing workforce to fill the vacancy 2 2
Seeking to obtain staff from other firms (head-hunting) 1 2
Advertising / Advertising more widely 5 1
Changing internal structures and practises 1 1
Using recruitment agencies 4 1
Just carrying on looking 2 3

4. BASIC SURVEY INTERPRETATION
The value of survey evidence depends as much on the way in which the results are interpreted as on the way in which respondents reply. There is a fairly standard approach to interpretation, usedwith differing degrees of skill, in analysing surveys throughout the UK. In this section we provide an example of such an approach, looking at the analysis that Business Strategies provided toHertfordshire TEC of its 1998 skills survey. Many other examples could have been chosen: this oneillustrates the value but also the inherent limitations of what is inevitably a fairly basic approach todata interpretation.
4.1 The Hertfordshire TEC Skills SurveyThis was a telephone survey of 1,000 training managers in Hertfordshire. It was conducted in August and September of 1998. The survey results were weighted using firm size according to the number of employees by SIC Broad Industry groups in Hertfordshire - thus ensuring the resultswere representative of the Hertfordshire economy. The distribution of the respondent firms by sizeaccording to the number of employees is provided in Table 7 below.
Employment had been rising strongly in Hertfordshire and the survey showed 30 per cent of employersreporting an increase in their workforce over the last 12 months, with 17 per cent reporting a decrease.Employment levels had been constant for 53 per cent of firms.
Employers were also optimistic about future employment. Thirty-six per cent expected an expansion intheir workforce over the next 12 months while only 3 per cent of respondents expected their workforceto shrink. Fifty-six per cent expected their workforce to remain the same size and 5 per cent did not know.
Existing Survey Evidence
23
Table 7: Distribution of Respondents by the Number of Employees
Employee Size Group
1-4 5-10 11-24 25-49 50-99 100-199 200-499 500+ Count
Unweighted 9.8% 31.0% 15.8% 11.8% 13.6% 8.8% 6.6% 2.6% 1000

4.2 Recruitment DifficultiesThose employers that were currently recruiting or who had recently recruited5 were asked whetherthey had experienced recruitment difficulties over the past twelve months. On average, 24 per centof firms reported that they had experienced recruitment difficulties.
The survey results showed that firms who had increased employment over the past year were morelikely than average to have experienced recruitment difficulties. That raises the question of whetherskills deficiencies (not, of course, the same as recruitment difficulties, but certainly linked to them)are likely to be positively or negatively correlated to a rise in output. The researchers commentedthat the results were largely what they would have expected, although they also noted that recruitmentdifficulties were more common in firms whose employment decreased over the past than in thosewhose employment had remained stable. This was offered as a more surprising result, and wasinterpreted as possibly reflecting the different types of occupations required by these firms. The kindof deeper statistical analysis described later in this paper can offer a more exhaustive analysis of theunderlying issues.
The survey results also suggested that when firms with decreasing employment recruit to replaceworkers who leave, they might be searching for someone with a greater skill requirement than thelost worker, so that the new recruit can do more than one job within the firm. Only one new one may replace two lost workers, and such new multi-skilled workers may be harder to find. This is aninteresting proposition and raises questions about the measurement of skill deficiencies. However,the survey evidence itself probably cannot resolve such arguments. (The suggestion was also madethat it may be harder to attract people to work in an industry where employment is declining andwhere pay levels may not be as high as those in an expanding industry.)
Looking at the experience of firms according to their future employment intentions, the researcherscommented that the proportion that reported experiencing recruitment difficulties was higher amongstthose expecting employment levels to change over the next twelve months (whether increase ordecrease) than those expecting employment levels to remain the same.
Existing Survey Evidence
24
Table 8: Have you had Recruitment difficulties in the last 12 months?
% FIRMS
Employment over Last 12 months
Average Increased Decreased Stayed the Same
YES 24 34 27 18
NO 76 65 73 83
5 The survey questions on recruitment difficulties applied to 35 per cent of the 1000 respondents.

If we look at recruitment difficulties experienced by firms in the manufacturing and non-manufacturingsectors we see little difference between the sectors. The researchers commented that for bothmanufacturing and non-manufacturing firms, above average proportions of firms with increasingemployment reported recruitment difficulties. Average proportions of firms with decreasing employmentcited recruitment difficulties and below average proportions with stable employment had cited recruitmentdifficulties. However, with only the survey information to go on, it is hard to know how much weightto apply to these interpretations.
Looking at the experience of firms according to their future employment intentions, more differenceswere apparent between sectors. The researchers noted that small sample sizes in some categoriesmean care must be taken with these results, but the results were nevertheless quoted. However, in both sectors recruitment difficulties were more common in firms who expected to increase or todecrease employment over the following year, and this point was identified to the client.
Existing Survey Evidence
25
Table 9: Have you had Recruitment difficulties in the last 12 months?
% FIRMS
Employment over Next 12 months
Increase Decrease Stay the Same Don’t Know
YES 31 31 20 20
NO 68 69 80 80
Table 10: Have you had Recruitment difficulties in the last 12 months?
% FIRMS
MANUFACTURING NON MANUFACTURING
Employment over Past 12 months Employment over Past 12 months
Increase Decrease Stay the Same Increase Decrease Stay the Same
YES 35 24 17 34 27 18
NO 65 76 83 65 73 83
Table 11: Have you had Recruitment difficulties in the last 12 months?
% FIRMS
MANUFACTURING NON MANUFACTURING
Employment over Next 12 months Employment over Next 12 months
Increase Decrease Stay the Don’t Increase Decrease Stay the Don’t Same Know Same Know
YES 42 50 10 22 30 30 21 20
NO 59 50 90 78 69 70 79 80

4.3 Reasons for Recruitment DifficultiesA shortage of labour rather than a shortage of skills was the most commonly cited cause of recruitmentdifficulties. When asked to cite the one main reason for recruitment difficulties, a quarter of respondentscited an overall lack of applicants as causing recruitment difficulties compared to 15 per cent citing a lack of applicants with the right skills and 7 per cent reporting a lack of applicants with the rightqualifications.
The researchers remarked that the most popular reason for recruitment difficulties was the same acrossall firms i.e. an overall lack of applicants. This was less of a problem for firms who had decreasedemployment levels, where being unable to pay enough was equally as important a reason as a lackof applicants for recruitment difficulties.
Although firms who had experienced increases or decreases in employment were more likely to have experienced recruitment difficulties, they were not more likely to have cited the cause of theserecruitment difficulties as a lack of skills. There was no explicit investigation of the possibility thatapparent evidence on skill deficiencies in fact tells us nothing more than we would gain by looking at a simple cyclical indicator. However, firms who had decreased employment were more likely to reportthat it was applicants’ lack of qualifications that caused recruitment difficulties - a striking result butone which is not easy to interpret without evidence on, for example, wages or product strategy.
Differences between manufacturing and non-manufacturing firms were evident from the survey results.Manufacturing firms, whether employment had increased, decreased or remained stable, were morelikely than non-manufacturing firms to have cited that applicants lacking either the correct skills orqualifications had caused recruitment difficulties. In all cases the most commonly cited cause wason overall lack of applicants.
Existing Survey Evidence
26
Table 12: The Main Reason for Recruitment Difficulties
% FIRMS
Employment over Last 12 months
Average Increased Decreased Stayed theSame
Overall lack of applicants 25 26 20 26
Lack of applicants with skills needed by company 14 15 15 14
Lack of applicants with right attitude 12 12 11 13
Lack of applicants with right work experience 9 10 7 9
Lack of applicants with right qualifications 7 6 16 4
Competition from other employers 4 6 3 2
Pay too low 13 9 20 12
Unsociable hours/shift work 5 5 3 6
Other 11 12 5 13

Similar proportions of firms who expected to increase employment or keep their workforce stablereported the main cause of recruitment difficulties to be a lack of applicants. However, more thanaverage firms whereby employment was to increase in the future cited recruitment difficulties as aresult of skill shortages. Skill shortages and a lack of qualifications were particular problems for firmswho did not know how their employment levels would change (5 per cent of the sample). This issuggestive of a situation in which poor market information and skill shortages go together, but it isdifficult to say much more than that.
The reasons for recruitment difficulties differed most for firms who expected to decrease employmentin the future (although it must be noted that these firms only represented 3 per cent of the sample).Pay was perceived to have been the main cause, while a lack of applicants was much less of aproblem than for other firms. However, the researchers noted that the proportion citing a lack ofskilled applicants was well below average.
Manufacturing firms were also more likely to have said that recruitment difficulties had been causedby a lack of applicants with the right skills or qualifications than non-manufacturing firms, whetherthe firms in question were expecting to increase, decrease or keep employment stable.
4.4 Skill GapsFirms were asked whether there was a gap between the skills of their staff and the requirements of the job. On average, 16 per cent of firms reported a skill gap.
Firms who had decreased or increased employment were more likely than average to report a skillgap. Those firms with increasing employment were the most likely to have reported a skill gap (21per cent) followed by just under a fifth of firms where employment had decreased. Only 12 per centof firms with stable employment levels reported any skill gap in their workforce. This was interpreted
Existing Survey Evidence
27
Table 13: Reasons for Recruitment Difficulties
% FIRMS
Employment over Last 12 months
Average Increased Decreased Stayed the Don’tSame Know
Overall lack of applicants 25 24 15 27 19Lack of applicants with skills needed by company 14 17 8 10 28Lack of applicants with right attitude 12 12 12 13 4Lack of applicants with right work experience 9 10 - 9 9Lack of applicants with right qualifications 7 8 1 6 13Competition from other employers 4 4 12 2 11Pay too low 13 9 25 15 13Unsociable hours/shift work 5 3 12 7 -Other 11 13 15 10 2

by the researchers as possible evidence that expanding or contracting firms may be placing greaterdemands on their employees (as a result of these changes) compared to those who are remainingstable in employment terms. This is an important hypothesis but not something which can easily beinvestigated further.
Examining skills gaps by firms’ future employment intentions, the proportions reporting a skill gapwere higher than average in those companies who expected to change employment levels. Theresearchers noted that this was particularly the case for those firms expecting to decrease theiremployment in the future, where 29 per cent reported a skill gap in their workforce (see Table 12below). Skill gaps were least prevalent in firms who expected their workforce to remain stable or didnot know. These results support the above hypothesis that expanding or contracting firms may beplacing greater demands on their employees.
Overall, firms with increasing employment were most likely to have reported skill gaps, and firms withstable employment were least likely. When comparing manufacturing and non-manufacturing firms,non-manufacturing firms were the most likely to have reported skill gaps. Indeed, of all firmssurveyed, non-manufacturing firms with changing (increasing or decreasing) employment were themost likely to have reported a skill gap. Only a small proportion of manufacturing firms withdecreasing or stable employment reported a skill gap.
Existing Survey Evidence
28
Table 14: Is there a Skill Gap?
% FIRMS
Employment over Last 12 months
Average Increased Decreased Stayed the Same
YES 16 21 19 12
NO 84 79 81 87
Table 15: Is there a Skill Gap?
% FIRMS
Employment over Next 12 months
Increase Decrease Stay the Same Don’t Know
YES 21 29 12 12
NO 79 71 88 88

Key to tables 15 and 16:
Skills: Percentage of firms reporting skilled labour as a constraint on output over the next 4months (ITS question 14b)
Employment: Balance of firms reporting an increase in employment over the past 4 months (ITS Q6)
Output: Balance of firms reporting an increase in output over the past 4 months (ITS Q8).
Capacity: Percentage of firms working below full capacity (ITS Q4).
Investment: Balance of firms expecting to increase capital spending on plant and machinery in thenext 12 months (ITS Q3b).
A balance is the percentage reporting an increase less the percentage reporting a decrease. The full texts of the survey questions are given in the annex.
Looking at the experience of non-manufacturing and manufacturing firms according to their futureemployment intentions, more differences were apparent, but the researchers advised that smallsample sizes in some categories meant that care must be taken with these results.
Existing Survey Evidence
29
Table 16: Is there a Skill Gap?
% FIRMS
MANUFACTURING NON MANUFACTURING
Employment over Past 12 months Employment over Past 12 months
Increase Decrease Stay the Same Increase Decrease Stay the Same
YES 16 7 6 22 20 12
NO 85 92 94 78 80 86
Table 17: Is there a Skill Gap?
% FIRMS
MANUFACTURING NON MANUFACTURING
Employment over Next 12 months Employment over Next 12 months
Increase Decrease Stay the Don’t Increase Decrease Stay the Don’t Same Know Same Know
YES 13 33 6 - 22 29 12 13
NO 88 67 93 100 78 71 87 87

4.5 ConclusionsThe key point to be made here is that the kind of analysis that we have described can be suggestive of explanations for phenomenon but little more than that. The real need is for hypothesis testing, andthat requires more formal techniques. We discuss some such techniques in the following section, inthe context of the time series evidence from the CBI and the BCC that we described earlier.
Existing Survey Evidence
30

5. STATISTICAL ANALYSIS & ESTIMATION
The approach outlined in Section 4 was largely descriptive with some interpretation based on knowledgeof the subject matter. However, survey results can also be subject to more formal analysis, and weconsider here whether or not that is useful.
As a first step, Section 5.1 takes an initial look at data from the CBI’s Industrial Trends Survey to see what can be gleaned from simple manipulations of the data. We are particularly interested inconsidering the possibility that the survey evidence on skills really tells us nothing about skills assuch, and simply repeats what we already know from other questions, namely that the manufacturingsector tends to follow a cyclical pattern. In other words, are reported skill shortages simply somethingthat goes up when output or employment is increasing and vice-versa or are the surveys telling ussomething more than that?
Sections 5.2 and 5.3 then take this forward in a more formal manner, initially using bi-variate causalitytests, and then using the technique of vector autoregressive regressions (VAR) to see if anything canbe said about the causes and implications of skill deficiencies. These are techniques for dealing withcomplex interactions between times series data. The analysis in this paper implies that VAR methodsin particular may be a useful way to analyse survey results.
5.1 Cyclicality & Structural ChangeThe main CBI survey evidence relating to skills shortages/skills gaps (question 14(b)) enquires aboutwhether or not skills shortages/skills gaps are anticipated to limit future output. That is, question 14(b)states “What factors are likely to limit your output over the next four months? … b) skilled labour”.
Our initial interest is to see to what extent the CBI survey results simply vary with the state of theeconomic cycle and to what extent have changes in the level of response been structural.
Inspection of Figs. 1 to 3 suggests that the responses to the skills constraint question do vary withthe economic cycle. Figure 1 shows the movement in the series on skills as a constraint on futureoutput and (for comparison) the results for question 16c(f) about general labour shortage capitalconstraining expenditure authorisations. The data are compared with the results of question 4, which shows the proportion of firms operating below full capacity and is generally used as a proxy forthe manufacturing cycle.6 The data cover the past thirty-eight years (eighteen years for the questionabout general labour shortage capital constraining expenditure authorisations, 16c(f)).
Existing Survey Evidence
31
6 However, here too there is some room for ambiguity. The CBI has twice asked respondents whether, in defining full capacity, they measured current outputsolely against physical capacity or whether other factors were considered. In 1998 sixty five per cent had physical capacity in mind (up from 55 per cent in1989) while 35 per cent (45 per cent) also considered other factors (mainly utilisation of labour). This may have important implications for our statisticalanalysis: that is, the extent of the relationship between skill shortages and capacity, as estimated through the analysis of survey results, will depend onrespondents’ perceived definition of ‘capacity’.

Existing Survey Evidence
32
Figure 1 shows the extent of the relationship between the series over time. Put simply, skills constraintsand labour shortages go up when the economic cycle is on an upswing and fall back again when it ison a downswing.
Figure 2 shows an even closer correlation between the skills constraint question and another surveyresult that can be taken to be a measure of the state of the cycle - that is, the balance of respondentssaying that there had been an upward trend in the number employed over the past four months(question 6). (Interestingly, the degree of correlation between those respondents citing skills constraintsand those expecting an increase in employment is much the same as for those reporting an increasein employment.)
Figure 1. CBI ITS: Percentage Answering Yes to:
60 64 68 72 76 80 84 88 92 96
100
80
60
40
20
0
-20
Figure 2. CBI ITS: Percentage Answering Yes to:
58 62 66 70 74 78 82 86 90 94 98
70
60
50
40
30
20
10
0
40
20
0
-20
-40
-60
-80
Skills constraint Labour shortage constraining capital expenditure Below capacity working
Year
Perc
enta
ge
Skills constraint Employment (balance)
Skills Constraint % Emp Balance %
Year

Figure 3 below depicts the correlation between actual year on year change in manufacturing employmentand output and the balance of respondents saying that there had been an upward trend in thenumber employed over the past four months (question 6), evidencing the suitability of the latter as a measure of the state of the cycle.
Casual inspection of Figures 1 to 3 suggests that reported skills constraints do vary with the economiccycle. We now proceed to investigate this more formally. If we accept the question on employmentchange as a proxy for the cycle, an easy way to extract the cycle is to regress the skills constraintquestion on the responses to the employment change question (we have actually included the currentand lagged values of the employment change question as the skills constraint question is correlatedwith both of them). The fitted values will then be an approximation of the cyclical element, and theresiduals will be an indicator of the structural changes in the responses to the skills constraints question.The results of this exercise are shown in Figures 4 and 5 below.
Existing Survey Evidence
33
Figure 3. Measures of the State of the Economic Cycle
68 72 76 80 84 88 92 96
40
20
0
-20
-40
-60
-80
15
10
5
0
-5
-10
-15
-20
CBI ITS: Employment Balance % Actual Output and Employment YoY %
Manufacturing Output (Actual) CBI ITS: Employment Balance Manufcturing Employment (Actual)
Figure 4. CBI ITS: Skilled Labour as a constraint on Output
58 62 66 70 74 78 82 86 90 94 98
70
60
50
40
30
20
10
0
Actual Fitted
Perc
enta
ge
Year
Year

Figure 5 shows the actual residuals from the regression and a smoothed version of the series7, whichmakes the long-run trends easier to identify.
A number of features are apparent from Figures 4 and 5:
• There was a big upsurge in reported skills constraints, relative to the cycle, in the mid-sixties.This is the period associated with an increased number of labour disputes and the end of the“golden era” of post-war UK growth.
• The unparalleled effect of the Barber Boom (in 1972/73) is apparent in both Figure 4 and Figure 5 (and indeed, Figures 1 and 2). There has been nothing like the skills constraintsapparent then since.
• Figure 4 indicates that since the mid-sixties there has been a trend decline in the proportion of respondents citing a shortage of skilled labour as a constraint on output. This decline mayhave flattened off since the mid-eighties, but it is too early to say for sure.
• The variation of the skills constraint series appears to have lessened over time. We can see from Figure 4 that the skills constraints series was more volatile than the employment changeseries until around 1980, and less volatile thereafter.
• From Figure 1, and from statistical tests, we can also see that labour shortages as a constrainton capital expenditure are much less cyclical than skills constraints.
This analysis shows that although there is an obvious positive relationship between reported skillsconstraints and the economic cycle (proxied here by the reported changes in employment), there are still interesting variations in reported skills constraints once we have extracted the cycle. There is still a suspicion from Figure 5, however, that even the residuals from the equation are displaying asimilar pattern to the general economic cycle. This implies that the relationship between respondentsciting availability of skilled labour as a constraint on output and the economic cycle is non-linear.Specifically, in this case, not only is there a positive relationship between skills as a constraint and
Existing Survey Evidence
34
7 The smoothed version of the residual series was constructed using a Henderson 9-point moving average.
Figure 5. CBI ITS: Skilled Constraint - Residual
58 62 66 70 74 78 82 86 90 94 98
40
30
20
10
0
-10
-20
Actual Smoothed
Year
Perc
enta
ge

employment growth but skills constraints show up as being particularly severe when employment isgrowing very rapidly and vice-versa.
If this is the whole story, with skills shortages being caused by the economic cycle and the survey resultstelling us little about the impact of skills shortages on the rest of the economy, then skills play a verysecondary part. However, we cannot yet conclude that skills constraints are simple a reflection of theeconomic cycle as the link between skills and the cycle may be more complex than that - indeed, theCBI question is seeking evidence of a negative relationship between skills shortages and output and,by implication, employment.
How does the evidence in Figures 1 to 5 fit in with the expectation of a negative relationship? Theanswer lies in the relationship over time. Figure 6 shows the correlation between reported changesin both employment and output from the survey and lagged values of the responses to the skillsconstraints question. From this we can postulate that, while the series move together over time (that is, the immediate relationship is positive) the negative relationship is captured by looking at the relationship between current and lagged values of the series’. That is, the negative relationshipseems to exist as a cause-and-effect type relationship. For example, the simple correlation coefficientbetween the reported change in employment and the proportion of respondents citing skills shortagesas a constraint on output at the same point in time is 0.694. A quarter earlier the correlation islower, and two quarters earlier the correlation is lower still - and so on, until the correlation with theresponses to the skills constraint question six quarters earlier is actually negative. While it can beseen that the relationship between the responses to the skills constraint question and changingoutput is not as strong as the relationship with changing employment, it does go negative sooner.
We have to be careful with this kind of analysis, since all we might be picking up are cycles that areout of step with one another, rather than a causal relationship. Nonetheless, we appear to be movingtowards a type of “stop-go” model in which a number of the survey variables are linked over time,with skills deficiencies playing a part in generating the cycle where increases in employment arefollowed by decreases and subsequently by increases, and so on. The diagram below illustrates the idea, and the following sections examine the idea more rigorously.
Existing Survey Evidence
35
Figure 6. Correlation of Kills constraints with Employment & Output
0 1 2 3 4 5 6 7 8
0.8
0.6
0.4
0.2
0.0
-0.2
-0.4
-0.6
Change in employment Change in output
Cor
rela
tion
Coe
ffici
ent
Lag Quarters

Furthermore, a study by Nickell and Nicolitsas8, 1999, investigates the existence of any connectionbetween the availability of human capital and the rates of accumulation of physical capital (fixedcapital investment) or knowledge capital (R&D expenditure). The outcome of this study suggested anegative relationship existed9 between a shortage of skilled labour and subsequent investments andR&D expenditure - thus raising the idea that investment in human capital and physical/knowledgecapital are strategic complements. Using this idea, an increase in the skills constraints would lead to a subsequent fall in investment and consequently output as hypothesised in the diagram above.
It must be stressed that there are other impacts of skill shortages on output. For instance, Haskel andMartin10, 1993, using a panel of 81 3-digit industries over 1980 - 1986, merged with industry skillshortage information from the CBI Industrial Trends Survey, investigated the hypothesis that skilledlabour shortages reduce productivity. The results concluded that, with all else held constant, theincrease in skill shortages over the mid-80s significantly reduced productivity growth. Shortages ofunskilled workers, however, were found to have no significant effect. Two arguments were used toprovide support for the hypothesis, these ran as follows: firstly, shortages increase the cost of hiringskilled labour leading firms to substitute toward cheaper, less productive unskilled labour; and secondly,shortages may put workers in a position of stronger bargaining power in which an easier pace of workcan be demanded.
There may be supply-side reactions that could act to negate the cycle depicted in the diagram above.For example, an increase in output could lead to an increase in firms’ training provision in the anticipationof future needs. This would break the circle. The results presented below, however, are consistentwith any supply-side being insufficient to fully break out the circle. There is also a role for an exogenoussupply-side input. If training provision increases there will be a decrease in skills as a constraint onoutput, and subsequent increases in output and employment. This is consistent with the findingsreported below. It is also consistent with Nickell and Nicolitsas11 who argue that an increase inhuman capital (in the form of an increase in the provision of training) will lead to an increase ininvestment and output.
Existing Survey Evidence
36
Increase in Employment
Increase in skills constraint
Decrease in Output
Increase in Output
Decrease in Employment
Relaxation of skills constraint
ff
ff
ff
8 Nickell, S. and Nicolitsas, D. (1999), Human capital, investment and innovation: what are the connections?, R. Barrell, G. Mason, M. O’Mahony (eds.),Productivity, Innovation and Economic Performance, Cambridge: Cambridge University Press.9 The results of the study suggested that a 10 percentage point increase in the number of firms reporting skilled labour shortages in the manufacturingindustry (in this case) will lead to a sustained 10 per cent reduction in its fixed capital investment and an unsustained 4 per cent reduction in R&D expenditure. 10 Haskel, J. and Martin, C. (1993), Do skill shortages reduce productivity? Theory and evidence from the United Kingdom. Economic Journal, 103 (March),386 - 394, Blackwell Publishers, Cambridge.11 Nickell, S. and Nicolitsas, D. (1999), Human capital, investment and innovation: what are the connections?, R. Barrell, G. Mason, M. O’Mahony (eds.),Productivity, Innovation and Economic Performance, Cambridge: Cambridge University Press.

Existing Survey Evidence
37
12 The usual statistical terminology is that A Granger causes B.
5.2 Granger CausalityWe will now use more formal statistical techniques to investigate whether there is any evidence ofthe kind of dynamic feedback loops suggested in the previous section.
Simms-Granger causality tests are statistical tests of the possibility of a causal link running from onevariable (one survey question) to another. More precisely, they are tests of whether or not changesto one variable pre-date changes to another. The possible outcomes are that A causes B12, that Bcauses A, that there is joint causality (i.e. A causes B and B causes A) or that there is no causality.Thus we can consider the following questions:
1. Are skills shortages a result of other developments in the economy? and/or
2. Are there identifiable consequences of skills shortages?
Granger causality should be distinguished from contemporaneous correlation (which is what is apparentto the eye in the charts), which just says that variables move the same way at the same time. If wecan find that skills shortages ‘Granger cause’ other variables then it will offer us a pointer to theeconomic consequences of those skills deficiencies. If, on the other hand, other variables ‘Grangercause’ the skills shortages series without any feedback, the implication will be that we are merelypicking up recruitment difficulties associated with different stages of the economic cycle.
As we have previously observed, the relationship between the various survey questions appears tohave changed over time so we have run the tests twice; once for a longer sample and once for ashorter sample. Test results using the estimation period 1974 to 1999 are given in Table 15, and in Table 16 for the estimation period 1984 to 1999. The latter sample has been chosen taking intoconsideration the changes in the UK economy since the mid-eighties (i.e. no 3 day week and labourmarket reforms).
The interpretation of the tables is as follows. If the quoted test statistic is greater than the critical valueof the F statistic (shown at the bottom of the tables), then there is evidence of Granger causality.
Table 15: Granger Causality Tests Statistics Using CBI data 1974-1999:2
Caused Variable
Skills Employment Output Capacity Investment
Skills - 17.07 8.64 12.25 5.47
Employment 2.42 - 3.06 1.70 0.41
Output 7.27 20.70 - 23.52 12.23
Capacity 0.96 8.13 3.84 - 1.52
Investment 8.62 18.31 6.00 3.69 -
Critical value F(1%)4,98 = 3.57
Source: Business Strategies, 1999
Causal
Variables

The results shown on Table 15 indicate that, for the wider (1974-1999) sample there is evidencethat changes in skills shortages pre-date (or, Granger cause) changes in each of the other variables.In the case of output and investment there is also evidence of feedback. That is, for example, skillsshortages have possible implications for future output and investment, which have possible implicationsfor future skills shortages.
The implication of Table 15 is (as one would intuitively expect) perceived skill shortages may preventemployers from increasing employment by as much as they would like. Surprisingly, there is noevidence of as significant an impact on output. What may be going on here is that there are morecomplex links and lags than we have allowed for. That is, lower employment could lead to lowercapacity, which in turn, could impact on output.
Another possible reason for the above results is provided in the ECISD case studies.13 Here they findthat rather than allowing skills problems, such as recruitment difficulties, to constrain capacity, theywere ‘overcome’ in other ways. For instance, where possible, staff are required to work over-time.This especially applies at a managerial level where overtime is typically unpaid. At lower levels, agencyworkers are sometimes brought in, and when applicable, outsourcing is sometimes used to overcomeskills shortages. Strategic responses to solving skill shortages were also cited. Responses includebeing more targeted in recruitment efforts and providing on-going professional development andtraining for existing staff.
If we look at Table 16 there is a very different picture. In the case of output and investment there isevidence that each ‘granger causes’ skills with no direct feedback. On its own, this could imply thatwe are merely picking up skills shortages, associated with the stage in the economic cycle. However,there is also ‘strong’ evidence of Granger causality from skills to employment, with no feedback. Giventhat the UK economy since the mid-eighties has been rather different from that in the seventies, webelieve that the results in Table 16 are more useful in addressing our current concerns.
In terms of our original questions the answers from this avenue of analysis are that:
1. Skills shortages do not simply reflect recruitment difficulties associated with the stage of the cycle.
2. Reported skill shortages may show negative impact on employment, which, in turn impacts onlower capacity, lower output and lower reported skills shortages.
Existing Survey Evidence
38
Table 16: Granger Causality Tests Statistics Using CBI data 1984-1999:2
Caused Variable
Skills Employment Output Capacity Investment
Skills - 8.81 3.45 3.24 1.44
Employment 1.95 - 0.85 0.92 1.60
Output 4.28 11.95 - 4.91 1.61
Capacity 1.72 4.66 2.90 - 0.68
Investment 5.02 9.42 5.78 6.62 -
Critical value F(1%)4,58 = 3.81
Source: Business Strategies, 1999
Causal
Variables
13 A summary of these case studies will be available in the forthcoming report: Hogarth, T., The Extent, Causes and Implications of Skill Deficiencies, CaseStudy Synthesis Report, Institute for Employment Research, University of Warwick.

5.3 The Vector Auto-Regressive ModelTo further investigate whether there are more complex links and lags than we have allowed for, a VAR(Vector Auto-regression) model has been developed. VAR models have proven to be a popular meansfor analysing the dynamic and causal interrelationships between different time series.14 The modelalso allows us to quantify the extent of these relationships.
This type of model aims to capture potential links such as those described in the flow chart above,but without imposing prior views on the relationship between variables. These models also have theadvantage of encompassing the formulation of expectations, and the potential link between expectationsof future values of a variable, rather than the current value of the variable itself, and other variables.
In a VAR model, all variables in the economic system are treated as endogenous in the estimatedequations. Lags of each variable are included into each equation to capture the inter-temporalcorrelation between variables. The more lags we have, the more parameters there are in the system.
For instance, a system with 3 equations and a lag length of 2 quarters would be written as:
y1t = α11 y1,t-1 + α12y1,t-2 + β11y2, t-1 + β12y2, t-2 + δ11y3, t-1 + δ12y3, t-2 + ε1,ty2t = β21 y2,t-1 + β22y2,t-2 + α21y1, t-1 + α22y1, t-2 + δ21y3, t-1 + δ22y3, t-2 + ε2,ty3t = δ31 y3,t-1 + δ32y3,t-2 + α31y2, t-1 + α32y3, t-2 + β31y2, t-1 + β32y2, t-2 + ε3,t
where yw,t stands for variable for w (w=1, ..., 3) at time t.
There are various procedures available to assist in the determination of the most appropriate lag length,such as Akaike’s Information Criterion, Schwartz Bayesian Criterion and the Adjusted Likelihood RatioTest. Both Akaike’s Information Criterion and Schwartz Bayesian Criterion prompted us to select alag length of eight quarters.
The choice of an eight-quarter lag structure leads us to one of the practical problems faced whenestimating VAR models. If the lag length is set too low, some of the intertemporal correlationbetween the variables may not be captured, leading to serially correlated disturbances and thus,invalid hypothesis-testing procedures. However, if the lag length is set too high, we may end up with too many parameters to estimate given the sample size, or at the very least, can lead to a set of inferences with large standard errors.
Fortunately, this problem of “overparamaterisation” can be overcome using the Bayesian vector auto-regression (BVAR) approach.15 The BVAR is an extension of the VAR model that enables the incorporation of any additional knowledge we have about the parameters beyond that containedin the sample. This is achieved by assigning some prior distribution on the estimated coefficients,the addition of more information into the model generally leading to more stable estimates. For thisreason we have estimated our system of equations using a BVAR model.
Existing Survey Evidence
39
13 A summary of these case studies will be available in the forthcoming report: Hogarth, T., The Extent, Causes and Implications of Skill Deficiencies, CaseStudy Synthesis Report, Institute for Employment Research, University of Warwick.14 C.A. Sims, “Macroeconomics and Reality”, Econometrica, vol. 48, 1980, pp. 1-48.15 For more information on Bayesian methods see:Berger, James O., (1985), Statistical Decision Theory and Bayesian Analysis, (2nd edition), New York: Springer;Bernado, J.M. and A.F.M. Smith, (1994), Bayesian Theory, New York: Wiley;Poirier, Dale J., (1995), Intermediate Statistics and Econometrics: A Comparative Approach. Cambridge: MIT Press.
We incorporated into our model the likelihood that as the length of time between two variables increases,so decreases the likelihood that movements in the variable in the earlier period will impact on theother variable today. To achieve this, we constrained the coefficient estimates such that the likelihoodof the coefficient being equal to zero was increasing in the lag length of the associated variable.
We constructed a BVAR model using data from the CBI’s Industrial Trends Survey for the period 1984to 1998. (We argued above that more recent data are more relevant because of distortions in theearlier period arising from the three-day week, and because of the potential impact of labour marketreforms on the latter period). The model includes the survey questions on changes in employment,changes in output, changes in investment, below capacity working and skilled labour as a constrainton output.
Once the equations are estimated we can test the impact of skills as a constraint by adding a residualto the skills as a constraint equation which would result in the predicted value (all else being equal)being a fixed amount (one in this case) higher than it would otherwise have been. We then solve the full model to find the impact on the other variables and the feedback to the skills as a constraintquestion. This feedback will change the value of the skills as a constraint variable beyond the residualof one that we originally imposed. This is the equivalent of asking, “what is the impact of a tighteningof skills constraints?”
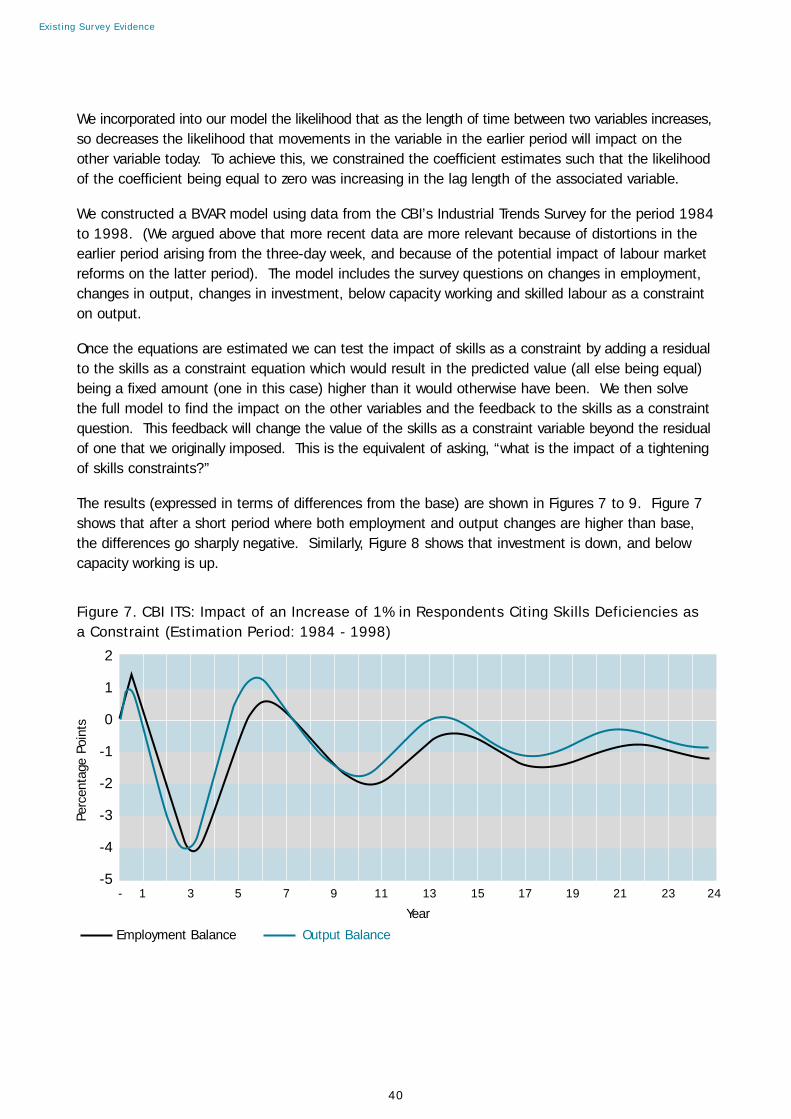
The results (expressed in terms of differences from the base) are shown in Figures 7 to 9. Figure 7shows that after a short period where both employment and output changes are higher than base,the differences go sharply negative. Similarly, Figure 8 shows that investment is down, and belowcapacity working is up.
Existing Survey Evidence
40
Figure 7. CBI ITS: Impact of an Increase of 1% in Respondents Citing Skills Deficiencies as a Constraint (Estimation Period: 1984 - 1998)
- 1 3 5 7 9 11 13 15 17 19 21 23 24
2
1
0
-1
-2
-3
-4
-5
Employment Balance Output Balance
Year
Perc
enta
ge P
oint
s

Existing Survey Evidence
41
Although the results shown in Figure 7 eventually settle down at about one below base after aroundtwelve years, we should be wary about attaching too much weight to small changes so far out becausewe cannot be sure of their statistical significance. Because of this we focus our attention on the firstsix years, which is the time by which the re-bound has occurred. This means that after an initial increasein the balance of respondents citing skills deficiencies as a constraint, the impact is sharply negativeuntil it returns to something not too far from zero after about six years. Similar results can be seenfor investment and firms working below full capacity (Figure 8).
Figure 9. CBI ITS: Impact of an increase of 1% in respondents Citing Recruitment Difficulties(Estimation Period: 1984 - 1998)
0 1 2 3 4 5 6
0.2
0.0
-0.2
-0.4
-0.6
-0.8
-1.0
-1.2
-1.4
Actual Employment Actual Output
Perc
enta
ge C
hang
e
Year
Figure 8. CBI ITS: Impact of an Increase of 1% in Respondents Citing Skills Deficiences as a Constraint (Estimation Period: 1984 - 1998)
- 1 3 5 7 9 11 13 15 17 19 21 23 24
-3
-2
-1
-0
-1
-2
-3
-4
-5
Investment Balance Below Capacity Working Balance
Year
Perc
enta
ge P
oint
s

Recalling that the questions on output and employment refer to changes (as opposed to levels) in output and employment, we can estimate historical relationships between manufacturing outputand employment growth and the CBI balances16, and use these to infer the impact of skills as aconstraint on actual output and employment. Focusing our attention on the first six years, theresults of this are shown in Figure 9.
From Figure 9 we can see that an increase of one per cent in the number of respondents citing ashortage of skilled labour as a constraint on output is associated with a fall in both output andemployment of about one per cent. This is strong statistical evidence that shortages of skilled labour do matter, and that their existence keeps both output and employment below what they might otherwise be.
Figure 10 shows the results for the skills as a constraint question itself. Initially this is one point abovebase (this is the residual that we have added). It then falls quite steeply to be 1/2 a point belowbase. In other words, for a time, the responses to the skills as a constraint question itself do notshow the full extent of the problem. The initial constraint is associated with a fall in employment,which in turn, is associated with a reduction the perceived problem as skills as a constraint onoutput. This is the process that we hypothesised in the flow chart.
Although the model tells us that exogenous changes to skills as a constraint have a big impact onoutput and employment we need to be careful in interpreting past changes in the survey results. In particular, given the fall off in the importance of skills as a constraint since the seventies, we mightbe tempted to think that this had a positive impact on employment and output. One interpretationthe model gives us, however, is that an exogenous, negative shock to output and/or employment areassociated with an easing of the skills constraint. The current low levels of response to the skillsconstraint question may therefore not be an indication of the improvement of the workings of thelabour market, but a result of the decline of UK manufacturing industry. So, although, skills as aconstraint are important (as we have demonstrated), we need to be aware that other factors havebeen at work in determining the current levels of manufacturing output and employment.
Existing Survey Evidence
42
16 We have estimated our own equations for the link between the CBI balances for reported changes in output and employment and official estimates ofmanufacturing output and employment but the methodology closely follows that in Robson, P. and Sentence, A (1997) Interpreting the CBI Industrial TrendsSurvey, London Business School Centre for Economic Forecasting Discussion Paper DP31-97 and in Blake, N. and Robson, P. (1998) Are the official estimatesof productivity growth giving the MPC misleading signals? Economic Outlook 22, 4.
Figure 10. CBI ITS: Impact of an Increase of 1% in Respondents Citing Recruitment Difficulties(Estimation Period: 1984 - 1998)
- 1 3 5 7 9 11 13 15 17 19 21 23 24
1.0
0.5
0.0
-0.5
-1.0
Skilled Labour as a Constraint on Output
Year
Perc
enta
ge P
oint
s

So far we have confined the analysis to data on manufacturing, chiefly because of the availability of a lengthy time series. As outlined in section 2.3, we also have data from the British Chambers of Commerce (BCC) survey on recruitment difficulties in services, although the series only begins in 1989. We have used this to fit a similar model to that constructed with CBI data. The chiefdifference is that because of the shorter-time period we have only used four lags. The resultssummarised in Figures 11 to 13 are surprisingly similar to those for manufacturing.
To get some idea of the actual impact on employment we have related changes in employment inservices17 to the BCC survey data. The results are shown in Figure 12. Once again, we have strongevidence of a negative relationship between recruitment difficulties and future employment.
Existing Survey Evidence
43
17 Including distribution, hotels and catering; transport and communications; and financial and business services.
Figure 11. BCC: Impact of an increase of 1% in Respondents Citing Recruitment Difficulties(Estimation Period: 1989q1 - 1999q2)
0 1 2 3 4 5 6 7
0.0
-0.2
-0.4
-0.6
-0.8
-1.0
-1.2
-1.4
-1.6
Employment Balance Output Balance
Perc
enta
ge P
oint
s
Year
Figure 12. BCC: Impact of an increase of 1% in Respondents Citing Recruitment Difficulties(Estimation Period: 1989q1 - 1999q2)
0 1 2 3 4 5 6 7
0.0
-0.20
-0.40
-0.60
-0.80
-1.00
Actual Employment
Perc
enta
ge C
hang
e
Year
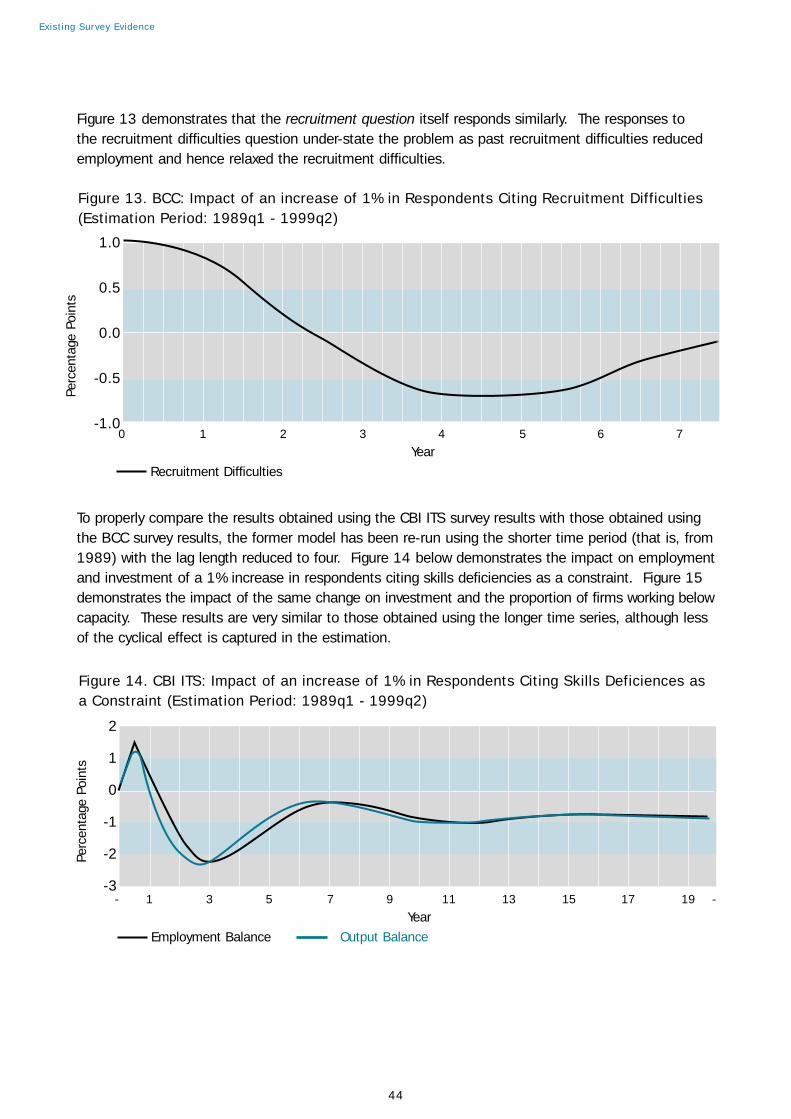
Figure 13 demonstrates that the recruitment question itself responds similarly. The responses to the recruitment difficulties question under-state the problem as past recruitment difficulties reducedemployment and hence relaxed the recruitment difficulties.
To properly compare the results obtained using the CBI ITS survey results with those obtained usingthe BCC survey results, the former model has been re-run using the shorter time period (that is, from1989) with the lag length reduced to four. Figure 14 below demonstrates the impact on employmentand investment of a 1% increase in respondents citing skills deficiencies as a constraint. Figure 15demonstrates the impact of the same change on investment and the proportion of firms working belowcapacity. These results are very similar to those obtained using the longer time series, although lessof the cyclical effect is captured in the estimation.
Existing Survey Evidence
44
Figure 13. BCC: Impact of an increase of 1% in Respondents Citing Recruitment Difficulties(Estimation Period: 1989q1 - 1999q2)
0 1 2 3 4 5 6 7
1.0
0.5
0.0
-0.5
-1.0
Recruitment Difficulties
Perc
enta
ge P
oint
s
Year
Figure 14. CBI ITS: Impact of an increase of 1% in Respondents Citing Skills Deficiences asa Constraint (Estimation Period: 1989q1 - 1999q2)
- 1 3 5 7 9 11 13 15 17 19 -
2
1
0
-1
-2
-3
Employment Balance Output Balance
Perc
enta
ge P
oint
s
Year

These results (using the BCC Survey and the CBI survey over a limited time period) confirm that thehypothesis about the impact of skills as a constraint on other economic variables that we originallytested using CBI data for 1984-1998 holds for services as well as for manufacturing. It also showsthat the results for manufacturing are not overturned by shortening the estimation period.
Existing Survey Evidence
45
Figure 15. CBI ITS: Impact of an increase of 1% in Respondents Citing Skills Deficiences asa Constraint (Estimation Period: 1989q1 - 1999q2)
- 1 3 5 7 9 11 13 15 17 19 -
2
1
0
-1
-2
-3
Investment Balance Below Capacity Working Balance
Perc
enta
ge P
oint
s
Year

6. IMPLICATIONS
The overarching question addressed by Section 5 is whether the reporting of skills as a constraintis simply a product of the stage of the economic cycle or does it have broader implications for theother economic variables such as output and employment? It begins by showing that casualinspection of the survey data and simple regression analysis do indeed suggest that the skills as a constraint responses vary with the economic cycle. However, this does not in itself prove that theformer is simply a product of the latter or that skills constraints does not have implications for othervariables. There is evidence (Figure 6) that skills constraints have a negative impact on output andemployment when account is taken of possible time lags.
A simple model is hypothesised in which skills shortages, employment, output and other variables are all closely linked together over time. Granger causality tests lend some support to the hypothesisby showing that skills constraints are not simple a product of the economic cycle but have a negativeimpact on employment, output and capacity. A BVAR model is developed to estimate the impact ofskills constraints. This shows that an increase of one per cent in the number of respondents citing ashortage of skilled labour as a constraint on output is associated with a fall in both output andemployment of about one per cent. For services, an increase of one percent in the number ofrespondents citing recruitment difficulties is associated with an eventual decline in employment by something between 1/2 and 3/4 of a per cent.
That analysis suggests that, despite anxieties over the limitations of existing surveys and the ways in which respondents often miss the intended meaning of the survey design, some important androbust conclusions can be drawn. The results for both manufacturing and services show strong links between all of the variables, and a strong negative link between skills shortages/recruitmentdifficulties and both output and employment.
In both cases, the feedback from lower employment to the skills shortages/recruitment difficulties meansthat the actual response to the questions understates the true extent of the problem. That in turnimplies that it is important that future research should focus on understanding how skill needs, andskill deficiencies, evolve over time. That requires the separation of cyclical and structural trends, butit also requires a richer understanding of how employers respond to skill deficiencies.
Existing Survey Evidence
46

ANNEX CURRENT SURVEY QUESTIONS
Skill Needs in Great Britain and Northern Ireland 1998Questions on current vacancies:SNB1. How many vacancies, if any, do you have at the moment at this location? (If none, ask no more questions on current vacancies).
SNB1.1. I’d like you to tell me the specific occupations in which you currently have vacancies at thislocation. Please tell me them in their order of importance to you?
SNB1.2. Do you currently have any vacancies at this location which are proving hard-to-fill?a) Yes (ask Q1.3); b) No (ask no more questions on current vacancies)
SNB1.3. Which of the following reasons that I am going to read out are the causes of your hard-to-fill vacancies? (If only one is indicated, then go to Q2)
a) Not enough suitably skilled people; b) Not enough people interested in doing this type of job; c) Too much competition from other employers; d) Company doesn’t pay enough; e) Lack of technical or practical skills; f) Lack of basic ability to build upon; g) Poor attitude, motivation, or personality; h) Lack of the qualifications you demand; i) Lack of the work experience you demand; j) Inflexibility and unwillingness to accept change; k) Other; l) Don’t Know
SNB1.4. And what is the main cause of your hard-to fill vacancies? (Read out all mentioned in Q1.3)
SNB2. I’d like you to tell me the specific occupations in which you currently have vacancies at thislocation that are proving hard-to-fill? (Refer to list at Q1.1)
SNB2.1. And how many actual vacancies do you have for... Read out all hard-to-fill vacanciesmentioned in Q2.
SNB2.2. Overall, are the hard-to fill vacancies causing you...?a) Loss of business or orders to competitors; b) Loss of quality in the service given to customers; c) Significant restrictions to business development activities; d) Increased running costs due to use of overtime, subcontracting or temporary staff; e) Above average recruitment costs through advertising, use of recruitment agencies etc.; f) Loss of efficiency or increased wastage; g) None of these
Existing Survey Evidence
47

SNB2.3. What actions are you taking at the moment to try and fill your hard-to-fill vacancies?
SNB2.4. How many people do you currently employ as... Read out first then subsequent vacanciesfrom Q2.
SNB3. Did any of these current hard-to-fill vacancies that you have just been talking to me aboutexist twelve months ago
a) Yes; b) No
Questions on past vacancies:SNB4. Thinking back over the past twelve months, have you had any vacancies at this location thatwere hard-to-fill that do not exist now?
a) Yes (Answer no more questions on past vacancies); b) No (And no vacancies at Q1 or Q1.2 - ask Q5; And yes at Q1.2 - answer no more questionson past vacancies)
If there have been no hard-to-fill vacancies over the past twelve months answer no more questionson past vacancies.
SNB5. Which of these would you say is the more important reason for your not having had anyhard-to-fill vacancies at this location over the last twelve months?
a) You have not been doing much recruitment (Answer no more questions on past vacancies); b) You have not had any problems finding recruits (Ask Q6)
SNB6. For which of these reasons do you feel you have not had any problems finding recruits overthe past twelve months?
Questions on skills gaps:SNB7. Turning now to the overall skills needed at your location to keep it running effectively, wouldyou say that the need for skills in your average employee was…?
a) Decreasing (Go to Q8); b) Static (Go to Q8); c) Increasing
SNB7.1. What are the main factors causing this increase?
SNB8. Would you say that there is a significant gap between the type of skills that your currentemployees have now, and those they need to meet your current business objectives?
a) Yes; b) No (Go to Q10)
SNB8.1. In which occupations do you feel the skills gap is greatest?
SNB9. Which if any, of these skills do you think are generally lacking in your existing employees?a) Technical or practical skills; b) Literacy skills; c) Numeracy skills; d) Management skills; e) Customer handling skills; f) General communication skills; Computer literacy or knowledge of information technology;
Existing Survey Evidence
48
Existing Survey Evidence
49
g) Team working skills; h) Problem solving skills; i) Managing own development
SNB10. May I just check, are any of your current employees aged between ?a) 16-17; b) 18-19; c) 20-24; d) Don’t know (If no to a, b, and c ask no more questions on skill gaps).
SNB10.1. Would you say there is a significant gap between the type of skills your 16 to 24 year oldemployees have now and those that they need to meet your current business objectives?
a) Yes; b) No (Ask no more questions on skill gaps)
SNB10.2. Which, if any, of these skills do you feel need improving among your 16 to 24 year oldemployees?
SNB10.3. Thinking about (type of skill selected at 10.2) would you say that the skills gap isespecially significant for 16 to 17 year olds?
The CBI Quarterly Industrial Trends Survey
ITS question 3b. Do you expect to authorise more or less capital expenditure in the next 12months than you authorised in the last 12 monthson plant and machinery:
a) More; b) Same; c) Less; d) N/A
ITS question 4. Is your present level of output below capacity (i.e. are you working below asatisfactory full rate of operation?)
a) Up; b) No; c) N/A
ITS question 6. Excluding seasonal variation, what has been the trend over the past four monthswith regard to the numbers employed:
a) Up; b) Same; c) Down; d) N/A
ITS question 8. Excluding seasonal variation, what has been the trend over the past four monthswith regard to the volume of output:
a) Up; b) Same; c) Down; d) N/A

ITS question 14. What factors are likely to limit your output over the next four months. Please tickthe most important factor or factors? (For each of a-g the percentage all firms is reported)
a) Orders or sales; b) Skilled labour; c) Other labour; d) Plant capacity; e) Credit or finance; f) Materials or components; g) Other
ITS question 16c. Which factors are likely to limit (wholly or partly) your capital expenditureauthorisation over the next twelve months? (For each of a-h the percentage all firms is reported)
a) Inadequate net return on proposed investment; b) Shortage of internal finance; c) Inability to raise external finance; d) Cost of finance; e) Uncertainty about demand; f) Shortage of labour including Managerial and Technical staff; g) Other (please specify); h) N/A
The British Chambers of Commerce Quarterly Economic Survey
BCC1. Have you attempted to recruit staff over the past 3 months? (Per cent of all firms)
BCC2. If yes, were they for: (For each of a and b, the percentage of thosefirms who answered yes to Q1 is reported)
a) Part-time jobs / Full-time jobs?; b) Temporary jobs / Permanent Jobs?
BCC3. Did you experience any difficulties finding suitable staff? (Per cent of all firms).
BCC4. If yes, for which of the following categories? (For each of a-d, the percentage of those firmswho answered yes to Q1 is reported)
a) Skilled manual and technical;b) Professional and managerial;c) Clerical; d) Unskilled and semi-skilled
BCC5. Excluding seasonal variation, domestic sales (domestic orders) over the past 3 months are:Up / Same / Down
BCC6. Over the past 3 months, which changes have you made in your investmentplans:a) For plant and machinery: Revised upwards / Revised Downward / No change
BCC7. Are you currently operating at:Full Capacity / Below Full Capacity
Existing Survey Evidence
50

NATIONAL SKILLS TASK FORCE RESEARCH PUBLICATIONSSKT 29 Skills for all: Research Report of the National Skills Task Force
Employers Skill Survey
SKT 30 Employers Skill Survey: Existing Survey Evidence and its use in the Analysis of SkillDeficiencies
SKT 31 Employers Skill Survey: Statistical ReportSKT 32 Employers Skill Survey: Case Study Report - Banking, Finance and InsuranceSKT 33 Employers Skill Survey: Case Study Report - EngineeringSKT 34 Employers Skill Survey: Case Study Report - Food ManufacturingSKT 35 Employers Skill Survey: Case Study Report - Health and Social CareSKT 36 Employers Skill Survey: Case Study Report - HospitalitySKT 37 Employers Skill Survey: Case Study Report - Local and Central GovernmentSKT 38 Employers Skill Survey: Case Study Report - Telecommunications
Skills Task Force Research Papers
SKT 6 Anticipating Future Skill Needs: Can it be Done? Does it Need to be Done? SKT 7 The Dynamics of Decision Making in the Sphere of Skills’ FormationSKT 8 Management Skills SKT 9 Intermediate Level Skills - How are they changing?SKT 10 Jungle Trekking: Vocational Courses and Qualifications for Young People SKT 11 The Leisure SectorSKT 12 Engineering Skills Formation in Britain: Cyclical and Structural Issues SKT 13 The Market Value of Generic Skills SKT 14 Employment Prospects and Skill Needs in the Banking, Finance and Insurance SectorSKT 15 New Technology IndustriesSKT 16 Funding Systems and their Impact on SkillsSKT 17 Skills Requirements in the Creative IndustriesSKT 18 Skills Issues in Small and Medium Sized Enterprises SKT 19 Spatial Skill Variations: their extent and implications SKT 20 Employers’ Attitude to TrainingSKT 21 Skills Issues in Other Business Services - Professional ServicesSKT 22 Science Skills IssuesSKT 23 Empirical Evidence of Management Skills in the UKSKT 24 Monitoring and measuring occupational change: the development of SOC2000
Information Technology, Communications and Electronics Skills Strategy Group Reports
SKT 25 Skills for the Information Age: Final report from the Information Technology,Communications and Electronics Skills Strategy Group
SKT 25E Skills for the Information Age: Final report form the Information Technology,Communications and Electronic Skills Strategy Group - Executive Summary
Existing Survey Evidence
51

Other Reports
SKT 3 Mind the Gap - includes CD-ROMSKT 4 Mind the Gap
Copies of these reports are available free of charge (quoting the appropriate SKT reference) from:
Prolog
PrologPO Box 5050SudburySuffolkCO10 6YJ
Tel: 0845 60 222 60Fax: 0845 60 333 60
These reports and others in the series are also available on the world wide web at:www.dfee.gov.uk/skillsforce
Existing Survey Evidence
52

Notes

Notes

1
For further copies of this publication contact the following, quoting the reference number below:
DfEE PublicationsP.O. Box 5050Sherwood ParkAnnesleyNottinghamNG15 0DJ
Tel: 0845 60 222 60Fax: 0845 60 333 60Minicom: 0845 60 555 60Email: [email protected]
Please quote ref: SKT 30
© Crown copyright 2000
Produced by the Department forEducation and Employment
Extracts from this document may be reproduced for non-commercial education or training purposes on condition that the source is acknowledged.
PP80D2/42154/0900/252


![Armanac dera Bouts dera Mountanho. - [Annado 34], numéro spécial 1938](https://img.dokumen.tips/doc/110x75/55cf97f0550346d033948cd6/armanac-dera-bouts-dera-mountanho-annado-34-numero-special-1938.jpg)