Embed Size (px)
Citation preview
DOT/FAA/AR-xx/xx Air Traffic Organization NextGen & Operations Planning Office of Research and Technology Development Washington, DC 20591
UAS Surveillance Criticality December 2016 Final Report This document is available to the U.S. public through the National Technical Information Services (NTIS), Springfield, Virginia 22161. This document is also available from the Federal Aviation Administration William J. Hughes Technical Center at actlibrary.tc.faa.gov.
U.S. Department of Transportation Federal Aviation Administration

NOTICE
This document is disseminated under the sponsorship of the U.S. Department of Transportation in the
interest of information exchange. The U.S. Government assumes no liability for the contents or use
thereof. The U.S. Government does not endorse products or manufacturers. Trade or manufacturers’
names appear herein solely because they are considered essential to the objective of this report. The
findings and conclusions in this report are those of the author(s) and do not necessarily represent the views
of the funding agency. This document does not constitute FAA policy. Consult the FAA sponsoring
organization listed on the Technical Documentation page as to its use.
This report is available at the Federal Aviation Administration William J. Hughes Technical Center’s Full-
Text Technical Reports page: actlibrary.tc.faa.gov in Adobe Acrobat portable document format (PDF).

Task A6: Surveillance Criticality
Final Report
University Grant Number Principal Investigator
North Carolina State
University
Mr. Kyle Snyder
University of North Dakota Dr. Will Semke
The Ohio State University Dr. Jim Gregory
Oregon State University Dr. Michael Wing
Embry Riddle Aeronautical
University
Mr. Mohammad Moallemi
Mississippi State University Dr. J.W. Bruce
Contract Number: XXXXX
PoP: 9/14/2015 to 11/30/2016
PROJECT A6: SURVEILLANCE CRITICALITY Version: 1
Publication Date: 12/08/2016

1
Technical Report Documentation Page 1. Report No.
DOT/FAA/TC-xx/xx
2. Government Accession No. 3. Recipient's Catalog No.
4. Title and Subtitle
Task A6: Surveillance Criticality
Final Report
5. Report Date
6. Performing Organization Code
7. Author(s)
Nicholas Allen, Evan Arnold, Dr. J.W. Bruce, Matthew McCrink, Mohammad
Moallemi, Dr. William Semke, Kyle Snyder, Dawson Stott, Asma Tabassum, Dr.
Michael Wing
8. Performing Organization Report No.
9. Performing Organization Name and Address
Project Lead: North Carolina State University
909 Capability Dr, Box 8601
Raleigh, NC 27695
10. Work Unit No. (TRAIS)
11. Contract or Grant No.
12. Sponsoring Agency Name and Address
U.S. Department of Transportation
Federal Aviation Administration
William J. Hughes Technical Center
Aviation Research Division
***BRANCH***
Atlantic City International Airport, NJ 08405
13. Type of Report and Period Covered
Final Report
9/14/2015 – 11/30/2016
14. Sponsoring Agency Code
15. Supplementary Notes
16. Abstract
The integration of unmanned aircraft systems (UAS) into the national airspace system (NAS) poses considerable challenges.
Maintaining human safety is perhaps chief among these challenges as UAS remote pilots will need to interact with other UAS,
piloted aircraft, and other conditions associated with flight. A research team of 6 leading UAS research universities was formed to
respond to a set of surveillance criticality research questions. Five analysis tools were selected following a literature review to
evaluate airborne surveillance technology performance. The analysis tools included: Fault Trees, Monte Carlo Simulations, Hazard
Analysis, Design of Experiments (DOE), and Human-in-the-Loop Simulations. The Surveillance Criticality research team used
results from these analyses to address three primary research questions and provide recommendations for UAS detect-and-avoid
mitigation and areas for further research.
17. Key Words
UAS, DAA, surveillance criticality, RTCA SC-228, fault tree,
hazard analysis, design of experiments, ADS-B, TCAS
18. Distribution Statement
This document is available to the U.S. public through the
National Technical Information Service (NTIS), Springfield,
Virginia 22161. This document is also available from the
Federal Aviation Administration William J. Hughes technical
Center at actlibrary.tc.faa.gov 19. Security Classif. (of this report)
Unclassified 20. Security Classif. (of this page)
Unclassified 21. No. of Pages
22. Price
Form DOT F 1700.7 (8-72) Reproduction of completed page authorized
2
Table of Contents
List of Figures _____________________________________________________________ 4
List of Tables ______________________________________________________________ 6
Acronyms _________________________________________________________________ 8
1 Executive Summary _____________________________________________________ 10
2 Introduction ___________________________________________________________ 13
3 Systems Overview ______________________________________________________ 16
3.1 ADS-B _____________________________________________________________ 16
3.2 TCAS ______________________________________________________________ 17
3.3 Radar ______________________________________________________________ 18
3.4 Transponders ________________________________________________________ 19
3.5 GPS________________________________________________________________ 19
3.6 Altimeters ___________________________________________________________ 20
4 Airspace Overview _____________________________________________________ 21
4.1 Class A: Airspace Description ___________________________________________ 21
4.2 Class B: Airspace Description ___________________________________________ 22
4.3 Class C: Airspace Description ___________________________________________ 22
4.4 Class D: Airspace Description ___________________________________________ 23
4.5 Class E (Above 10,000 MSL): Airspace Description _________________________ 23
4.6 Class E (Below 10,000 MSL): Airspace Description __________________________ 24
4.7 Class G: Airspace Description ___________________________________________ 24
5 Evaluation ____________________________________________________________ 26
5.1 Functions and Methods ________________________________________________ 26
5.1.1 Introduction ______________________________________________________ 26
5.1.2 Fault Trees _______________________________________________________ 26
5.1.3 Hazard Analysis __________________________________________________ 27
5.1.4 Design of Experiments _____________________________________________ 27
5.1.5 Monte Carlo Simulations ___________________________________________ 30
5.2 Evaluation Process ____________________________________________________ 31
3
5.2.1 FAA SRM Procedure ______________________________________________ 31
5.2.2 RTCA DAA Minimum Operational Performance Standards ________________ 33
5.3 Research Approach ____________________________________________________ 34
5.4 Bowtie and collission process design ______________________________________ 37
5.4.1 Bowtie Flow _____________________________________________________ 37
5.4.2 Collision Process __________________________________________________ 38
5.5 Hazard Assessment Design _____________________________________________ 38
5.5.1 Fault Tree _______________________________________________________ 38
5.5.2 Hazard Assessment ________________________________________________ 44
6 Analysis ______________________________________________________________ 48
6.1 Hazard analysis summary_______________________________________________ 48
6.2 Severity Analysis Summary _____________________________________________ 57
6.3 Data (radar/ADS-B) report fleet study _____________________________________ 65
6.4 EO/IR Preliminary Study _______________________________________________ 76
7 Observations, Findings, and Conclusions ____________________________________ 78
7.1 Observations _________________________________________________________ 78
7.2 Findings ____________________________________________________________ 82
7.3 Mitigation Recommendations ___________________________________________ 84
8 Follow on Work ________________________________________________________ 86
9 References ____________________________________________________________ 90
10 Appendices __________________________________________________________ 91
10.1 Appendix A. Data Source Analysis Summary _______________________________ 91
10.2 Appendix B. Part 43—ATC Transponder Tests and Inspections ________________ 139
10.3 Appendix C. Part 43—Altimeter System Test and Inspections _________________ 142
10.4 Appendix D. ADS-B IN Device Performance Analysis Report by Simulyze ______ 148
10.5 Appendix E: Literature Review _________________________________________ 158
11 Simulation Environment Architecture Description __________________________ 178
12 Hazard Assessment Data Sets __________________________________________ 182
4
List of Figures
Figure 2.1. Analysis approach
Figure 3.1. ADS-B block diagram
Figure 3.2. TCAS block diagram as it applies to UAS
Figure 4.1. Airspace Classification
Figure 5.1. 2D GPS error distribution
Figure 5.2. SRM System Safety Process
Figure 5.3. Research approach
Figure 5.4. Simulation environment displays during testing
Figure 5.5. Top level DAA tree
Figure 5.6. Ownship DAA tree
Figure 5.7. Intruder DAA tree
Figure 5.8. TCAS failure tree
Figure 5.9. ADS-B failure tree
Figure 5.10. Barometer altimeter failure tree
Figure 5.11. Risk matrix chart
Figure 5.12. Criticality chart
Figure 6.1. Normal Plot of standardized effects
Figure 6.2. Pareto chart of standardized effects
Figure 6.3. Interaction plots depicting how total likelihood varies
Figure 6.4. Altitude [ft] vs. time [sec from June 21, 2015 12:00a.m.] plot showing cyclical
unique behavior
Figure 6.5. Altitude [ft] vs. time [sec from June 21, 2015 12:00a.m.] plot showing aircraft w/ the
same aircraft ID number
Figure 6.6. Altitude [ft] vs. time [sec from June 21, 2015 12:00a.m.] plot showing outliers
Figure 6.7. The Finley Radar Map showing the effective radar radius

5
Figure 6.8. The Fargo Radar Map showing the effective radar radius
Figure 6.9. Altitude [ft] vs time [sec from October 20, 2016 12:00am] plots showing
discrepancies
Figure 6.10. Altitude [ft] vs Time [sec from October 20, 2016 12:00am] plot showing cyclic
change
Figure 6.11. An optical image of a UND aircraft on the tarmac at GFK international airport
Figure 6.12. Three different color schemes on the FLIR thermal camera
Figure 10.1. ADS-B ground station network coverage at 500 feet (upper-left), 1500 feet (upper-
right), 3000 feet (lower-left), and 5000 feet (lower-right). All altitudes are AGL
Figure 10.2. Hazard Severity Classification (part 1) per FAA ATO SMS
Figure 10.3. Hazard Severity Classification (part 2) per FAA ATO SMS
Figure 10.4. Likelihood of Effects Standard (Operations and Equipment)
Figure 10.5. Likelihood of Effects: Continuum
Figure 10.6. Likelihood of Effects Standards (Domain and Estimated)
Figure 10.7. Hazard 1: Static system error
Figure 10.8. Hazard 2: Transponder reporting error
Figure 10.9. Hazard 3: Static system error
Figure 10.10. Hazard 4: Static system error (ADSB-out equipped intruder)
Figure 10.11. Hazard 5: Static system error (mode C-equipped intruder)
Figure 10.12. Hazard 6: Transponder reporting error (mode C-equipped intruder)
Figure 10.13. Hazard 7: Static system error (no transponder intruder)
Figure 11.1. Visualization engine and aircraft control displays
Figure 11.2. Simulation station
Figure 11.3. ATC views
Figure 11.4. Simulation chase view

6
List of Tables
Table 6.1. Summary of the eight scenarios analyzed with the DOE
Table 6.2. Summary of the analyzed eight Pilot 1 and Pilot 2 DOE scenarios
Table 6.3. Summary of dropout statistics for both the Fargo and Finley sites
Table 6.4. Summary of unique behavior for the Fargo and Finley sites
Table 6.5. Dropout statistics during 7 days
Table 6.6. Aircraft demonstrating different characteristics of altitude data from ADS-B
messaging
Table 6.7. Aircraft altitude discrepancy ranges
Table 10.1. Ground-based line of sight ranges to airborne aircraft
Table 10.2. Time spent in ATC services airspaces by manned aircraft on cross-country mission
Table 12.1. Class A 2v2
Table 12.2. Class A 1v2
Table 12.3. Class A 1v1
Table 12.4. Class B 2v2
Table 12.5. Class B 1v2
Table 12.6. Class B 1v1
Table 12.7. Class C 2v2
Table 12.8. Class C 1v2
Table 12.9. Class C 1v1
Table 12.10. Class D 2v2
Table 12.11. Class D 1v2
Table 12.12. Class D 1v1
Table 12.13. Class D 2v1A
Table 12.14. Class D 1v1A
Table 12.15. Class D 2v0

7
Table 12.16. Class D 1v0
Table 12.17. Class E>10k, 2v2
Table 12.18. Class E>10k, 1v2
Table 12.19. Class E>10k, 1v1
Table 12.20. Class E<10k, 2v2
Table 12.21. Class E<10k, 1v2
Table 12.22. Class E<10k, 1v1
Table 12.23. Class E<10k, 2v1A
Table 12.24. Class E<10k, 1v1A
Table 12.25. Class E<10k, 2v0
Table 12.26. Class E<10k, 1v0
Table 12.27. Class G 2v2
Table 12.28. Class G 1v2
Table 12.29. Class G 1v1
Table 12.30. Class G 2v1A
Table 12.31. Class G 1v1A
Table 12.32. Class G 2v0
Table 12.33. Class G 1v0

8
Acronyms
AC Advisory circular
ADS-B Automatic dependent surveillance broadcast
AGL Above ground level
ARTCC Air Route Traffic Control Center
ASSURE Alliance for System Safety of UAS through Research Excellence
ATC Air traffic control
ATCRBS Air traffic control radar beacon system
ATO Air Traffic Organization
CDTI Cockpit display of traffic information
COE Center of Excellence
ConOps Concept of operations
CPA Closest point of approach
CRP Certified repair stations
DAA Detect and avoid
DoD Department of Defense
DOE Design of Experiments
EO Electro optical
FAA Federal Aviation Administration
FHA Failure hazard analysis
FIS-B Flight information system-broadcast
FL Flight level
FLIR Forward looking infrared
GPS Global positioning system
HA Hazard analysis
IFR Instrument flight rules
9
IR Infrared
LiDAR Light Detection and Ranging
LEO Low earth orbit
MAC Mid-air collision
MHz Megahertz (106 Hz)
MSL Mean sea level
Mode S Secondary surveillance radar
NAS National airspace system
NMAC Near mid-air collision
NOTAM Notice to airmen
PDF Probability distribution function
RA Resolution advisory
RTCA Radio Technical Commission for Aeronautics
SAA Sense and avoid
SMS Safety management system
SRM Safety risk management
TA Traffic advisory
TIM Technical interchange meeting
TCAS Traffic collision avoidance system
TFR Temporary flight restrictions
TIS–B Traffic information service – broadcast
TRACON Terminal radar approach control
TSO Technical standard order
UAS Unmanned aircraft system
VFR Visible flight rules
10
1 Executive Summary
UAS Surveillance Criticality
The integration of unmanned aircraft systems (UAS) into the national airspace system (NAS)
poses considerable challenges. Maintaining human safety is perhaps chief among these
challenges as UAS remote pilots will need to interact with other UAS, piloted aircraft, and other
conditions associated with flight.
Aircraft detect and avoid (DAA) technology can assist all pilots in helping to avoid collisions
and other circumstances that can threaten human safety in the NAS. A team of six universities
associated through the Federal Aviation Association’s (FAA) UAS Center of Excellence (COE)
ASSURE team researched DAA-related technology to better understand potential DAA UAS
integration. University members included North Carolina State University, Embry-Riddle
Aeronautical University, Mississippi State University, University of North Dakota, Ohio State
University, and Oregon State University. The university team was joined by seven industrial
partners: Adaptive Aerospace Group, CGH Technologies, Harris Corporation, L-3
Communications, Precision Hawk, Rockwell Collins, and Simulyze. The combined group
formed the ASSURE Surveillance Criticality research team.
Our research team interactions included two stakeholder workshops, monthly teleconferences
with FAA representatives, and a regular teleconference schedule among team members. Our
initial efforts included a literature review to examine previous DAA-related research and to help
refine our research approach. The review included product descriptions for surveillance
equipment and solutions, published standards, technical standard orders (TSOs), and Advisory
Circulars (ACs) for transponders, ADS-B, traffic collision avoidance system (TCAS) II
integration, and related technologies. Evaluations of in-field installed performance and in-field
monitoring, maintenance/recertification requirements, including effectiveness of controller
procedures for altitude/position/speed verification, pilot procedural altitude/position/speed
verification were also included in the literature review.
To respond to surveillance criticality research questions, five analysis tools were selected
following the literature review to evaluate airborne surveillance technology performance. The
analysis tools included: Fault Trees, Monte Carlo Simulations, Hazard Analysis, Design of

11
Experiments (DOE), and Human-in-the-Loop Simulations. Our Surveillance Criticality research
team used results from these analyses to address three primary research questions. The questions
and our executive findings for each are presented below.
1. For a cooperative DAA solution based on Automatic dependent surveillance
broadcast (ADS-B) and/or transponders, how should the current operational or
technical performance requirements for ADS-B Out and/or transponders be
changed (if at all) for UAS DAA functions?
Transponder technologies show inherent deficiency for their expected use and are seen as
high risk failures in all airspace and equipage scenarios. ADS-B and TCAS systems are
designed to a performance standard that is appropriate in well controlled airspaces (A, B,
and C) but experience encounter issues as air traffic control is decreased. This is a direct
result of the equipage requirements and the ATC procedures within these airspaces.
However, ADS-B failures are shown to have the largest influence on failure likelihood
when compared with TCAS. Real world data has given indications that significant ADS-
B loss is present in fielded technologies. Our recommendations for transponder and ADS-
B design assurance level improvements aim to increase the level of safety in UAS DAA
systems. For the UAS DAA system, transponders need a more conservative failure
characteristic in all applications to be deemed safe in our analysis. ADS-B systems in
UAS DAA applications show acceptable risk levels in controlled airspaces A, B, and C.
In order for use in lower airspace classes where VFR and non-cooperative traffic
becomes possible, ADS-B will also need to be designed to a greater assurance level.
2. Do current surveillance equipment technologies meet the design assurance
criteria to provide UAS DAA functions?
While the current requirements of UAS DAA are not explicit and are in transition, our
analytical tool is structured to evaluate such standards as they become available. Using
the assurance criteria from FAA TSO documents for manned implementation of these
technologies, our findings are mixed. The surveillance equipment is able to provide DAA
functionality in certain airspace and equipage combinations, but is not a whole solution.
Transponder failures cause a significant loss in DAA operations in all airspaces. While
ATC interactions provide mitigation to these faults when available, there are still high

12
risk scenarios present in the current DAA equipages. In addition to new DAA
requirements, the design of our work allows changes to each piece of surveillance
technology, should greater levels of design assurance be required for UAS DAA use. Our
product also has the capacity to address the needs of future DAA technologies in design
assurance as they are incorporated into UAS.
3. What are the criteria for evaluating “equivalent level of safety” of UAS against
piloted-aircraft for DAA functions?
The analysis was performed with the design assurance levels from piloted-aircraft
technology in order to determine if these criteria provided UAS the same situational
safety as piloted-aircraft. Using the piloted-aircraft standards allows our UAS encounters
to be evaluated to the same specifications as a manned aircraft to manned aircraft
encounter would be, except that the ownship has an air-to-air radar in place of the pilot’s
see and avoid ability. This difference is the most important factor in low equipage and
uncontrolled airspace comparisons, but has less of an impact when in airspace that has
minimum equipment rules and provides ATC separation services to IFR aircraft (UAS).
When other visual or electronic acquisition technologies become available to UAS DAA
systems, our evaluation analysis can be adjusted to support them.
Research Results
The Surveillance Criticality research team has completed a set of analyses using a formalized
structure that enables the ASSURE team to offer further research into DAA surveillance
criticality analysis. This structures provides the team the tools to work with industry partners to
evaluate technology performance against standards and other systems, while also providing the
FAA, RTCA, and others with a research methodology for expanding into new operating
scenarios and equipage configurations.
13
2 Introduction
As unmanned aircraft systems (UAS) continue to expand operations in the National Airspace
System (NAS), the requirements aviation safety and airspace integrity must be maintained. UAS
integration demands separation assurance from manned and other unmanned aircraft. Manned
aviation has driven the development of technologies for airborne traffic surveillance to support
pilot-in-the-aircraft operational concepts. These technologies, such as transponders, TCAS, and
ADS-B, provide collision avoidance functions and separation alerts to the onboard pilot for in-
flight decision making based on the pilot’s situational assessment, training, experience, and
aircraft capabilities. Maintaining separation by sensing and avoiding other air traffic is ultimately
still the pilot’s responsibility.
Many UAS integration strategies are built on the availability and performance of these airborne
surveillance technologies, and new, emerging technologies, to continue providing separation
assurance. The Detect and Avoid (DAA) function in a UAS-integrated airspace system
transitions from the pilot with eyes, to technologies providing traffic data and separation
recommendations. One of the largest challenges facing the UAS industry today is that there is no
known research that examines the performance of these airborne surveillance technologies for
maintaining separation assurance when the pilot is not actually in the aircraft. Surveillance
equipment performance standards are established and separation requirements are defined, such
as the definition for “well clear,” but the analysis of the impacts of these technologies in various
equipage configurations and flight scenarios is missing. DAA systems have significant issues in
obtaining operational and airworthiness approval for UAS because these systems are new and
novel and their intended function performance needs to be defined in the context of the DAA
system of a specific UAS.
The analysis of airborne traffic surveillance equipment for achieving UAS DAA requirements is
critical to continued UAS integration and expansion into the NAS. The comprehensive analysis
evaluates the sensitivities of various systems and components for achieving separation; the
analysis determines the impacts of failures and degraded operations of systems and components;
and the analysis assesses the hazards resulting from reduced performance within the NAS.
Research that covers this analysis will include performance of surveillance technologies on

14
manned and unmanned aircraft, large and small aircraft, operations in multiple types of airspace,
with air traffic at different levels of density. This research must answer the primary three
questions:
1. For a cooperative DAA solution based on ADS-B and/or transponders, how should the
current operational or technical performance requirements for ADS-B Out and/or
transponders be changed (if at all) for UAS DAA functions?
2. Do current surveillance equipment technologies meet the design assurance criteria to
provide UAS DAA functions?
3. What are the criteria for evaluating
“equivalent level of safety” of UAS against
piloted-aircraft for DAA functions?
A research team of six universities was formed under
the FAA’s UAS Center of Excellence program,
ASSURE, to answer these questions and provide the
analysis of airborne traffic surveillance technologies in
the context of UAS DAA operations. This team
consists of North Carolina State University, Embry-
Riddle Aeronautical University, Mississippi State
University, University of North Dakota, Ohio State
University, and Oregon State University. The research
team developed a methodology and toolset for
evaluating the criticality of DAA technologies using
available performance analysis processes, simulation
environments, and equipment characterizations (Figure
2.1). The team utilized industry partner knowledge and
resources, established UAS Integration Concept of
Operations (ConOps) (from RTCA SC-228)
evaluation scenarios, and a team of researchers to conduct a three-phase iterative criticality
analysis.
Figure 2.1. Analysis approach

15
The Industry Partners on this research project are Adaptive Aerospace Group, CGH
Technologies, Harris Corp., L-3 Communications, Precision Hawk, Rockwell Collins, and
Simulyze. These partners were invited participants in the two Stakeholder Workshops in addition
to regular technical exchange teleconferences.
The research team made several assumptions to scope the research effort for the criticality
analysis.
1. The initial research focuses on large UAS, not small UAS flying at very low altitudes
(below 500’ AGL).
2. All aircraft operating in the scenarios meet at least Part 23 equipage requirements,
including ADS-B Out functionality, in a 2020 future flight environment.
3. DAA systems must serve as a means of compliance with 14 CFR 91.113 right-of-way
rules, but also may be required to comply with 14 CFR 91.111 (Operating near other
aircraft) and 14 CFR 91.119 (Minimum safe altitudes: General).
4. DAA system behavior must also comply with 14 CFR 91.123 (Compliance with ATC
clearances and instructions) and 14 CFR 91.181 (Course to be flown) as appropriate.

16
3 Systems Overview
Detect and avoid (DAA) systems as researched in this report are complex systems consisting of
several independent components used throughout the aviation industry. Each of these
components is assumed to be an integral portion of an overarching DAA system. The system
consists of an ADS-B module, a TCAS, a radar, a Mode S transponder, a GPS, and an altimeter.
All of the listed parts of the DAA system have extensive history and use in manned aircraft
systems. A detailed description of each component used in a DAA system for UAS.
3.1 ADS-B
Automatic Dependent Surveillance – Broadcast (ADS-B) is a system by which aircraft and fixed
ground locations can share position, velocity, and other information with one another. ADS-B
periodically transmits its state vector, which includes horizontal and vertical position, and
velocity. The system is broken down into two separate components, ADS-B Out and ADS-B In.
The transponder mode is the ADS-B Out portion which broadcasts all state vector information.
The receiving part of the system is ADS-B In which receives communication from other aircraft
as well as ADS-B messages from ground locations. With state vector information available from
other proximate aircraft as well as information re-broadcasted from ground locations, it is
possible to establish the relative position and movement of those proximate aircraft with
reference to the ownship aircraft.
ADS-B is automatic in the sense that no pilot or controller action is required for the information
to be broadcast. It is a dependent surveillance because it requires that the aircraft state vector and
additional information be derived from the on-board navigation equipment. The aircraft
originating the broadcast may or may not have knowledge of which users are receiving its
broadcast.
The overall system could be used to replace secondary radar as the primary surveillance method
for air traffic control. The ADS-B system is currently used in the United States as a component
of the NextGen national airspace strategy for upgrading and enhancing the overall aviation
infrastructure. ADS-B increases air traffic safety by making aircraft visible in real time to Air
Traffic Control (ATC) and to other appropriately equipped aircraft. The system allows for the
possibility of increased situational awareness, improved visibility, weather reporting, flight

17
information broadcasts, traffic capacity improvement, cockpit display of traffic information
(CDTI) and airborne collision avoidance.
Figure 3.1. ADS-B block diagram
3.2 TCAS
The Traffic Alert Collision Avoidance System (TCAS) was developed as a back-up airborne
collision avoidance system. The system provides pilots with vertical maneuvering guidance to
increase vertical separation between two or more aircraft that the system determines to be a
possible collision threat. The TCAS system is composed of a Mode S transponder that
interrogates other air traffic transponders and a computer system that analyzes the transponder
interrogations. The system includes a traffic display designed to warn pilots of potentially
conflicting airborne traffic.
TCAS is capable of providing two classes of advisories. Resolution advisories (RA’s) indicate
vertical maneuvers that are predicted to either increase or maintain the existing vertical
separation from threatening aircraft. Resolution advisories do not provide horizontal maneuver
guidance as the algorithm for TCAS is based upon vertical separation. Traffic advisories (TA’s)
indicate the positions of intruding aircraft that may later cause resolution advisories to be
displayed. Traffic advisories display range, range rate, altitude, altitude rate and bearing (if
available) for intruding aircraft relative to the ownship aircraft.

18
The best method for understanding the operation of TCAS is by visualizing its operation in
flight. When airborne, the TCAS equipment periodically transmits interrogation signals, these
interrogations are received by the Air Traffic
Control Radar Beacon System (ATCBRS) or
Mode S transponders. In reply to the
interrogations, the transponder transmits a signal
which reports its altitude. The TCAS system
computes the range of the intruding aircraft by
using the round-trip time between the
transmission of the interrogation and the reply.
Altitude, altitude rate, range, and range rate,
range acceleration, and bearing are all
determined by tracking the reply information
from the ATCBRS or Mode S transponder. This
data, together with the current TCAS sensitivity
level, are used to determine the threat level of
the intruding aircraft. Each intruding aircraft is
processed individually to permit the selection of
the minimum safe resolution advisory based on
track data and in coordination with other TCAS
equipped aircraft.
Figure 3.2. TCAS block diagram as it applies to UAS
3.3 RADAR
Detect and avoid radar is an air-to-air radar that is being developed in order to provide an
additional layer of collision avoidance and separation for manned and unmanned aircraft in the
national airspace. The system will have one or more antenna elements in order to cover the radar
field. The electronics of the radar provide all transmit, receive, control, status, and tracking
functions.
19
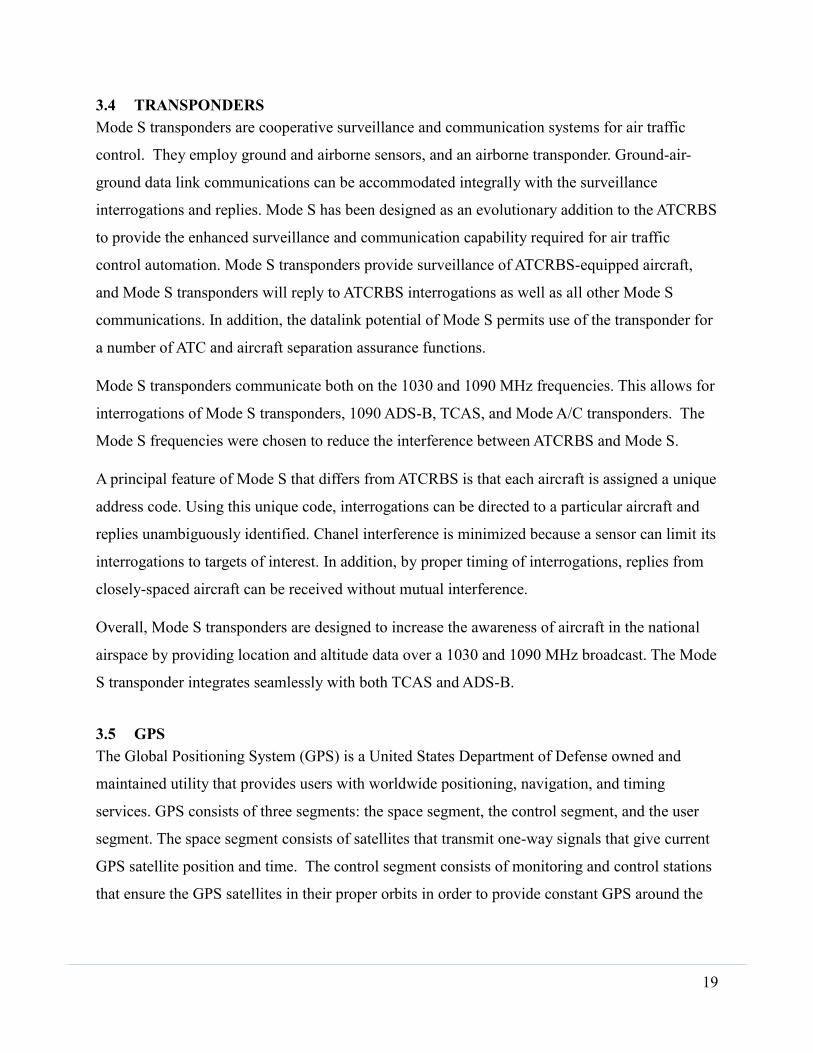
3.4 TRANSPONDERS
Mode S transponders are cooperative surveillance and communication systems for air traffic
control. They employ ground and airborne sensors, and an airborne transponder. Ground-air-
ground data link communications can be accommodated integrally with the surveillance
interrogations and replies. Mode S has been designed as an evolutionary addition to the ATCRBS
to provide the enhanced surveillance and communication capability required for air traffic
control automation. Mode S transponders provide surveillance of ATCRBS-equipped aircraft,
and Mode S transponders will reply to ATCRBS interrogations as well as all other Mode S
communications. In addition, the datalink potential of Mode S permits use of the transponder for
a number of ATC and aircraft separation assurance functions.
Mode S transponders communicate both on the 1030 and 1090 MHz frequencies. This allows for
interrogations of Mode S transponders, 1090 ADS-B, TCAS, and Mode A/C transponders. The
Mode S frequencies were chosen to reduce the interference between ATCRBS and Mode S.
A principal feature of Mode S that differs from ATCRBS is that each aircraft is assigned a unique
address code. Using this unique code, interrogations can be directed to a particular aircraft and
replies unambiguously identified. Chanel interference is minimized because a sensor can limit its
interrogations to targets of interest. In addition, by proper timing of interrogations, replies from
closely-spaced aircraft can be received without mutual interference.
Overall, Mode S transponders are designed to increase the awareness of aircraft in the national
airspace by providing location and altitude data over a 1030 and 1090 MHz broadcast. The Mode
S transponder integrates seamlessly with both TCAS and ADS-B.
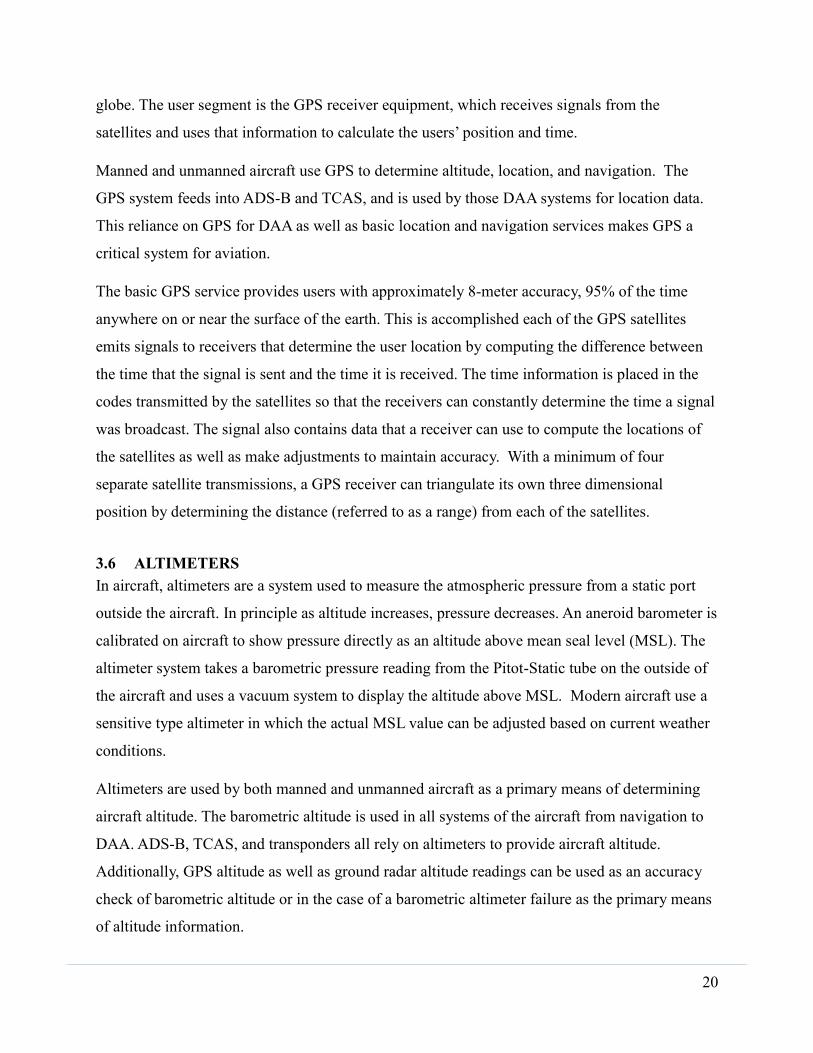
3.5 GPS
The Global Positioning System (GPS) is a United States Department of Defense owned and
maintained utility that provides users with worldwide positioning, navigation, and timing
services. GPS consists of three segments: the space segment, the control segment, and the user
segment. The space segment consists of satellites that transmit one-way signals that give current
GPS satellite position and time. The control segment consists of monitoring and control stations
that ensure the GPS satellites in their proper orbits in order to provide constant GPS around the
20
globe. The user segment is the GPS receiver equipment, which receives signals from the
satellites and uses that information to calculate the users’ position and time.
Manned and unmanned aircraft use GPS to determine altitude, location, and navigation. The
GPS system feeds into ADS-B and TCAS, and is used by those DAA systems for location data.
This reliance on GPS for DAA as well as basic location and navigation services makes GPS a
critical system for aviation.
The basic GPS service provides users with approximately 8-meter accuracy, 95% of the time
anywhere on or near the surface of the earth. This is accomplished each of the GPS satellites
emits signals to receivers that determine the user location by computing the difference between
the time that the signal is sent and the time it is received. The time information is placed in the
codes transmitted by the satellites so that the receivers can constantly determine the time a signal
was broadcast. The signal also contains data that a receiver can use to compute the locations of
the satellites as well as make adjustments to maintain accuracy. With a minimum of four
separate satellite transmissions, a GPS receiver can triangulate its own three dimensional
position by determining the distance (referred to as a range) from each of the satellites.
3.6 ALTIMETERS
In aircraft, altimeters are a system used to measure the atmospheric pressure from a static port
outside the aircraft. In principle as altitude increases, pressure decreases. An aneroid barometer is
calibrated on aircraft to show pressure directly as an altitude above mean seal level (MSL). The
altimeter system takes a barometric pressure reading from the Pitot-Static tube on the outside of
the aircraft and uses a vacuum system to display the altitude above MSL. Modern aircraft use a
sensitive type altimeter in which the actual MSL value can be adjusted based on current weather
conditions.
Altimeters are used by both manned and unmanned aircraft as a primary means of determining
aircraft altitude. The barometric altitude is used in all systems of the aircraft from navigation to
DAA. ADS-B, TCAS, and transponders all rely on altimeters to provide aircraft altitude.
Additionally, GPS altitude as well as ground radar altitude readings can be used as an accuracy
check of barometric altitude or in the case of a barometric altimeter failure as the primary means
of altitude information.

21
4 Airspace Overview
Airspace in the United States is decomposed into six distinct classes. These classes are indicative
of the different equipment and pilot requirements, as well as the level of air traffic control
present therein. Many flight communication and equipment tools that are mandatory in the
higher classes are related to collision avoidance, and are assigned to improve the level of safety.
We evaluated some of the major collision avoidance technologies in order to better understand
how these technologies might be employed by UAS. In our analysis, all airspace is assumed to
have the equipage requirements of the 2020 ADS-B mandate.
For the purposes of our preliminary hazard assessment, four different equipage classes were
defined. In accordance with the latest DAA MOPS, the ownship UAS may only take the top two
equipages. The highest level of equipage, Class 2, is defined as having TCAS, ADS-B,
transponder, and, for the UAS, an air-to-air radar. For the most conservative evaluation it is
assumed that the TCAS and ADS-B systems are utilizing the same onboard transponder system,
not redundant, independent systems. This introduces a greater significance of transponder
failures, but is indeed an option to manufacturers and therefore an important consideration. A
Class 1 system keeps ADS-B, transponder, and radar, but does not have TCAS. These are the
same for the intruder aircraft, except there is no air-to-air radar present in the intruder systems.
The final two, intruder only equipages are: Class 1A, having only a transponder, and Class 0,
completely unequipped. In airspace classes A through C, as well as E above 10,000 feet MSL,
only equipages one and two are present for both aircraft. In the rest, the intruder may take all
four equipages. All combinations of equipage encounters were analyzed and are represented with
their own hazard table.
4.1 CLASS A: AIRSPACE DESCRIPTION
ATC Services
In Class A airspace, all aircraft must be on an IFR flight plan, regardless of
weather conditions. This requirement gives ATC complete separation
responsibility over all aircraft flying in Class A. While the ownship UAS will
always be on an IFR flight plan and therefore controlled by ATC, the barring of
any VFR traffic from operating in Class A airspace significantly improves the

22
safety therein. Essentially, the UAS’s DAA technology is secondary to ATC
guidance and instructions, and there are indeed limitations on when a pilot can
respond to the DAA system’s recommendations.
Flight Altitudes
Class A airspace exists everywhere in the continental United States from 18,000
Feet MSL to flight level (FL) 600.
4.2 CLASS B: AIRSPACE DESCRIPTION
ATC Services
Class B airspace is the most heavily controlled airport airspace in the US. The
equipment requirements are very similar to those in Class A, however Class B
does not carry the same IFR mandate. While VFR traffic is present in Class B, all
traffic must receive specific authorization to enter the airspace and will receive
ATC flight separation while operating within its bounds. Additionally, for
improved situational awareness for the local ATC, all aircraft are required to be
operating at least a Mode C transponder with altitude encoding when flying
within 30 nautical miles of a Class B airport. This mode C veil encompasses all
Class B airspace, as well as that airspace below the outer tiers.
Flight Altitudes
Class B airspace is often highly complex, consisting of several segments with
their own altitude floors and ceilings based on the requirements of the area. In
general, the shape is described as an upside down wedding cake, having multiple
tiers with different radii. The first tier is always a column from the surface to
10,000 feet MSL, usually 10 miles across. All subsequent tiers extend farther
from the center point of the primary airport, but are uniquely tailored to
accommodate the specific needs of each location, such as other airports and
airspace routes.
4.3 CLASS C: AIRSPACE DESCRIPTION
ATC Services
Control within Class C is slightly less comprehensive than Class A and B in
several ways. First and foremost, entering into class C requires the establishment
23
of two way communications between each aircraft and ATC, however, there is no
requirement for clearance or authorization. Additionally, while within Class C,
VFR traffic may not be receiving separation services from ATC.
Flight Altitudes
Class C airspace is usually a two tiered system, with an inside column from the
surface to 4,000 feet above the surface and a 5 nautical mile radius and an outside
shelf, extending 10 nautical miles out with a floor no lower than 1,200 feet and a
ceiling of 4,000 feet above the surface. When the specific requirements of the
local airspace dictate, the dimensions of the class C airspace are adjusted to
accommodate these needs.
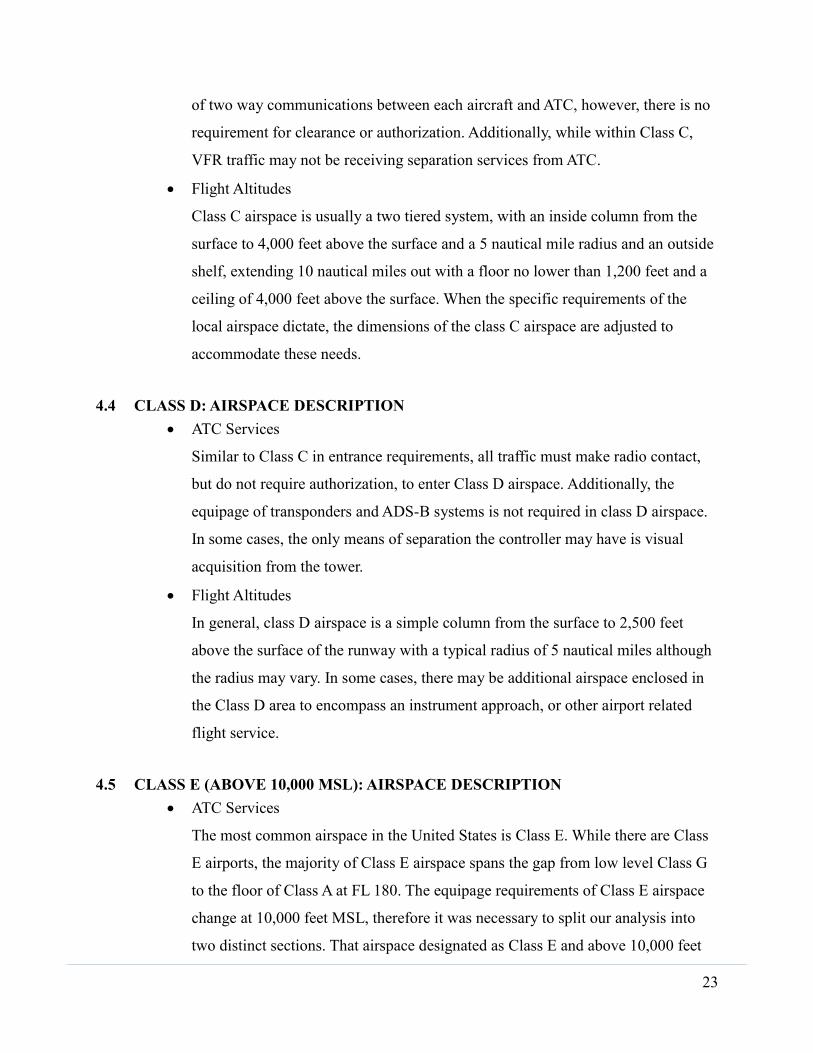
4.4 CLASS D: AIRSPACE DESCRIPTION
ATC Services
Similar to Class C in entrance requirements, all traffic must make radio contact,
but do not require authorization, to enter Class D airspace. Additionally, the
equipage of transponders and ADS-B systems is not required in class D airspace.
In some cases, the only means of separation the controller may have is visual
acquisition from the tower.
Flight Altitudes
In general, class D airspace is a simple column from the surface to 2,500 feet
above the surface of the runway with a typical radius of 5 nautical miles although
the radius may vary. In some cases, there may be additional airspace enclosed in
the Class D area to encompass an instrument approach, or other airport related
flight service.
4.5 CLASS E (ABOVE 10,000 MSL): AIRSPACE DESCRIPTION
ATC Services
The most common airspace in the United States is Class E. While there are Class
E airports, the majority of Class E airspace spans the gap from low level Class G
to the floor of Class A at FL 180. The equipage requirements of Class E airspace
change at 10,000 feet MSL, therefore it was necessary to split our analysis into
two distinct sections. That airspace designated as Class E and above 10,000 feet

24
MSL carry similar transponder and ADS-B requirements to the controlled
airspaces of A, B, and C. Though there is no requirement for VFR traffic to
communicate with ATC, the presence of this technology significantly improves
the available ATC separation services for cooperating aircraft.
Flight Altitudes
This portion of Class E airspace extends everywhere between 10,000 feet MSL
and FL 180 at the bottom of Class A airspace. Additionally, Class E airspace
resumes above the ceiling of Class A at FL 600.
4.6 CLASS E (BELOW 10,000 MSL): AIRSPACE DESCRIPTION
ATC Services
In contrast to its higher altitude equivalent, Class E airspace below 10,000 feet
MSL has very little mandatory equipment. VFR traffic in this airspace is not
required to talk to ATC except when in the vicinity of an airport with a control
tower.
Flight Altitudes
Class E airspace extends below 10,000 feet MSL to 700 feet AGL in most cases.
There are airports designated as Class E, which extend to the surface, and there
are other areas where the Class E floor is elevated to 1,200 feet AGL.
4.7 CLASS G: AIRSPACE DESCRIPTION
ATC Services
Class G airspace is the low lying airspace from the surface to the floor of the local
Class E, except when another airports higher class airspace extends to the surface.
There are some airports within class G airspace, but these are the lowest traffic
public and private airports. Class G is entirely uncontrolled airspace: ATC offers
no separation services and there are no communication or equipage requirements.
Around airports, general aviation follows one-in one-out procedures and are
recommended to call out their intentions on the local radio frequency.
Flight Altitudes
From the surface up to the local Class E airspace, either 700 or 1200 feet AGL in
most cases.

25
Figure 4.1. Airspace Classification
26
5 Evaluation
5.1 FUNCTIONS AND METHODS
5.1.1 Introduction
Five analysis tools were selected to provide the framework and data for evaluating
airborne surveillance technology performance. The combined results of these analysis
techniques provided the research team a repeatable process for comparing performance
across different scenarios and equipage configurations, while providing statistically
sufficient data sets. The five analysis techniques that were selected are Fault Trees,
Hazard Analysis, Design of Experiments, Human-in-the-Loop Simulations, and Monte
Carlo simulations. The Fault Tree analysis provides a quantitative assessment of the
impact of specific component failures within the surveillance equipment on either
ownship or the encounter aircraft in the scenarios. The Design of Experiments
methodology provides the sensitivity analysis for understanding which equipment
components are most critical for achieving separation requirements in different equipage
configurations. The Functional Hazard Analysis characterizes the criticality of the failure
impacts against the performance of the system. The simulation environment is used to
visualize the combined results of the other three analysis processes using the same
component characterizations, operational parameters, and scenario designs. Collectively
these analysis tools provide the data, correlations, and evidence to assess the criticality of
each airborne traffic surveillance technology tested.
5.1.2 Fault Trees
Fault tree analysis is designed to present a graphical representation of the failures within
the system. This method of visualization confirms that all dependencies and interactions
between technologies are incorporated in the cumulative likelihood of failure. Due to the
multiple equipage possibilities for both ownship UAS and intruder, some branches of the
tree were built to toggle on and off so that all configurations could be tested within the
same structure. In doing so, however, conditions had to be created that would correctly
exclude certain failure rates from the calculations when the technology required for
operation was not present on the opposite aircraft. For example, a fully equipped ownship
does not receive an improved level of safety from its systems when the intruder is non-

27
cooperative. Failure rates are assigned to each root level cause, which in our case come
from the technical standards on each component. When calculating failure probability in
this manner, it is important to note which systems within the tree a failure will propagate
to, and which are still fully functioning. In this style of implementation, the cumulative
failure is an indicator of the safety and reliability of system as a whole, as well as the
residual level of safety when a failure does occur. We provide this data alongside the risk
assessment in the hazard assessment to fully understand how the system reacts to a
failure.
5.1.3 Hazard Analysis
Hazard Analysis (HA) is a method for interpreting the outcome of a specific failure given
a set of operational and environmental assumptions. Our task was to evaluate the system
failures throughout the NAS, therefore a HA was an excellent analytical fit for exploring
the failure modes indicated in the fault tree. The HA allowed the team to judge the
failures based airspace class and equipage combination, providing a consistent procedure
and enabling comparison between different states. This tailored approach allows the
presence of air traffic control, when applicable, to influence the overall level of safety of
the system.
5.1.4 Design of Experiments
A systematic approach using a statistical Design of Experiments (DOE) technique was
implemented to evaluate the Fault Tree and Hazard Analysis. This data analysis provides
critical information on operational and technical performance requirements for the DAA
technologies. In this fashion the various inputs into the system can all be evaluated to
assess their contribution to the overall results. The process results in an unbiased
numerical comparison of each of the parameters studied as well as the interaction
between the parameters. The technique is especially valuable when dealing with complex
systems where multiple parameters have influence on the results. The results are also
unbiased due to any predisposed opinions or expectations. It is also valuable in
identifying interactions between the input parameters that may otherwise have been
undetected. Several classic texts on the use of DOE in other subject areas and its
development are available (Lawson and Erjavec 2001, Box and Draper 1987, Box et al.
1978, Dieter 1991).

28
The specific DOE used in this study is a two-level factorial design where each of the
identified parameters is evaluated at the high and low setting (systems on or off) in the
design space of interest. In addition, the resulting analyses serve as a predicting tool to
evaluate cases between the limits on the settings of each parameter. For example, the
DOE provides a prediction of the outcome if one of the parameters is working at less than
its full capacity, but still providing partial information. The DOE tool not only predicts
the relative importance of each parameter, but can also identify when there is not a strong
correlation between the input parameters and the resulting output. This is valuable in
systems where there is not direct impact from an input, but rather a random or
undetermined outcome. Conversely, identifying strong influence provides great impact on
determining the inputs that have the greatest influence. This can result in the more
efficient and effective decision making, as efforts in the places that have the most impact
can be targeted. The focus can be on making the most change in these areas or
establishing the appropriate requirements. In addition, the factors with less impact can be
given more freedom and/or less restrictions. Both of these situations result in placing
resources where they best fit while not over restricting others with costly requirements.
Our DOE included parameters representing Ownship TCAS, Intruder TCAS, and Intruder
ADS-B. It is assumed that each of these systems would be either operational or not. Our
results indicated that the Intruder ADS-B has five times more influence on the level of
safety than any other parameter on interaction. The Ownship TCAS, Intruder TCAS,
Ownship TCAS and Intruder ADS-B Interaction, and Intruder TCAS and Intruder ADS-B
Interaction also have impact on the output, while the rest of the interactions have an
insignificant influence on the results. These systems can be broken down into the
individual components and subsystems to gain a more thorough understanding of the
impact of each.
The DOE can also be used to evaluate simulation data to correlate the data found with the
fault tree findings. One approach was to use pilots to fly simulated encounters with
various systems turned off and on and record their performance. The cases with higher

29
risks identified should result in flight simulations with higher likelihood of unsafe flight
operations. The closest point of approach was calculated and it was found to be most
influenced most by Mode S availability and the individual pilot tendencies. Simulations
create a larger set of encounters to evaluate than would ever be possible through actual
flight testing.
Other areas of system evaluation that we conducted were in the data mining of radar and
ADS-B archives available to us. Both of these systems are identified as crucial
components to future safety in the NAS. In both systems, the loss of data and the transfer
of incorrect or misleading data was observed and evaluated. While only a relatively short
snapshot of time was studied, several interesting phenomena were observed. Both
systems have loss of data occurring in a relatively large percent of aircraft interrogated.
Some of the data losses are single events while others have significant time periods
without data being captured. The other key observation is that there are a small
percentage, but still meaningful number, of cases where incorrect or corrupt data are
observed. This is in the form of altitude readings that alternate by hundreds of feet
periodically at each scan, or barometric and geometric altitude transmissions with large
discrepancies. In addition, instances of multiple aircraft with the same identifier have
been observed as well as isolated cases of large location jumps. A summary of the
preliminary findings with the relative percentage of aircraft involved is presented below.
This data is instrumental in updating the reliability and performance specifications for the
systems involved.
Lastly, initial preliminary studies were conducted on alternate separation techniques that
have been identified as prospective contributors to safe NAS integration. Optical and
thermal detection systems have been identified by many as potential candidates. After the
initial studies are complete, these systems can be evaluated using the same DOE
techniques developed to assess the TCAS and ADS-B systems. In this manner, the true
influence and likelihood of failure can be introduced in a variety of ways to ascertain the
true impact of the inclusion of these technologies in the surveillance criticality study.

30
5.1.5 Monte Carlo Simulations
A Monte Carlo simulation methodology was developed for assessing the correlated
uncertainties occurring in the failure tree. In this case utilization of the Monte Carlo
method referrers specifically to randomly sampling either accuracy or failure statistics
from known or modeled component and system failure distributions.
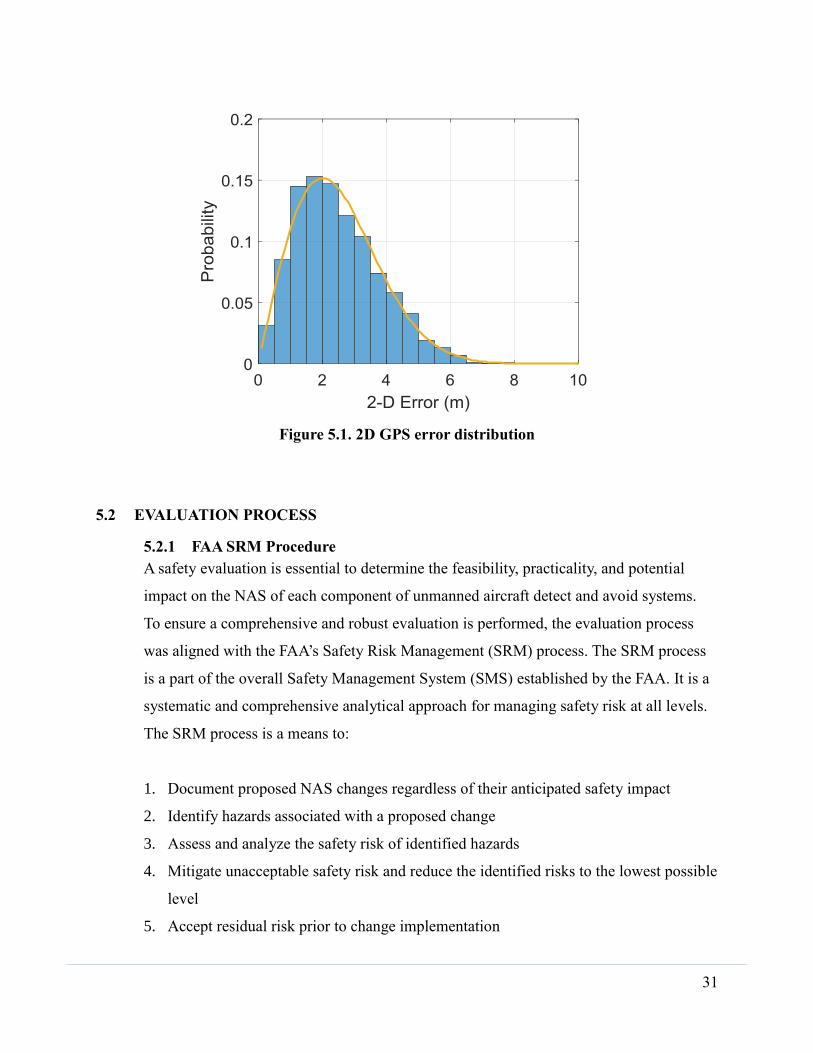
The sample probability distribution functions (PDFs) for individual component failures
were modeled based on widely published failure modes for common components. For the
majority of the cases considered in this work, accuracy statistics tended to follow a
Weibull distribution with scaling proportional to the design assurance level of the
individual component. A representative distribution for GPS latitude and longitude errors
is shown below in Figure 5.1.
Failure modes were treated as bimodal failure statistics proportional to the component
design assurance level. For the baseline testing presented in subsequent sections, the
residual failure probabilities were based entirely on the bimodal distributions used in the
individual component characterizations outlined in Section 3.
Additional computational tools were developed to assess correlated errors based on
individual component accuracy requirements, but were not used in the residual failure
rate characterizations. These tools are viewed as key follow-on capabilities which can be
rapidly integrated into more advanced models as real-world failure data is compiled.
31
Figure 5.1. 2D GPS error distribution
5.2 EVALUATION PROCESS
5.2.1 FAA SRM Procedure
A safety evaluation is essential to determine the feasibility, practicality, and potential
impact on the NAS of each component of unmanned aircraft detect and avoid systems.
To ensure a comprehensive and robust evaluation is performed, the evaluation process
was aligned with the FAA’s Safety Risk Management (SRM) process. The SRM process
is a part of the overall Safety Management System (SMS) established by the FAA. It is a
systematic and comprehensive analytical approach for managing safety risk at all levels.
The SRM process is a means to:
1. Document proposed NAS changes regardless of their anticipated safety impact
2. Identify hazards associated with a proposed change
3. Assess and analyze the safety risk of identified hazards
4. Mitigate unacceptable safety risk and reduce the identified risks to the lowest possible
level
5. Accept residual risk prior to change implementation
32
6. Implement the change and track hazards to resolution
7. Assess and monitor the effectiveness of the risk mitigation strategies throughout the
lifecycle of the change
8. Reassess change based on the effectiveness of the mitigations
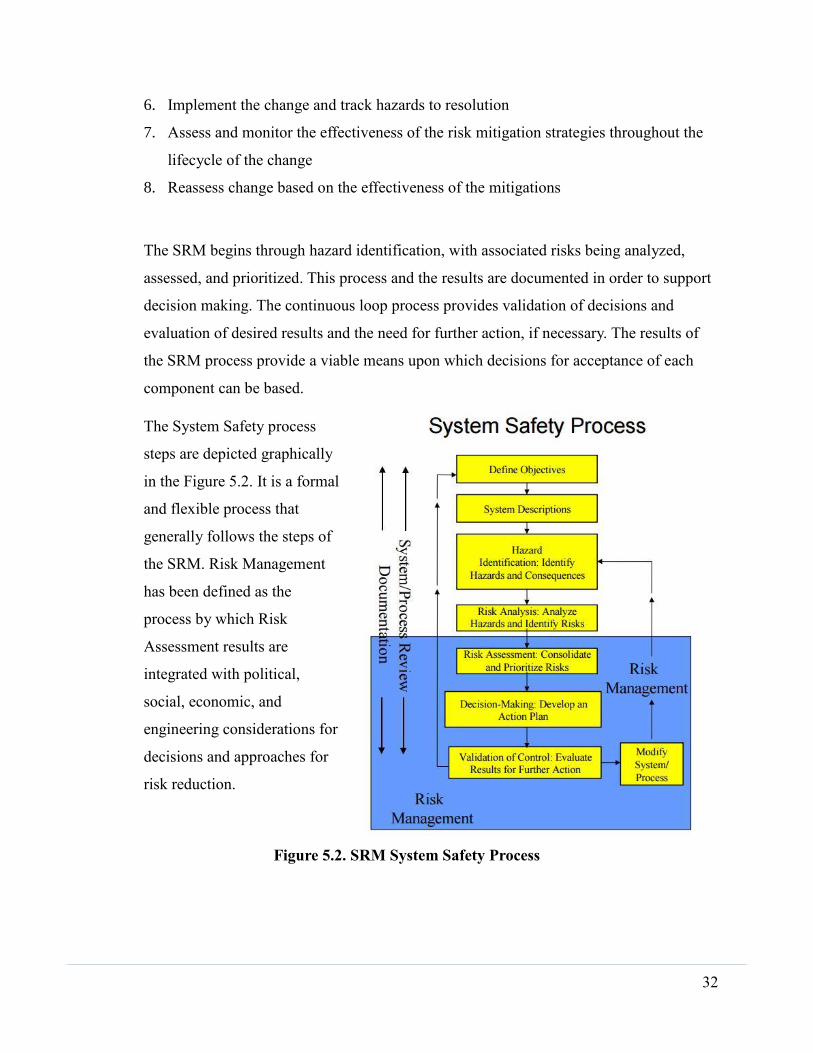
The SRM begins through hazard identification, with associated risks being analyzed,
assessed, and prioritized. This process and the results are documented in order to support
decision making. The continuous loop process provides validation of decisions and
evaluation of desired results and the need for further action, if necessary. The results of
the SRM process provide a viable means upon which decisions for acceptance of each
component can be based.
The System Safety process
steps are depicted graphically
in the Figure 5.2. It is a formal
and flexible process that
generally follows the steps of
the SRM. Risk Management
has been defined as the
process by which Risk
Assessment results are
integrated with political,
social, economic, and
engineering considerations for
decisions and approaches for
risk reduction.
Figure 5.2. SRM System Safety Process

33
5.2.2 RTCA DAA Minimum Operational Performance Standards
At the time of the project, the team used the August 19, 2016 revision of the DAA MOPs
document produced by RTCA-SC 228. The MOPs covers the nominal DAA system
architecture, alert computations, display configuration, equipment classes, and several
other technical details regarding the system. The scope of the document is the DAA
systems used in UAS transitioning to and from Class A or special use airspace (above
500’AGL), and traversing Class D, E, and G airspace in the NAS. It does not apply to
small UAS (sUAS) operating in low level environments (below 500’) or other segmented
areas. Likewise, it does not apply to operations in the Visual Flight Rules (VFR) traffic
pattern of an airport.
The MOPs assumes that cooperative intruders carry equipment that allows the ownship
to receive state information about the intruder, while non-cooperative intruder are “silent”
and all state data must be determined by sensors onboard the ownship. Two classes of
DAA are defined. Class 1 is the basic DAA that is a standalone system that include all of
the required collision avoidance capabilities. Class 2 relies on TCAS II system and
incorporates TCAS tracks and alerts. Class 2 systems can have automatic collision
avoidance maneuver execution. The TCAS II Resolution Advisory (RA) will be used to
execute the RA, which is called “Auto-RA”. If the UAS is unable to follow a TCAS II
RA (e.g. due to reduced climb ability at high altitudes or failures), the operational mode
of DAA may need to be changed to “RA Off” since TCAS II behavior onboard an
intruder may change based on whether the UAS is advertised to be TCAS II equipped or
not.
TCAS II RA Mode of Operation (from PIC) – Equipment Class 2 systems are listed as
• RA Off
• RA Manual
• RA Auto (automatically maneuver the UA to avoid danger)
The Equipment Class 1 and Class 2 air-to-air radar system is mainly used to detect
aircraft that have no surveillance equipage onboard. It uses reflections from the intruder
34
to determine if it is a traffic issue. The onboard radar will be the sole surveillance sensor
for all aircraft that do not carry transponders or ADS B equipment. The DAA system also
makes use of radar data to validate ADS-B data. Equipment Class 1 active airborne
surveillance uses 1030/1090 MHz frequencies to detect aircraft with surveillance
equipage. Active surveillance equipment relies on an intruder aircraft having an installed
and operating Mode S transponder designed to RTCA 2195 DO-181E, respectively.
Active surveillance uses a 1030 MHz transmitter to interrogate transponders within a
defined range of the ownship, and a 1090 MHz receiver to process replies. This enables
measurement of the relative aircraft position and reception of the intruder’s barometric
pressure altitude via the reply.
In general, DAA system produces three alerts when the well clear definition is violated
by an intruder aircraft. Preventative alert is intended to capture aircraft separated by 500ft
when both aircraft are level, but is specified such that it could capture additional
geometries as well. The DAA corrective alert is intended to get the Pilot In Command’s
(PIC) attention, get the PIC to determine a needed maneuver, and start PIC coordination
with ATC. It is the earliest point at which the PIC is expected to begin maneuvering, per
their judgment, to remain well clear. The corrective alert necessitates immediate
awareness of the PIC and subsequent PIC response. The DAA warning alert is intended
to inform the PIC that immediate action is required to remain well clear. The warning
alert necessitates immediate awareness of the PIC and a prompt ownship maneuver.
5.3 RESEARCH APPROACH
The research team divided the technical process into three phases to build the analysis tool,
populate the data, and assess the results for determining criticality. These three phases provided
an iterative development process allowing the team to refine results as complexity and depth
were added to the analysis tool based on further research, recommendations from FAA and
industry partners, and results of early analysis. Each phase is described below (Figure 5.3) for a
summary of the research task plan.

35
Initial Tool Design and Testing (Nov 2016 – June 2016)
This research phase was the longest phase of the project. The research team members required
extended time to prepare the Literature Review that included previous related research, published
standards, and aviation circulars, while also characterizing the baseline surveillance technologies
ADS-B, TCAS, and Mode-S. The simulation environment for testing and visualizing the
scenarios and criticality analysis was built. The initial Design of Experiments and Fault tree
analysis structures were designed, built, reviewed, and modified many times as the depth the of
analysis and dependencies within the models were discovered. Although the data analysis
minimal in the first phase, the analysis structures were robust and the overall team understanding
of the complexities was significantly stronger than when the project started.
Stakeholder Workshop #1 (June 2016)
The team met with the FAA Stakeholders and industry partners CGH Technologies, Adaptive
Aerospace Group, and Rockwell Collins at Embry Riddle in June 2016 to review the progress of
the tool design and analysis. The surveillance system characterizations, sensitivity analysis, and
scenario models were reviewed. A demonstration of the simulation environment indicated how
Figure 5.3. Research approach
36
the analysis results would be visualized (Figure 5.45.4). The initial fault tree designs were
reviewed expecting significant expansion and stakeholder recommendations for refinement.
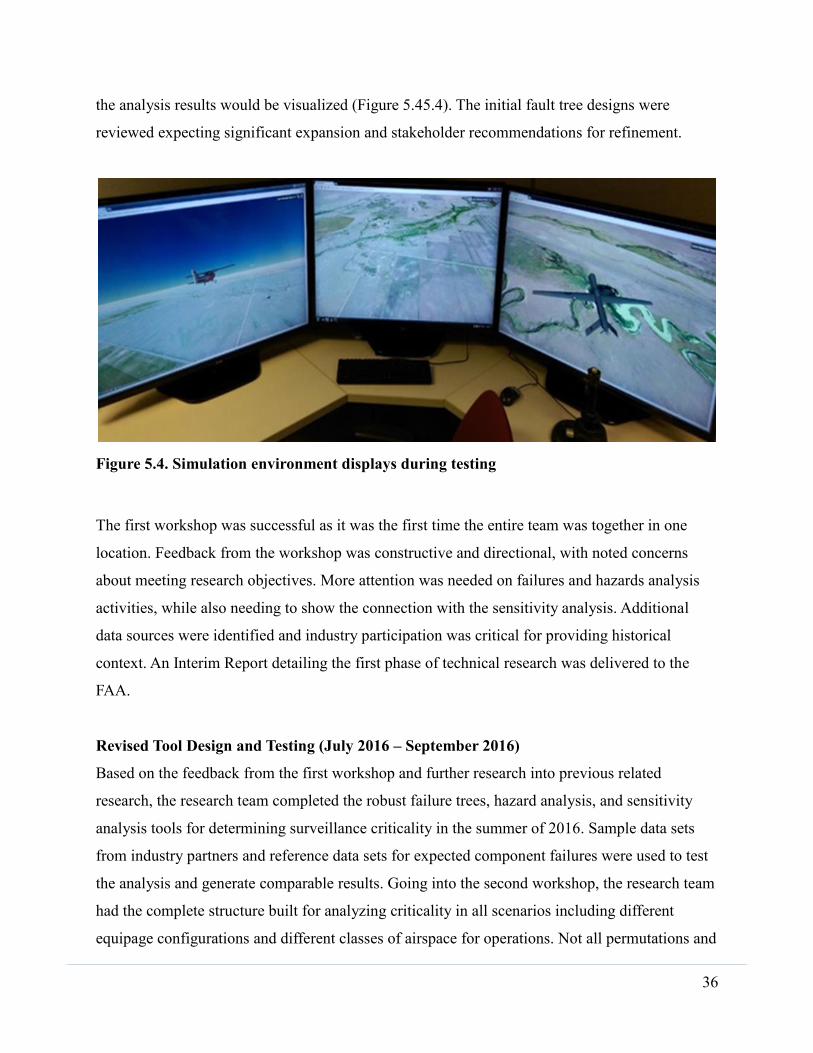
Figure 5.4. Simulation environment displays during testing
The first workshop was successful as it was the first time the entire team was together in one
location. Feedback from the workshop was constructive and directional, with noted concerns
about meeting research objectives. More attention was needed on failures and hazards analysis
activities, while also needing to show the connection with the sensitivity analysis. Additional
data sources were identified and industry participation was critical for providing historical
context. An Interim Report detailing the first phase of technical research was delivered to the
FAA.
Revised Tool Design and Testing (July 2016 – September 2016)
Based on the feedback from the first workshop and further research into previous related
research, the research team completed the robust failure trees, hazard analysis, and sensitivity
analysis tools for determining surveillance criticality in the summer of 2016. Sample data sets
from industry partners and reference data sets for expected component failures were used to test
the analysis and generate comparable results. Going into the second workshop, the research team
had the complete structure built for analyzing criticality in all scenarios including different
equipage configurations and different classes of airspace for operations. Not all permutations and

37
combinations were tested, but the structure was built and test cases were generating results for
analysis.
Stakeholder Workshop #2 (September 2016)
The second Stakeholder Workshop was hosted at North Carolina State University in September
2016. This workshop was attended by FAA and industry partners CGH Technologies, Adaptive
Aerospace Group, and Precision Hawk. The research team presented the analysis updates from
the first workshop, highlighting the advances in the failure trees and functional hazards analysis
for evaluating criticality. The simulation engine was [remotely] used to demonstrate updates and
examples of scenarios run through the data analysis tools. At the conclusion of the workshop, the
research team was on track to deliver the research objectives of the project using the analysis
tools and data sources identified through the first two technical phases of research.
Final Revisions and Analysis (October 2016 – November 2016)
The research team used the scenarios presented at the second workshop to complete the
surveillance criticality analysis for large UAS DAA technologies including ADS-B, TCAS, and
Mode-S transponders. The results of this analysis are presented after the detailed descriptions of
the analysis tools below.
5.4 BOWTIE AND COLLISSION PROCESS DESIGN
5.4.1 Bowtie Flow
The bowtie method visually correlates failure modes to actual outcomes of each scenario.
A single hazard is selected, with the potential causes expanded on one side, and the
environment specific outcomes on the other. With the complexity and number of
scenarios being examined, a traditional bowtie structure was not practical to use,
however, the underlying ideas are preserved. On one side there are the failure trees,
separated by equipage to only include the appropriate linkages; and, on the other, the
airspaces. The focus hazard in this case is complete DAA systems failure.

38
5.4.2 Collision Process
Our analysis evaluates how often these technologies fail, and attempts to grade those
failures in an objective manner, however, the failure rates only show us part of the story.
Our analytical team’s discussions revealed that while such failures may produce
dangerous outcomes, the underlying probability of an encounter scenario was missing. To
understand the total impact these failures have, traffic density and encounter likelihood
need to be included in the analysis. In contrast, however, it was important to note that a
system is not safe simply because it is not needed frequently. It was unacceptable to the
team to argue that “big sky” was an effective mitigation to potential collisions, but that if
an encounter occurred during a failure, collisions were expected. The final output
includes both considerations, with and without an encounter probability, but the hazard
severity is assessed without it. This is an effort to present both sides of the argument, the
system in an encounter as well as the system in a true fielded environment.
Once an encounter has occurred, it must be evaluated in terms of safety. In our case, this
meant determining the expected minimum separation that would exist. This separation
expectation was applied based on the status of the DAA system overall, after the failure,
in order to remain subjective and consistent across all airspaces. Our event criticality
explanations are detailed later in Figure 5.12.
5.5 HAZARD ASSESSMENT DESIGN
5.5.1 Fault Tree
The failure trees included below (Figures 5.5, 5.6, 5.7, 5.8, 5.9, and 5.10) depict the
technology requirements and dependencies of the highest equipage cases of both ownship
and intruder aircraft. All the DAA systems are able to be toggled on and off when
evaluating less equipped scenarios. Flat bottomed gates indicate AND functions, whereas
arched bottoms gates are OR functions. Circles indicate root level events or failures. A
triangle gate indicates that there is collapsed information beneath that particular level.
The failure rates are included below each event, but are fully referenced later in the
hazard tables.
The top level in the failure tree shows the relationship between ownship and intruder
equipment. This is also where the probability of having an encounter scenario was
implemented. There are many interpretations of what a reasonable expectation of having
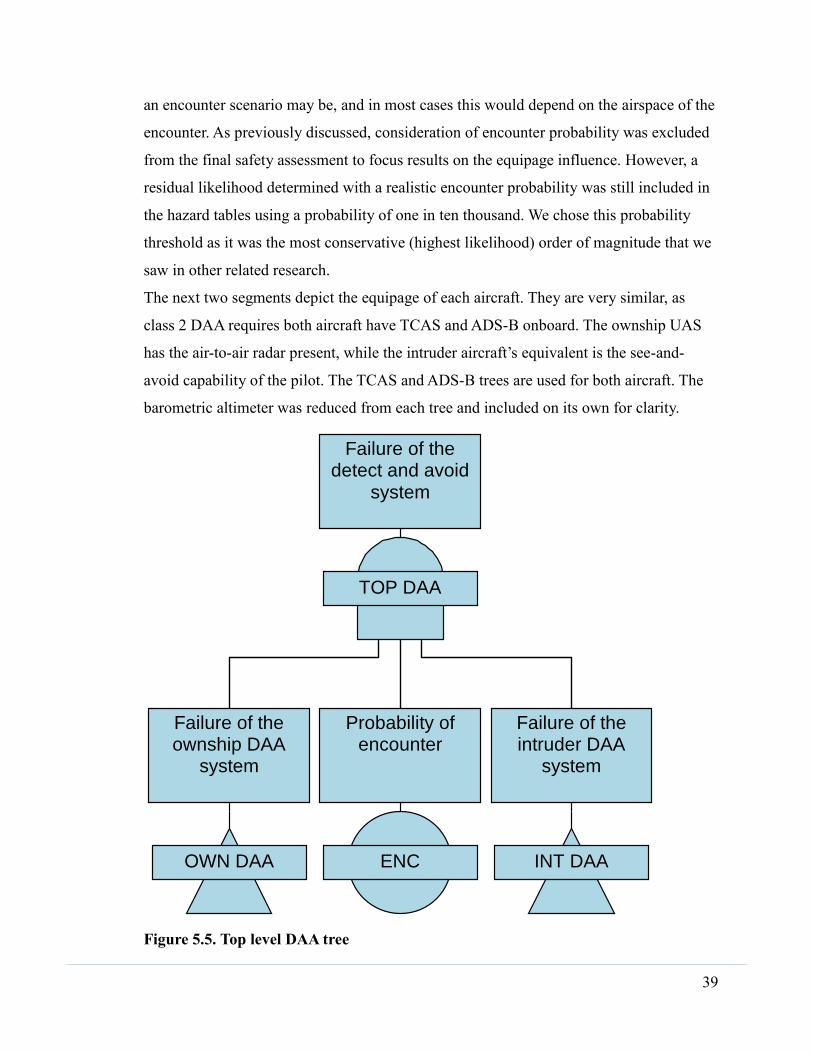
39
an encounter scenario may be, and in most cases this would depend on the airspace of the
encounter. As previously discussed, consideration of encounter probability was excluded
from the final safety assessment to focus results on the equipage influence. However, a
residual likelihood determined with a realistic encounter probability was still included in
the hazard tables using a probability of one in ten thousand. We chose this probability
threshold as it was the most conservative (highest likelihood) order of magnitude that we
saw in other related research.
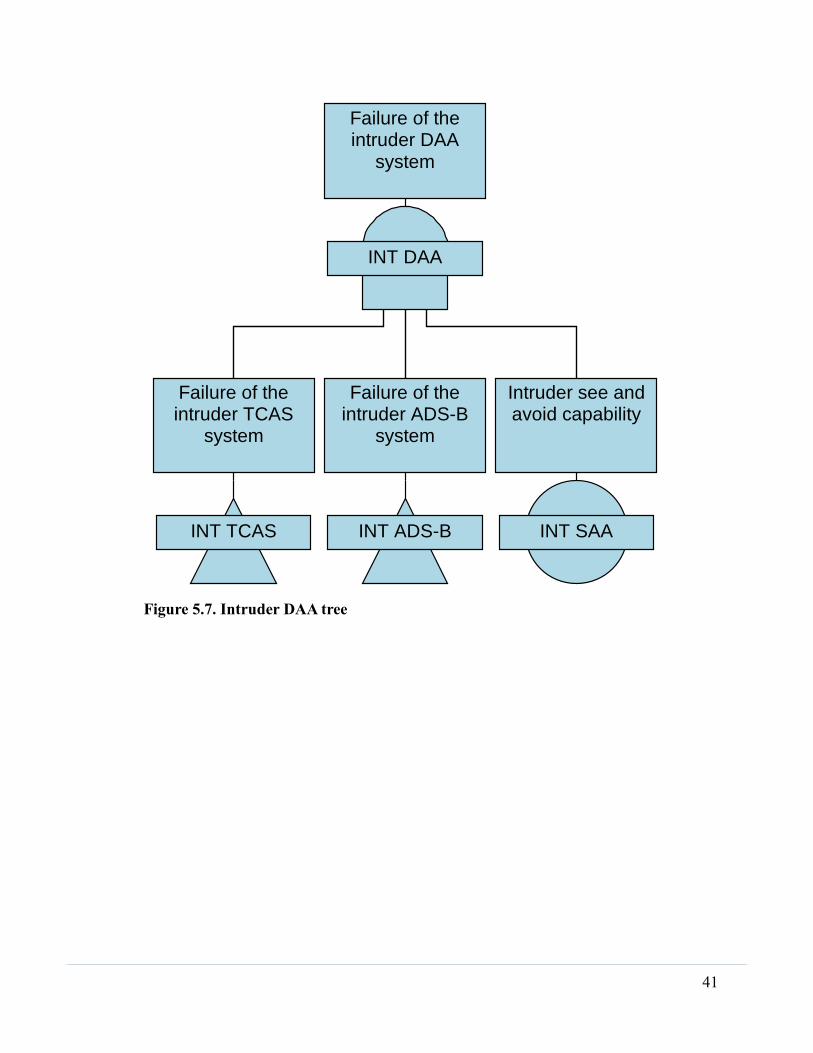
The next two segments depict the equipage of each aircraft. They are very similar, as
class 2 DAA requires both aircraft have TCAS and ADS-B onboard. The ownship UAS
has the air-to-air radar present, while the intruder aircraft’s equivalent is the see-and-
avoid capability of the pilot. The TCAS and ADS-B trees are used for both aircraft. The
barometric altimeter was reduced from each tree and included on its own for clarity.
Figure 5.5. Top level DAA tree
TOP DAA
Failure of thedetect and avoid
system
OWN DAA
Failure of theownship DAA
system
INT DAA
Failure of theintruder DAA
system
ENC
Probability ofencounter

40
Figure 5.6. Ownship DAA tree
OWN DAA
Failure of theownship DAA
system
OWN TCAS
Failure of theownship TCAS
system
OWN ADS-B
Failure of theownship ADS-B
system
OWN RADAR
Failure of theownship DAA
radar
FR=0.001Failure Rate = 0.001
41
Figure 5.7. Intruder DAA tree
INT DAA
Failure of theintruder DAA
system
INT TCAS
Failure of theintruder TCAS
system
INT ADS-B
Failure of theintruder ADS-B
system
INT SAA
Intruder see andavoid capability

42
Figure 5.8. TCAS failure tree
TCAS
Failure of theTCAS system
MODE-S
Failure of theMode S
transponder
RADIO ALT FAIL
TCAS radioaltimeter failure
FR=0.001
TCAS FAIL
Failure of theTCAS function
FR=1E-05
BARO ALT
Failure of thebarometricaltimeter
MODE-S FAIL
Failure of theMode S
transponder
FR=0.001
MODE-S WRONG
Misleadinginformation from
the Mode Stransponder
FR=1E-05

43
Figure 5.9. ADS-B failure tree
AD
S-B
Fa
ilure
of th
eA
DS
-B s
yste
m
AL
T E
RR
OR
Altitu
de
erro
r inth
e A
DS
-Bsyste
m
MO
DE
-S
Fa
ilure
of th
eM
od
e S
tran
sp
on
de
r
AD
S-B
FA
IL
Lo
ss o
f fun
ctio
no
f the
ow
nsh
ipA
DS
-B s
yste
m
FR
=1
E-0
5
AD
S-B
WR
ON
G
Mis
lea
din
gin
form
atio
n fro
mth
e A
DS
-Bsyste
m
FR
=1
E-0
5
GP
S E
RR
OR
(P)
Mis
lea
din
gin
form
atio
n in
GP
S p
ositio
n
FR
=1
E-0
5
BA
RO
AL
T
Fa
ilure
of th
eb
aro
me
trica
ltime
ter
GP
S E
RR
OR
(A)
Mis
lea
din
gin
form
atio
n in
GP
S a
ltitud
e
FR
=1
E-0
5
MO
DE
-S F
AIL
Fa
ilure
of th
eM
od
e S
tran
sp
on
de
r
FR
=0
.00
1
MO
DE
-S W
RO
NG
Mis
lea
din
gin
form
atio
n fro
mth
e M
od
e S
tran
sp
on
de
r
FR
=1
E-0
5

44
Figure 5. 10. Barometer altimeter failure tree
5.5.2 Hazard Assessment
Our task was primarily focused on examining the DAA systems in an objective,
standards-based manner. Due to a myriad of options in the marketplace, our DAA
system failure rates were drawn from the technical order minimums for each piece
of equipment, rather than from data provided by fielded equipment. We do not
suggest that all equipment in the fleet achieves these minimums, nor would we
imply that none go above and beyond them. However, as an unbiased
measurement, the standards provide an assessment value for evaluation. Most of
the systems considered have TSOs which provide a Failure Condition
BARO ALT
Failure of thebarometricaltimeter
ALT FAIL
Failure of thebarometricaltimeter
FR=1E-07
ALT WRONG
Misleadinginformation fromthe barometric
altimeter
FR=1E-09
ALT LOSS
Loss of theprimary means of
functon of thealtitude display
FR=0.001

45
Classification; these design requirements and the risk matrix chart (Figure 5.11)
provide a maximum likelihood of failure. The likelihood for the appropriate
severity level with the maximum value associated with the first medium risk event
was used. Except in the case of minor failures, a limitation of probable was
implemented because frequent has an uncapped likelihood. This chart is used
again in the final stage of analysis to combine likelihood and failure criticality
into a risk assessment.
The next step in the hazard analysis was to evaluate what impact each failure had
on the DAA system as a whole. We then determined which pieces were still
operating and to what extent they may still provide improved situational
awareness for the pilot. To answer these questions as objectively as possible, we
crafted our own criticality assessment chart. Figure 5.12 shows the breakdown of
each level of criticality as defined by the working state of the DAA system, and
our analysis of what level of separation such a system would be capable of
providing. It is important to note that for the purposes of this chart, ATC services
were included as a DAA benefit. This was done so that ATC mitigation was
included in the analysis directly and not used as a post process severity limiter.
With a failure likelihood and event criticality, the analysis returns to the risk
matrix to determine the risk level for each mode of failure. This is the basis of our
conclusions on whether or not a system is providing adequate safety to the overall
scenario.

46
Figure 5.11. Risk matrix chart
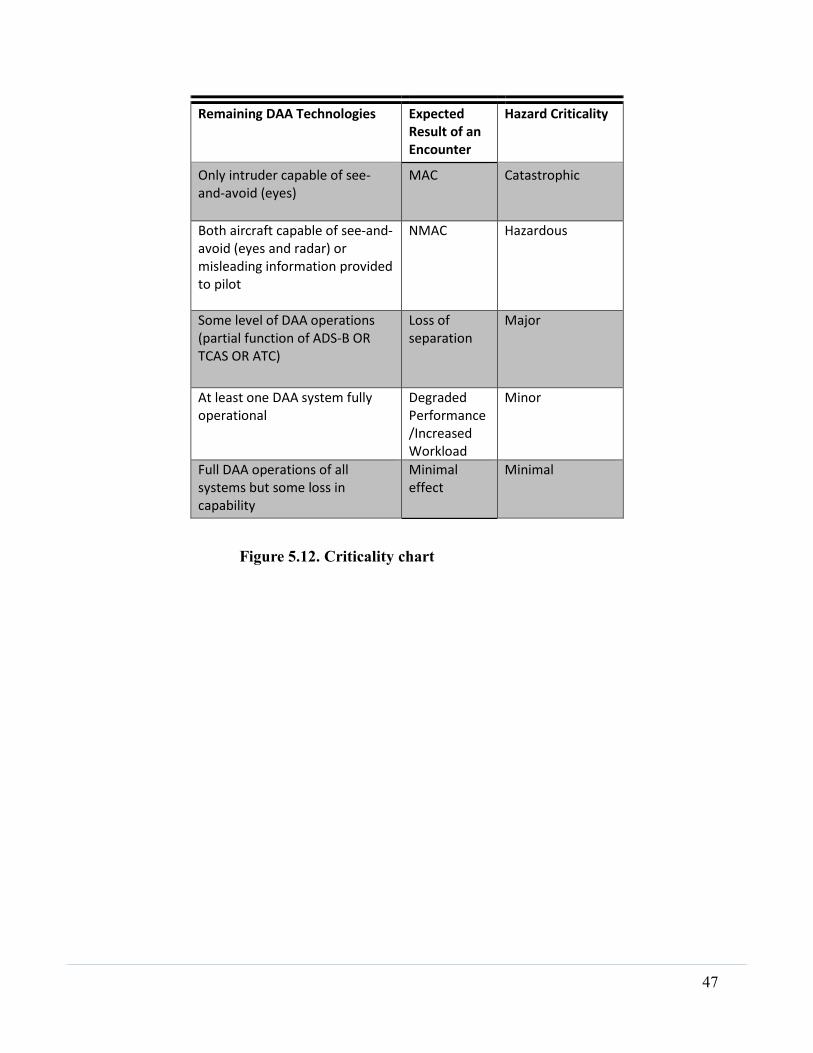
47
Remaining DAA Technologies Expected Result of an Encounter
Hazard Criticality
Only intruder capable of see-and-avoid (eyes)
MAC Catastrophic
Both aircraft capable of see-and-avoid (eyes and radar) or misleading information provided to pilot
NMAC Hazardous
Some level of DAA operations (partial function of ADS-B OR TCAS OR ATC)
Loss of separation
Major
At least one DAA system fully operational
Degraded Performance/Increased Workload
Minor
Full DAA operations of all systems but some loss in capability
Minimal effect
Minimal
Figure 5.12. Criticality chart
48
6 Analysis
6.1 HAZARD ANALYSIS SUMMARY
This section presents the summary of all hazard analyses considered based on the equipage and
airspace categories outlined in sections 3-5. This analysis focuses on high-risk scenarios resulting
from DAA system and/or component failures on the ownship aircraft. Trends in the high-risk
scenarios were primarily influenced by airspace and the allowable equipages therein. High-risk
scenarios present in controlled airspace (A, B, and C) were similarly present in less controlled
airspace. The overlap in high-risk scenarios allows the hazard analysis to be segmented by
airspace, with a discussion of the influence of equipage and unique scenarios therein.
The hazard analyses presented below provide the quantitative data necessary to address the
research questions posed in the initial research proposal. A discussion of the influence of these
data on the specific research questions is presented in section 7.

49
Controlled Airspace (Class A, B, and C)
Equipage – Controlled airspace (Class A, B, and C) has two separate equipage cases. The first is
Class 2, the fully equipped case with TCAS, ADS-B, and radar. The second equipage case is
Class 1, ADS-B, Mode S transponder, and Radar. The above equipage cases represent the
minimum equipage cases for UAS operations on an IFR flight plan in controlled airspace as of
2020. For the encounter cases considered in this analysis, the intruder aircraft will not be
equipped with radar, but may take on either Class 2 (with TCAS) or Class 1 (without TCAS)
surveillance capabilities.
Criticality of each High risk case – Three failures in controlled airspace result in a high risk
severity classification.
1. The total loss of function of the transponder results in a worst case scenario of the loss of
separation of the ownship and intruder aircraft, which we define as a major failure event.
This is a probable failure mode, and when combined with its criticality results in a high
risk case on the risk matrix.
2. A hazardously misleading malfunction of the transponder also results in a possible loss of
separation and is therefore classified as a major criticality. Corrupt transmissions are
slightly less likely than failures and assigned the remote designation, however, the risk
matrix still outputs this failure as a high risk case. Both of these failures occur in all three
equipage combinations present in controlled A, B, and C airspace.
3. The final high risk failure occurs only when a Class 1 ownship encounters a Class 1
intruder and is the result of a GPS failure. This is another major failure classification with
a remote likelihood.
All other system failures in controlled airspace are categorized as low or medium risk.
Discussion of High Risk – This analysis demonstrates that the transponder system is the
component with the highest associated risk in these encounters. The transponder system acts as a
single point failure as it affects multiple other DAA systems. These transponder failures would
result in the DAA system becoming reliant solely on the ownship radar. The loss of all three
major DAA systems results in a greater possibility of loss of separation and as such unsafe flying

50
conditions. In the event of a transponder failure, ATC would continue to provide separation
services in these airspaces, limiting the criticality of the failure to major.
The transmission of hazardously misleading information presents a scenario where the DAA
system may display multiple aircraft tracks, or display the incorrect altitude and location track.
With incorrect altitude and location information being transmitted, ATC would rely on primary
radar to provide separation information of aircraft in controlled airspace. This would cause an
increased workload on the ATC to provide separation services as the only reliable information
would be location and not altitude. Increased ATC workload as well as the possibility of detect
and avoid being inoperable results in reliance on ATC and radar, resulting in a potential loss of
separation.
The GPS failure will result in a loss of ADS-B functionality. This loss, without the presence of a
TCAS system as in Class 1 equipage results in a DAA system limited to just a radar and ATC
services. In a manner similar to the transponder events, this is a major failure. However, both
aircraft maintain Mode-S operability and therefore ATC separation services are unaffected by
this failure.

51
Class D airspace
Equipage – Class D airspace allows for consideration of additional intruder equipage cases.
These include operation with only a Mode-S transponder, and an entirely unequipped case
(following the post-2020 rule set forth in 14 CFR § 91.225 and 91.227). It should be noted that
the unequipped case is still assumed to have two-way radio contact with ATC as per the
requirements set forth in 14 CFR § 91.129. This allows the local tower ATC to enforce separation
standards for arriving and departing traffic.
Criticality of each high-risk case – The high-risk failures for equipages 2v2, 1v2, and 1v1 in
class D airspace are equivalent to those found in class A, B, and C airspaces and will not be
repeated here. Additionally, the high-risk cases for equipages 2v1A and 1v1A are similar to those
found in the higher equipage cases. Class D airspace allows for the presence of unequipped
aircraft (equipage case 0) which implies that the primary means of deconfliction between
ownship and intruder aircraft is the ownship radar system and the DAA capabilities of the
intruder. Ownship radar failure is assumed binary in nature and therefore results in only a total
loss of function (no misleading information cases are considered for this system). Failure of the
ownship radar for equipage cases 2v0 and 1v0 results in a hazardous criticality and possible
NMAC, given the lack of remaining onboard DAA systems. The lack of any remaining DAA
systems, combined with the high probability of failure outlined in the SC-228 radar MOPS,
results in a high-risk severity. All other failures for higher equipage cases result in a low or
medium-risk severity as outlined in the class A, B, and C airspace discussions.
Discussion of high-risk cases – An ownship radar failure in class D airspace against an
unequipped intruder results in a unique high-risk incident. In a manner similar to the transponder
failure outlined in the discussion of class A, B, and C airspaces, the radar functions as a single-
point failure. However, operations inside class D airspace occur under local ATC control, which
may provide deconfliction in a manner not available in uncontrolled airspace. This reduces the
possible effects from a MAC to a possible NMAC, given the only remaining DAA systems
involve the intruder’s DAA ability and active intervention by ATC.

52
Class E airspace above 10,000 feet
Equipage – Class E above 10,000 feet follows the same equipage cases as listed above in
controlled airspace. These equipage cases are discussed in detail in the Airspace Overview
section earlier in the report. The equipage cases listed above represent the minimum equipage
cases for UAS operations as of 2020. For the encounter cases considered in this analysis, the
intruder aircraft will not be equipped with radar.
Criticality of each High Risk Case – The high risk failures for equipages 2v2, 1v2, and 1v1 in
class E airspace above 10,000 feet are equivalent to those found in class A, B, C, and D
airspaces. The total loss of function of the transponder results in a worst case scenario of the loss
of separation of the ownship and intruder aircraft. A loss of separation results in a criticality that
is classified as major. A hazardously misleading malfunction of the transponder also results in a
possible loss of separation and is therefore classified as a major criticality. The combination of a
major criticality as a result of the two transponder failure modes and a probable/remote
probability of failure, respectively, results in a high risk scenario according to the FAA SMS risk
matrix. The two failures listed above are present in all equipage cases for Class E airspace above
10,000 feet. A third and final high risk failure is identified in the equipage case of Class 1
ownship and Class 1 intruder. GPS horizontal failure results in a possible loss of separation and
is therefore classified as a major criticality. This failure is classified as a remote probability, thus
the combination of a major criticality and remote probability results in a high risk case.
Discussion of High Risk - This analysis demonstrates that the transponder system and horizontal
GPS are the components with the highest associated risk. The transponder system acts as a single
point failure because it affects multiple other systems that rely on the transmission and
coordination of position data. The failure analysis assumes that a single transponder is linked to
both the TCAS and ADS-B systems. Therefore, a transponder failure would result in a DAA
system being entirely reliant on the ownship’s radar. The loss of three major DAA systems
results in a greater possibility of loss of separation and as such unsafe flying conditions. In the
event of a transponder failure, ATC would continue to provide separation services, reducing the
criticality of the failure. ATC services combined with DAA capabilities of the intruder and
ownship radar is an adequate mitigation to lower the failure criticality to major. However, the

53
probable likelihood of a total loss of function in the transponder system is enough to warrant a
high risk case scenario.
The transmission of hazardously misleading information presents a scenario where the DAA
system would display multiple aircraft tracks, or display the incorrect altitude and location track.
With incorrect altitude and location information being transmitted, ATC would rely on primary
radar to provide lateral separation information of aircraft in class E airspace. This would cause an
increased workload on the ATC to provide separation services as the only reliable information
would be location and not altitude. Increased ATC workload and the possibility of DAA being
inoperable results in reliance on ATC and radar, and a potential loss of separation. The loss of
separation in association with a remote likelihood of a transponder transmitting hazardously
misleading information results in a high risk situation.
The failure of horizontal GPS causes the failure of the ADS-B system because ADS-B is no
longer able to determine position. Unlike vertical GPS, horizontal GPS is the primary means of
determining aircraft location. In the equipage case without TCAS, GPS location is no longer
being transmitted. The loss of horizontal GPS transmission results in an inability for either the
ownship or intruder aircraft to determine location relative to each other. This failure causes ATC
to rely on primary radar to provide separation services to aircraft flying in Class E airspace above
10,000 feet. ATC providing the only reliable separation services would result in an increased
work load for ATC. This increased workload combined with inoperable DAA systems results in a
reliance on ATC and radar, and a potential loss of separation. Horizontal GPS has a remote
likelihood of failure which causes a loss of separation, leading to a combination that results in a
high risk scenario.
54
Class E airspace below 10,000 feet
Equipage – Class E below 10,000 feet follows the same equipage cases as Class D airspace
described above. These equipage cases are discussed in detail in the Airspace Overview section
earlier in the report. Of the above equipage cases, UAS’s as of 2020 will be equipped with a
minimum of ADS-B, Mode S, and Radar. The intruder can be equipped any of the four possible
equipage cases. For the encounter cases considered in this analysis, the intruder aircraft will not
be equipped with radar.
Criticality of each High Risk Case – The high risk failures for equipages 2v2, 1v2, 1v1, 2v1a,
and 1v1a are similar to those found in class D airspace. The total loss of function of the
transponder results in a worst case scenario of a NMAC of the ownship and intruder aircraft. A
NMAC results in a criticality that is classified as hazardous. A hazardously misleading
malfunction of the transponder also results in a possible NMAC and is therefore classified as a
hazardous criticality. The combination of a hazardous criticality as a result of the two
transponder failure modes and a probable/remote probability of failure, respectively, results in a
high risk scenario according to the FAA SMS risk matrix. The two failures listed above are
present in all equipage cases for Class E airspace below 10,000 feet except for the unequipped
case. A third high risk failure is identified in the equipage case of Class 1 ownship and Class 1
intruder as well as Class 1 ownship and Class 1a intruder. Horizontal GPS failure results in a
possible NMAC and therefor classified as a hazardous criticality. This failure is classified as a
remote probability, therefore the combination of a major criticality and remote probability results
in a high risk case. The final failure only occurs in the unequipped intruder cases and is the
failure of the Radar system which could result in a Mid Air Collision of the ownship and intruder
aircraft. As such this is a catastrophic criticality. This criticality combined with a probable
likelihood of failure results in a high risk failure.
Discussion of High Risk - This analysis demonstrates that the transponder system, horizontal
GPS, and radar are the components with the highest associated risk. The transponder system acts
as a single point failure because it affects multiple other systems that rely on the transmission
and coordination of position data. The failure analysis assumes that a single transponder is linked
to both the TCAS and ADS-B systems. Therefore, a transponder failure would result in a DAA
entirely reliant on the ownship’s radar. The loss of three major DAA systems results in a greater

55
possibility of NMAC and as such unsafe flying conditions. In the event of a transponder failure,
ATC would not provide separation services in Class E airspace below 10,000 feet. Without ATC
services and the sole reliance on see and avoid of the intruder and ownship radar there is no
mitigation to lower the failure criticality resulting in a hazardous criticality. Additionally, the
probable likelihood of a total loss of function in the transponder system is enough to warrant a
high risk case scenario.
The transmission of hazardously misleading information presents a scenario where the DAA
system would display multiple aircraft tracks, or display the incorrect altitude and location track.
With incorrect altitude and location information being transmitted, and without ATC providing
lateral separation information of aircraft in class E airspace below 10,000 feet, the only
operational DAA systems are those on the intruder and the ownship’s radar. This would result in
the possibility of a near mid-air collision because of reliance on see and avoid or radar as well as
the loss of other DAA systems. A NMAC in association with a remote likelihood of a
transponder transmitting hazardously misleading information results in a high risk situation.
The failure of horizontal GPS causes the failure of the ADS-B system because ADS-B is no
longer able to determine position. Unlike vertical GPS, horizontal GPS is the primary means of
determining aircraft location. In any of the equipage cases without TCAS, GPS location is no
longer being transmitted. The loss of horizontal GPS transmission results in an inability for
either the ownship or intruder to determine location relative to each other. ATC does not provide
separation services to aircraft flying in Class E airspace below 10,000 feet. The lack of ATC
services as well as a reliance on see and avoid or radar due to the loss of other DAA systems
results in a potential NMAC between the ownship and intruder aircraft. Horizontal GPS has a
remote likelihood of failure which hazardous failure condition, this combination results in a high
risk scenario.
In Class E below 10,000 feet the Class 0 intruder cases have one failure. The ownship radar
failure when the intruder is unequipped results in relying only on the intruder’s DAA
capabilities. As such, any situation where the intruder is unable to see the ownship aircraft could
result in a mid-air collision. This is a catastrophic failure. The combination of a catastrophic
failure and a probable likelihood of failure is a high risk event.

56
Class G airspace
Equipage – Class G airspace incorporates all four equipage classes and seven combinations just
like Class D and E below 10k. Class G has no ATC involvement or contact requirements, and
ATC radars do not have consistent coverage in the low altitudes of class G. This means that even
IFR traffic present in class G will not be receiving separation services or ATC guidance. In
general IFR traffic is expected to use class G airspace in transition to controlled airspace, gaining
separation services upon entering class E or greater airspace.
Criticality of each high-risk case – Class G airspace is the lowest controlled and equipped
airspace, and expectedly presents the most high risk failures. As before, both failure of the
transponder and misleading information from it are high risk events in all equipage cases except
when the intruder is unequipped. Additionally, in Class 1 ownship and Class 1 or 1a intruder
scenarios, failure of horizontal GPS results in a high risk condition. In both situations where the
intruder is Class 1a, the altimeter failure becomes a major failure and therefore a high risk event.
This is a new high risk event unique to class G airspace, as in all other airspaces, ATC presence
moderates such a failure. Finally, both unequipped intruder encounters’ radar failure modes
remain high risk. Without ATC presence, many of these failures are a higher criticality than in the
previous airspaces, meaning that class G airspace has many more hazardous failures. This hazard
level does not make high risk events more severe, but do increase the number of medium risk
events. Though still not critical in our analysis, this is another indication of the decreased safety
of flying in class G airspace.
Discussion of high-risk cases – An altimeter failure in the presence of a Class 1a intruder results
in no active DAA systems being operable. Because of the lack of control in class G airspace, this
presents a significant hazard not found in other airspaces. With no other system ensuring
separation, it is left to the air to air radar and the intruder pilot to avoid one another. This major
failure has probable likelihood and is therefore determined to be high risk.

57
6.2 SEVERITY ANALYSIS SUMMARY
Failure Tree Design of Experiments
To provide a sensitivity study and to understand the interaction between different DAA
technologies on the failure tree, a DOE was chosen. This data is used to determine the
operational and performance requirements for the DAA technologies. Using a DOE in
conjunction with the failure tree allows the permutations of failure combinations to be
understood. The failure tree provides a good picture of the total likelihood of failure of the DAA
system, but the DOE illustrates which factors or systems have the largest impact on total failure.
In other words, the DOE provides the sensitivity of various systems, or combinations or systems
failing. Ownship TCAS, intruder TCAS, and intruder ADS-B were chosen to provide a
generalized overview of how this type of analysis works. It was assumed that Mode S would
always be turned on both the ownship and intruder aircraft, so by investigating two of the major
DAA systems used today, a thorough understanding of the sensitives of these systems could be
understood.
A DOE two-level factorial design with three different factors resulted in eight different
runs/scenarios. All possible scenarios are provided in Table 6.1 along with the associated factor
labels (A, B, and C) which we used in subsequent analysis described later in this section. The
“on” indicates the system is working properly. The “off” represents either a total failure of the
system(s) or the system(s) was/were not installed on the aircraft. Later in this section, high level
refers to the “on” label, and low level refers to the “off” label. The total likelihood column is the
information obtained from the failure tree result and indicates the likelihood of failure for the
overall DAA system.

58
Table 6.1. Summary of the eight scenarios analyzed with the DOE. The left three columns
indicate whether those systems were on or off (either from total failure or not having the
systems on the aircraft), and the far right column lists the total likelihood of failure from
that corresponding scenario.
Ownship TCAS
(Factor A)
Intruder TCAS
(Factor B)
Intruder ADS-B
(Factor C) Total Likelihood of Failure
off off on 1.17E-14
on off on 1.75E-14
off on on 1.75E-14
on on on 2.61E-14
off off off 5.74E-12
off on off 8.60E-12
on off off 8.60E-12
on on off 1.29E-11
One noticeable result from the failure interactions is when either ownship TCAS or the intruder
TCAS were turned off, and ADS-B was on (Note: TCAS refers to the TCAS algorithm, not the
equipment used for the TCAS system), the total likelihood was the same. This can be seen in
rows 2 and 3 of Table 6.1. Both the ownship and intruder Mode-S transponders were still on, so
this is a result one would expect. As long as one of the TCAS algorithms is still active, the total
likelihood of failure of the entire DAA system remains the same, regardless of whether the
ownship or intruder has the working algorithm. Another behavior to point out is that having all
three parameters turned off does not result in the highest total likelihood of failure, and having all
three parameters turned on does not result in the lowest total likelihood of failure. This is because
as systems are added to the overall DAA system, new failure methods are introduced and
potentially increase the likelihood of failure of the overall DAA system. Another major
observation that can be drawn from this analysis is that ADS-B appears to play the largest effect

59
on the total likelihood of failure. When ADS-B is turned off, the total likelihood of failure is 10-12
or less, when ADS-B is on the total likelihood is 10-14.
A useful approach to analyze results from a factorial design is to interpret factorial plots of
effects. There are two types of effects, main effects and interaction effects. Main effects represent
the individual factor effects (parameters that are turned on and off), where interaction effects
illustrate the connected effects/interactions of two or more factors. Normal probability plots and
Pareto charts are used to demonstrate the overall effects of different combinations. The normal
probability plot correlates the magnitude and statistical significance of main and interaction
effects, while the Pareto chart compares the importance of standardized effects.
In the initial analysis, the interaction effects of ownship TCAS and Intruder TCAS (factor AB in
our analysis) and ownship TCAS, Intruder TCAS, and Intruder ADS-B (factor ABC) had very
small values which could be neglected. After discarding these two terms, the final results were
established. The following figures and equation only contain the significant effects and
interactions. Total failure likelihood can be expressed by Equation 1. While the primary DOE
results considered total failures of the systems, the equation can help interpolate between those
results, providing insight into partial failures of various systems to consider the sensitivity those
partial failures have as well. The coefficients were found from analysis of variance, with a p
value of less than 0.05 for the significant factors found. Each variable in the equation
corresponds to the equipment main effect or interaction between multiple pieces of equipment. A
value between -1 and 1 could be entered to simulate a partial failure of each variable. A value of
1 indicates a fully operational system, while a value of -1 indicates a full system failure.
Therefore, to determine the percentage of failure for a partially operating system the value can be
normalized to fall between -1 to 1. For example, for a failure of 50% the value used for the factor
in the equation is 0, halfway between the end points.
Equation 1:
𝑇𝑜𝑡𝑎𝑙 𝐹𝑎𝑖𝑙𝑢𝑟𝑒 𝐿𝑖𝑘𝑒𝑙𝑖ℎ𝑜𝑜𝑑 = 4.50 ∗ 10−12 + 8.36 ∗ 10−13 ∗ 𝑂𝑤𝑛𝑠ℎ𝑖𝑝 𝑇𝐶𝐴𝑆 + 8.36 ∗ 10−13 ∗
𝐼𝑛𝑡𝑟𝑢𝑑𝑒𝑟 𝑇𝐶𝐴𝑆 − 4.50 ∗ 10−12 ∗ 𝐼𝑛𝑡𝑟𝑢𝑑𝑒𝑟 𝐴𝐷𝑆𝐵 − 8.90 ∗ 10−13 ∗ 𝑂𝑤𝑛𝑠ℎ𝑖𝑝 𝑇𝐶𝐴𝑆 ∗
𝐼𝑛𝑡𝑟𝑢𝑑𝑒𝑟 𝐴𝐷𝑆𝐵 − 8.90 ∗ 10−13 ∗ 𝐼𝑛𝑡𝑟𝑢𝑑𝑒𝑟 𝑇𝐶𝐴𝑆 ∗ 𝐼𝑛𝑡𝑟𝑢𝑑𝑒𝑟 𝐴𝐷𝑆𝐵
The normal plot of effects for the analysis is shown in Figure 6.1. The horizontal axis represents
the significance of the factor. Red blocks represent factors with significance. The blue line is the

60
zero effect line, so any point that falls closer to the blue line has less effect and those farther
away have more effect. The vertical axis represents the percentile of the cumulative probability
distribution. A larger percent specifies a greater probability of impacting the outcome of
experiment. For example, the effect of ownship TCAS is most likely to impact the outcome, but
does not have the largest effect. The negative effects are displayed on the left side, and positive
effects on right side of the zero effect line. A negative effect means the likelihood response is
reduced as the factors goes to a high level. Intruder ADS-B is negative, which means the total
likelihood is reduced when the intruder aircraft is ADS-B equipped and functional. While a
positive effect means the response is reduced when factor goes to a low level. So from the figure
it is revealed that likelihood is reduced when either the ownship or intruder TCAS is
unequipped/not functional. This can be seen from our data in Table 6.1. The magnitude of the
either TCAS effect are significantly less than the magnitude of the effect of intruder ADS-B.
ADS-B can be seen as the most dominant factor from the analysis.
50-5-10-15-20-25
99
95
90
80
70
60
50
40
30
20
10
5
1
Standardized Effect
Pe
rce
nt
A O wnship TC A S
B Intruder TC A S
C Intruder A DS-B
Factor Name
Not Significant
Significant
Effect Type
BC
AC
C
B
A
Figure 6.1. Normal Plot of standardized effects showing factors that had a
significant effect on likelihood. The horizontal axis represents the significance
of the factor and the vertical axis represents the percentile of the cumulative
probability distribution.

61
Figure 6.2 illustrates the quantitative effects of the three different factors and their interactions on
total likelihood. The red reference line is the quantile t-distribution; any values that extend
beyond this reference line are potentially significant. The bar showing the effect of Intruder
ADS-B is extended most beyond the reference line which depicts that it has the most significant
effect, and is approximately five times more than other effects. It is clear from both Figures 6.1
and 6.2 that an ADS-B equipped/functional intruder remarkably reduces the total likelihood of
failures, which would likely reduce the number of near mid-air collisions.
Figure 6.2. Pareto chart of standardized effects, a quantitative
representation of significant factors. The red line denotes
statistical significance.
The effect of one factor influenced by the level of other factors can be visualized from the
interaction plot. In our analysis, the interaction between ownship TCAS and Intruder ADS-B,
and the interaction between Intruder TCAS and Intruder ADS-B were statistically significant.
Figure 6.3 is the interaction plot between ownship/Intruder TCAS and Intruder ADS-B indicates
the change in mean likelihood. The red dashed line is for equipped/functional ADS-B and black
continuous line is for unequipped/not functional ADS-B.
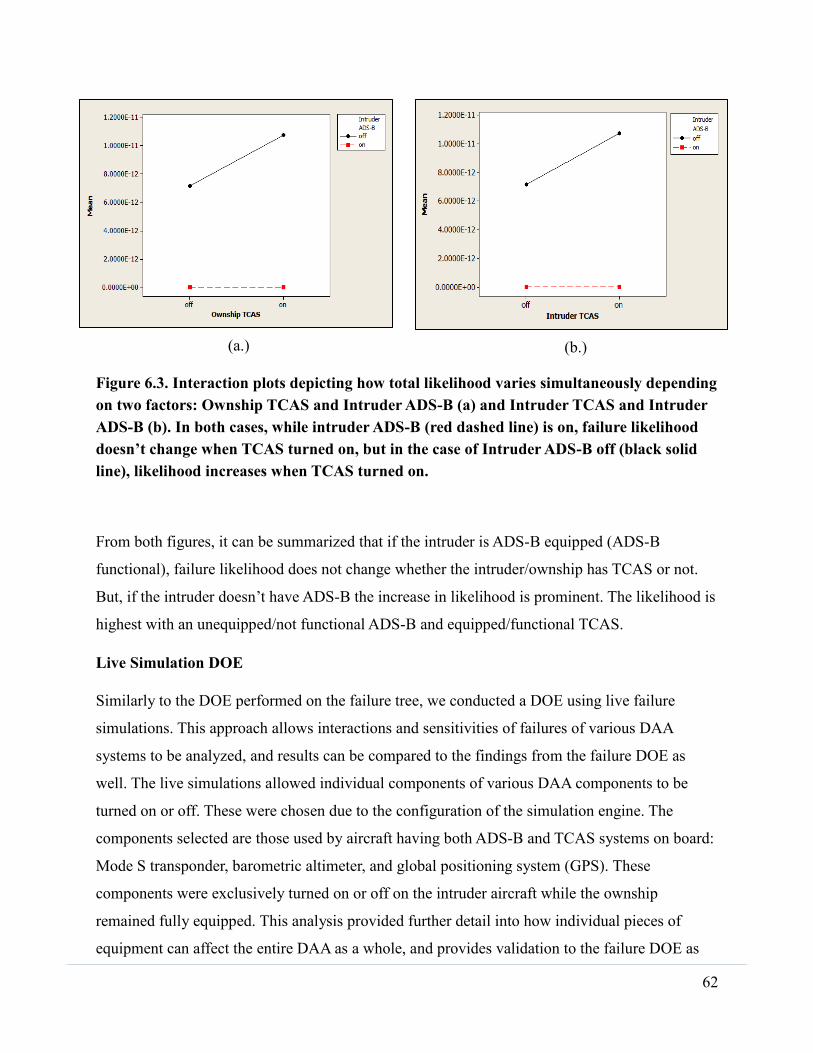
62
(a.)
(b.)
Figure 6.3. Interaction plots depicting how total likelihood varies simultaneously depending
on two factors: Ownship TCAS and Intruder ADS-B (a) and Intruder TCAS and Intruder
ADS-B (b). In both cases, while intruder ADS-B (red dashed line) is on, failure likelihood
doesn’t change when TCAS turned on, but in the case of Intruder ADS-B off (black solid
line), likelihood increases when TCAS turned on.
From both figures, it can be summarized that if the intruder is ADS-B equipped (ADS-B
functional), failure likelihood does not change whether the intruder/ownship has TCAS or not.
But, if the intruder doesn’t have ADS-B the increase in likelihood is prominent. The likelihood is
highest with an unequipped/not functional ADS-B and equipped/functional TCAS.
Live Simulation DOE
Similarly to the DOE performed on the failure tree, we conducted a DOE using live failure
simulations. This approach allows interactions and sensitivities of failures of various DAA
systems to be analyzed, and results can be compared to the findings from the failure DOE as
well. The live simulations allowed individual components of various DAA components to be
turned on or off. These were chosen due to the configuration of the simulation engine. The
components selected are those used by aircraft having both ADS-B and TCAS systems on board:
Mode S transponder, barometric altimeter, and global positioning system (GPS). These
components were exclusively turned on or off on the intruder aircraft while the ownship
remained fully equipped. This analysis provided further detail into how individual pieces of
equipment can affect the entire DAA as a whole, and provides validation to the failure DOE as
63
well. The simulation where these failures were tested was modeled after Scenario A.5.10
Intruder Maneuvers after DAA Maneuver Has Begun and Causes Change in the DAA Maneuver
outlined in SC-228 (2015).
A DOE two-level factorial design with three different factors resulted in eight different
runs/scenarios (6.2). The “on” indicates the component is working properly. The “off” represents
a total failure of the component(s) on the aircraft. The one primary difference from the failure
tree DOE is that each simulation was run twice, using two different licensed commercial pilots.
The pilots were asked to fly the same simulation, with various DAA systems turned on or off.
They had to make the best possible judgment with the information they had available to them.
The closest point of approach (CPA), listed in feet, was provided from the output of the
simulation engine. The first eight values listed under the CPA column are from Pilot 1 and
second 8 listed are from Pilot 2. As expected, the CPA varies by pilot and even on what
components were on or off. Anytime humans are introduced to a study, large variations are
possible but our inclusion of human pilots potentially provides a set of more realistic results.
Mode S appeared to have one of the largest impacts on the CPA (Table 6.2) because when it was
turned off, the scenarios produced some of the smallest CPAs from the simulations.
In order to provide a better analysis to assess both pilot’s reactions to the scenarios, a replicate
design was used. Replicate designs are used to analyze data if more than one trial was performed.
After the DOE analysis was performed, it was evident that Mode S had the largest significant
effect on CPA, followed by the effect of the pilot. The current study only evaluated the
performance of two pilots, resulting in large human factor and pilot preference influences.

64
Table 6.2. Summary of the eight analyzed Pilot 1 and Pilot 2 DOE scenarios. The left three
columns indicate which component was on or off (either from total failure or not having the
systems on the aircraft), and the far right column lists the closest point of approach
between the UAS and plane from the scenario.
Mode S GPS Altimeter CPA (ft)
off off on 951.9
Pilo
t 1
off on on 1213.2
off off off 1643.0
off on off 2879.0
on off on 4156.1
on on on 6254.0
on off off 11131.8
on on off 12799.3
off on off 1503.0
Pilo
t 2
on off off 1596.3
off off on 1812.2
off on on 1852.7
on off on 2033.6
off off off 2054.2
on on on 2061.1
on on off 2679.9
Just like the failure tree analysis DOE, an equation can be produced to interpolate between these
primary failures tested, and may be used to predict the effect of partial failures. Equation 2,
which is only valid for this set of data and considers the Mode S and the pilot contribution. The
coefficients were found from analysis of variance, with a p value of less than 0.05 for the
significant factors found. Each variable in the equation corresponds to the either the Mode S
effect or Pilot effect. Either the number 1 or 2 would be entered in to represent what Pilot flew
the simulation. However, a value between -1 and 1 could be entered to simulate a partial failure
of the Mode S system as was discussed in the previous DOE fault tree study.
Equation 2:
𝐶𝑃𝐴 = 3538.8 + 1800.2 ∗ 𝑀𝑜𝑑𝑒𝑆 + 1589.7 ∗ 𝑃𝑖𝑙𝑜𝑡
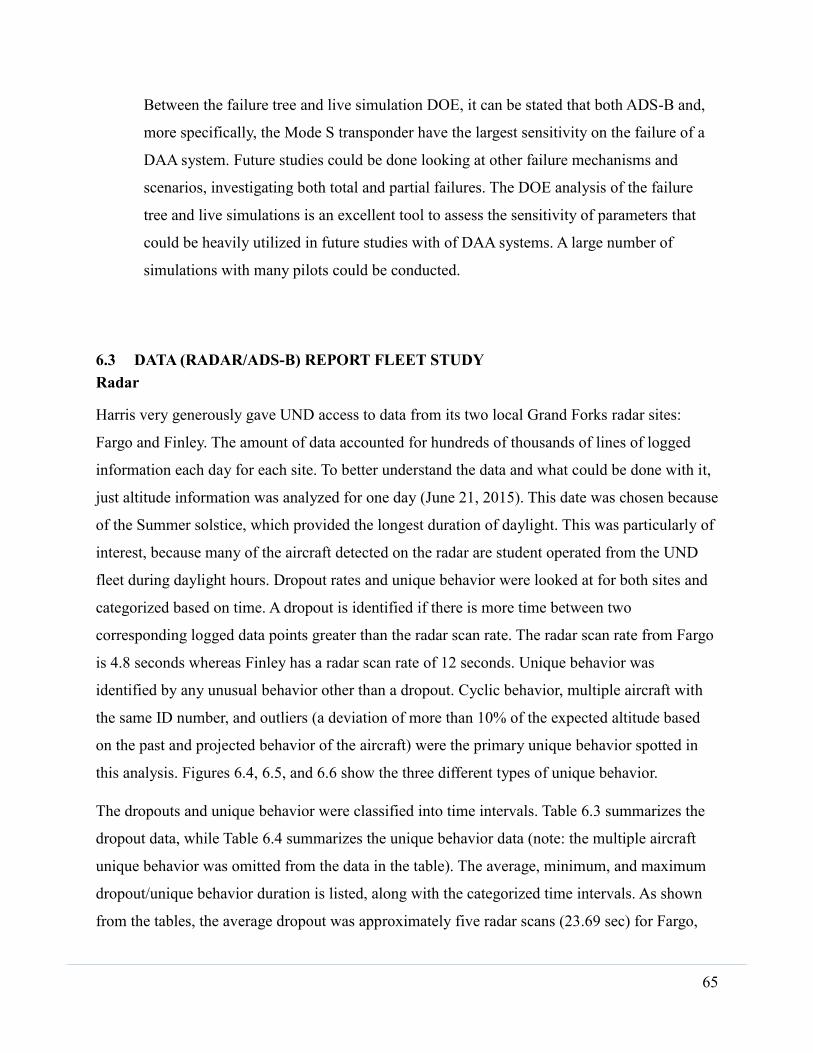
65
Between the failure tree and live simulation DOE, it can be stated that both ADS-B and,
more specifically, the Mode S transponder have the largest sensitivity on the failure of a
DAA system. Future studies could be done looking at other failure mechanisms and
scenarios, investigating both total and partial failures. The DOE analysis of the failure
tree and live simulations is an excellent tool to assess the sensitivity of parameters that
could be heavily utilized in future studies with of DAA systems. A large number of
simulations with many pilots could be conducted.
6.3 DATA (RADAR/ADS-B) REPORT FLEET STUDY
Radar
Harris very generously gave UND access to data from its two local Grand Forks radar sites:
Fargo and Finley. The amount of data accounted for hundreds of thousands of lines of logged
information each day for each site. To better understand the data and what could be done with it,
just altitude information was analyzed for one day (June 21, 2015). This date was chosen because
of the Summer solstice, which provided the longest duration of daylight. This was particularly of
interest, because many of the aircraft detected on the radar are student operated from the UND
fleet during daylight hours. Dropout rates and unique behavior were looked at for both sites and
categorized based on time. A dropout is identified if there is more time between two
corresponding logged data points greater than the radar scan rate. The radar scan rate from Fargo
is 4.8 seconds whereas Finley has a radar scan rate of 12 seconds. Unique behavior was
identified by any unusual behavior other than a dropout. Cyclic behavior, multiple aircraft with
the same ID number, and outliers (a deviation of more than 10% of the expected altitude based
on the past and projected behavior of the aircraft) were the primary unique behavior spotted in
this analysis. Figures 6.4, 6.5, and 6.6 show the three different types of unique behavior.
The dropouts and unique behavior were classified into time intervals. Table 6.3 summarizes the
dropout data, while Table 6.4 summarizes the unique behavior data (note: the multiple aircraft
unique behavior was omitted from the data in the table). The average, minimum, and maximum
dropout/unique behavior duration is listed, along with the categorized time intervals. As shown
from the tables, the average dropout was approximately five radar scans (23.69 sec) for Fargo,

66
and just under three radar scans (32.41 sec) for Finley. The unique behavior statistics were much
lower, with an average of about one radar scan (5.30 sec) for Fargo and approximately two radar
scans (23.52 sec) for Finley. Fargo had 67% of its dropouts and 98% of its unique behavior occur
for less than three radar scans. While Finley had 82% of its dropouts and 84% of its unique
behavior for less than three radar scans. However, there are some dropouts that occur for a
significant period of time, with some dropouts going for hundreds of seconds.
Figure 6.4. Altitude [ft] vs. time [sec from June 21, 2015 12:00a.m.] plot showing cyclical
unique behavior. Note the zoomed in view in the red box showing the altitude reading
jumping between two relative values.
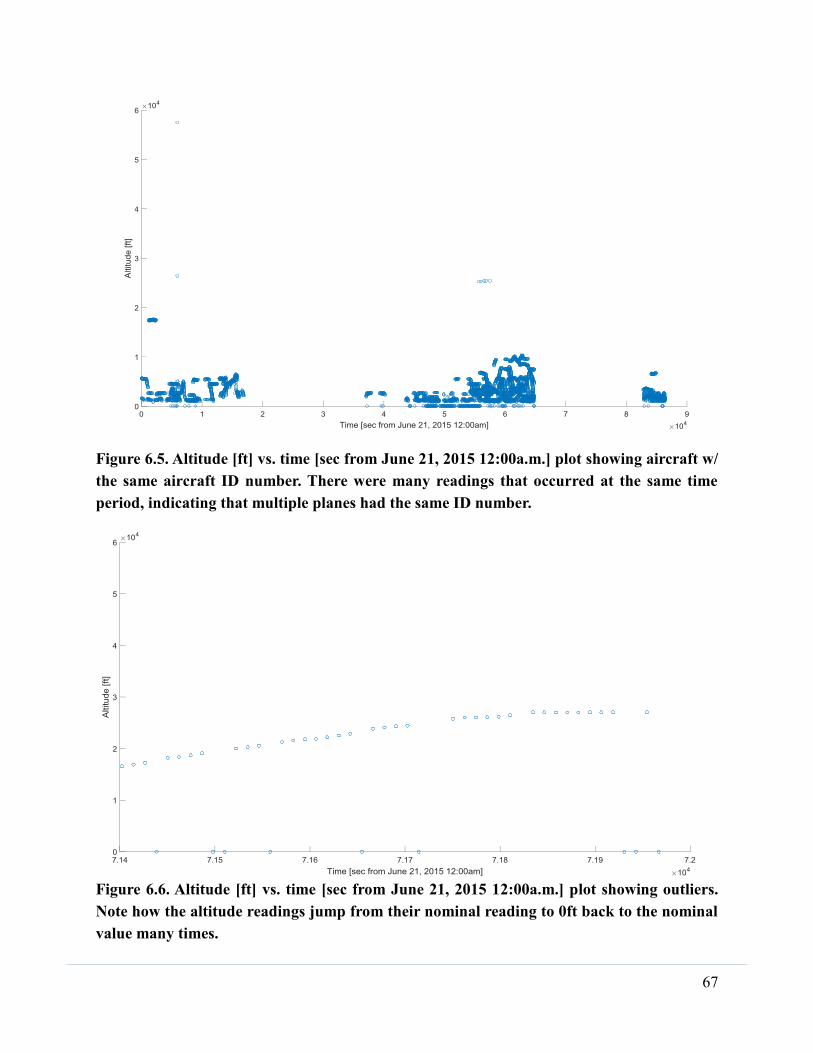
67
Figure 6.5. Altitude [ft] vs. time [sec from June 21, 2015 12:00a.m.] plot showing aircraft w/
the same aircraft ID number. There were many readings that occurred at the same time
period, indicating that multiple planes had the same ID number.
Figure 6.6. Altitude [ft] vs. time [sec from June 21, 2015 12:00a.m.] plot showing outliers.
Note how the altitude readings jump from their nominal reading to 0ft back to the nominal
value many times.

68
Table 6.3. Summary of dropout statistics for both the Fargo and Finley sites. The average,
minimum, and maximum dropout time is noted. The dropouts are also ranked by time
intervals, showing the number of dropouts for that time period and the percentage.
Fargo Finley Dropout Duration Dropout Duration
Average (sec) 23.69 Average (sec) 32.41
Minimum (sec) 9.00 Minimum (sec) 23.53
Maximum (sec) 265.46 Maximum (sec) 336.27
Categorized Data Categorized Data
Number of Dropouts 132 Number of Dropouts 352
Less than 10 sec 65 49% Less than 24 sec 146 41%
10 -15 sec 24 18% 24 -36 sec 143 41%
15 -20 sec 1 1% 36-48 sec 24 7%
20 -25 sec 5 4% 48 - 60 sec 9 3%
25 -30 sec 5 4% 60 -90 sec 19 5%
30 -60 sec 26 20% 90 -120 sec 9 3%
Greater than 60 sec 9 7% Greater than 120 sec 2 1%

69
Table 6.4. Summary of unique behavior for the Fargo and Finley sites. The average,
minimum, and maximum unique behavior time is noted. The unique behavior occurrences
are also ranked by time intervals, showing the number of unique behavior instances for
that time period and the percentage.
Fargo Finley Unique Behavior Unique Behavior
Average (sec) 5.31 Average (sec) 23.52
Minimum (sec) 4.66 Minimum (sec) 11.84
Maximum (sec) 19.24 Maximum (sec) 108.16
Categorized Data Categorized Data
Unique Behavior 52 Unique Behavior 25
Less than 10 sec 51 98% Less than 24 sec 19 76% 10 -15 sec 0 0% 24 -36 sec 2 8% 15 -20 sec 1 2% 36-48 sec 1 4% 20 -25 sec 0 0% 48 - 60 sec 1 4% 25 -30 sec 0 0% 60 -90 sec 0 0% 30 -60 sec 0 0% 90 -120 sec 2 8% Greater than 60 sec 0 0% Greater than 120 sec 0 0%
Time and location were investigated to see if either demonstrated an influence on dropouts or
unique behavior in system performance. Time did not appear to play a large role, however
location had a large effect. This can be seen by Figures 6.7 and 6.8, which shows the dropouts
and unique behavior, with the effective radar radius overlaid on top of the points. It can be seen
that a significant number of the dropouts and unique behavior occurred either in the approach
path to the airport (Fargo or Grand Forks) or near the effective radar radius.

70
(a.) (b.)
Figure 6.7. The Finley Radar Map showing the effective radar radius (blue circle) and the
location of each dropout or unique behavior (red dot): Dropouts (a.) and Unique Behavior
(b.).
(a.) (b.)
Figure 6.8. The Fargo Radar Map showing the effective radar radius (blue circle) and the
location of each dropout or unique behavior (red dot): Dropouts (a.) and Unique Behavior
(b.).
An overlapping study was also done to determine if the dropouts and unique behavior were radar
or transponder induced. Fargo’s radar radius fits entirely inside Finley’s, so theoretically, all of
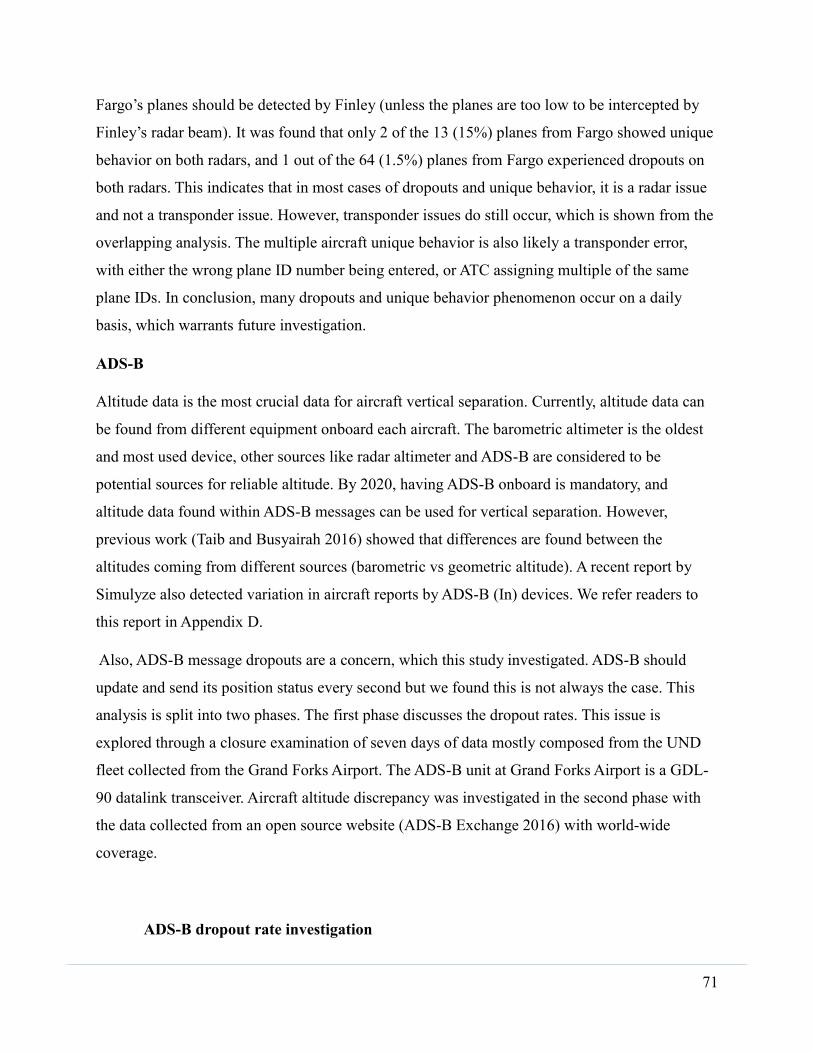
71
Fargo’s planes should be detected by Finley (unless the planes are too low to be intercepted by
Finley’s radar beam). It was found that only 2 of the 13 (15%) planes from Fargo showed unique
behavior on both radars, and 1 out of the 64 (1.5%) planes from Fargo experienced dropouts on
both radars. This indicates that in most cases of dropouts and unique behavior, it is a radar issue
and not a transponder issue. However, transponder issues do still occur, which is shown from the
overlapping analysis. The multiple aircraft unique behavior is also likely a transponder error,
with either the wrong plane ID number being entered, or ATC assigning multiple of the same
plane IDs. In conclusion, many dropouts and unique behavior phenomenon occur on a daily
basis, which warrants future investigation.
ADS-B
Altitude data is the most crucial data for aircraft vertical separation. Currently, altitude data can
be found from different equipment onboard each aircraft. The barometric altimeter is the oldest
and most used device, other sources like radar altimeter and ADS-B are considered to be
potential sources for reliable altitude. By 2020, having ADS-B onboard is mandatory, and
altitude data found within ADS-B messages can be used for vertical separation. However,
previous work (Taib and Busyairah 2016) showed that differences are found between the
altitudes coming from different sources (barometric vs geometric altitude). A recent report by
Simulyze also detected variation in aircraft reports by ADS-B (In) devices. We refer readers to
this report in Appendix D.
Also, ADS-B message dropouts are a concern, which this study investigated. ADS-B should
update and send its position status every second but we found this is not always the case. This
analysis is split into two phases. The first phase discusses the dropout rates. This issue is
explored through a closure examination of seven days of data mostly composed from the UND
fleet collected from the Grand Forks Airport. The ADS-B unit at Grand Forks Airport is a GDL-
90 datalink transceiver. Aircraft altitude discrepancy was investigated in the second phase with
the data collected from an open source website (ADS-B Exchange 2016) with world-wide
coverage.
ADS-B dropout rate investigation

72
ADS-B dropouts were analyzed utilizing the data of June 15th to June 21st (2015) from
Grand Forks Airport. The data were archived in a GDL-90 raw pass-through format and
parsed for interpretation. Dropout rates were counted as the number of times the data did
not indicate a one second update period. A total of 642 aircraft data were analyzed
including 534,736 data points/transmissions. Each data point contained the aircraft
position (latitude, longitude), altitude, aircraft status (Ground/Air) and a few other
messages. Dropouts occurred 35,063 times, but it should be noted that this number
(35,063) doesn’t represent time. In other words, the ADS-B message was lost for at least
1 second during transponding 35,063 times. The dropouts ranged from 2 seconds to over
5 minutes in some cases. Table 6.5 summarizes these results.
Table 6.5. Dropout statistics during 7 days (June 15th to June 21st, 2015). Dropouts are also
categorized by duration interval including occurrences and interval percentages.
Total data set Dropout % Dropout
534736 35063 6.6%
Categorized Data
Total 35063
Less Than 5 Secs 25066 71.5%
Between
5 secs-10 secs
512
1.5%
Between
10 secs-20 secs
313
0.9%
Between
20 secs-40 secs
92
0.3%
Between
40 secs-60 secs
163
0.3%
Between
60 secs-300 secs
3401 9.7%
Greater
300 secs
5469 15.6%
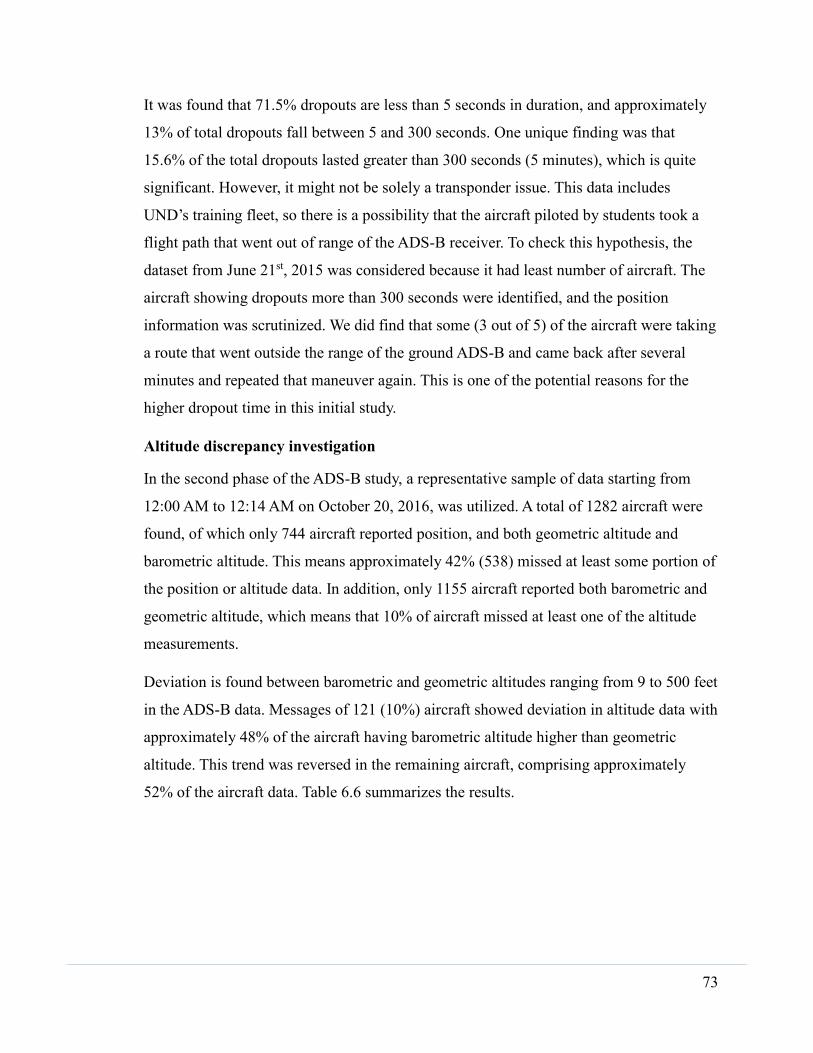
73
It was found that 71.5% dropouts are less than 5 seconds in duration, and approximately
13% of total dropouts fall between 5 and 300 seconds. One unique finding was that
15.6% of the total dropouts lasted greater than 300 seconds (5 minutes), which is quite
significant. However, it might not be solely a transponder issue. This data includes
UND’s training fleet, so there is a possibility that the aircraft piloted by students took a
flight path that went out of range of the ADS-B receiver. To check this hypothesis, the
dataset from June 21st, 2015 was considered because it had least number of aircraft. The
aircraft showing dropouts more than 300 seconds were identified, and the position
information was scrutinized. We did find that some (3 out of 5) of the aircraft were taking
a route that went outside the range of the ground ADS-B and came back after several
minutes and repeated that maneuver again. This is one of the potential reasons for the
higher dropout time in this initial study.
Altitude discrepancy investigation
In the second phase of the ADS-B study, a representative sample of data starting from
12:00 AM to 12:14 AM on October 20, 2016, was utilized. A total of 1282 aircraft were
found, of which only 744 aircraft reported position, and both geometric altitude and
barometric altitude. This means approximately 42% (538) missed at least some portion of
the position or altitude data. In addition, only 1155 aircraft reported both barometric and
geometric altitude, which means that 10% of aircraft missed at least one of the altitude
measurements.
Deviation is found between barometric and geometric altitudes ranging from 9 to 500 feet
in the ADS-B data. Messages of 121 (10%) aircraft showed deviation in altitude data with
approximately 48% of the aircraft having barometric altitude higher than geometric
altitude. This trend was reversed in the remaining aircraft, comprising approximately
52% of the aircraft data. Table 6.6 summarizes the results.

74
Table 6.6. Aircraft demonstrating different characteristics of altitude data from ADS-B
messaging
Behaviors
No. of Aircraft Percentage
Report Both Altitude 1155 --
No deviation found 1034 90%
Discrepancy found 121 10%
Out of 121 cases of
altitude discrepancy
Consistent Discrepancy 99 82%
Fluctuating Discrepancy 22 18%
Primary analysis revealed that the altitude discrepancy could be as high as 500 feet. Table 6.7
indicates that 28% of discrepancies fall above 200 feet which might increase the likelihood of
violation of the vertical separation threshold. A significant percentage of these cases could
produce the possibility of a near mid-air collision condition. The discrepancies are nearly
normally distributed above and below the actual altitude, so combinations where one is high and
the other low can lead to dramatic vertical separation errors.
Table 6.7. Aircraft altitude discrepancy ranges
Altitude Discrepancy
Range
Number of
Aircraft
Percentage (Out of 121 aircraft that
showed altitude discrepancy)
1 feet-50 feet 32 26%
51 feet- 100 feet 23 19%
101 feet-150 feet 16 13%
151 feet-200 feet 16 13%
201 feet-250 feet 17 14%
251 feet- 350 feet 11 9%
351 feet- 450 feet 04 3%
451 feet-500 feet 02 2%
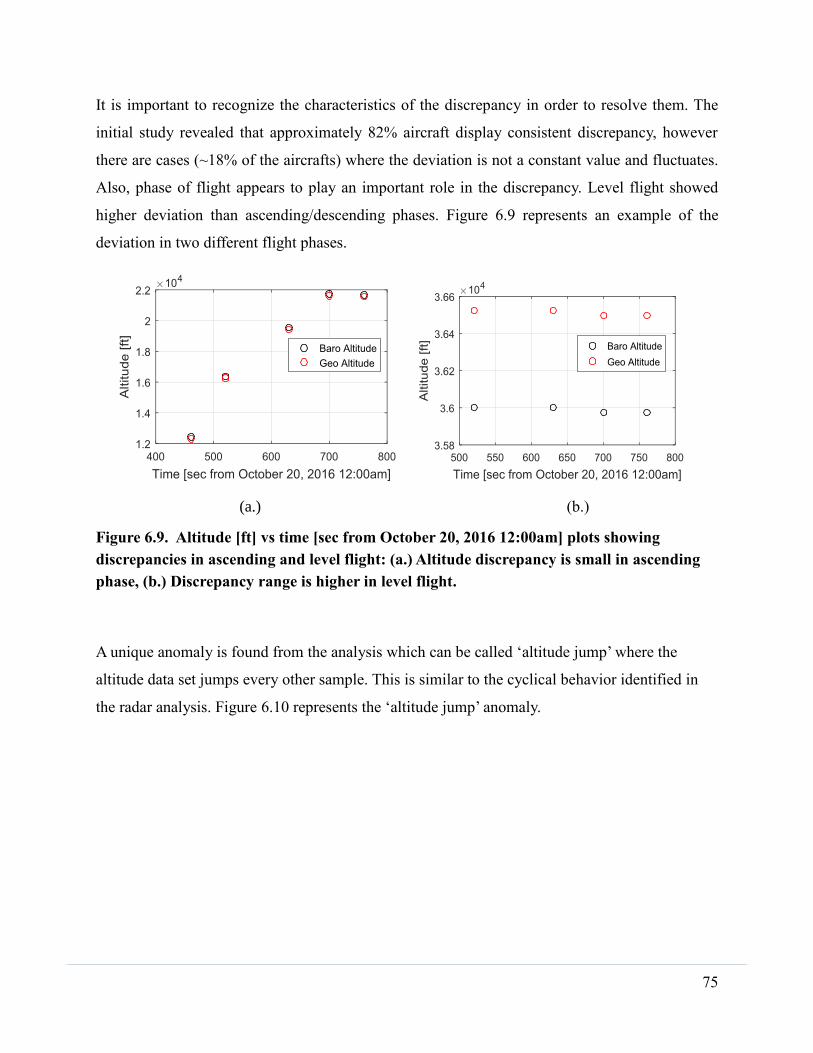
75
It is important to recognize the characteristics of the discrepancy in order to resolve them. The
initial study revealed that approximately 82% aircraft display consistent discrepancy, however
there are cases (~18% of the aircrafts) where the deviation is not a constant value and fluctuates.
Also, phase of flight appears to play an important role in the discrepancy. Level flight showed
higher deviation than ascending/descending phases. Figure 6.9 represents an example of the
deviation in two different flight phases.
(a.) (b.)
Figure 6.9. Altitude [ft] vs time [sec from October 20, 2016 12:00am] plots showing
discrepancies in ascending and level flight: (a.) Altitude discrepancy is small in ascending
phase, (b.) Discrepancy range is higher in level flight.
A unique anomaly is found from the analysis which can be called ‘altitude jump’ where the
altitude data set jumps every other sample. This is similar to the cyclical behavior identified in
the radar analysis. Figure 6.10 represents the ‘altitude jump’ anomaly.

76
Figure 6.10. Altitude [ft] vs Time [sec from October 20, 2016 12:00am] plot showing cyclic
change in both geometric and barometric altitude data
The analysis was done on a small sample of data; a more diverse and comprehensive study may
provide more insight on the anomalies found in this preliminary study and lead to solutions to
overcome these behaviors.
6.4 EO/IR PRELIMINARY STUDY
A very preliminary study was also done comparing optical and forward looking infrared (FLIR)
thermal camera images. The image in Figure 6.11 is of a UND aircraft that recently landed sitting
on the tarmac. Figure 6.12 shows three different varieties of images obtained with the FLIR
camera of the same aircraft. It can be seen the engine bay is warm by the brighter colors. It is
expected that an EO/thermal vision system could be a viable DAA system to be evaluated in the
future studies. The team has performed an initial study evaluating the performance characteristics
of these devices.

77
Figure 6.11. An optical image of a UND aircraft
on the tarmac at GFK international airport
Figure 6.12. Three different color schemes on the FLIR thermal camera showing the same
aircraft pictured in Figure KK. Note the bright area showing the warm engine in the front
of the plane. By using false color representations, select characteristics may be highlighted
with the thermal imagery.

78
7 Observations, Findings, and Conclusions
7.1 OBSERVATIONS
We chose and developed five analysis tools to help us to research our three primary research
questions regarding airborne surveillance criticality. The analysis tools included: Fault Trees,
Monte Carlo Simulations, Hazard Analysis, Design of Experiments (DOE), and Human-in-the-
Loop simulations. Potential DAA scenario failures were graphed through Fault Tree analysis and
subsequent Monte Carlo simulations quantified correlated Fault Tree uncertainties. Hazard
Analysis described failure impacts criticality against system performance. DOE created a
sensitivity analysis for understanding significant equipage and functionality combinations in
achieving separation. Our visualization scenarios allowed us to explore and validate analysis
outcomes using the same component characterizations, operational parameters, and scenario
designs. We present some of our significant observations below.
Fault Tree DOE
Fault Tree parameter criticality was evaluated using the DOE statistical factor analysis.
ownship TCAS, intruder TCAS, and intruder ADS-B and whether each system was
operational or not were the primary statistical factors resulting in eight possible
combinations. The DOE results therefore represent the probability of a total DAA system
failure. The DOE results indicate that the intruder ADS-B had five-times greater
influence on the level of safety than any other system or interaction between systems.
Ownship TCAS, intruder TCAS, the interaction of ownship TCAS and intruder ADS- B,
and the interaction of TCAS and intruder ADS-B were the only other factors of statistical
significance (assessed via Monte Carlo simulations). The total likelihood of failure was
10-12 or below when ADS-B was off and 10-14 when ADS-B was on. Interestingly, the
total likelihood of failure remained the same when either ownship TCAS or the intruder
TCAS were off and ADS-B was on. The total likelihood of failure of the entire DAA
system remained the same, regardless of whether the ownship or intruder had a working
avoidance algorithm, as long as one of the TCAS systems was still active. Another
interesting results was that having ownship TCAS, intruder TCAS, and intruder ADS-B
off at the same time did not result in the highest total likelihood of failure. Conversely,
having all three systems turned on did not result in the lowest total likelihood of failure.

79
An explanation for this result is that having all three systems creates additional failure
modes in the DAA system due to increased complexity of the system.
Hazard Analysis
We performed a rigorous hazard analysis on surveillance criticality equipage in all air
space classes. This resulted in analysis of ownship and intruder aircraft DAA interactions
for the combination of class A, B, and C airspace, and separately for class D, E (above
10,000 ft and also below), and G. Analysis in highly controlled airspace (A, B, and C)
were grouped together due to the similar ATC requirements and procedure, and included
two equipage classes. Class 2 represents a fully equipped aircraft with TCAS, ADS-B,
and radar whereas Class 1 had ADS-B, Mode S transponder, and radar. Three failure
scenarios resulted in a high-risk classification. In order of severity, these were
transponder failure, transmission of hazardous or misleading information, and loss of
ADS-B integrity. These results underscore the criticality of transponder functionality in
highly controlled airspace. The transponder in this situation serves as a single point
failure as it affects multiple other DAA systems.
Class D airspace introduces additional intruder equipage scenarios that are not available
in A, B, and C. The two new possibilities include intruder operation with only a Mode-S
transponder and being completely unequipped. In terms of ownship and intruder
interactions in class D airspace that were similarly equipped as those in A, B, and C
airspace, the critical failure component was the transponder. This further validates the
critical role of the transponder in aircraft interactions. Outside of the similar equipage
scenarios, ownship radar failure in class D airspace against an unequipped intruder
resulted in a unique high-risk incident. The role of radar in this scenario was akin to the
transponder as a single-point failure node for the entire DAA system. ATC
communications in class D provides an additional deconfliction service and could reduce
this risk where available.
Equipage criticality was assessed in class E airspace above 10,000 feet with the same
equipage cases as class A airspace. Transponder failure was again identified as the critical
component as in A, B, C, and D airspace. However, a combination of transponder system
and horizontal GPS failure were identified as a third highest risk case (following

80
transponder failure and transmission of hazardous or misleading information
malfunction).
Criticality was also analyzed in class E airspace below 10,000 ft following the similar
equipage classes used in class D airspace with intruder aircraft not having radar. In
contrast to the four previous airspace analyses resulting in only three high-risk cases, a
fourth high-risk failure case was identified with an unequipped intruder resulting from a
radar failure leading to a potential MAC. Therefore, in this class of airspace, four
elements were found to potentially result in a high-risk failure.
Class G DAA criticality analysis considered the same equipage classes and aircraft
scenarios as Class D and E below 10,000 ft. Class G presents a particularly challenging
environment as it is the least controlled and has no ATC interaction or communication
requirements. As with all other airspaces, failure of the transponder and transmission of
hazardous or misleading information are the most critical failure points for all equipage
classes except an unequipped intruder. Failure of the horizontal GPS data stream results
in a high-risk scenario within class 1 ownship and class 1 or 1a intruder scenarios.
Altimeter failure in class G leads to a high-risk event in both situations where the intruder
is Class 1a. The criticality of the altimeter is unique to class G airspace because ATC is
not available as a mitigation.
Live Simulation DOE
Live failure simulation data were used to create a DOE analysis for the closest point of
approach (CPA) between two approaching aircraft. Two different licensed pilots were
used to guide the simulated flights. The pilots were directed to fly the same missions but
with three DAA factors being switched on or off during each flight simulation so that all
component combinations could be considered. Analyzed components included Mode S
transponder, barometric altimeter, and GPS. These components were chosen as they are
used by aircraft that have both ADS-B and TCAS systems on board. We found that CPA
was not only impacted by component functionality, but also by pilot decision-making, not
surprisingly. We believe that these types of simulations that actively involve human
interaction may provide a more meaningful output than simulations that rely solely on
digital input. The smallest CPAs resulted when Mode-S was not functioning and
81
demonstrates the significance of this component among the three that were analyzed, a
result that was validated through a replicate design study.
Radar Live Data Analysis
We sought to further explore DAA criticality through examination of live radar and ADS-
B that were made available from two radar sites in proximity to the University of North
Dakota (UND). We examined hundreds of thousands of lines of code for these sites
representing one day of observations at each site. We tallied dropout rates and unique
behavior from the live data. We determined that when dropouts and unique behavior
occur, it is usually radar that appears to be the driver and not the transponder. We did find
that transponder functionality appeared to be responsible for some of the unique behavior
cases. However, the results suggest that dropouts and unique behavior occur every day.
This is concerning as the unique behavior included altitude readings that alternated by
hundreds of feet at successive scans and large discrepancies between altitude readings.
Further research should explore how pervasive and common these failures are over time
periods that go beyond a single day, and at other radar locations.
ADS-B Live Data Analysis
We examined ADS-B dropout rates over one week of data from an airport located near
UND, involving 642 aircraft and 534,736 data point transmissions. Data was lost 35,063
times (6.6% of all transmissions) for a least one second during transponding. In some
cases, dropouts lasted over five minutes but the vast majority of the dropouts (71.5%)
were less than five seconds. These dropouts may not all be attributable to transponder
failure as some of these dropouts were likely attributable to aircraft leaving the range of
the ground ADS-B and later returning.
To further examine ADS-B performance, we considered data from a world-wide database
of 1282 aircraft operating over a brief time span. Only 744 (58%) of these aircraft
reported position, geometric altitude, and barometric altitude. Only 1155 (90%) of these
aircraft had both barometric and geometric altitude. Among the aircraft that reported both
altitudes, elevation differences were present in 121 (10%). We found elevation variation
as high as 500 feet when we compared barometric and geometric altitudes.

82
Approximately 28% (34) of the aircraft had elevation differences in excess of 200 feet, a
level which could lead to a mid-air collision.
These two ADS-B studies raise concerns about ADS-B reliability and functionality.
Further study should examine whether the trends we observed are consistent over longer
time spans and larger aircraft fleets.
7.2 FINDINGS
Our conclusions are drawn from the analyses and results presented in the earlier sections of this
document. We present an overview of our conclusions as they relate to each of the research
objectives below.
1. For a cooperative DAA solution based on automatic dependent surveillance
broadcast (ADS-B) and/or transponders, how should the current operational or
technical performance requirements for ADS-B Out and/or transponders be
changed (if at all) for UAS DAA functions?
There are differences in how ADS-B and transponder technologies perform depending on
airspace within the NAS and equipage combinations. However, we believe that there are
inherent performance shortcomings for this technology application and that these
shortcomings represent high risk failures in all airspace and equipage scenarios. ADS-B
and TCAS systems are designed to a performance standard that is suitable in highly
controlled and regulated airspaces (A, B, and C) but can experience encounter problems
when ATC is reduced. Equipage requirements and the ATC procedures within these
airspaces lead to this outcome. Our analytical comparison of ADS-B and TCAS failures
revealed that ADS-B failures had the greatest impact on failure likelihood rates. We
analyzed live transmission data and found significant ADS-B messaging loss in fielded
technologies. Our recommendations for transponder and ADS-B design assurance level
improvements are intended to elevate the level of safety in UAS DAA systems.
Transponders need a more conservative failure characteristic in UAS DAA systems in
order to be safely applied according to our analysis results. ADS-B systems in UAS DAA
applications demonstrated acceptable risk levels in highly controlled airspace (A, B, and
83
C). ADS-B will also need to be designed to a greater assurance level for application in
lower airspace classes where VFR and non-cooperative traffic becomes possible.
2. Do current surveillance equipment technologies meet the design assurance
criteria to provide UAS DAA functions?
This is a challenging question as UAS DAA technologies are sometimes not only lacking
in assurance criteria explicitness but are also in a transitive state. However, the analytical
approaches and resulting evaluative products to assess the performance of UAS DAA
functions that are described earlier in this report are designed to assess such standards
when they become available. Our analytical approaches were also based on available
assurance criteria from FAA TSO documents for manned implementation of DAA
technologies. Our findings are mixed.
DAA functionality varies depending on airspace and equipage capabilities but doesn’t
currently offer a solution that is suitable for all airspace. We found evidence of significant
loss of DAA performance in all airspaces. ATC communications can provide a solution to
some failure scenarios when communications are possible, yet high risk scenarios in
current DAA equipages remain. The DAA evaluative tools that were created in our
research should be applicable to not only assessing any new DAA requirements or
changes to surveillance technology, but should also be relevant if greater levels of design
assurance become required for UAS DAA use. Our evaluative tools also have the ability
to address design assurance needs of future DAA technologies as they are incorporated
into UAS.
3. What are the criteria for evaluating “equivalent level of safety” of UAS against
piloted-aircraft for DAA functions?
We applied design assurance levels from piloted-aircraft technology in our analysis to
assess whether these criteria provided UAS the same situational safety scenarios as
piloted-aircraft. The piloted-aircraft standards allowed our UAS encounters to be
evaluated to the same specifications as manned aircraft to manned aircraft encounter
would be with one exception. The exception was that the UAS ownship has an air-to-air
radar in place of the pilot’s see and avoid ability. This difference is the most paramount

84
factor in low equipage and uncontrolled airspace comparisons but matters less in airspace
that has minimum equipment rules that provides ATC separation services to IFR aircraft
(UAS). All aircraft are operating as IFR and therefore the same as the UAS in Class A
airspace. Aircraft operating in class B, C, and E above 10,000 feet MSL do not have the
same requirements. VFR traffic in these airspaces will be separated by ATC and therefore
present a similar state between all aircraft. Class D airspace will have a less substantial
ATC presence but still imparts minimum service to IFR aircraft. Class E below 10,000
feet MSL and class G airspace are not subject to any such requirements, and become
dependent on the equivalence of manned aircraft see and avoid abilities to UAS air-to-air
radar. This state remains for the current UAS equipage options. When other visual
acquisition technologies become available to UAS DAA systems, our analytical
approaches and resulting evaluative products can be applied for their assessment.
7.3 MITIGATION RECOMMENDATIONS
We provide mitigation recommendations as they relate to each of the primary research questions
we considered. Our recommendations draw from the analyses and results presented earlier in this
report.
1. For a cooperative DAA solution based on automatic dependent surveillance
broadcast (ADS-B) and/or transponders, how should the current operational or
technical performance requirements for ADS-B Out and/or transponders be
changed (if at all) for UAS DAA functions?
Mitigation: We found that ADS-B systems in UAS DAA applications demonstrated
acceptable risk levels in our analysis of highly controlled airspace (A, B, and C) so no
mitigation is recommended for UAS operation within these airspaces. In less controlled
airspace and when ATC is lacking, we recommend that performance requirements for
ADS-B and transponders be elevated as they currently act as a single-point failure source.
Redundant transponder systems, which separate the Mode-S and ADS-B functions, could
also reduce the failure likelihood. We also recommend further investigation to understand
85
the source of the multiple ADS-B dropouts we observed when analyzing live
transmission data.
2. Do current surveillance equipment technologies meet the design assurance criteria
to provide UAS DAA functions?
Mitigation: We determined that while current surveillance equipment provides acceptable
DAA functionality in certain airspace and equipage combinations, transponder failures
can halt DAA operations in all airspaces. We recommend that elevated design criteria be
considered for transponders such that failure rates are minimized. We also recommend
that as new surveillance technologies become available, that they be evaluated for design
criteria using a UAS-centric approach. We have proposed such a system with our research
methods and demonstrated its application with our results and findings.
3. What are the criteria for evaluating “equivalent level of safety” of UAS against
piloted-aircraft for DAA functions?
Mitigation: We observed that the primary difference in evaluating DAA equivalent level
of safety factors between UAS and piloted aircraft was UAS ownship having to rely upon
radar rather than a pilot’s see and avoid capacity. We recommend that the capacity of
radar as a DAA tool for UAS be further investigated for its limitations in comparison to
see and avoid, and the limitations involved in installing and operating radar on a small
UAS. Namely, the MOPS for radar operations do not allow for a direct comparison of
failure probabilities compared to other DAA technologies. We expect that as these
systems are fielded, more data on their reliability will be available. Our current analysis
framework can be rapidly updated to include this new information. We further
recommend that other DAA sensor technologies that might be more affordable and
applicable to a broader range of UAS, including small UAS, be investigated. If other
DAA sensors can provide sufficient surveillance capacity, their adoption should be
considered, if for nothing else to serve as another DAA system component redundancy.
Potential sensors include EO, LiDAR, and thermal infrared.
86
8 Follow on Work
Overview
The primary outcome of this project was the development of a tool to analyze DAA equipage
performance in UAS integration scenarios. This product provides the capability to update, add,
or eliminate systems as the equipage requirements change based on the current regulations and
technology advancements for airborne traffic surveillance. Passive DAA systems such as EO/IR
or LiDAR could be incorporated into both the failure tree and live simulations. Following the
addition of those systems, a DOE would be done on the results to further understand the
interactions and sensitivities of the various systems. There are many possibilities of various DAA
systems that will need to be analyzed and evaluated. These possibilities include live testing of
small UAS to determine their capacity for radar and other DAA-related sensors. In addition, 4-
Dimensional Trajectory (4DT) Based Operations (TBO) are a key component within the
NextGen concept for Performance Based Navigation. 4DT concepts are particularly valuable for
operating within constrained airspaces but have not yet been fully adopted for UAS.
Radar and ADS-B data
In addition to the DOE, further studies should be done on the radar and ADS-B data.
Initially a larger dataset covering the spans of a week or more could be investigated.
Climate and environmental conditions may also play a significant factor on the
performance of these technologies. By obtaining data from different times of year and
correlating that data to different weather conditions, a better understanding of the impact
of climate and environmental conditions could be understood. Our current radar/ADS-B
study focused on altitude data. Future studies could expand this to a positional analysis as
well. Following a complete analysis of the altitude and position data, an overlapping
study could be performed on between radar and ADS-B to identify discrepancies between
the respective systems. Also, ADS-B data from a ground station could be compared with
onboard GPS data to research whether there is any discrepancy or mismatch. UND has
large data sets from both radar and ADS-B archives. This includes a large fleet of
equipped aircraft that UND owns and operates along with access to detailed installation,
maintenance, and calibration records. Industry partners are also prepared to share ADS-B

87
report data for evaluating reliability and functionality in multiple airspaces and equipage
scenarios. There is significant interest in validating ADS-B performance capabilities as
BVLOS operations are explored for certain applications.
The brief comparison of optical and forward looking infrared (FLIR) thermal camera
images showed their ability as a potential DAA system. Preliminary results indicated that
FLIR wavelengths and their sensitivity to emitted radiation may provide the ability to
identify aircraft with active engines or recently active engines. This relatively low-cost
remote sensing capability could potentially offer a less costly and intricate approach to
DAA technology. Future work could continue to investigate the feasibility of FLIR
cameras and how they could be incorporated into a DAA system with existing
technologies such as ADS-B, TCAS, or radar. In addition, FLIR cameras and/or LiDAR
systems could be compared to optical cameras on their ability to detect objects in various
climate conditions, such as foggy, cloudy, sunny, or low light scenarios.
The results from this future study could influence regulations and design assurance
requirements for UAS. Understanding the sensitivities and interactions of various DAA
systems is crucial for producing proper requirements and regulations. In addition,
understanding and being able to detect and possibly correct issues in systems such as
ADS-B and radar is vital for maintaining a well-functioning DAA system.
Live UAS DAA Testing
One aspect of integrating UAS into the NAS is that the presence of UAS in the air is
likely to be greater than that of manned aircraft in the future, particularly in uncontrolled
airspace. The ability of UAS in uncontrolled airspace to apply DAA technology for
avoiding conflict will be essential for safe integration and the expected increase in UAS
density. One of the most popular small UAS platforms for professional photogrammetry
and other remote sensing applications is the DJI Phantom 4. The Phantom 4 employs
both EO and sonar sensors for obstacle DAA. The EO and sonar sensors work in
combination with the onboard GPS, barometer, and IMU to sense and avoid objects on
the horizontal and vertical planes. EO images are managed on board through a vision
processing unit (VPU) to discern approaching objects. When objects are sensed to be

88
within a certain threshold of the aircraft based on processed VPU output, the autopilot
directs the Phantom 4 to divert away from the object. Given the current and expected
increase in the future prevalence of the Phantom 4 and subsequent Phantom models in the
NAS, live testing of the DAA capabilities could be helpful in mitigating both current and
expected increasing future integration. These live scenarios would involve multiple
Phantom 4 aircraft operating in proximity of one another. Testing would involve a set of
repeatable scenarios that would involve remote pilots being directed along a flight path
that involves potential airspace conflict with each other. The closest point of approach
(CPA) resulting from aircraft interactions would be used to provide a hazard assessment.
The diverted flight path vectors and their spatial deviation from pilot directed paths could
be measured to quantify potential impact and hazards on surrounding airspace. Results
from piloted UAS simulations involving airspace conflict could be augmented by
autonomously flown mission scenarios. Autonomous missions could be created that result
in conflict between multiple Phantoms 4s. The autonomous results could be contrasted to
those from the remotely piloted scenarios to determine whether either scenario results in
increased hazards or risks.
These same scenarios could be applied to a single Phantom being operated with respect to
objects on-the-ground, such as vehicles or structures. These on-the-ground testing
scenarios would help discern what potential hazards exist for the public when UAS
operations occur in near proximate areas.
This proposed DAA research addresses two interests. The first is the identification of
potential hazards between two or more commonly flown small UAS operating in close
proximity. The second builds upon research suggested above for investigating lower-cost
DAA solutions for UAS. Given that the vast majority of current UAS operations in the
NAS are limited to line-of-site and visibility thresholds, EO DAA systems may have
promise in NAS to enable UAS integration.
4-Dimensional Trajectory Based Operations
4-Dimensional Trajectory Based Operations is a key feature of the NextGen program (the
technology pillar of the National Airspace (NAS) Air Traffic Management (ATM)
89
modernization program) requiring improvements to both the aircraft avionics and the
ATM automation systems. A 4-Dimensional Trajectory (4DT) is defined as “a precise
description of an aircraft path in space and time” in other words a trajectory computed by
the automation (ground and/or flight deck) that defines the flight path of an aircraft from
one point (position) to another in four dimensions (latitude, longitude, altitude, and time).
The 4DT covers both surface and airborne operations (gate-to-gate).
4DT concepts have not yet been fully adopted for UAS and the associated automation
technologies needed for UAS Air Traffic Control (ATC). There have been significant
advancements in applying 4DT technologies and operations to commercial aviation that
can be reused and adopted for UAS.
A future work extension of this research project could include research and adoption of
the concepts of 4DT information communication between the ground ATC and UAS
aircraft utilizing the Aeronautical Telecommunication Network (ATN) or Future Air
Navigation System (FANS) data link system, supporting ground and air automations.
UAS traffic automation will need to be integrated with the NAS automation systems,
therefore, the capabilities to support performance-based navigation and flight object
exchange are essential in this transition. Methods of implementing routes and flight paths
rely on aircraft meeting a Required Navigation Performance (RNP) specification and
being equipped with a monitoring and alerting capability to alert when the aircraft system
is unable to meet the performance specification required for the operation. Many 4DT
procedure implementations require precise aircraft navigation conformance relative to a
moving reference such as another aircraft, to form aggregate flows or a weather cell to
allow flows to shift. Therefore, Dynamic-RNP (D-RNP) is an efficient and practical
solution for UAS traffic management, enabling TBO in constraint airspace such as
around airports, no fly zones, aggregated flow, or curved path time of arrival control.

90
9 References
ADS-B Exchange. Retrieved October 20, 2016, from https://www.adsbexchange.com/
Box, G. E., Hunter, W. G., & Hunter, J. S. (1978). Statistics for experimenters: An introduction to
design, data analysis, and model building. New York: Wiley.
Box, G. E., & Draper, N. R. (1987). Empirical model-building and response surfaces. New York:
Wiley.
Dieter, G. (1991). Engineering Design. McGraw Hill.
Lawson, J., & Erjavec, J. (2000). Modern statistics for engineering and quality improvement.
Duxbury Press.
SC-228. (2015, November 24). Detect and Avoid (DAA) Minimum Operational Performance
Standards (MOPS) for Verification and Validation. Washington, DC: RTCA Inc.
Taib, Nur A., and Busyairah S. Ali. (2016, Jan 25-28). An Analysis of Geometric Altitude Data in
ADS-B Messages. Proc. of ION ITM 2016. Monterey, California.

91
10 Appendices
10.1 APPENDIX A. DATA SOURCE ANALYSIS SUMMARY
Regulations for reporting systems
In the NAS (and airspace worldwide), it is imperative that devices that inform the flight crew as
well as advise ground based air traffic controllers or other aircraft of altitude and position be
accurate. Part 121 aircraft (air carrier) and Part 135 aircraft (aircraft for hire) specify the details
and regularity of altitude and transponder inspections in their approved maintenance programs.
Aircraft that operate under Reduced Vertical Separation Minimum (RVSM) rules must have
altitude and position reporting equipment inspected to higher standards, as they operate with
1000-ft vertical separation in the flight-levels as opposed to the 2000-ft separations used by
lower aircraft. Part 91 aircraft (small, non-commercial) must perform regular altimeter and
transponder inspections every two years. The US Federal Aviation Regulation (FAR) 91.411
addresses the certification of barometric altimeter systems, and FAR 91.413 is concerned with
guaranteeing that the transponder system operates within specifications.
Part 121 and Part 135 aircraft, including RVSM certified aircraft, are very often required to be
equipped with a Traffic Collision Avoidance System (TCAS) to reduce the incidence of mid-air
collisions between aircraft. TCAS is required for all aircraft with a maximum take-off weight
(MTOW) over 12,600 lb, or authorized to carry more than 19 passengers. TCAS queries and
monitors the nearby airspace for other aircraft independent of air traffic control. TCAS is based
on secondary surveillance radar (SSR) transponder signals, and operates independently of
ground-based radar systems to advise the pilot on aircraft that pose a collision hazard. In the
event of two TCAS-equipped aircraft entering a conflict situation, the TCAS systems on the
aircraft will coordinate to determine the appropriate action for each aircraft to de-escalate the
conflict situation.
TCAS operates via the aircraft transponder. TCAS-equipped aircraft interrogate, several times
per second, via the 1030MHz transponder frequency all aircraft in the vicinity of their position.
The vicinity around the TCAS-equipped aircraft is speed, altitude, and heading variable. All
nearby aircraft then reply to the transponder interrogations on 1090 MHz. Using the transponder
92
returns, the TCAS constructs a map of all responding aircraft in the area. Information determined
include:
range based on signal round-trip propagation time,
bearing based on the TCAS system’s directional antenna, and
altitude as reported by the interrogated aircraft’s transponder via mode C or mode S.
Using this information, the TCAS system can determine whether any other aircraft pose a threat
to the TCAS-equipped aircraft, will any other aircraft pose a future threat to the TCAS-equipped
aircraft anticipated future values, and what actions should be taken to remove that threat. So as to
avoid TCAS alerts and advisories regarding an intruding aircraft near the TCAS-equipped
aircraft’s position, but at a dramatically different altitude (e.g. many thousands of feet above or
below), the responding aircraft’s transponder reported altitude is of vital importance for TCAS
operation. Reported transponder altitude is typically derived from air-data computer, encoding
altimeter, or a blind encoder.
As stated above, Part 121 and 135 aircraft have transponder and altitude inspections enshrined in
their approved maintenance plans. Furthermore, these aircraft are often TCAS-equipped and
certified for RVSM operations, and have location and altitude inspections are exacting and
conducted often. These stringent requirements are derived from the fact that the location and
altitude information due to the RVSM proximities and TCAS reliance on accurate altitude for
TCAS conflict resolution. These larger, more-capable aircraft are also monitored via automated
methods in the NAS as to ensure continued accuracy in their reported location and altitude..
Smaller aircraft under Part 91 are numerous and typically operate below the flight-levels and at
much lower speeds. The equipment performance standards and inspections for these aircraft are
enumerated in FAR 91.411 and FAR 91.413. This report will look at each of these regulations in
turn, and inspect their impact on collision detection and avoidance.
93
Transponders: Requirements and Inspections – FAR 91.413
Modern aircraft transponders operate in one of three modes:
Mode A. Sometimes referred to as mode 3/A. Civil Mode A is identical to military Mode
3. Mode A responds to an ATC interrogation signal with the transponder code set by the
pilot.
Mode C. Refers to aircraft equipped with an altitude encoder and altimeter. With Mode C,
ATC will actually see the flight level altitude on their radar screen if the transponder is
operating in the Mode C or "ALT" (altitude) Mode.
Mode S. Mode S is a possible platform for a variety of other applications, such as Traffic
Information Service (TIS), Graphic Weather Service, and Automatic Dependent
Surveillance-Broadcast (ADS-B). Under ADS-B, each aircraft periodically broadcasts its
identification, position, and altitude. Overall, Mode S provides improved surveillance
quality, discrete aircraft addressing function, and digital capability. Mode S is not
required for general aviation aircraft.
The application of 91.413 would therefore apply to (i) aircraft operations airspaces where
transponder use is required, and (ii) aircraft operations in an airframe in which the transponder is
listed among the “minimum equipment list” (MEL).
According to the AIM, Section 4-1-19: In all cases, while in controlled airspace, each pilot
operating an aircraft equipped with an operable ATC transponder maintained in accordance with
14 CFR section 91.413 shall operate the transponder, including Mode C if installed, on the
appropriate code or as assigned by ATC. Specific transponder operating requirements are spelled
out in FAR 91.215:
91.215 ATC transponder and altitude reporting equipment and use.
(a) All airspace: U.S.-registered civil aircraft. For operations not conducted under part 121 or
135 of this chapter, ATC transponder equipment installed must meet the performance and
environmental requirements of any class of TSO-C74b (Mode A) or any class of TSO-C74c
(Mode A with altitude reporting capability) as appropriate, or the appropriate class of TSO-C112
(Mode S).
94
(b) All airspace. Unless otherwise authorized or directed by ATC, no person may operate an
aircraft in the airspace described in paragraphs (b)(1) through (b)(5) of this section, unless that
aircraft is equipped with an operable coded radar beacon transponder having either Mode 3/A
4096 code capability, replying to Mode 3/A interrogations with the code specified by ATC, or a
Mode S capability, replying to Mode 3/A interrogations with the code specified by ATC and
intermode and Mode S interrogations in accordance with the applicable provisions specified in
TSO C-112, and that aircraft is equipped with automatic pressure altitude reporting equipment
having a Mode C capability that automatically replies to Mode C interrogations by transmitting
pressure altitude information in 100-foot increments. This requirement applies -
(1) All aircraft. In Class A, Class B, and Class C airspace areas;
(2) All aircraft. In all airspace within 30 nautical miles of an airport listed in appendix D,
section 1 of this part from the surface upward to 10,000 feet MSL;
(3) Notwithstanding paragraph (b)(2) of this section, any aircraft which was not originally
certificated with an engine-driven electrical system or which has not subsequently been certified
with such a system installed, balloon or glider may conduct operations in the airspace within 30
nautical miles of an airport listed in appendix D, section 1 of this part provided such operations
are conducted -
(i) Outside any Class A, Class B, or Class C airspace area; and
(ii) Below the altitude of the ceiling of a Class B or Class C airspace area designated for an
airport or 10,000 feet MSL, whichever is lower; and
(4) All aircraft in all airspace above the ceiling and within the lateral boundaries of a Class B or
Class C airspace area designated for an airport upward to 10,000 feet MSL; and
(5) All aircraft except any aircraft which was not originally certificated with an engine-driven
electrical system or which has not subsequently been certified with such a system installed,
balloon, or glider -
(i) In all airspace of the 48 contiguous states and the District of Columbia at and above 10,000
feet MSL, excluding the airspace at and below 2,500 feet above the surface; and
(ii) In the airspace from the surface to 10,000 feet MSL within a 10-nautical-mile radius of any
airport listed in appendix D, section 2 of this part, excluding the airspace below 1,200 feet
outside of the lateral boundaries of the surface area of the airspace designated for that airport.
(c) Transponder-on operation. While in the airspace as specified in paragraph (b) of this section
or in all controlled airspace, each person operating an aircraft equipped with an operable ATC
transponder maintained in accordance with § 91.413 of this part shall operate the transponder,

95
including Mode C equipment if installed, and shall reply on the appropriate code or as assigned
by ATC.
(d) ATC authorized deviations. Requests for ATC authorized deviations must be made to the ATC
facility having jurisdiction over the concerned airspace within the time periods specified as
follows:
(1) For operation of an aircraft with an operating transponder but without operating automatic
pressure altitude reporting equipment having a Mode C capability, the request may be made at
any time.
(2) For operation of an aircraft with an inoperative transponder to the airport of ultimate
destination, including any intermediate stops, or to proceed to a place where suitable repairs can
be made or both, the request may be made at any time.
(3) For operation of an aircraft that is not equipped with a transponder, the request must be
made at least one hour before the proposed operation.
(Approved by the Office of Management and Budget under control number 2120-0005)
[Doc. No. 18334, 54 FR 34304, Aug. 18, 1989, as amended by Amdt. 91-221, 56 FR 469, Jan. 4,
1991; Amdt. 91-227, 56 FR 65660, Dec. 17, 1991; Amdt. 91-227, 7 FR 328, Jan. 3, 1992; Amdt.
91-229, 57 FR 34618, Aug. 5, 1992; Amdt. 91-267, 66 FR 21066, Apr. 27, 2001]
In summary, the following areas require the operation of a Mode C transponder:
Operations within Class A, Class B, and Class C airspace.
Operations within 30 nautical miles of the primary airport within Class B airspace from
the surface to 10,000 feet MSL (NOTE: There are approximately 35 Class B airports
listed in the AIM with an associated “Mode C veil”)
Operations above the ceiling and within the lateral boundaries of Class B and C airspace.
Operations above 10,000 feet MSL in the contiguous 48 states, excluding the airspace at
and below 2,500 feet AGL.
The AIM states in Section 4-1-19(a)(3) that for airborne operations in Class G airspace,
the transponder should be operating unless otherwise requested by ATC.
Notice that FAR 91.215(d) details the method by which an aircraft without a transponder can
request permission and operate within airspaces which require transponders for all aircraft
operations.

96
Furthermore, FAR 99.13 concerns security control of air traffic, and contains requirements for
when aircraft containing transponders must use their transponders in flights into or out of the US
airspace or operate in a specified Air Defense Identification Zone (ADIZ). An ADIZ is an area
surrounding much of North America – namely airspace surrounding the United States and
Canada – in which the ready identification, location, and control of civil aircraft over land or
water is required in the interest of national security. The transponder requirements in FAR 99.13
state:
FAR 99.13 Transponder-on requirements.
(a) Aircraft transponder-on operation. Each person operating an aircraft into or out of the
United States into, within, or across an ADIZ designated in subpart B of this part, if that aircraft
is equipped with an operable radar beacon transponder, shall operate the transponder, including
altitude encoding equipment if installed, and shall reply on the appropriate code or as assigned
by ATC.
(b) ATC transponder equipment and use. Effective September 7, 1990, unless otherwise
authorized by ATC, no person may operate a civil aircraft into or out of the United States into,
within, or across the contiguous U.S. ADIZ designated in subpart B of this part unless that
aircraft is equipped with a coded radar beacon transponder.
(c) ATC transponder and altitude reporting equipment and use. Effective December 30, 1990,
unless otherwise authorized by ATC, no person may operate a civil aircraft into or out of the
United States into, within, or across the contiguous U.S. ADIZ unless that aircraft is equipped
with a coded radar beacon transponder and automatic pressure altitude reporting equipment
having altitude reporting capability that automatically replies to interrogations by transmitting
pressure altitude information in 100-foot increments.
(d) Paragraphs (b) and (c) of this section do not apply to the operation of an aircraft which was
not originally certificated with an engine-driven electrical system and which has not
subsequently been certified with such a system installed, a balloon, or a glider.
[Doc. No. 24903, 55 FR 8395, Mar. 7, 1990. Redesignated at 69 FR 16756, Mar. 30, 2004]
The required inspections for transponder performance in Part 91 aircraft are spelled out in FAR
91.413. The transponder tests may be conducted using a test bench or a portable test set.
Transponder systems transmit on a frequency of 1090 MHz, the transponder is checked to verify
that the transponder response frequency is within an acceptable limit, which allows a variation
up 3 MHz, depending on the type and mode of transponder used, around 1090 MHz. The

97
transponder system must reply to more than 90% of interrogations. Transponder transmitter
power output is also verified to be within prescribed limits. The transponder reported altitude
(Mode C) data is verified to be within specification. Mode S transponders, common in TCAS-
equipped and ADSB-out-equipped aircraft, are further tested.
Specifically, the requirements in FAR 91.413 are:
91.413 ATC transponder tests and inspections
(a) No persons may use an ATC transponder that is specified in 91.215(a), 121.345(c), or Sec.
135.143(c) of this chapter unless, within the preceding 24 calendar months, the ATC transponder
has been tested and inspected and found to comply with appendix F of part 43 of this chapter;
and
(b) Following any installation or maintenance on an ATC transponder where data
correspondence error could be introduced, the integrated system has been tested, inspected, and
found to comply with paragraph (c), appendix E, of part 43 of this chapter.
(c) The tests and inspections specified in this section must be conducted by--
(1) A certificated repair station properly equipped to perform those functions and holding--
(i) A radio rating, Class III;
(ii) A limited radio rating appropriate to the make and model transponder to be tested;
(iii) A limited rating appropriate to the test to be performed;
[(iv) deleted]
(2) A holder of a continuous airworthiness maintenance program as provided in part 121 or Sec.
135.411(a)(2) of this chapter; or
(3) The manufacturer of the aircraft on which the transponder to be tested is installed, if the
transponder was installed by that manufacturer.
Amdt. 91-269, Eff. 1/31/2004
The Appendix B of Part 43 referenced in this FAR is given in the appendix for the reader’s
convenience.
FAR 91.413 specifies that not only is transponder testing required every two years, but also when
there is a chance of correspondence error. This could be a result of component replacement such
as an encoding altimeter or air data computer.
98
A key point to recognize in FAR 91.413 is that all aircraft using transponders should be inspected
every two years. This inspection requirement applies to aircraft under VFR and IFR. The only
aircraft exempt from this requirement would be those called out in FAR 91.215.b.5 -- aircraft
which were not originally certificated with an engine-driven electrical system or which has not
subsequently been certified with such a system installed, to include balloons and gliders.
Altitude Reporting Equipment: Requirements and Inspections
FAR 91.205 provides guidance for the instrument and equipment requirements for powered civil
aircraft with standard category in the US. Included in the list for both VFR, VFR night, and IFR
flight is an altimeter. (Specifically, FAR 91.205 requires an altimeter for VFR day and night
operations, and a “sensitive altimeter” for IFR flight. Apart from antique aircraft that are
maintained in original or restored-to-original condition, most altimeters in the fleet are sensitive
altimeters.) Accurate reporting of an aircraft’s altimeter is important for every flight, and
especially so for VFR night and IFR flights.
In order that aircraft altimeters are accurate enough for IFR enroute, terminal, and approach
operations, regulations require biennial inspections of the pitot-static and altimeter systems. The
requirements are listed in FAR 91.411:
91.411 Altimeter system and altitude reporting equipment tests and inspections.
(a) No person may operate an airplane, or helicopter, in controlled airspace under IFR unless--
(1) Within the preceding 24 calendar months, each static pressure system, each altimeter
instrument, and each automatic pressure altitude
reporting system has been tested and inspected and found to comply with appendices E and F of
part 43 of this chapter;
(2) Except for the use of system drain and alternate static pressure valves, following any opening
and closing of the static pressure system, that system has been tested and inspected and found to
comply with paragraph (a), appendix E, of part 43 of this chapter; and
(3) Following installation or maintenance on the automatic pressure altitude reporting system of
the ATC transponder where data correspondence error could be introduced, the integrated
system has been tested, inspected, and found to comply with paragraph (c), appendix E, of part
43 of this chapter.
(b) The tests required by paragraph (a) of this section must be conducted by--

99
(1) The manufacturer of the airplane, or helicopter, on which the tests and inspections are to be
performed;
(2) A certificated repair station properly equipped to perform those functions and holding--
(i) An instrument rating, Class I;
(ii) A limited instrument rating appropriate to the make and model of appliance to be tested;
(iii) A limited rating appropriate to the test to be performed;
(iv) An airframe rating appropriate to the airplane, or helicopter, to be tested; or
(v) deleted
(3) A certificated mechanic with an airframe rating (static pressure system tests and inspections
only).
(c) Altimeter and altitude reporting equipment approved under Technical Standard Orders are
considered to be tested and inspected as of the date of their manufacture.
(d) No person may operate an airplane, or helicopter, in controlled airspace under IFR at an
altitude above the maximum altitude at which all altimeters and the automatic altitude reporting
system of that airplane, or helicopter, have been tested.
Amdt. 91-294, Eff. 2/20/07
The Appendix C of Part 43 referenced in this FAR is given in this report’s appendix for the
reader’s convenience.
Testing and certification of the Altimeter includes an inspection for scale error. All altimeter tests
are performed with the altimeter barometric pressure readout set to 29.92 Inches of Mercury.
Static system pressure is increased up to the maximum operating altitude of the aircraft, and the
simulated rate of climb is not to exceed 20,000 feet per minute. Appendix E of Part 43 lists all of
the required test points and allowable errors. Tolerances go from 20 feet at 1,000 feet below sea
level to 280 feet at a scale reading of 50,000 feet. A Hysteresis test is performed next. Static
system pressure is increased, simulating a rate of aircraft decent between 5,000 and 20,000 feet
per minute down to within 3,000 feet of the first test point (50 percent of the maximum altitude )
and then within 3,000 feet per minute. After the reading is taken, static system pressure is again
increased in the same manner as before until the second test point (40 percent of maximum
altitude) is reached. After the reading is taken, static system pressure is again increased as before
until atmospheric pressure is reached. Finally, another third reading is done and should be within
100
prescribed tolerance of the original altitude. Additionally, a friction test as well as a case leakage
test round out the certification process.
Part 43 Appendix E also requires additional inspections and test for equipment, if installed.
These include static port heater, visual inspection of the static port and surrounding area to verify
that no alteration or deformation of the airframe surface has occurred that would affect the
airflow over the static sensor for any flight condition. In the event of multiple static pressure
systems (pilot, co-pilot, and stand-by), all static systems employed by the flight deck instruments
or that supply altitude data to an altitude reporting system are subject to the rules described here.
In the event the aircraft is certified for Reduced Vertical Separation Minimums (RVSM), the
displayed flight deck altitude must meet an even tighter tolerance than those not RVSM
compliant. As this program is designed to allow aircraft operating between 29,000 and 41,000 to
fly with only 1,000 feet vertical division, the altitude indicating system must be very accurate.
Altitude tolerance at FL290t is +/- 48 feet and +/-72 feet at FL410.
ADS-B
The Automated Dependent Surveillance Broadcast (ADS-B) system consists of two services,
"ADS-B Out" and "ADS-B In", ADS-B could replace radar as the primary surveillance method
for controlling aircraft worldwide. ADS-B is an integral component of the NextGen national
airspace strategy for upgrading and enhancing aviation infrastructure and operations. The ADS-B
system can also provide traffic- (TIS-B) and government-generated graphical weather (FIS-B)
information. ADS-B enhances safety by making an aircraft visible, realtime, to air traffic control
(ATC) and to other appropriately equipped ADS-B aircraft with position and velocity data
transmitted every second. ADS-B data can be recorded and downloaded for post-flight analysis.
ADS-B also provides the data infrastructure for inexpensive flight tracking, planning, and
dispatch.
"ADS-B Out" periodically broadcasts information about each aircraft, such as identification,
current position, altitude, and velocity, through an onboard transmitter. ADS-B Out provides air
traffic controllers with real-time position information that is, in most cases, more accurate than
the information available with current radar-based systems. With more accurate information,
ATC will be able to position and separate aircraft with improved precision and timing.

101
"ADS-B In" is the reception by aircraft of FIS-B and TIS-B data and other ADS-B data such as
direct communication from nearby aircraft. The ground station broadcast data is typically only
made available in the presence of an ADS-B Out broadcasting aircraft, limiting the usefulness of
purely ADS-B In devices. FIS-B and TIS-B data streams are available to participating aircraft
over the 978 MHz channel from a ground station network across the United States and in the
Gulf of Mexico. ADS-B ground station range depends aircraft altitude and any terrain that might
block line of sight between the aircraft and the ground station. There are also practical limits due
to transmitter power and receiver sensitivity.
As of 2014, the FAA declared ADS-B ground station network deployment complete. The FAA
(through the ADS-B network contractor ITT) provides coverage maps for the US based on
aircraft altitude. These coverage maps were created by radiation and terrain models and are only
approximate. The ADS-B network coverage maps for 500’ AGL (upper-left), 1500’ AGL (upper-
right), 3000’ AGL (lower-left), and 5000’ AGL (lower-right) are shown below. At 5000’ AGL,
nearly 100% of the contiguous US is able to access the ADB-B ground station network and avail
itself of TIS-B and FIS-B data streams. The only significant areas without ADS-B coverage at
5000’AGL are in the intermountain west (likely due to rugged terrain shadowing effects) and
Alaska. It would be assumed that in the flight levels, ADS-B ground station contact would be
nearly universally available. However, at lower altitudes, ADS-B coverage is more sporadic with
approximately 25% and 40% drop-out possible at 1500’ AGL and 500’ AGL, respectively.

102
Figure 10.1. ADS-B ground station network coverage at 500 feet (upper-left), 1500 feet
(upper-right), 3000 feet (lower-left), and 5000 feet (lower-right). All altitudes are AGL.
The ADS-B system in the aircraft relies on two avionics components—a high-integrity GPS
navigation source and a datalink (ADS-B unit). The most common ones operate at 1090 MHz,
essentially a modified Mode S transponder, or devices named Universal Access Transceivers
(UATs) operating at 978 MHz. The UAT device for ADS-B is only certified for operation in the
NAS in the US, and would employed by smaller, slower, lower flying general aviation aircraft.
ADS-B out units operating at 1090 MHz are required in the flight levels. While aircraft
operating below FL180 and in the US NAS may use the 978 MHz link via UATs.
A proposed system by Aireon for ADS-B reception by low earth orbit (LEO) satellites could
improve the coverage of the ADS-B network, especially in more remote and inhospitable terrain.
The proposal is to deploy 1090 MHz ADS-B receivers on the Iridium satellite network, a LEO
satellite network that was originally created to deliver phone and data service anywhere on the
planet. The rationale for using the Iridium satellite network for this new capability was due to:

103
The Iridium satellites operate from LEO, and thus can receive the ADS-B out signals
more reliably as the aircraft transponders and ADS-B system were originally designed for
ground reception.
Iridium satellites are replaced relatively frequently due to the increased air friction at
their lower altitude, and thus lower lifespan. Thus the system would be deployed on
Iridium constellation faster than other existing or new satellite systems.
Iridium provides worldwide coverage, including the poles.
By capturing ADS-B position data from aircraft flying below the satellite, the network will give
the following capabilities:
Full air traffic control will be possible over water, in areas that radar does not currently
cover.
As is currently possible in radar covered areas, a position history will be available for lost
aircraft (think: Malaysia Airlines flight 370 lost on March 8, 2014 over the Indian
Ocean).
The system only receives ADS-B on aircraft broadcasting on the 1090 MHz frequency. This
limits the system generally to airliners and business aircraft. Therefore, UAT equipped aircraft
(typically general aviation flying below the flight levels) would not be detected by the proposed
system. These lower flying aircraft are the aircraft that will most often be denied ADS-B ground
station coverage and are not detected by ATCRBS surveillance radar due to terrain/mountain
shadowing at low altitudes. Furthermore, even 1090 MHz extended squitter smaller, general
aviation aircraft will likely not be served by the proposed Airoeon system. These lighter aircraft
are often outfitted with single diversity ADS-B systems with exclusively belly mounted ADS-B
antennas. The aircraft itself will likely block the signal to the Iridium satellite constellation
overhead.
104
Risk Analysis
The FAA Air Traffic Organization (ATO) uses the Safety Management System (SMS) for its
approach to system safety. The Air Traffic Organization (ATO) SMS is an integrated collection of
principles, policies, processes, procedures, and programs used to identify, analyze, assess,
manage, and monitor safety risk in the provision of air traffic management and communication,
navigation, and surveillance services. The ATO SMS describes the process of identifying safety
hazards and mitigating risk in the NAS.
Severity is the consequence or impact of a hazard’s effect or outcome in terms of degree of loss
or harm. Severity is independent of likelihood and must be determined before likelihood. Assess
all effects when determining severity. It is important to consider existing controls when
determining severity. The two tables following are the severity table used by the ATO to assess
the severity of a hazard when performing safety risk management.
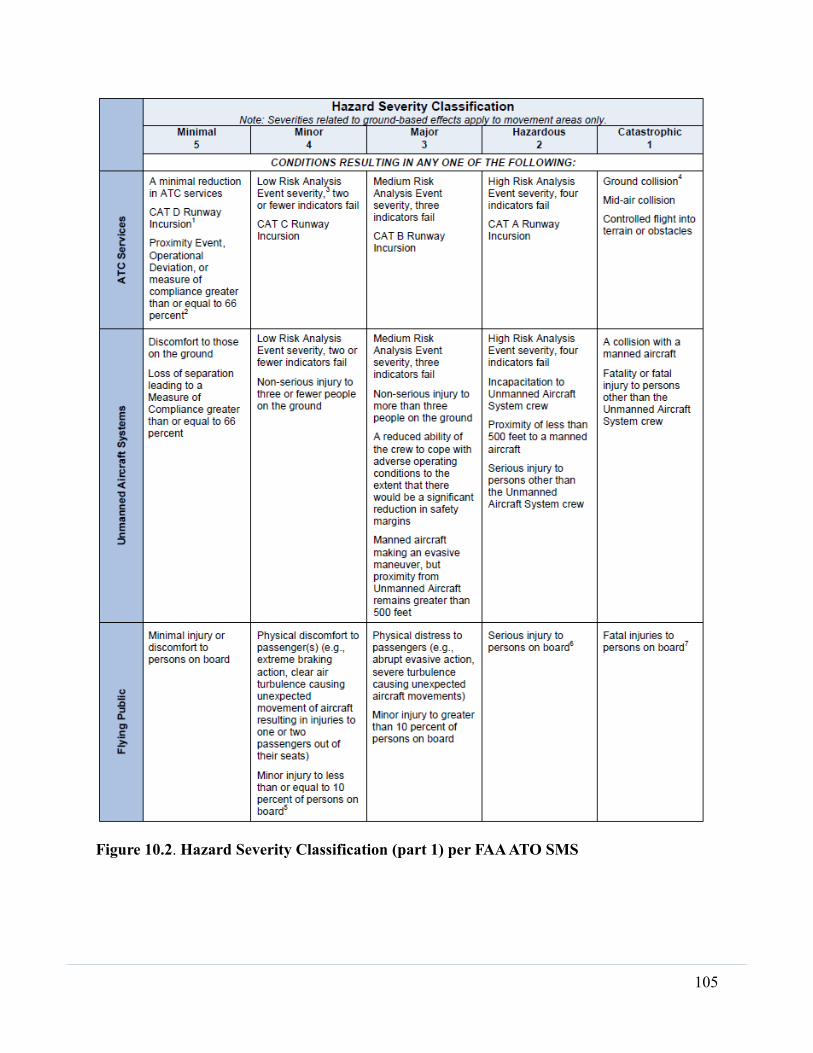
105
Figure 10.2. Hazard Severity Classification (part 1) per FAA ATO SMS

106
Figure 10.3. Hazard Severity Classification (part 2) per FAA ATO SMS
Likelihood is defined as the estimated probability or frequency, in quantitative or qualitative
terms, of a hazard’s effect or outcome. More specifically, the concept of likelihood can be
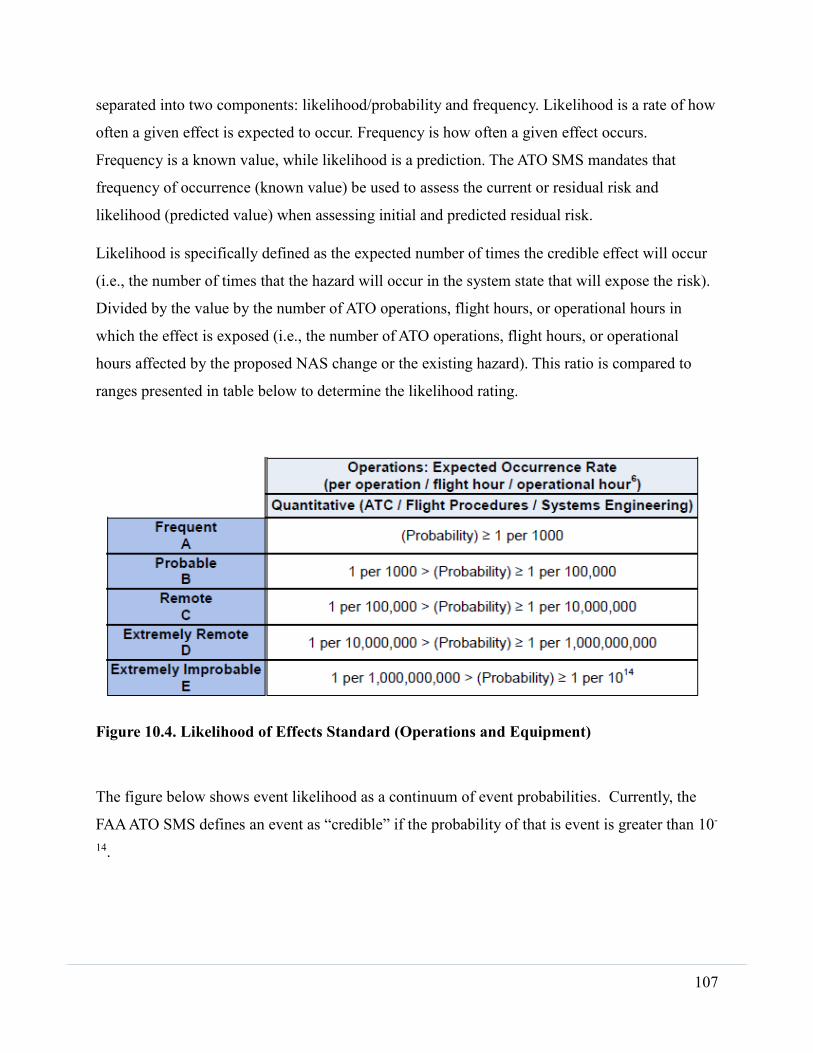
107
separated into two components: likelihood/probability and frequency. Likelihood is a rate of how
often a given effect is expected to occur. Frequency is how often a given effect occurs.
Frequency is a known value, while likelihood is a prediction. The ATO SMS mandates that
frequency of occurrence (known value) be used to assess the current or residual risk and
likelihood (predicted value) when assessing initial and predicted residual risk.
Likelihood is specifically defined as the expected number of times the credible effect will occur
(i.e., the number of times that the hazard will occur in the system state that will expose the risk).
Divided by the value by the number of ATO operations, flight hours, or operational hours in
which the effect is exposed (i.e., the number of ATO operations, flight hours, or operational
hours affected by the proposed NAS change or the existing hazard). This ratio is compared to
ranges presented in table below to determine the likelihood rating.
Figure 10.4. Likelihood of Effects Standard (Operations and Equipment)
The figure below shows event likelihood as a continuum of event probabilities. Currently, the
FAA ATO SMS defines an event as “credible” if the probability of that is event is greater than 10-
14.
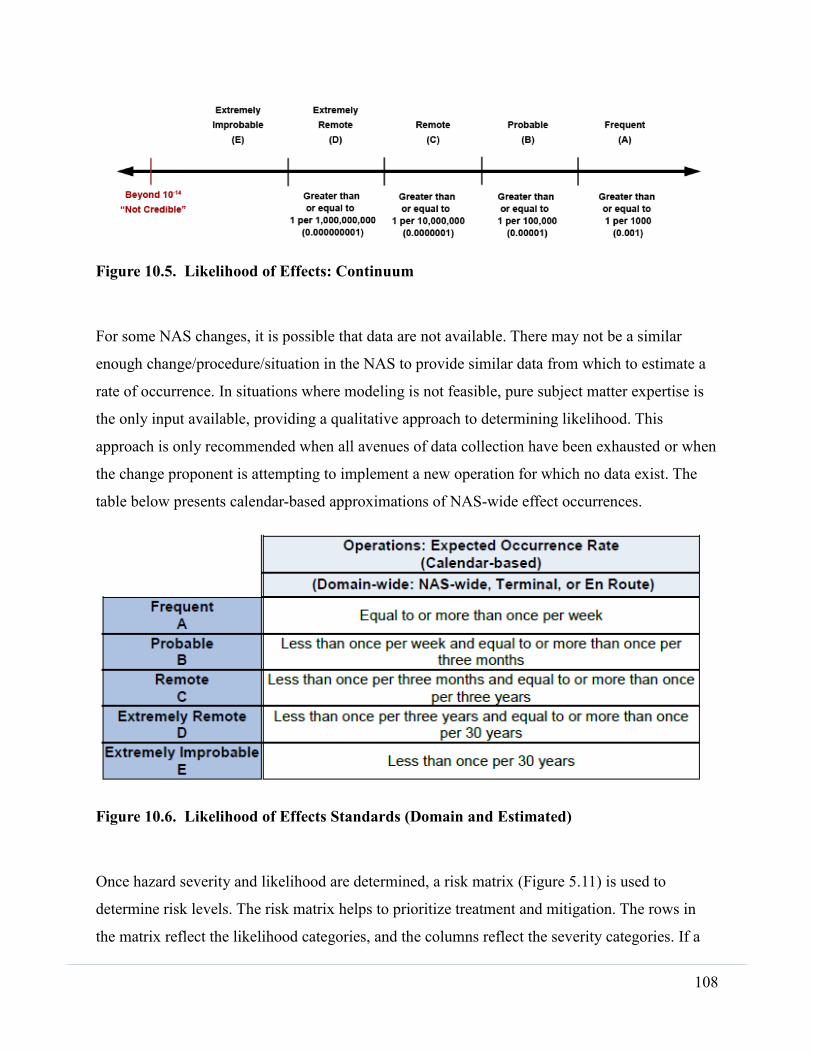
108
Figure 10.5. Likelihood of Effects: Continuum
For some NAS changes, it is possible that data are not available. There may not be a similar
enough change/procedure/situation in the NAS to provide similar data from which to estimate a
rate of occurrence. In situations where modeling is not feasible, pure subject matter expertise is
the only input available, providing a qualitative approach to determining likelihood. This
approach is only recommended when all avenues of data collection have been exhausted or when
the change proponent is attempting to implement a new operation for which no data exist. The
table below presents calendar-based approximations of NAS-wide effect occurrences.
Figure 10.6. Likelihood of Effects Standards (Domain and Estimated)
Once hazard severity and likelihood are determined, a risk matrix (Figure 5.11) is used to
determine risk levels. The risk matrix helps to prioritize treatment and mitigation. The rows in
the matrix reflect the likelihood categories, and the columns reflect the severity categories. If a

109
hazard severity-likelihood pair is plotted red, the risk associated with the hazard is high; if the
hazard severity-likelihood pair is plotted yellow, the risk associated with the hazard is medium;
and if the hazard severity-likelihood pair is plotted green, the risk associated with the hazard is
low.
A preliminary hazard event tree analysis by the MITRE Corporation in 2013 attempted to
determine whether any malfunctions/inaccuracies in an altimeter or transponder would affect the
safety of a flight involving UAS. Their work primarily dealt with a scenario in which both the
UAS and the manned aircraft are large, well equipped, and operating in class A airspace. Their
work ultimately determined that altitude reporting issues would not result in a significant
increase in the hazard level of the flight scenarios reviewed in this document. ATC should not
rely on vertical separation alone to separate traffic. Even though the conclusion made by The
MITRE Corporation seems to indicate that inaccurate altimeters would not cause a significant
increase in risk, it is important to note that this deals with Class A airspace. To date, it appears
that lower altitudes, specifically Class E and G airspaces, containing much VFR (read: general
aviation) aircraft has not been analyzed.
In this study, eight scenarios, most with four subcases, were identified for further study based on
possible static system and transponder reporting errors. The actors in these scenarios are a well-
equipped medium to large UAS utilizing proposed DAA methods with both radar interrogations
and ADS-B data processing. The intruders take on four distinct classes of aircraft:
TCAS equipped large aircraft (Hazard 0, 1, & 2)
ADSB-out equipped aircraft (Hazards 3 & 4)
Mode C equipped aircraft (Hazards 5 & 6)
No transponder equipped aircraft (Hazard 7)
The hazard event tree uses preliminary success/failure probabilities at each level. Further
refinement will be necessary to obtain higher fidelity event tree results. However, the results here
can be used in a comparative analysis to prioritize future research effort and investigations.
Hazard 0 examines the conflict between two TCAS-equipped aircraft in the flight levels has been
examined by multiple investigators and is included here for reference. The 2013 MITRE study

110
considered the case of a UAS (Citation Jet class) in twelve difference scenarios including an
altimeter lost-link hazard. The observations from that study are summarized below.
Event tree analysis shows that unmanned (Citation: Jet) does have a slight increase in
residual risk in Class A, but not to the point that additional mitigations are required
Detect and avoid in Class A for both ownship and other aircraft was assumed to be
marginally effective in certain circumstances
Lost link scenarios considered non-credible under current ATC procedures as ATC would
not rely solely on vertical separation
All information normally provided to manned aircraft crew in flight may need to be
available over a UAS C2 link, e.g. pilot/co-pilot altimeter cross-check
Some UAS have operational profiles requiring constant climb/descent during ops in Class
A airspace or underlying airspace. These operations could delay ATC’s ability to verify
that encoder reported altitude agrees with cockpit indicated altitude which normally
requires a level flight segment
There is a possible benefit from GPS altitude comparison in UAS control stations
ATC procedures, crew procedures, and altimetry and transponder certification standards
provide effective safety controls for flight in Class A airspace
To effectively mitigate risk in Class A, public aircraft altimetry systems/transponders
airworthiness standards should resemble those used for civil aircraft
In the scenarios covered by Hazard 0, all aircraft are required to be operating on IFR flight plans
and in constant communication with ATC. Furthermore, both would be expected to be FAR
91.411 and 91.413 current, and transponder and static system errors would be minimal.
Hazards 1-7 examine the conflict between a DAA (radar + ADS-B) equipped UASS and manned
aircraft in various equipage states in the altitudes below the flight levels. Depending on the
aircraft altitude and distance form an ATCRBS site and the installed ADS-B ground network, two
aircraft in close proximity in this hazard can take on four subcases:
1. Both aircraft have ATCRBS and ADS-B TIS coverage
2. Both aircraft have ATCRBS (but no ADS-B TIS coverage)
3. Both aircraft have ADS-B TIS (but no ATCRBS coverage)

111
4. Both aircraft are operating in areas without either ATCRBS and ADS-B coverage
Subcase (a) corresponds roughly to the higher altitudes (see the ADS-B network coverage maps)
and locations in the NAS near ATC surveillance radar sites. Using a simple approximation line-
of-sight model, an aircraft at an altitude of h feet above an assumed spherical earth can be seen
visually by a ground-based observer √ℎ nautical miles away. This simple approximation is
correct within 1%. For radar, wave diffraction bending the wave downwards can occur in the
earth’s atmosphere due to atmospheric density (water vapor and pressure) variations with
altitude. A simple approximation line-of-sight model accounting for beam diffraction due to
atmospheric density changes, an aircraft at an altitude of h feet above an assumed spherical earth
can be seen by a ground-based radar at a distance of √8ℎ𝑅𝑒
3⁄ , where 𝑅𝑒 is the radius of the
earth, or 6.4x10³ km and h is the aircraft height in km. Simplifying, the range of a ground-based
radar to a target h feet in altitude is roughly 1.2315√ℎ nautical miles. The table below lists the
line-of-sight distance, both visual and radar, for multiple aviation altitudes.
Table 10.1. Ground-based Line of Sight Ranges to Airborne Aircraft
Altitude (feet AGL) Visual Line of sight distance
(nm)
RADAR Line of sight
distance (nm)
500 22.4 27.5
1500 38.7 47.7
3,000 54.8 67.5
5,000 70.7 87.1
10,000 100 123
15,000 123 151
18,000 (~ FL180) 134 165
30,000 (~ FL300) 173 213
40,000 (~ FL400) 200 246
50,000 (~ FL500) 224 275

112
Referring to the table above gives insight to the subcases (a)-(d) considered in this study. If
aircraft are operating at 3000’ AGL, these aircraft would need to be located within about 67 miles
of the surveillance radar site to be seen by that radar. The simple model used here does not
account for terrain and radar/ground station shadowing and attenuation effects of nearby
obstacles. In practice, these line-of-sight ranges may be much smaller or bigger than predicted in
the table above. It can be assumed that ADS-B transmissions from a ground station antenna to a
participating aircraft would have a similar range, although the ADS-B ground station antennas
are typically located on cellular phone towers, or short towers located at airports. More accurate
data for participatory aircraft with surveillance radar and ADS-B network could be obtained from
operational NAS data.
The hazard subcase (a) would be the situation where both aircraft are operating at sufficiently
high altitude and within sufficiently close range to ATCRBS (ARTCC and TRACON sites) and
approximately 600 ADS-B ground stations. This would clearly be the case when aircraft are
operating at high altitudes, and/or in reasonably close proximity to large population centers in the
US.
Subcase (b) would correspond to both aircraft operating near surveillance radar site but not
within range of an ADS-B ground station. Given that ADS-B ground stations are far more
numerous and geographically distributed in the US, subcase (b) would be a much rarer situation.
This subcase scenario would occur at low altitudes near an radar site when the locale has no
nearby ADS-B ground stations. Subcase (c) could also occur in locations and altitudes where the
ATCRBS was visible and all ADS-B ground stations were blocked (shadowed) by terrain in
between the aircraft and the ADS-B ground station antenna.
Subcase (c) would correspond to both aircraft operating near ADS-B ground station antenna but
at locations and altitudes where the aircraft is not visible to an ATCRBS site. Given that ADS-B
ground stations are far more numerous and geographically distributed in the US, subcase (c)
would be more common than subcase (b). During weekday daylight hours, regional or terminal
radar approach control (TRACON) facilities would provide a good coverage of the US. On
weekends, holidays, or during nighttime operations, many TRACON are closed and surveillance
radar responsibilities default to ARTCC. Less equipped aircraft (fair-weather VFR flyers) tend
not to fly at night, but would likely fly more on weekends and holidays. In the case of darkened
113
TRACON facilities, it is more likely that low-flying aircraft are operating beyond ARTCC sites
and not detected by ATCRBS radar. However, ADS-B equipped aircraft would be participating in
the ADS-B network, but and visible to ATC through the ADS-B network. Similar to above,
subcase (c) could also occur in locations and altitudes where the one or more ADS-B ground
stations are visible to the aircraft, but the line of sight to all ARTCC and TRACON active radar
are blocked (shadowed) by terrain in between the aircraft and the radar antenna.
Subcase (d) would correspond to both aircraft operating out of range or sight of all ATCRBS
sites and ADS-B ground stations. Once again refereeing to the ADS-B ground stations coverage
map, this situation is most likely for aircraft at that are located at a distance from ATCRBS and
ADS-B ground stations and at lower altitudes. With the distributed ADS-B ground station
antenna network, this scenario is not greatly impacted by TRACON closures on weekends,
holidays, and at night, since ADS-B coverage is typically the limiting factor. In the remote
regions of the intermountain western US, line of sight to all ARTCC/TRACON radar and ADS-B
ground stations may be blocked (shadowed) by terrain in between the aircraft and the antenna
sites.
The special cases wherein each aircraft have difference services (ATCRBS and/or ADS-B)
available to them, or are operating in difference ATC sectors has not been considered, as these
scenarios would have lower likelihood due to the small spatial volumes in which they could
occur. A fuller analysis and verification of this assumption which is beyond the scope of this
preliminary study, would need to be made going forward. For the purpose of the hazard event
tree analysis, the percentage of time that each class of intruder aircraft (TCAS, ADSB, Mode C,
and no transponder) spend in each ATC services region is estimated. Estimates are based on an
average 2h flight with a “cross-country” mission to reasonably high altitude taking advantage of
ATC services (flight following/IFR/etc)., and gross estimates of the flight characteristics of each
aircraft class. The extents of coverage of ADS-B are based on the FAA ADS-B coverage maps,
and assume that aircraft are equally likely to be at any location in the US NAS. This assumption
is overly pessimistic and patently false as more air traffic would be located around population
centers. A better estimate of percentage of time without ADS-B coverage would be based on a
time-weighted average of real NAS data. However, this calculated estimate would be optimistic
because it would not account for aircraft operating outside of ATC’s view. Another error in the
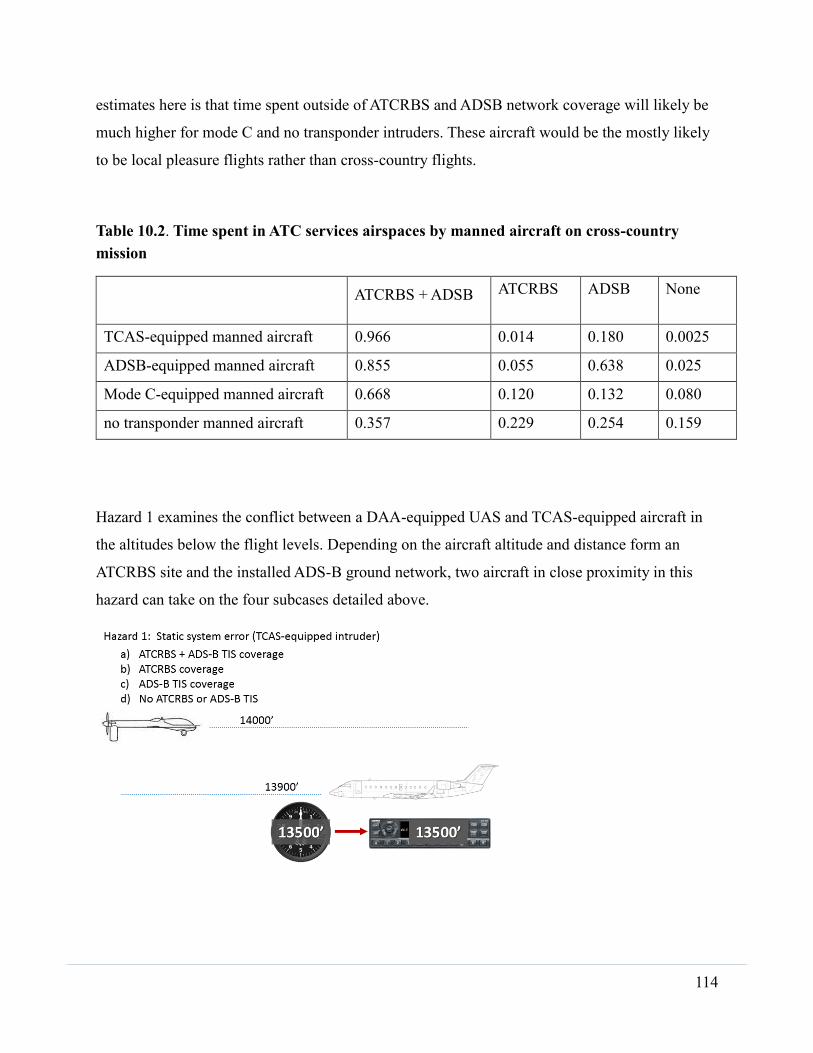
114
estimates here is that time spent outside of ATCRBS and ADSB network coverage will likely be
much higher for mode C and no transponder intruders. These aircraft would be the mostly likely
to be local pleasure flights rather than cross-country flights.
Table 10.2. Time spent in ATC services airspaces by manned aircraft on cross-country
mission
ATCRBS + ADSB ATCRBS ADSB None
TCAS-equipped manned aircraft 0.966 0.014 0.180 0.0025
ADSB-equipped manned aircraft 0.855 0.055 0.638 0.025
Mode C-equipped manned aircraft 0.668 0.120 0.132 0.080
no transponder manned aircraft 0.357 0.229 0.254 0.159
Hazard 1 examines the conflict between a DAA-equipped UAS and TCAS-equipped aircraft in
the altitudes below the flight levels. Depending on the aircraft altitude and distance form an
ATCRBS site and the installed ADS-B ground network, two aircraft in close proximity in this
hazard can take on the four subcases detailed above.

115

116

117
Hazard 2 examines the conflict between a DAA-equipped UAS and TCAS-equipped aircraft in
the altitudes below the flight levels. Depending on the aircraft altitude and distance form an
ATCRBS site and the installed ADS-B ground network, two aircraft in close proximity in this
hazard can take on the four subcases detailed above.

118

119
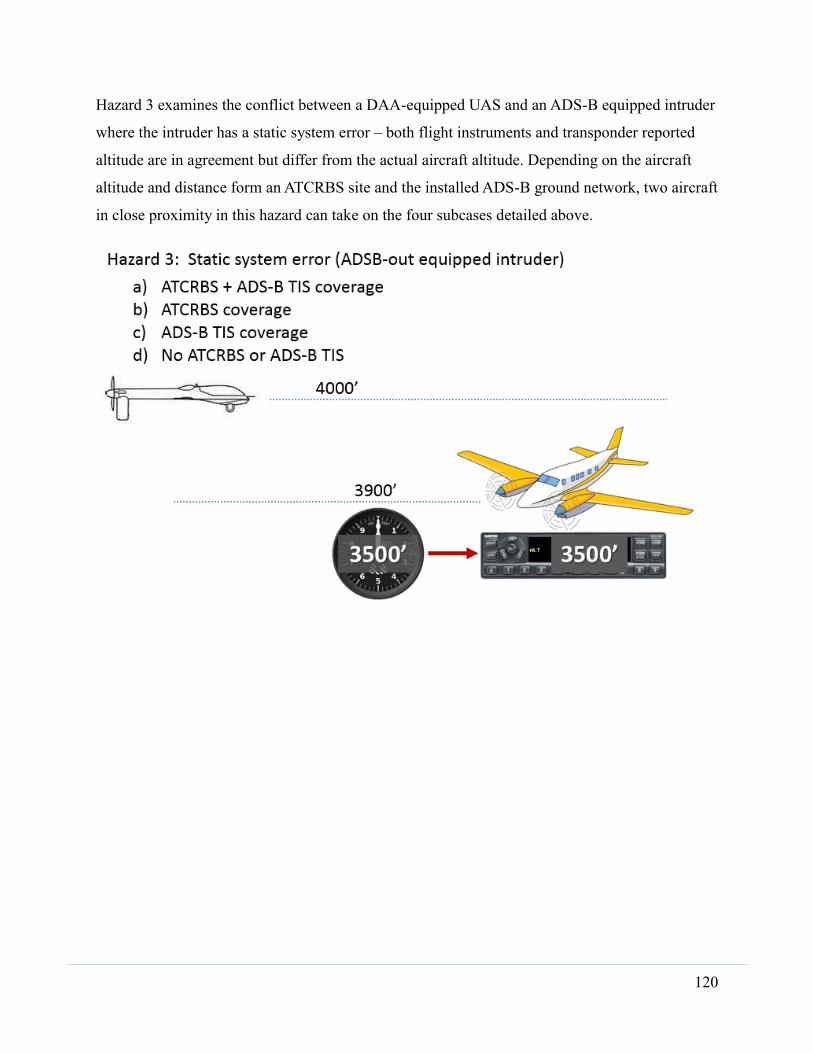
120
Hazard 3 examines the conflict between a DAA-equipped UAS and an ADS-B equipped intruder
where the intruder has a static system error – both flight instruments and transponder reported
altitude are in agreement but differ from the actual aircraft altitude. Depending on the aircraft
altitude and distance form an ATCRBS site and the installed ADS-B ground network, two aircraft
in close proximity in this hazard can take on the four subcases detailed above.

121
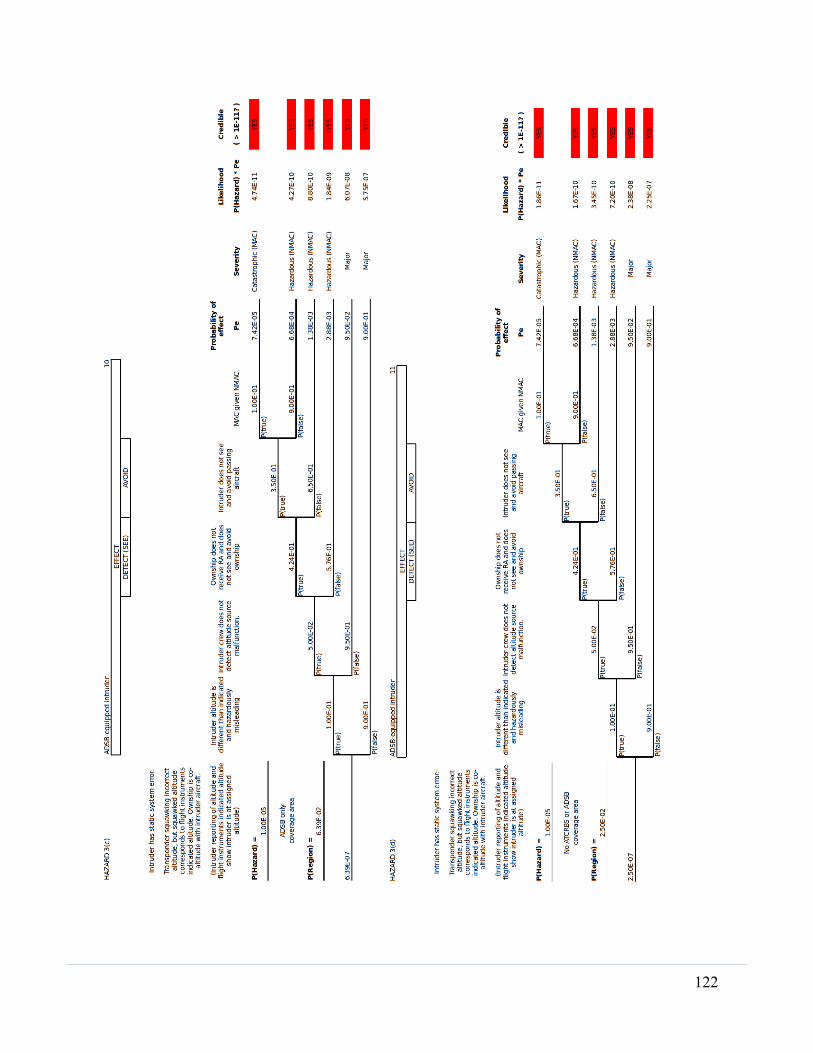
122

123
Hazard 4 examines the conflict between a DAA-equipped UA and ADSB-equipped aircraft in the
altitudes below the flight levels. Depending on the aircraft altitude and distance form an
ATCRBS site and the installed ADS-B ground network, two aircraft in close proximity in this
hazard can take on the four subcases detailed above.

124

125

126
Hazard 5 examines the conflict between a DAA-equipped UAS and a mode-C transponder
equipped intruder where the intruder has a static system error – both flight instruments and
transponder reported altitude are in agreement but differ from the actual aircraft altitude.
Depending on the aircraft altitude and distance form an ATCRBS site and the installed ADS-B
ground network, two aircraft in close proximity in this hazard can take on the four subcases
detailed above.
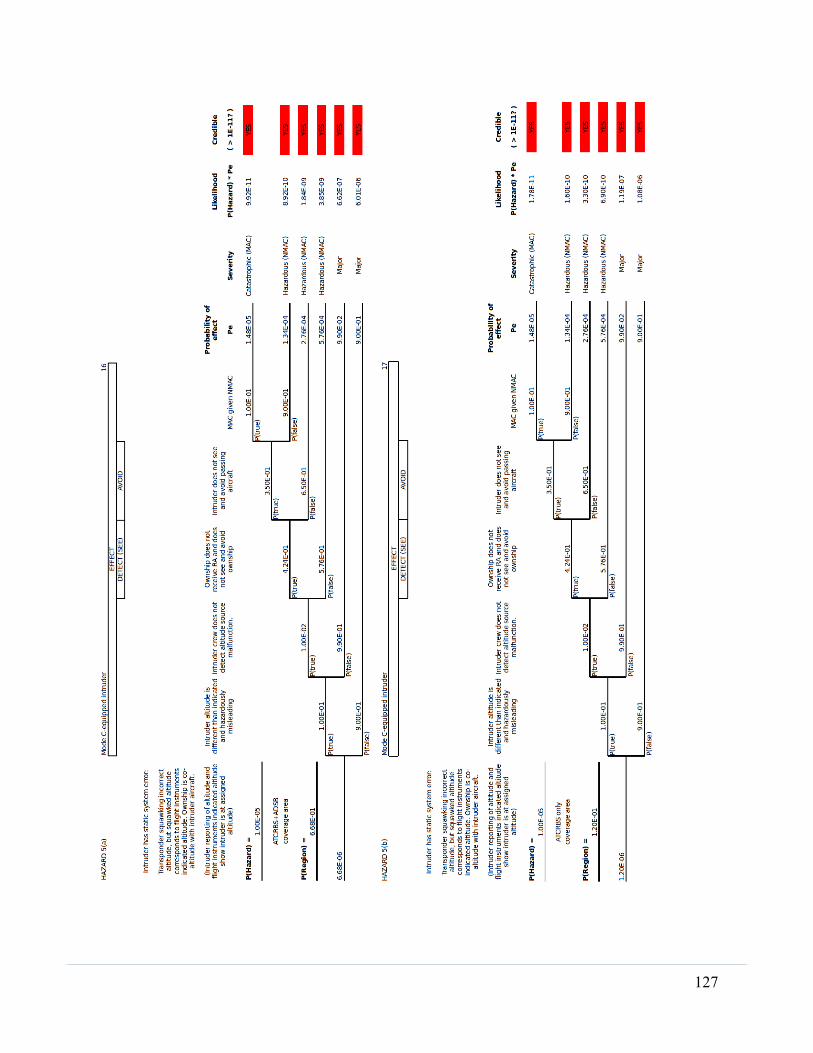
127

128

129
Hazard 6 examines the conflict between a DAA-equipped UAS and Mode-C transponder-
equipped aircraft in the altitudes below the flight levels. Depending on the aircraft altitude and
distance form an ATCRBS site and the installed ADS-B ground network, two aircraft in close
proximity in this hazard can take on the four subcases detailed above.
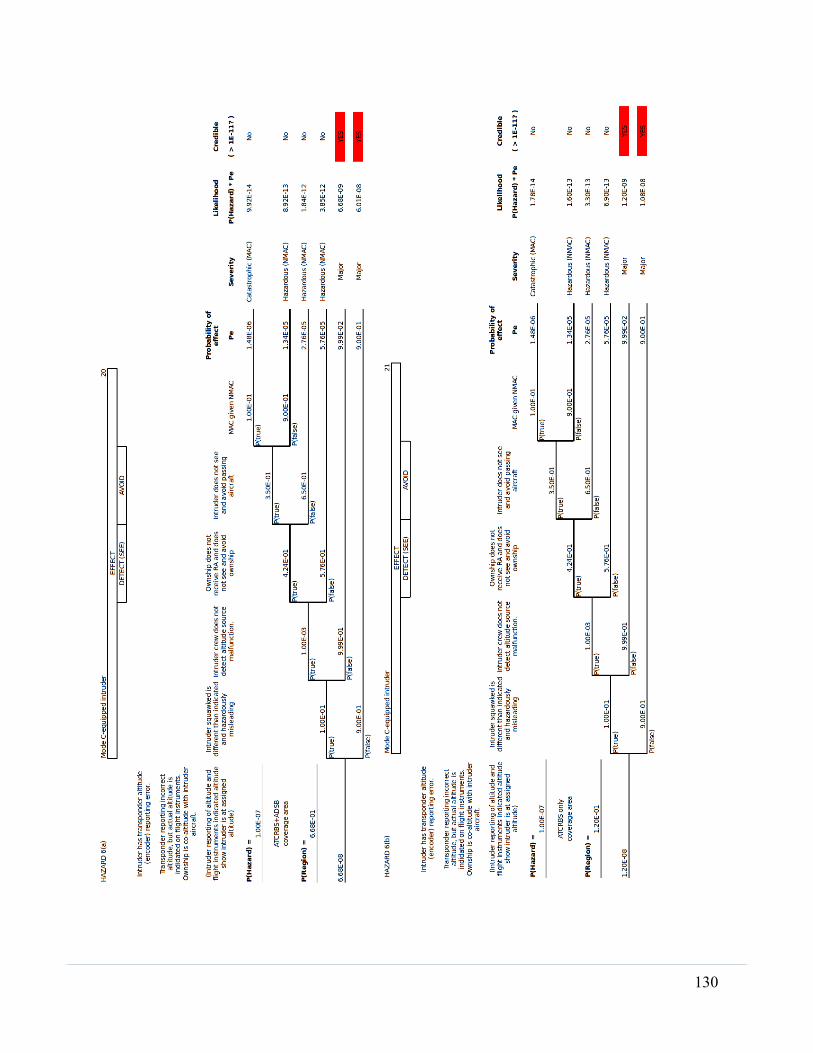
130
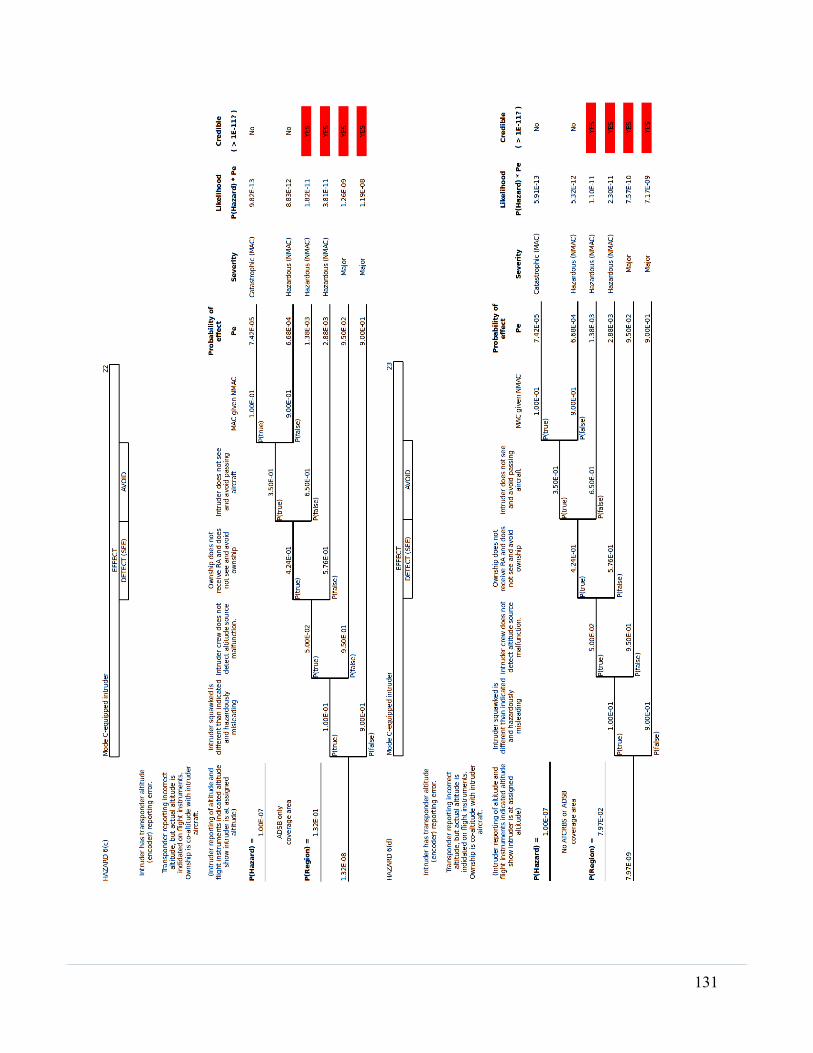
131

132
Hazard 7 examines the conflict between a DAA-equipped UAS and a no-transponder aircraft
intruder where the intruder has a static system error – flight instruments reports an altitude
different from the actual aircraft altitude. Depending on the aircraft altitude and distance form an
ATCRBS site and the installed ADS-B ground network, two aircraft in close proximity in this
hazard can take on the four subcases detailed above.

133

134

135
Probability of error detection, RA notice, sense and avoid, and MAC are based on values
suggested by previous studies (author year, author year, etc). Each of these probabilities could be
improved upon with more specific details of operating modes. The results here are a very
preliminary examination of the case of UAS and manned aircraft conflict below the flight levels
to determine if any failure likelihoods are credible.
Analysis could also be improved by incorporation of encounter models in the NAS. Analysis also
does not account for time periods of varying ATC service availability, radio coverage, and
location in NAS to account for actual ATC availability. UAS mission operating procedures in
more challenging airspace and collision-prone scenarios would also reduce the likelihood
measures here.
Examination of the event trees shows that encounters between DAA does clearly lower altitude
encounters located in more remote locales lead to higher likelihoods of NMAC and MAC.
Operations over more populated regions (near Class B and Class B airspaces) would have greater
ATC communication and radar coverage, and ADS-B network connectivity. Away from these
more capable ATC sectors (>75nm from ATC radar) at lower altitudes (below 3000’ AGL) would
challenge UAS operations because ADS-B TIS-B services would be lacking much information
about the intruder targets. While UAS DAA could interrogate TCAS, ADS-B, and Mode C
intruders in these low altitude, remote locations, the transponder-less aircraft would be difficult
to identify without another mechanism.
Preliminary Investigations on Occurrences of Altitude Reporting System Errors in the
Installed Fleet
Since the analysis above assumes that altimetry errors (either altimeter or transponder altimetry
source) exist, the most obvious next step is to determine the likelihood of these sorts of errors in
the flying fleet, and the magnitude of errors when they do occur. The FAR 91.411 requires that
all aircraft flying IFR be inspected every two years. VFR operators would not be required to
comply with these inspections. FAR 91.413 requires transponder inspections every two years for
all transponder-equipped aircraft. Transponder-less aircraft, while very few in number, would
obviously not be inspected. Also, it is believed that a number of flying aircraft have likely not
had FAR 91.411 and FAR 91.413 inspections as required.
136
The most straight-forward method to determine the number and extents of these errors would be
an inspection of the fleet. This would be cost- and time-prohibitive. Single-owner fleets (flight
schools, air operators, etc) of aircraft could be inspected to determine the magnitude of altimetry
errors; however, this measure would be biased. Fleets of this type are used in commercial
operations for their owners, and these fleets would be arguably better and more-often maintained
than privately-owned and non-commercial aircraft. For preliminary estimates of the altimetry
errors in the flying fleet, avionics certified repair stations (CRS) can be surveyed as to
observations in performing 91.411 and 91.413 inspections. Again, this measure is automatically
biased, as it is only considering aircraft which are volunteering themselves to be inspected per
the regulations. The very aircraft that are more likely to be less rigorously maintained are also the
aircraft that fail to maintain their 91.411 and 91.413 certifications every two years.
An informal survey was done of three different avionics CRS operating under three different
FSDOs in different parts of the country. The avionics CRS – each in operation for 20 years or
more -- were asked to report their anecdotal observations about altimeter accuracy (91.411
inspections) and reported transponder altimetry (91.413). Admittedly, this survey has a biased
sample population, as the preponderance of aircraft getting 91.411 inspections would be
expected to IFR-operating aircraft. Such aircraft would likely be better equipped, better
maintained, and operating more frequently/regularly than more casual VFR aircraft. All aircraft
with a transponder are required to obtain biennial 91.413 inspections, but compliance with this
regulation may be less thorough than desired. In either case, altimetry is not inspected as
thoroughly in most 91.413 inspections.
All three avionics CRS reported performing approximately or more than 75 91.411 inspections
and approximately or more than 125 91.413 inspections annually. A summary of the avionics
CRS responses to the survey are given below:
Q: What percentage of aircraft inspected annually for 91.413 fail for erroneous altitude
reporting? (Note: Avionics CRS verify for 125’ agreement between altimeter and transponder “at
a sufficient number of test points”.)
CRS1: A few annually… two to four planes. (This number would correspond to about 3%.)
CRS2: I’d say I see 10-15 failures a year. (This number would correspond to 15-20%.)
CRS3: Just an estimate off the top of my head: 10%

137
These avionics CRS largely agreed with the occurrence of 91.413 failures. It should be noted that
these CRS operate in different regions of the country and with different population densities. One
is located in very densely populated metropolitan and busy aviation corridor. Another in a more
suburban locations with no major metropolitan areas. The final CRS is located in a sparsely
populate mid-continent region with more recreational flying general aviation aircraft and lots of
agricultural aviation. The third CRS reported observing several cases where aircraft with low
annual flight times had altimeter or blind encoder diaphragms that were stiff due to lack of
use/exercise. He reported that such errors were dynamic and varied with temperature, aircraft
use, humidity, etc.
Q: What percentage of aircraft inspected annually for 91.411 fail?
CRS1: Maybe as much as one-half.
CRS2: Oh, 80%. (This shop admitted to being very thorough in its 91.411 inspections, and most
of these failures were static system leak-down test failures due to the aging general aviation
fleet.)
CRS3: Not too many 10%.
The first two avionics CRS seemed to be answering the question with regard to initial 91.411
failures. When queried, all CRS reported that the most common failure mode of 91.411
inspections was system leak test. Such failures can be diagnosed and repaired quickly. The third
CRS was referring specifically to the occurrences of 91.411 failures of the altimeter (scale or
barometer error) itself where the altimeter could not be adjusted back into compliance.
Q: In altimeter scale errors, what are the magnitudes of the errors observed?
CRS1: These altimeter errors are dynamic. Many intermittent and often altitude dependent. Most
errors would be as much as 300’. I have seen as much as 700-800’.
CRS2: Most errors are small. Gross errors would be called out by ATC and would be addressed.
Errors in the system are, in reality, much worse; once an altitude is out of compliance in the 411
inspection, we stop the test and fail the aircraft.
CRS3: Most 200-300 feet. Some have been worse.

138
Transponder inspections in FAR 91.413 must be performed and equipment must comply with the
requirements in of Part 43. These requirements are reproduced below for reference.
139
10.2 APPENDIX B. PART 43—ATC TRANSPONDER TESTS AND INSPECTIONS
The ATC transponder tests required by § 91.413 of this chapter may be conducted using a bench
check or portable test equipment and must meet the requirements prescribed in paragraphs (a)
through (j) of this appendix. If portable test equipment with appropriate coupling to the aircraft
antenna system is used, operate the test equipment for ATCRBS transponders at a nominal rate
of 235 interrogations per second to avoid possible ATCRBS interference. Operate the test
equipment at a nominal rate of 50 Mode S interrogations per second for Mode S. An additional 3
dB loss is allowed to compensate for antenna coupling errors during receiver sensitivity
measurements conducted in accordance with paragraph (c)(1) when using portable test
equipment.
(a) Radio Reply Frequency:
(1) For all classes of ATCRBS transponders, interrogate the transponder and
verify that the reply frequency is 1090 ±3 Megahertz (MHz).
(2) For classes 1B, 2B, and 3B Mode S transponders, interrogate the transponder
and verify that the reply frequency is 1090 ±3 MHz.
(3) For classes 1B, 2B, and 3B Mode S transponders that incorporate the optional
1090 ±1 MHz reply frequency, interrogate the transponder and verify that the
reply frequency is correct.
(4) For classes 1A, 2A, 3A, and 4 Mode S transponders, interrogate the
transponder and verify that the reply frequency is 1090 ±1 MHz.
(b) Suppression: When Classes 1B and 2B ATCRBS Transponders, or Classes 1B, 2B,
and 3B Mode S transponders are interrogated Mode 3/A at an interrogation rate between
230 and 1,000 interrogations per second; or when Classes 1A and 2A ATCRBS
Transponders, or Classes 1B, 2A, 3A, and 4 Mode S transponders are interrogated at a
rate between 230 and 1,200 Mode 3/A interrogations per second:
(1) Verify that the transponder does not respond to more than 1 percent of
ATCRBS interrogations when the amplitude of P2 pulse is equal to the P1 pulse.
(2) Verify that the transponder replies to at least 90 percent of ATCRBS
interrogations when the amplitude of the P2 pulse is 9 dB less than the P1 pulse.
If the test is conducted with a radiated test signal, the interrogation rate shall be
235 ±5 interrogations per second unless a higher rate has been approved for the
test equipment used at that location.
(c) Receiver Sensitivity:
140
(1) Verify that for any class of ATCRBS Transponder, the receiver minimum
triggering level (MTL) of the system is −73 ±4 dbm, or that for any class of Mode
S transponder the receiver MTL for Mode S format (P6 type) interrogations is
−74 ±3 dbm by use of a test set either:
(i) Connected to the antenna end of the transmission line;
(ii) Connected to the antenna terminal of the transponder with a
correction for transmission line loss; or
(iii) Utilized radiated signal.
(2) Verify that the difference in Mode 3/A and Mode C receiver sensitivity does not
exceed 1 db for either any class of ATCRBS transponder or any class of Mode S
transponder.
(d) Radio Frequency (RF) Peak Output Power:
(1) Verify that the transponder RF output power is within specifications for the
class of transponder. Use the same conditions as described in (c)(1)(i), (ii), and
(iii) above.
(i) For Class 1A and 2A ATCRBS transponders, verify that the minimum
RF peak output power is at least 21.0 dbw (125 watts).
(ii) For Class 1B and 2B ATCRBS Transponders, verify that the minimum
RF peak output power is at least 18.5 dbw (70 watts).
(iii) For Class 1A, 2A, 3A, and 4 and those Class 1B, 2B, and 3B Mode S
transponders that include the optional high RF peak output power, verify
that the minimum RF peak output power is at least 21.0 dbw (125 watts).
(iv) For Classes 1B, 2B, and 3B Mode S transponders, verify that the
minimum RF peak output power is at least 18.5 dbw (70 watts).
(v) For any class of ATCRBS or any class of Mode S transponders, verify
that the maximum RF peak output power does not exceed 27.0 dbw (500
watts).
Note: The tests in (e) through (j) apply only to Mode S transponders.
(e) Mode S Diversity Transmission Channel Isolation: For any class of Mode S
transponder that incorporates diversity operation, verify that the RF peak output power
transmitted from the selected antenna exceeds the power transmitted from the
nonselected antenna by at least 20 db.

141
(f) Mode S Address: Interrogate the Mode S transponder and verify that it replies only to
its assigned address. Use the correct address and at least two incorrect addresses. The
interrogations should be made at a nominal rate of 50 interrogations per second.
(g) Mode S Formats: Interrogate the Mode S transponder with uplink formats (UF) for
which it is equipped and verify that the replies are made in the correct format. Use the
surveillance formats UF=4 and 5. Verify that the altitude reported in the replies to UF=4
are the same as that reported in a valid ATCRBS Mode C reply. Verify that the identity
reported in the replies to UF=5 are the same as that reported in a valid ATCRBS Mode
3/A reply. If the transponder is so equipped, use the communication formats UF=20, 21,
and 24.
(h) Mode S All-Call Interrogations: Interrogate the Mode S transponder with the Mode S-
only all-call format UF=11, and the ATCRBS/Mode S all-call formats (1.6 microsecond
P4 pulse) and verify that the correct address and capability are reported in the replies
(downlink format DF=11).
(i) ATCRBS-Only All-Call Interrogation: Interrogate the Mode S transponder with the
ATCRBS-only all-call interrogation (0.8 microsecond P4 pulse) and verify that no reply is
generated.
(j) Squitter: Verify that the Mode S transponder generates a correct squitter
approximately once per second.
(k) Records: Comply with the provisions of § 43.9 of this chapter as to content, form, and
disposition of the records.
[Amdt. 43-26, 52 FR 3390, Feb. 3, 1987; 52 FR 6651, Mar. 4, 1987, as amended by Amdt. 43-31,
54 FR 34330, Aug. 18, 1989]
Altimeter system and altitude reporting equipment tests and inspections in FAR 91.411 must be
performed and equipment must comply with the requirements Part 43. These requirements are
reproduced below in Appendix C.

142
10.3 APPENDIX C. PART 43—ALTIMETER SYSTEM TEST AND INSPECTIONS
Each person performing the altimeter system tests and inspections required by § 91.411 shall
comply with the following:
(a) Static pressure system:
(1) Ensure freedom from entrapped moisture and restrictions.
(2) Determine that leakage is within the tolerances established in § 23.1325 or §
25.1325, whichever is applicable.
(3) Determine that the static port heater, if installed, is operative.
(4) Ensure that no alterations or deformations of the airframe surface have been
made that would affect the relationship between air pressure in the static pressure
system and true ambient static air pressure for any flight condition.
(b) Altimeter:
(1) Test by an appropriately rated repair facility in accordance with the following
subparagraphs. Unless otherwise specified, each test for performance may be
conducted with the instrument subjected to vibration. When tests are conducted
with the temperature substantially different from ambient temperature of
approximately 25 degrees C., allowance shall be made for the variation from the
specified condition.
(i) Scale error. With the barometric pressure scale at 29.92 inches of
mercury, the altimeter shall be subjected successively to pressures
corresponding to the altitude specified in Table I up to the maximum
normally expected operating altitude of the airplane in which the altimeter
is to be installed. The reduction in pressure shall be made at a rate not in
excess of 20,000 feet per minute to within approximately 2,000 feet of the
test point. The test point shall be approached at a rate compatible with the
test equipment. The altimeter shall be kept at the pressure corresponding
to each test point for at least 1 minute, but not more than 10 minutes,
before a reading is taken. The error at all test points must not exceed the
tolerances specified in Table I.
(ii) Hysteresis. The hysteresis test shall begin not more than 15 minutes
after the altimeter's initial exposure to the pressure corresponding to the
upper limit of the scale error test prescribed in subparagraph (i); and
while the altimeter is at this pressure, the hysteresis test shall commence.
Pressure shall be increased at a rate simulating a descent in altitude at the

143
rate of 5,000 to 20,000 feet per minute until within 3,000 feet of the first
test point (50 percent of maximum altitude). The test point shall then be
approached at a rate of approximately 3,000 feet per minute. The
altimeter shall be kept at this pressure for at least 5 minutes, but not more
than 15 minutes, before the test reading is taken. After the reading has
been taken, the pressure shall be increased further, in the same manner as
before, until the pressure corresponding to the second test point (40
percent of maximum altitude) is reached. The altimeter shall be kept at
this pressure for at least 1 minute, but not more than 10 minutes, before
the test reading is taken. After the reading has been taken, the pressure
shall be increased further, in the same manner as before, until atmospheric
pressure is reached. The reading of the altimeter at either of the two test
points shall not differ by more than the tolerance specified in Table II from
the reading of the altimeter for the corresponding altitude recorded during
the scale error test prescribed in paragraph (b)(i).
(iii) After effect. Not more than 5 minutes after the completion of the
hysteresis test prescribed in paragraph (b)(ii), the reading of the altimeter
(corrected for any change in atmospheric pressure) shall not differ from
the original atmospheric pressure reading by more than the tolerance
specified in Table II.
(iv) Friction. The altimeter shall be subjected to a steady rate of decrease
of pressure approximating 750 feet per minute. At each altitude listed in
Table III, the change in reading of the pointers after vibration shall not
exceed the corresponding tolerance listed in Table III.
(v) Case leak. The leakage of the altimeter case, when the pressure within
it corresponds to an altitude of 18,000 feet, shall not change the altimeter
reading by more than the tolerance shown in Table II during an interval of
1 minute.
(vi) Barometric scale error. At constant atmospheric pressure, the
barometric pressure scale shall be set at each of the pressures (falling
within its range of adjustment) that are listed in Table IV, and shall cause
the pointer to indicate the equivalent altitude difference shown in Table IV
with a tolerance of 25 feet.
(2) Altimeters which are the air data computer type with associated computing
systems, or which incorporate air data correction internally, may be tested in a

144
manner and to specifications developed by the manufacturer which are acceptable
to the Administrator.
(c) Automatic Pressure Altitude Reporting Equipment and ATC Transponder System
Integration Test. The test must be conducted by an appropriately rated person under the
conditions specified in paragraph (a). Measure the automatic pressure altitude at the
output of the installed ATC transponder when interrogated on Mode C at a sufficient
number of test points to ensure that the altitude reporting equipment, altimeters, and ATC
transponders perform their intended functions as installed in the aircraft. The difference
between the automatic reporting output and the altitude displayed at the altimeter shall
not exceed 125 feet.
(d) Records: Comply with the provisions of § 43.9 of this chapter as to content, form, and
disposition of the records. The person performing the altimeter tests shall record on the
altimeter the date and maximum altitude to which the altimeter has been tested and the
persons approving the airplane for return to service shall enter that data in the airplane
log or other permanent record.

145
Table 1 Scale Error Tolerances
ALTITUDE EQUIVALENT PRESSURE (IN HG)
TOLERANCE (+/- FEET)
−1,000 31.018 20
0 29.921 20
500 29.385 20
1,000 28.856 20
1,500 28.335 25
2,000 27.821 30
3,000 26.817 30
4,000 25.842 35
6,000 23.978 40
8,000 22.225 60
10,000 20.577 80
12,000 19.029 90
14,000 17.577 100
16,000 16.216 110
18,000 14.942 120
20,000 13.750 130
22,000 12.636 140
25,000 11.104 155
30,000 8.885 180
35,000 7.041 205
40,000 5.538 230
45,000 4.355 255
50,000 3.425 280

146
Table 2 Test Tolerances
TEST TOLERANCE (+/- FEET)
Case Leak Test ±100
Hysteresis Test:
First Test Point (50 percent of maximum altitude) 75
Second Test Point (40 percent of maximum altitude) 75
After Effect Test 30
Table 3 Friction Tolerances
ALTITUDE TOLERANCE (+/- FEET)
1,000 ±70
2,000 70
3,000 70
5,000 70
10,000 80
15,000 90
20,000 100
25,000 120
30,000 140
35,000 160
40,000 180
50,000 250

147
Table 4 Pressure-Altitude Difference
PRESSURE (IN HG) ALTITUDE DIFFERENCE (FEET)
28.10 −1,727
28.50 −1,340
29.00 −863
29.50 −392
29.92 0
30.50 531
30.90 893
30.99 974
(Secs. 313, 314, and 601 through 610 of the Federal Aviation Act of 1958 (49 U.S.C. 1354, 1355,
and 1421 through 1430) and sec. 6(c), Dept. of Transportation Act (49 U.S.C. 1655(c)))
[Amdt. 43-2, 30 FR 8262, June 29, 1965, as amended by Amdt. 43-7, 32 FR 7587, May 24, 1967;
Amdt. 43-19, 43 FR 22639, May 25, 1978; Amdt. 43-23, 47 FR 41086, Sept. 16, 1982; Amdt. 43-
31, 54 FR 34330, Aug. 18, 1989]
148
10.4 APPENDIX D. ADS-B IN DEVICE PERFORMANCE ANALYSIS REPORT BY
SIMULYZE
ADS-B IN Device Performance Analysis Report
from
Simulyze Inc.
to
the
NextGen Air transportation Consortium (NGAT)
at
North Carolina State University
In support of the
ASSURE A6 Surveillance Criticality Study
November 28, 2016
Simulyze Inc.
12020 Sunrise Valley Drive, Suite 300
Reston, VA 20191
www.simulyze.com
Point of Contact
Kevin Gallagher
Phone: 703-391-7001 x262
Fax: 703-391-7002
Email: [email protected]

149
INTRODUCTION
ADS-B IN is one of the surveillance technologies that will be a factor for UAS operations, whether
ADS-B OUT is used on UAV’s or just for surveillance of manned aviation that uses ADS-B OUT
per the FAA ADS-B mandate. Working with ADS-B IN as a surveillance technology for situational
awareness in support of UAS operations, Simulyze® has observed potential differences in aircraft
reporting from different ADS-B IN devices. These observations have led us to work with the
ASSURE A6 Surveillance Critically Study to perform an initial, quick look study comparing the
surveillance performance of four ADS-B IN devices.
STUDY PARAMETERS
This is an initial study to do a quantitative first look at ADS-B IN device performance for
surveillance supporting UAS operations. The purpose of the study is to get a quantitative
assessment of the value in performing a more detailed study of ADS-B IN devices for surveillance.
This study is focused on assessing the reporting of ADS-B OUT transmissions that should be
received by all the devices. This was accomplished by limiting the coverage area to 1 statute mile
ground radius from the receivers/antennas. Another study of actual comparative receiver and
antenna performance may be beneficial. For this study, four commercially available ADS-B IN
devices that receive both the 1090 MHz and 978 MHz frequencies were selected. Simulyze’s
Mission Insight software was used to process the data from each of the devices. Each of the
devices output a different data format. The 4 ADS-B IN devices are the Clarity from Sagetech,
the Stratus 2 from Appareo, the PingUSB from uAvionix, and the PingBuddy from uAvionix. They
are pictured, in order, below.

150
All devices except the Stratus 2 used the device’s fixed antenna. The Stratus used an external
antenna. The test was a ground based test. The devices were placed within a 1 square foot area
approximately 7 feet off the ground. The test was performed from 16:55 – 22:15 GMT on 11/13/16
about 5 miles west of Washington Dulles International Airport (KIAD) in Virginia.
OVERALL RESULTS
The results of this quick look study reveal a significant variation in reporting by each of the various
devices. None of the devices provided reporting on all the aircraft, although one device did not
report on only one aircraft. ADS-B OUT aircraft report once a second. There was variability in
the reporting frequency from the devices.
This initial study indicates that a more rigorous study should be performed with ADS-B IN devices
to assess the difference between various devices and to assess the timing performance of ADS-IN
to support surveillance in support of UAS operations. Also, ground based versus aerial based
performance may also be of interest.
ANALYSIS and RESULTS
A top level look at the overall number of aircraft reported by each of the devices is the starting
point for the analysis. This is a top level parameter as the reporting will vary based on the device’s
antenna and receiver sensitivities as well as the ordering and processing of the different messages
that can make up an ADS-B OUT broadcast to identify the aircraft (Registration number/”N”
number, call sign, ICAO address). The following set of tables will include the number of aircraft
reported from the specific device as well the total number of aircraft reported from the combined
outputs. The total number of aircraft reported by each device will be provided for five ranges from
the location of the devices.
All aircraft reported, no range from device filter
Device Number of aircraft reported
All devices in a combined dataset 432
uAvionix PingUSB 419
Appareo Stratus 2 w/ external antenna 345
Sagetech Clarity 264
uAvionix PingBuddy 188

151
Aircraft reported within 35 statute miles from the devices
Device Number of aircraft reported
All devices in a combined dataset 378
uAvionix PingUSB 366
Appareo Stratus 2 w/ external antenna 325
Sagetech Clarity 257
uAvionix PingBuddy 188
Aircraft reported with 15 statute miles from the devices
Device Number of aircraft reported
All devices in a combined dataset 329
uAvionix PingUSB 321
Appareo Stratus 2 w/ external antenna 279
Sagetech Clarity 231
uAvionix PingBuddy 178
Aircraft reported with 5 statute miles from the devices
Device Number of aircraft reported
All devices in a combined dataset 276
uAvionix PingUSB 271
Appareo Stratus 2 w/ external antenna 233
Sagetech Clarity 196
uAvionix PingBuddy 142
Aircraft reported with 1 statute miles from the devices
Device Number of aircraft reported
All devices in a combined dataset 206
uAvionix PingUSB 204
Appareo Stratus 2 w/ external antenna 164
Sagetech Clarity 147
uAvionix PingBuddy 86
From a range and reporting perspective, the uAvionix PingUSB had the best overall reporting
followed by the Appareo Stratus 2 and then the Sagetech Clarity. The uAvionix PingBuddy had
the shortest range and fewest reported tracks. It is unknown if any of the devices have limits on
the number of aircraft and/or reports that can be handled, although any device used for surveillance
should report all aircraft in proximity to the device and at least some reasonable operating area.

152
In an attempt to reduce the receiver and antenna sensitivity variation, the next level of analysis was
done on aircraft reporting within one statute mile ground radius from the devices. The expectation
being that aircraft in close proximity to any device should be received and reported. The last table
above listed the aircraft reported by each device in the one statue mile radius from the devices.
There was variability in the total aircraft reported. The PingUSB performed the best. The Stratus
and the Clarity were second and third with the PingBuddy a distant fourth.
The devices were located in proximity to Washington Dulles International Airport (KIAD) and
Leesburg Executive Airport (KJYO). 15 aircraft were reported in more than one contiguous time
period as well as multiple aircraft squawking 1200. For the purposes of this quick look report,
those aircraft were eliminated from the analysis.
The table below does a comparison between each pair of devices based on the number of aircraft
reported. Looking at each column, the values are how many more aircraft were reported by the
device in the column heading than by the device in each row heading. The percentage is the
percentage of aircraft received by the device in the column that were not received by the device in
the row divided by the total number of tracks received by the device in the column.
uAvionix
PingUSB
Appareo Stratus
2
Sagetech Clarity uAvionix
PingBuddy
uAvionix PingUSB - 1 (0.01%) 0 0
Appareo Stratus 2 38 (20%) - 6 (0.4%)
2 (0.03%)
Sagetech Clarity 54 (29%) 23 (15%) - 0
uAvionix
PingBuddy
112 (59%) 77 (51%) 58 (43%) -
None of the devices reported all the aircraft. The PingUSB did not report on only one aircraft
reported by the Stratus. The Stratus reported 23 aircraft the Clarity did not report but the Clarity
reported 6 aircraft the Stratus did not report. The PingBuddy reported significantly fewer aircraft
than all others, although it did report on two aircraft that the Stratus did not report. The PingBuddy
was the only device that did not report any aircraft further than 35 miles.
Although the study is not intended to assess the respective receiver and antenna performance, it
seems interesting that the two uAvionix devices provided the best and the worst reporting in this
initial study. Their receiver characteristics listed on the uAvionix website are the same. The
devices use a different antenna, as shown in the pictures above.

153
PingUSB Technical Specifications-Receiver
Specification Value
MTL 1090MHz –84dBm
Dynamic Range -81 to -0dBm
MTL 978MHz -93dBm
Dynamic Range -90 to -3dBm
PingBuddy Technical Specifications-Receiver
Specification Value
MTL 1090MHz –84dBm
Dynamic Range -81 to -0dBm
MTL 978MHz -93dBm
Dynamic Range -90 to -3dBm
Below is a table of more detailed reporting parameters. It is grouped into 4 sections. The first is
the overall aircraft count. The second is statistics about the number of reports received for each
aircraft. The third is statistics about the time period that reports were received for each aircraft.
The fourth is statistics about reporting intervals.

154
Overall uAvionix
PingUSB
Appareo
Stratus 2
Sagetech
Clarity
uAvionix
PingBuddy
Number of aircraft reported 190 189 152 135 77
Average number of reports
per aircraft reported
26.9 8.9 14.9 16.0
Median number of reports
per aircraft reported
19 7 11 10
Minimum number of reports
per aircraft reported
4 1 1 1
Maximum number of reports
per aircraft reported
138 50 93 102
Average time period of
reports per aircraft
41 sec 49 sec 33 sec 21 sec
Median time period of
reports per aircraft
34 sec 42 sec 29 sec 14 sec
Minimum time period of
reports per aircraft
3 sec 1 sec 1 sec 1 sec
Maximum time period of
reports per aircraft
4 min 34 sec 4 min 38 sec 4 min 21 sec 1 min 56 sec
Average time between
reports per aircraft
2 sec 7 sec 3 sec 1 sec
Median time between reports
per aircraft
2 sec 6 sec 2 sec 1 sec
Minimum time between
reports per aircraft
1 sec 1 sec 1 sec 1 sec
Maximum time between
reports per aircraft
5 sec 29 sec 18 sec 5 sec
There is variability in these parameters for each device. The performance ordering of the four
devices remains the same, except the Clarity generally reported more frequently than the Stratus
on the aircraft the Clarity received. The PingBuddy also reported more frequently than the other
three devices on the aircraft it did report, although it reported significantly fewer aircraft overall.
For a quick look to see if there was different reporting based on altitude, the two tables below
provide the same data from above for aircraft below 18000 feet and at or above 18000 feet altitude.
Although the ADS-B OUT frequency is not identified in all the feeds, these tables gives a high
level approximation for the guideline 1090 MHz and the 978 MHz operating altitudes.

155
Below 18000 feet altitude
Overall uAvionix
PingUSB
Appareo
Stratus 2
Sagetech
Clarity
uAvionix
PingBuddy
Number of aircraft reported 83 82 69 58 32
Average number of reports
per aircraft reported
30.1 10.0 14.0 16.3
Median number of reports
per aircraft reported
21.5 8 12.5 19
Minimum number of reports
per aircraft reported
4 1 1 1
Maximum number of reports
per aircraft reported
131 37 44 43
Average time period of
reports per aircraft
46 sec 52 sec 35 sec 20 sec
Median time period of
reports per aircraft
37 sec 47 sec 30 sec 20 sec
Minimum time period of
reports per aircraft
3 sec 4 sec 1 sec 1 sec
Maximum time period of
reports per aircraft
4 min 34 sec 4 min 38 sec 4 min 21 sec 0 min 52 sec
Average time between
reports per aircraft
2 sec 7 sec 3 sec 1 sec
Median time between reports
per aircraft
1 sec 6 sec 3 sec 1 sec
Minimum time between
reports per aircraft
1 sec 1 sec 1 sec 1 sec
Maximum time between
reports per aircraft
5 sec 25 sec 14 sec 5 sec
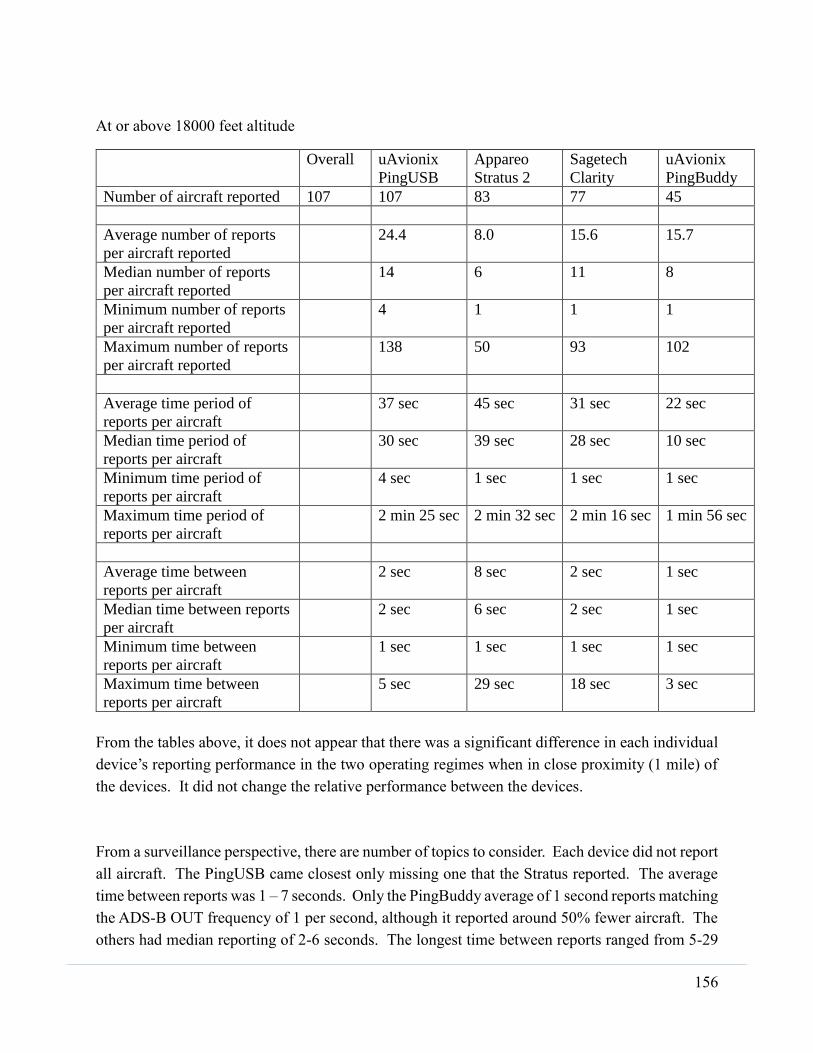
156
At or above 18000 feet altitude
Overall uAvionix
PingUSB
Appareo
Stratus 2
Sagetech
Clarity
uAvionix
PingBuddy
Number of aircraft reported 107 107 83 77 45
Average number of reports
per aircraft reported
24.4 8.0 15.6 15.7
Median number of reports
per aircraft reported
14 6 11 8
Minimum number of reports
per aircraft reported
4 1 1 1
Maximum number of reports
per aircraft reported
138 50 93 102
Average time period of
reports per aircraft
37 sec 45 sec 31 sec 22 sec
Median time period of
reports per aircraft
30 sec 39 sec 28 sec 10 sec
Minimum time period of
reports per aircraft
4 sec 1 sec 1 sec 1 sec
Maximum time period of
reports per aircraft
2 min 25 sec 2 min 32 sec 2 min 16 sec 1 min 56 sec
Average time between
reports per aircraft
2 sec 8 sec 2 sec 1 sec
Median time between reports
per aircraft
2 sec 6 sec 2 sec 1 sec
Minimum time between
reports per aircraft
1 sec 1 sec 1 sec 1 sec
Maximum time between
reports per aircraft
5 sec 29 sec 18 sec 3 sec
From the tables above, it does not appear that there was a significant difference in each individual
device’s reporting performance in the two operating regimes when in close proximity (1 mile) of
the devices. It did not change the relative performance between the devices.
From a surveillance perspective, there are number of topics to consider. Each device did not report
all aircraft. The PingUSB came closest only missing one that the Stratus reported. The average
time between reports was 1 – 7 seconds. Only the PingBuddy average of 1 second reports matching
the ADS-B OUT frequency of 1 per second, although it reported around 50% fewer aircraft. The
others had median reporting of 2-6 seconds. The longest time between reports ranged from 5-29

157
seconds. If this timing is confirmed in a more detailed study, that would need to be assessed in
terms of detect and avoid algorithms if they assume 1 second reporting of positions consistent with
the ADS-B OUT reporting requirements.
SUMMARY
This quick look analysis indicates that it would be valuable to perform a detailed study of ADS-B
IN devices. This initial study indicates there is potentially a significant variance in the aircraft
reported and the reporting frequency for the aircraft reports from different ADS-B IN devices.
It does indicate that ADS-B IN can provide valuable surveillance data. If a more rigorous follow-
up study confirms that there is significant variability in the aircraft reported and the reporting
intervals, the variability will need to be factored into surveillance metrics and detect and avoid
algorithms. Devices may need to meet a minimum capability threshold or be certified to be used
in surveillance applications.
158
10.5 APPENDIX E: LITERATURE REVIEW
ADS-B
1. Cook, E. (2015, August). ADS-B, Friend or Foe: ADS-B Message Authentication for
NextGen Aircraft. In High Performance Computing and Communications (HPCC),
2015 IEEE 7th International Symposium on Cyberspace Safety and Security (CSS),
2015 IEEE 12th International Conference on Embedded Software and Systems
(ICESS), 2015 IEEE 17th International Conference on (pp. 1256-1261). IEEE.
This paper outlines the lack of security measures in place within current ADS-B devices
to provide authenticity and integrity as well as presents a method for ADS-B message
authentication. A public key infrastructure to verify all ADS-B signals from FAA
registered aircraft that uses an asymmetric cryptography to exchange a session key to
validate data authenticity is suggested as a means of securing ADS-B devices in the NAS.
The evaluation of the current security issues that makes ADS-B open to spoofing as well
as a possible methodology to provide integrity and authenticity to ADS-B messages
provides insight into possible failure modes of ADS-B in terms of external spoofing.
2. Costin, A., & Francillon, A. (2012). Ghost in the Air (Traffic): On insecurity of ADS-
B protocol and practical attacks on ADS-B devices. Black Hat USA, 1-12.
This paper analyzes the security of ADS-B in regards to both passive (eavesdropping)
and active (message jamming) attacks on the system. By using a commercial off the shelf
software defined radio (SDR) to transmit attacker controlled messages to an ADS-B
receiver Costin, Andrei, and Francillon were able show various types and severities of
ADS-B attacks. This study outlines some of the fundamental architecture and design
problems of ADS-B that have not been addressed in prior security experiments in an
attempt to raise awareness to the liability of current ADS-B systems.
The results of this paper on ADS-B insecurity provides viable research into the
possibilities of ADS-B attacks as well as outlines some of the security concerns and
design flaws within the architecture of ADS-B. These flaws could provide useful to input
into the simulations to provoke system failures.
3. Jeon, D., Eun, Y., & Kim, H. (2015). Estimation fusion with radar and ADS-B for air
traffic surveillance. International Journal of Control, Automation and Systems, 13(2),
336-345.
This article presents a practical system for the estimation fusion with radar and ADS-B
for air traffic surveillance and control. Validation processes and methods are also
presented for ADS-B data which are dependent on individual aircraft. The simulation
159
results show that the current fusion system can provide a plausible solution within the
ATC environment.
The fusion of multiple sensors including ADS-B and radar provides insight into the future
of ATC management as well as possibilities for detect and avoid collaboration.
4. Kovell, B., Mellish, B., Newman, T., & Kajopaiye, O. (2012). Comparative analysis
of ADS-B verification techniques. The University of Colorado, Boulder, 4.
This paper analyzes Kalman Filtering and Group Validation techniques in order to
determine which provides a better verification method for ADS-B signals. In addition to
the verification analysis this paper outlines some of the key vulnerabilities within ADS-B
security.
Reviewing this paper provides a detailed look into ADS-B security vulnerabilities as well
as two proposed solutions.
5. Krozel, J., & Andrisani, D. (2005, September). Independent ADS-B verification and
validation. In AIAA Aviation, Technology, Integration, and Operations Conference
Proceedings (pp. 1-11).
The paper on Independent ADS-B Verification and Validation discusses both the
possibility of ADS-B being spoofed as well as the verification and validation techniques
used to analyze ADS-B systems to ensure continuous uninterrupted service in the NAS.
Two applications were addressed by this study, ADS-B in ground based applications
(used as a multilateration system) and airborne ADS-B applications.
This paper provides additional background on some of the faults and security questions
concerning ADS-B and its use in the NAS.
6. Lester, E. A. (2007). Benefits and incentives for ADS-B equipage in the national
airspace system (Doctoral dissertation, Massachusetts Institute of Technology).
This thesis presents research into the applications of ADS-B with the strongest benefit to
possible users. In order for ADS-B equipage to be universal and voluntary in some
sectors the benefits need to outweigh the cost. This research concludes that ADS-B
should be implemented in non-radar airspace as well as busy terminal areas.
A student at MIT presented this thesis in 2007 before the ADS-B equipage ruling was
released by the FAA. However, this research does highlight many of the benefits of ADS-
B equipage by outlining survey answers from various stakeholders
160
7. Li, T., Sun, Q., & Li, J. (2012, December). A Research on the Applicability of ADS-B
Data Links in Near Space Environment. In 2012 International Conference on
Connected Vehicles and Expo (ICCVE) (pp. 1-5). IEEE.
This paper focuses on the applicability of ADS-B data links in a near space environment.
The study simulated the channel transmission performance of both 1090 MHz and UAT
data links with a High Altitude Performance System (HAPS) as well as analyzed the
simulation results in terms of path loss, signal to noise ratio, and bit error rate. The paper
concludes that both 1090 MHz and UAT data links are applicable and that aircraft in
high-altitude the performance is better than in a ground environment.
The simulations run in this study provide a framework of understanding for future
simulations as well as an additional metric for ADS-B applicability.
8. Martel, F., Schultz, R. R., Semke, W. H., Wang, Z., & Czarnomski, M. (2009, April).
Unmanned aircraft systems sense and avoid avionics utilizing ADS-B transceiver.
In AIAA Infotech@ Aerospace Conference (pp. 6-9).
In a study done by the University of North Dakota, the results of modeling collision
avoidance algorithms using ADS-B derived information within a software-in-the-loop
(SWIL) environment were tested. Simulated flights were conducted in an SWIL
environment with an ADS-B equipped simulated aircraft. The results found a preliminary
validation of the detect and avoid algorithms for ADS-B.
This study outlines an earlier attempt to evaluate the safety criticality of ADS-B equipage
on unmanned aircraft systems. This paper indicates the need for future work with
hardware-in-the-system testing within a Monte Carlo simulation. The future work of this
paper is very similar to how the problem is being approached by the ASSURE A6 team.
9. Mozdzanowska, A., Weibel, R., Marais, K., Lester, E., Weigel, A., & Hansman, R. J.
(2007). Dynamics of Air Transportation System Transition and Implications for
ADS-B Equipage, 7th AIAA Aviation Technology. In Integration and Operations
Conference (ATIO), Belfast, Northern Ireland.
This paper uses a feedback model to describe the stakeholder barriers to ADS-B
integration as well discusses ensuring a efficient safety approval and certification process
for the implementation of ADS-B. Additionally the criticality levels and the target level
of safety of ADS-B are addressed by this paper in that by increasing the desired
application of ADS-B in the NAS, increased standards and criticality levels may be
necessary to validate equipage.
161
10. Orefice, M., Di Vito, V., Corraro, F., Fasano, G., & Accardo, D. (2014, May). Aircraft
conflict detection based on ADS-B surveillance data. In Metrology for Aerospace
(MetroAeroSpace), 2014 IEEE (pp. 277-282). IEEE.
This paper focuses on the application of ADS-B surveillance data as inputs for conflict
detection algorithms, in order to support future self-separation as well as collision
avoidance systems. The architecture and the main implemented software modules of the
proposed conflict detection system are outlined in the paper and it is concluded that the
intended system is applicable for both manned and unmanned aircraft systems.
The work outlined in this paper provides an avenue for future testing of ADS-B IN using
real world surveillance data to validate the results obtained. This is meaningful to
ASSURE in that it provides a possible method to determine ADS-B design assurance.
11. Pourvoyeur, K., & Heidger, R. (2014, September). Secure ADS-B usage in ATC
tracking. In Digital Communications-Enhanced Surveillance of Aircraft and Vehicles
(TIWDC/ESAV), 2014 Tyrrhenian International Workshop on(pp. 35-40). IEEE.
This paper discusses the safety of ADS-B data for ATC purposes and concludes that
current security is not sufficient to rely on the accuracy information provided from ADS-
B. Furthermore this paper concludes that the usage of ADS-B can be made safe and
reliable if proper security mechanisms are set in place. For example, this paper
specifically shows the usage of the PHOENIX multi sensor data fusion system provides
increased security layers for ADS-B.
12. Powell, J. D., Jennings, C., & Holforty, W. (2005, November). Use of ADS-B and
perspective displays to enhance airport capacity. In 24th Digital Avionics Systems
Conference (Vol. 1, pp. 4-D). IEEE.
This study outlines research done to show the use of ADS-B to reduce the impact from
wake vortex turbulence in parallel runway spacing. The reduction of wake vortex
turbulence from ADS-B could decrease the necessary airport spacing and as such increase
the capacity of airports without increasing the land area.
Overall this study provided a solid example on the possible use of ADS-B to increase
safety in the NAS as well as provided some of the complications faced in mass
implementation of ADS-B.
13. Strohmeier, M., Schafer, M., Lenders, V., & Martinovic, I. (2014). Realities and
challenges of nextgen air traffic management: the case of ADS-B. IEEE
Communications Magazine, 52(5), 111-118.

162
This article discusses important issues with the current state of ADS-B (as of 2014) by
evaluating reports from the OpenSky network in Central Europe. Using OpenSky the
1090 MHz communication channel of ADS-B is analyzed to understand the current state
of its behavior under the increasing traffic loads. Additionally the article considers some
of the security challenges faced by ADS-B. From looking into reports from central
Europe commercial aviation, two primary concerns dealing with ADS-B were noticed.
The first being the serious message loss caused by increased traffic loads on the 1090
MHz channel and the open security concerns caused by cheap and easy availability of
software radios.
Overall this article was helpful in understanding some of the design flaws inherent in
current ADS-B systems as well as providing a framework of analysis done on sense and
avoid system currently in use throughout commercial aircraft in central Europe.
14. Ali, B. S., Ochieng, W., Majumdar, A., Schuster, W., & Chiew, T. K. (2014). ADS-B
system failure modes and models. The Journal of Navigation, 67(6), 995.
This paper outlines the high level failure modes and models of an ADS-B system.
Specifically the paper identifies the failure modes associated with ADS-B out from
avionics, ADS-B out from ground station, ADS-B in, human error, and environmental
effects. The descriptions of each failure mode are outlined as well as their impacts on
ATC operations and aircraft navigation. Finally potential mitigation for each failure mode
is presented.
This study is critical for the design assurance of ADS-B systems as they pertain to UAS
and will be used to develop bow-tie analysis of an ADS-B system to run through a Monte
Carlo simulation.
15. Lin, Y., & Saripalli, S. (2015, May). Sense and avoid for Unmanned Aerial Vehicles
using ADS-B. In 2015 IEEE International Conference on Robotics and Automation
(ICRA) (pp. 6402-6407). IEEE.
This paper outlines the experimental testing and development of a path planning
algorithm for UAV collision avoidance. The testing was done in a software-in-the-loop
system in which the UAV was able to avoid collisions with aircraft of different numbers,
speeds, and approaching directions.
The experimentation on SITL collision avoidance as well as the development of an path
planning algorithm for UAV collision avoidance provides framework for future
verification and validation of ADS-B systems as equipped on hardware enabled UAV’s.

163
16. Zeitlin, D., Hammer, J., Cieplak, J., & Olmos, B. O. (1998, December). Achieving
early CDTI capability with ADS-B. In USA/Europe ATM R&D Seminar.
The paper on the early Cockpit Display of Traffic Information (CDTI) with ADS-B is an
early study on the necessary technical requirements, developmental work, and standards
for ADS-B. This study is an overview of some of the initial work done by RTCA SC-186
and discusses the initial standard developed called the MASPS. In this study MITRE used
a simulation test bed focused on a generic mid-fidelity transport aircraft on approach to
Seattle-Tacoma International Airport.
Reviewing the earlier work done by MITRE and RTCA SC-186 gives insight into the
historical attempts to classify the design assurance level of ADS-B for widespread use in
manned aircraft; however, as this study does not concern unmanned aircraft and because
it deals with airports it is not relevant to the current study other than gaining historical
perspective.
17. Kexi, Z., Jun, Z., & Xuejun, Z. (2010, August). Research on ADS-B geometric height
information for height keeping performance surveillance. In 2010 3rd International
Conference on Advanced Computer Theory and Engineering (ICACTE) (Vol. 2, pp.
V2-328). IEEE.
This study analyzes the feasibility of ADS-B (both UAT and 1090) geometric altitude
data meeting the requirement for altitude keeping performance surveillance. In order to
properly maintain altitude levels in controlled airspace the Air Traffic Controller must
receive accurate altitude readings from ADS-B. This study provides analysis on the
precision of ADS-B for altitude surveillance.
Analyzing the precision of altitude accuracy in ADS-B systems provides an example of a
possible failure mode in detect and avoid systems as well as improves understanding of
ADS-B function.
DAA Algorithm Development
1. Kochenderfer, M. J., Chryssanthacopoulos, J. P., Kaelbling, L. P., & Lozano-Pérez,
T. (2010). Model-based optimization of airborne collision avoidance logic (No. ATC-
360). MASSACHUSETTS INST OF TECH LEXINGTON LINCOLN LAB.
A project report illustrates the development of a particular conflict resolution Algorithm
and establishes connection with existing model-based optimization.

164
2. Munoz, C., Narkawicz, A., & Chamberlain, J. (2013, August). A TCAS-II resolution
advisory detection algorithm. In Proceedings of the AIAA Guidance Navigation, and
Control Conference and Exhibit.
The paper represents the development of mathematical model of TCAS II RA logic and
the design of RA detection algorithm. The algorithm can also be used for TA resolution as
TCAS II logic for traffic advisories and the logic for resolution advisories mainly differ
in the values of the time and distance threshold parameters and the use of a horizontal
miss distance filter. This RA detection algorithm proposed in this paper is a fundamental
component of a NASA sense and avoid concept for the integration of Unmanned Aircraft
Systems in civil airspace.
Evaluation Standards
1. Airborne Collision Avoidance System (ACAS) Manual. 1st ed. Montréal:
International Civil Aviation Organization, 2006. International Civil Aviation
Organization, 2006. Web. 10 Apr. 2016.
This manual was developed by the Surveillance and Conflict Resolution Systems Panel.
The guide provides a detailed description of ACAS and associated technical and
operational issues to facilitate proper operation and monitoring.
2. Air Traffic Organization, “Safety Management System”, 2014
This document provided a wide range of information on hazard identification techniques
and safety level descriptions. It gives a base of set of processes that allow for a
disciplined approach to failure mode evaluations such as the task of A6. Additionally, it
provides a set of definitions of criticalities and begins to define likelihoods of specific
events. This wealth of knowledge will serve as a general base that can be molded and
adjusted appropriately for the case of TCAS and ADS-B failure analysis. It was
especially important to find prior work from a reputable source that could spell out this
framework and provide direction, as well as help identify a repeatable process for
extension to future, similar, research.
3. RTCA, D. (2011). Minimum Operational Performance Standards for 1090 MHz
Extended Squitter Automatic Dependent Surveillance–Broadcast (ADS-B) and
Traffic Information Services–Broadcast (TIS-B). DO-260B with Corrigendum, 1(1),
1365-1372.
The MOPS for 1090 MHz Extended Squitter ADS-B and TIS-B were outlined with great
detail. The document was prepared by RTCA.
165
4. DO, R. (1983). Minimum Operational Performance Standards for Air Traffic Control
Radar Beacon System/mode Select (ATCRBS/modes) Airborne Equipment. Radio
Technical Commission for Aeronautics.
The MOPS for ATCRBS and Mode S equipment were outlined in this document. The
document was prepared by RTCA.
5. SC-228. "Detect and Avoid (DAA) Minimum Operational Performance Standards
(MOPS) for Verification and Validation." RTCA, Inc., 24 Nov. 2015. Web. 15 Feb.
2016.
This is a draft which establishes Minimum Operational Performance Standards for
verification and validation of UAS DAA equipment in the specified Operational
Environment. The document was prepared by RTCA.
Past DAA Analysis
1. Billingsley, T. B. (2006). Safety analysis of TCAS on Global Hawk using airspace
encounter models. MASSACHUSETTS INST OF TECH CAMBRIDGE DEPT OF
AERONAUTICS AND ASTRONAUTICS.
TCAS collision avoidance effectiveness was evaluated on the U.S Air Force’s RQ-4
Global Hawk using a fast-time simulation tool at MIT Lincoln laboratory. The risk ratio
was determined comparing Global Hawks with and without TCAS. Encounter models
reflecting the Global hawk’s actual performance were also developed.
2. Galati, G., Leonardi, M., Mantilla-Gaviria, I. A., & Tosti, M. (2012). Lower bounds
of accuracy for enhanced mode-S distributed sensor networks. IET Radar, Sonar &
Navigation, 6(3), 190-201.
A study was done to analyze the accuracy of passive location systems using the Cramer-
Rao lower bound (CRLB). The focus was on sensor networks derived from
Multilateration systems. The CRLB was used to define basic limitations and advantages
of different architectures, as well as optimizing certain architectures by adding new
measurement capabilities.
3. Haissig, Christine, and Eric Euteneuer. "ADS-B Position Validation Criteria Using
TCAS or Radar for UAS Detect and Avoid." N.p., n.d. Web. 01 Mar. 2016.
This paper justified the proposed position validation criteria to enable the use of ADS-B
position data for UAS Detect and Avoid (DAA). Position validation can be done with
active TCAS data or with DAA on-board radar.
166
4. Kochenderfer, M. J., Holland, J. E., & Chryssanthacopoulos, J. P. (2012). Next
generation airborne collision avoidance system. Lincoln Laboratory Journal, 19(1),
17-33.
The Traffic Alert and Collision Avoidance System (TCAS) is mandated worldwide in all
large aircraft. Major changes to the airspace are planned over the coming years. Lincoln
Laboratories has been developing a new approach to collision avoidance which is
outlined in this paper.
5. Kuchar, J. E., & Drumm, A. C. (2007). The traffic alert and collision avoidance
system. Lincoln Laboratory Journal, 16(2), 277.
This paper deals with RA reversal problems with an example of accident. It also
discusses possible solutions and future corrections for the RA reversal issue.
6. Kuchar, J. (2006). Update on the analysis of ACAS performance on Global
Hawk. Aeronautical Surveillance Panel, International Civil Aviation Organization
(ICAO), SCRSP WG A/WP A10-04, Montreal, 1-5.
UAV airspace encounter models have been developed, along with fast-time Monte Carlos
simulations during the encounters. ACAS performance was examined comparing
conventional aircraft vs. conventional aircraft, conventional aircraft vs. non-ACAS
Global Hawks, and conventional aircraft vs. ACAS-equipped Global Hawks.
7. Hottman, S. B., Hansen, K. R., & Berry, M. (2009). Literature review on detect,
sense, and avoid technology for unmanned aircraft systems.
This review paper elaborates different types of detect, sense and avoidance technologies
over past years, discusses the present situations and recommendations for future
developments.
8. Strohmeier, M., Schafer, M., Lenders, V., & Martinovic, I. (2014). Realities and
challenges of nextgen air traffic management: the case of ADS-B. IEEE
Communications Magazine, 52(5), 111-118.
Important issues regarding ADS-B are discussed. Researchers used the OpenSky sensor
network to analyze the current state and behavior under increased traffic load. Security
challenges with ADS-B are also visited, with recommendations for the future.
9. Temizer, S., Kochenderfer, M. J., Kaelbling, L. P., Lozano-Perez, T., & Kuchar, J. K.
(2009). Unmanned Aircraft Collision Avoidance Using Partially Observable Markov
Decision Processes.
This paper investigated the use of an automatic collision avoidance logic given
information such as: aircraft dynamics, sensor performance, and intruder behavior.

167
Developing this logic will prevent custom making every collision avoidance algorithm by
hand for every aircraft and sensor combination. Using a partially-observable Markov
decision process (POMDP), a generic POMDP solver can be used to create a generic
avoidance strategy.
10. Zeitlin, A., & McLaughlin, M. (2006). Modeling for UAS collision avoidance. AUVSI
Unmanned Systems North America, Orlando.
Several methods and tools are discussed for modeling and evaluating the safety of
collision for manned aircraft. The problem with applying these methodologies to
unmanned aircraft is also discussed.
TCAS/ACAS
1. Asmar, D. M. (2013). Airborne collision avoidance in mixed equipage
environments (Doctoral dissertation, Massachusetts Institute of Technology).
This thesis looks at recent research on coordination, interoperability, and multiple threat
encounters. This paper investigates different methods to extend ACAS X beyond single
unequipped intruders to coordinated encounter and multiple equipped intruders.
This research provides insight into future avoidance system equipage as well as the
extended capabilities of ACAS X. Overall this paper could lend a framework for TCAS
testing and simulation.
2. Bai, H., Hsu, D., Kochenderfer, M. J., & Lee, W. S. (2012). Unmanned aircraft
collision avoidance using continuous-state POMDPs. Robotics: Science and Systems
VII, 1.
This paper discusses the modeling of unmanned aircraft collision avoidance and
generated the threat resolution logic by solving the developed models in a Monte Carlo
Iteration. Simulation results showed that the continuous state models developed reduced
the risk of collision by up to seventy times.
The analysis of the paper provides an example of a Monte Carlo simulation run with
TCAS architecture. This could provide a framework for future TCAS simulation.
3. "Planning, J. (2007). Concept of operations for the next generation air
transportation system.
This version of the ConOps provides an overall, integrated view of NextGen operations
for the 2025 time-frame, including key transformations from today’s operations.

168
4. De, D., & Chattoraj, N. (2014, March). A review: Theoretical analysis of TCAS
antenna: Traffic collision avoidance system for aircrafts. In Green Computing
Communication and Electrical Engineering (ICGCCEE), 2014 International
Conference on (pp. 1-7). IEEE.
This paper describes a theoretical model of a TCAS antenna installed on an aircraft. The
theoretical analysis was developed to study the overall effect on the aircraft due to the
performance of TCAS antenna. This paper also contains a new proposed idea for a TCAS
antenna which might be more beneficial than the existing system.
By analyzing a TCAS antenna to determine the overall effect on an aircraft it provides an
example of a possible failure mode on a system as well as an understanding of the
structure of a TCAS platform.
5. Gariel, M., Kunzi, F., & Hansman, R. J. (2011, October). An algorithm for conflict
detection in dense traffic using ADS-B. In Digital Avionics Systems Conference
(DASC), 2011 IEEE/AIAA 30th (pp. 4E3-1). IEEE.
This paper presented a novel algorithm for traffic situation awareness with alerts. The
algorithm alerts pilots of potential incoming collision or hazardous situations. The
algorithm uses a constant turn trajectory prediction. This trajectory prediction
outperforms the classic constant velocity propagation.
6. Gottstein, J., & Form, P. (2008, September). ACAS-monitoring of 1 000 000 flight
hours in the North German Airspace. In Digital Communications-Enhanced
Surveillance of Aircraft and Vehicles, 2008. TIWDC/ESAV 2008. Tyrrhenian
International Workshop on (pp. 1-6). IEEE.
This paper discusses a developed ACAS Monitor Station which receives 1030/1090 MHz
Secondary Surveillance Radar and ACAS Communications. The monitoring software
keeps track of the status of all Mode S-Aircraft in range and automatically compiles
reports on Resolution Advisories by ACAS in the North German Airspace. This paper
indicates that over twelve months of continuous recordings covered more than 1 000 000
flight hours of ACAS-Equipped Aircraft were recorded. On average one ACAS indicated
collision threat was reported per day. The analysis also showed that only 6 of 7
Resolution Advisories were followed by proper escape maneuvers.
This study of ACAS flight hours in Northern Germany provides valuable real world data
on the average number of threats and the percentage of pilot error in following escape
maneuvers.

169
7. Holland, J. E., Kochenderfer, M. J., & Olson, W. A. (2014). Optimizing the next
generation collision avoidance system for safe, suitable, and acceptable operational
performance. Air Traffic Control Quarterly, 36.
This paper summarizes a fifteen month study on iteratively tuning ACAS X in order to
meet operational suitability and pilot acceptability performance metrics. The tuning
process reduced the operational impact on the air traffic system and improved the
acceptability of alerts. This paper demonstrates the safer logic that is more operationally
suitable than currently existing TCAS.
8. Horio, B., DeCicco, A., & Hemm, R. (2012, April). Safety risk assessment case study
using Airspace Conflict Analysis Simulation. In Integrated Communications,
Navigation and Surveillance Conference (ICNS), 2012 (pp. D2-1). IEEE.
This paper presents a case study describing how the ACAS tool was recently used for a
safety risk assessment, by determining the probability of conflict, and the resulting
implications for estimating separation assurance risk. Additionally to the case study, the
paper discusses the current capacity of the ACAS framework as well as the integration of
UAS into the NAS.
Overall the safety risk assessment provides valuable insight into the risk of an ACAS
system. Integration of UAS into the NAS is a critical factor in this project and as just the
application of future research into integration is valuable.
9. "Introduction to TCAS II Version 7.1." (n.d.): 1-50. FAA.gov. Federal Aviation
Administration, 28 Feb. 2011. Web. 28 Feb. 2016.
This booklet describes different early avoidance systems, TCAS evolution, its
components and functions. It also includes collision avoidance concepts, CAS logic
functions, performance monitoring of the system.
10. Jeannin, J. B., Ghorbal, K., Kouskoulas, Y., Gardner, R., Schmidt, A., Zawadzki, E.,
& Platzer, A. (2015, April). A formally verified hybrid system for the next-generation
airborne collision avoidance system. In International Conference on Tools and
Algorithms for the Construction and Analysis of Systems (pp. 21-36). Springer Berlin
Heidelberg.
This paper discusses the development of a general strategy for analyzing the safety of real
world collision avoidance systems as they apply to “TCAS X”. This strategy identifies
conditions on resolution advisories that have been proved to keep the aircraft clear of
NMAC as well as identifying discrete states where TCAS X is provably safe.
170
This analysis of a next generation detect and avoid system provides insight into the future
of TCAS equipage as well as understanding of intruder “safe region” formulations.
11. Kochenderfer, M. J., Chryssanthacopoulos, J. P., & Weibel, R. E. (2012). A new
approach for designing safer collision avoidance systems. Air Traffic Control
Quarterly, 20(1), 27.
This paper has summarized ongoing work exploring a new approach to derive airborne
collision avoidance logic from new encounter models and performance metrics.
Experiments demonstrated that the approach outlined in this paper have the potential to
improve safety and reduce the rate of unnecessary alerts. The approach focuses on human
effort in building models and deciding on performance metrics and using computers to
optimize the logic.
This past detect and avoid analysis provides insight into how TCAS has been evaluated in
the past as well as the standards and performance of TCAS architecture.
12. Pritchett, A., Haga, R., & Thakkar, D. (2014, October). Pilot responses to traffic
events during NextGen high traffic density terminal operations. In 2014 IEEE/AIAA
33rd Digital Avionics Systems Conference (DASC) (pp. 2C4-1). IEEE.
This work evaluates pilot responses to TCAS Resolution Advisories (RA) during
NextGen operations, such as Advanced Flightdeck Interval Management (AFIM), which
couple an aircraft's autoflight system to the flight path of another aircraft via ADS-B In
information. Additionally, this paper examines the pilot's ability to both maintain an
interval and re-establish it after a TCAS resolution advisory (RA) involving either the
pilot's own aircraft or the lead aircraft.
While this paper focuses primarily on high traffic terminal operations as well as pilot
error in responding to resolution advisories, it gives insight into how a UAV pilot might
need to react in order to achieve a similar level of assurance as a manned flight.
13. Sahawneh, L. R., Mackie, J., Spencer, J., Beard, R. W., & Warnick, K. F. (2015).
Airborne radar-based collision detection and risk estimation for small unmanned
aircraft systems. Journal of Aerospace Information Systems, 12(12), 756-766.
In this paper, an innovative approach is presented to quantify likely intruder trajectories
and estimate the probability of collision risk for a pair of aircraft flying at the same
altitude and in close proximity given the state estimates provided by an airborne radar
sensor. The proposed approach is formulated in a probabilistic framework using the
reachable set concept and the statistical data contained in the uncorrelated encounter
model developed by Lincoln Laboratory, Massachusetts Institute of Technology. Monte-

171
Carlo-based simulation is used to evaluate and compare the performance of the proposed
approach with linearly extrapolated collision-detection logic.
14. Smith, K. A., Kochenderfer, M. J., Olson, W. A., & Vela, A. E. (2013). Collision
avoidance system optimization for closely spaced parallel operations through
surrogate modeling. In AIAA Guidance, Navigation, and Control Conference.
This paper describes the application of surrogate modeling and automated search for the
purpose of tuning ACAS X for parallel operations. The performance of the tuned system
is assessed using an operational performance model. The tuning of ACAS X using
surrogate modeling was an efficient way to tune the system in that the tuned logic
outperforms TCAS in terms of both safety and operational suitability.
The thesis written Kyle Smith provides insight into the optimization logic of the future of
avoidance systems as well as a solid overview of the currently equipped TCAS platform.
15. Smith, N. E., Cobb, R. G., Pierce, S. J., & Raska, V. M. (2013, August). Optimal
collision avoidance trajectories for unmanned/remotely piloted aircraft.
In Proceedings of the AIAA Guidance, Navigation, and Control Conference (GNC'13).
This paper describes the optimal control problem associated with sense and avoid and
uses a direct orthogonal colocation method to solve this problem and then analyzes these
results in order to determine collision avoidance scenarios. The goal of this paper is
twofold, determine the best technique for calculating the best avoidance trajectories and
determine the best technique for estimating and intruder aircraft’s trajectory.
16. Volovoi, V., Balueva, A., & Vega, R. V. (2013). Analytical risk model for automated
collision avoidance systems. Journal of Guidance, Control, and Dynamics, 37(1), 359-
363.
This method discusses an analytical procedure for evaluating the reliability of several
layers of collision avoidance systems. Instead of using a Monte Carlo simulation and
analytical approach is taken in order to increase computational efficiency and precision as
well as increase transparency of the contributing risk factors.
This paper gives a past example of an avoidance system using an analytical model instead
of a Monte Carlo model. This could provide insight into a possible alternative method of
sense and avoid simulation and experimentation.
Well Clear Definition
172
1. Johnson, M., Mueller, E. R., & Santiago, C. (2015, June). Characteristics of a Well
Clear Definition and Alerting Criteria for Encounters between UAS and Manned
Aircraft in Class E Airspace. In Eleventh UAS/Europe Air Traffic Management
Research and Development Seminar (pp. 23-26).
The study considers three well clear definitions and presents the relative state conditions
of intruder aircraft as they encroach upon the well clear boundary in a particular airspace
class E. It also shows the definition of the alerting criteria needed to inform the UAS
operator of a potential loss of well clear in that airspace.
2. Lee, S. M., Park, C., Johnson, M. A., & Mueller, E. R. (2013, August). Investigating
Effects of “Well Clear” Definitions on UAS Sense-And-Avoid Operations.
In Proceedings of the 14th AIAA Aviation Technology, Integration, and Operations
(ATIO) Conference, no. AIAA-2013-4308,(Los Angeles, California, USA).
This paper investigates the effects that different well-clear metrics have on the rate of
well-clear violations and evaluates the distribution of distances between aircraft at a well
clear violation in high-altitude enroute airspace.
Updated Literature Review Documents
1. Circular, F.A. 20-165B, “. Airworthiness Approval of Automatic Dependent
Surveillance – Broadcast (ADS-B) Out Systems.
This Advisory Circular provided an overview of the installation requirements for ADS-B
out in aircraft. Specifically it provides clear insight into some of the required performance
characteristics of ADS-B as well as a system overview. The performance requirements of
ADS-B were useful in creating and building a preliminary hazard assessment of a DAA
system with ADS-B out included.
2. Circular, F. A. 23.1309-1E, “. Equipment, Systems, and Installation in Part, 23.
This advisory circular detailed a functional hazard assessment for 14 CFR Part 23 IFR
Aircraft. Additionally it provided an appendix of aircraft functions and their associated
classification of failure condition. This was used to inform the failure tree for the
preliminary hazard assessment as well as verify the failure classifications provided by
various TSO’s. Finally, this advisory circular provided the failure classification of the
altimeter system and radio altimeter, both of which were necessary for the preliminary
hazard assessment.

173
3. Circular, F.A. 43-6C, “. Altitude Reporting Equipment and Transponder System
Maintenance and Inspection Practices.
This advisory circular mainly points to several key TSO’s for the altimeter and ADS-B
systems. The acknowledgement of the TSO’s for altimeter and ADS-B systems led to
failure classifications of several important DAA components.
4. Radio Technical Commission for Aeronautics, Washington, DC Special Committee
135. (1990). Environmental Conditions and Test Procedures for Airborne Equipment.
Radio Technical Commission for Aeronautics.
RTCA published this document to provide a set of standards for the environmental test
procedures for Airborne Equipment. These standards provide a sense of the overall
performance standards for all airborne equipment. By having the test procedures for all
airborne equipment outlined in this DO, it was possible to understand how detect and
avoid equipment needed to function in order to pass the environmental testing. Overall,
this RTCA paper provided insight into the functioning of detect and avoid systems as well
as the design assurance levels.
5. DO, R. (2011). 178C. Software Considerations in Airborne Systems and Equipment
Certification. Radio Technical Commission for Aeronautics.
This document published by RTCA outlines the design standards for software used in
airborne systems. The rapid increase in the use of software in airborne systems required a
standard for software development and implantation. This document provides the
necessary airworthiness process for software. In particular this document gives the
descriptions of the failure condition categories for software failure in airborne systems.
The descriptions outline the worst case outcome for each failure category from
Catastrophic to No Safety Effect.
6. DO, R. (2011). Minimum Operational Performance Standards for Air Traffic Control
Radar Beacon System/mode Select (ATCRBS/modes) Airborne Equipment. Radio
Technical Commission for Aeronautics.
The MOPS for ATCRBS/Mode S outlines the performance standards of both commonly
used transponder systems. These performance standards were critical in developing the
failure modes of Mode S transponders as well as how the system performs in typical use
cases. This document in particular was helpful in determining the specifics of how Mode
S transponders work and interact with other detect and avoid systems. DO-181E outlines
174
everything from system performance to data link communications and the specifics of
Mode S transponder messaging.
7. DO, R. (2008), Minimum Operational Performance Standards for Traffic Collision
Avoidance System II (TCAS II). Radio Technical Commission for Aeronautics.
Traffic Collision Avoidance System (TCAS) is outlined completely in this document by
RTCA. The minimum performance standards of TCAS were used to develop the failure
modes and characteristics of TCAS. Overall the MOPS gave enough information to
understand TCAS on a system level. Particularly the information regarding how the
TCAS unit handles transponder failures as well as transponder misleading information
was useful for the preliminary hazard assessment. Additionally the system overview and
performance characteristics provided an understanding of the overall TCAS equipment.
8. DO, R. (2004), Minimum Aviation System Performance Standards for Automatic
Dependent Surveillance Broadcast (ADS-B). Radio Technical Commission for
Aeronautics.
The minimum aviation system performance standards (MASPS) for ADS-B specify
operational characteristics that help designers and users gather an understanding of the
aviation standards associated with ADS-B. This document provides a view of the system-
wide operational use of ADS-B, but does not describe a specific technical implementation
or design architecture meeting the operational and technical characteristics. Overall this
document was useful in determining the operational use cases for ADS-B as well as the
failure conditions.
9. DO, R. (2000), Design Assurance Guidance for Airborne Electronic Hardware. Radio
Technical Commission for Aeronautics.
This RTCA document provided guidelines to the failure condition classifications for
electronic hardware. The failure conditions were outlined and described according to how
the failure would affect the system as whole as well as what the failure would mean for
the continued operation of an aircraft. The description of the failure conditions provided
insight on how to classify the failures researched in the preliminary hazard assessment.
10. DO, R. (2011), Minimum Operational Performance Standards (MOPS) for 1090 MHz
Extended Squitter Automatic Dependent Surveillance – Broadcast (ADS-B) and Traffic
Information Services – Broadcast (TIS-B). Radio Technical Commission of
Aeronautics.
11.

175
The ADS-B 1090 MHz Extended Squitter MOPS outlined the specific performance
standards of Extended Squitter ADS-B as compared to UAT ADS-B. In particular this
document discussed how a Mode S transponder works with ADS-B as well as the
specifics of GPS NIC, NAC, and SIL together with ADS-B. As 1090 ES ADS-B was the
primary ADS-B system analyzed, this document was useful in determining how 1090 ES
works as well as how it works with other systems necessary for detect and avoid.
12. DO, R. (2011), Minimum Operational Performance Standards (MOPS) for Universal
Access Transceiver (UAT) Automatic Dependent Surveillance Broadcast (ADS-B).
Radio Technical Commission of Aeronautics.
The MOPS for UAT ADS-B provided details on the working and performance standards
of Universal Access Transceiver ADS-B. UAT is a multi-purpose aeronautical data link
intended to support not only ADS-B but also Flight Information Service – Broadcast
(FIS-B), and Traffic Information Service – Broadcast (TIS-B), and if required in the
future, supplementary ranging and positioning capabilities. Overall this document was
useful in outlining how UAT ADS-B, FIS-B, and TIS-B function together in the national
airspace.
13. DO, R. (2003), Minimum Aviation System Performance Standards for Aircraft
Surveillance Applications (ASA). Radio Technical Commission of Aeronautics.
This paper provided several examples of fault trees and how they can be used in a
preliminary hazard assessment. In particular Appendix C of this paper gives multiple
fault tree examples for collisions under VFR conditions in the national airspace. These
failure trees given in this paper provided example for designing the failures of the detect
and avoid system as well as an indication of how to connect each failure into an
overarching tree. Finally DO-289 gave insight into developing an operational hazards
chart and how to present hazards, safety concerns, and mitigations from a failure tree.
14. DO, R. (2014), Minimum Operational Performance Standards (MOPS) for Aircraft
Surveillance Applications (ASA) System. Radio Technical Commission of
Aeronautics.
The MOPS for the ASA System contains requirements for processing, control and display
of traffic and ownship information for use by flight crews in performing airborne
applications. In particular, this document takes a look into the math behind developing
performance standards for ASA systems. It was useful to see how the Aircraft
Surveillance Applications System works and how that can be modeled similarly to a
detect and avoid system.

176
15. DO, R. (2014), Safety, Performance and Interoperability Requirement Document for
Traffic Situation Awareness with Alerts (TSAA). Radio Technical Commission of
Aeronautics.
This document defines and allocates the set of minimum requirement for the end-to-end
operational, safety, performance, and interoperability aspects for implementation of the
TSAA application. In addition this document provides guidance to determine the levels of
design assurance and performance that are needed for each element (aircraft, operator,
and Air Navigation Service Provider to support the TSAA application. DO-348 was
useful in providing additional examples of fault trees and an in depth preliminary hazard
assessment for the TSAA application. These examples provided an opportunity to learn
about failure tree as well as reference to determine content and structure.
16. "Introduction to TCAS II Version 7.1." (n.d.): 1-50. FAA.gov. Federal Aviation
Administration, 28 Feb. 2011. Web. 28 Feb. 2016.
This document describes different early avoidance systems, TCAS evolution, its
components and functions. It also includes collision avoidance concepts, CAS logic
functions, performance monitoring of the system. Primarily this paper was used to
determine the overall performance of TCAS as well as the system level components and
architecture involved with the TCAS system. In particular it was useful to determine how
the individual components of TCAS affect the performance of the system. The document
goes through and outlines how TCAS responds to incorrect data and system level
failures.
17. TCAS on UAS Team. “Evaluation of Candidate Functions for Traffic Alert and
Collision Avoidance System II (TCAS II) On Unmanned Aircraft Systems (UAS).”
FAA Aviation Safety (2011): n. pag. Web.
This paper provided a baseline for the preliminary hazard assessment performed on detect
and avoid system for unmanned aircraft. The system level hazard approach was helpful in
determining the approach and development of the analyzing detect and avoid systems. In
particular the risk assessment and hazard assessment for the Traffic Alert and Collision
Avoidance System was helpful by providing a baseline for the analysis. Additionally this
paper provided a template to follow in the writing of the final report.
18. Kuchar, J. E., & Drumm, A. C. (2007). The traffic alert and collision avoidance
system. Lincoln Laboratory Journal, 16(2), 277.

177
This paper discusses the Traffic Alert and Collision Avoidance System and how is has been
a success in reducing the risk of mid-air collisions. Additionally this paper looks at the
previous data from TCAS implemented systems around the world in an attempt to
determine how the algorithms could be improved as well as how the entire system could
be improved. The paper also addresses the possibility and functioning of TCAS on
unmanned aircraft. This is particularly useful to this project as it gives insight into the
shortcomings of TCAS on unmanned aircraft as well as some of the possible mitigations.
19. Panken, A. D., Harman, W. H., Rose, C. E., Drumm, A. C., Chludzinski, B. J., Elder,
T. R., & Murphy, T. J. (2012). Measurements of the 1030 and 1090 MHz environments
at JFK international airport (No. ATC-390). Spring Field: Lincoln Laboratory.
This paper is a report on the 1030/1090 MHz frequency using a ground based
omnidirectional receiver near the JFK International Airport. This report includes the overall
analysis of the 1030/1090 MHz environments, the analysis of TCAS air-to-coordination
process, an examination of the 1090 MHz ES ADS-B, and the assessment of the extent and
impact of TCAS operation on the airport surface. Overall this paper provides several key
aspects to the DAA final report for UAS. The analysis of TCAS and 1090 ES ADS-B were
valuable in understanding possible failure modes as well as the operation of both system
in the real world.

178
11 Simulation Environment Architecture Description
In order to design a successful surveillance analyzing simulation environment, accurate Flight
Dynamic Models (FDM) of the UAS aircraft, as well as an autopilot capable of steering the
aircraft safely and securely are essential. Two distinct UAS aerodynamic models have been
developed for this project. A Predator class RQ1 UAV aircraft and a Global Hawk model of
RQ4A have been modeled using JSBSim aerodynamic modeler. The FDMs were integrated with
the Flight Management System (FMS) capable of storing flight plans using 3D waypoint
trajectories (latitude, longitude, altitude), as well as spawning multiple simulated real-time
aircraft. Flight plan trajectory can be provided for autonomous navigation of an aircraft.
The FDMs are developed based on the publicly available aircraft operational data and
limitations. In order to test the aircraft in various flight scenarios, a test autopilot has been
developed, maintaining the horizontal, vertical, and lateral balance of the aircraft as well as the
speed (autothrottle) and altitude.
The FDM and autopilot were designed and implemented in JSBSim. JSBSim is an open-source
M&S software incorporating equations of motion in aerodynamics, as well as ideal
“Proportional-Integrative-Derivative” (PID) control loop feedback mechanisms implemented in a
C++ simulation engine supported by an xml model-definition language. JSBsim uses a discrete-
time base that computes the forces acting in the six degrees of freedom at each time-step.
Therefore, the entire state of the aircraft including all of the equations of motion is recomputed at
each time step. This allows for accurate estimation of the aerodynamic behavior of the aircraft as
well as its heading and attitude. Flight control laws, stability augmentation systems, autopilots,
and arbitrary aircraft systems (avionics, electrical systems, etc.) can be modeled in JSBSim by
creating chains of individual control components. A suite of configurable components in JSBSim
includes gains, filters, switches, PIDs, and more, enabling implementation of various dynamics
in the FDM and autopilot.
The two UAS models were provided with autopilots designed in JSBSim, composed of three
directional stability (yaw, pitch, and roll) as well as heading and speed control (autothrottle).
Multiple tests consisting of diverse maneuvers are simulated to verify the performance of the
aircraft.
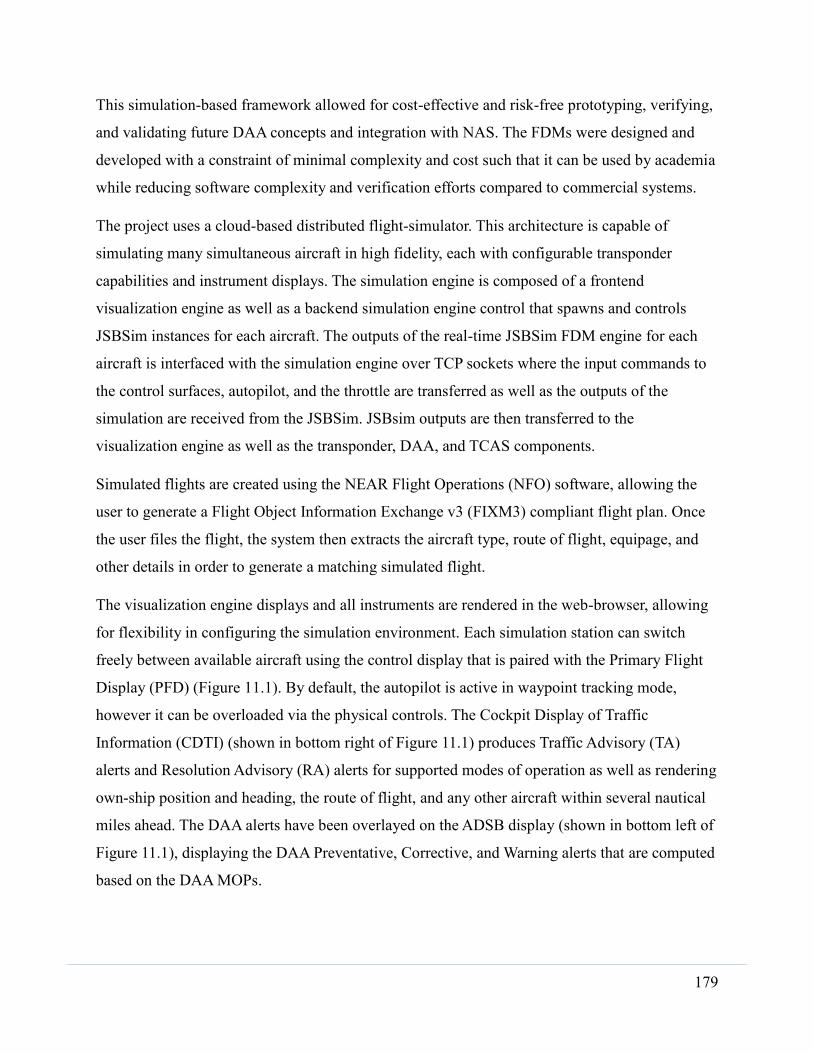
179
This simulation-based framework allowed for cost-effective and risk-free prototyping, verifying,
and validating future DAA concepts and integration with NAS. The FDMs were designed and
developed with a constraint of minimal complexity and cost such that it can be used by academia
while reducing software complexity and verification efforts compared to commercial systems.
The project uses a cloud-based distributed flight-simulator. This architecture is capable of
simulating many simultaneous aircraft in high fidelity, each with configurable transponder
capabilities and instrument displays. The simulation engine is composed of a frontend
visualization engine as well as a backend simulation engine control that spawns and controls
JSBSim instances for each aircraft. The outputs of the real-time JSBSim FDM engine for each
aircraft is interfaced with the simulation engine over TCP sockets where the input commands to
the control surfaces, autopilot, and the throttle are transferred as well as the outputs of the
simulation are received from the JSBSim. JSBsim outputs are then transferred to the
visualization engine as well as the transponder, DAA, and TCAS components.
Simulated flights are created using the NEAR Flight Operations (NFO) software, allowing the
user to generate a Flight Object Information Exchange v3 (FIXM3) compliant flight plan. Once
the user files the flight, the system then extracts the aircraft type, route of flight, equipage, and
other details in order to generate a matching simulated flight.
The visualization engine displays and all instruments are rendered in the web-browser, allowing
for flexibility in configuring the simulation environment. Each simulation station can switch
freely between available aircraft using the control display that is paired with the Primary Flight
Display (PFD) (Figure 11.1). By default, the autopilot is active in waypoint tracking mode,
however it can be overloaded via the physical controls. The Cockpit Display of Traffic
Information (CDTI) (shown in bottom right of Figure 11.1) produces Traffic Advisory (TA)
alerts and Resolution Advisory (RA) alerts for supported modes of operation as well as rendering
own-ship position and heading, the route of flight, and any other aircraft within several nautical
miles ahead. The DAA alerts have been overlayed on the ADSB display (shown in bottom left of
Figure 11.1), displaying the DAA Preventative, Corrective, and Warning alerts that are computed
based on the DAA MOPs.

180
Figure 11.1. Visualization engine and aircraft control displays
Figure 11.2 shows the desktop simulation console that was used as pilot station for UAV. During
the testing, the cockpit window displays were turned off to emulate a UAV flight.
Figure 11.2. Simulation station
Other visual displays such as Air Traffic Control (ATC) displays (Figure 11.3) and aircraft chase
view (Figure 11.4) were used to monitor and track the execution of the scenarios.

181
Figure 11.3. ATC views
Figure 11.4. Simulation chase view

182
12 Hazard Assessment Data Sets
Tables in Section 12
Table 12.1. Class A 2v2
Table 12.2. Class A 1v2
Table 12.3. Class A 1v1
Table 12.4. Class B 2v2
Table 12.5. Class B 1v2
Table 12.6. Class B 1v1
Table 12.7. Class C 2v2
Table 12.8. Class C 1v2
Table 12.9. Class C 1v1
Table 12.10. Class D 2v2
Table 12.11. Class D 1v2
Table 12.12. Class D 1v1
Table 12.13. Class D 2v1A
Table 12.14. Class D 1v1A
Table 12.15. Class D 2v0
Table 12.16. Class D 1v0
Table 12.17. Class E>10k, 2v2
Table 12.18. Class E>10k, 1v2
Table 12.19. Class E>10k, 1v1
Table 12.20. Class E<10k, 2v2
Table 12.21. Class E<10k, 1v2
Table 12.22. Class E<10k, 1v1
Table 12.23. Class E<10k, 2v1A

183
Table 12.24. Class E<10k, 1v1A
Table 12.25. Class E<10k, 2v0
Table 12.26. Class E<10k, 1v0
Table 12.27. Class G 2v2
Table 12.28. Class G 1v2
Table 12.29. Class G 1v1
Table 12.30. Class G 2v1A
Table 12.31. Class G 1v1A
Table 12.32. Class G 2v0
Table 12.33. Class G 1v0

184
Table 12.1. Class A 2v2
Failure Likelihood Effects Criticality Severity RLGE RLRE
Altimeter fail 1E-03
Degraded performance: An altimeter failure will lead to the loss of Mode S reporting credibility and therefore failure of the TCAS avoidance algorithm. However, ADS-B systems have the capability to identify an invalid altitude report and can use GPS altitude for intruder calculations. ATC and radar still provide separation assistance.
Minor Medium Risk 9E-10 9E-14
Altimeter wrong 1E-09
Loss of separation: Altitude is providing misleading information. In class A airspace, ATC provides altitude checks. Additionally, the GPS geometric altitude available from the ADS-B system provides a reference for detection of a misleading altimeter.
Major Low Risk 8E-15 8E-19
GPS (Horizontal) 1E-05 Degraded performance: GPS failure results in ADS-B system failure. Separation ensured by ATC and TCAS.
Minor Medium Risk 2E-09 2E-13
GPS (Vertical) 1E-05 Minimal effect: Altitude separation provided by barometric altitude, ATC, and TCAS. ADS- B still provides lateral separation information.
Minimal Low Risk 8E-15 8E-19
Transponder fail 1E-03 Loss of separation: Loss of TCAS and ADS-B. Radar and ATC provides separation.
Major High Risk 9E-10 9E-14
Transponder wrong 1E-05
Loss of separation: Possible corruption of TCAS and ADS-B. Radar and ATC provides separation. Receiving transponder error correction routines can identify and mitigate corrupted messages.
Major High Risk 3E-12 3E-16
TCAS 1E-07 Degraded performance: Transponder, ADS-B, and radar still functional. Additional separation assistance provided by ATC.
Minor Low Risk 3E-12 3E-16
Radar 1E-03 Degraded performance: Transponder, ADS-B, and TCAS still functional. Additional separation assistance provided by ATC.
Minor Medium Risk 5E-14 5E-18
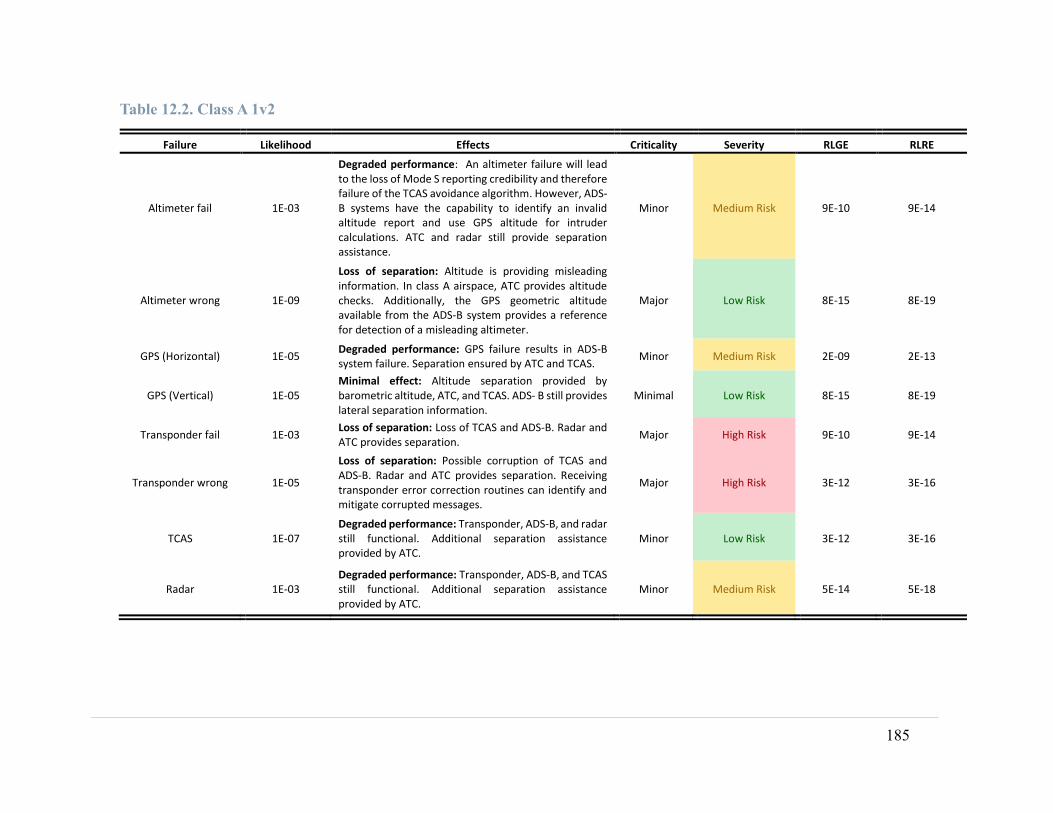
185
Table 12.2. Class A 1v2
Failure Likelihood Effects Criticality Severity RLGE RLRE
Altimeter fail 1E-03
Degraded performance: An altimeter failure will lead to the loss of Mode S reporting credibility and therefore failure of the TCAS avoidance algorithm. However, ADS-B systems have the capability to identify an invalid altitude report and use GPS altitude for intruder calculations. ATC and radar still provide separation assistance.
Minor Medium Risk 9E-10 9E-14
Altimeter wrong 1E-09
Loss of separation: Altitude is providing misleading information. In class A airspace, ATC provides altitude checks. Additionally, the GPS geometric altitude available from the ADS-B system provides a reference for detection of a misleading altimeter.
Major Low Risk 8E-15 8E-19
GPS (Horizontal) 1E-05 Degraded performance: GPS failure results in ADS-B system failure. Separation ensured by ATC and TCAS.
Minor Medium Risk 2E-09 2E-13
GPS (Vertical) 1E-05 Minimal effect: Altitude separation provided by barometric altitude, ATC, and TCAS. ADS- B still provides lateral separation information.
Minimal Low Risk 8E-15 8E-19
Transponder fail 1E-03 Loss of separation: Loss of TCAS and ADS-B. Radar and ATC provides separation.
Major High Risk 9E-10 9E-14
Transponder wrong 1E-05
Loss of separation: Possible corruption of TCAS and ADS-B. Radar and ATC provides separation. Receiving transponder error correction routines can identify and mitigate corrupted messages.
Major High Risk 3E-12 3E-16
TCAS 1E-07 Degraded performance: Transponder, ADS-B, and radar still functional. Additional separation assistance provided by ATC.
Minor Low Risk 3E-12 3E-16
Radar 1E-03 Degraded performance: Transponder, ADS-B, and TCAS still functional. Additional separation assistance provided by ATC.
Minor Medium Risk 5E-14 5E-18

186
Table 12.3. Class A 1v1
Failure Likelihood Effects Criticality Severity RLGE RLRE
Altimeter fail 1.00E-03
Degraded performance: An altimeter failure will lead to the loss of Mode S reporting credibility. However, ADS-B systems have the capability to identify an invalid altitude report and use GPS altitude for intruder calculations. ATC and radar still provide separation assistance.
Minor Medium Risk 2E-12 2E-16
Altimeter wrong 1.00E-09
Loss of separation: Altitude is providing misleading information. In class A airspace, ATC provides altitude checks. Additionally, the GPS geometric altitude available from the ADS-B system provides a reference for detection of a misleading altimeter.
Major Low Risk 2E-12 2E-16
GPS (Horizontal) 1.00E-05 Loss of separation: GPS failure results in ADS-B system failure. Separation ensured by ATC and Mode-S.
Major High Risk 4E-07 4E-11
GPS (Vertical) 1.00E-05 Minimal effect: Altitude separation provided by barometric altitude, ATC, and Mode-S. ADS- B still provides lateral separation information.
Minimal Low Risk 2E-12 2E-16
Transponder fail 1.00E-03 Loss of separation: Loss of ADS-B. Radar and ATC provides separation.
Major High Risk 2E-12 2E-16
Transponder wrong 1.00E-05
Loss of separation: Possible corruption of ADS-B. Radar and ATC provides separation. Receiving transponder error correction routines can identify and mitigate corrupted messages.
Major High Risk 2E-12 2E-16
Radar 1.00E-03 Degraded performance: Transponder and ADS-B still functional. Additional separation assistance provided by ATC.
Minor Medium Risk 2E-12 2E-16

187
Table 52.4. Class B 2v2
Failure Likelihood Effects Criticality Severity RLGE RLRE
Altimeter fail 1.00E-03
Degraded performance: An altimeter failure will lead to the loss of Mode S reporting credibility and therefore failure of the TCAS avoidance algorithm. However, ADS-B systems have the capability to identify an invalid altitude report and use GPS altitude for intruder calculations. ATC and radar still provide separation assistance.
Minor Medium Risk 9E-10 9E-14
Altimeter wrong 1.00E-09
Loss of separation: Altitude is providing misleading information. In class B airspace, ATC provides altitude checks. Additionally, the GPS geometric altitude available from the ADS-B system provides a reference for detection of a misleading altimeter.
Major Low Risk 8E-15 8E-19
GPS (Horizontal) 1.00E-05 Degraded performance: GPS failure results in ADS-B system failure. Separation ensured by ATC and TCAS.
Minor Medium Risk 2E-09 2E-13
GPS (Vertical) 1.00E-05 Minimal effect: Altitude separation provided by barometric altitude, ATC, and TCAS. ADS- B still provides lateral separation information.
Minimal Low Risk 8E-15 8E-19
Transponder fail 1.00E-03 Loss of separation: Loss of TCAS and ADS-B. Radar and ATC provides separation.
Major High Risk 9E-10 9E-14
Transponder wrong 1.00E-05
Loss of separation: Possible corruption of TCAS and ADS-B. Radar and ATC provides separation. Receiving transponder error correction routines can identify and mitigate corrupted messages.
Major High Risk 3E-12 3E-16
TCAS 1.00E-07 Degraded performance: Transponder, ADS-B, and radar still functional. Additional separation assistance provided by ATC.
Minor Low Risk 3E-12 3E-16
Radar 1.00E-03 Degraded performance: Transponder, ADS-B, and TCAS still functional. Additional separation assistance provided by ATC.
Minor Medium Risk 5E-14 5E-18
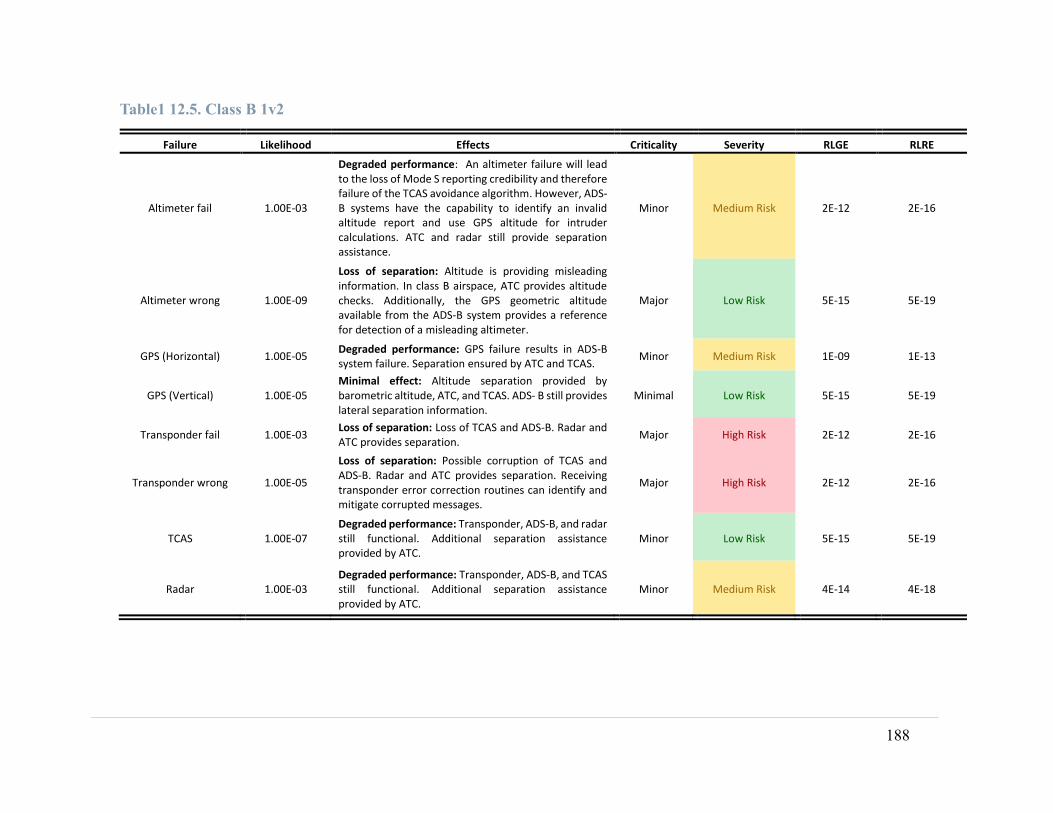
188
Table1 12.5. Class B 1v2
Failure Likelihood Effects Criticality Severity RLGE RLRE
Altimeter fail 1.00E-03
Degraded performance: An altimeter failure will lead to the loss of Mode S reporting credibility and therefore failure of the TCAS avoidance algorithm. However, ADS-B systems have the capability to identify an invalid altitude report and use GPS altitude for intruder calculations. ATC and radar still provide separation assistance.
Minor Medium Risk 2E-12 2E-16
Altimeter wrong 1.00E-09
Loss of separation: Altitude is providing misleading information. In class B airspace, ATC provides altitude checks. Additionally, the GPS geometric altitude available from the ADS-B system provides a reference for detection of a misleading altimeter.
Major Low Risk 5E-15 5E-19
GPS (Horizontal) 1.00E-05 Degraded performance: GPS failure results in ADS-B system failure. Separation ensured by ATC and TCAS.
Minor Medium Risk 1E-09 1E-13
GPS (Vertical) 1.00E-05 Minimal effect: Altitude separation provided by barometric altitude, ATC, and TCAS. ADS- B still provides lateral separation information.
Minimal Low Risk 5E-15 5E-19
Transponder fail 1.00E-03 Loss of separation: Loss of TCAS and ADS-B. Radar and ATC provides separation.
Major High Risk 2E-12 2E-16
Transponder wrong 1.00E-05
Loss of separation: Possible corruption of TCAS and ADS-B. Radar and ATC provides separation. Receiving transponder error correction routines can identify and mitigate corrupted messages.
Major High Risk 2E-12 2E-16
TCAS 1.00E-07 Degraded performance: Transponder, ADS-B, and radar still functional. Additional separation assistance provided by ATC.
Minor Low Risk 5E-15 5E-19
Radar 1.00E-03 Degraded performance: Transponder, ADS-B, and TCAS still functional. Additional separation assistance provided by ATC.
Minor Medium Risk 4E-14 4E-18

189
Table 6.6. Class B 1v1
Failure Likelihood Effects Criticality Severity RLGE RLRE
Altimeter fail 1.00E-03
Degraded performance: An altimeter failure will lead to the loss of Mode S reporting credibility. However, ADS-B systems have the capability to identify an invalid altitude report and use GPS altitude for intruder calculations. ATC and radar still provide separation assistance.
Minor Medium Risk 2E-12 2E-16
Altimeter wrong 1.00E-09
Loss of separation: Altitude is providing misleading information. In class B airspace, ATC provides altitude checks. Additionally, the GPS geometric altitude available from the ADS-B system provides a reference for detection of a misleading altimeter.
Major Low Risk 2E-12 2E-16
GPS (Horizontal) 1.00E-05 Loss of separation: GPS failure results in ADS-B system failure. Separation ensured by ATC and Mode-S.
Major High Risk 4E-07 4E-11
GPS (Vertical) 1.00E-05 Minimal effect: Altitude separation provided by barometric altitude, ATC, and Mode-S. ADS- B still provides lateral separation information.
Minimal Low Risk 2E-12 2E-16
Transponder fail 1.00E-03 Loss of separation: Loss of ADS-B. Radar and ATC provides separation.
Major High Risk 2E-12 2E-16
Transponder wrong 1.00E-05
Loss of separation: Possible corruption of ADS-B. Radar and ATC provides separation. Receiving transponder error correction routines can identify and mitigate corrupted messages.
Major High Risk 2E-12 2E-16
Radar 1.00E-03 Degraded performance: Transponder and ADS-B still functional. Additional separation assistance provided by ATC.
Minor Medium Risk 2E-12 2E-16

190
Table 72.7. Class C 2v2
Failure Likelihood Effects Criticality Severity RLGE RLRE
Altimeter fail 1.00E-03
Degraded performance: An altimeter failure will lead to the loss of Mode S reporting credibility and therefore failure of the TCAS avoidance algorithm. However, ADS-B systems have the capability to identify an invalid altitude report and use GPS altitude for intruder calculations. ATC and radar still provide separation assistance.
Minor Medium Risk 9E-10 9E-14
Altimeter wrong 1.00E-09
Loss of separation: Altitude is providing misleading information. In class C airspace, ATC provides altitude checks. Additionally, the GPS geometric altitude available from the ADS-B system provides a reference for detection of a misleading altimeter.
Major Low Risk 8E-15 8E-19
GPS (Horizontal) 1.00E-05 Degraded performance: GPS failure results in ADS-B system failure. Separation ensured by ATC and TCAS.
Minor Medium Risk 2E-09 2E-13
GPS (Vertical) 1.00E-05 Minimal effect: Altitude separation provided by barometric altitude, ATC, and TCAS. ADS- B still provides lateral separation information.
Minimal Low Risk 8E-15 8E-19
Transponder fail 1.00E-03 Loss of separation: Loss of TCAS and ADS-B. Radar and ATC provides separation.
Major High Risk 9E-10 9E-14
Transponder wrong 1.00E-05
Loss of separation: Possible corruption of TCAS and ADS-B. Radar and ATC provides separation. Receiving transponder error correction routines can identify and mitigate corrupted messages.
Major High Risk 3E-12 3E-16
TCAS 1.00E-07 Degraded performance: Transponder, ADS-B, and radar still functional. Additional separation assistance provided by ATC.
Minor Low Risk 3E-12 3E-16
Radar 1.00E-03 Degraded performance: Transponder, ADS-B, and TCAS still functional. Additional separation assistance provided by ATC.
Minor Medium Risk 5E-14 5E-18

191
Table 82.8. Class C 1v2
Failure Likelihood Effects Criticality Severity RLGE RLRE
Altimeter fail 1.00E-03
Degraded performance: An altimeter failure will lead to the loss of Mode S reporting credibility and therefore failure of the TCAS avoidance algorithm. However, ADS-B systems have the capability to identify an invalid altitude report and use GPS altitude for intruder calculations. ATC and radar still provide separation assistance.
Minor Medium Risk 2E-12 2E-16
Altimeter wrong 1.00E-09
Loss of separation: Altitude is providing misleading information. In classC airspace, ATC provides altitude checks. Additionally, the GPS geometric altitude available from the ADS-B system provides a reference for detection of a misleading altimeter.
Major Low Risk 5E-15 5E-19
GPS (Horizontal) 1.00E-05 Degraded performance: GPS failure results in ADS-B system failure. Separation ensured by ATC and TCAS.
Minor Medium Risk 1E-09 1E-13
GPS (Vertical) 1.00E-05 Minimal effect: Altitude separation provided by barometric altitude, ATC, and TCAS. ADS- B still provides lateral separation information.
Minimal Low Risk 5E-15 5E-19
Transponder fail 1.00E-03 Loss of separation: Loss of TCAS and ADS-B. Radar and ATC provides separation.
Major High Risk 2E-12 2E-16
Transponder wrong 1.00E-05
Loss of separation: Possible corruption of TCAS and ADS-B. Radar and ATC provides separation. Receiving transponder error correction routines can identify and mitigate corrupted messages.
Major High Risk 2E-12 2E-16
TCAS 1.00E-07 Degraded performance: Transponder, ADS-B, and radar still functional. Additional separation assistance provided by ATC.
Minor Low Risk 5E-15 5E-19
Radar 1.00E-03 Degraded performance: Transponder, ADS-B, and TCAS still functional. Additional separation assistance provided by ATC.
Minor Medium Risk 4E-14 4E-18
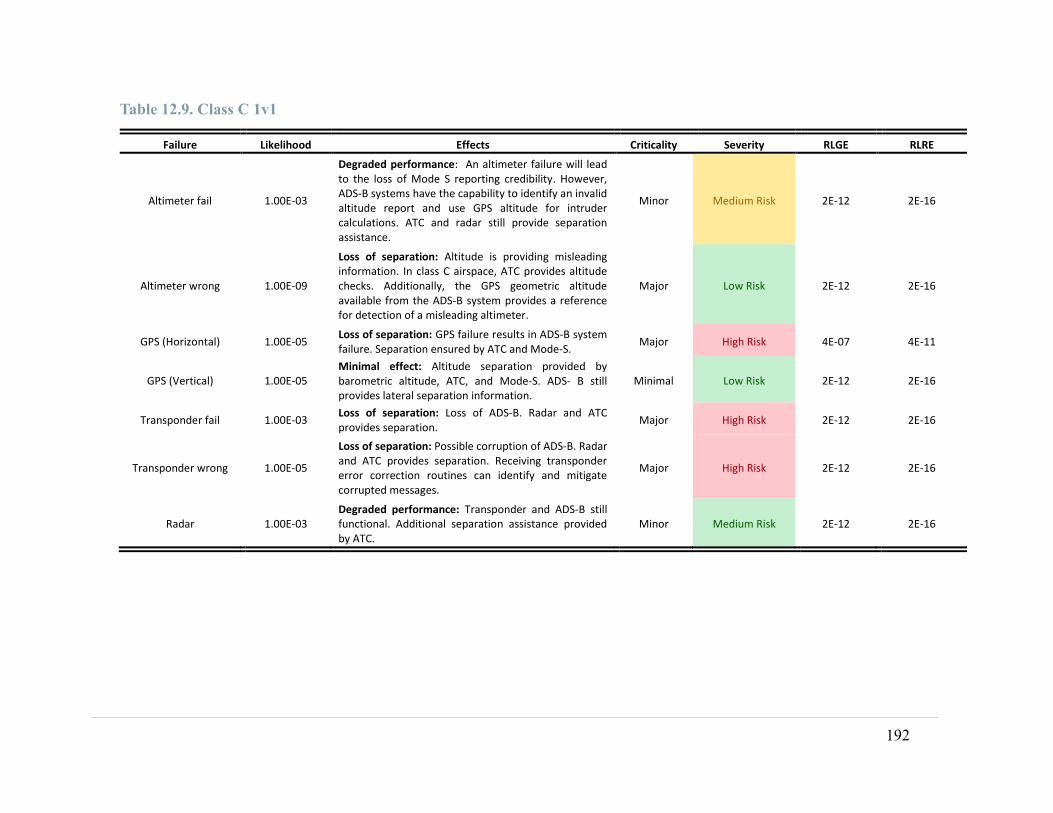
192
Table 12.9. Class C 1v1
Failure Likelihood Effects Criticality Severity RLGE RLRE
Altimeter fail 1.00E-03
Degraded performance: An altimeter failure will lead to the loss of Mode S reporting credibility. However, ADS-B systems have the capability to identify an invalid altitude report and use GPS altitude for intruder calculations. ATC and radar still provide separation assistance.
Minor Medium Risk 2E-12 2E-16
Altimeter wrong 1.00E-09
Loss of separation: Altitude is providing misleading information. In class C airspace, ATC provides altitude checks. Additionally, the GPS geometric altitude available from the ADS-B system provides a reference for detection of a misleading altimeter.
Major Low Risk 2E-12 2E-16
GPS (Horizontal) 1.00E-05 Loss of separation: GPS failure results in ADS-B system failure. Separation ensured by ATC and Mode-S.
Major High Risk 4E-07 4E-11
GPS (Vertical) 1.00E-05 Minimal effect: Altitude separation provided by barometric altitude, ATC, and Mode-S. ADS- B still provides lateral separation information.
Minimal Low Risk 2E-12 2E-16
Transponder fail 1.00E-03 Loss of separation: Loss of ADS-B. Radar and ATC provides separation.
Major High Risk 2E-12 2E-16
Transponder wrong 1.00E-05
Loss of separation: Possible corruption of ADS-B. Radar and ATC provides separation. Receiving transponder error correction routines can identify and mitigate corrupted messages.
Major High Risk 2E-12 2E-16
Radar 1.00E-03 Degraded performance: Transponder and ADS-B still functional. Additional separation assistance provided by ATC.
Minor Medium Risk 2E-12 2E-16

193
Table 92.10. Class D 2v2
Failure Likelihood Effects Criticality Severity RLGE RLRE
Altimeter fail 1.00E-03
Degraded performance: An altimeter failure will lead to the loss of Mode S reporting credibility and therefore failure of the TCAS avoidance algorithm. However, ADS-B systems have the capability to identify an invalid altitude report and use GPS altitude for intruder calculations. ATC and radar still provide separation assistance.
Minor Medium Risk 9E-10 9E-14
Altimeter wrong 1.00E-09
Loss of Separation: Altitude is providing misleading information which may result in DAA system providing incorrect avoidance recommendations/incorrect pilot maneuvering. Radar and ATC provide separation.
Major Low Risk 8E-15 8E-19
GPS (Horizontal) 1.00E-05 Degraded performance: GPS failure results in ADS-B system failure. Separation ensured by TCAS avoidance algorithm and ATC.
Minor Medium Risk 2E-09 2E-13
GPS (Vertical) 1.00E-05
Minimal effect: Geometric altitude is a backup system for ADS-B. Altitude separation provided by DAA relies on barometric altitude and Mode-S. TCAS and ADS-B still fully operational.
Minimal Low Risk 8E-15 8E-19
Transponder fail 1.00E-03 Loss of Separation: Loss of TCAS and ADS-B. Radar, separation by ATC and see-and-avoid by intruder aircraft are primary means of separation.
Major High Risk 9E-10 9E-14
Transponder wrong 1.00E-05
Loss of Separation: Possible corruption of TCAS and ADS-B. Radar and ATC provides separation. Receiving transponder error correction routines can identify and mitigate corrupted messages.
Major High Risk 3E-12 3E-16
TCAS 1.00E-07 Degraded Performance: Transponder, ADS-B, and radar still functional. Additional separation assistance provided by ATC.
Minor Low Risk 3E-12 3E-16
Radar 1.00E-03 Degraded Performance: Transponder, ADS-B, and TCAS still functional. Additional separation assistance provided by ATC.
Minor Medium Risk 5E-14 5E-18

194
Table 102.11. Class D 1v2
Failure Likelihood Effects Criticality Severity RLGE RLRE
Altimeter fail 1.00E-03
Degraded performance: An altimeter failure will lead to the loss of Mode S reporting credibility and therefore failure of the TCAS avoidance algorithm. However, ADS-B systems have the capability to identify an invalid altitude report and opt to using GPS altitude for its intruder calculations. ATC and radar still provide separation assistance.
Minor Medium Risk 2E-12 2E-16
Altimeter wrong 1.00E-09
Loss of Separation: Altitude is providing misleading information which may result in DAA system providing incorrect avoidance recommendations/incorrect pilot maneuvering. Radar and ATC provide separation.
Major Low Risk 5E-15 5E-19
GPS (Horizontal) 1.00E-05 Degraded performance: GPS failure results in ADS-B system failure. Separation ensured by ATC and TCAS.
Minor Medium Risk 1E-09 1E-13
GPS (Vertical) 1.00E-05 Minimal effect: Geometric altitude is a backup system for ADS-B, Altitude separation provided by DAA relies on barometric altitude and Mode-S, TCAS and ADS-B still fully operational.
Minimal Low Risk 5E-15 5E-19
Transponder fail 1.00E-03 Loss of Separation: Loss of TCAS and ADS-B. Radar and See-and-avoid are primary means of separation.
Major High Risk 2E-12 2E-16
Transponder wrong 1.00E-05
Loss of Separation: Possible corruption of TCAS and ADS-B. Radar and ATC provides separation. Receiving transponder error correction routines can identify and mitigate corrupted messages.
Major High Risk 2E-12 2E-16
TCAS 1.00E-07 Degraded Performance: Failure of the TCAS avoidance algorithm, ADS-B still operational providing target tracking, radar and see-and-avoid separation still possible.
Minor Low Risk 5E-15 5E-19
Radar 1.00E-03 Degraded Performance: Radar failure does not affect performance of ADS-B or TCAS systems, DAA still fully functional.
Minor Medium Risk 4E-14 4E-18
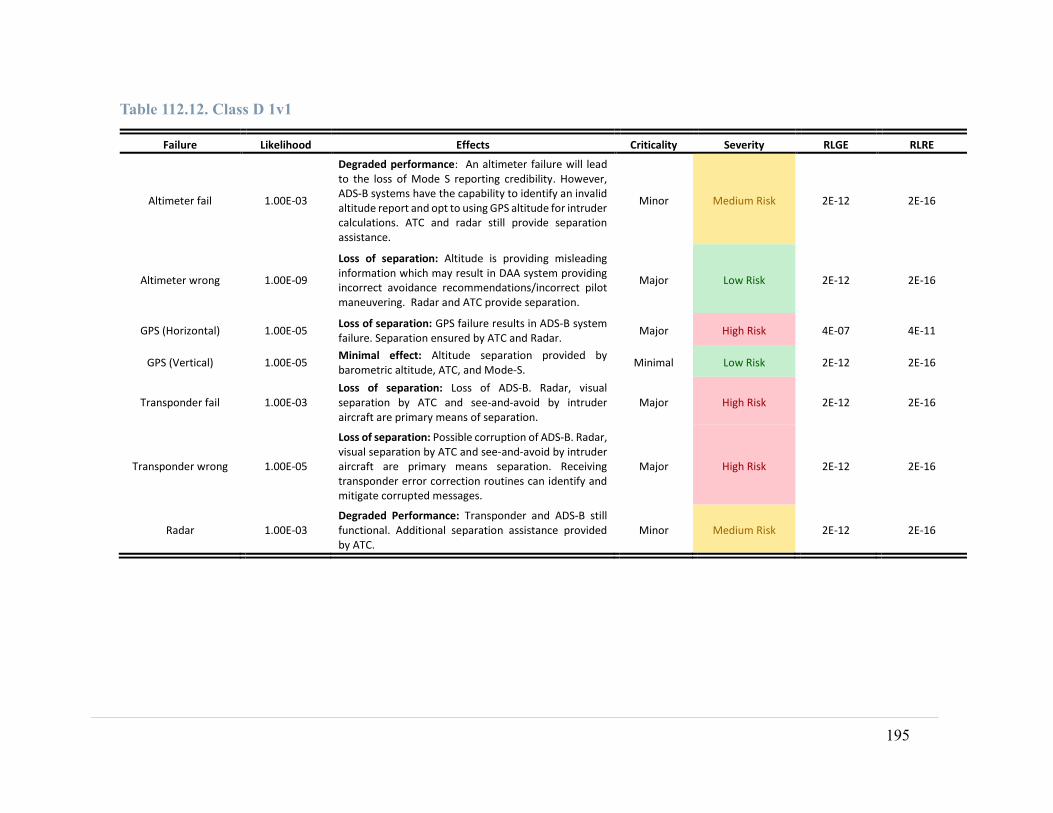
195
Table 112.12. Class D 1v1
Failure Likelihood Effects Criticality Severity RLGE RLRE
Altimeter fail 1.00E-03
Degraded performance: An altimeter failure will lead to the loss of Mode S reporting credibility. However, ADS-B systems have the capability to identify an invalid altitude report and opt to using GPS altitude for intruder calculations. ATC and radar still provide separation assistance.
Minor Medium Risk 2E-12 2E-16
Altimeter wrong 1.00E-09
Loss of separation: Altitude is providing misleading information which may result in DAA system providing incorrect avoidance recommendations/incorrect pilot maneuvering. Radar and ATC provide separation.
Major Low Risk 2E-12 2E-16
GPS (Horizontal) 1.00E-05 Loss of separation: GPS failure results in ADS-B system failure. Separation ensured by ATC and Radar.
Major High Risk 4E-07 4E-11
GPS (Vertical) 1.00E-05 Minimal effect: Altitude separation provided by barometric altitude, ATC, and Mode-S.
Minimal Low Risk 2E-12 2E-16
Transponder fail 1.00E-03 Loss of separation: Loss of ADS-B. Radar, visual separation by ATC and see-and-avoid by intruder aircraft are primary means of separation.
Major High Risk 2E-12 2E-16
Transponder wrong 1.00E-05
Loss of separation: Possible corruption of ADS-B. Radar, visual separation by ATC and see-and-avoid by intruder aircraft are primary means separation. Receiving transponder error correction routines can identify and mitigate corrupted messages.
Major High Risk 2E-12 2E-16
Radar 1.00E-03 Degraded Performance: Transponder and ADS-B still functional. Additional separation assistance provided by ATC.
Minor Medium Risk 2E-12 2E-16

196
Table 122.13. Class D 2v1A
Failure Likelihood Effects Criticality Severity RLGE RLRE
Altimeter fail 1.00E-03
Loss of separation: An altimeter failure will lead to the loss of Mode S reporting credibility and therefore failure of the TCAS avoidance algorithm. However, ADS-B systems have the capability to identify an invalid altitude report and opt to using GPS altitude for intruder calculations. ATC and radar still provide separation assistance.
Minor Medium Risk 9E-10 9E-14
Altimeter wrong 1.00E-09
Loss of separation: Altitude is providing misleading information which may result in DAA system providing incorrect avoidance recommendations/incorrect pilot maneuvering. Radar and ATC provide separation.
Major Low Risk 9E-10 9E-14
GPS (Horizontal) 1.00E-05 Degraded performance: GPS failure results in ADS-B system failure. Separation ensured by ATC and TCAS.
Minor Medium Risk 4E-07 4E-11
GPS (Vertical) 1.00E-05 Minimal effect: Geometric altitude is a backup system for ADS-B, Altitude separation provided by barometric altitude, ATC, and Mode-S.
Minimal Low Risk 9E-10 9E-14
Transponder fail 1.00E-03 Loss of separation: Loss of ADS-B. Radar and ATC provides separation.
Major High Risk 9E-10 9E-14
Transponder wrong 1.00E-05
Loss of separation: Possible corruption of ADS-B. Radar and ATC provides separation. Receiving transponder error correction routines can identify and mitigate corrupted messages.
Major High Risk 9E-10 9E-14
TCAS 1.00E-07 Degraded Performance: Failure of the TCAS avoidance algorithm. ADS-B still operational providing target tracking. Radar and DAA separation still possible.
Minor Low Risk 5E-15 5E-19
Radar 1.00E-03 Degraded Performance: Transponder and ADS-B still functional. Additional separation assistance provided by ATC.
Minor Medium Risk 9E-10 9E-14

197
Table 12.14. Class D 1v1A
Failure Likelihood Effects Criticality Severity RLGE RLRE
Altimeter fail 1.00E-03
Loss of separation: An altimeter failure will lead to the loss of Mode S reporting credibility. However, ADS-B systems have the capability to identify an invalid altitude report and opt to using GPS altitude for its intruder calculations. ATC and radar still provide separation assistance.
Minor Medium Risk 9E-10 9E-14
Altimeter wrong 1.00E-09
Loss of separation: Altitude is providing misleading information which may result in DAA system providing incorrect avoidance recommendations/incorrect pilot maneuvering. Radar and ATC provide separation.
Major Low Risk 9E-10 9E-14
GPS (Horizontal) 1.00E-05 Loss of separation: GPS failure results in ADS-B system failure. Separation ensured by ATC and Radar.
Major High Risk 4E-07 4E-11
GPS (Vertical) 1.00E-05 Minimal effect: Geometric altitude is a backup system for ADS-B. Altitude separation provided by barometric altitude, ATC, and Mode-S.
Minimal Low Risk 9E-10 9E-14
Transponder fail 1.00E-03 Loss of separation: Loss of ADS-B. Radar and ATC provides separation.
Major High Risk 9E-10 9E-14
Transponder wrong 1.00E-05
Loss of separation: Possible corruption of ADS-B. Radar and ATC provides separation. Receiving transponder error correction routines can identify and mitigate corrupted messages.
Major High Risk 9E-10 9E-14
Radar 1.00E-03 Degraded Performance: Transponder and ADS-B still functional. Additional separation assistance provided by ATC.
Minor Medium Risk 9E-10 9E-14
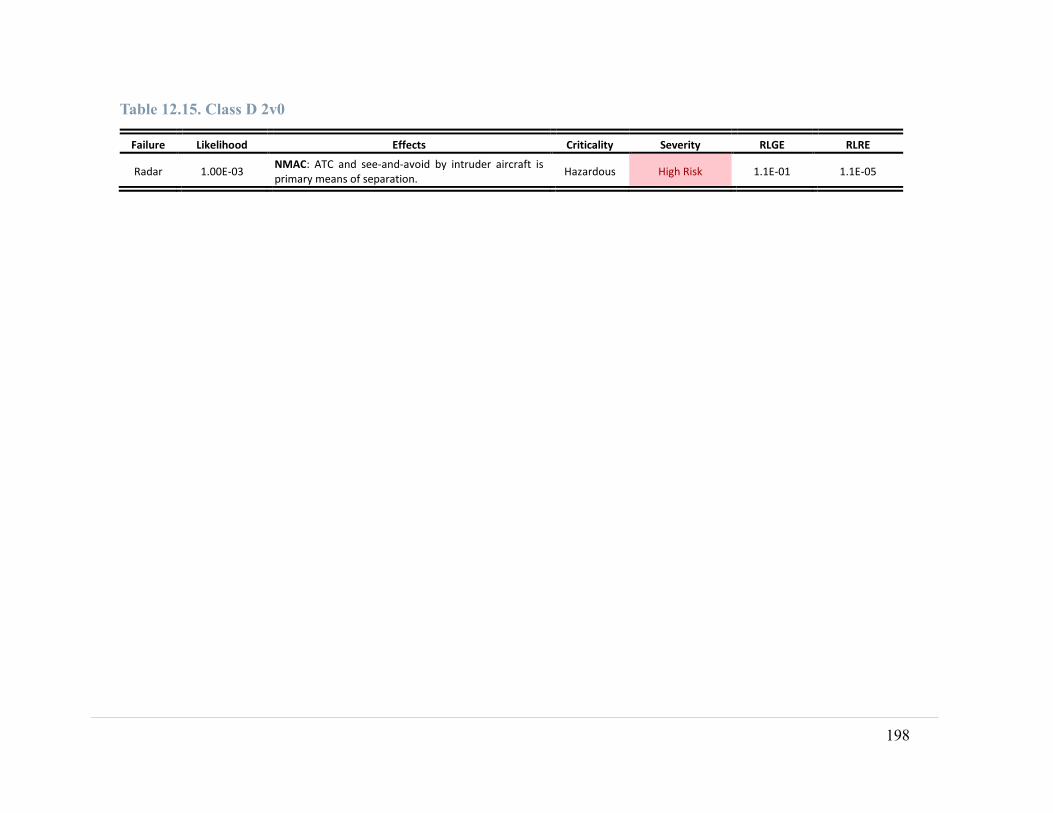
198
Table 12.15. Class D 2v0
Failure Likelihood Effects Criticality Severity RLGE RLRE
Radar 1.00E-03 NMAC: ATC and see-and-avoid by intruder aircraft is primary means of separation.
Hazardous High Risk 1.1E-01 1.1E-05

199
Table 12.16. Class D 1v0
Failure Likelihood Effects Criticality Severity RLGE RLRE
Radar 1.00E-03 NMAC: ATC and see-and-avoid by intruder aircraft is primary means of separation.
Hazardous High Risk 1.E-01 1.E-05

200
Table 12.17. Class E > 10k, 2v2
Failure Likelihood Effects Criticality Severity RLGE RLRE
Altimeter fail 1.00E-03
Degraded performance: An altimeter failure will lead to the loss of Mode S reporting credibility and therefore failure of the TCAS avoidance algorithm. However, ADS-B systems have the capability to identify an invalid altitude report and use GPS altitude for intruder calculations. ATC and radar still provide separation assistance.
Minor Medium Risk 9E-10 9E-14
Altimeter wrong 1.00E-09
Loss of separation: Altitude is providing misleading information. In class E airspace, ATC provides altitude checks and is separating all IFR traffic. Additionally, the GPS geometric altitude available from the ADS-B system provides a reference for detection of a misleading altimeter.
Major Low Risk 8E-15 8E-19
GPS (Horizontal) 1.00E-05 Degraded performance: GPS failure results in ADS-B system failure. Separation ensured by ATC and TCAS.
Minor Medium Risk 2E-09 2E-13
GPS (Vertical) 1.00E-05 Minimal effect: Altitude separation provided by barometric altitude, ATC, and TCAS.
Minimal Low Risk 8E-15 8E-19
Transponder fail 1.00E-03 Loss of separation: Loss of TCAS and ADS-B. Radar, ATC provide separation.
Major High Risk 9E-10 9E-14
Transponder wrong 1.00E-05
Loss of separation: Possible corruption of TCAS and ADS-B. Radar and ATC provides separation. Receiving transponder error correction routines can identify and mitigate corrupted messages.
Major High Risk 3E-12 3E-16
TCAS 1.00E-07 Degraded performance: Transponder, ADS-B, and radar still functional. Additional separation assistance provided by ATC.
Minor Low Risk 3E-12 3E-16
Radar 1.00E-03 Degraded Performance: Transponder, ADS-B, and TCAS still functional. Additional separation assistance provided by ATC.
Minor Medium Risk 5E-14 5E-18
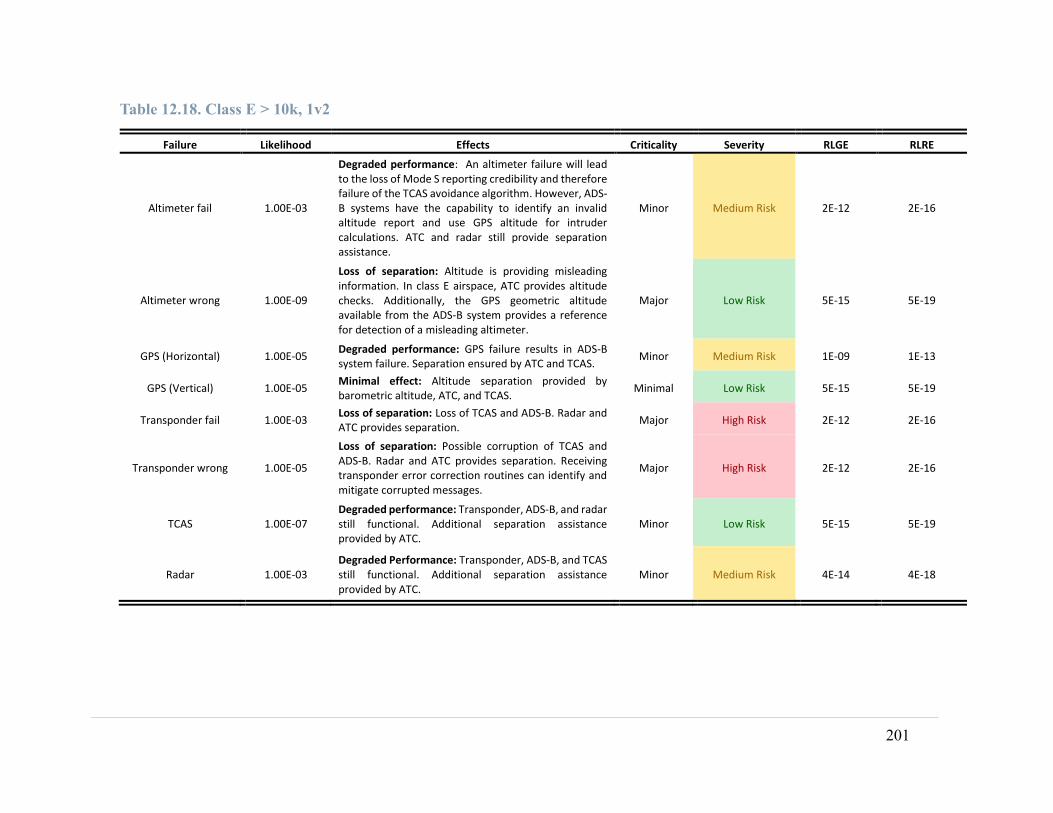
201
Table 12.18. Class E > 10k, 1v2
Failure Likelihood Effects Criticality Severity RLGE RLRE
Altimeter fail 1.00E-03
Degraded performance: An altimeter failure will lead to the loss of Mode S reporting credibility and therefore failure of the TCAS avoidance algorithm. However, ADS-B systems have the capability to identify an invalid altitude report and use GPS altitude for intruder calculations. ATC and radar still provide separation assistance.
Minor Medium Risk 2E-12 2E-16
Altimeter wrong 1.00E-09
Loss of separation: Altitude is providing misleading information. In class E airspace, ATC provides altitude checks. Additionally, the GPS geometric altitude available from the ADS-B system provides a reference for detection of a misleading altimeter.
Major Low Risk 5E-15 5E-19
GPS (Horizontal) 1.00E-05 Degraded performance: GPS failure results in ADS-B system failure. Separation ensured by ATC and TCAS.
Minor Medium Risk 1E-09 1E-13
GPS (Vertical) 1.00E-05 Minimal effect: Altitude separation provided by barometric altitude, ATC, and TCAS.
Minimal Low Risk 5E-15 5E-19
Transponder fail 1.00E-03 Loss of separation: Loss of TCAS and ADS-B. Radar and ATC provides separation.
Major High Risk 2E-12 2E-16
Transponder wrong 1.00E-05
Loss of separation: Possible corruption of TCAS and ADS-B. Radar and ATC provides separation. Receiving transponder error correction routines can identify and mitigate corrupted messages.
Major High Risk 2E-12 2E-16
TCAS 1.00E-07 Degraded performance: Transponder, ADS-B, and radar still functional. Additional separation assistance provided by ATC.
Minor Low Risk 5E-15 5E-19
Radar 1.00E-03 Degraded Performance: Transponder, ADS-B, and TCAS still functional. Additional separation assistance provided by ATC.
Minor Medium Risk 4E-14 4E-18

202
Table 12.19. Class E > 10k, 1v1
Failure Likelihood Effects Criticality Severity RLGE RLRE
Altimeter fail 1.00E-03
Degraded performance: An altimeter failure will lead to the loss of Mode S reporting credibility. However, ADS-B systems have the capability to identify an invalid altitude report and use GPS altitude for intruder calculations. ATC and radar still provide separation assistance.
Minor Medium Risk 2E-12 2E-16
Altimeter wrong 1.00E-09
Loss of separation: Altitude is providing misleading information. In class E airspace, ATC provides altitude checks. Additionally, the GPS geometric altitude available from the ADS-B system provides a reference for detection of a misleading altimeter.
Major Low Risk 2E-12 2E-16
GPS (Horizontal) 1.00E-05 Loss of separation: GPS failure results in ADS-B system failure. Separation ensured by ATC and Radar.
Major High Risk 4E-07 4E-11
GPS (Vertical) 1.00E-05 Minimal effect: Altitude separation provided by barometric altitude, ATC, and Mode-S.
Minimal Low Risk 2E-12 2E-16
Transponder fail 1.00E-03 Loss of separation: Loss of ADS-B. Radar and ATC provides separation.
Major High Risk 2E-12 2E-16
Transponder wrong 1.00E-05
Loss of separation: Possible corruption of ADS-B. Radar and ATC provides separation. Receiving transponder error correction routines can identify and mitigate corrupted messages.
Major High Risk 2E-12 2E-16
Radar 1.00E-03 Degraded Performance: Transponder and ADS-B still functional. Additional separation assistance provided by ATC.
Minor Medium Risk 2E-12 2E-16
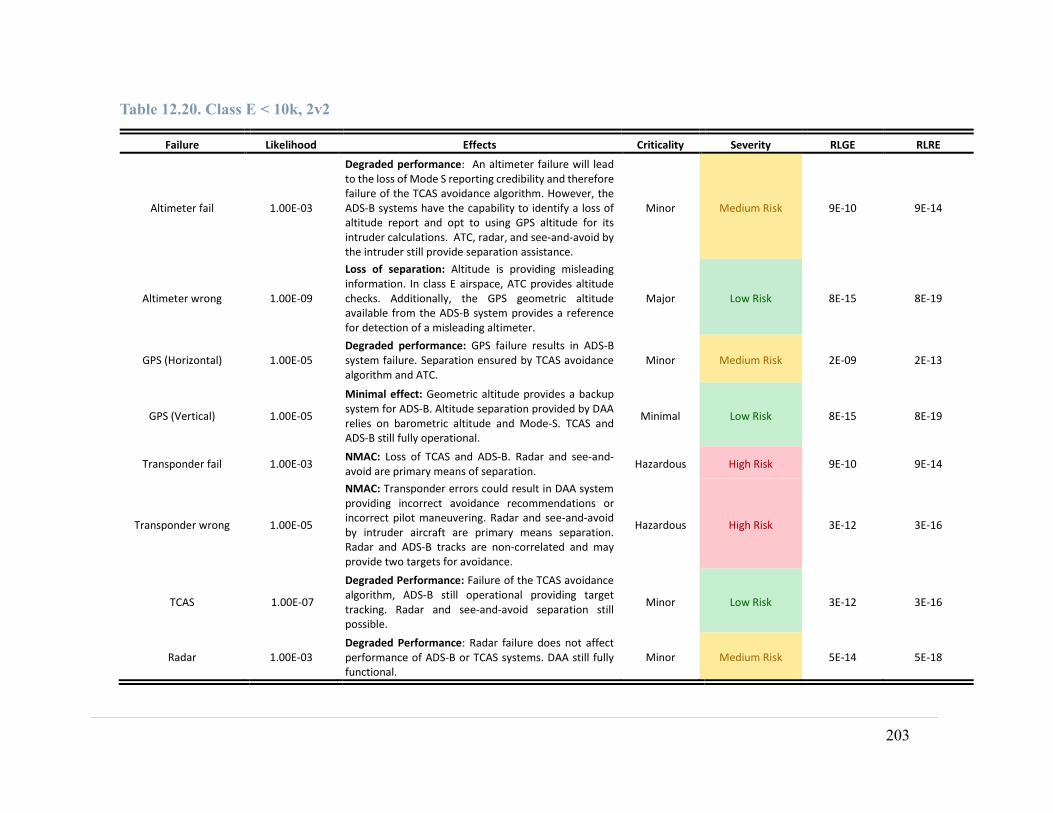
203
Table 12.20. Class E < 10k, 2v2
Failure Likelihood Effects Criticality Severity RLGE RLRE
Altimeter fail 1.00E-03
Degraded performance: An altimeter failure will lead to the loss of Mode S reporting credibility and therefore failure of the TCAS avoidance algorithm. However, the ADS-B systems have the capability to identify a loss of altitude report and opt to using GPS altitude for its intruder calculations. ATC, radar, and see-and-avoid by the intruder still provide separation assistance.
Minor Medium Risk 9E-10 9E-14
Altimeter wrong 1.00E-09
Loss of separation: Altitude is providing misleading information. In class E airspace, ATC provides altitude checks. Additionally, the GPS geometric altitude available from the ADS-B system provides a reference for detection of a misleading altimeter.
Major Low Risk 8E-15 8E-19
GPS (Horizontal) 1.00E-05 Degraded performance: GPS failure results in ADS-B system failure. Separation ensured by TCAS avoidance algorithm and ATC.
Minor Medium Risk 2E-09 2E-13
GPS (Vertical) 1.00E-05
Minimal effect: Geometric altitude provides a backup system for ADS-B. Altitude separation provided by DAA relies on barometric altitude and Mode-S. TCAS and ADS-B still fully operational.
Minimal Low Risk 8E-15 8E-19
Transponder fail 1.00E-03 NMAC: Loss of TCAS and ADS-B. Radar and see-and-avoid are primary means of separation.
Hazardous High Risk 9E-10 9E-14
Transponder wrong 1.00E-05
NMAC: Transponder errors could result in DAA system providing incorrect avoidance recommendations or incorrect pilot maneuvering. Radar and see-and-avoid by intruder aircraft are primary means separation. Radar and ADS-B tracks are non-correlated and may provide two targets for avoidance.
Hazardous High Risk 3E-12 3E-16
TCAS 1.00E-07
Degraded Performance: Failure of the TCAS avoidance algorithm, ADS-B still operational providing target tracking. Radar and see-and-avoid separation still possible.
Minor Low Risk 3E-12 3E-16
Radar 1.00E-03 Degraded Performance: Radar failure does not affect performance of ADS-B or TCAS systems. DAA still fully functional.
Minor Medium Risk 5E-14 5E-18
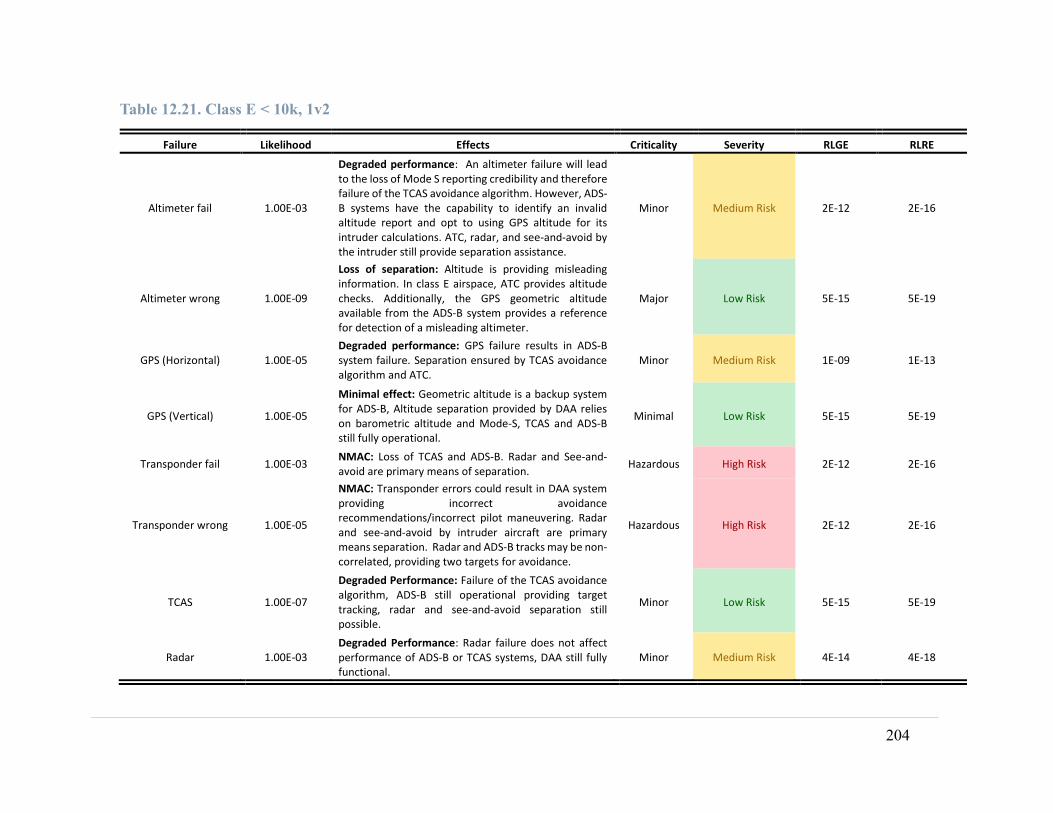
204
Table 12.21. Class E < 10k, 1v2
Failure Likelihood Effects Criticality Severity RLGE RLRE
Altimeter fail 1.00E-03
Degraded performance: An altimeter failure will lead to the loss of Mode S reporting credibility and therefore failure of the TCAS avoidance algorithm. However, ADS-B systems have the capability to identify an invalid altitude report and opt to using GPS altitude for its intruder calculations. ATC, radar, and see-and-avoid by the intruder still provide separation assistance.
Minor Medium Risk 2E-12 2E-16
Altimeter wrong 1.00E-09
Loss of separation: Altitude is providing misleading information. In class E airspace, ATC provides altitude checks. Additionally, the GPS geometric altitude available from the ADS-B system provides a reference for detection of a misleading altimeter.
Major Low Risk 5E-15 5E-19
GPS (Horizontal) 1.00E-05 Degraded performance: GPS failure results in ADS-B system failure. Separation ensured by TCAS avoidance algorithm and ATC.
Minor Medium Risk 1E-09 1E-13
GPS (Vertical) 1.00E-05
Minimal effect: Geometric altitude is a backup system for ADS-B, Altitude separation provided by DAA relies on barometric altitude and Mode-S, TCAS and ADS-B still fully operational.
Minimal Low Risk 5E-15 5E-19
Transponder fail 1.00E-03 NMAC: Loss of TCAS and ADS-B. Radar and See-and-avoid are primary means of separation.
Hazardous High Risk 2E-12 2E-16
Transponder wrong 1.00E-05
NMAC: Transponder errors could result in DAA system providing incorrect avoidance recommendations/incorrect pilot maneuvering. Radar and see-and-avoid by intruder aircraft are primary means separation. Radar and ADS-B tracks may be non-correlated, providing two targets for avoidance.
Hazardous High Risk 2E-12 2E-16
TCAS 1.00E-07
Degraded Performance: Failure of the TCAS avoidance algorithm, ADS-B still operational providing target tracking, radar and see-and-avoid separation still possible.
Minor Low Risk 5E-15 5E-19
Radar 1.00E-03 Degraded Performance: Radar failure does not affect performance of ADS-B or TCAS systems, DAA still fully functional.
Minor Medium Risk 4E-14 4E-18

205
Table 13. Class E < 10k, 1v1
Failure Likelihood Effects Criticality Severity RLGE RLRE
Altimeter fail 1.00E-03
Degraded performance: An altimeter failure will lead to the loss of Mode S reporting credibility. However, ADS-B systems have the capability to identify an invalid altitude report and opt to using GPS altitude for its intruder calculations. ATC, radar, and see-and-avoid by the intruder still provide separation assistance.
Minor Medium Risk 2E-12 2E-16
Altimeter wrong 1.00E-09
Loss of separation: Altitude is providing misleading information. In class E airspace, ATC provides altitude checks. Additionally, the GPS geometric altitude available from the ADS-B system provides a reference for detection of a misleading altimeter.
Major Low Risk 2E-12 2E-16
GPS (Horizontal) 1.00E-05 Loss of separation: GPS failure results in ADS-B system failure. Separation ensured by ATC and Radar.
Major High Risk 4E-07 4E-11
GPS (Vertical) 1.00E-05
Minimal effect: Geometric altitude is a backup system for ADS-B. Altitude separation provided by DAA relies on barometric altitude. Mode-S and ADS-B still fully operational.
Minimal Low Risk 2E-12 2E-16
Transponder fail 1.00E-03 NMAC: Loss of ADS-B functionality. Radar and see-and-avoid by intruder aircraft are primary means of separation.
Hazardous High Risk 2E-12 2E-16
Transponder wrong 1.00E-05
NMAC: Transponder errors could result in DAA system providing incorrect avoidance recommendations/incorrect pilot maneuvering. Radar and see-and-avoid by intruder aircraft are primary means separation. Radar and ADS-B tracks may be non-correlated, possibly providing two targets for avoidance.
Hazardous High Risk 2E-12 2E-16
Radar 1.00E-03 Degraded Performance: Both aircraft are transponding and ownship DAA is still operating.
Minor Medium Risk 2E-12 2E-16

206
Table 12.23. Class E < 10k, 2v1A
Failure Likelihood Effects Criticality Severity RLGE RLRE
Altimeter fail 1.00E-03
Degraded Performance: An altimeter failure will lead to the loss of Mode S reporting credibility and therefore failure of the TCAS avoidance algorithm. However, ADS-B systems have the capability to identify an invalid altitude report and opt to using GPS altitude for its intruder calculations. ATC, radar, and see-and-avoid by the intruder still provide separation assistance.
Minor Medium Risk 4E-07 4E-11
Altimeter wrong 1.00E-09
Loss of separation: Altitude is providing misleading information. In class E airspace, ATC provides altitude checks. Additionally, the GPS geometric altitude available from the ADS-B system provides a reference for detection of a misleading altimeter.
Major Low Risk 1E-09 1E-13
GPS (Horizontal) 1.00E-05 Degraded performance: GPS failure results in ADS-B system failure. Separation ensured by TCAS avoidance algorithm and ATC.
Minor Medium Risk 6E-07 6E-11
GPS (Vertical) 1.00E-05 Minimal effect: Geometric altitude is a backup system for ADS-B, Altitude separation provided by DAA relies on barometric altitude and Mode-S, TCAS and ADS-B still fully operational.
Minimal Low Risk 1E-09 1E-13
Transponder fail 1.00E-03 NMAC: Loss of ADS-B and TCAS functionality. Radar and see-and-avoid by intruder aircraft are primary means of separation.
Hazardous High Risk 4E-07 4E-11
Transponder wrong 1.00E-05
NMAC: Transponder errors could result in DAA system providing incorrect avoidance recommendations/incorrect pilot maneuvering. Radar and see-and-avoid by intruder aircraft are primary means separation. Radar and ADS-B tracks may be non-correlated, possibly providing two targets for avoidance.
Hazardous High Risk 1E-09 1E-13
TCAS 1.00E-07 Degraded Performance: Failure of the TCAS avoidance algorithm, ADS-B still operational providing target tracking, radar and see-and-avoid separation still possible.
Minor Low Risk 4E-07 4E-11
Radar 1.00E-03 Degraded Performance: Both aircraft are transponding and ownship DAA is still operating.
Minor Medium Risk 9E-09 9E-13
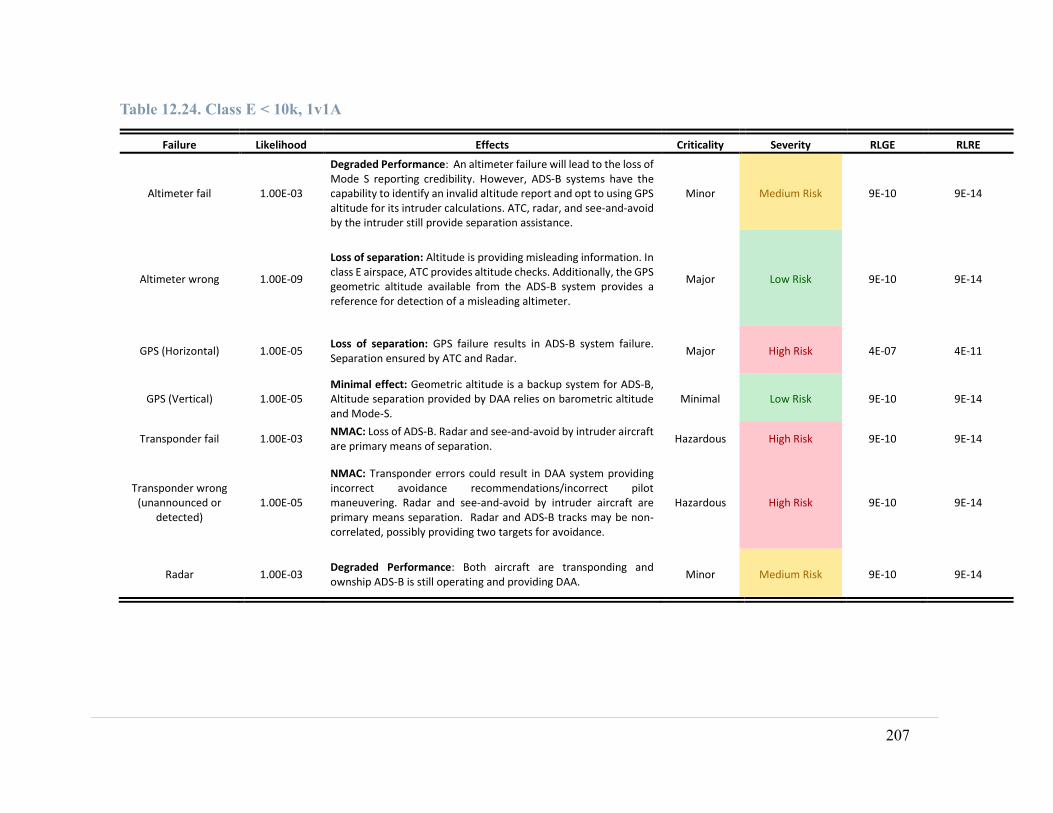
207
Table 12.24. Class E < 10k, 1v1A
Failure Likelihood Effects Criticality Severity RLGE RLRE
Altimeter fail 1.00E-03
Degraded Performance: An altimeter failure will lead to the loss of Mode S reporting credibility. However, ADS-B systems have the capability to identify an invalid altitude report and opt to using GPS altitude for its intruder calculations. ATC, radar, and see-and-avoid by the intruder still provide separation assistance.
Minor Medium Risk 9E-10 9E-14
Altimeter wrong 1.00E-09
Loss of separation: Altitude is providing misleading information. In class E airspace, ATC provides altitude checks. Additionally, the GPS geometric altitude available from the ADS-B system provides a reference for detection of a misleading altimeter.
Major Low Risk 9E-10 9E-14
GPS (Horizontal) 1.00E-05 Loss of separation: GPS failure results in ADS-B system failure. Separation ensured by ATC and Radar.
Major High Risk 4E-07 4E-11
GPS (Vertical) 1.00E-05 Minimal effect: Geometric altitude is a backup system for ADS-B, Altitude separation provided by DAA relies on barometric altitude and Mode-S.
Minimal Low Risk 9E-10 9E-14
Transponder fail 1.00E-03 NMAC: Loss of ADS-B. Radar and see-and-avoid by intruder aircraft are primary means of separation.
Hazardous High Risk 9E-10 9E-14
Transponder wrong (unannounced or
detected) 1.00E-05
NMAC: Transponder errors could result in DAA system providing incorrect avoidance recommendations/incorrect pilot maneuvering. Radar and see-and-avoid by intruder aircraft are primary means separation. Radar and ADS-B tracks may be non-correlated, possibly providing two targets for avoidance.
Hazardous High Risk 9E-10 9E-14
Radar 1.00E-03 Degraded Performance: Both aircraft are transponding and ownship ADS-B is still operating and providing DAA.
Minor Medium Risk 9E-10 9E-14

208
Table 12.25. Class E < 10k, 2v0
Failure Likelihood Effects Criticality Severity RLGE RLRE
Radar 1.00E-03 MAC: See-and-avoid by intruder aircraft is primary means of separation.
Catastrophic High Risk 1.E-01 1.E-05

209
Table 12.26. Class E < 10k, 1v0
Failure Likelihood Effects Criticality Severity RLGE RLRE
Radar 1.00E-03 MAC: See-and-avoid by intruder aircraft is primary means of separation.
Catastrophic High Risk 1.E-01 1.E-05

210
Table 12.27. Class G 2v2
Failure Likelihood Effects Criticality Severity RLGE RLRE
Altimeter fail 1.00E-03
Degraded performance: An altimeter failure will lead to the loss of Mode S reporting credibility and therefore failure of the TCAS avoidance algorithm. However, ADS-B systems have the capability to identify an invalid altitude report and opt to using GPS altitude for its intruder calculations. Radar, and see-and-avoid by the intruder still provide separation.
Minor Medium Risk 9E-10 9E-14
Altimeter wrong 1.00E-09
NMAC: Altitude is providing misleading information to the transponder and ADS-B system, may result in DAA system providing incorrect avoidance recommendations/incorrect pilot maneuvering. Radar, see-and-avoid are primary means of separation.
Hazardous Medium Risk 8E-15 8E-19
GPS (Horizontal) 1.00E-05 Degraded performance: GPS failure results in ADS-B system failure. Separation ensured by TCAS avoidance algorithm, radar, and see-and-avoid
Minor Medium Risk 2E-09 2E-13
GPS (Vertical) 1.00E-05
Minimal effect: Geometric altitude is a backup system for ADS-B, Altitude separation provided by DAA relies on barometric altitude and Mode-S, TCAS, and ADS-B still fully operational.
Minimal Low Risk 8E-15 8E-19
Transponder fail 1.00E-03 NMAC: Loss of TCAS and ADS-B. Radar and see-and-avoid are primary means of separation.
Hazardous High Risk 9E-10 9E-14
Transponder wrong 1.00E-05
NMAC: Transponder errors could result in DAA system providing incorrect avoidance recommendations/incorrect pilot maneuvering. Radar and see-and-avoid by intruder aircraft are primary means separation. Radar and ADS-B tracks may be non-correlated, possibly providing two tracks for avoidance.
Hazardous High Risk 3E-12 3E-16
TCAS 1.00E-07
Degraded Performance: Failure of the TCAS avoidance algorithm, ADS-B still operational providing target tracking, radar and see-and-avoid separation still possible.
Minor Low Risk 3E-12 3E-16
Radar 1.00E-03 Degraded Performance: Transponder, TCAS and ADS-B still functional.
Minor Medium Risk 5E-14 5E-18

211
Table 12.28. Class G 1v2
Failure Likelihood Effects Criticality Severity RLGE RLRE
Altimeter fail 1.00E-03
Degraded performance: An altimeter failure will lead to the loss of Mode S reporting credibility and therefore failure of the TCAS avoidance algorithm. However, ADS-B systems have the capability to identify an invalid altitude report and opt to using GPS altitude for its intruder calculations. Radar, and see-and-avoid by the intruder still provide separation.
Minor Medium Risk 2E-12 2E-16
Altimeter wrong 1.00E-09
NMAC: Altitude is providing misleading information to transponder which may result in DAA system providing incorrect avoidance recommendations/incorrect pilot maneuvering. Radar and see-and-avoid by intruder aircraft are still functional means separation. Radar and ADS-B tracks may be non-correlated, possibly providing two tracks for avoidance.
Hazardous Medium Risk 5E-15 5E-19
GPS (Horizontal) 1.00E-05 Degraded performance: GPS failure results in ADS-B system failure. Separation ensured by TCAS avoidance algorithm, radar, and see-and-avoid.
Minor Medium Risk 1E-09 1E-13
GPS (Vertical) 1.00E-05
Minimal effect: Geometric altitude is a backup system for ADS-B, Altitude separation provided by DAA relies on barometric altitude and Mode-S, TCAS, and ADS-B still fully operational.
Minimal Low Risk 5E-15 5E-19
Transponder fail 1.00E-03 NMAC: Loss of TCAS and ADS-B. Radar and See-and-avoid are primary means of separation.
Hazardous High Risk 2E-12 2E-16
Transponder wrong 1.00E-05
NMAC: Transponder errors could result in DAA system providing incorrect avoidance recommendations/incorrect pilot maneuvering. Radar and see-and-avoid by intruder aircraft are primary means separation. Radar and ADS-B tracks may be non-correlated, possibly providing two tracks for avoidance.
Hazardous High Risk 2E-12 2E-16
TCAS 1.00E-07 Degraded Performance: Failure of the TCAS avoidance algorithm. ADS-B still operational providing target tracking. Radar and see-and-avoid separation still possible.
Minor Low Risk 5E-15 5E-19
Radar 1.00E-03 Degraded Performance: Transponder, TCAS and ADS-B still functional.
Minor Medium Risk 4E-14 4E-18
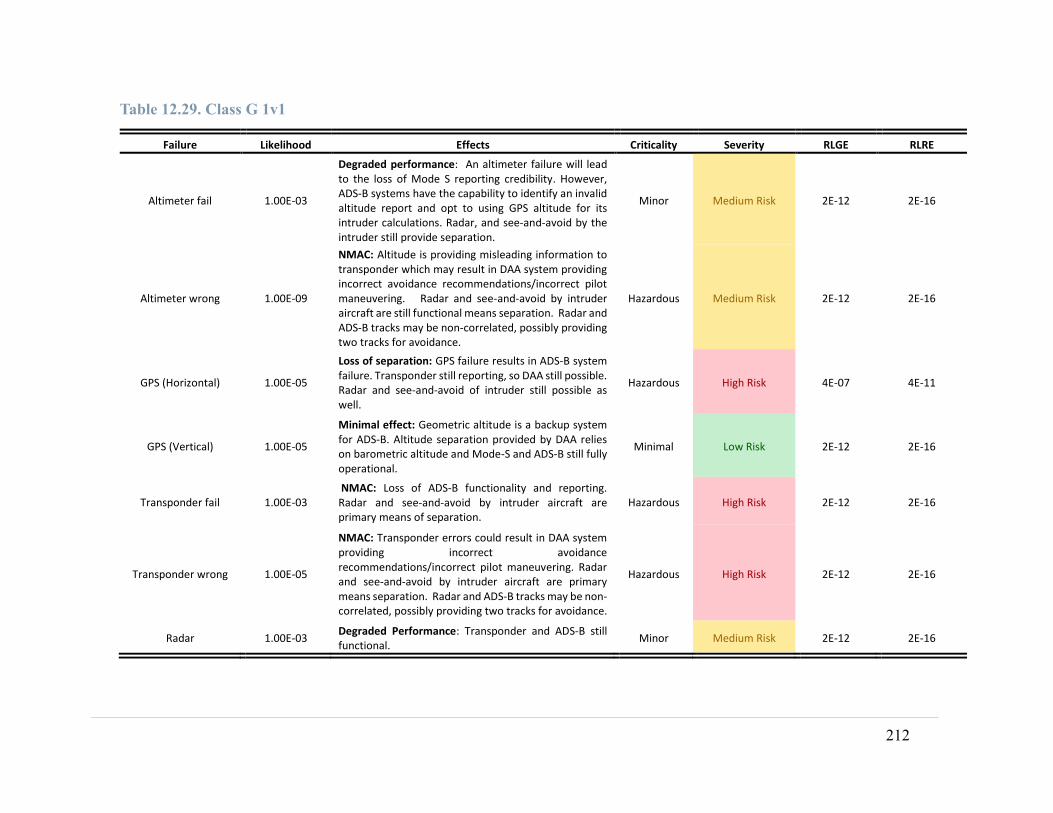
212
Table 12.29. Class G 1v1
Failure Likelihood Effects Criticality Severity RLGE RLRE
Altimeter fail 1.00E-03
Degraded performance: An altimeter failure will lead to the loss of Mode S reporting credibility. However, ADS-B systems have the capability to identify an invalid altitude report and opt to using GPS altitude for its intruder calculations. Radar, and see-and-avoid by the intruder still provide separation.
Minor Medium Risk 2E-12 2E-16
Altimeter wrong 1.00E-09
NMAC: Altitude is providing misleading information to transponder which may result in DAA system providing incorrect avoidance recommendations/incorrect pilot maneuvering. Radar and see-and-avoid by intruder aircraft are still functional means separation. Radar and ADS-B tracks may be non-correlated, possibly providing two tracks for avoidance.
Hazardous Medium Risk 2E-12 2E-16
GPS (Horizontal) 1.00E-05
Loss of separation: GPS failure results in ADS-B system failure. Transponder still reporting, so DAA still possible. Radar and see-and-avoid of intruder still possible as well.
Hazardous High Risk 4E-07 4E-11
GPS (Vertical) 1.00E-05
Minimal effect: Geometric altitude is a backup system for ADS-B. Altitude separation provided by DAA relies on barometric altitude and Mode-S and ADS-B still fully operational.
Minimal Low Risk 2E-12 2E-16
Transponder fail 1.00E-03 NMAC: Loss of ADS-B functionality and reporting. Radar and see-and-avoid by intruder aircraft are primary means of separation.
Hazardous High Risk 2E-12 2E-16
Transponder wrong 1.00E-05
NMAC: Transponder errors could result in DAA system providing incorrect avoidance recommendations/incorrect pilot maneuvering. Radar and see-and-avoid by intruder aircraft are primary means separation. Radar and ADS-B tracks may be non-correlated, possibly providing two tracks for avoidance.
Hazardous High Risk 2E-12 2E-16
Radar 1.00E-03 Degraded Performance: Transponder and ADS-B still functional.
Minor Medium Risk 2E-12 2E-16

213
Table 12.30. Class G 2v1A
Failure Likelihood Effects Criticality Severity RLGE RLRE
Altimeter fail 1.00E-03
Loss of separation: An altimeter failure will lead to the loss of Mode S reporting credibility and therefore failure of the TCAS avoidance algorithm. However, ADS-B systems have the capability to identify an invalid altitude report and opt to using GPS altitude for its intruder calculations. Radar, and see-and-avoid by the intruder still provide separation.
Major High Risk 4E-07 4E-11
Altimeter wrong 1.00E-09
NMAC: Altitude is providing misleading information to transponder which may result in DAA system providing incorrect avoidance recommendations/incorrect pilot maneuvering. Radar and see-and-avoid by intruder aircraft are still functional means separation. Radar and ADS-B tracks may be non-correlated, possibly providing two tracks for avoidance.
Hazardous Medium Risk 1E-09 1E-13
GPS (Horizontal) 1.00E-05 Degraded performance: GPS failure results in ADS-B system failure. TCAS tracking still fully functional, as well as radar and see-and-avoid by intruder aircraft.
Minor Medium Risk 6E-07 6E-11
GPS (Vertical) 1.00E-05
Minimal effect: Geometric altitude is a backup system for ADS-B, Altitude separation provided by DAA relies on barometric altitude and Mode-S, TCAS and ADS-B still fully operational.
Minimal Low Risk 1E-09 1E-13
Transponder fail 1.00E-03 NMAC: Loss of ADS-B and TCAS functionality. Radar and see-and-avoid by intruder aircraft are primary means of separation.
Hazardous High Risk 4E-07 4E-11
Transponder wrong 1.00E-05
NMAC: Transponder errors could result in DAA system providing incorrect avoidance recommendations/incorrect pilot maneuvering. Radar and see-and-avoid by intruder aircraft are primary means separation. Radar and ADS-B tracks may be non-correlated, possibly providing two tracks for avoidance.
Hazardous High Risk 1E-09 1E-13
TCAS 1.00E-07 Degraded Performance: Failure of the TCAS avoidance algorithm, ADS-B still operational providing target tracking, radar and see-and-avoid separation still possible.
Minor Low Risk 4E-07 4E-11
Radar 1.00E-03 Degraded Performance: Transponder, TCAS ADS-B still functional.
Minor Medium Risk 9E-09 9E-13

214
Table 12.31. Class G 1v1A
Failure Likelihood Effects Criticality Severity RLGE RLRE
Altimeter fail 1.00E-03
Loss of separation: An altimeter failure will lead to the loss of Mode S reporting credibility. However, ADS-B systems have the capability to identify an invalid altitude report and opt to using GPS altitude for its intruder calculations. Radar, and see-and-avoid by the intruder provide separation.
Major High Risk 9E-10 9E-14
Altimeter wrong 1.00E-09
NMAC: Altitude is providing misleading information to transponder which may result in DAA system providing incorrect avoidance recommendations/incorrect pilot maneuvering. Radar and see-and-avoid by intruder aircraft are primary means separation.
Hazardous Medium Risk 9E-10 9E-14
GPS (Horizontal) 1.00E-05 NMAC: GPS failure results in ADS-B system failure. Radar and see-and-avoid by intruder aircraft are primary means of separation.
Hazardous High Risk 4E-07 4E-11
GPS (Vertical) 1.00E-05 Minimal effect: Geometric altitude is a backup system for ADS-B, Altitude separation provided by DAA relies on barometric altitude and Mode-S.
Minimal Low Risk 9E-10 9E-14
Transponder fail 1.00E-03 NMAC: Loss of ADS-B. Radar and see-and-avoid by intruder aircraft are primary means of separation.
Hazardous High Risk 9E-10 9E-14
Transponder wrong 1.00E-05
NMAC: Transponder errors could result in DAA system providing incorrect avoidance recommendations/incorrect pilot maneuvering. Radar and see-and-avoid by intruder aircraft are primary means separation
Hazardous High Risk 9E-10 9E-14
Radar 1.00E-03 Degraded performance: Transponder and ADS-B still functional.
Minor Medium Risk 9E-10 9E-14

215
Table 14. Class G 2v0
Failure Likelihood Effects Criticality Severity RLGE RLRE
Radar 1.00E-03 MAC: See-and-avoid by intruder aircraft is primary means of separation.
Catastrophic High Risk 1.E-01 1.E-05

216
Table 12.33. Class G 1v0
Failure Likelihood Effects Criticality Severity RLGE RLRE
Radar 1.00E-03 MAC: See-and-avoid by intruder aircraft is primary means of separation.
Catastrophic High Risk 1.E-01 1.E-05

![[ON TIME-CRITICALITY] TIME-CRITICALITY … · ["ON TIME-CRITICALITY"] TIME-CRITICALITY Time-critical signal processing in humans and machines ... - ancient Greek prosody based on](https://img.dokumen.tips/doc/110x75/5b914fb509d3f215288b5a2b/on-time-criticality-time-criticality-on-time-criticality-time-criticality.jpg)