Embed Size (px)
Citation preview

Don’t Get Caught In the Cold,Warm-up Your JVM
Understand and Eliminate JVM Warm-upOverhead in Data-parallel Systems
David Lion, Adrian Chiu, Hailong Sun*, Xin Zhuang, Nikola Grcevski†, Ding Yuan
University of Toronto, *Beihang University, †Vena Solutions
2
The JVM is Popular
● Systems are increasingly built on the JVM
● Popular for big data applications
● Increasingly used on latency-sensitive queries
3
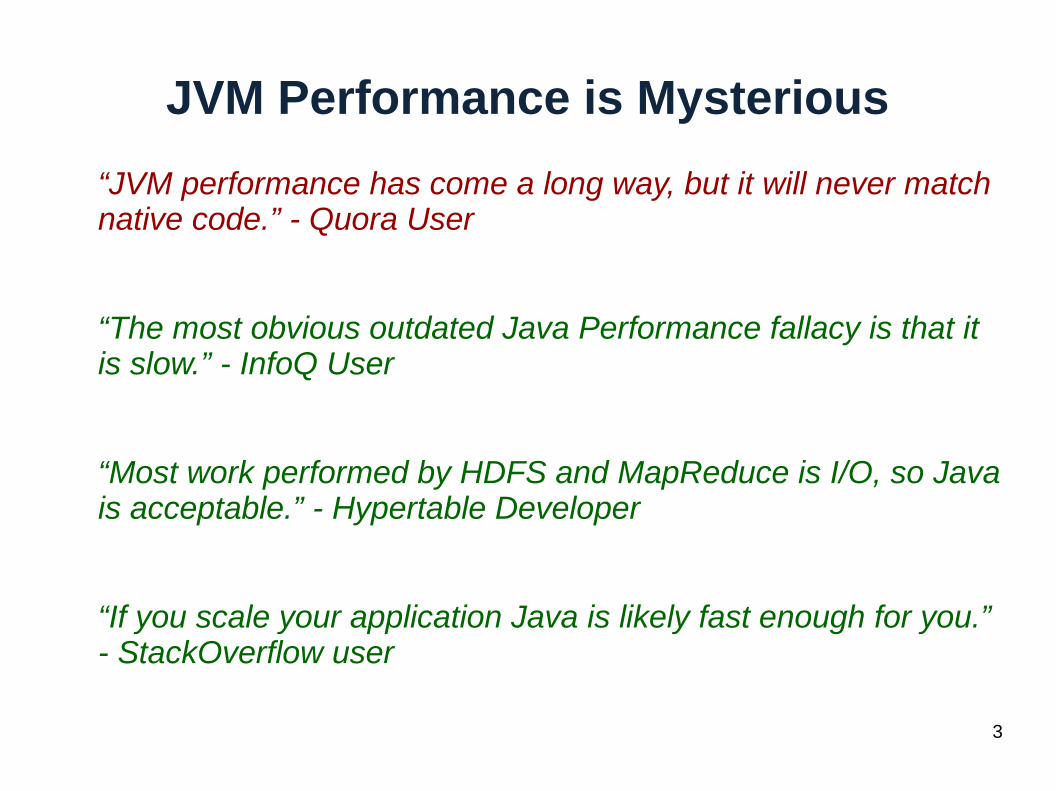
JVM Performance is Mysterious
“JVM performance has come a long way, but it will never match native code.” - Quora User
“The most obvious outdated Java Performance fallacy is that it is slow.” - InfoQ User
“Most work performed by HDFS and MapReduce is I/O, so Java is acceptable.” - Hypertable Developer
“If you scale your application Java is likely fast enough for you.” - StackOverflow user
4
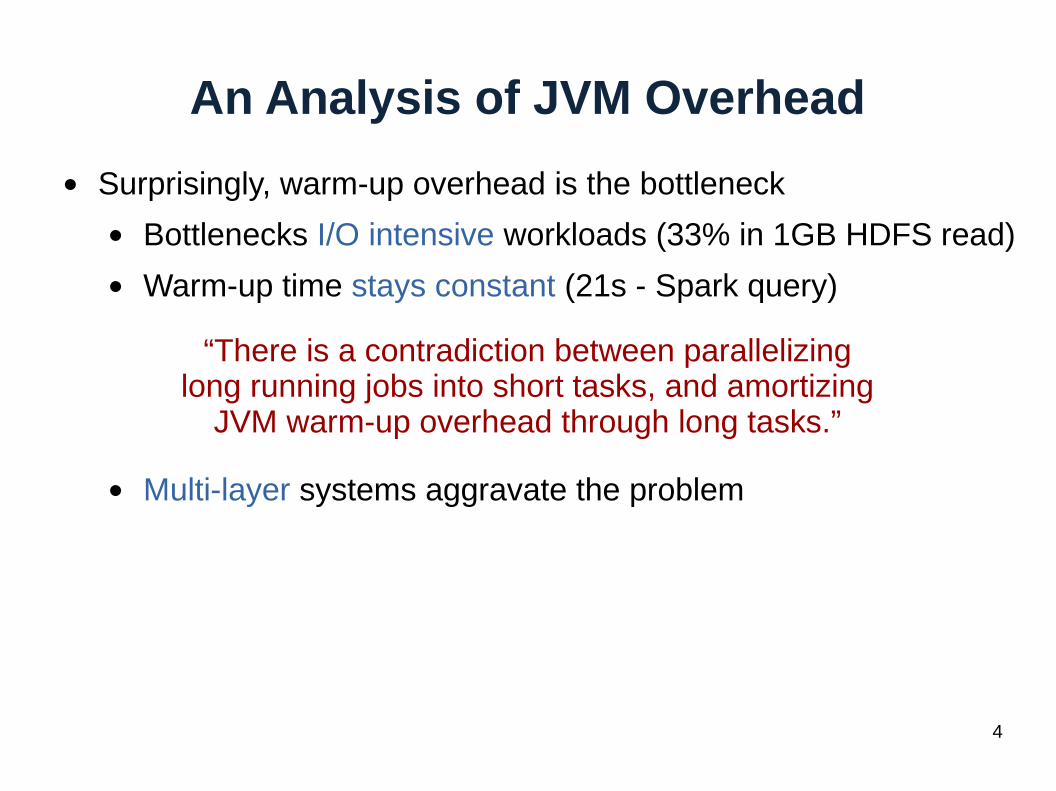
An Analysis of JVM Overhead
● Surprisingly, warm-up overhead is the bottleneck
● Bottlenecks I/O intensive workloads (33% in 1GB HDFS read)
● Warm-up time stays constant (21s - Spark query)
● Multi-layer systems aggravate the problem
“There is a contradiction between parallelizing long running jobs into short tasks, and amortizing
JVM warm-up overhead through long tasks.”
5
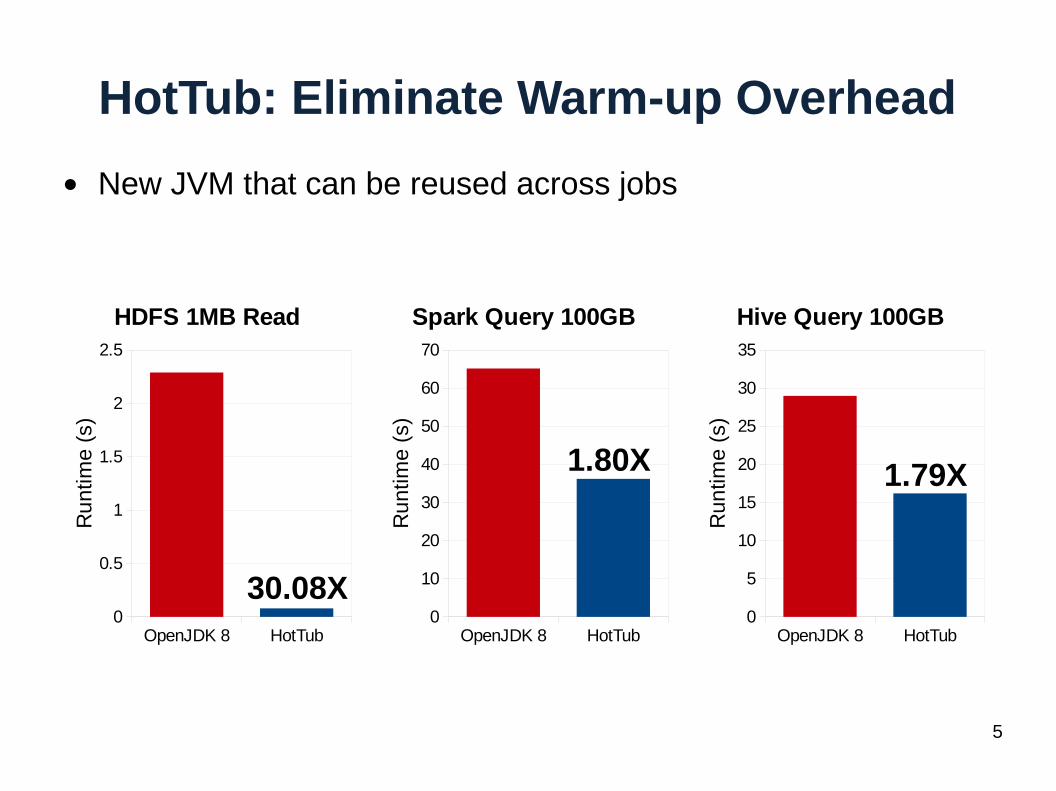
HotTub: Eliminate Warm-up Overhead
● New JVM that can be reused across jobs
OpenJDK 8 HotTub0
10
20
30
40
50
60
70
Spark Query 100GB
Ru
ntim
e (
s)
OpenJDK 8 HotTub0
5
10
15
20
25
30
35
Hive Query 100GB
Run
time
(s)
OpenJDK 8 HotTub0
0.5
1
1.5
2
2.5
HDFS 1MB Read
Ru
ntim
e (
s)
30.08X
1.80X 1.79X
6
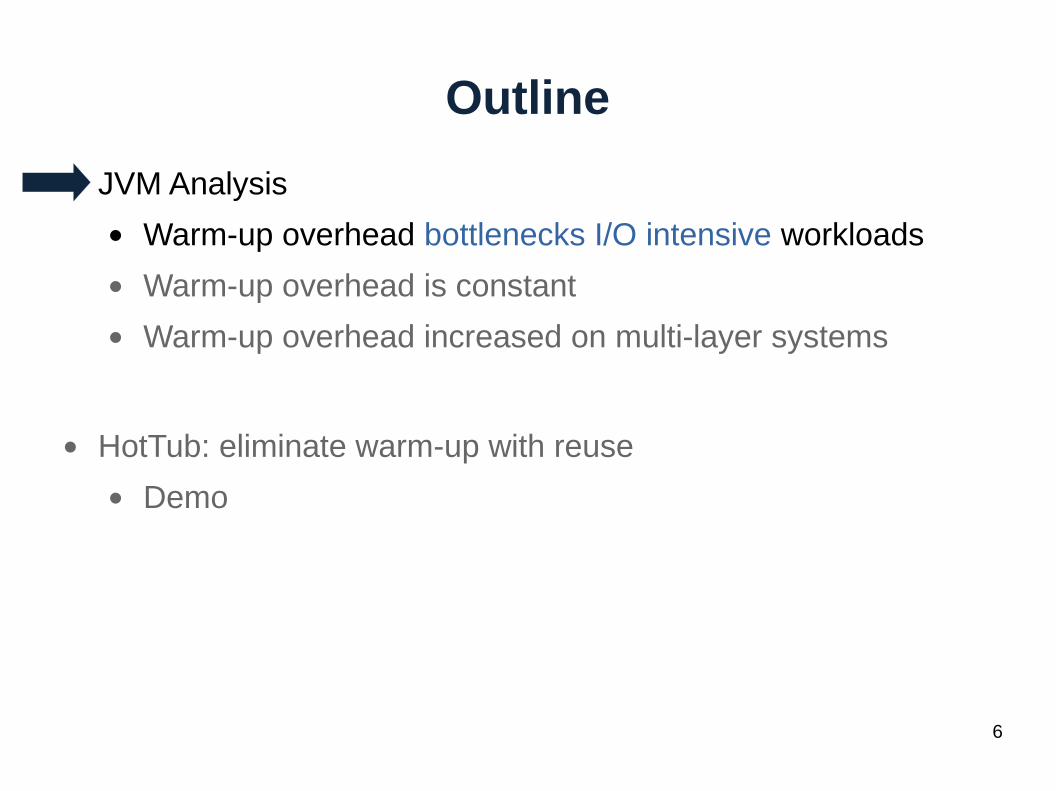
Outline
● JVM Analysis
● Warm-up overhead bottlenecks I/O intensive workloads
● Warm-up overhead is constant
● Warm-up overhead increased on multi-layer systems
● HotTub: eliminate warm-up with reuse
● Demo
7
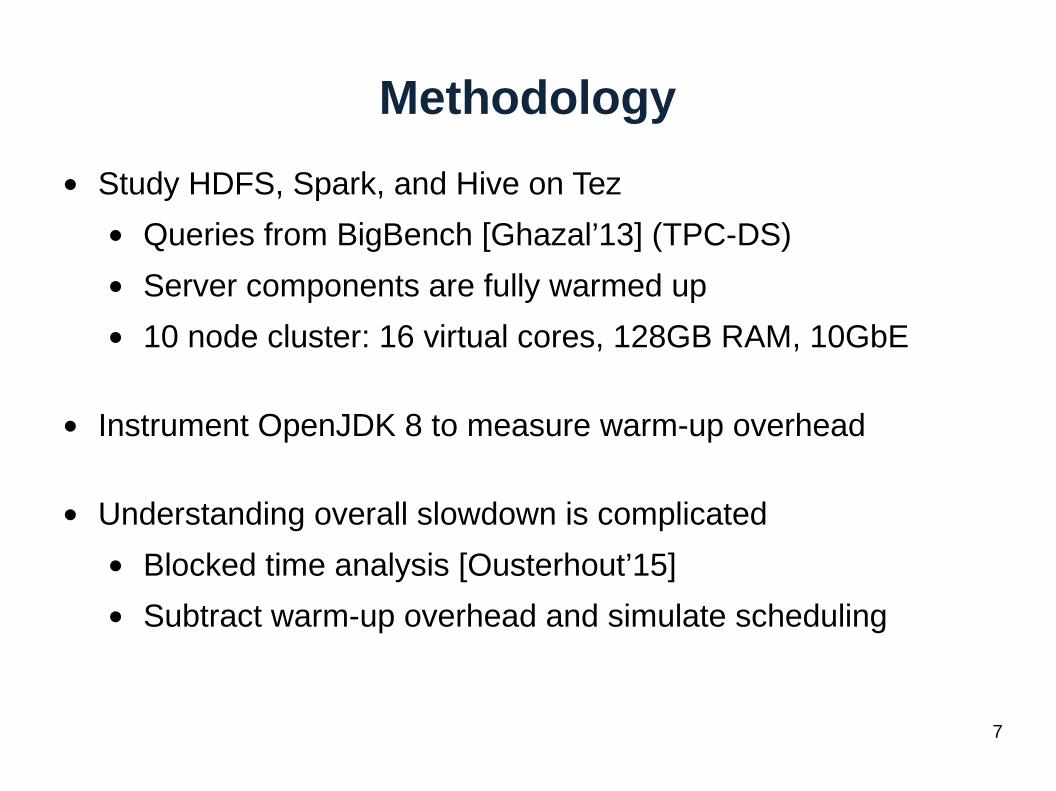
Methodology
● Study HDFS, Spark, and Hive on Tez
● Queries from BigBench [Ghazal’13] (TPC-DS)
● Server components are fully warmed up
● 10 node cluster: 16 virtual cores, 128GB RAM, 10GbE
● Instrument OpenJDK 8 to measure warm-up overhead
● Understanding overall slowdown is complicated
● Blocked time analysis [Ousterhout’15]
● Subtract warm-up overhead and simulate scheduling
8
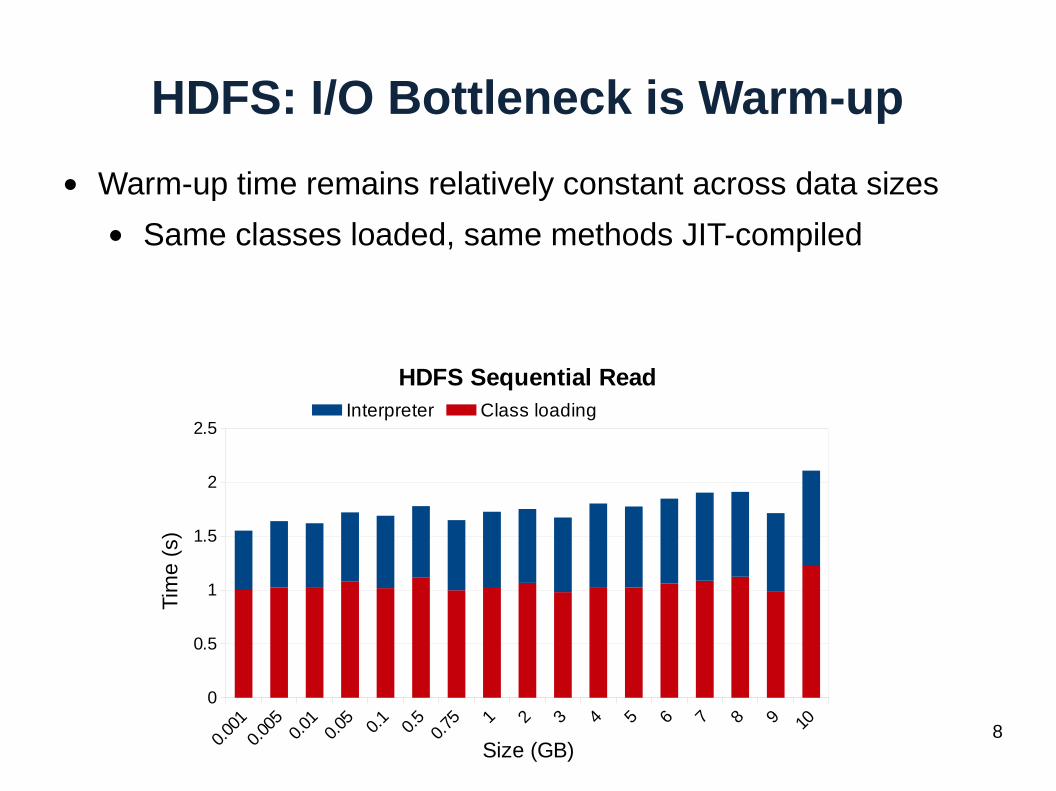
HDFS: I/O Bottleneck is Warm-up
● Warm-up time remains relatively constant across data sizes
● Same classes loaded, same methods JIT-compiled
0.00
10.
005
0.01
0.05 0.
10.
50.
75 1 2 3 4 5 6 7 8 9 100
0.5
1
1.5
2
2.5
HDFS Sequential ReadInterpreter Class loading
Size (GB)
Tim
e (
s)
9
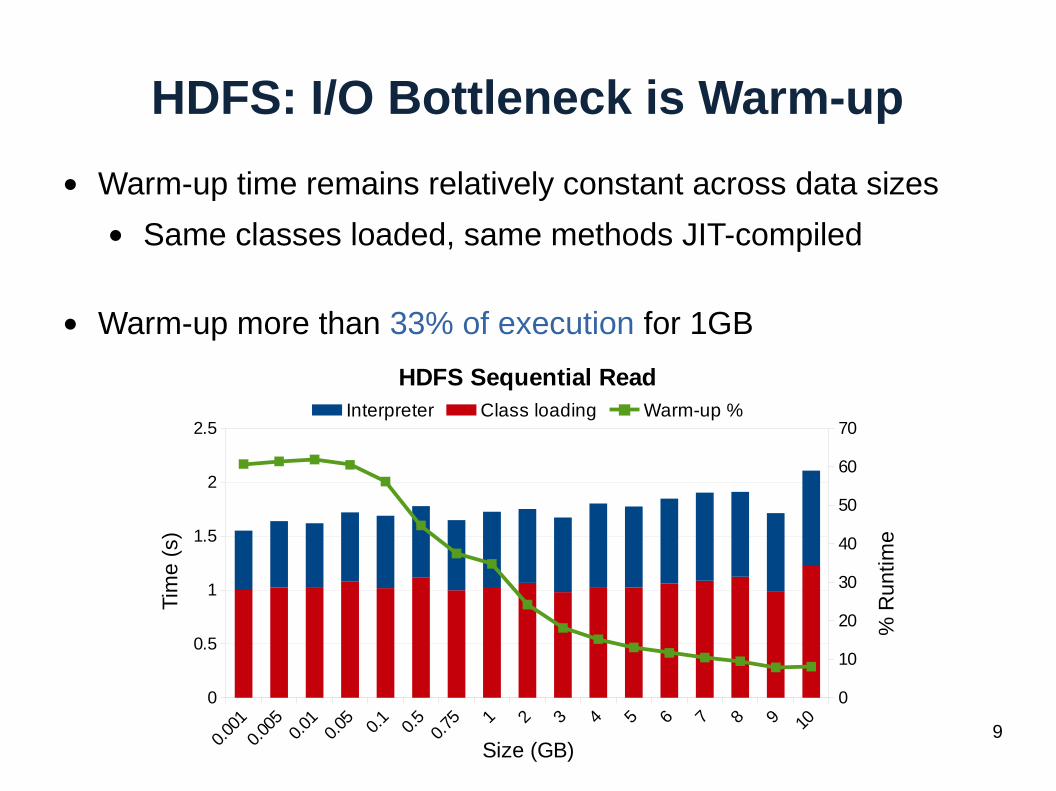
HDFS: I/O Bottleneck is Warm-up
● Warm-up time remains relatively constant across data sizes
● Same classes loaded, same methods JIT-compiled
● Warm-up more than 33% of execution for 1GB
0.00
10.
005
0.01
0.05 0.
10.
50.
75 1 2 3 4 5 6 7 8 9 100
0.5
1
1.5
2
2.5
0
10
20
30
40
50
60
70
HDFS Sequential ReadInterpreter Class loading Warm-up %
Size (GB)
Tim
e (
s)
% R
un
time
10
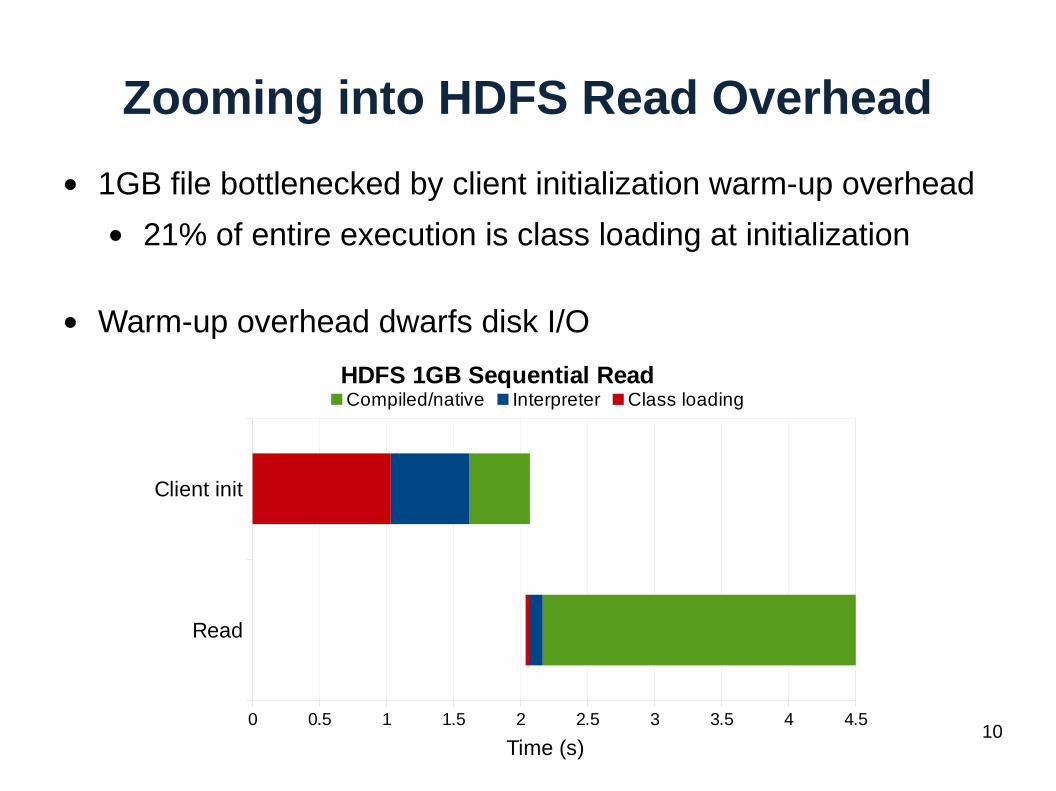
Zooming into HDFS Read Overhead
● 1GB file bottlenecked by client initialization warm-up overhead
● 21% of entire execution is class loading at initialization
● Warm-up overhead dwarfs disk I/O
Read
Client init
0 0.5 1 1.5 2 2.5 3 3.5 4 4.5
HDFS 1GB Sequential ReadCompiled/native Interpreter Class loading
Time (s)
11
ack
0 5 10 15 20 25 30 35 40 45 50
HDFS Datanode I/OCompiled/native Interpreter Class loading
Time (ms)
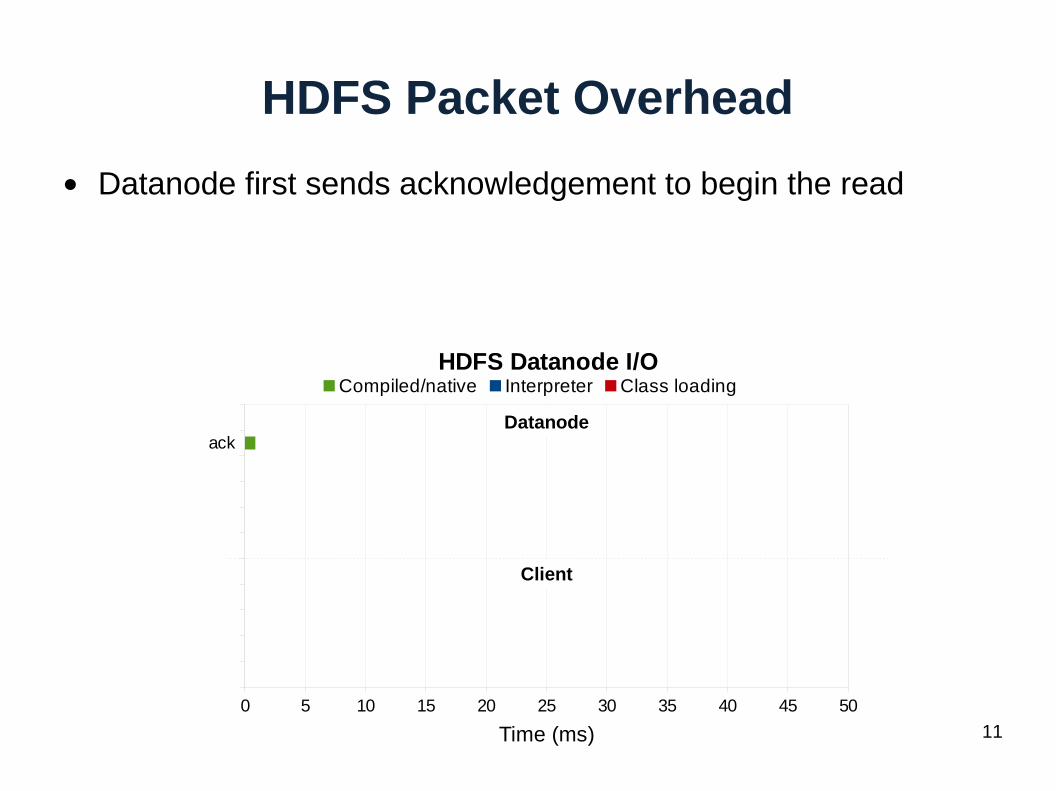
HDFS Packet Overhead
● Datanode first sends acknowledgement to begin the read
Datanode
Client
12
parse DN ack
ack
0 5 10 15 20 25 30 35 40 45 50
HDFS Datanode I/OCompiled/native Interpreter Class loading
Time (ms)
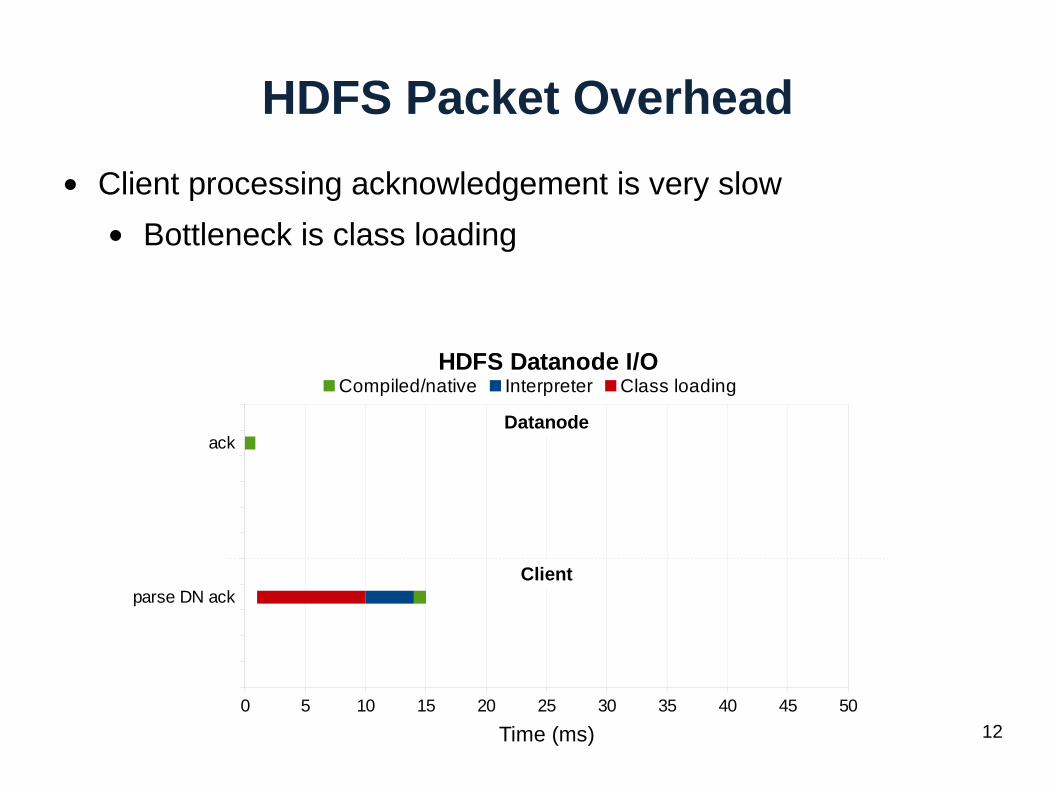
HDFS Packet Overhead
● Client processing acknowledgement is very slow
● Bottleneck is class loading
Datanode
Client
13
parse DN ack
sendfile 1-38
ack
0 5 10 15 20 25 30 35 40 45 50
HDFS Datanode I/OCompiled/native Interpreter Class loading
Time (ms)
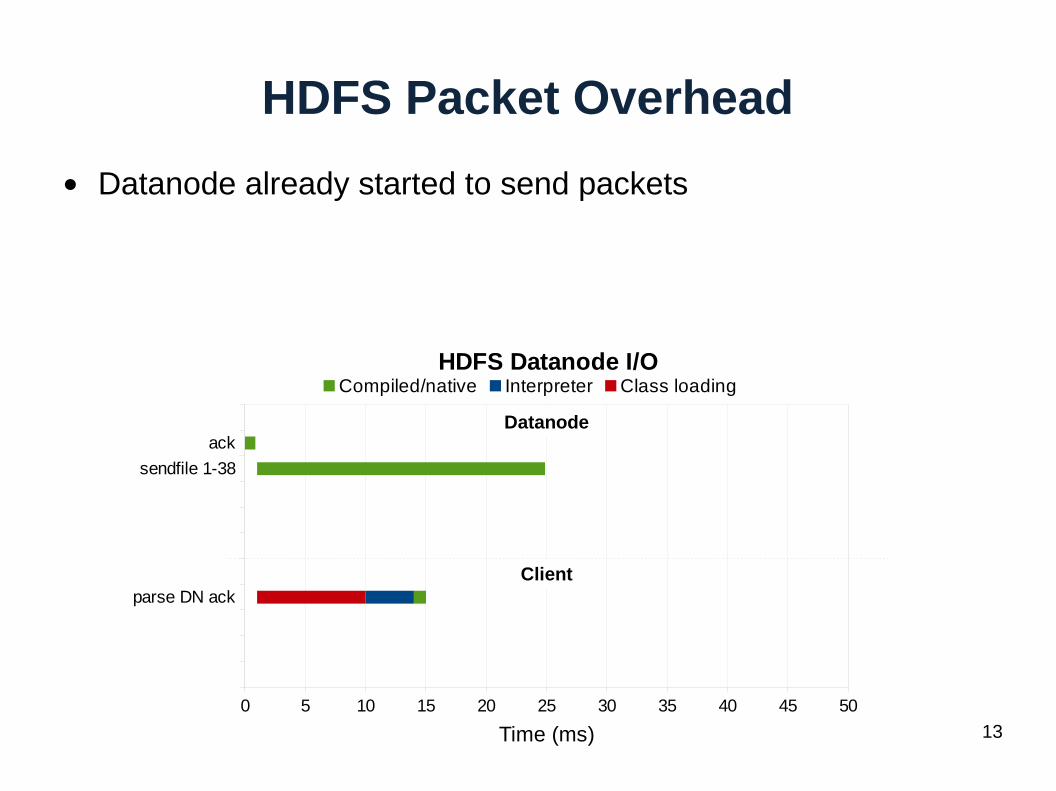
HDFS Packet Overhead
● Datanode already started to send packets
Datanode
Client
14
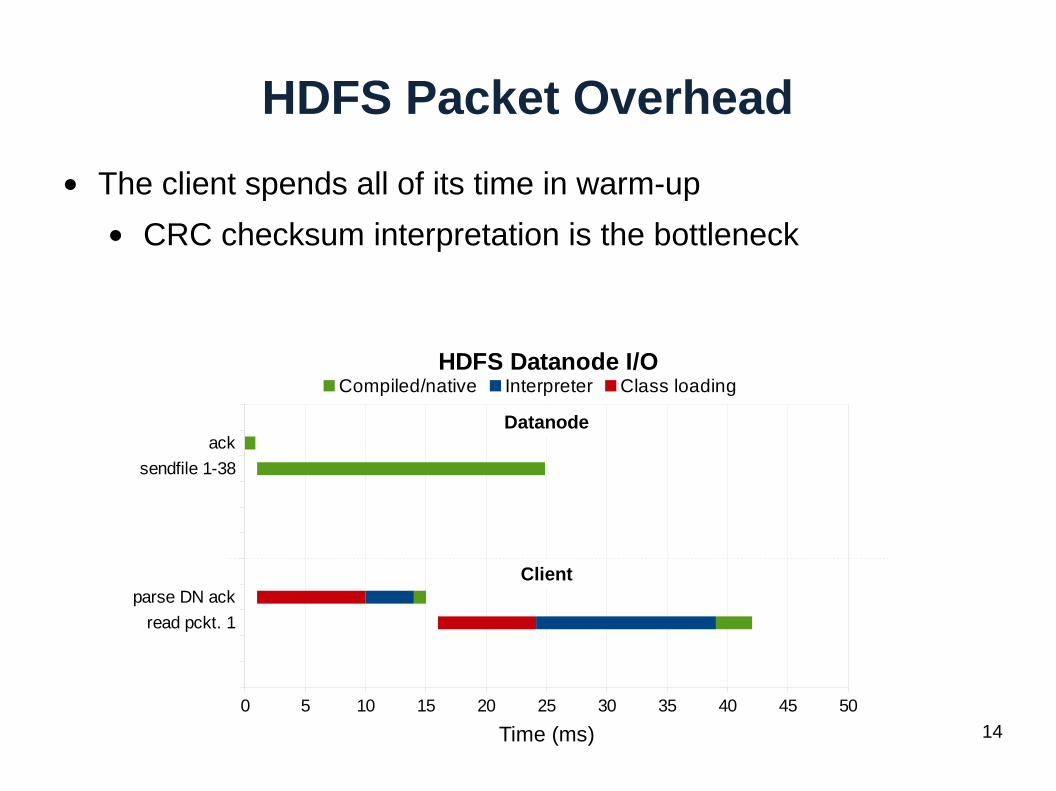
read pckt. 1
parse DN ack
sendfile 1-38
ack
0 5 10 15 20 25 30 35 40 45 50
HDFS Datanode I/OCompiled/native Interpreter Class loading
Time (ms)
HDFS Packet Overhead
● The client spends all of its time in warm-up
● CRC checksum interpretation is the bottleneck
Datanode
Client
15
read pckt. 1
parse DN ack
wait
sendfile 1-38
ack
0 5 10 15 20 25 30 35 40 45 50
HDFS Datanode I/OCompiled/native Interpreter Class loading
Time (ms)
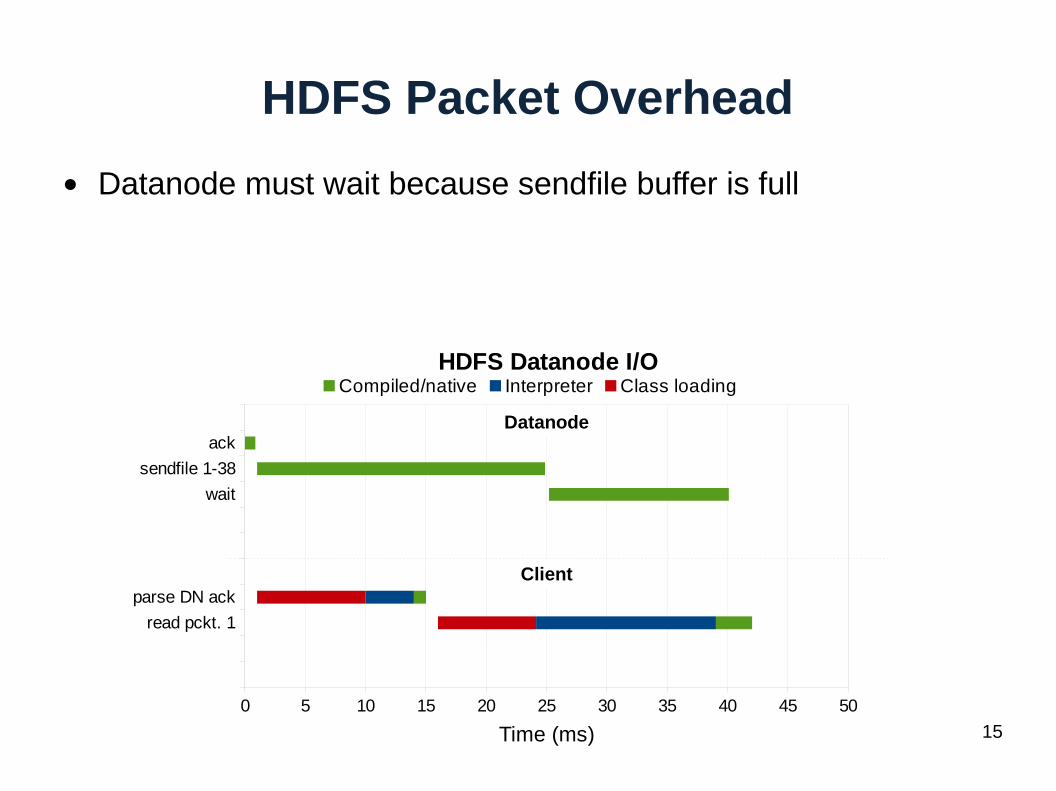
HDFS Packet Overhead
● Datanode must wait because sendfile buffer is full
Datanode
Client
16
read pckt. 3
read pckt. 2
read pckt. 1
parse DN ack
sendfile 39-109
wait
sendfile 1-38
ack
0 5 10 15 20 25 30 35 40 45 50
HDFS Datanode I/OCompiled/native Interpreter Class loading
Time (ms)
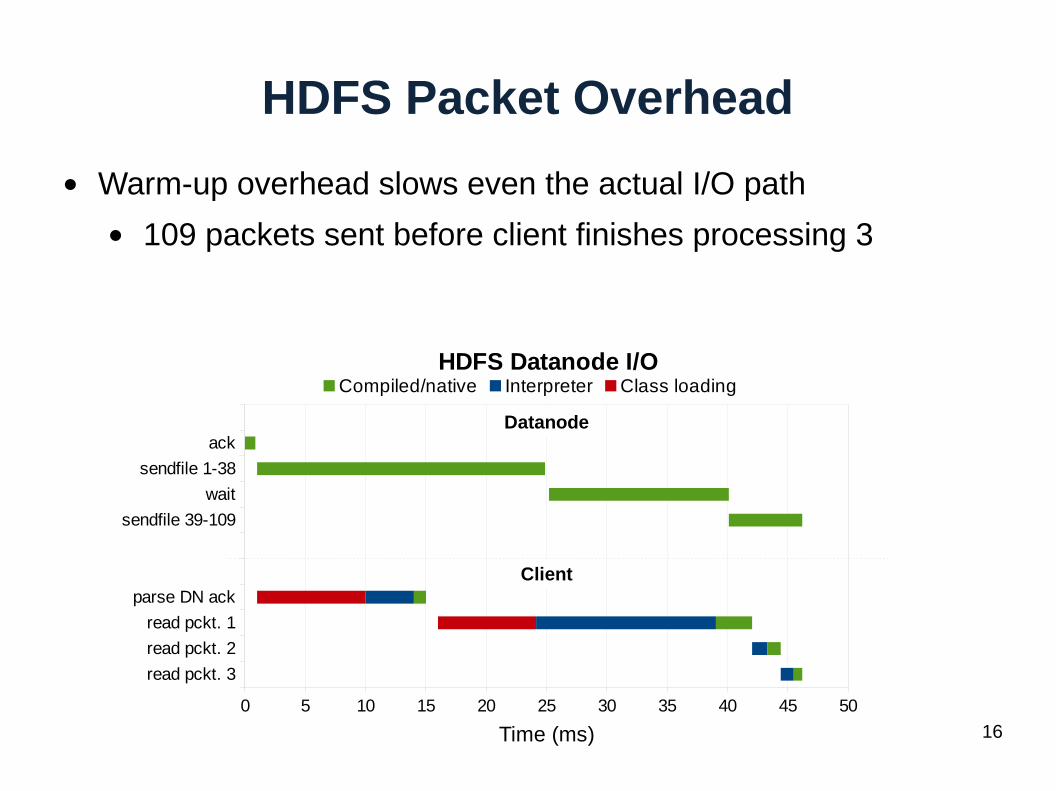
HDFS Packet Overhead
● Warm-up overhead slows even the actual I/O path
● 109 packets sent before client finishes processing 3
Datanode
Client
17
0
5
10
15
20
25
30
35
40
45
Warm-up Over StudyInterpreter Class loading
Tim
e (
s)
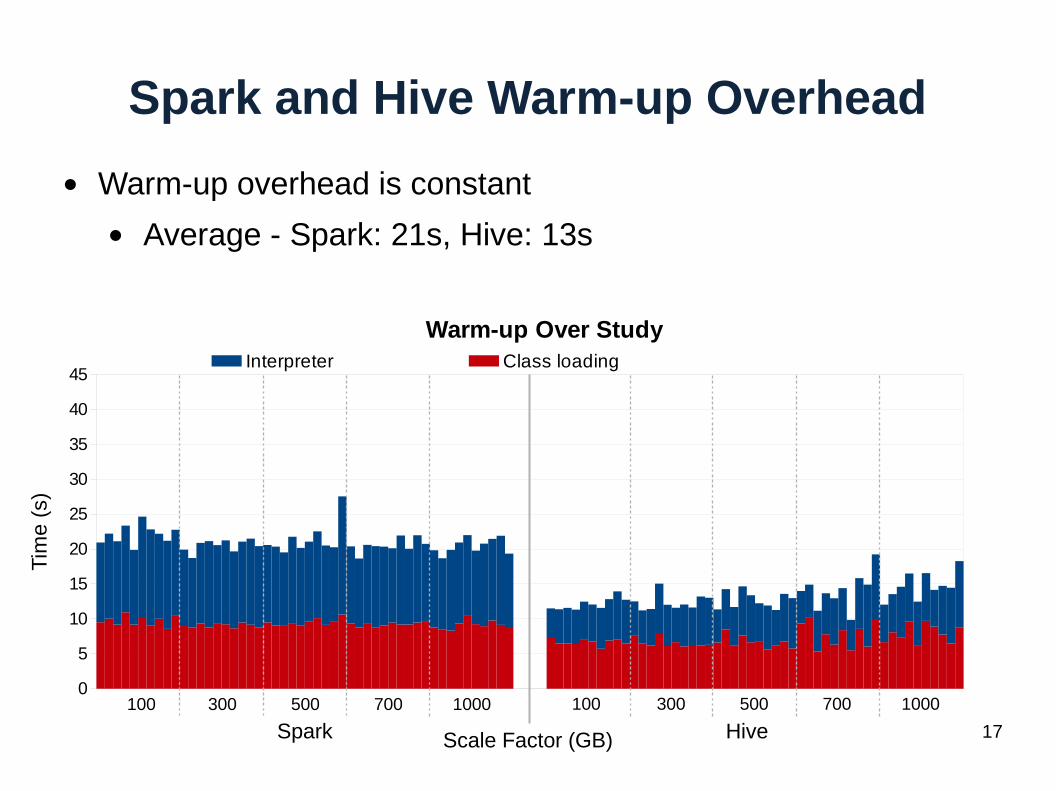
Spark and Hive Warm-up Overhead
● Warm-up overhead is constant
● Average - Spark: 21s, Hive: 13s
Spark HiveScale Factor (GB)
100 300 500 700 1000 100 300 500 700 1000
18
0
5
10
15
20
25
30
35
40
45
0
5
10
15
20
25
30
35
40
45
Warm-up Over StudyInterpreter Class loading Warm-up %
Tim
e (
s)
% R
un
time
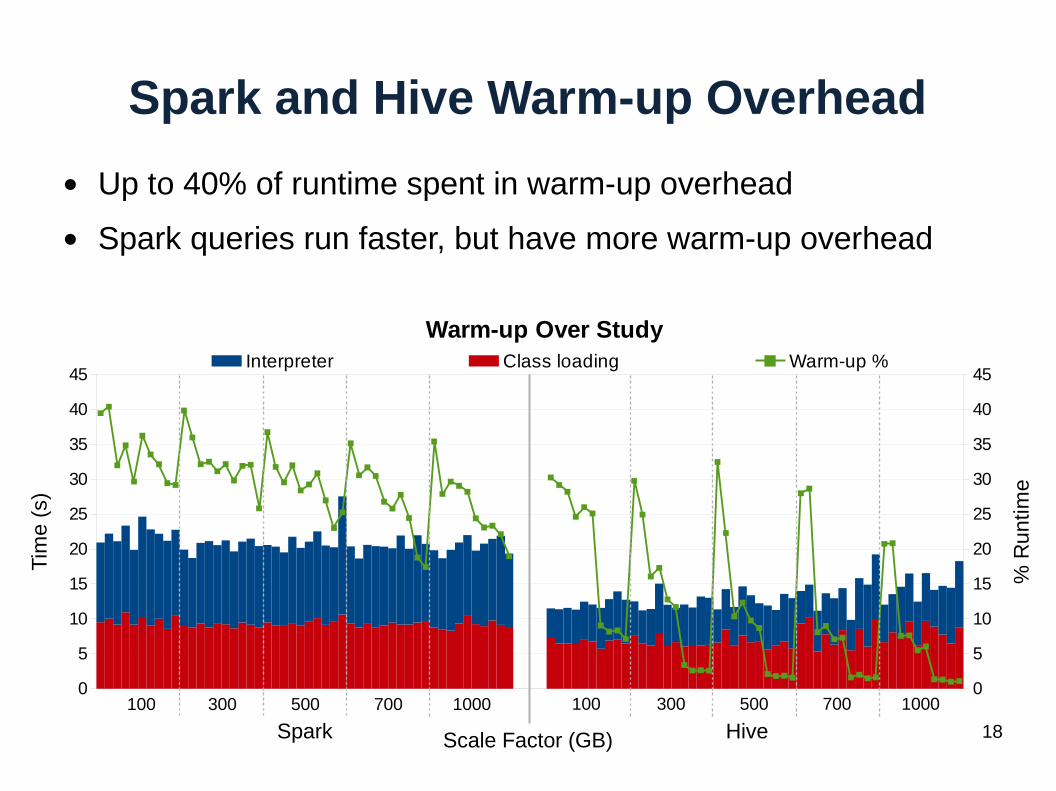
Spark and Hive Warm-up Overhead
● Up to 40% of runtime spent in warm-up overhead
● Spark queries run faster, but have more warm-up overhead
Spark HiveScale Factor (GB)
100 300 500 700 1000 100 300 500 700 1000
19Spark Hive
0
2000
4000
6000
8000
10000
12000
14000
16000
18000
20000
Client Classes
Cla
sse
s L
oade
d
Spark Package Classes
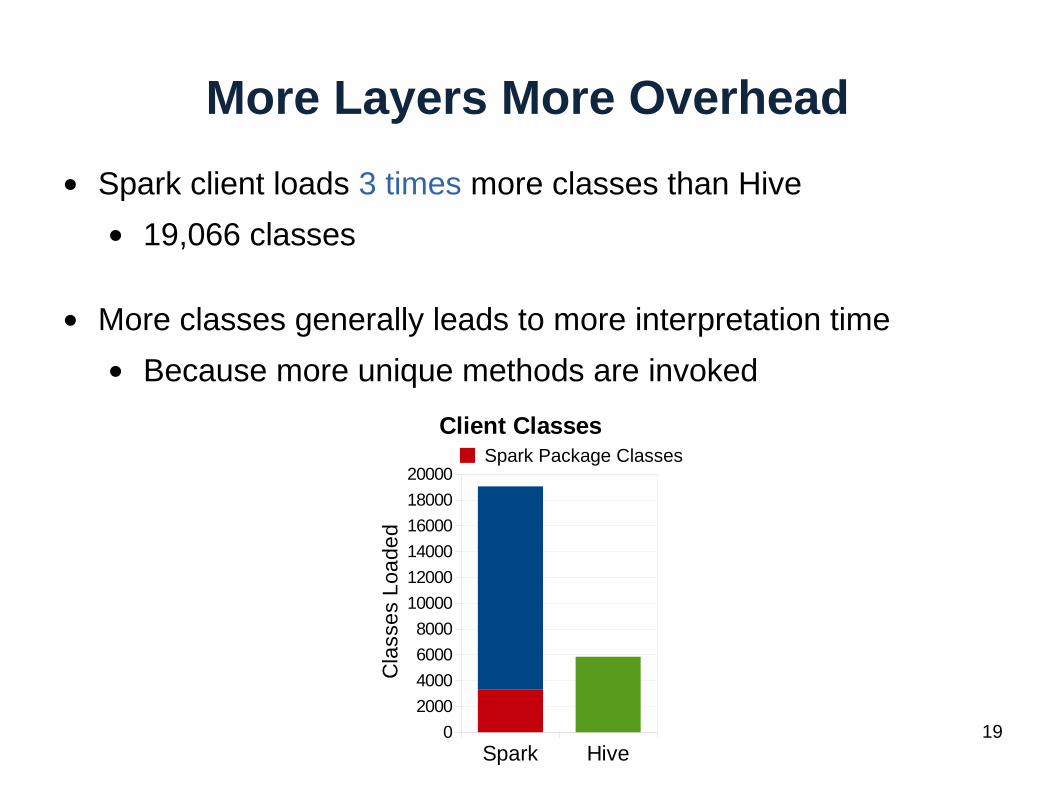
More Layers More Overhead
● Spark client loads 3 times more classes than Hive
● 19,066 classes
● More classes generally leads to more interpretation time
● Because more unique methods are invoked
20
JVM Reuse is Hard at Application Layer
● Spark and Tez already try to reuse JVMs
● But only within a job
● Many challenges exist when reusing JVMs
● Need to ensure same classes are used● Need to reset all static data
● 3rd party libraries make this even harder
● Close file descriptors● Kill threads
● Signals
21
Outline
● JVM Analysis
● Warm-up overhead bottlenecks I/O intensive workloads
● Warm-up overhead is constant
● Warm-up overhead increased on multi-layer systems
● HotTub: eliminate warm-up with reuse
● Demo
22
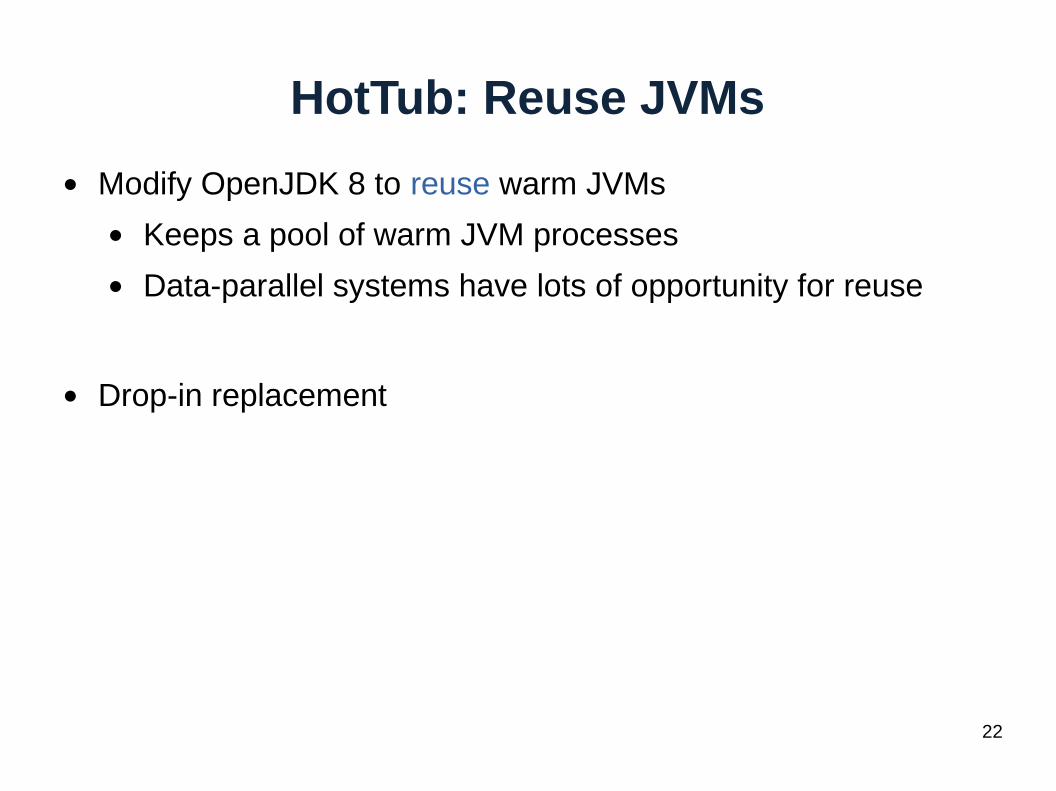
HotTub: Reuse JVMs
● Modify OpenJDK 8 to reuse warm JVMs
● Keeps a pool of warm JVM processes
● Data-parallel systems have lots of opportunity for reuse
● Drop-in replacement
23
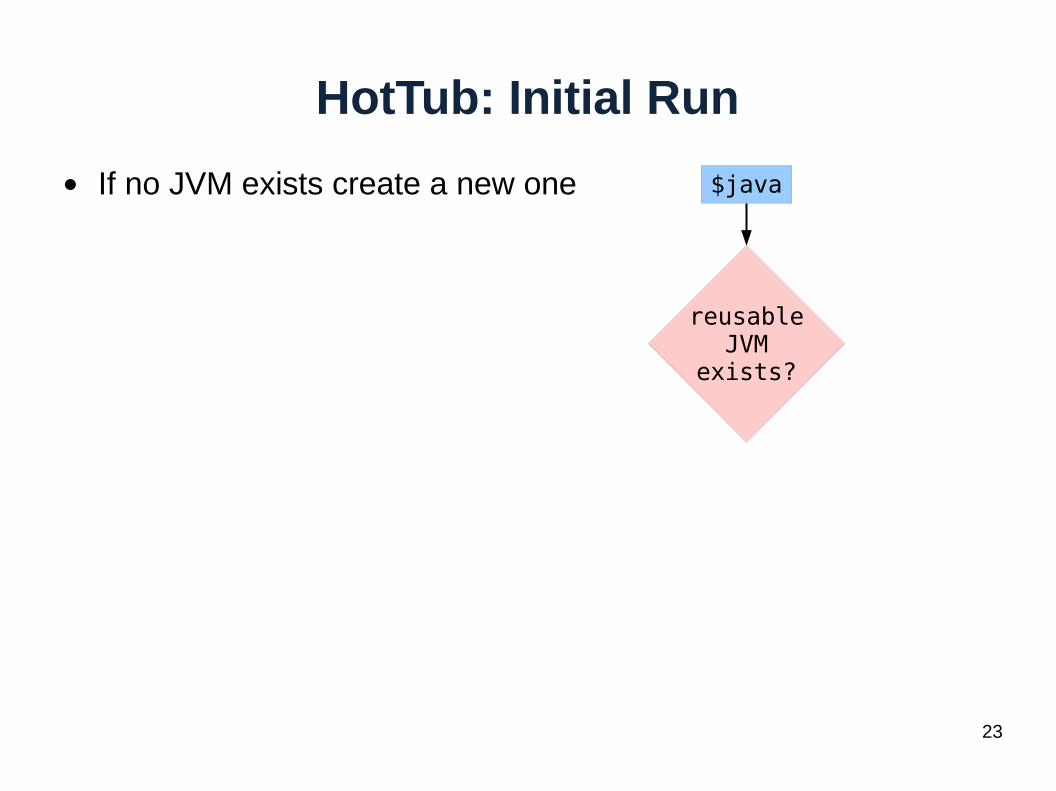
HotTub: Initial Run
● If no JVM exists create a new one $java
reusableJVM
exists?
24
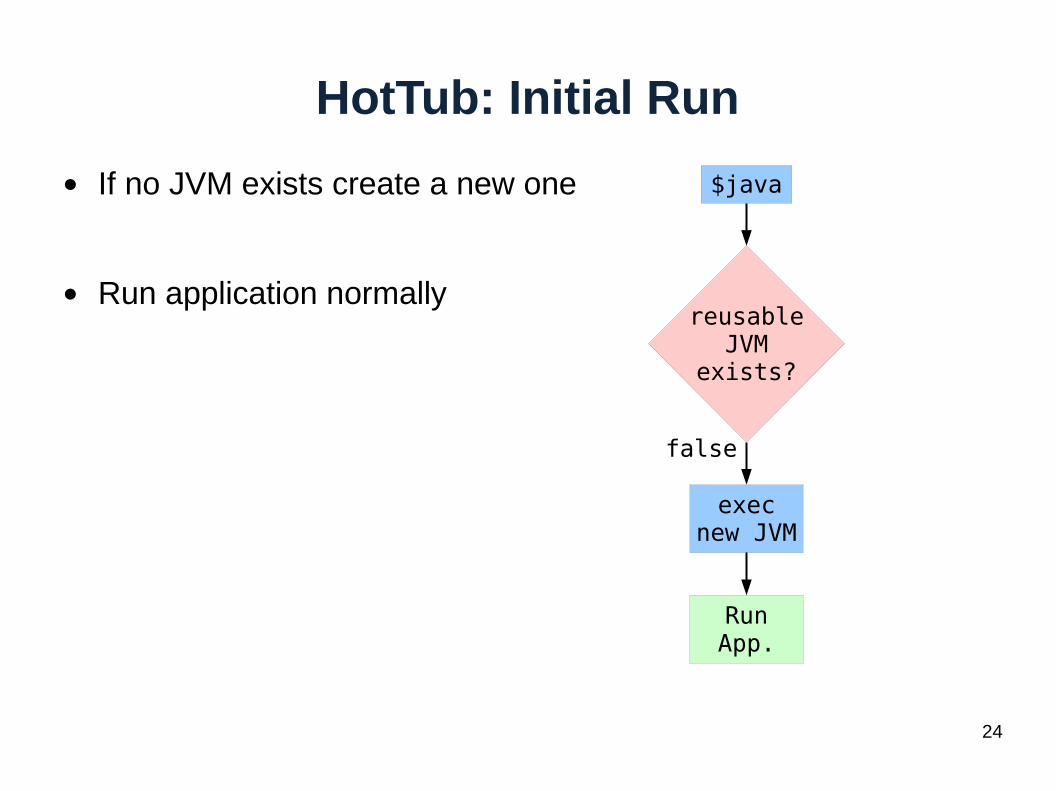
HotTub: Initial Run
● If no JVM exists create a new one
● Run application normally
$java
reusableJVM
exists?
execnew JVM
RunApp.
false
25
JVMJVMJVM
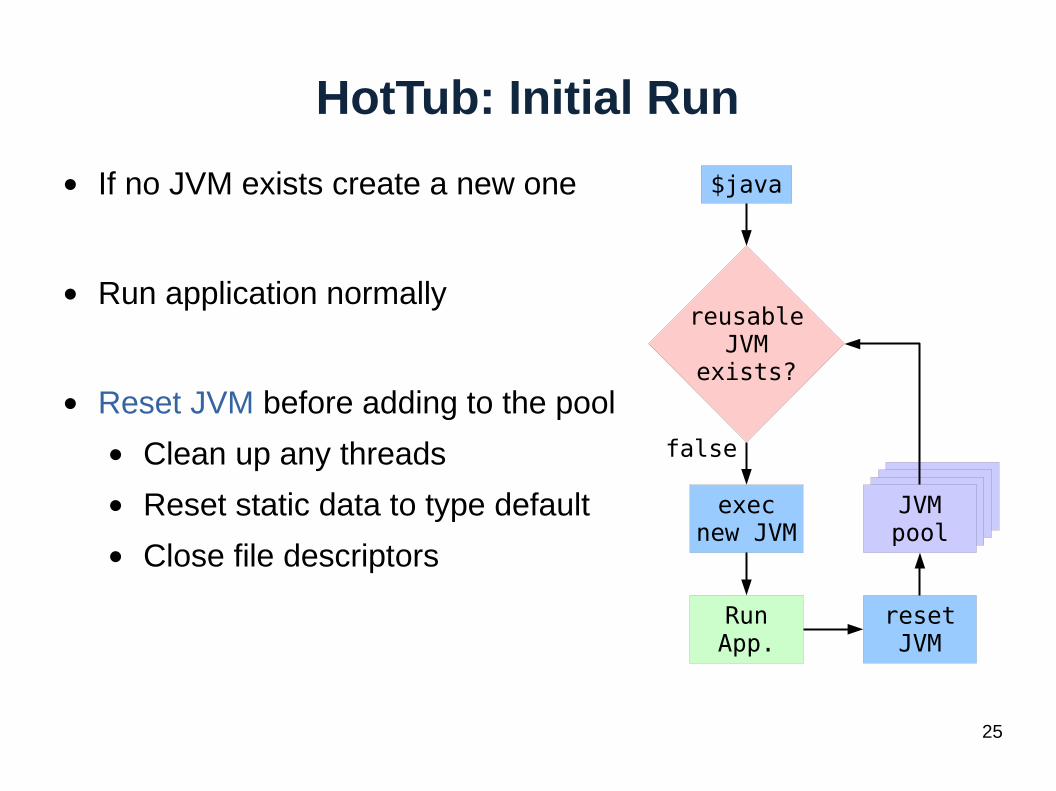
HotTub: Initial Run
● If no JVM exists create a new one
● Run application normally
● Reset JVM before adding to the pool
● Clean up any threads
● Reset static data to type default
● Close file descriptors
$java
reusableJVM
exists?
execnew JVM
JVMpool
RunApp.
resetJVM
false
26
JVMJVMJVM
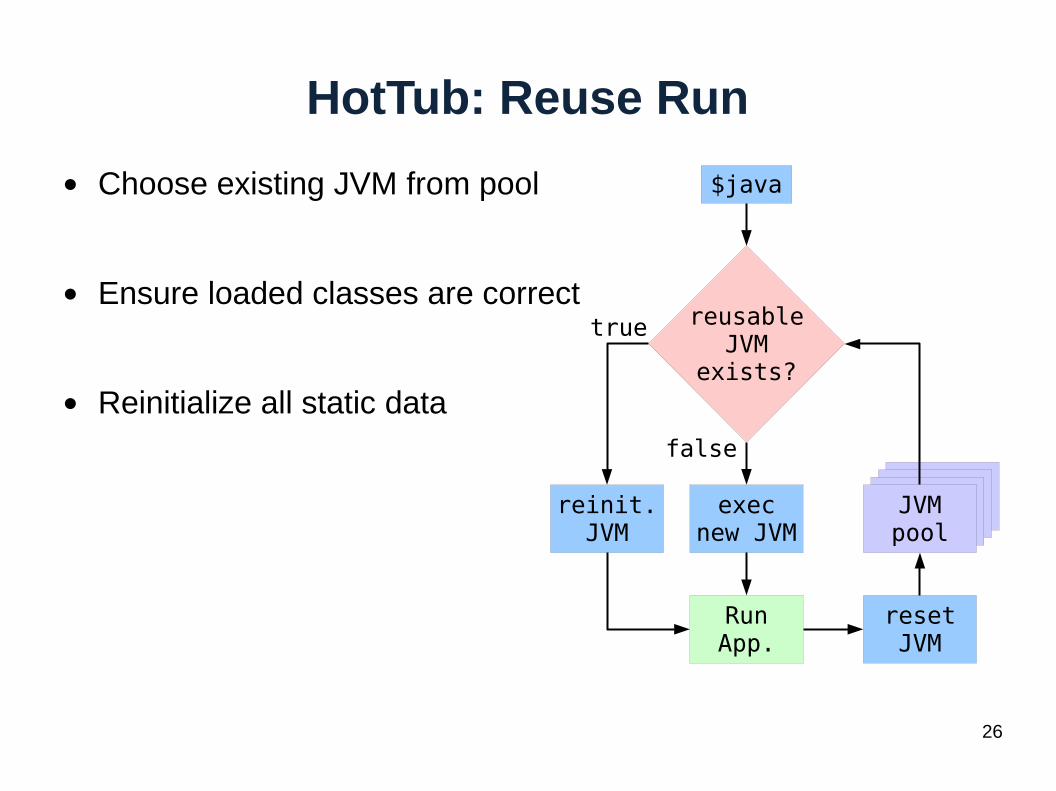
HotTub: Reuse Run
● Choose existing JVM from pool
● Ensure loaded classes are correct
● Reinitialize all static data
$java
reusableJVM
exists?
reinit.JVM
execnew JVM
JVMpool
RunApp.
resetJVM
true
false

HotTub Demo
28
1MB 1GB0
1
2
3
4
5
6
7
8
HDFS ReadOpenJDK 8 HotTub
File Size
Run
time
s (s
)
Best Worst0
10
20
30
40
50
60
70
80
Spark 100GBOpenJDK 8 HotTub
BigBench Query (Speedup)
Run
time
s (s
)
Best Worst0
50
100
150
200
250
Hive 100GBOpenJDK 8 HotTub
BigBench Query (Speedup)
Ru
ntim
es
(s)
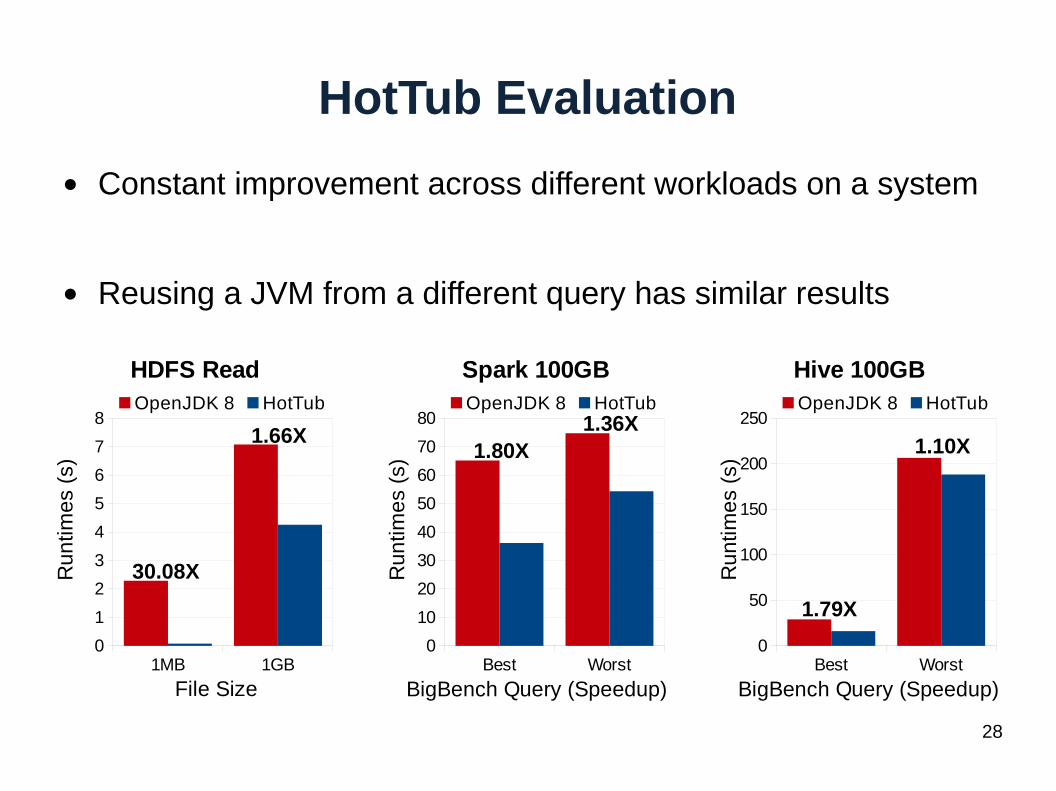
HotTub Evaluation
● Constant improvement across different workloads on a system
● Reusing a JVM from a different query has similar results
1.66X
30.08X
1.80X1.36X
1.79X
1.10X
29
Limitations
● Security: limit reuse to same Linux user
● Could see loaded classes and compiled methods
● Similar to timing channel
● Not useful for long running JVMs
● Breaks the JVM specification for class initialization on edge cases
30
Related Work
● Garbage collection overhead in data-parallel systems
● Yak [Nguyen'16], Taurus [Maas'16], Broom [Gog'15], etc
● Not warm-up overhead
● Studies on data-parallel systems
● [Ousterhout'15], [Pavlo'09], etc
● Not targeting the JVM
● Studies on the cost of scalability [McSherry'15]
● Work on JVM unrelated to data-parallel systems
31
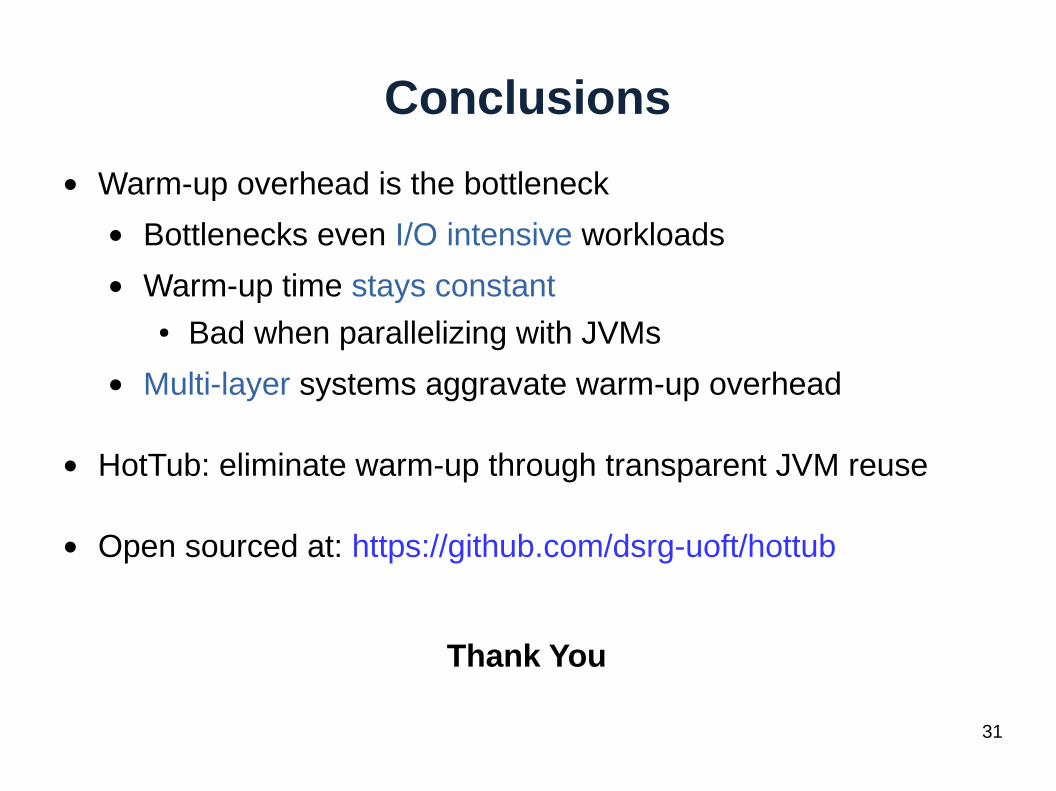
Conclusions
● Warm-up overhead is the bottleneck
● Bottlenecks even I/O intensive workloads
● Warm-up time stays constant● Bad when parallelizing with JVMs
● Multi-layer systems aggravate warm-up overhead
● HotTub: eliminate warm-up through transparent JVM reuse
● Open sourced at: https://github.com/dsrg-uoft/hottub
Thank You

Extra Slides
33
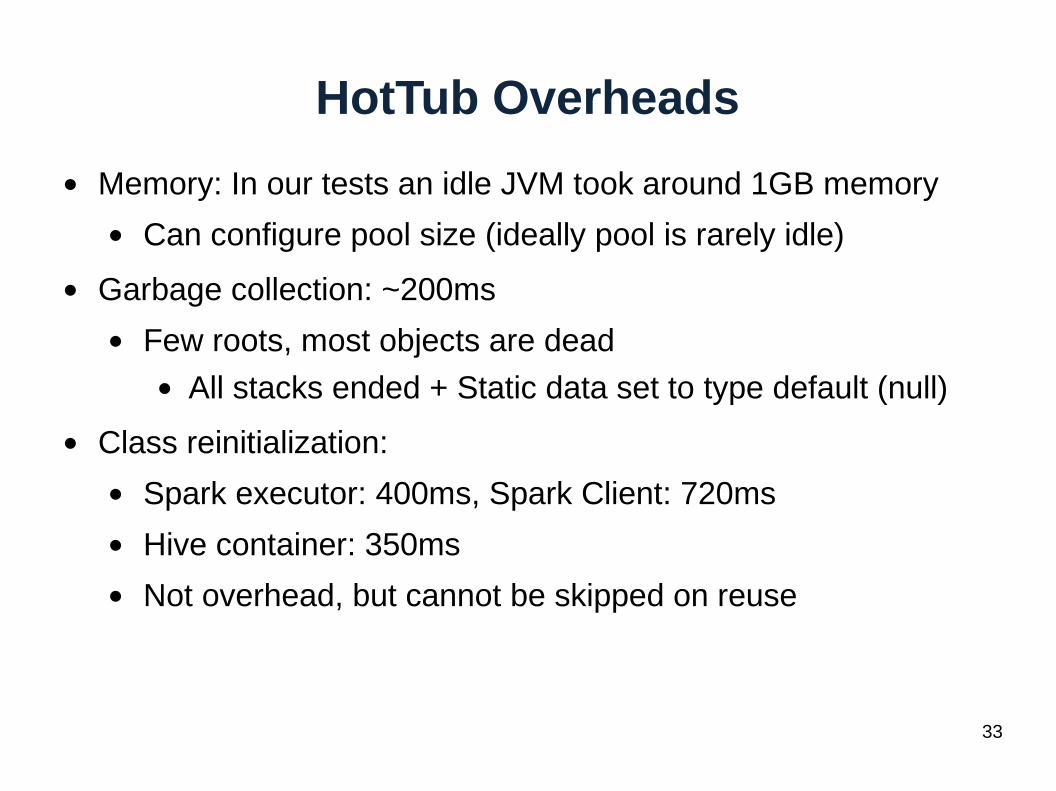
HotTub Overheads
● Memory: In our tests an idle JVM took around 1GB memory
● Can configure pool size (ideally pool is rarely idle)
● Garbage collection: ~200ms
● Few roots, most objects are dead● All stacks ended + Static data set to type default (null)
● Class reinitialization:
● Spark executor: 400ms, Spark Client: 720ms
● Hive container: 350ms
● Not overhead, but cannot be skipped on reuse
34
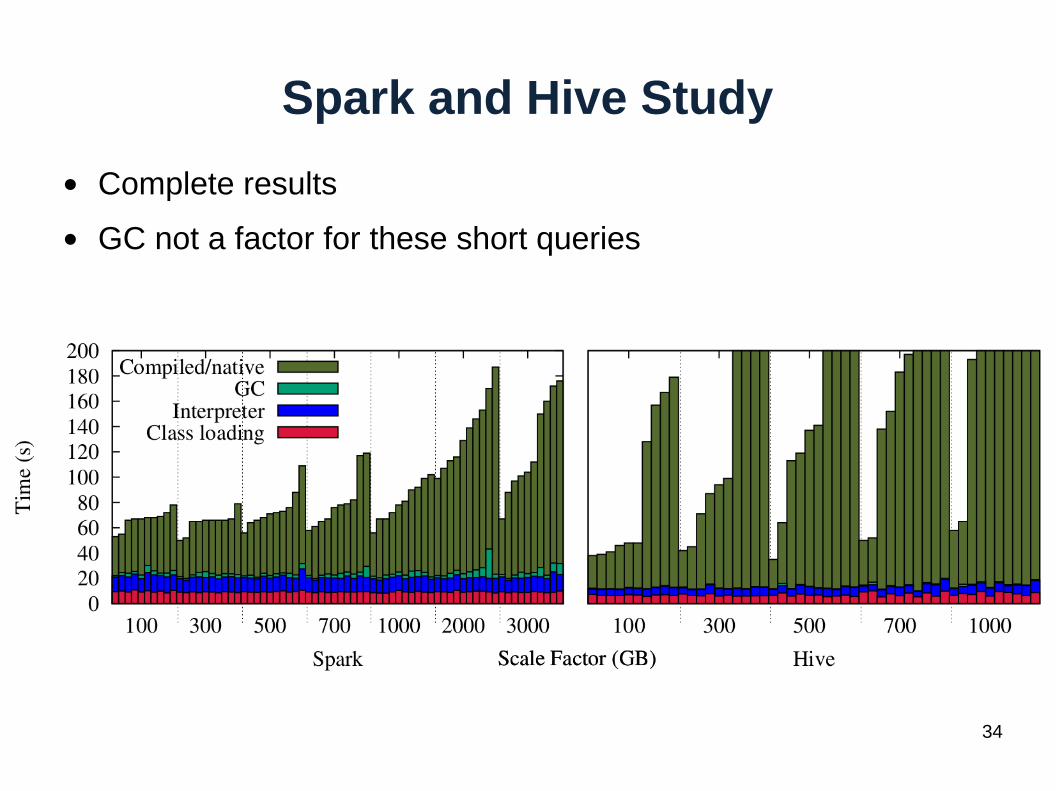
Spark and Hive Study
● Complete results
● GC not a factor for these short queries
35
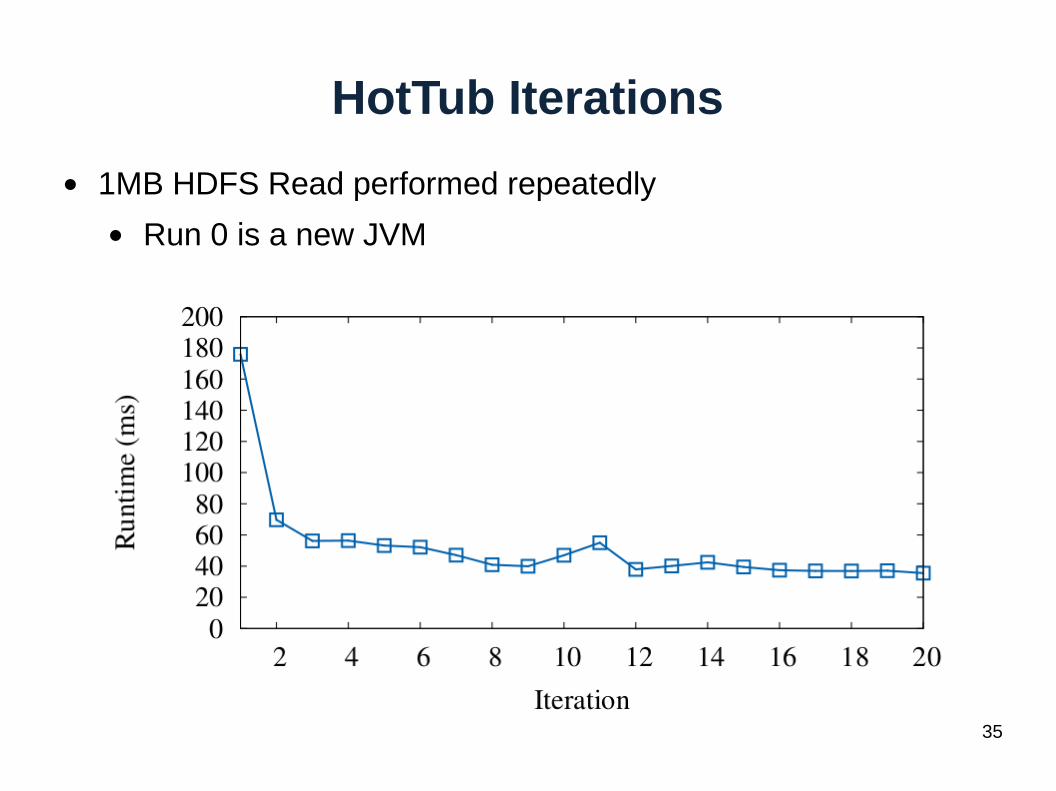
HotTub Iterations
● 1MB HDFS Read performed repeatedly
● Run 0 is a new JVM
36
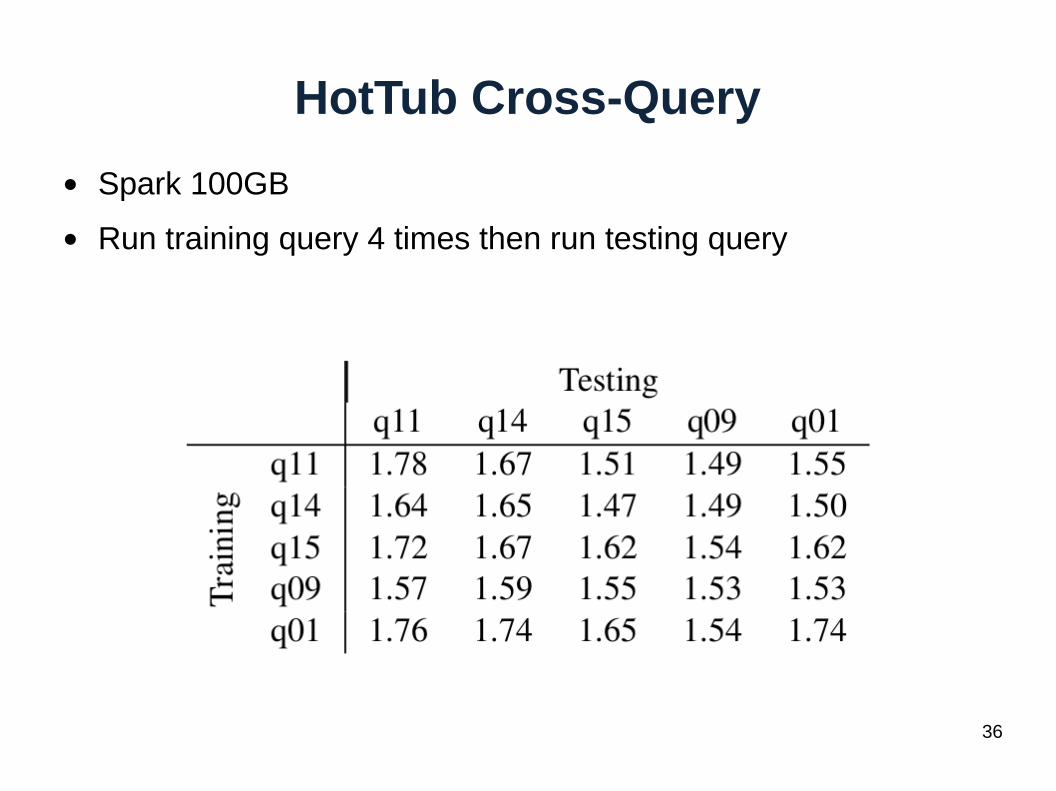
HotTub Cross-Query
● Spark 100GB
● Run training query 4 times then run testing query
37
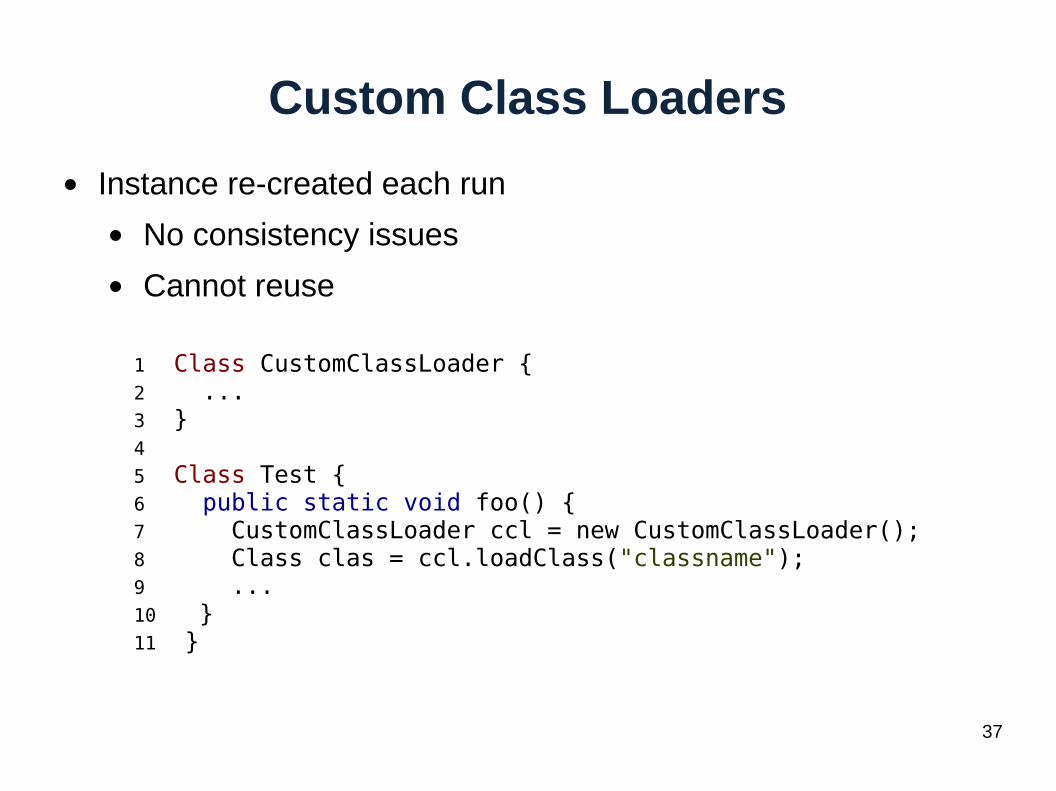
Custom Class Loaders
● Instance re-created each run
● No consistency issues
● Cannot reuse
1 Class CustomClassLoader {2 ...3 }4 5 Class Test {6 public static void foo() {7 CustomClassLoader ccl = new CustomClassLoader();8 Class clas = ccl.loadClass("classname");9 ...10 }11 }
38
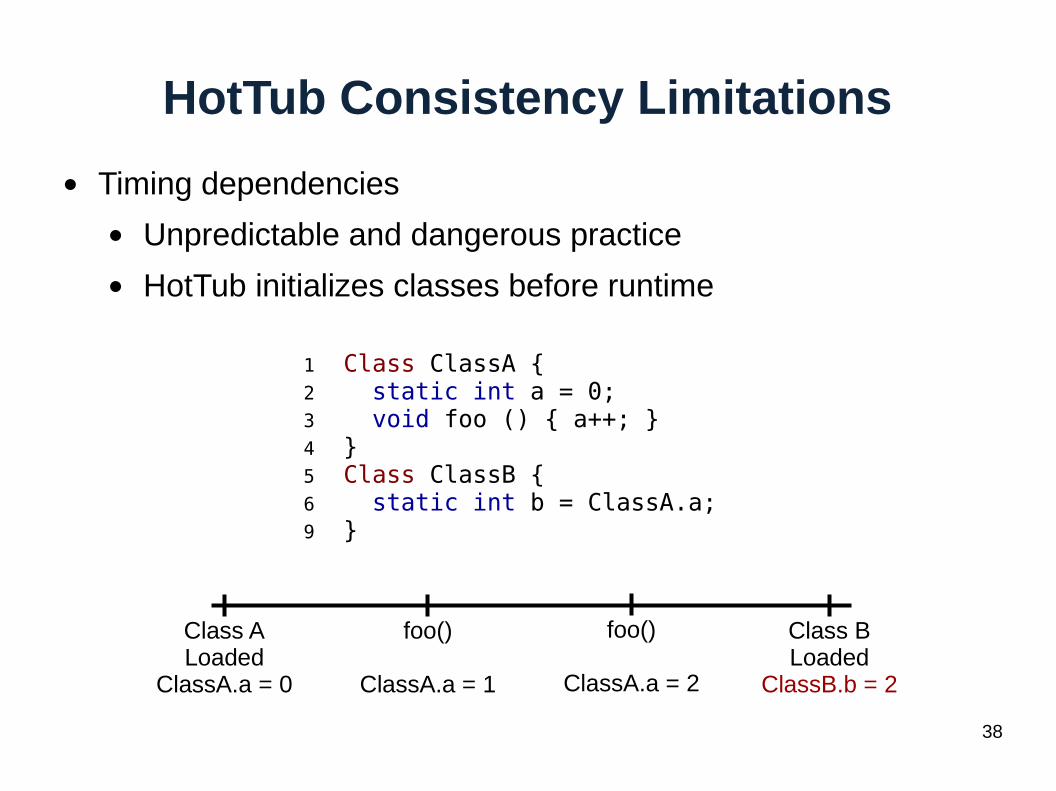
HotTub Consistency Limitations
● Timing dependencies
● Unpredictable and dangerous practice
● HotTub initializes classes before runtime
1 Class ClassA {2 static int a = 0;3 void foo () { a++; }4 }5 Class ClassB {6 static int b = ClassA.a;9 }
Class ALoaded
ClassA.a = 0
foo()
ClassA.a = 1
Class BLoaded
ClassB.b = 2
foo()
ClassA.a = 2
39
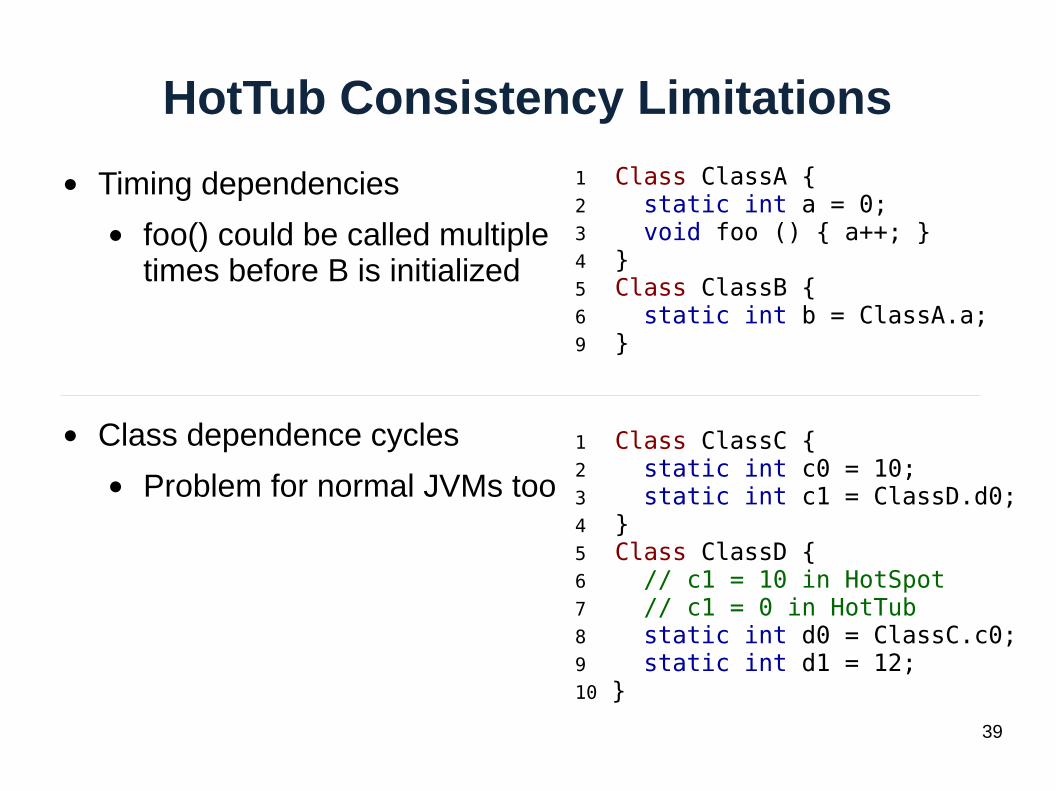
HotTub Consistency Limitations
● Timing dependencies
● foo() could be called multiple times before B is initialized
● Class dependence cycles
● Problem for normal JVMs too
1 Class ClassC {2 static int c0 = 10;3 static int c1 = ClassD.d0;4 }5 Class ClassD {6 // c1 = 10 in HotSpot7 // c1 = 0 in HotTub8 static int d0 = ClassC.c0;9 static int d1 = 12;10 }
1 Class ClassA {2 static int a = 0;3 void foo () { a++; }4 }5 Class ClassB {6 static int b = ClassA.a;9 }
40
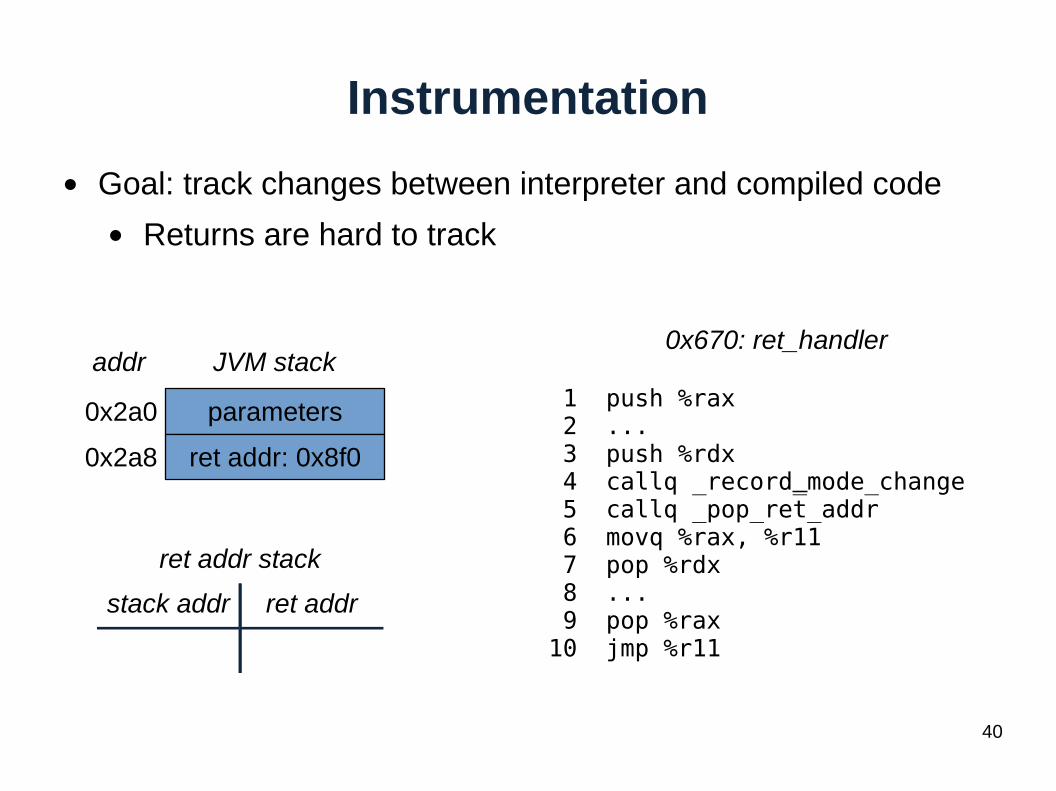
Instrumentation
● Goal: track changes between interpreter and compiled code
● Returns are hard to track
parameters0x2a0
ret addr: 0x8f00x2a8
JVM stackaddr
ret addr stack
stack addr ret addr
0x670: ret_handler
1 push %rax 2 ... 3 push %rdx 4 callq _record_mode_change 5 callq _pop_ret_addr 6 movq %rax, %r11 7 pop %rdx 8 ... 9 pop %rax10 jmp %r11
41
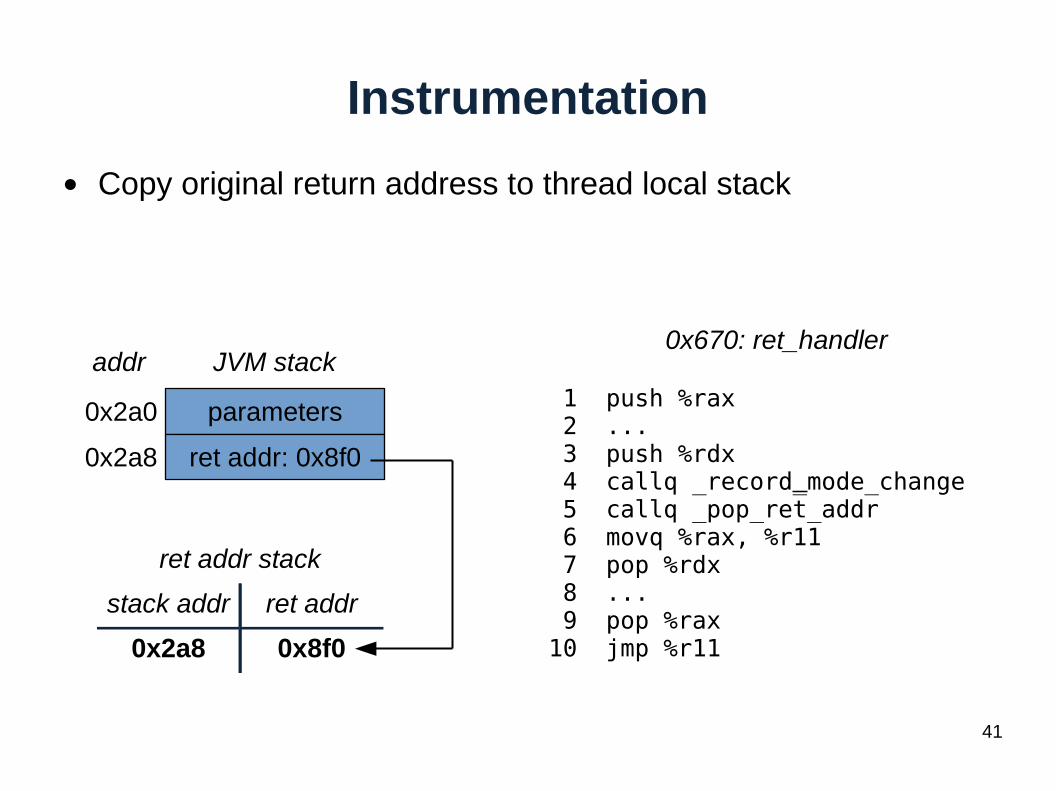
Instrumentation
● Copy original return address to thread local stack
parameters0x2a0
ret addr: 0x8f00x2a8
JVM stackaddr
ret addr stack
stack addr ret addr
0x2a8 0x8f0
0x670: ret_handler
1 push %rax 2 ... 3 push %rdx 4 callq _record_mode_change 5 callq _pop_ret_addr 6 movq %rax, %r11 7 pop %rdx 8 ... 9 pop %rax10 jmp %r11

42
Instrumentation
● Copy our return handler into the return address
parameters0x2a0
ret addr: 0x6700x2a8
JVM stackaddr
ret addr stack
stack addr ret addr
0x2a8 0x8f0
0x670: ret_handler
1 push %rax 2 ... 3 push %rdx 4 callq _record_mode_change 5 callq _pop_ret_addr 6 movq %rax, %r11 7 pop %rdx 8 ... 9 pop %rax10 jmp %r11
43
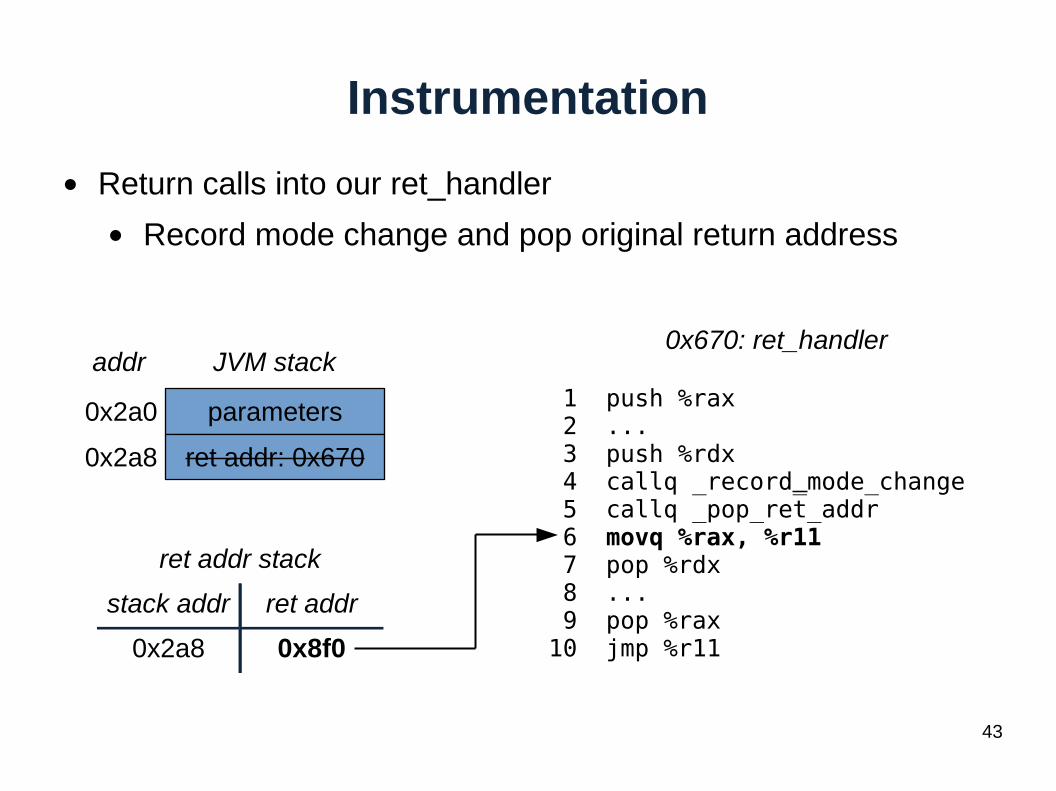
Instrumentation
● Return calls into our ret_handler
● Record mode change and pop original return address
parameters0x2a0
ret addr: 0x6700x2a8
JVM stackaddr
ret addr stack
stack addr ret addr
0x2a8 0x8f0
0x670: ret_handler
1 push %rax 2 ... 3 push %rdx 4 callq _record_mode_change 5 callq _pop_ret_addr 6 movq %rax, %r11 7 pop %rdx 8 ... 9 pop %rax10 jmp %r11
44
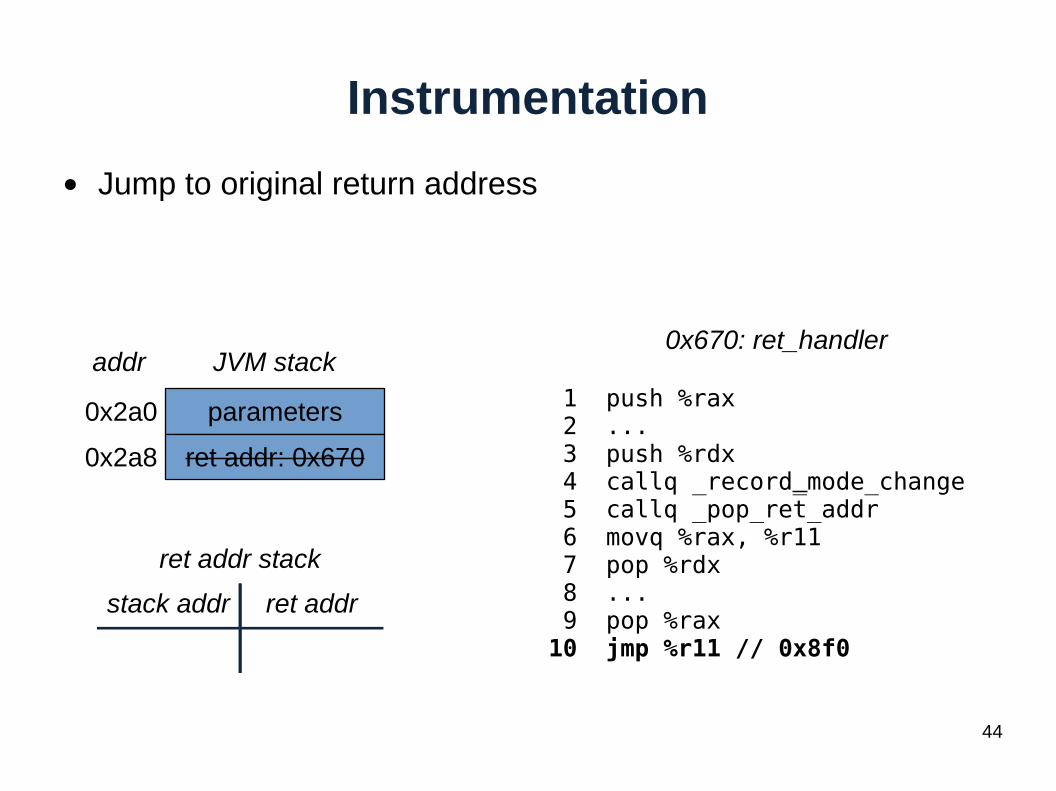
Instrumentation
● Jump to original return address
parameters0x2a0
ret addr: 0x6700x2a8
JVM stackaddr
ret addr stack
stack addr ret addr
0x670: ret_handler
1 push %rax 2 ... 3 push %rdx 4 callq _record_mode_change 5 callq _pop_ret_addr 6 movq %rax, %r11 7 pop %rdx 8 ... 9 pop %rax10 jmp %r11 // 0x8f0
45
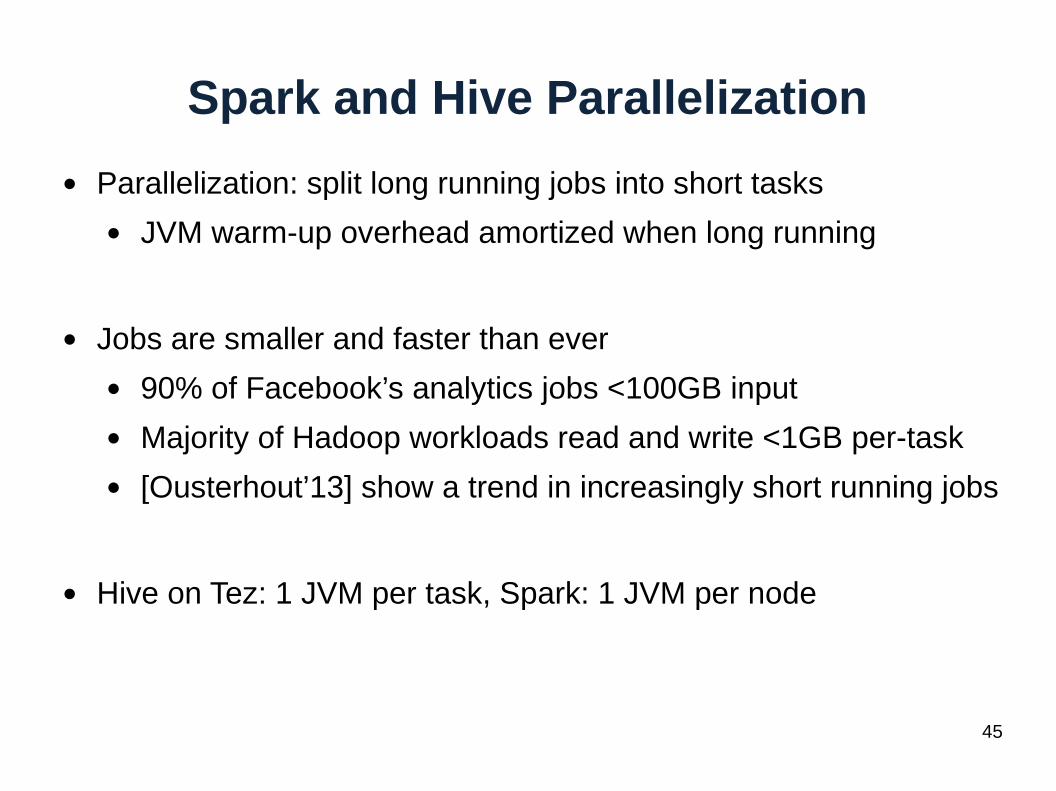
Spark and Hive Parallelization
● Parallelization: split long running jobs into short tasks● JVM warm-up overhead amortized when long running
● Jobs are smaller and faster than ever● 90% of Facebook’s analytics jobs <100GB input
● Majority of Hadoop workloads read and write <1GB per-task● [Ousterhout’13] show a trend in increasingly short running jobs
● Hive on Tez: 1 JVM per task, Spark: 1 JVM per node


![Imergindo jvm[Apresentação ]](https://img.dokumen.tips/doc/110x75/5563a518d8b42a01658b53ed/imergindo-jvmapresentacao-.jpg)