Embed Size (px)
Citation preview

Donna High School Texas STaR Chart
2009-2012Created by: Delia Torres

2
Introduction
Texas STaR Chart background
Texas Long Range Plan, 2006-2020
Donna High School (DHS), 3-year data
http://office.microsoft.com/en-us/images/

3
Texas STaR Chart basics
STaR: School Technology and Readiness
Inventory: technology usage school needs
Shows progress goals - Texas Long-Range Plan
*http://starchart.epsilen.com/docs/TxTSC.pdf , page 4
http://office.microsoft.com/en-us/images/

4
STaR Chart benefits
Professional development needs
Comparable data Set campus goals Prioritize funding
*http://starchart.epsilen.com/docs/TxTSC.pdf , page 4
http://office.microsoft.com/en-us/images/

5
*Who are the stakeholders?
Students Parents Educators Community and
school board members
*http://starchart.epsilen.com/docs/TxTSC.pdf , page 4
http://office.microsoft.com/en-us/images/

6
Four key areas surveyed
Teaching & learning Educator preparation &
development Leadership,
administration, & instructional support
Infrastructure & Technology
*http://starchart.epsilen.com/docs/TxTSC.pdf , page 4
http://office.microsoft.com/en-us/images/

7
Teaching and learning
Patterns of classroom use Frequency/design of
instruction setting Content area connections Tech apps TEKS
implementation Student master of tech
apps Online learning*http://starchart.epsilen.com/docs/TxTSC.pdf , page 4
http://office.microsoft.com/en-us/images/
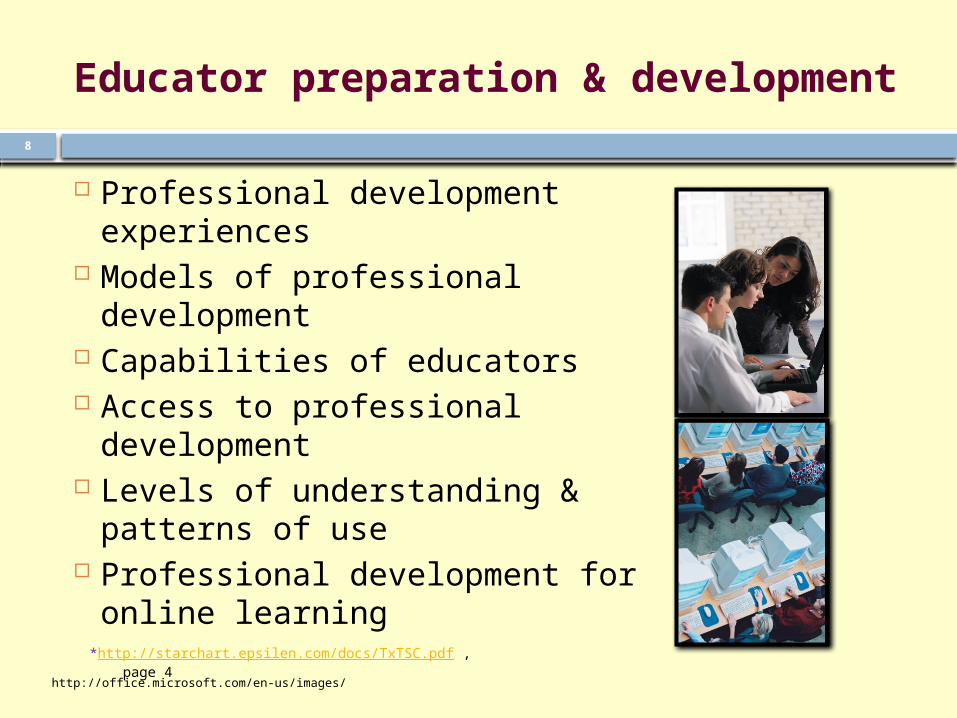
8
Educator preparation & development
Professional development experiences
Models of professional development
Capabilities of educators Access to professional
development Levels of understanding & patterns
of use Professional development for
online learning*http://starchart.epsilen.com/docs/TxTSC.pdf , page 4
http://office.microsoft.com/en-us/images/

9
Leadership, administration & instructional support
Leadership & vision Planning Instructional support Communication and
& collaboration Budget Leadership & support
for online learning
*http://starchart.epsilen.com/docs/TxTSC.pdf , page 4
http://office.microsoft.com/en-us/images/

10
Infrastructure & technology
Students per computer Internet access connectivity
speed Other classroom technology Technical support Local area network/Wide area
network Distance learning capacity
*http://starchart.epsilen.com/docs/TxTSC.pdf , page 4
http://office.microsoft.com/en-us/images/

11
Long-Range Plan for Technology
STaR Chart Academic excellence Online & distance learning Review & revision phases:
1st 2006 – 2010 2nd 2011 – 2015 3rd 2016 - 2020
http://office.microsoft.com/en-us/images/

12
Donna High School
STaR Charts:
2009-20102010-20112011-2012
“We will provide a quality education and treat all with dignity and respect.”

13
DHS 2009-2010
Area
Area Name Total
STaR Classification
I Teaching & Learning 12 Developing Technology
II Educator Preparation & Development 12 Developing
Technology
IIILeadership/Administration/Instructional Support
15 Advanced Technology
IV Infrastructure and Technology 16 Advanced
Technology
http://starchart2.epsilen.com/
Rating Classification
6 - 8 Early Tech
9 - 14 Developing Tech
15 - 20 Advanced Tech
21 - 24 Target Tech

14
DHS 2010-2011
Area
Area Name Total
STaR Classification
I Teaching & Learning 24 Target Technology
II Educator Preparation & Development 24 Target Technology
IIILeadership/Administration/Instructional Support
20 Advanced Technology
IV Infrastructure and Technology 23 Target Technology
http://starchart2.epsilen.com/
Rating Classification
6 - 8 Early Tech 9 – 14
Developing Tech 15 – 20
Advanced Tech
21 - 24 Target Tech
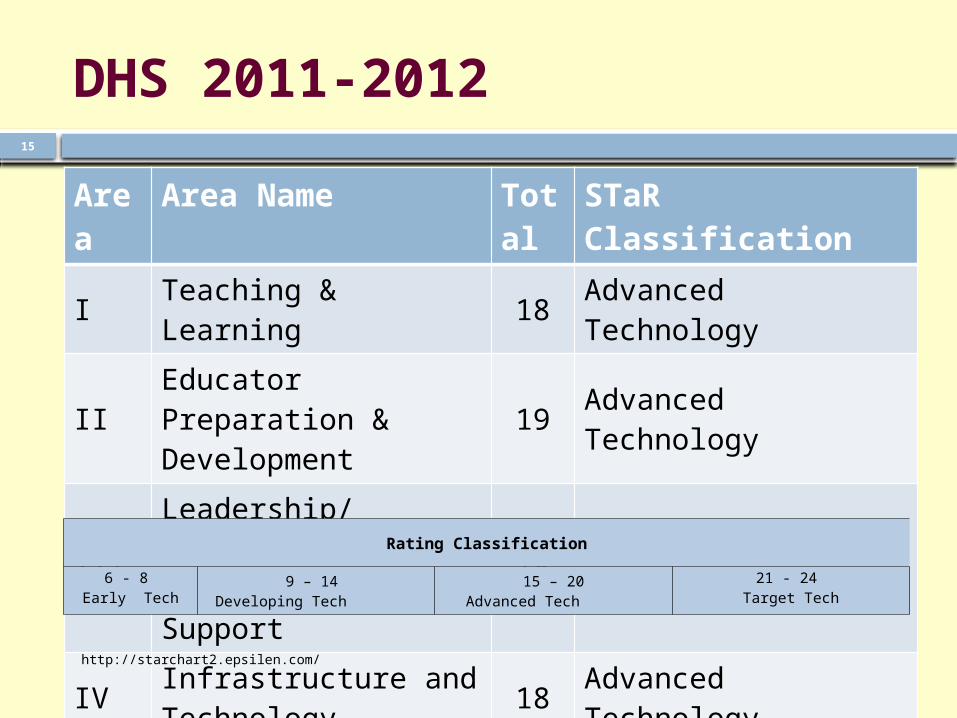
15
DHS 2011-2012
Area
Area Name Total
STaR Classification
I Teaching & Learning 18 Advanced Technology
II Educator Preparation & Development 19 Advanced Technology
IIILeadership/Administration/Instructional Support
18 Advanced Technology
IV Infrastructure and Technology 18 Advanced Technology
http://starchart2.epsilen.com/
Rating Classification
6 - 8 Early Tech 9 – 14
Developing Tech 15 – 20
Advanced Tech
21 - 24 Target Tech
16
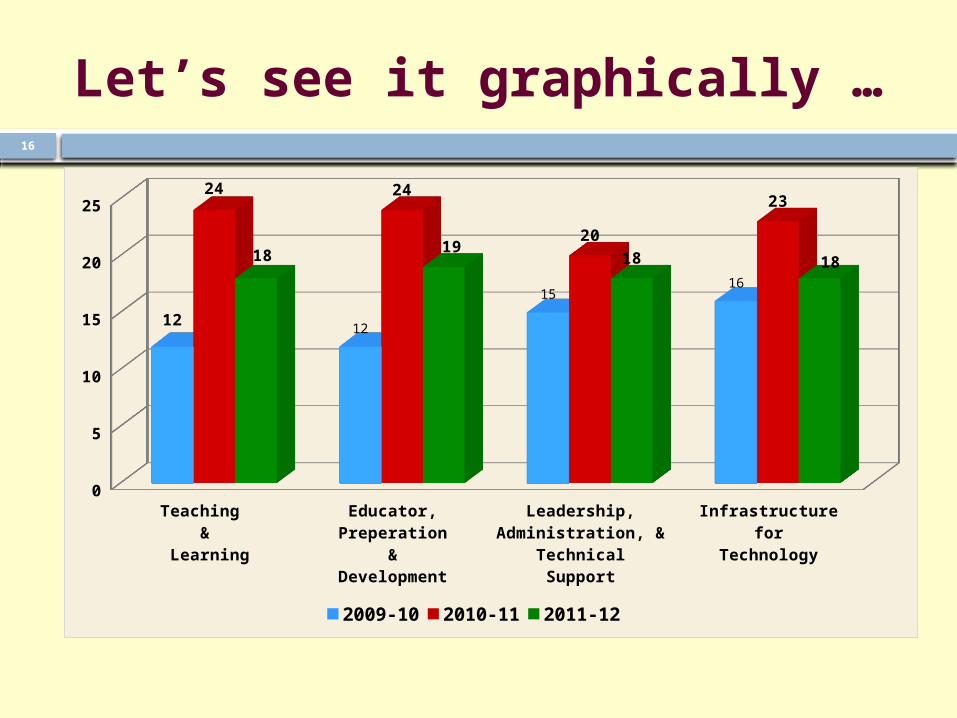
Let’s see it graphically …
Teaching &
Learning
Educator, Preperation&
Development
Leadership,Administration, &
TechnicalSupport
Infrastructurefor
Technology
0
5
10
15
20
25
1212
1516
24 24
20
23
1819
18 18
2009-10 2010-11 2011-12

17
When interpreting data
Data interpretation responsibility
Investigate the data
Use data to bring about changes

18
Data does not say…
Why was there such a great increase?
Why was there a rapid decrease?
What other variables?
http://office.microsoft.com/en-us/images/

19
Conclusion, what changes needs to be done?
Promotion of STaR Chart
Campus,district-wide, & community
What other variables?
http://office.microsoft.com/en-us/images/

20
References
http://office.microsoft.com/en-us/images/
http://starchart2.epsilen.com/ http://starchart.epsilen.com/docs/TxTSC.pdf , page
4