Embed Size (px)
Citation preview

Tihana Matosevic
Martin Knapp
Jeremy Kendall
Julien Forder
Patricia Ware
Brian Hardy
Domiciliary Care
Providers in the
Independent
Sector
PSSRU Discussion Paper 1605
PSSRUat the University of Kent at Canterbury,
the London School of Economicsand the University of Manchester

© 2001, Nuffield Institute for Health and Personal Social Services Research Unit
ISBN 1-902671-21-X
First published in 2001 by the Nuffield Institute for Health, University of Leeds and the
Personal Social Services Research Unit, London School of Economics.
This work received support from the Department of Health. The views expressed in this
publication are those of the authors and not necessarily those of the Department of Health or
other funders.
Typeset by Nick Brawn at the PSSRU, Canterbury and printed by the University of Kent at
Canterbury Print Unit.
This publication is also available at the PSSRU and Nuffield Institute websites:
www.ukc.ac.uk/PSSRU/
www.leeds.ac.uk/nuffield/
Contents
1 Introduction . . . . . . . . . . . . . . . . . . . . . . . . . . . . . . . . . . . . . . . . . 1
2 Sample selection . . . . . . . . . . . . . . . . . . . . . . . . . . . . . . . . . . . . . . 2
3 Provider characteristics. . . . . . . . . . . . . . . . . . . . . . . . . . . . . . . . . 3
4 Local market and demand for services . . . . . . . . . . . . . . . . . . . . 5
5 Prices. . . . . . . . . . . . . . . . . . . . . . . . . . . . . . . . . . . . . . . . . . . . . . . 9
6 Contracts . . . . . . . . . . . . . . . . . . . . . . . . . . . . . . . . . . . . . . . . . . 13
7 Relationships with the local authority. . . . . . . . . . . . . . . . . . . . . 15
8 Service quality and staffing . . . . . . . . . . . . . . . . . . . . . . . . . . . . . 19
9 Providers’ background and expressed motivations . . . . . . . . . 21
10 Future plans . . . . . . . . . . . . . . . . . . . . . . . . . . . . . . . . . . . . . . . . 23
11 Conclusions and summary . . . . . . . . . . . . . . . . . . . . . . . . . . . . . 24
References . . . . . . . . . . . . . . . . . . . . . . . . . . . . . . . . . . . . . . . . . 25
Contacts . . . . . . . . . . . . . . . . . . . . . . . . . . . . . . . . . . . . . . . . . . . 25

1 Introduction
Domiciliary care for older people has changed significantly over the past twodecades. Eligibility criteria have been tightened, intensity of support has increased,user charges have spread and patterns of support across the week have beenextended. A more recent but no less important shift has been the changingbalance of provision between the public, private and voluntary sectors. Forexample, the independent sectors’ share of the publicly-funded home care markethad reached 51% of all domiciliary care provision in England by 1999(Department of Health, 2000). For the first time ever, the proportion ofdomiciliary care that English authorities purchase has exceeded the proportionthat they provide in-house (Laing & Buisson, 2000).
Furthermore, the latest national statistics on domiciliary care services show thatthe average number of contact hours is considerably higher for the independentsector (8.1 hours) than for in-house (5.2 hours) (Department of Health, 2000).This reflects the tendency for local authorities to contract out responsibility formore intensive packages to independent sector organisations.
Who are these independent sector providers? What are their main characteristics?What are their market experiences and how do they respond to changes in thecontext of care, especially in relation to local authority commissioning? What isthe nature of providers’ relationships with purchasers? What were the motivationsfor entering the domiciliary care market? What are the working conditions andqualifications of staff? Finally, what expectations do providers have for the future?
These questions prompted and structured a major survey of independent sectordomiciliary care providers in 1999. The study was conducted as part of the MixedEconomy of Care Research Programme, which is a long-running joint endeavourby the Personal Social Services Research Unit, London School of Economics, andthe Nuffield Institute for Health, University of Leeds. It follows on from a similarstudy by the same group in 1995. Although we can make comparisons in generalterms between the two studies, the samples do not comprise exactly the sameproviders due to the considerable movement on and off local authority lists. Wefocus on comparisons between 1995 and 1999 in another paper (Ware et al., 2001).
In this paper we summarise the descriptive findings from the 1999 domiciliarycare study. Detailed analyses of these data are presented in four papers, markedwith an asterisk in the references at the end of this report.
I N T R O D U C T I O N
1
AIMS OF THE DOMICILIARY CARE PROVIDERS STUDY
� to describe the main features of independent sector provider organisations, such as their
legal status, funding sources, length of time in business, number of hours provided and client
groups served;
� to examine the nature of provider motivations and their past and future plans;
� to describe how local authorities employ incentives and constraints in order to manage the
supply side of social care markets; and
� to examine the general effects on providers of the development of the mixed economy.

2 Sample selection
The data used in this report were gathered using a two-stage sampling process.The sample of local authorities was first selected in 1995, to be representative ofthe national picture at that time in respect of political control, total social servicesexpenditure per head of population, and percentage of social services expendituregoing to independent sector services. In 1995 we had a sample of eight localauthorities; in 1999 this had increased to eleven because three new unitaryauthorities had been established in these eight areas. These eleven comprised twoLondon boroughs, three shire counties, three metropolitan districts and three newunitary authorities.
At the second stage, we asked each local authority social services department toidentify all providers from whom they had purchased home care services. Postalquestionnaires were sent to each provider on current local authority lists. A totalof 408 survey forms were sent out. The response rate to the total number ofquestionnaires sent out was 57%; the response from the current working lists was62%.
Subsequently, 20% of those on the working lists for each of the authorities wereselected for interview. Our interview sample is not exactly a sub-sample of thepostal survey sample since seventeen interviewees did not complete a postalquestionnaire. We also identified ten providers who were no longer in thedomiciliary care business and who were willing to discuss their reasons for leavingthe market. The statistical findings in this paper are based on 155 completedpostal surveys and 56 interview schedules.
D O M I C I L I A R Y C A R E P R O V I D E R S
2

3 Providercharacteristics
The provider characteristics examined were legal structure, organisational size,ownership, geographical coverage and time in business. Our sample differed fromthe 1995 study in having slightly smaller proportions of sole proprietors,partnerships and charities, and a greater proportion of limited companies. In1999, two-thirds of providers were private businesses and 26% charities (figure 1).
There was a range of legal forms: 36% of organisations were limited companiesand 24% were registered charities and other voluntary organisations (figure 2).Similarly, the study by Laing & Buisson (2000) found that 41% of independentsector providers in their sample were sole traders or partnerships, another 41%were limited companies, and only 18% were voluntary sector organisations.
Two out of five organisations were part of a larger business or organisation. Thirtyrespondents (19%) were part of a residential or nursing home business and theaverage number of beds per home was 28. There was also a slightly smallerproportion of organisations that were part of a residential or nursing homebusiness.
According to Laing & Buisson (2000), by 1997 47% of independent sectororganisations had been in business for less than four years, 27% between four andten years, and 32% had been in domiciliary care business for more than ten years.In our study we found that one provider had joined the market within the pastyear, 13 (8%) in the past two years, and 64% since implementation of thecommunity care changes in 1993 (table 1).
P R O V I D E R C H A R A C T E R I S T I C S
3
15.5
20.6
36.1
24.2
Sole proprietorship
Partnership
Limited company
Registered charityor other voluntary
0 10 20 30 40
Per cent
Figure 2: Legal structure (n = 155)
0 20 40 60 80Per cent
67.1Private business
25.8Charity
6.5Not-for-profit organisation
(but not a charity)
Figure 1: Sector of ownership (n = 154, missing = 1)

Almost half the sample worked over a comparatively small area within their ownlocal authority, but half (76 organisations) were operating in more than oneauthority. However, this latter figure may overestimate the number of respondentsthat directly work in other authorities since about twenty organisations in oursample were part of larger organisations that operated across a wider area: theindividual provider (branch) may have only worked in one local authority.
The most distant client in our interview sample was 60 minutes travelling timeaway from the office base, but generally clients were fairly close.
D O M I C I L I A R Y C A R E P R O V I D E R S
4
Table 1: Time in business (n = 144, missing = 11)
Year of start-up Years in service Count % of 155
1999 Less than 1 1 0.6
1997-1998 1-2 13 8.4
1993-1996 3-6 85 54.8
1989-1992 7-10 17 11.0
Before 1988 More than 10 28 18.1
Missing 11 7.1

4 Local market anddemand for services
In the postal questionnaire we asked about the provider’s current business focusand the proportion of their clients with particular dependencies, the types ofservices currently provided, the number of clients and the number of hours ofservice provided in the sample local authority and other local authority areas.
Almost all of the sample provided personal care and practical care, and more thanhalf offered night sitting, day sitting and respite for carers. Less commonlyprovided were live-in services and nursing care (figure 3). The nature ofdomiciliary care continues to develop, with a greater emphasis in England onpersonal care and less on practical tasks (Laing & Buisson, 2000).
Although our focus was on agencies providing care for older people, localauthority lists sometimes included organisations providing services to a wider agegroup. In fact, only 6% of providers had no client aged under 65. Nearly half ofthe sample (44.5%) reported that more than three-quarters of their clients wereolder people (figure 4). For the other three client groups, over half of our survey
L O C A L M A R K E T A N D D E M A N D
5
142 141
95 9385
35 31
Personalcare
Practicalcare
Nightsitting
Daysitting
Respite forcarers
Live-in Nursingcare
Type of service
0
20
40
60
80
100
120
140
160
Num
ber
ofpro
vider
s
Figure 3: Services currently provided
5.29.0
16.8
7.79.7
56.1 55.5
64.5
34.2
16.8
4.511.6
44.5
2.6 0.63.9
Older people Older people withmental health problems
Chronically sick(<65 years)
Physicaldisabilities (<65)
0
20
40
60
80
Per
cent
NoneLess thana quarter
Between one andthree quarters
More thanthree quarters
Figure 4: Proportion of all your clients made up of the following groups (n = 155)

sample said that these groups represented less than a quarter of their clients.
Specialised services (e.g. sensory impairment, learning disabilities and mentalhealth problems) were provided to less than a quarter of clients.
We also asked about client dependency in aggregate. Few providers had largeproportions of clients with high dependency levels (figure 5).
Providers were also asked about their the relevance of clients’ professional orreligious backgrounds and their funding sources. Only 9% of intervieweescurrently provided for people with particular professional, ethnic or religiouscharacteristics. Forty-three per cent of those interviewed did not aim their servicesat people with a particular funding source. Of those 30 providers (out of 56) whodid, four had more than 75% private payers and 26 had more than 75% publicpayers.
We asked respondents how big their business was in terms of hours of service.Many providers operate on a small scale. Although there has been an increasesince our 1995 study in the proportion of agencies providing more than 500 hoursa week, there are still over a quarter which provide 250 hours or less per week.This underlines the continuing small scale of many providers operations. UKHCAfindings indicate that 85% of their members surveyed in 1998 provided fewer than5000 hours per month (Hardy, 1998). These findings are consistent with Laing &Buisson’s study (2000) which showed that the average organisation in Englandprovided 763 hours per week, equivalent to 3300 hours of domiciliary care permonth.
As would be expected, our question about the number of clients served byagencies generated very similar patterns to the question about the number ofhours (table 2). In our 1995 survey, 46% of our sample provided services for 50clients or fewer in the sample authority. As table 2 shows, around 43% of thesample served this number of clients in 1999.
In order to examine providers’ advertising behaviours, we asked the interviewsample about the proportion of their turnover spent on advertising and whetherthat proportion had changed since 1993, or since they started in the business. Sixinterviewees (out of 56) could not tell us the proportion of turnover spent in this
D O M I C I L I A R Y C A R E P R O V I D E R S
6
4.5 7.1 4.5 5.8 5.8
51.0
34.2
50.3 51.655.5
29.7
51.0
36.1
21.3
7.12.6 3.9 1.3
8.4
… dependent onwalking aids
… who arechair/bed bound
… who areincontinent
… with dementia … with specialneeds
0
20
40
60
80
People…
NoneLess thana quarter
Between one andthree quarters
More thanthree quarters
24.5Per
cent
Figure 5: Proportion of all your current clients with particular dependencycharacteristics (n = 155)
Table 2: Number of clients per agency for whom services provided in the last week inthis local authority (n = 155)
Number of clients Count % of 155
0 6 3.9
1-20 33 21.3
21- 50 27 17.4
51-100 33 21.3
101-500 51 32.9
More than 500 3 1.9

way, 21 did not formally advertise, 23 spent less than 5% of their turnover onadvertising, and two spent between 5% and 10%. Thirteen (23%) said that theyadvertised more in 1999 than in 1993 or when they started in business andtwenty-four (43%) said that they advertised the same or less.
One of the main reasons for this change in providers’ advertising behaviour is thatword of mouth is relied upon to generate business. Overall, the majority ofproviders from this category see advertising as a waste of resources. The majorityof those who do advertise reported using Yellow Pages, local newspapers, doctors’surgeries and local hospitals.
We asked our interview sample how they perceived the degree of competition intheir local market and whether it had changed since 1993. As figure 6 shows, 73%of interviewees described the market in general as ‘quite’ or ‘extremelycompetitive’, but fewer (61%) reported that the competition directly affectingtheir organisations was as high. This suggests that some providers felt themselvesto be insulated from competitive pressures. Interviewees indicated that this mayhave been because of the type of contract that they had or because of particularlygood relationships with care managers.
From our interviews it emerged that providers who reported that the market wasquite un-competitive or not at all competitive in terms of both directlyexperienced and perceived overall competition were mainly providing quitespecialised types of service and were those with a good reputation.
Just over half of our interview sample thought that there was now morecompetition since 1993 or when they first started in business. For many providersthe competition has increased due to large companies moving into the home caremarket. When asked about competition, some interviewees said that thedomiciliary care market was not about ‘competition’, it was about gettingqualified and suitable staff. A big problem for providers was that they were oftencompeting for the same staff.
In order to see whether there had been any change regarding the types of clientsand the amount of services provided we asked the interview sample to report howthey perceived changes in their local market since 1993 or when they started inbusiness.
A clear majority of interviewees reported increases (generally ‘considerableincreases’) in the hours that local authorities wanted to purchase and clients theywished to have supported (figure 7). We asked our postal sample what changes toclient and staff numbers there had been over the past year. Although the majorityreported growth on both counts, 25% reported a fall in client numbers and 17% adecrease in staff numbers.
More than half the sample of providers said that new clients applying for services
L O C A L M A R K E T A N D D E M A N D
7
14.3
7.1
28.6
17.9
44.6 42.9
16.1
7.1
Extremelycompetitive
Quitecompetitive
Quiteuncompetitive
Not at allcompetitive
0
10
20
30
40
50
Per
cent
In the market generally Affecting the organisation
Figure 6: Degree of competition in the home care market generally, and thecompetition which directly affects your organisation (n = 56)

were more dependent than previous or current clients. These findings are in linewith the national figures, which show that the number of households receivinghome care has decreased by 5%, but at the same time the number of contacthours provided by the independent sector has gone up by 3% (Laing & Buisson,2000). Also, 38% of organisations reported an increase in the proportion ofprivately-funded clients seeking home care support. Frequently, interviewees saidthey were in favour of taking on more private payers simply because it reducedtheir business risk and meant less paperwork in comparison with local authorityclients.
With regard to changes in the proportion of clients where respondents would bethe only supplier, 29% of the sample reported an increase. This could suggest thatlocal authorities are reducing the way they use independent agencies to workalongside care assistants with the same clients.
D O M I C I L I A R Y C A R E P R O V I D E R S
8
Per
cent
55.3
14.210.7
5.4 5.4
41.0
23.2
10.7 8.95.4
Considerableincrease
Slight increase No change Slight decrease Considerabledecrease
0
20
40
60
80
Service hours Number of clients
Figure 7: Changes in the number of service hours and the number of clients fundedby the local authority (n = 56)

5 Prices
Two of the main elements of the commissioning process are decisions over pricingstructures and the types of contracts to be employed. For the purpose of this studythe price was defined as the cost to the local authority of the case it buys fromindependent sector providers in social care markets. The postal questionnairesought information on the range of prices that organisations charged fordomiciliary care tasks. We were interested to identify differences betweengeographical areas, between organisational types, between private and publiclyfunded clients and for clients with different needs.
In general, independent sector providers find themselves under considerablefinancial pressure because local authorities are offering price increases that do notmatch the rate of cost inflation (Laing & Buisson, 1999). However, there isevidence that the prices paid by some local authorities are increasing. Laing &Buisson (1999) found that the cost of an average weekday daytime personal carehour to an English authority was £6.89 in 1997.
Unsurprisingly, there has been an increase in prices for home care services sinceour 1995 study. In our 1999 survey we found that average prices were very similaracross types of providers, with the exception of charities which had higher meanprices and a wider distribution. Prices were significantly higher in our six Londonand southern sample authorities than in our five northern authorities, both forpractical care and personal care (table 3). Personal care was defined as washingand dressing clients while practical care includes shopping and cleaning. In aseparate paper we have examined these inter-authority differences in detail (seeForder et al., 2001).
In order to see if different types of organisation tend to charge at different rates wecompared the prices for sole proprietors, partnerships, limited companies andcharities/voluntary organisations (table 4). As in 1995, charities appear to chargehigher amounts. Differences in clientele or other factors might in part explainthese variations. In the charity category the range in prices is also much widerthan for other types of organisation, perhaps because there are different ranges offunding alternatives. There are differences within the charity sector according towhether charities are also limited companies. Across charities and voluntaryorganisations as a whole there is a wide range in prices (£6-£15) but among thoseorganisations which are both registered charities and limited companies there is
P R I C E S
9
Table 3: Hourly daytime prices for personal and practical care for local authorityfunded clients (£) (n = 155)
Region Time ofcare
Practical care Personal care
Mean Minimum Maximum Mean Minimum Maximum
London andthe South
Weekday
Weekend
8.08
9.51
5.00
5.20
13.60
18.75
8.41
9.83
5.00
5.00
13.60
18.75
The North Weekday 7.11 4.50 15.00 7.21 4.98 15.00
Weekend 7.79 4.50 15.00 7.90 5.60 15.00

less variability (£6-£13.60) — although this range of prices is still wider than forother types of organisation (table 5).
We sought to establish the difference in prices between daytime, night-time, andweekend care for local authority funded clients (table 6). We analysed these pricedifferentials by legal structure of organisation and found that registered charitieshad greater price differentials than sole proprietors, partnerships or limitedcompanies. There was also a significantly greater difference between weekday andweekend daytime prices than between weekday and weeknight prices (figure 8)and greater variation in prices in London and the South than there was in theNorth (table 7).
We sought the same information about hourly charges for privately funded ratherthan local authority funded clients. The range of prices and the average chargewere generally lower for privately funded clients than for publicly funded clients
D O M I C I L I A R Y C A R E P R O V I D E R S
10
Table 6: Hourly prices for personal care for local authority funded clients at differenttimes of the day/week (£) (n = 155)
Region Time of care Mean Minimum Maximum
London and the South Day weekday 8.41 5.00 13.60
Night weekday 9.46 6.19 15.75
Day weekend 9.83 5.00 18.75
Night weekend 10.42 7.50 18.75
The North Day weekday 7.21 4.98 15.00
Night weekday 7.37 5.27 12.00
Day weekend 7.90 5.60 15.00
Night weekend 7.98 5.60 14.00
0.980.89 0.93
1.58
0.5
0.71 0.65
0.39
Sole proprietor Partnership Limited company Registered charity*0
0.5
1
1.5
Pounds
Differential between weekday and weekend day
Differential between week and weekday night
Figure 8: Price differential (£) between mean daytime weekday/weekend and meanweekday/weeknight personal care for local authority funded clients — by legalstructure
* This category included registered charities that were also limited companies.
Table 5: Hourly daytime prices for personal care for local authority funded clients bytype of charity (£)
Provider is … Mean Minimum Maximum
Registered charity only 8.00 6.00 12.75
Registered charity and limited company 9.97 6.00 13.60
Charity/voluntary organisations (all) 8.94 6.00 15.00
Table 4: Hourly daytime prices for practical and personal care for local authorityfunded clients by legal structure (£) (n = 155)
Legal structure Practical care Personal care
Mean Minimum Maximum Mean Minimum Maximum
Sole proprietor 7.17 5.00 9.32 7.37 5.00 9.32
Partnership 7.39 5.20 10.00 7.57 5.40 10.00
Limited company 7.20 4.98 10.72 7.39 4.98 10.72
Charity/voluntary organisation 8.72 4.50 15.00 8.94 6.00 15.00

(tables 3 and 8). A similar pattern was also seen regarding legal structure (tables 4and 9).
In the charity sector there was a marked difference between privately and publiclyfunded clients and there was a greater range of prices for publicly funded clients(table 10).
We wanted to find out whether agencies set their hourly charges to reflectparticular client needs. For a large majority of the sample (72%) the charges didnot reflect level of need or the type of clientele. However, some 29% of providersreported that their prices for publicly funded clients vary according to client group(e.g. older people, physical disability, learning disability, and mental healthproblems).
Travel costs were included in hourly charges for the majority of providers,although for privately-funded clients there was more likelihood that travel costswould be added according to the client situation. Some 70% of organisations hadtheir travel costs included in the price of service for the publicly-funded clientswhereas for private payers, 55% of providers included travel costs in their prices.
We asked our interview sample some more detailed questions about pricing,including how prices were set, how well they covered costs and how they reactedto competition. For a third of the sample, prices were set on an annual basis, while45% of providers reported setting the prices every three years. Whether setannually or otherwise, prices were said to be set principally by local authorities ina third of cases (32%), by the provider in half of cases, and jointly for only 9 percent of our sample. Interestingly, however, in our larger postal survey only 8 percent of providers thought of themselves as having the most influence over the finalcontract price. For 57% of our survey sample the local authority had the mostinfluence over the final contract price. Nearly a third (28%) of providers reported
P R I C E S
11
Table 8: Hourly daytime prices for practical and personal care for privately fundedclients (£)
Region Practical care Personal care
Time ofcare
Mean Minimum Maximum Mean Minimum Maximum
London and the South Weekday 7.35 3.90 12.75 7.97 5.00 12.75
Weekend 8.80 5.20 18.75 9.25 5.50 18.75
The North Weekday 6.58 4.00 11.00 6.67 4.25 11.00
Weekend 7.30 4.50 11.00 7.39 4.50 11.00
Table 9: Hourly daytime prices for practical and personal care for privately fundedclients by legal structure (£)
Practical care Personal care
Legal structure Mean Minimum Maximum Mean Minimum Maximum
Sole proprietor 6.93 5.00 9.28 7.18 5.00 9.28
Partnership 7.02 5.20 9.95 7.28 5.27 9.95
Limited company 6.84 4.00 10.72 7.11 4.25 10.72
Charity/voluntary organisation 7.20 4.50 12.75 7.94 5.25 12.75
Table 10: Hourly daytime prices for charities and voluntary organisations (£)
Mean Minimum Maximum
Publicly funded prices 8.94 6.00 15.00
Privately funded prices 7.94 5.25 12.75
Table 7: Price differential (£) for personal care by region (local authority fundedclients)
Region Price differential between meanweekday and weekend day
Price differential between meanweekday and weeknight
London and the South 1.42 1.05
The North 0.69 0.16

that the prices are usually set through a process of negotiation between providersand purchasers. These findings show that local authorities are having moreinfluence in price setting than in 1995 when 32% said that the local authority hadthe most influence on prices.
We also asked our interview sample whether the prices for the local authorityfunded clients adequately covered their costs. Thirty eight per cent of agenciesreported being able to cover their costs with only a modest surplus while a quarterof providers said that the prices equal their costs (figure 9). Provider mark-uprates were influenced by the type of contract used, service characteristics andprovider motivation (as discussed in the following sections).
Twenty per cent had responded to local authority pricing policies by reducingtheir costs. Of these, 36% had done so by reducing their profit or surplus and11% had seriously considered exiting the care market.
The most commonly cited ways of reducing costs were reducing wages and/orstaff benefits and streamlining the administration and staffing. Those who failedto cover costs often cross-subsidised from other services of the organisation ortopped up clients’ fees with external sources or from their own surplus.
We asked providers what they would do hypothetically if prices were reduced by10% (i.e. about 70-80p per hour). There were a number of reactions:� 27% of providers would try to recruit more private payers;� 23% would adjust the total number of hours provided;� 16% would close down;� 13% would decrease quality levels, staff pay, training;� 9% would increase the cross subsidy from other sources� 9% would not respond, and take a cut in surplus.
We also sought reactions to two other hypothetical situations. If their nearestcompetitor were to reduce standard prices by 10%, few providers would respondby reducing their own prices. Our results indicate that 80% of our interviewsample said that they would not reduce their standard prices while only 4% wereprepared to respond to market competition by reducing their standard prices.
Second, we asked about their responses to a local authority guarantee to buy onethird of the hours they currently provide. Some 43% of providers were not infavour of lower prices in order to secure a contract with the local authority. Onlyfive agencies said that they would offer a 5% discount and three agencies wouldoffer a 10%, 15% and 20% discount respectively.
D O M I C I L I A R Y C A R E P R O V I D E R S
12
5.4
7.1
25.0
37.5
14.3
Fail to cover costs by a substantial amount
Just fail to cover costs
Equal costs of typical LA funded client
Exceed costs with only a modest surplus
Exceed costs to give a healthy surplus
0 10 20 30 40
Per cent
Figure 9: Relationship of prices to costs of local authority funded clients

6 Contracts
We asked about the types of contracts (defined in the box below) that providershave with their local authority and their preferred type of contract.
In the course of analysing the data it became clear that many respondentsconsidered the terms ‘spot’ and ‘call-off ’ interchangeable. An important feature ofcall-off or spot contracts is that there is no guarantee of purchase in advancewhereas with block, grant or cost and volume arrangements there is somecommitment to purchase a certain amount of work or number of hours. Thedifference between spot and call-off contracts is that for spot purchasing the priceis negotiated on an individual basis at the time the service is delivered, whereas forcall-off purchasing the price tariff is already negotiated and agreed, often on anannual basis, before the service is delivered. Respondents used the term spotwhere in fact call-off would have been the more accurate description, using theabove definitions. This is evidenced by the fact that only around 5% of providersindicated that the hourly charge was negotiable on an individual basis. Confusionarises because the terms ‘block’ and ‘spot’ are popularly used as a shorthand tosignify whether hours are guaranteed in advance or not.
Our previous study in 1995 indicated that there was a heavy reliance on call-off orspot purchasing, such that three-quarters of the interview sample only had thesesorts of contracts with purchasers. Only 12% of providers had some combinationincluding block contracts and 6% had cost and volume contracts. Such prevalenceof spot and call-off contracts was perceived to be the most significant potentialsource of instability (Hardy et. al, 1996).
We wanted to know whether agencies generally had just one sort of contract orhad negotiated a mixture of different sorts. In the 1995 study, 76% of our sampleonly had spot or call-off contracts. In 1999 about half of the postal surveyrespondents had just one type of contract. One provider indicated that they hadall five types of contract (figure 10). Of the 78 agencies that had only one sort ofcontract a large majority (42% of all agencies) had spot or call-off contracts.
With regard to organisations with a combination of different contracts, in 1995only 6% of providers had a variety of contracts while in 1999 some 45% did. The
C O N T R A C T S
13
TYPES OF CONTRACTS — DEFINITIONS
� Block — payment for a pre-determined number of hours or clients whether taken up or not
� Call-off — price per hour specified in advance; paid when service is provided
� Spot — price agreed and paid when service is provided
� Cost & volume — guaranteed block purchase of hours plus negotiable option to purchase
further hours of service
� Grant — general payment not linked to particular client or amount of service

most commonly mentioned was a spot contract, followed by a call-off contract(figure 11). Private sector providers were less likely to have block and cost &volume contracts.
Although there was no clear preference for any particular type of contract, almosttwo thirds of the survey sample said they would prefer grant, block, or cost &volume contracts, which give guaranteed hours and therefore provide somesecurity (figure 12).
Compared to our 1995 study, there seems to be less of a preference for blockcontracting among independent domiciliary care providers. In 1995, more than60% selected a block contract as their preferred type of contract, whilst in 1999only 32% of providers said that block contracts were their preferred type. One ofthe main reasons is that since our last study, local authorities’ contractingarrangements have developed considerably, and there are now more differenttypes of contracts with a certain amount of guaranteed hours. Furthermore, our1999 sample had a greater proportion of for-profit providers which were moredependent on spot contracts than voluntary sector providers. Laing and Buisson(1999) reported that over a third of voluntary providers said that more than 80%of local authority funded domiciliary care was purchased under block contracts.The second most popular contract type was cost & volume, with 28% selectingthis type as their preferred contract.
D O M I C I L I A R Y C A R E P R O V I D E R S
14
4.5
14.8
27.1
1.9
1.9
44.5
Block only
Call-off only
Spot only
Cost and volume only
Grant only
Mixture of more thanone type of contract
0 10 20 30 40 50
Per cent
Figure 10: Types of contract with the local authority (n = 147, missing = 8)
28.3
36.7
62.6
18.0
7.5
Block
Call-off
Spot
Cost & volume
Grant
0 10 20 30 40 50 60 70
Per cent
Figure 11: Types of contract with the local authority — proportion of providers usingeach contract type (n = 147, missing = 8)
31.6
14.2
15.5
27.7
4.5
Block
Call-off
Spot
Cost & volume
Grant
0 5 10 15 20 25 30 35 40
Per cent
Figure 12: Preferred type of contract (n = 147, missing = 8)
7 Relationships withthe local authority
The nature of purchaser-provider relationships plays an important role in thequality and delivery of domiciliary care. We were interested in how dependentproviders are on authority funding, in the providers’ perceptions of risk, and thedegree of contact and flow of information between providers and the localauthority. A detailed analysis of these issues is presented in a separate paperfocusing on purchaser-provider relationships (Hardy et al., 2001).
A large majority of providers were registered with their local authority as homecare providers. Despite there being no statutory registration requirement, nearly85% of providers had undergone a registration process of some sort. Providersindicated that if they were not on the list of the accredited agencies it was unlikelythat the local authority would contract with them. According to one interviewee:
Accreditation means that the local authority are happy with what you doand they are willing to use you because they have seen your records and howyou operate. A registration process should carry more weight. A registrationprocess would mean agencies have to be registered if the local authority isgoing to use you. At the moment the system is that you do not need to beregistered because there is no registration process. Companies can start upwithout being accredited — they can come in at quite cheap prices — andcan take on work if the accredited companies can’t take on the work.
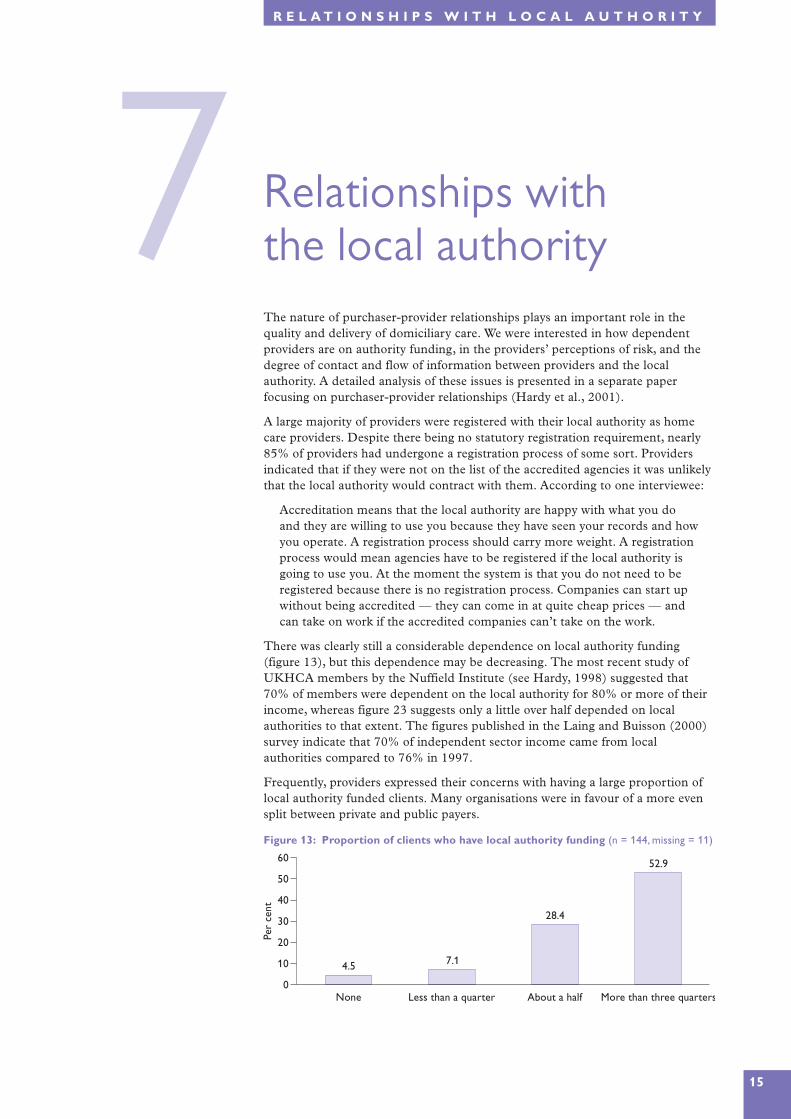
There was clearly still a considerable dependence on local authority funding(figure 13), but this dependence may be decreasing. The most recent study ofUKHCA members by the Nuffield Institute (see Hardy, 1998) suggested that70% of members were dependent on the local authority for 80% or more of theirincome, whereas figure 23 suggests only a little over half depended on localauthorities to that extent. The figures published in the Laing and Buisson (2000)survey indicate that 70% of independent sector income came from localauthorities compared to 76% in 1997.
Frequently, providers expressed their concerns with having a large proportion oflocal authority funded clients. Many organisations were in favour of a more evensplit between private and public payers.
R E L A T I O N S H I P S W I T H L O C A L A U T H O R I T Y
15
4.57.1
28.4
52.9
None Less than a quarter About a half More than three quarters0
10
20
30
40
50
60
Per
cent
Figure 13: Proportion of clients who have local authority funding (n = 144, missing = 11)

Agencies have frequently argued in the past that they are less willing to provideshort visits. Our survey addressed this issue with two questions: What is theshortest chargeable visit you provide? What is the shortest chargeable visit youhave been asked by local authorities to provide? Local authorities are twice aslikely (54%) to ask for short visits of this nature than agencies are prepared toprovide them (27%). However we also asked our postal survey sample whetherthey charged more for shorter visits and just over a quarter said that they did.Some 40 per cent reported the same charges for short visits of half an hour or less.
In our postal questionnaire we asked about the number of all their clientsreceiving visits of 30 minutes and less. As figure 14 shows, there is a wide range inthe proportions of clients who receive such visits. We found that nearly 30% ofproviders do not provide short visits at all whilst around 14% provide short visitsto most of their clients. Overall, nearly half of the providers in the sample wereproviding short visits to half of their clients.
Providers were asked about their perceived business risks in the relationship withthe local authority. Their responses indicated that about one third of respondentsfelt that there was some ‘excess’ risk (figure 15). The perception of risk associatedwith revenue for the coming year (e.g. the number of referrals and local authorityprices) was greater than risks concerning the costs of the service (e.g. challengingclients, changes in labour market conditions or local authority policy changes).
Pertinent to the question of risk is information about providers’ perceptions of theintentions of local authority purchasing staff. We asked what contact there waswith such staff either individually or through purchasing forums and whether theywere satisfied with this contact. Although half of the sample had frequent contactand a little over half (57%) were satisfied with the contact they had; nearly 20%were unsatisfied.
As far as information about local authority purchasing plans was concerned, oursample was fairly equally divided between those who did and those who did notreceive such information. Some 40% of providers did not receive informationwhile 46% reported receiving information regarding purchasing plans. Of thosethat did receive the information half were satisfied with it. Of those that did notreceive the information about one third said it did not matter to them, but abouttwo-thirds indicated that it did matter. Furthermore, providers believed that they
D O M I C I L I A R Y C A R E P R O V I D E R S
16
14.3
25.0
48.2
8.9
17.9
55.4
A great deal of excess risk Some excess risk No excess risk0
20
40
60
Per
cent
Risk regardingincome
Risk regardingcost fluctuations
Figure 15: Perceived risk regarding income in the coming year and regardingfluctuations in costs in the coming year (n = 54, missing = 2)
29.7
20.6
31.6
14.2
None A small proportion(1-25%)
About half(26-75%)
Most (76-100%)0
5
10
15
20
25
30
35
Per
cent
Figure 14: Proportion of all your clients who receive visits of 30 minutes or less

should be more involved in decision-making processes. Some providers felt thateven when the information about local authorities’ purchasing plans waspublished, they often contained insufficient detail. As one provider said:
I don’t think it [the purchasing plan] is particularly thorough. They havepages and pages on how your staff should act, what they should be, whatthey should do in the home, etc. That’s the same year in year out. And theyhave a little bit that says ‘this year we’ll be purchasing in this way.’ [e.g.block contract].
Similarly, we asked whether the local authority made available to providers (andothers) information on the unit costs of the in-house home help service. Most ofthe agencies did not receive this information. Some 80% (45) reported that theydid not know the unit costs of the local authority’s home care services. Indeed,nearly two-thirds (64%) of our sample believed that the local authority always orsometimes favoured their in-house service. A larger proportion (73%) felt that thelocal authority gave users no choice or only limited choice over the selection ofprovider. Little more than a quarter of providers (29%) indicated that they weresatisfied with the present situation.
As far as tangible support to develop new services and service options wasconcerned, our sample was fairly evenly divided between those who felt that therewas real support (38%) and those who experienced no support (36%).
One important aspect of provider-purchaser relationships is the amount ofproviders’ inputs to user assessment and reviews and their ability to alter servicesaccording to need. There was a wide range of responses, from those who said thathad no input to those having a genuine input (figure 16). Respondents indicatedthat they were slightly more satisfied with their input to reviews (59%) than theywere to the initial assessment (46%). Overall, providers were satisfied with carereviews both in terms of their involvement and the way they are conducted.
The results in figure 16 show that 39% of organisations reported no involvementwhile 20% reported only limited input into the initial assessment. In general,providers expressed their concerns about not being able to participate in the initialassessments and to utilise their skills and experience. As one interviewee pointedout:
I think for me, one of the most frustrating things is that care plans are drawnup by a person who is not actually going to do the work. They are drawn upin theory and one care manager may think that it would take an hour towash somebody for example. And then we go in and we find it takes half anhour. And I will ring up and say could we suggest a reduction in time to savemoney.
We asked the providers whether they were satisfied with their local authority’smonitoring arrangements regarding individual contracts (figure 17). Satisfactionlevels were mixed, with 36% expressing satisfaction with the level of monitoringand the current review arrangements.
R E L A T I O N S H I P S W I T H L O C A L A U T H O R I T Y
17
39.3
19.6
30.4
3.6
28.6
57.1
No input Limited input Some real input0
20
40
60
Per
cent
Assessment Reviews
Figure 16: Amount of provider input to the initial user assessment and care plan andsubsequent care reviews

In order to examine the trading relationship with the local authority, we asked ourinterview sample whether they had any difficulties regarding delayed paymentsand collecting client contributions and local authority fees. A significantproportion had some problems in these areas. Forty-five per cent of providersexperienced problems with delayed payments. These were often perceived to be aconsequence of poor management skills, but also an indication of a lack ofunderstanding of the business pressures that many independent providers face,whether directly or as a result of late payments in general.
In terms of forward planning and contact between provider and purchasing localauthority regarding new clients (e.g. last minute referrals), 63% of agenciesreported no problems with late referrals.
D O M I C I L I A R Y C A R E P R O V I D E R S
18
5.4
14.3 12.5
30.4
None Less than a quarter About half More thanthree quarters
Proportion of contracts monitored
0
10
20
30
Per
cent
Figure 17: Level of monitoring and follow-up of individual contracts by the localauthority (n = 37, missing = 19)

8 Service qualityand staffing
Qualified care staff are a key ingredient in good quality domiciliary care. As notedearlier, there is a high level of competition among providers for qualified careworkers.
Providers were asked about their levels of staffing, and what differences there havebeen in recruiting over time. We also collected information to provide an indicationof quality such as training, supervision and qualifications. We asked whetherorganisations belonged to a national or local association of home care providers:72% did. Membership has (potential) quality implications to the extent that suchassociations have their own frameworks of audit, regulation and quality standards.
The majority of providers employed fewer than 200 staff. Questions regardingstaff qualifications (figure 18) did not stipulate types of formal qualifications andbest represent managers’ perceptions about staff competence.
Roughly one in five respondents reported most or all of their staff having a socialcare qualification. A smaller percentage of our interview sample (9%) indicatedthat most or all of their staff had such qualifications. However, the latter figuresmay overestimate the number of people with qualifications if set alongside figuresfrom the Improvement and Development Agency which suggest that only 7% oflocal authority domiciliary care staff have a formal qualification and that only 6%of staff are studying for qualifications (Social and Health Care Workforce Group,1999). Our interview sample indicated that over 90% of respondents pay forunqualified staff to train for qualifications. However, it may well be thatrespondents did not differentiate between on-the-job induction training andqualifications. Some 75% of our interview sample did not receive any assistancefrom the local authority to provide training.
Just over 50% of providers indicated that supervisors had either daily or weeklyphone contact with care workers. However, two respondents noted that they onlyhad face-to-face contact with their workers between six monthly and yearly.Further, the majority of organisations (70%) did not offer their staff a minimumnumber of hours.
S E R V I C E Q U A L I T Y A N D S T A F F I N G
19
33.5
43.9
4.51.3
12.9
45.8
18.7 19.4
None A small proportion About half Most or all0
10
20
30
40
50
Per
cent
Nursing Social work
Figure 18: Proportion of care workers with nursing or social care qualifications

Most respondents had experienced difficulties in recruiting suitable care staff(75%) and nearly a third rejected at least half of their applicants. The findingsfrom the UKHCA 2000 survey also showed that overthree-quarters of providers had experienceddifficulties in recruiting domiciliary care workers.However, respondents reported less difficulty inretaining staff once they had them in place (figure19).
Problems with the applicants themselves and thecompetition from other providers were more oftenmentioned as difficulties than conditions associatedwith the job per se, such as lack of guaranteed hours,low pay, or unsociable hours (figure 20).Competition from other providers could also includecompetition from a social service department’s in-house service, where differentials regarding pay andconditions for staff are significant.
D O M I C I L I A R Y C A R E P R O V I D E R S
20
75.0
28.6
0
20
40
60
80
100
Per
cent
Recru
itmen
t
Reten
tion
Figure 19: Proportionexperiencing problemsrecruiting and retainingsuitable care staff in the lastyear
37.5
30.4
26.8
23.2
19.6
16.1
12.5
Unsuitable applicants
Competition from other providers
Insufficient applicants
Lack of guaranteed hours
Unsociable working conditions
Low pay
Travel problems
0 10 20 30 40 50
Per cent
Figure 20: Problems of staff recruitment and retention
Percentages add up to more than 100% because some respondents gave more than one answer.

9 Providers’ backgroundand expressedmotivations
As in our earlier 1995 study, one of our research aims was to examine providers’motivations and identify the factors that influence their motives. The 1995 surveyfound that 75% of the interviewees had a background in the caring professions.We asked our 1999 interview sample about their previous occupation and theircurrent motives for being in this business. As figure 21 indicates, the majority ofinterviewees (79%) had a background in the caring professions.
Providers were asked to select, from eight given motives, those important to them(figure 22). The majority (73%) of providers selected developing skills andexpertise, followed by professional achievement (71%). Some 63% said they weremotivated by meeting the needs of elderly people. Finally, only 9% of intervieweesreported profit maximising as one of their main motives.
When we asked interviewees to rank their three most important motives, thoseselected as most important were:
� to meet the needs of older people� professional accomplishment and creative achievement� to develop or use skills and expertise
B A C K G R O U N D A N D M O T I V A T I O N S
21
23.2
5.4
8.9
21.4
17.9
1.8
19.6
NHS nursing/continuing care
Other health
SSD purchaser/commissioner or social worker
Residential care/nursing home
Social care provider – day, meals, domiciliary
Voluntary organisation (non-residential care)
Non-care
0 5 10 15 20 25 30
Per cent
Figure 21: Interviewees’ occupation before coming into this business (n = 56)
73.2
71.4
62.5
55.4
53.6
39.3
32.1
8.9
To develop or use skills and expertise
Professional accomplishment and creative achievement
To meet the needs of elderly people
Independence and autonomy
A satisfactory level of personal income
Duty/responsibility to society as a whole
Duty/responsibility to a particular section of society
Income and profit maximising
0 20 40 60 80 100
Per cent
Figure 22: Current motivations for being in this business (n = 56)
Percentages add up to more than 100% because respondents chose more than one motive.

It is worth emphasising that ‘a satisfactory level of personal income’ was the mostfrequent third choice and that ‘income and profit maximising’ was the leastfrequently mentioned motive.
We asked interviewees whether their motives had changed since 1993. Nearly two-thirds (63%) reported no change in their motivations since then. In addition wewere interested to find out whether the operational aims of their organisationreflected their personal motives. The findings show that 86% of our interviewsample said that their motives correspond to the motivations behind theirorganisation.
Two further points concerning this evidence on expressed motivations areimportant. First, while we might expect providers to present themselves in a goodlight by playing down the significance of financial considerations, evidence fromprevious MEOC provider studies suggests that actual pricing behaviour isconsistent with expressed motivations (Forder, 2000) Second, providers’motivations in social care need to be understood not only in terms of the morefixed factors listed above, but also as bound up with the natures of the structuresfor communication and feedback set in place by purchasers, and the character oftheir relationships with public purchasers. In another paper (Kendall et al., 2001)we explore how these linkages can be conceptualised, and show empirically howdistinctive combinations exist.
D O M I C I L I A R Y C A R E P R O V I D E R S
22

10Future plans
We asked interviewees about their business expectations, over the next 12 months,in terms of the number of hours of service and the proportion of private payers(figure 23).
The figures in figure 23 indicate that in regard to business plans for the next yearthe majority of providers were in favour of ‘controlled growth’. As one intervieweeexplained:
We are aware that it is a growth area, a growthindustry — but what we have been very carefulabout is having in place systems and staff levels sothat we can supply a high quality service. Wewould have expended a lot more quickly, butprobably lost the reputation, which is everythingin the industry.
We were also interested in whether they had anybusiness plans to diversify into day and other careservices in the next year. Rather less than half hadsuch plans (figure 24).
Finally we asked interviewees whether theyanticipated leaving domiciliary care in the next year:none did.
F U T U R E P L A N S
23
32.1
55.4
7.11.8
10.7
35.7 33.9
1.8
Considerable increase Slight increase No change Slight decrease0
10
20
30
40
50
60
70
Per
cent
Hours Private payers
Figure 23: Plans for the business over the next 12 months in terms of total number ofhours and proportion of private payers (n = 55, missing = 1)
25.0
33.9
0
5
10
15
20
25
30
35
40
Per
cent
Oth
erca
re
Day
serv
ices
Figure 24: Business plans,over the next 12 months, interms of diversifying intoother care and day services(n = 56)

11Conclusions andsummary
This PSSRU/Nuffield Institute study offers a statistical snapshot of independentsector publicly funded domiciliary care providers in England. The data werecollected in eleven areas during 1999, through a postal survey and interviews.There is no reason to believe that the findings are not generalisable to the wholeof the country. Other sources of information on domiciliary care markets —insofar as they overlap with this study — report similar characteristics and trends(Department of Health, 2000; Laing & Buisson, 2000).
The majority of organisations in our sample were private businesses, and a smallproportion were charities or other nonprofit entities. Overall, there appears tohave been an increase in the level of competition in the domiciliary care market,with more than a half of interviewees reporting more competition now than in1993 or when they entered the market.
There has also been an increase in local authorities’ influence on the final contractprices. Most providers were able to cover their costs for publicly-funded clients.However, the way they covered their costs was either by reducing their runningcost or in some cases significantly reducing their profit. A shortage of care staffremains a major problem for independent sector domiciliary care providers. Manyreport a lack of suitable applicants, linked to competition from other employers.
Providers’ relationships with local authorities have improved considerably sinceour previous study in 1995. However, the majority still aspired to greaterinformation and enhanced communication. They would like local authorities tobe more transparent about their purchasing intentions and in-house policies, inparticular about the unit costs of in-house domiciliary care.
Findings from this study suggest that the domiciliary care market in England isstill developing. We would expect to see considerable further changes over at leastthe next few years.
D O M I C I L I A R Y C A R E P R O V I D E R S
24

R E F E R E N C E S & C O N T A C T S
25
REFERENCES
* Papers asterisked give more details on certain aspects of this study.
*Brian Hardy, Patricia Ware, Gerald Wistow, Julien Forder, Jeremy Kendall, Martin Knapp
and Tihana Matosevic (2001) Mixed Modes of Governance and Mixed Economies of Care,
Nuffield Institute for Health, University of Leeds.
Brian Hardy (1998) 1997 Survey of UKHCA Members, United Kingdom Home Care
Association and Nuffield Institute for Health, Community Care Division, Carshalton
Beeches and Leeds.
Brian Hardy, Ruth Young and Gerald Wistow (1996) Purchasing Domiciliary Care: The
Provider Perspective, Nuffield Institute for Health, University of Leeds.
Department of Health (2000) Community Care Statistics 1999: Home Help/Home Care
Services, England; Department of Health, London.
Julien Forder (2000) Mental health: market power and governance, Journal of Health
Economics, 19, 6, 877-905.
*Julien Forder, Jeremy Kendall, Martin Knapp, Tihana Matosevic, Brian Hardy and Patricia
Ware (2001) Prices, Contracts and Domiciliary Care, PSSRU, London School of
Economics.
*Jeremy Kendall, Tihana Matosevic, Julien Forder, Martin Knapp, Brian Hardy and Patricia
Ware (2001) The Motivations of Domiciliary Care Providers in England: New Concepts, New
Findings, PSSRU, London School of Economics.
Laing & Buisson (1999) Domiciliary Care Markets 1999, Laing & Buisson Publications Ltd,
London.
Laing & Buisson (2000) Domiciliary Care Markets 2000, Laing & Buisson Publications Ltd,
London.
*Patricia Ware, Tihana Matosevic, Julien Forder, Brian Hardy, Jeremy Kendall, Martin Knapp
and Gerald Wistow (2001) Movement and Change: Independent Sector Domiciliary Care
Providers between 1995 and 1999, Nuffield Institute for Health, University of Leeds.
Social and Health Care Workforce Group (1999) Social Services Workforce Analysis Main
Report 1998 Survey, Social and Health Care Workforce Group, London.
United Kingdom Home Care Association (2000) Who Cares? A Profile of the Independent
Sector Home Care Workforce in England, UKHCA, Carshalton Beeches, Surrey.
CONTACTS
Telephone Email
Tihana Matosevic 0207 955 6315 [email protected]
Martin Knapp 0207 955 6225 [email protected]
Jeremy Kendall 0207 955 6147 [email protected]
Julien Forder 0207 955 6173 [email protected]
Patricia Ware 0113 233 6356 [email protected]
Brian Hardy 0113 2336354 [email protected]
www.ukc.ac.uk/PSSRU/
www.leeds.ac.uk/nuffield/

English local authorities now purchase more
domiciliary care than they provide directly.
Furthermore, it is the more intensive packages
of care which are more likely to be contracted
out to independent sector organisations.
Who are these independent sector providers?
What are their main characteristics? What are
their market experiences and how do they
respond to changes in the context of care,
especially in relation to local authority
commissioning? What is the nature of
providers’ relationships with purchasers?
What were the motivations for entering the
domiciliary care market? What are the
working conditions and qualifications of staff ?
Finally, what expectations do providers have
for the future?
This paper summarises findings from the 1999
PSSRU/Nuffield domiciliary care study, which
was designed to give answers to these
questions. The study was conducted as part
of the Mixed Economy of Care Research
Programme, which is a long-running joint
endeavour by the Personal Social Services
Research Unit, London School of Economics,
and the Nuffield Institute for Health,
University of Leeds. It follows on from a
similar study by the same group in 1995.
ISBN 1-902671-21-X