Embed Size (px)
Citation preview

Extensive Variation and Sub-Structuring in Lineage AmtDNA in Indian Sheep: Genetic Evidence forDomestication of Sheep in IndiaSachin Singh1, Satish Kumar Jr2, Atul P. Kolte3, Satish Kumar1*¤
1 CSIR-Centre for Cellular and Molecular Biology, Hyderabad, India, 2 ICAR-Central Sheep and Wool Research Institute, Avikanagar, India, 3 ICAR-NationalInstitute of Animal Nutrition and Physiology, Bangaluru, India
Abstract
Previous studies on mitochondrial DNA analysis of sheep from different regions of the world have revealed thepresence of two major- A and B, and three minor- C, D and E maternal lineages. Lineage A is more frequent in Asiaand lineage B is more abundant in regions other than Asia. We have analyzed mitochondrial DNA sequences of 330sheep from 12 different breeds of India. Neighbor-joining analysis revealed lineage A, B and C in Indian sheep.Surprisingly, multidimensional scaling plot based on FST values of control region of mtDNA sequences showedsignificant breed differentiation in contrast to poor geographical structuring reported earlier in this species. The breeddifferentiation in Indian sheep was essentially due to variable contribution of two major lineages to different breeds,and sub- structuring of lineage A, possibly the latter resulting from genetic drift. Nucleotide diversity of this lineagewas higher in Indian sheep (0.014 ± 0.007) as compared to that of sheep from other regions of the world (0.009 ±0.005 to 0.01 ± 0.005). Reduced median network analysis of control region and cytochrome b gene sequences ofIndian sheep when analyzed along with available published sequences of sheep from other regions of the worldshowed that several haplotypes of lineage A were exclusive to Indian sheep. Given the high nucleotide diversity inIndian sheep and the poor sharing of lineage A haplotypes between Indian and non-Indian sheep, we propose thatlineage A sheep has also been domesticated in the east of Near East, possibly in Indian sub-continent. Finally, ourdata provide support that lineage B and additional lineage A haplotypes of sheep might have been introduced toIndian sub-continent from Near East, probably by ancient sea trade route.
Citation: Singh S, Kumar Jr S, Kolte AP, Kumar S (2013) Extensive Variation and Sub-Structuring in Lineage A mtDNA in Indian Sheep: Genetic Evidencefor Domestication of Sheep in India. PLoS ONE 8(11): e77858. doi:10.1371/journal.pone.0077858
Editor: Axel Janke, BiK-F Biodiversity and Climate Research Center, Germany
Received September 1, 2012; Accepted September 13, 2013; Published November 11, 2013
Copyright: © 2013 Singh et al. This is an open-access article distributed under the terms of the Creative Commons Attribution License, which permitsunrestricted use, distribution, and reproduction in any medium, provided the original author and source are credited.
Funding: This study was supported by in-house research funds from the Centre for Cellular and Molecular Biology, Hyderabad and the Central Sheep andWool Research Institute, Avikanagar. There are no current external funding sources for this study. The funders had no role in study design, data collectionand analysis, decision to publish, or preparation of the manuscript.
Competing interests: The authors have declared that no competing interests exist.
* E-mail: [email protected]
¤ Current address: DBT-National Institute of Animal Biotechnology, Hyderabad, India
Introduction
The present day domestic livestock has been derived fromtaming of various wild animal species, and sub-sequently byexpanding their numbers and selective breeding in captivity byman to suite his various purposes, namely; food, fiber, draught,game etc. Domestication of animals heralded a cultural andeconomic revolution in human history. Understanding theprocesses of domestication has very significant bearing notonly in working out strategies for further genetic improvementand conservation of genetic variability in livestock species butalso in gaining knowledge on the ancient human historyincluding trade and culture. Molecular genetic markers,particularly, control region of maternally inherited mitochondrialgenome, have been extensively used to understand the origin
of different domesticated livestock species [1,2,3,4,5,6,7,8]. Incertain instances, it has also been possible to identify therespective wild species that gave rise to the domestic stocks.During the last several years such studies have shown thatmost of the livestock species have been domesticated morethan once and or in more than one geographical regions of theworld as evident from the discovery of multiple and distinctmitochondrial lineages in the extant populations [6,9,10,11,12].
Archaeological evidence suggests that sheep might havebeen one of the earliest species domesticated by man ~12000years bp in Southwestern Asia [13]. Mitochondrial DNA studiesrevealed the presence of two lineages- A and B in domesticsheep populations [4,14,15]. Neither of these lineages showedsignificant relationship with mitochondrial DNA sequences ofthe wild species of sheep. Subsequent studies [16,17,18,19]
PLOS ONE | www.plosone.org 1 November 2013 | Volume 8 | Issue 11 | e77858

have demonstrated that domestic sheep has a complexdomestication history involving two major (A and B) and threeminor (C, D, and E) maternal lineages. Tapio and colleaguesfurther suggested that the two major lineages weredomesticated in Near East [18]. Based upon control regionmtDNA sequences Hiendleder and colleagues thought that thelineage B type sheep might have originated from Europeanmouflon (Ovis musimon) [4]. On the other hand Groeneveldand coworkers argued that the latter might represent the feralform of lineage B type sheep rather than being the wildoriginator of domestic sheep in Europe [20]. The wild ancestorsof domestic sheep remain to be identified. Althoughmitochondrial and other DNA markers studies [21] on sheepbreeds from different parts of the world have revealed verypoor geographical structuring mitochondrial diversity studieshave shown that lineage B is predominantly found in Europeanregions [18,19] and lineage A is prevalent in Asia [16,22]. In alimited study, only lineage A has been reported in Indian sheep[22] (Pardeshi et al. 2007).
Genetic studies on mitochondrial DNA have indicated thatIndian sub-continent has been one of the important places ofdomestication of river buffalo [6,7] and zebu cattle [23]. Indiahas a vast genetic resource of sheep diversity represented bymore than 40 different recognized breeds that are distributed invarious agro-climatic zones of the country [24]. Therefore, tounderstand the domestication of sheep, we have investigatedthe control region mtDNA and cytochrome b gene sequencesof 330 samples from 12 different breeds from various regionsof India. Analysis of our data along with those from publishedliterature provides genetic evidence for domestication oflineage A type sheep in India and support for immigration oflineage B and additional lineage A haplotypes into India fromelsewhere, probably through sea route in ancient times.
Materials and Methods
Ethics statementThe study involved drawing of ~ 5 ml blood from jugular vein
aseptically from domestic sheep with the consent of the flockowners. There is no specific legislation for blood samplecollection and hence no approval was necessary. Bloodsamples for all breeds, except Deccani and Nellore, werecollected by Dr. Satish Kumar Jr., Ph.D. and Dr. Atul Kolte,M.V.Sc. Samples from Deccani and Nellore breeds werecollected by Dr. Mahesh D. Sahare, M.V.Sc. and Dr. AviratSwaimul, M.V.Sc. for their dissertation work. These sampleswere originally collected for genotyping in various researchprojects at CSWRI, Avikanagar.
Sample collectionBlood samples from 330 unrelated sheep, except those from
Garole breed, representing four different agro-climatic zones ofIndia were collected from farmers’ flocks (Figure 1). Un-relatedness of the sampled animals was ensured by coveringthe breeding tract of a given breed, restricting the number ofsamples taken from a village to one or two, and by gainingknowledge on breeding history of the selected animals basedon personal interviews with flock owners. Blood samples from
26 unrelated animals of Garole breed were obtained from theCentral Sheep and Wool Research Institute, Avikanagar,Rajasthan, India. DNA was isolated from jugular vein bloodusing organic extraction method [25].
PCR amplification and sequencing of the mitochondrialDNA
To amplify a 721 bp of control region mtDNA fragment,Primer 3 software was used for primer designing and threeoverlapping sets of primers: I) forward 5’-CCAGAGAAGGAGAACAACCAA-3’ reverse 5’-CATGGTGAACAAGCTCGTGA-3’; II) forward 5’-TGTCTGTCTTAAACATGCAAACG-3’ reverse 5’-CCAAGCATCCCCAAAAATTA-3’, and III) forward 5’-GGGTATTAAACTGCTTGACCGTA-3’ reverse 5’-GCATTTTCAGTGCCTTGCTT-3’ were designed based onsheep mitochondrial reference sequence: AF010406 [26]. Thecoordinates of the amplicon corresponded from 15541 to16216 nt of the reference sequence. PCR reactions wereperformed using 2X AmpliTaq gold PCR master Mix (AppliedBiosystem, Roche Molecular System, Inc.), 5 pM each primer,20 ng of DNA in a final volume up to 10 µl. The reactions wereperformed in Eppendorf thermal cycler with followingconditions: initial denaturation 95°C for 5 min, followed by 30cycles at 94°C for 1 min, 59°C for 45 sec and 72°C for 1 minand final extension at 72°C for 5 min. Single band of the PCRproducts were confirmed by 1.5 % agarose gel electrophoresisstained with ethidium bromide. Amplicons were treated withExoSAP-IT as per manufactures instructions (Affymetrix).Sequencing reactions were performed using BigDyeTerminator Cycle Sequencing Kit (Applied Biosystems) and theproducts were purified by alcohol precipitation. Purifiedproducts were analyzed in ABI 3730 automated DNAsequencer (Applied Biosystems). To amplify a 967 bp ofcytochrome b gene, the following three sets of primer pairswere used: I) forward 5’-TGTCATCATCATTCTCACATGG-3’reverse 5’-GCGATGATGAATGGGAAAATA-3’ II) forward 5’-GGACGAGGCCTATACTATGGA-3’ reverse 5’-TGAGGGGGAGTGTTAAGTGG-3’ III) forward 5’-CCTACTAATCCTCATCCTCATGC-3’ reverse 5’-GGGAGGTTGGTTGTTCTCCT-3’. PCR and sequencingreactions were setup essentially using the same condition asdescribed above for control region mtDNA except that theannealing temperatures of 53°C for the first and third set of theprimer pairs and 50°C for the second set primer pair wereused. The sheep sequences were submitted to GenBank(accession numbers JX545477 - JX546133).
Data analysisThe sequences were edited using AUTOASSEMBLER
(Perkin Elmer) program and 721 bp of control region mtDNAwere obtained with respect to the reference sequence.Alignment showed that control region of the majority of thesequences contained four 75 bp tandem repeats, while twosequences contained three 75 bp & one 76 bp repeats.However, three samples contained one 75 & three 76 bptandem repeats each. For comparative analysis of oursequences, control region mtDNA sequences of domestic and
Genetic Evidence for Sheep Domestication in India
PLOS ONE | www.plosone.org 2 November 2013 | Volume 8 | Issue 11 | e77858

Figure 1. An outline map of India depicting sampling sites of Indian domestic sheep breeds used in the study. Number ofanimals has been shown in parenthesis against the name of the respective breed. 1- Muzzafarnagri (22); 2- Nali (31); 3- Chokla(38); 4- Kheri (29); 5- Marwari (31); 6- Jaisalmeri (25); 7- Sonadi (29); 8- Patanwadi (20); 9- Deccani (26); 10- Nellore (28); 11-Ganjam (23); 12- Garole (26).doi: 10.1371/journal.pone.0077858.g001
Genetic Evidence for Sheep Domestication in India
PLOS ONE | www.plosone.org 3 November 2013 | Volume 8 | Issue 11 | e77858

wild sheep were collated from NCBI as follows: (DQ242050 -DQ242455) [18], (DQ491576 - DQ491736) [27], (EU019130 -EU019189), (AY829376 - AY829430) [16], (DQ903228 -DQ903304) [28], (DQ852280 - DQ852289) [19], Ovis ammonammon AF242347 [4], Ovis vignei arkal AY091489 [4], Ovisammon nigrimontana AY091494 [4], Ovis vignei bochariensisAY091491 [15], Ovis ammon collium AY091492 [4] and OvisVignei arkal AY091489 [4]. The cytochrome b gene sequencesof 326 sheep from the present study were analyzed along withfollowing sequences available from the data bases: (FJ218019- FJ218150) [22], (DQ903208 - DQ903227), (AY879464 -AY879584) [29], (DQ097407 - DQ097430) [17] (DQ851886 -DQ852082) [19]. In order to avoid tandem repeats present insheep control region mtDNA, we considered 432 bp comprisingtwo fragment (I) 103 bp spanning from 15541 to 15643 and (II)329 bp from 15933 to 16261 with respect to the referencesequence.
ClustalX version 65534.0.10.0 program [30] was used for thealignment of sequences. GeneDoc version 2.7.0.0 packagewas used for formatting the aligned sequences to make themcompatible for the desired software. MEGA 5 version 5.0.1.102[31] was used to construct Neighbor-joining tree using Tamura-Nei model [32] with 10,000 replicates. Maximum Likelihood treewas also constructed with Hasegawa-Kishino-Yano (HKY) [33]model (+G = 0.37, I = 0.62) with 5 categories. DNA alignmentsoftware version 1.3.1.1 (www.fluxus-engineering.com) wasused to convert the aligned sequence into RDF binary format.Reduced median network [34,35,36] was drawn using Networksoftware version 4.6.1.0 (www.fluxus-engineering.com) withparameters set to a weight of 2 and threshold value of 1.Haplotype, nucleotide diversity and its standard error, Fu’s Fsstatistics [37], mismatch distribution [38], AMOVA (analysis ofmolecular variance), and the population pairwise differences(FST) values were calculated using Arlequin version 3.5.1.2software [39]. Pairwise FST values were calculated with 10,000bootstrap and values were displayed as a multidimensionalscaling (MDS) plot with a stress value = 0.12 using SPSS 11.0software.
Results
Genetic variation within control region mtDNAsequences
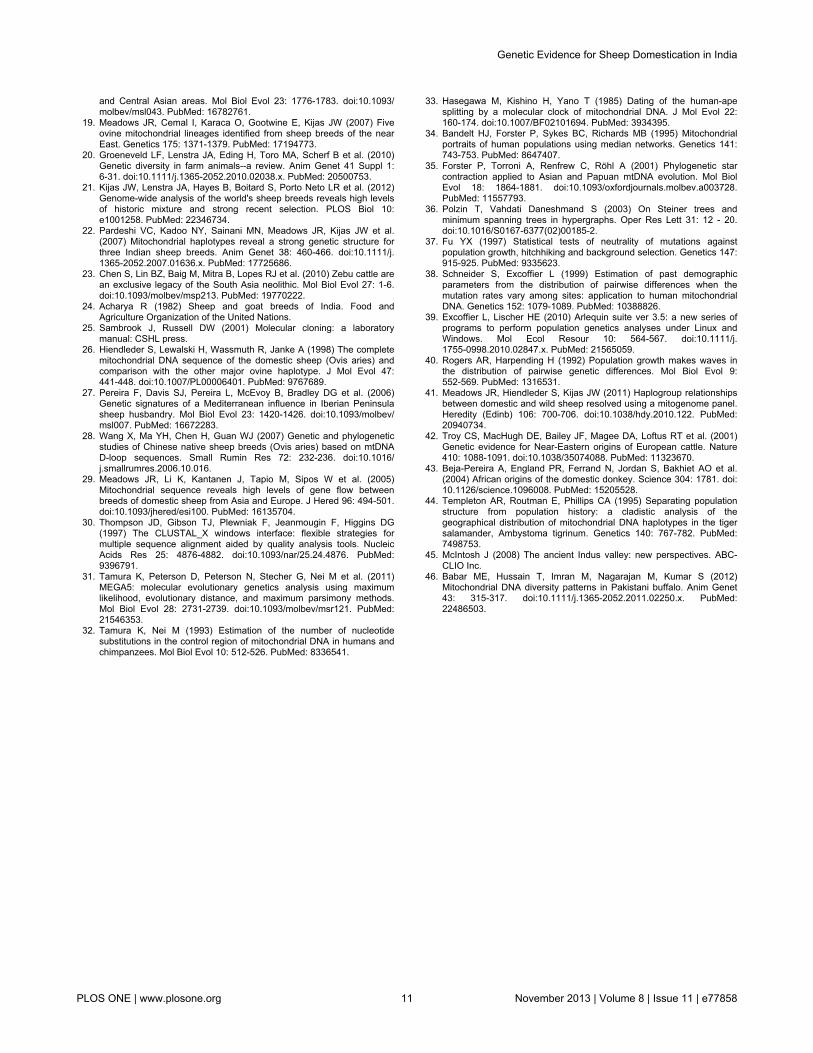
We aligned 432 bp of control region mtDNA sequences of330 samples of Indian sheep belonging to 12 different breedsfrom four agro-climatic regions of India (Figure 1). The samplesize for a given breed ranged from 20 to 38. Multiple sequencealignment revealed the presence of 77 nucleotide variablesites, out of which 64 were parsimony informative and 13 weresingleton sites. The comparison of 330 sequences showed 193mitochondrial haplotypes; among them 146 haplotypes wereunique. The most frequent haplotype was observed in 30individuals from seven breeds. The number of haplotypes for agiven breed ranged from 14 to 30 and the haplotype diversityvalues ranged from 0.916 ± 0.05 (Patanwadi) to 0.993 ± 0.01(Jaisalmeri) and the nucleotide diversity varied from 0.015 ±0.008 (Deccani) to 0.036 ± 0.018 (Sonadi) [Table 1]. The hightransition: transversion ratio (18.24: 1) revealed strong bias
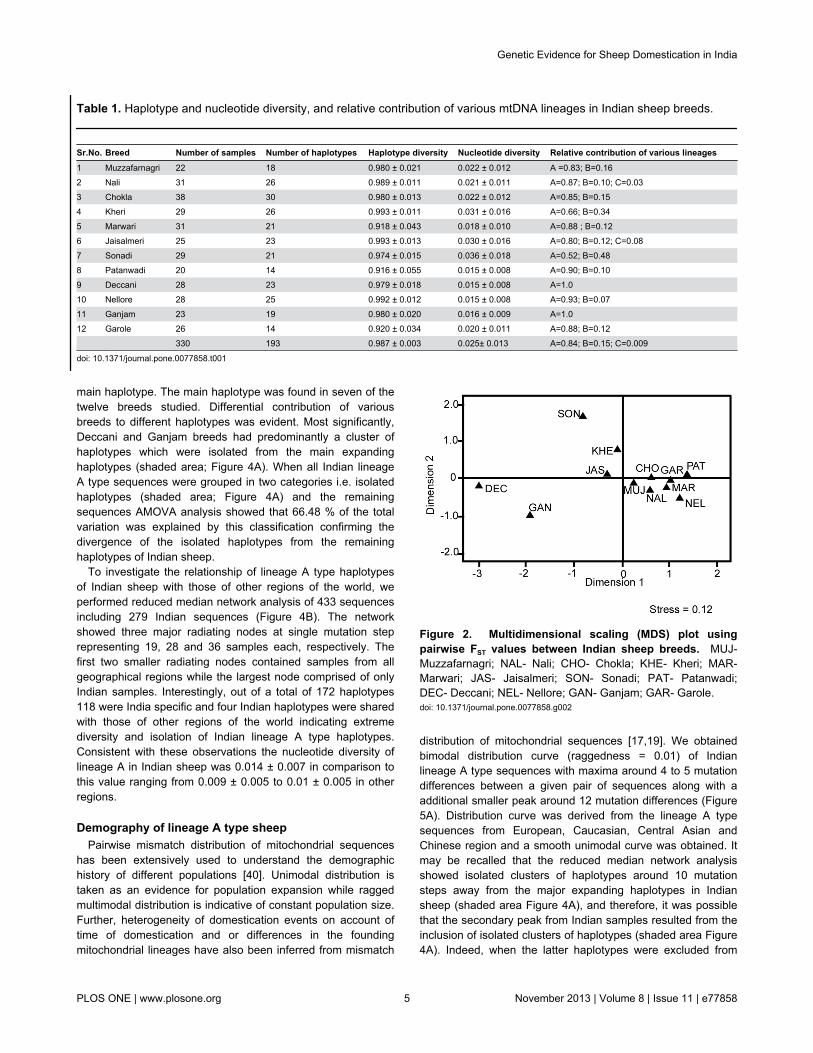
towards transition in Indian domestic sheep as has beenreported for various species [5,7]. The breed effect onmitochondrial genetic variation was analyzed by AMOVA. Thebreed component contributed 13.41% to the total mitochondrialgenetic variation (P < 0.01) indicating significant breeddifferentiation with respect to maternal lineages of Indiansheep. To further understand the genetic differentiation amongbreeds, FST values were calculated between all breed pairsbased on the nucleotide differences. Maximum differentiationwas observed between Deccani and Patanwadi (44.90%),while no significant differentiation was observed among agroup of breeds such as Marwari, Garole, Chokla, Nali,Patanwadi, Muzzafarnagri and Nellore. Calculated pairwise FST
values were also analyzed by multidimensional scaling (MDS)plot with stress value of 0.12 (Figure 2). MDS plot revealedthree major groups: 1) Deccani and Ganjam; 2) Chokla,Marwari, Muzzafarnagri, Nali, Nellore, Patanwadi, Jaisalmeri,Garole and Kheri; 3) Sonadi. Consistent with these resultsAMOVA analysis after classification of Deccani and Ganjambreeds as one group versus the remaining breeds as a singlegroup explained 21.15% (P < 0.01) of total genetic variation.Similarly, when Sonadi breed was treated as an additionalgroup 23.33 % (P < 0.01) of the total genetic variation wasaccounted by this grouping.
Phylogenetic analysisNeighbor-joining tree based on 432 bp of control region
mtDNA of 330 sheep samples from India and rooted with wildsheep sequences showed the presence of three distinctlineages, namely; A, B and C, out of the five lineages reportedin this species thus far (Figure 3A). Lineage A waspredominant in Indian sheep (84%) as compared to lineage B(15%) [Table 1]. Lineage C was found in less than 1% of theanimals analyzed. Maximum likelihood tree also showed asimilar topology (Figure S1). Interestingly, the sequencediversity in lineage A of Indian sheep as compared to that ofsheep breeds from other parts of the world was high (Figure3B). Indeed, several branches of lineage A in the tree wereexclusive to Indian sheep indicating sub - structuring of thelineage A. The relative contribution of lineage A and B todifferent breeds was extremely variable (Table 1). Whilemajority of the breeds had predominantly lineage A (66 to93%), Deccani and Ganjam breeds had only lineage A while inSonadi breed the two lineages were almost equallyrepresented.
Reduced median network analysisGiven the complexity of lineage A in Indian sheep as
revealed by phylogenetic analysis (Figure 3) we investigatedthe relationships among various haplotypes of 279 animals oflineage A and their distribution in various breeds (Figure 4A).Reduced median network analysis (Figure 4A) showed multipleexpanding haplotypes and several singletons radiating fromthese expanding haplotypes indicating the expansion of lineageA type sheep populations in India. Although there was a mainexpanding haplotype there were many additional haplotypesshowing expansion both a few mutation steps away from themain haplotype as well as ten mutation steps away from the
Genetic Evidence for Sheep Domestication in India
PLOS ONE | www.plosone.org 4 November 2013 | Volume 8 | Issue 11 | e77858
main haplotype. The main haplotype was found in seven of thetwelve breeds studied. Differential contribution of variousbreeds to different haplotypes was evident. Most significantly,Deccani and Ganjam breeds had predominantly a cluster ofhaplotypes which were isolated from the main expandinghaplotypes (shaded area; Figure 4A). When all Indian lineageA type sequences were grouped in two categories i.e. isolatedhaplotypes (shaded area; Figure 4A) and the remainingsequences AMOVA analysis showed that 66.48 % of the totalvariation was explained by this classification confirming thedivergence of the isolated haplotypes from the remaininghaplotypes of Indian sheep.
To investigate the relationship of lineage A type haplotypesof Indian sheep with those of other regions of the world, weperformed reduced median network analysis of 433 sequencesincluding 279 Indian sequences (Figure 4B). The networkshowed three major radiating nodes at single mutation steprepresenting 19, 28 and 36 samples each, respectively. Thefirst two smaller radiating nodes contained samples from allgeographical regions while the largest node comprised of onlyIndian samples. Interestingly, out of a total of 172 haplotypes118 were India specific and four Indian haplotypes were sharedwith those of other regions of the world indicating extremediversity and isolation of Indian lineage A type haplotypes.Consistent with these observations the nucleotide diversity oflineage A in Indian sheep was 0.014 ± 0.007 in comparison tothis value ranging from 0.009 ± 0.005 to 0.01 ± 0.005 in otherregions.
Demography of lineage A type sheepPairwise mismatch distribution of mitochondrial sequences
has been extensively used to understand the demographichistory of different populations [40]. Unimodal distribution istaken as an evidence for population expansion while raggedmultimodal distribution is indicative of constant population size.Further, heterogeneity of domestication events on account oftime of domestication and or differences in the foundingmitochondrial lineages have also been inferred from mismatch
distribution of mitochondrial sequences [17,19]. We obtainedbimodal distribution curve (raggedness = 0.01) of Indianlineage A type sequences with maxima around 4 to 5 mutationdifferences between a given pair of sequences along with aadditional smaller peak around 12 mutation differences (Figure5A). Distribution curve was derived from the lineage A typesequences from European, Caucasian, Central Asian andChinese region and a smooth unimodal curve was obtained. Itmay be recalled that the reduced median network analysisshowed isolated clusters of haplotypes around 10 mutationsteps away from the major expanding haplotypes in Indiansheep (shaded area Figure 4A), and therefore, it was possiblethat the secondary peak from Indian samples resulted from theinclusion of isolated clusters of haplotypes (shaded area Figure4A). Indeed, when the latter haplotypes were excluded from
Figure 2. Multidimensional scaling (MDS) plot usingpairwise FST values between Indian sheep breeds. MUJ-Muzzafarnagri; NAL- Nali; CHO- Chokla; KHE- Kheri; MAR-Marwari; JAS- Jaisalmeri; SON- Sonadi; PAT- Patanwadi;DEC- Deccani; NEL- Nellore; GAN- Ganjam; GAR- Garole.doi: 10.1371/journal.pone.0077858.g002
Table 1. Haplotype and nucleotide diversity, and relative contribution of various mtDNA lineages in Indian sheep breeds.
Sr.No. Breed Number of samples Number of haplotypes Haplotype diversity Nucleotide diversity Relative contribution of various lineages1 Muzzafarnagri 22 18 0.980 ± 0.021 0.022 ± 0.012 A =0.83; B=0.162 Nali 31 26 0.989 ± 0.011 0.021 ± 0.011 A=0.87; B=0.10; C=0.033 Chokla 38 30 0.980 ± 0.013 0.022 ± 0.012 A=0.85; B=0.154 Kheri 29 26 0.993 ± 0.011 0.031 ± 0.016 A=0.66; B=0.345 Marwari 31 21 0.918 ± 0.043 0.018 ± 0.010 A=0.88 ; B=0.126 Jaisalmeri 25 23 0.993 ± 0.013 0.030 ± 0.016 A=0.80; B=0.12; C=0.087 Sonadi 29 21 0.974 ± 0.015 0.036 ± 0.018 A=0.52; B=0.488 Patanwadi 20 14 0.916 ± 0.055 0.015 ± 0.008 A=0.90; B=0.109 Deccani 28 23 0.979 ± 0.018 0.015 ± 0.008 A=1.010 Nellore 28 25 0.992 ± 0.012 0.015 ± 0.008 A=0.93; B=0.0711 Ganjam 23 19 0.980 ± 0.020 0.016 ± 0.009 A=1.012 Garole 26 14 0.920 ± 0.034 0.020 ± 0.011 A=0.88; B=0.12 330 193 0.987 ± 0.003 0.025± 0.013 A=0.84; B=0.15; C=0.009
doi: 10.1371/journal.pone.0077858.t001
Genetic Evidence for Sheep Domestication in India
PLOS ONE | www.plosone.org 5 November 2013 | Volume 8 | Issue 11 | e77858

Indian samples a smooth unimodal mismatch distribution wasobtained (Figure 5C). These results indicated that Indian type Asequences and those from other regions of the world hadsimilar demographic history. However distribution curve
(raggedness = 0.05) (Figure 5D) of isolated cluster ofhaplotypes (shaded area; Figure 4A) showed maxima around 3mutation differences between a given pair of haplotypes.
Figure 3. Neighbor-joining tree of domestic sheep based on 432 bp of control region mtDNA. (A) Neighbor-joining tree ofmtDNA sequences of Indian sheep (330) along with representative samples of five lineages (▲), namely; A, B, C, D & E. Indiansheep show three lineages, namely; A, B and C. (B) Neighbor-joining tree of mtDNA sequences of the Indian (330), Chinese (129),Central Asian, Caucasian and European (406), Portuguese (161), and West Balkan (60), sheep along with representative samplesof five lineages (▲), namely; A, B, C, D & E . The sequences of wild Ovis species have been used as outgroups. MEGA 5 version5.0.1.102 was used to construct the trees using Tamura-Nei model with 10,000 bootstrap. Numbers above a given branch representbootstrap support for the branch as a percentage out of 10,000 re samplings.doi: 10.1371/journal.pone.0077858.g003
Genetic Evidence for Sheep Domestication in India
PLOS ONE | www.plosone.org 6 November 2013 | Volume 8 | Issue 11 | e77858

Figure 4. A reduced median network of lineage A type of domestic sheep based on 432 bp of control region mtDNA. (A)Network based on sequences of Indian sheep (279). (B) Network based on Indian (279), Chinese (46), Central Asian, Caucasianand European (98), Portuguese (6) and West Balkan (4) sheep sequences. The nodes represent haplotypes and the size of a givennode is proportional to the frequency of the samples represented in that node. Branch length is proportional to the mutationaldifferences between. The smallest node represents one individual animal.doi: 10.1371/journal.pone.0077858.g004
Genetic Evidence for Sheep Domestication in India
PLOS ONE | www.plosone.org 7 November 2013 | Volume 8 | Issue 11 | e77858

Discussion
Control region mtDNA analysis [18,19,27] and genome wideSNP studies [21] have revealed extensive variability in theextant genetic base of domestic sheep indicating contributionsfrom very diverse wild ancestral stocks in the process ofdomestication. Kijas and coworkers investigated the relativesuitability of various components of mitochondrial genome toestablish the relationship among domestic and wild sheep andfound that the results obtained with control region wereconsistent with those from whole mitochondrial genome [41].Using control region of mtDNA, five maternal lineages, namely;A, B, C, D and E have been reported to have contributed in theprocess of domestication of this species. Lineage B has closerelationship with European mouflon, Ovis musimon [4] whilewild ancestors of other lineages are not yet established. Out ofthe two major lineages, lineage B is predominant in sheep fromMiddle East, Caucasian and Europe [18,19,27], while inChinese sheep lineage A is prevalent [12,16]. A limited studyon Indian sheep has found only lineage A [22]. In the presentstudy, we analyzed 330 animals from 12 recognized sheepbreeds from different parts of India, particularly sampling alarge number of breeds from northwestern region of thecountry, the latter representing significant areas of the erstwhileIndus valley civilization. Out of the five known maternallineages, we found three lineages, namely; A, B and C in India(Figure 3 and Figure S2A). Lineage A was present in 84% ofthe animals studied, confirming the previous results thatlineage A was predominant in Indian sheep [22]. Distribution of
haplotypes in various sheep breeds has revealed a very weekpopulation structure with respect to the geography [12,29].Surprisingly, in our study multidimensional scaling plot of FST
values (Figure 2) and AMOVA analysis differentiated 12 breedsin three major groups, namely; 1) Deccani and Ganjam, 2)Sonadi, and 3) the remaining nine breeds as one cluster, albeitwithout any apparent geographical indications. A closerexamination of mitochondrial sequences of Sonadi, Deccaniand Ganjam breeds from the Northwestern, Westcentral andEastern parts of India, respectively revealed that these breedsdiffered significantly with respect to the relative contribution oflineage A and B as compared to the remaining Indian breeds(Table 1). While Deccani and Ganjam breed had exclusivelylineage A Sonadi animals had these two lineages in almostequal proportion, in contrast to 66% to 93% contribution oflineage A in the remaining breeds. Further, it was noteworthythat the majority of Deccani and Ganjam animals did not havethe most frequent haplotypes of lineage A of Indian sheep(Figure 4A). Indeed, Deccani and Ganjam animals sharedamong themselves a large number of haplotypes isolated fromthe main expanding haplotype of lineage A of Indian sheep(shaded area; Figure 4A).
Most interestingly, the survey of mitochondrial sequences ofIndian breeds and their comparison with those from otherregions of the world showed extremely high genetic diversity inlineage A (Figure 4B) in contrast to lineage B in Indian sheep(Figure S3). In neighbor-joining tree and reduced mediannetwork of lineage A there were several branches andhaplotypes that were exclusive to Indian sheep. On the other
Figure 5. Mismatch analysis based on 432 bp of control region mtDNA sequences of lineage A sheep from differentgeographical regions of the world. A) Distribution curve of lineage A sequences from India (279). B) Distribution curve of China(46), Central Asia, Caucasian and Europe (98), Portugal (6), and West Balkan (4). C) Distribution curve of 223 lineage A sequencesfrom India, after exclusion of 56 samples present in isolated haplotypes (shaded area; Figure 4A). D) Distribution curve of 56samples of isolated haplotypes (shaded area; Figure 4A).doi: 10.1371/journal.pone.0077858.g005
Genetic Evidence for Sheep Domestication in India
PLOS ONE | www.plosone.org 8 November 2013 | Volume 8 | Issue 11 | e77858

hand, Indian animals were present all over the network (Figure4B). These conclusions were also supported by reducedmedian network analysis using cytochrome b gene sequences(Figure S2B). Although it has been suggested that the lineageA type sheep might have been domesticated in Near East [18]no wild ancestor of lineage A has been identified thus far andspecifically there is no evidence in support of Argali and Urialbeing the originators of the modern day domestic sheep [15] &[41]. It is fairly assumed that the centers of domesticationwould have higher genetic variability and as one moves awayfrom such centers the genetic variability would drop [42,43]. Inthis context, it may be noted that on the basis of high geneticdiversity in Chinese sheep [12] it has been suggested thatsheep might have been independently domesticated in regionsother than Near East. Our study revealed that Indian sheep hascomparatively high mitochondrial nucleotide diversity. Inreduced median network (Figure 4B) the most frequent nodeand several secondary expanding haplotypes were exclusivelycomposed of Indian animals. The poor haplotype sharing ofIndian and non-Indian lineage A is a strong genetic evidence insupport of multiple domestication of this lineage. Our datataken together with the previously published results support thefollowing scenario of the sheep domestication. We propose thatthe present day lineage A sheep was also domesticated Eastof Near East. The genetic evidence in the present studyindicates possible domestication of sheep in Indian sub-continent from wild animals having lineage A haplotypesdifferent from those of non-Indian sheep. It may be noted thatin reduced median network some of Indian animals appearedto segregate at the fringes of the network (shaded area; Figure4A). We cannot rule out whether the isolated clusters ofhaplotypes in Indian samples may indicate secondaryexpansion of some of the haplotypes at the periphery of thenetwork after the initial domestication event (shaded area;Figure 4A)) of lineage A in India or these isolated haplotypesreflect yet another independent domestication event of lineageA in Indian sub-continent. The preferential representation ofDeccani and Ganjam breeds in the isolated cluster ofhaplotypes (shaded area; Figure 4A) might be the result ofsecondary expansion of these haplotypes in the regionsrepresented by these breeds. Templeton and coworkers [44]have argued that in gradually expanding population somehaplotypes on the margins of the network may expanddisproportionally and spread to new areas. In this context it isinteresting to note that although there is a relatively highcontribution of Deccani and Ganjam breeds to these isolatedhaplotypes other breeds are also represented in thesehaplotypes suggesting that expansion of these haplotypesmight have predated the differentiation of Deccani and Ganjambreeds from the remaining Indian breeds. However, thedifferential demographic history of the main Indian lineage Aand the subset of Indian lineage A type represented by theseisolated haplotypes (Figure 5B and D) may also argue in favorof the latter haplotypes representing an additional independentdomestication event. Although we have provided a stronggenetic evidence for domestication of lineage A in Indian sub-continent neither a suitable wild ancestor has been identifiednor there any archeological evidence to support the
domestication of sheep in Indian sub-continent. Furthermismatch distribution showed similar demographic history ofIndian and non-Indian lineage A sheep (Figure 5B and Figure5C).
Comparison of Indian lineage A and Chinese lineage Asheep with European sheep showed that Chinese lineage Awas more similar to European sheep than to Indian sheep(Figure 4B). However, in spite of this similarity the majorhaplotype in Chinese animals was a minor haplotype inEuropean sheep. Notwithstanding poor sharing of lineage Ahaplotypes of Indian and Chinese sheep as result of thepresence of several exclusive haplotypes in Indian animals, therecent SNP data indicate otherwise that the sheep from thesetwo regions are similar. One of the possible explanations couldbe that Chinese sheep represent a maternal lineage more akinto European sheep but with male mediated introgression fromIndian sheep. SNP genotyping and large scale sequencing ofIndian and Chinese sheep would be necessary to understandthis apparent paradox. Generally, it is agreed thatdomestication of lineage B type sheep has taken place in NearEast [18]. Our data on lineage B of Indian sheep, particularlythe complete absence of this lineage from a few Indian breedsfrom West-central and Eastern parts of the country ( [16] &present study) are consistent with the arrival of lineage B fromoutside of Indian sub-continent. Interestingly, the relativecontribution of lineage B to various breeds is extremely variable(0% to 48%), the highest being in Sonadi breed (Table 1 &Figure S4). The present-day breeding tract of Sonadi breedwere parts of the contemporary settlements of the suggestedHarappan domain of the Indus civilization and not very faraway from the very important ancient Lothal port of Induscivilization [45]. This port had important trading links with thefar corners of West Asia and Africa during the times of Induscivilization. The high frequency of lineage B in this region inIndia may be interpreted as a circumstantial evidence insupport of this port being one of the important entry points ofthis lineage into Indian sub-continent. As one moves away fromthis region, the contribution of lineage B in various Indianbreeds decreases (Figure S4). More interestingly, the samescenario continues in the Pakistani sheep i.e. lineage B ispresent only in 16 % of these animals (Babar, personalcommunication).
In conclusion, we have provide strong genetic evidence ofdomestication of the present day lineage A type sheep in eastof Near East, possibly in Indian sub-continent. In contrast to thepoor phylogeographic structuring of mitochondrial geneticdiversity in sheep from different regions of the world we foundstrong breed differentiation in Indian sheep as a consequencesof genetic drift in lineage A or founding effects due to anadditional domestication event in the regions of the present dayDecanni or Ganjam breeds and differential contribution oflineage B to various Indian breeds. Further, our data providesupport that lineage B type sheep and additional lineage Ahaplotypes of sheep would have been introduced to Indian sub-continent from Near East, probably by ancient sea trade route.Lately, genetic evidence has been accumulating to suggestthat cattle and buffalo were domesticated in South Asia[6,7,23,46]. Our study on Indian sheep adds one more species
Genetic Evidence for Sheep Domestication in India
PLOS ONE | www.plosone.org 9 November 2013 | Volume 8 | Issue 11 | e77858

to the list of the animals that possibly might have beendomesticated in Indian sub-continent.
Supporting Information
Figure S1. Maximum likelihood tree of Indian domesticsheep sequences (330) based on 432 bp of control regionmtDNA sequences along with representative samples offive lineages (▲), namely; A, B, C, D & E. Analysis revealedpresence of three distinct lineages, namely; A, B and C out offive lineages reported so far. The sequences of wild Ovisspecies have been used as outgroups. MEGA 5 version5.0.1.102 was used to construct the trees with 10,000bootstrap. Numbers above a given branch represent bootstrapsupport for the branch as a percentage out of 10,000 resamplings.(TIF)
Figure S2. A reduced median network analysis based on967 bp of cytochrome b gene. (A) Reduced median networkof 326 Indian domestic sheep sequences of the present studyshowed three distinct lineages, namely; A, B and C out of fivelineage reported so far. (B) Reduced median network of 824sequences of sheep from different region of the world revealedextensive haplotype diversity of lineage A in Indian sheep. Thenodes represent haplotypes and the size of a given node isproportional to the frequency of the samples represented inthat node. Branch length is proportional to the mutationaldifferences between nodes. The smallest node represents oneindividual animal.
(TIF)
Figure S3. A reduced median network analysis based on432 bp of control region mtDNA of lineage B sheep foundin different geographical regions of the world. Networkcomprised Indian (48), Chinese (47), Central Asian (21),Caucasian (94), European (380) sheep sequences. The nodesrepresent haplotypes and the size of a given node isproportional to the frequency of the samples represented inthat node. Branch length is proportional to the mutationaldifferences between nodes. The smallest node represents oneindividual animal.(TIF)
Figure S4. Geographical map of India depicting relativedistribution of Lineage A, B and C in different Indian sheepbreeds used in this study.(TIF)
Acknowledgements
We thank Mahesh D. Sahare, and Avirat Swaimul for collectionof blood samples from Deccani and Nellore breeds, Babar forsharing of data on Pakistani sheep.
Author Contributions
Conceived and designed the experiments: SK. Performed theexperiments: SS. Analyzed the data: SS SK. Contributedreagents/materials/analysis tools: SKJR AK. Wrote themanuscript: SK.
References
1. Bradley DG, MacHugh DE, Cunningham P, Loftus RT (1996)Mitochondrial diversity and the origins of African and European cattle.Proc Natl Acad Sci U S A 93: 5131-5135. doi:10.1073/pnas.93.10.5131. PubMed: 8643540.
2. Loftus RT, MacHugh DE, Bradley DG, Sharp PM, Cunningham P(1994) Evidence for two independent domestications of cattle. ProcNatl Acad Sci U S A 91: 2757-2761. doi:10.1073/pnas.91.7.2757.PubMed: 8146187.
3. Giuffra E, Kijas JM, Amarger V, Carlborg O, Jeon JT et al. (2000) Theorigin of the domestic pig: independent domestication and subsequentintrogression. Genetics 154: 1785-1791. PubMed: 10747069.
4. Hiendleder S, Kaupe B, Wassmuth R, Janke A (2002) Molecularanalysis of wild and domestic sheep questions current nomenclatureand provides evidence for domestication from two different subspecies.Proc Biol Sci 269: 893-904. doi:10.1098/rspb.2002.1975. PubMed:12028771.
5. Joshi MB, Rout PK, Mandal AK, Tyler-Smith C, Singh L et al. (2004)Phylogeography and origin of Indian domestic goats. Mol Biol Evol 21:454-462. PubMed: 14660684.
6. Kumar S, Nagarajan M, Sandhu JS, Kumar N, Behl V (2007)Phylogeography and domestication of Indian river buffalo. BMC EvolBiol 7: 186. doi:10.1186/1471-2148-7-186. PubMed: 17915036.
7. Kumar S, Nagarajan M, Sandhu JS, Kumar N, Behl V et al. (2007)Mitochondrial DNA analyses of Indian water buffalo support a distinctgenetic origin of river and swamp buffalo. Anim Genet 38: 227-232. doi:10.1111/j.1365-2052.2007.01602.x. PubMed: 17459014.
8. Larson G, Albarella U, Dobney K, Rowley-Conwy P, Schibler J et al.(2007) Ancient DNA, pig domestication, and the spread of the Neolithicinto Europe. Proc Natl Acad Sci U S A 104: 15276-15281. doi:10.1073/pnas.0703411104. PubMed: 17855556.
9. Bruford MW, Bradley DG, Luikart G (2003) DNA markers reveal thecomplexity of livestock domestication. Nat Rev Genet 4: 900-910. doi:10.1038/nrg1203. PubMed: 14634637.
10. Larson G, Dobney K, Albarella U, Fang M, Matisoo-Smith E et al.(2005) Worldwide phylogeography of wild boar reveals multiple centersof pig domestication. Science 307: 1618-1621. doi:10.1126/science.1106927. PubMed: 15761152.
11. Beja-Pereira A, Caramelli D, Lalueza-Fox C, Vernesi C, Ferrand N etal. (2006) The origin of European cattle: evidence from modern andancient DNA. Proc Natl Acad Sci U S A 103: 8113-8118. doi:10.1073/pnas.0509210103. PubMed: 16690747.
12. Chen SY, Duan ZY, Sha T, Xiangyu J, Wu SF et al. (2006) Origin,genetic diversity, and population structure of Chinese domestic sheep.Gene 376: 216-223. doi:10.1016/j.gene.2006.03.009. PubMed:16704910.
13. Zeder MA, Emshwiller E, Smith BD, Bradley DG (2006) Documentingdomestication: the intersection of genetics and archaeology. TrendsGenet 22: 139-155. doi:10.1016/j.tig.2006.01.007. PubMed: 16458995.
14. Wood NJ, Phua SH (1996) Variation in the control region sequence ofthe sheep mitochondrial genome. Anim Genet 27: 25-33. PubMed:8624033.
15. Hiendleder S, Mainz K, Plante Y, Lewalski H (1998) Analysis ofmitochondrial DNA indicates that domestic sheep are derived from twodifferent ancestral maternal sources: no evidence for contributions fromurial and argali sheep. J Hered 89: 113-120. doi:10.1093/jhered/89.2.113. PubMed: 9542158.
16. Guo J, Du LX, Ma YH, Guan WJ, Li HB et al. (2005) A novel maternallineage revealed in sheep (Ovis aries). Anim Genet 36: 331-336. doi:10.1111/j.1365-2052.2005.01310.x. PubMed: 16026344.
17. Pedrosa S, Uzun M, Arranz JJ, Gutiérrez-Gil B, San Primitivo F et al.(2005) Evidence of three maternal lineages in Near Eastern sheepsupporting multiple domestication events. Proc Biol Sci 272:2211-2217. doi:10.1098/rspb.2005.3204. PubMed: 16191632.
18. Tapio M, Marzanov N, Ozerov M, Cinkulov M, Gonzarenko G et al.(2006) Sheep mitochondrial DNA variation in European, Caucasian,
Genetic Evidence for Sheep Domestication in India
PLOS ONE | www.plosone.org 10 November 2013 | Volume 8 | Issue 11 | e77858
and Central Asian areas. Mol Biol Evol 23: 1776-1783. doi:10.1093/molbev/msl043. PubMed: 16782761.
19. Meadows JR, Cemal I, Karaca O, Gootwine E, Kijas JW (2007) Fiveovine mitochondrial lineages identified from sheep breeds of the nearEast. Genetics 175: 1371-1379. PubMed: 17194773.
20. Groeneveld LF, Lenstra JA, Eding H, Toro MA, Scherf B et al. (2010)Genetic diversity in farm animals--a review. Anim Genet 41 Suppl 1:6-31. doi:10.1111/j.1365-2052.2010.02038.x. PubMed: 20500753.
21. Kijas JW, Lenstra JA, Hayes B, Boitard S, Porto Neto LR et al. (2012)Genome-wide analysis of the world's sheep breeds reveals high levelsof historic mixture and strong recent selection. PLOS Biol 10:e1001258. PubMed: 22346734.
22. Pardeshi VC, Kadoo NY, Sainani MN, Meadows JR, Kijas JW et al.(2007) Mitochondrial haplotypes reveal a strong genetic structure forthree Indian sheep breeds. Anim Genet 38: 460-466. doi:10.1111/j.1365-2052.2007.01636.x. PubMed: 17725686.
23. Chen S, Lin BZ, Baig M, Mitra B, Lopes RJ et al. (2010) Zebu cattle arean exclusive legacy of the South Asia neolithic. Mol Biol Evol 27: 1-6.doi:10.1093/molbev/msp213. PubMed: 19770222.
24. Acharya R (1982) Sheep and goat breeds of India. Food andAgriculture Organization of the United Nations.
25. Sambrook J, Russell DW (2001) Molecular cloning: a laboratorymanual: CSHL press.
26. Hiendleder S, Lewalski H, Wassmuth R, Janke A (1998) The completemitochondrial DNA sequence of the domestic sheep (Ovis aries) andcomparison with the other major ovine haplotype. J Mol Evol 47:441-448. doi:10.1007/PL00006401. PubMed: 9767689.
27. Pereira F, Davis SJ, Pereira L, McEvoy B, Bradley DG et al. (2006)Genetic signatures of a Mediterranean influence in Iberian Peninsulasheep husbandry. Mol Biol Evol 23: 1420-1426. doi:10.1093/molbev/msl007. PubMed: 16672283.
28. Wang X, Ma YH, Chen H, Guan WJ (2007) Genetic and phylogeneticstudies of Chinese native sheep breeds (Ovis aries) based on mtDNAD-loop sequences. Small Rumin Res 72: 232-236. doi:10.1016/j.smallrumres.2006.10.016.
29. Meadows JR, Li K, Kantanen J, Tapio M, Sipos W et al. (2005)Mitochondrial sequence reveals high levels of gene flow betweenbreeds of domestic sheep from Asia and Europe. J Hered 96: 494-501.doi:10.1093/jhered/esi100. PubMed: 16135704.
30. Thompson JD, Gibson TJ, Plewniak F, Jeanmougin F, Higgins DG(1997) The CLUSTAL_X windows interface: flexible strategies formultiple sequence alignment aided by quality analysis tools. NucleicAcids Res 25: 4876-4882. doi:10.1093/nar/25.24.4876. PubMed:9396791.
31. Tamura K, Peterson D, Peterson N, Stecher G, Nei M et al. (2011)MEGA5: molecular evolutionary genetics analysis using maximumlikelihood, evolutionary distance, and maximum parsimony methods.Mol Biol Evol 28: 2731-2739. doi:10.1093/molbev/msr121. PubMed:21546353.
32. Tamura K, Nei M (1993) Estimation of the number of nucleotidesubstitutions in the control region of mitochondrial DNA in humans andchimpanzees. Mol Biol Evol 10: 512-526. PubMed: 8336541.
33. Hasegawa M, Kishino H, Yano T (1985) Dating of the human-apesplitting by a molecular clock of mitochondrial DNA. J Mol Evol 22:160-174. doi:10.1007/BF02101694. PubMed: 3934395.
34. Bandelt HJ, Forster P, Sykes BC, Richards MB (1995) Mitochondrialportraits of human populations using median networks. Genetics 141:743-753. PubMed: 8647407.
35. Forster P, Torroni A, Renfrew C, Röhl A (2001) Phylogenetic starcontraction applied to Asian and Papuan mtDNA evolution. Mol BiolEvol 18: 1864-1881. doi:10.1093/oxfordjournals.molbev.a003728.PubMed: 11557793.
36. Polzin T, Vahdati Daneshmand S (2003) On Steiner trees andminimum spanning trees in hypergraphs. Oper Res Lett 31: 12 - 20.doi:10.1016/S0167-6377(02)00185-2.
37. Fu YX (1997) Statistical tests of neutrality of mutations againstpopulation growth, hitchhiking and background selection. Genetics 147:915-925. PubMed: 9335623.
38. Schneider S, Excoffier L (1999) Estimation of past demographicparameters from the distribution of pairwise differences when themutation rates vary among sites: application to human mitochondrialDNA. Genetics 152: 1079-1089. PubMed: 10388826.
39. Excoffier L, Lischer HE (2010) Arlequin suite ver 3.5: a new series ofprograms to perform population genetics analyses under Linux andWindows. Mol Ecol Resour 10: 564-567. doi:10.1111/j.1755-0998.2010.02847.x. PubMed: 21565059.
40. Rogers AR, Harpending H (1992) Population growth makes waves inthe distribution of pairwise genetic differences. Mol Biol Evol 9:552-569. PubMed: 1316531.
41. Meadows JR, Hiendleder S, Kijas JW (2011) Haplogroup relationshipsbetween domestic and wild sheep resolved using a mitogenome panel.Heredity (Edinb) 106: 700-706. doi:10.1038/hdy.2010.122. PubMed:20940734.
42. Troy CS, MacHugh DE, Bailey JF, Magee DA, Loftus RT et al. (2001)Genetic evidence for Near-Eastern origins of European cattle. Nature410: 1088-1091. doi:10.1038/35074088. PubMed: 11323670.
43. Beja-Pereira A, England PR, Ferrand N, Jordan S, Bakhiet AO et al.(2004) African origins of the domestic donkey. Science 304: 1781. doi:10.1126/science.1096008. PubMed: 15205528.
44. Templeton AR, Routman E, Phillips CA (1995) Separating populationstructure from population history: a cladistic analysis of thegeographical distribution of mitochondrial DNA haplotypes in the tigersalamander, Ambystoma tigrinum. Genetics 140: 767-782. PubMed:7498753.
45. McIntosh J (2008) The ancient Indus valley: new perspectives. ABC-CLIO Inc.
46. Babar ME, Hussain T, Imran M, Nagarajan M, Kumar S (2012)Mitochondrial DNA diversity patterns in Pakistani buffalo. Anim Genet43: 315-317. doi:10.1111/j.1365-2052.2011.02250.x. PubMed:22486503.
Genetic Evidence for Sheep Domestication in India
PLOS ONE | www.plosone.org 11 November 2013 | Volume 8 | Issue 11 | e77858