Embed Size (px)
Citation preview

July 2, 2019
Dollarama To Acquire 50.1% of Dollarcity, Establishing Second Growth Platform

Cautionary statement
Forward-Looking Statements Certain statements in this presentation, and in any discussion during or following this presentation, about current and future plans, expectations and intentions, results, levels of activity, performance, goals or achievements or any other future events or developments constitute forward-looking statements. The words “may”, “will”, “would”, “should”, “could”, “expects”, “plans”, “intends”, “trends”, “indications”, “anticipates”, “believes”, “estimates”, “predicts”, “likely” or “potential” or the negative or other variations of these words or other comparable words or phrases, are intended to identify forward-looking statements. Forward-looking statements include, without limitation, statements relating to the following: (i) the financial performance of Dollarcity, (ii) the accretive impact of the Dollarcity transaction on the Corporation’s earnings, (iii) the estimated purchase price to be paid by the Corporation for a 50.1% interest in Dollarcity, (iv) the operational integration of Dollarcity, (v) the count and geographic distribution of Dollarcity’s new store openings, (vi) demographic and market trends in Latin America, and (vii) growth opportunities derived from the Dollarcity transaction. Forward-looking statements are based on information currently available to us and on estimates and assumptions made by us regarding, among other things, general economic conditions and the competitive environment within the retail industry in Canada and in Latin America, in light of our experience and perception of historical trends, current conditions and expected future developments, as well as other factors that we believe are appropriate and reasonable in the circumstances, but there can be no assurance that such estimates and assumptions will prove to be correct. Many factors could cause actual results, level of activity, performance or achievements or future events or developments to differ materially from those expressed or implied by the forward-looking statements, including factors similar to those discussed in greater detail in the “Risks and Uncertainties” section of the Corporation’s management’s discussion and analysis and in the “Risk Factors” section of the Corporation’s annual information form for the Corporation’s fiscal year ended February 3, 2019, both available on SEDAR at www.sedar.com, including the following: future increases in operating costs, future increases in merchandise costs, inability to sustain assortment and replenishment of merchandise, increase in the cost or a disruption in the flow of imported goods, failure to maintain brand image and reputation, disruption of distribution infrastructure, inventory shrinkage, inability to increase warehouse and distribution centre capacity in a timely manner, market acceptance of private brands, failure to protect trademarks and other proprietary rights, foreign exchange rate fluctuations, interest rate risk associated with variable rate indebtedness, competition in the retail industry, general economic conditions, departure of senior executives, failure to attract and retain quality employees, disruption in information technology systems, inability to protect systems against cyber attacks, unsuccessful execution of the growth strategy, natural disasters, climate change and geopolitical events, unexpected costs associated with current insurance programs, product liability claims and product recalls, litigation, regulatory and environmental compliance. These factors are not intended to represent a complete list of the factors that could affect the Corporation or Dollarcity; however, they should be considered carefully. The purpose of the forward-looking statements is to provide the reader with a description of management’s expectations regarding the Corporation’s and Dollarcity’s financial performance and to assist the reader in understanding certain key elements of the Corporation’s and Dollarcity’s current objectives, strategic priorities, expectations and plans and may not be appropriate for other purposes; readers should not place undue reliance on forward-looking statements made herein. Furthermore, unless otherwise stated, the forward-looking statements contained in this presentation are made as at the date of those statements and we have no intention and undertake no obligation to update or revise any forward-looking statements, whether as a result of new information, future events or otherwise, except as required by law. The financial outlook for Dollarcity’s calendar year 2019 and the financial outlook for the Corporation’s fiscal years ending February 2, 2020 and January 31, 2021 referred to in this presentation are forward-looking statements and are based on financial projections provided by Dollarcity’s management and are subject to the risks and uncertainties identified above. The purpose of such financial outlook is to provide an estimated purchase price range for the Dollarcity transaction and an estimate of the accretive impact of the Dollarcity transaction on the Corporation’s earnings, and may not be appropriate for other purposes. All of the forward-looking statements contained in this presentation are expressly qualified by this cautionary statement.
2

Cautionary statement (cont’d)
Non-GAAP Financial Measures The Corporation reports its financial results in accordance with generally accepted accounting principles in Canada (GAAP) as set out in the CPA Canada Handbook - Accounting under Part I, which incorporates International Financial Reporting Standards (IFRS), as issued by the International Accounting Standards Board (IASB). Dollarcity reports its financial results in accordance with International Financial Reporting Standards for Small Medium Enterprises (IFRS for SEMs), which do not include IFRS 16, Leases. However, this presentation also refers to EBITDA, a non-GAAP measure which represents operating income plus depreciation and amortization. EBITDA does not have a standardized meaning prescribed by GAAP and is therefore unlikely to be comparable to similar measures presented by other companies. Non-GAAP measures, including EBITDA, provide investors with a supplemental measure of operating performance and financial position and thus highlight trends in the core business that may not otherwise be apparent when relying solely on GAAP measures. These measures are used to bridge differences between external reporting under GAAP and external reporting that is tailored to the retail industry and should not be considered in isolation or as a substitute for financial performance measures calculated in accordance with GAAP. Management uses non-GAAP measures in order to facilitate operating and financial performance comparisons from period to period, to prepare annual budgets, to assess the Corporation’s ability to meet future debt service, capital expenditure and working capital requirements, and to evaluate senior management’s performance. We believe that securities analysts, investors and other interested parties frequently use non-GAAP measures in the evaluation of issuers. Refer to the appropriate footnote of this presentation for a reconciliation of EBITDA, the non-GAAP measure used and presented in this presentation, to operating income, the most directly comparable GAAP measure.
External Information Where this presentation quotes or refers to any information or statistics from any external third-party source, it should not be interpreted that the Corporation has adopted or endorsed such information, reports, estimates, calculations or statistics as being accurate. We advise you that some of the information presented herein is based on or derived from statements, reports, calculations and estimates by third parties and has not been independently verified by or on behalf of the Corporation, and that no representation or warranty, express or implied, is made as to, and no reliance should be placed on, the fairness, accuracy, completeness or correctness of this information or any other information or opinions contained herein, for any purpose whatsoever.
Important Notice This presentation does not constitute an offer to sell or a solicitation of an offer to buy any securities. This presentation is not, and is not intended to be, an advertisement, prospectus or offering memorandum, and is made available on the express understanding that it does not contain all information that may be required to evaluate, and will not be used by readers in connection with, the purchase of or investment in any securities of any entity. This presentation accordingly should not be treated as giving investment advice and is not intended to form the basis of any investment decision. It does not, and is not intended to, constitute or form part of, and should not be construed as, any recommendation or commitment by the Corporation or any of its directors, officers, employees, shareholders, agents, affiliates, advisors or any other person, or as an offer or invitation for the sale or purchase of, or a solicitation of an offer to purchase, subscribe for or otherwise acquire, any securities of any entity, nor shall it or any part of it be relied upon in connection with or act as any inducement to enter into any contract or commitment or investment decision whatsoever. Readers should not construe the contents of this presentation as legal, tax, regulatory, financial or accounting advice and are urged to consult with their own advisers in relation to such matters.
3

Transaction overview
Dollarama (DOL) to acquire 50.1% interest in Dollarcity 20181 sales of US$236M, EBITDA2 of US$36.6M (16% EBITDA margin) Estimated 2019 sales of ~US$333M and EBITDA of ~US$50M3 Closing expected in August 2019
Estimated total purchase price of US$85-95M Equity value to be calculated as 5x EBITDA of audited financial statements
for the 12 months ending June 30, 2020, minus net debt +/- other customary adjustments4 Payment of US$40M upon closing; balance to be paid in Q3 F2021
as a result of acceleration of call option Purchase to be funded by available free cash flows Investment to be reported based on equity method
Immediately accretive to DOL EPS +CA$0.02-0.03 per share in F20205 +CA$0.05-0.07 per share in F2021
4
(1) Dollarcity full-year financial results are for the 12-month period ended December 31, 2018. (2) EBITDA is a non-GAAP measure. A reconciliation of EBITDA to the most directly
comparable GAAP measure, operating income, is included below.
(3) Based on financial projections provided by Dollarcity management. This forward-looking financial information is disclosed for the purposes of providing an estimated purchase price range.
(4) Purchase price formula reflects financial terms agreed upon in 2013. (5) F2020 EPS will include approximately 5 months of Dollarcity earnings.

Transaction rationale
Second growth platform
Favourable demographics and economic fundamentals in Latin America (LATAM)
Attractive retail markets with growing presence of global retailers and brands
Significant growth opportunity in value retail segment
Target of 600 Dollarcity stores in El Salvador, Guatemala and Colombia by 2029
Dollarcity is expected to have an immediately accretive impact on DOL earnings
Proven business model
Commercial relationship between DOL and Dollarcity since 2013
Success in creating ‘localized’ DOL to deliver compelling value to LATAM consumers
Dollarcity has surpassed all contractual KPIs to date: new store openings, sales, gross margin and EBITDA
No integration required; business as usual following transaction
Strong local partners
A leading business group in Central America with experience in aviation, banking, telecom, food processing and agriculture, real estate and retail
LATAM market knowledge, expertise and relationships
Involvement as long-term investors and operators; will continue to lead the business
5

Dollarcity Overview

Track record of rapid growth
2009 2013 2014 2015 2016 2017 2018
Dollarcity founded in El Salvador
Licensing and services agreement concluded with DOL First 10 new concept stores opened in El Salvador
2019
25+ stores in El Salvador
Opening of first new concept store in Guatemala 40+ stores in Guatemala and El Salvador
Opening of first new concept store in Colombia 70+ stores in three countries
Opening of 100th store 28 stores in Colombia by year end SAP implemented
Replenishment system implemented 150+ stores in three countries, including 65+ in Colombia
DOL acquires 50.1% interest 180+ stores in three countries
7

Dollarcity today
Guatemala 54 Dollarcity stores Local warehouse
El Salvador 44 Dollarcity stores Administrative office
in San Salvador International warehouse Local warehouse
Colombia 82 Dollarcity stores Local warehouse
Dollarcity initially tested the Dollarama concept in El Salvador and Guatemala, and has successfully built an established presence in these two markets
Since 2017, network expansion has been mainly focused on Colombia, a compelling retail market with significant growth opportunities
Dollarcity head office in Panama City, a recognized strategic hub for serving LATAM markets
Panama Head office in
Panama City
180 Dollarcity
stores
8

(As at respective year ends) Dec. 31, 20181 Feb. 3, 2019
NUMBER OF STORES 169 1,225
SALES CA$309 million (US$236 million) CA$3,549 million
Accelerated store network
DOLLARCITY STORE NETWORK GROWTH (Number of stores)
10 28 38 40 43 44
13 30 39
52 54
3 28
74 82
2013 2014 2015 2016 2017 2018 Q1 2019 El Salvador Guatemala Colombia
26
41
71 107
169 180
18x Store Network Growth
9
Strong execution in store network growth
Dollarcity sales performance comparable to DOL
(1) US$ amounts converted to CA$ using a USD/CAD average exchange rate of 1.31 for the year ended December 31, 2018.

San Salvador, El Salvador
10

Guatemala City, Guatemala
11

Bogota, Colombia
12

(As at respective year ends) Dec. 31, 20183 Feb. 3, 2019
PRICE POINT RANGE4
US$0.69-$3.00 or equivalents in local currencies
CA$0.82-$4.00
NEW STORE INVESTMENT
CA$786,000 (US$600,000)
CA$700,000
A ‘localized’ Dollarama
13 (1) Merchandise mix categories may differ slightly between DOL and Dollarcity. (2) For DOL, domestic refers to merchandise purchased in North America. For Dollarcity, domestic refers to merchandise purchased in the countries where the company operates stores. (3) US$ amounts converted to CA$ using a USD/CAD average exchange rate of 1.31 for the year ended December 31, 2018. (4) Dollarcity price points include value-added tax.
Successful in adapting DOL business model to LATAM markets and consumers
Rapid new store payback period
MERCHANDISE MIX1 (based on annual retail value)
SOURCING MIX (based on annual retail value)
General Merchandise Consumables Seasonal
Domestic2 Imported
35%
18%
47%
41%
16%
43%
39%
61% 55% 45%

Growth Opportunity

An attractive market with compelling growth potential
Source: see Appendix, slides 24-27, for more information
LATAM is second largest emerging market Dynamic growth rates compared to developed regions Young and increasingly urban population with similar spending habits as North America Showed resiliency through the 2008-2009 global financial crisis and 2016 slowdown Attractive market for global retailers Strong presence and growth of global retailers and brands, with nearly 1/3 of retail revenue in
LATAM region coming from foreign operations Of the world’s 250 top retailers, those in LATAM had the highest year-over-year revenue
growth and profit margins in FY2017
Value retail, a rapidly growing segment Presence of discount retailers in LATAM continues to increase, outperforming other retail
channels Segment has been widely accepted, increasing retail industry share over last five years

Guatemala Opportunistic
growth
El Salvador Opportunistic
growth
Colombia Primary focus of store
network growth
Panama Head office in
Panama City
Target of 600
Dollarcity stores
Dollarcity growth plan to 2029
Colombia represents the largest growth opportunity within deal countries1
Target of 600 stores in three countries by 2029 • Majority of store network growth
will be focused in Colombia • Opportunistic growth in
Guatemala and El Salvador
Target of 40-50 net new stores in 2019, primarily in Colombia • 11 net new stores opened
in Q1-19
(1) Dollarcity 2013 agreement covers the following territories or ‘deal countries’: Colombia, Costa Rica, Ecuador, El Salvador, Guatemala, Honduras, Nicaragua, Panama and Peru.
16

Operational Structure and Governance

Operational structure and governance
DOLLARAMA BOARD OF DIRECTORS
DOLLARCITY MANAGEMENT TEAM
Chief Executive Officer Executive Vice-President Director of Finance and Treasury Director of Procurement and Sr. Buyer
Director of Store Operations Director of Inbound Logistics, Imports and Compliance Director of Legal Director of Projects
Certain strategic and operational decisions subject to 100% stockholder approval. These include, but are not limited to, decisions related to capital structure, nature of the business, M&A activities, executive officer appointments, approval of annual budget and business plan, and entry into new countries.
Three (3) representatives appointed by Dollarama
Two (2) representatives appointed by Dollarcity founding group
DOLLARCITY BOARD OF DIRECTORS
DOLLARCITY STOCKHOLDERS
DOLLARAMA 50.1%
18
FOUNDING GROUP 49.9%

Stockholder options
19
DOL (50.1%) No remaining call options Ability to postpone the exercise of Dollarcity founding group put right in certain situations Ability to purchase all remaining shares not yet held by DOL if the exercise of the put
results in Dollarcity founding group holding less than a specified ownership threshold
Dollarcity founding group (49.9%) Ordinary course put rights commencing in 2022, subject to transaction size thresholds,
required ownership thresholds for designated person and freeze periods, among other conditions and restrictions
Event-driven put rights in case of sale transaction, DOL change of control or a designated person event
Exercise of any put right triggers fair market valuation to establish applicable share price
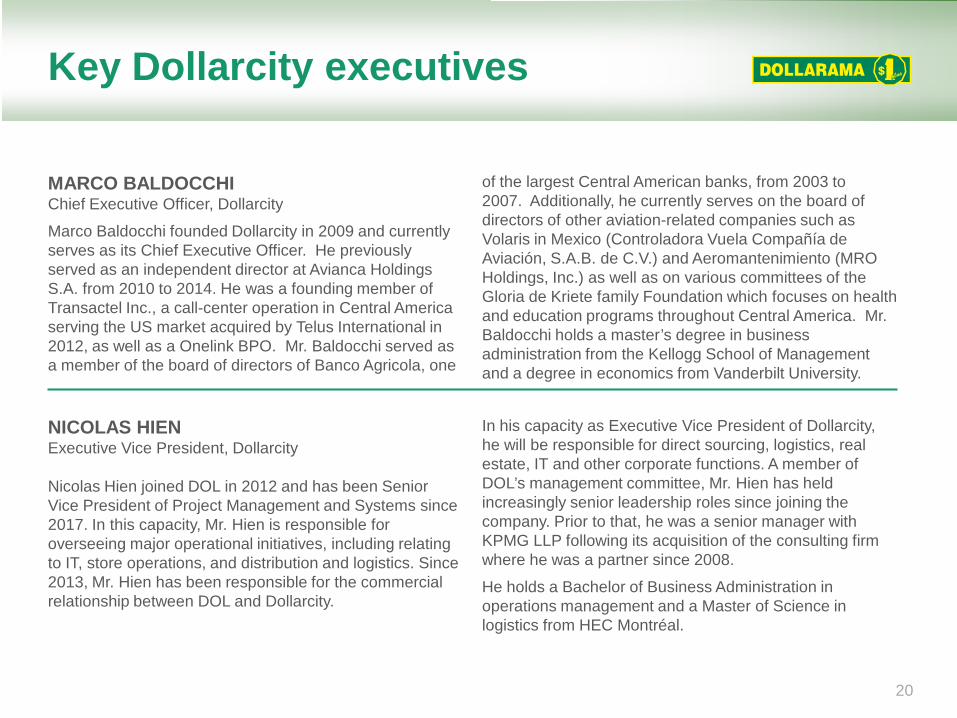
Key Dollarcity executives
MARCO BALDOCCHI Chief Executive Officer, Dollarcity
Marco Baldocchi founded Dollarcity in 2009 and currently serves as its Chief Executive Officer. He previously served as an independent director at Avianca Holdings S.A. from 2010 to 2014. He was a founding member of Transactel Inc., a call-center operation in Central America serving the US market acquired by Telus International in 2012, as well as a Onelink BPO. Mr. Baldocchi served as a member of the board of directors of Banco Agricola, one
of the largest Central American banks, from 2003 to 2007. Additionally, he currently serves on the board of directors of other aviation-related companies such as Volaris in Mexico (Controladora Vuela Compañía de Aviación, S.A.B. de C.V.) and Aeromantenimiento (MRO Holdings, Inc.) as well as on various committees of the Gloria de Kriete family Foundation which focuses on health and education programs throughout Central America. Mr. Baldocchi holds a master’s degree in business administration from the Kellogg School of Management and a degree in economics from Vanderbilt University.
NICOLAS HIEN Executive Vice President, Dollarcity Nicolas Hien joined DOL in 2012 and has been Senior Vice President of Project Management and Systems since 2017. In this capacity, Mr. Hien is responsible for overseeing major operational initiatives, including relating to IT, store operations, and distribution and logistics. Since 2013, Mr. Hien has been responsible for the commercial relationship between DOL and Dollarcity.
In his capacity as Executive Vice President of Dollarcity, he will be responsible for direct sourcing, logistics, real estate, IT and other corporate functions. A member of DOL’s management committee, Mr. Hien has held increasingly senior leadership roles since joining the company. Prior to that, he was a senior manager with KPMG LLP following its acquisition of the consulting firm where he was a partner since 2008.
He holds a Bachelor of Business Administration in operations management and a Master of Science in logistics from HEC Montréal.
20

Risk management
Local partner with strong reputation and business acumen Successful track record in other industries Remains heavily invested in Dollarcity future Thorough due diligence process throughout term of relationship Supported by comprehensive third-party
analysis and perspectives
Six years of on-the-ground experience Good understanding of LATAM markets and
retail landscape
Successful in adapting DOL business model in three countries Strong growth rate despite economic
slowdown in 2016 Solid execution and compelling growth
ahead
Political and Social
Economic and Financial
Competitive Landscape Operational Legal and
Regulatory
21

Priorities: Disciplined execution of DOL growth plan
Execute LATAM platform growth plan Open 40-50 net new Dollarcity stores
in 2019, primarily in Colombia Target of 600 stores in three
countries by 2029 Continue implementation of
various operational initiatives Create value for all stakeholders
22
Execute Canadian platform growth plan Open 60-70 net new Dollarama stores in FY2020 Target of 1,700 stores in Canada by 2027

Appendix

A growing market with strong fundamentals
REAL GDP GROWTH 2005-2022 (Annual % change)
LATAM RETAIL GROWTH vs. REAL GDP GROWTH 2006-2023
(Annual % change)
Source: ©IMF, World Bank Group; CEPAL 24
-4
-2
0
2
4
6
8
2006
20
07
2008
20
09
2010
20
11
2012
20
13
2014
20
15
2016
20
17
2018
20
19
2020
20
21
2022
20
23
Retail growth in LATAM GDP growth: Advanced economies LATAM and the Caribbean World
Source: ©IMF 2019; Euromonitor
LATAM is second largest emerging market GDP of US$5.6 trillion, ~6% of world’s global GDP Population of ~644M people Dynamic growth rates compared to developed regions Young and increasingly urban population ~50% of population under age of 29 (~35.0% in
Canada) Women increasingly joining the workforce Spending habits similar to North America
Increased economic growth and stability Showed resiliency through the 2008-2009 global
financial crisis and 2016 slowdown Strong presence and growth of global retailers and
brands

Strong presence of global retailers and brands in LATAM with 27.1% of retail revenue in the region coming from foreign operations
Of the world’s 250 top retailers, those in LATAM had the highest year-over-year revenue growth and profit margins
An attractive market for global retailers
25
3,3%
5,1%
3,2%
2,2%
3,0%
4,2%
5,7%
9,8%
6,5%
7,1%
10,5
%
4,2%
2,3%
2,2%
2,1%
2,2%
3,7%
2,3%
5,0%
4,1%
3,4%
4,3%
3,6%
6,6%
0%
5%
10%
15%
Top 250 Africa/ Middle East
Asia Pacific
FY2012-2017 Retail revenue CAGR2
FY2017 Retail revenue growth
FY2017 Net profit margin
FY2017 ROA
1 Sales-weighted, currency-adjusted composites 2 Compound annual growth rate
Europe Latin America North America
RETAIL REVENUE GROWTH AND PROFITABILITY BY REGION1, FY2017
Source: Global Powers of Retailing 2019, Deloitte, Euromonitor Results reflect Top 250 companies headquartered in each region/country

A healthy appetite for value retail
REAL GDP GROWTH 2005-2022 (Annual % change)
26
0
1 000
2 000
3 000
4 000
5 000
2013 2014 2015 2016 2017 2018
DISCOUNTERS MARKET SIZE IN SELECTED COUNTRIES
($M, current values)
Colombia Panama El Salvador Guatemala
0,8%
0,6%
5,0%
5,5%
3,5%
0,6%
7,4%
5,7%
0,0% 1,0% 2,0% 3,0% 4,0% 5,0% 6,0% 7,0% 8,0%
Colombia Panama El Salvador Guatemala
DISCOUNTERS MKT SIZE / TOTAL RETAIL MKT SIZE (%)
2013 2018 Source: Euromonitor; Deloitte (1) Colombia, Panama, Guatemala, El Salvador
Value retail, a rapidly growing segment Discount retailers in countries of interest1
showed a 25.2% CAGR from 2013-2018 in current US$ terms
Segment has been widely accepted in these countries, increasing retail industry share on average by ~105 bps from 2013-2018
Growth driven by store openings Appealing value proposition for customers Sound business model for both low- and high-
income consumers Presence of discount retailers continues to
increase, outperforming other retail channels

Select LATAM country data vs. Canada
27
Country Population 2018 (M) Nominal GDP 2018 (US$ B) Average GDP Growth in Last 5 Years (%)1
El Salvador 6.6 26 2.4% Guatemala 17.3 79 3.3% Colombia 49.8 333 2.3% Panama 4.2 65 5.0%
Total 77.9 503 2.7%
Canada 37.0 1,711 1.6%
Source: ©IMF (1) Total GDP growth in last 5 years is CAGR of real GDP in national currency from 2014-2018.
0%
2%
4%
6%
8%
2018 2019 2020 2021 2022 2023
El Salvador Guatemala Colombia Panama Canada
REAL GDP GROWTH 2018-2023
REAL GDP GROWTH 2018-2023

Recap: DOL and Dollarcity Relationship
2013 TRANSACTION
2016 AGREEMENT AMENDMENT
2019 CALL OPTION ACCELERATION
In February 2013, DOL announced that it had entered into an agreement, through Dollarama International Inc., a wholly-owned subsidiary, to share its business expertise and provide sourcing services to Dollarcity, a Central American dollar store chain looking to expand its activities in Central America, Colombia, Peru, and Ecuador (the “Region”). At the time, Dollarcity operated 15 locations in the Region.
As per the terms of the agreement, DOL agreed to share its business and operational expertise as well as leverage its direct sourcing and importing expertise to provide Dollarcity’s growing network of stores with a compelling product offering.
The agreement had a term of 8 years, did not require DOL to make any capital commitments, and contained key financial performance indicators at specified milestones through the term.
The agreement included an option for DOL to acquire a 50.1% interest in Dollarcity as of the beginning of the seventh year, based on an agreed upon purchase price formula.
In 2016, the agreement was amended to postpone the original call option window from Feb. 2019-Feb. 2021 to Feb. 2020-Feb. 2022 and the relevant financial period for the purposes of the purchase price calculation.
These amendments were made to provide the parties with more time to test the value retail concept in Colombia and to take into account the additional investments required to be made by Dollarcity to enter this market.
One year after entry, Dollarcity’s performance in Colombia already exceeded expectations and KPIs.
DOL negotiated with Dollarcity to advance the exercise of the call option to July 2, 2019.
The purchase price calculation formula as per the 2013 agreement and the relevant financial period as per the 2016 amendment were maintained.
The two-step payment process with an upfront payment at closing and a balance to be paid at later date is a direct result of the acceleration of the call option.
Calculation of equity value and total purchase price based on 5x EBITDA of audited financial statements for the 12-month period ending June 30, 2020, minus net debt +/- other customary adjustments. US$40M closing payment, and Balance to be paid in Q3 F2021.
Purchase to be funded by available free cash flows.
Acquisition subject to customary closing conditions, expected in August 2019
28

Thank you