Embed Size (px)
Citation preview
Doing Business in India:
2013 Country Commercial Guide for U.S. Companies
INTERNATIONAL COPYRIGHT, U.S. & FOREIGN COMMERCIAL SERVICE AND U.S. DEPARTM ENT OF STATE, 2010. ALL RIGHTS RESERV ED OUTSIDE OF THE UNITED STATES.
• Chapter 1: Doing Business In India • Chapter 2: Political and Economic Environment • Chapter 3: Selling U.S. Products and Services • Chapter 4: Leading Sectors for U.S. Export and Investment • Chapter 5: Trade Regulations, Customs and Standards • Chapter 6: Investment Climate • Chapter 7: Trade and Project Financing • Chapter 8: Business Travel • Chapter 9: Contacts, Market Research and Trade Events • Chapter 10: Guide to Our Services
Return to table of contents Chapter 1: Doing Business in India
• Market Overview • Market Challenges • Market Opportunities • Market Entry Strategy • Market Fact Sheet link
Market Overview Return to top The Republic of India is one of the w orld’s most politically-active democracies and the tenth largest economy. It is the third largest Asian economy after China and Japan. Among the major emerging markets of Brazil, Russia, India, China, and South Africa (BRICS), India ranks second in terms of economic grow th w ith the IMF forecasting a GDP grow th rate of 5.7 percent for 2013. It is the second most populous country in the w orld w ith approximately thirty percent of its 1.2 billion inhabitants residing in urban areas. India's industrialized economy encompasses diverse manufacturing sectors (steel production, oil and gas refining, auto, plastics, textiles) that contribute just 18 percent to a GDP that also includes traditional village farming, agriculture, and handicrafts. The services sector, especially information technology, continues to be the major source of economic grow th. Services account for more than half of India's GDP output and employ less than one third of its labor force, currently estimated to be 471 million w orkers, making it the second biggest w orkforce on the planet. India is the 18th largest export market for U.S. goods. Led by civil aircraft, engines, equipment and parts, U.S. goods exports to India in 2012 reached $22.3 billion, up 3.9 percent from the previous year. Corresponding U.S. imports from India, primarily diamonds, pharmaceuticals, and petrochemical products, totaled $40.5 billion, up 12.1 percent. Preliminary data show that U.S. exports of private commercial services (i.e., excluding military and government sales) to India stood at $12 billion in 2012 and U.S. imports w ere $17.7 billion. Total tw o w ay trade in goods and services is expected to top $100 billion in the near term. The stock of U.S. foreign direct investment (FDI) in India w as $24.7 billion in 2011 (latest data available), dow n from $24.8 billion in 2010. U.S. FDI in India is largely in the professional, scientif ic, and technical services, f inance/insurance services, and the information services sectors. The Indian economy has posted an average grow th rate of 6.9 percent since 1998, and according to the Government of India, reduced poverty by about 10 percentage points to 29.8 percent. Dependent on services exports and private domestic consumption, India’s 2012 GDP grew approximately 4.5 percent, reaching $1.945 trillion w ith a GDP per capita of $1,592. The World Bank estimates India’s 2013-14 GDP grow th at 6.1 percent. Economists estimate that creating jobs for millions of its citizens in order to alleviate poverty in India requires economic grow th of 7 to 8 percent per year through 2020, the year India is expected to overtake China as the most populous nation on earth. In 2011, economic grow th in India began a quarter-on-quarter deceleration from 8.5 percent GDP grow th in 2010 to w hat many believe w as the bottom at 4.5 percent GDP at the end of 2012. Supply side constraints, policy paralysis, and the government's inability to roll back the 2008 f iscal stimulus programs that contributed to the surge in the f iscal deficit contributed to the dow nturn. How ever, experts speculate that the Indian economy w ill grow faster in 2013 compared to 2012 due to business and investor friendly reform measures announced recently by the Indian government. Under the threat of a stalled Indian investment cycle, a possible credit rating dow ngrade over a burgeoning f iscal deficit, and a rising current account deficit, the government relaxed foreign investment rules in sectors such as retail and civil aviation and set up a ministerial panel to fast-track implementation of large industrial and infrastructure projects. Political fallout over the decision to implement FDI in the multi-brand retail sector resulted in the loss of political allies in the parliament. Nevertheless, Prime Minister Manmohan Singh expressed confidence that the government w ill pass long pending reforms needed to reverse the country's w orst economic slow dow n in recent years. Restrictions on single-brand retail w ere relaxed; the Government of India on a case by case basis has been know n to adjust the requirement to source a proportion of inventory from domestic industry, a factor w hich discouraged foreign investment. Opening up the domestic aviation sector to foreign investment should help to ease indebtedness of the industry (estimated at $20 billion in 2011/12), and in turn should ease some of the pressure on public sector banks, w hich have a large degree of exposure to domestic airlines. The government also raised the FDI cap in broadcasting services (to 74 percent, from 49 percent previously). The Indian government also approved the sale of stakes in state-ow ned companies in the aluminum, oil and copper sectors.
The Government of India continues to consider law s that w ould allow foreign investment in the pension sector (49 percent) and raise the FDI cap on the insurance sector (to 49 percent, from 26 percent currently). With the 2011 introduction of a new land acquisition bill, the government began the process of reforming and modernizing hundred year old land acquisition rules. It is also taking an across the board review of FDI caps that can be removed or relaxed w ithout legislative action. The reform efforts w ere w elcomed by business leaders as a signal that India is “open for business.” But much remains to be done. The 2012 nominal exchange rate w as 53.38 Indian rupees per 1 USD. According to the 2013 Indian Government Economic Survey, unemployment reached 6.6 percent in 2010, how ever, as much as 90 percent of total employment is in the informal economy. Minimum w ages in India vary from state to state and range from $130 per month for unskilled w orkers to $160 per month for skilled w orkers. Among the professional ranks rapidly rising salaries w ith generous perks (cars, housing allow ances) have generated high turnover. An increased security presence in urban areas combined w ith conservative monetary and f iscal policies have allow ed India to become one of the more stable economies in the region and thereby lessened the impact of the ongoing global economic dow nturn. Despite persistently high inflation of 7.5 percent in 2012 for w holesale prices, India’s grow ing middle class and its relatively stable political environment compared to its neighbors makes it an attractive destination for U.S. companies. Principal U.S. interests run the gamut of industry sectors. Major U.S. companies include: AECOM, Bank of America, Bell Helicopter, Black and Veatch, Coca-Cola, DuPont, Federal Express, General Electric, General Motors, Jacobs Engineering, KFC, Lockheed Martin, McDonalds, Microsoft, Kimberly Clark, PepsiCo, Raytheon, Starbucks, and United Airlines, among many others. Recent FDI reflects w ell-know n hotel brands such as Marriott, Hilton and Hyatt and major engineering f irms are pursuing huge infrastructure projects such as the Delhi-Mumbai Industrial Corridor and the Chennai-Bangalore highw ay project. India’s economy is gradually being transformed by India’s highly entrepreneurial and rapidly globalizing private sector. Notw ithstanding a recent slow dow n in domestic investment, Indian f irms are investing in infrastructure projects, grow ing their advanced manufacturing capabilities, and investing in new volume-based business models that tap into rising incomes and consumption in tow ns and rural economies across the country. Increasingly they are also investing abroad, including into the United States. In terms of long-range economic forecasts, major consulting f irms project that more than 400 million people, a full 40 percent of the population, w ill enter India’s middle class over the next 15 to 20 years. Given the expected dramatic increase in the size of the Indian middle class, the critical role played by private consumption is likely to endure, notw ithstanding the Government of India’s efforts to become more export-oriented. This “demographic dividend” of India’s grow ing under-35 population is anticipated to be one of the key drivers of long-term grow th, provided suff icient employment can be generated. India w ould like to be view ed as a major economy and w orld pow er, but it is diff icult to overlook that India is home to the largest number of poor people in the w orld, w ith an estimated 350 million people living below the poverty line (living on less than $1.25 a day) according to the CIA World Factbook. Market Challenges Return to top Infrastructure Problems w ith the country's roads, railroads, ports, airports, education, pow er grid, and telecommunications are signif icant obstacles to India’s economy grow ing to its full potential. India’s ongoing urbanization, together w ith rising incomes, have resulted in a heightened need for improved infrastructure, both to deliver public services and to sustain economic grow th. India is seeking to invest $1 trillion in its infrastructure during the 12th Five-Year Plan (2012-2017) and is looking for private sector participation to fund half of this massive expansion largely through its home-grow n Public-Private Partnership (PPP) model. U.S. companies have been successful in certain areas of India’s infrastructure development, but competition from other countries is becoming stif fer, and U.S. industry’s market share in India in this sector has been declining. High Tariffs and Protectionist Policies Tariffs Import duties continue to be very high, and exporters and investors are faced w ith non-transparent and often unpredictable regulatory and tarif f regimes. Most U.S. services are still strictly excluded from the market. The World Bank ranks India among the w orld’s more diff icult business climates – 132 out of 183 economies in 2012 (improved from 139/182 in 2011), and next to last in enforcing contracts.

Local Content Requirements The Indian government is pursuing local content requirements in specif ic areas including Information and Communications Technologies (ICT), electronics, and solar energy to spur an increase in the domestic manufacturing sector’s contribution to GDP. These policies negatively affect U.S. exporters. With regard to ICT, w hich has been a particular area of concern this past year, India recently drafted a policy expressing preference for domestically manufactured telecommunications and ICT products in government procurement, citing security concerns. In addition, all ministries must notify the Department of Telecommunications of all telecom and ICT products that have security implications. At the time of drafting this report, the Indian government announced that all imported ICT equipment w ill require mandatory licensing and certif ication from accredited labs in India from September 2013 onw ards, creating yet another hurdle for U.S. exporters due to the limited number of such labs. This preferential market access (PMA) policy could result in hindering imports of innovative technologies, forcing the government to choose from a limited pool of approved locally-manufactured products for its ICT procurement needs and, alarmingly, could impact procurements by private telecom companies as w ell. Of similar concern is a new ly evolving cloud computing policy, w hich could mandate that all government data remain in India, effectively denying market access to any foreign cloud storage companies. Weakening of the Patent Regime for Pharmaceutical Industry 2012 w itnessed w eakening of the intellectual property environment in India for big pharmaceutical companies holding patents on innovative medicines. In tw o landmark cases, the Indian government issued unprecedented compulsory licenses to Indian generic pharmaceutical f irms for tw o cancer drugs of a European and a U.S. multinational. Furthermore, the Indian Supreme Court recently rejected the grant of a patent to a multinational pharma company for an innovative cancer drug that is patentable elsew here, including in the United States. By raising the bar for patents and issuing compulsory licenses, India encourages its generic manufacturers to produce and export cheap generics at the expense of the big pharma w hen patented drugs are deemed unaffordable. In the face of such obstacles, U.S. companies are reevaluating their business models in India. Powers of States Pow er and decision-making is decentralized in India, therefore investors should be prepared to face varying business and economic conditions across India’s 28 states and 7 union territories. There are differences at the state level in political leadership, quality of governance, regulations, taxation, labor relations, and education levels. Gujarat is an example of a state w ith positive business climate, having attracted signif icant foreign investment. Jharkand or Uttar Pradesh are on the other side of the spectrum and have minimal foreign business activities. To do business in India successfully an investor should factor differences in approach by different states in its national business strategy. Poor infrastructure, high tarif fs, protectionist policies, corruption, bureaucratic ineff iciency, and a w eak intellectual property regime present the biggest obstacles to foreign investment and grow th. Nonetheless, India’s infrastructure requirements also present trade and investment opportunities for U.S. companies. Similarly, w hile recent modif ications in India’s defense procurement procedure w ill give priority to domestic public and private sector f irms for major military procurements, thus reducing the country’s dependence on imports from foreign vendors as a last option, major U.S. defense f irms continue to have success in the Indian market. Indeed, many large U.S. multinationals are convinced of India’s long-term potential and are expanding and deepening their market penetration. U.S. f irms w ith advanced and niche-market products and services are entering the market for the f irst time, or are replacing legacy distributors appointed in the slow -grow th past w ith more capable and aggressive representatives. Logistics companies are discovering India as a base for distribution throughout Asia, Africa, and the Middle East. Finally, many smaller American f irms have begun to view India as a top anchor market for their products and services as w ell. Many businesses f ind they cannot afford to ignore this budding market of 1.2 billion people. Market Opportunities Return to top Best prospect sectors and business opportunities. These sectors present opportunities for U.S. entrants to the Indian market on the basis of estimated Indian imports from the U.S. for 2013:
• Defense and Civil Aviation
• Education Services • Environment and Water • Franchising • Healthcare and Medical Equipment • Transportation Infrastructure (Roads, Ports and Railw ays) • Mining and Mineral Processing Equipment • Plastics • Pow er and Renew able Energy • Travel and Tourism
Specif ic information on these sectors, as w ell as best prospects in agricultural sectors is listed in Chapter 4: Leading Sectors for U.S. Export and Investment. In addition to these best prospect sectors there are grow ing opportunities in the f ield of homeland security equipment, oil and gas and construction equipment, solar pow er, and food processing and cold storage equipment. Market Entry Strategy Return to top
Strategic planning, due diligence, consistent follow -up, and perhaps most importantly, patience and commitment are all prerequisites to successful business. The Indian sub-continent necessitates multiple marketing efforts that address differing regional opportunities, standards, languages, cultural differences, and levels of economic development. Gaining access to India's markets requires careful analysis of consumer preferences, existing sales channels, and changes in distribution and marketing practices, all of w hich are continually evolving.
Finding Partners and Agents: New to market businesses must address issues of sales channels, distribution and marketing practices, pricing and labeling, and protection of intellectual property. Relationships and personal meetings w ith potential agents are extremely important. Due diligence is strongly recommended to ensure that partners are credible and reliable. Geographic Diversity: U.S. companies, particularly small and medium-sized enterprises, should consider approaching India’s markets on a local level. Good localized information is a key to success in such a large and diverse country. The U.S. Commercial Service posts in New Delhi, Mumbai, Chennai, Ahmedabad, Bangalore, Hyderabad and Kolkata provide valuable local information and advice and are w ell plugged in w ith local business and economic leaders. Multiple agents are often required to serve each geographic market in the country. Market Entry Options: Options include using a subsidiary relationship, a joint venture w ith an Indian partner, or using a liaison, distributor, project, or branch off ice. Return to table of contents
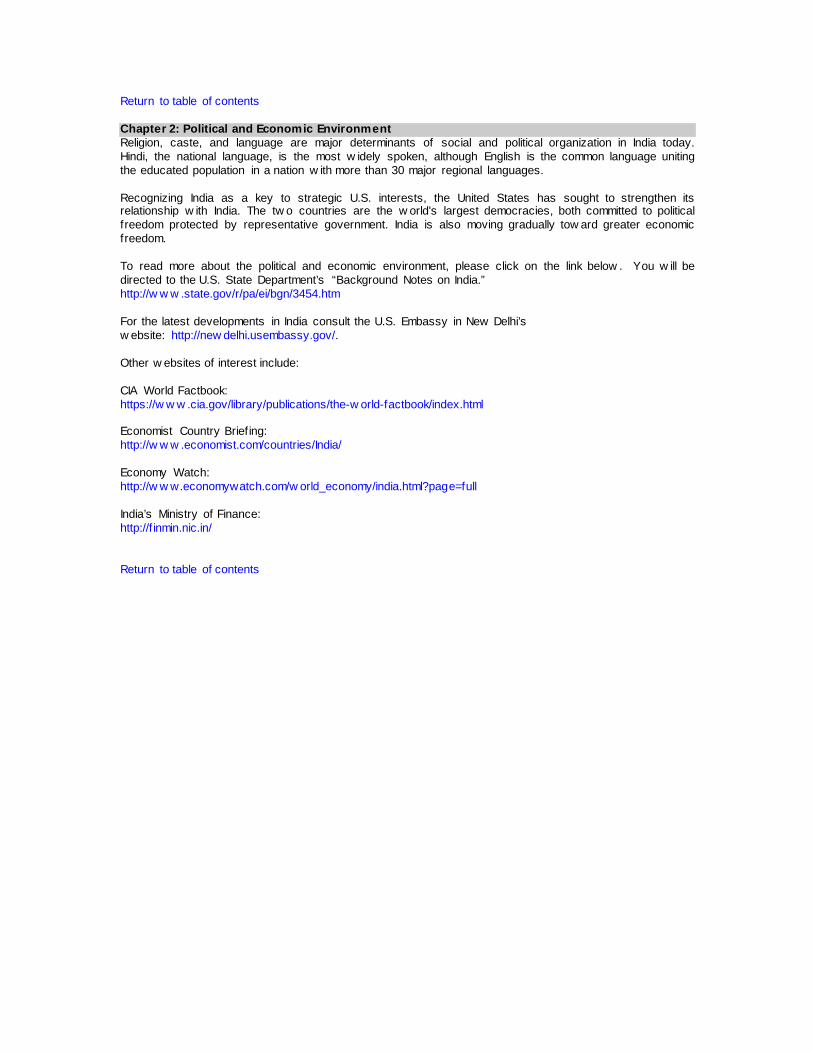
DOING BUSINESS/ECONOMIC FREEDOM RANKINGSWorld Bank Doing Business in 2012 Rank: 132 of 185Heritage/WSJ 2012 Index of Freedom Rank: 123 of 179
COUNTRY FACT SHEET: INDIA PROFILEPopulation in 2011 (Millions): 1,207Capital: New DelhiGovernment: Republic
ECONOMY 2009 2010 2011
Nominal GDP (Current Billions $U.S.) 1,266 1,630 1,827Nominal GDP Per Capita (Current $US) 1,079 1,370 1,514Real GDP Growth Rate (% change) 5.9 10.1 6.8Real GDP Growth Rate Per Capita (% change) 4.4 8.6 5.4Consumer Prices (% change) 10.9 12.0 8.9Unemployment (% of labor force)
Economic Mix in 2011: 26.4% All Industries; 13.9% Manufactures; 56.4% Services; 17.2% Agriculture
FOREIGN MERCHANDISE TRADE ($US Millions) 2009 2010 2011
India Exports to World 176,765 220,408 301,483India Imports from World 266,402 350,029 462,403U.S. Exports to India 16,441 19,250 21,501U.S. Imports from India 21,166 29,533 36,153U.S. Trade Balance with India -4,725 -10,282 -14,652Position in U.S. Trade:Rank of India in U.S. Exports 17 17 17Rank of India in U.S. Imports 15 14 13India Share (%) of U.S. Exports 1.6 1.5 1.5India Share (%) of U.S. Imports 1.4 1.5 1.6
Principal U.S. Exports to India in 2011: Principal U.S. Imports from India in 2011:
1. Chemicals (20.7%)1. Miscellaneous Manufactured Commodities (23%)
2. Miscellaneous Manufactured Commodities (19.1%) 2. Chemicals (16.6%)
3. Machinery, Except Electrical (11%) 3. Apparel & Accessories (9.6%)
4. Computer & Electronic Products (10.3%) 4. Petroleum & Coal Products (9.3%)
5. Primary Metal Mfg (5.9%) 5. Textile Mill Products (6.8%)
FOREIGN DIRECT INVESTMENT 2009 2010 2011
U.S. FDI in India (US $Millions) 19,166 24,822 24,663FDI in U.S. by India (US $Millions) 2,555 4,110 4,888
Source: Created by USDOC/ITA/OTII-TPIS from many sources: FDI from USDOC, Bureau of Economic Analysis. US Trade from USDOC,Census Bureau,Foreign Trade Division. India Trade with World from United Nations where available. National Macroeconomic datafrom IMF/World Bank databases including World Economic Outlook and World Development Indicators. .WORLD and other country aggregates are summaries of available UN COMTRADE, IMF and other data, and coverage varies over time and by source, but typically represents greater than 85 percent of world trade and production. Note: Principal U.S. Exports and Imports Are 3-digit NAICS Categories
Page 1 of 2
3/29/2013http://tpis7.ita.doc.gov/TPIS_GREPORTS/tpis_ctyreport2.aspx
Return to table of contents Chapter 2: Political and Economic Environment Religion, caste, and language are major determinants of social and political organization in India today. Hindi, the national language, is the most w idely spoken, although English is the common language uniting the educated population in a nation w ith more than 30 major regional languages. Recognizing India as a key to strategic U.S. interests, the United States has sought to strengthen its relationship w ith India. The tw o countries are the w orld's largest democracies, both committed to political freedom protected by representative government. India is also moving gradually tow ard greater economic freedom. To read more about the political and economic environment, please click on the link below . You w ill be directed to the U.S. State Department’s “Background Notes on India.” http://w w w .state.gov/r/pa/ei/bgn/3454.htm For the latest developments in India consult the U.S. Embassy in New Delhi’s w ebsite: http://new delhi.usembassy.gov/. Other w ebsites of interest include: CIA World Factbook: https://w w w .cia.gov/library/publications/the-w orld-factbook/index.html Economist Country Briefing: http://w w w .economist.com/countries/India/ Economy Watch: http://w w w.economywatch.com/w orld_economy/india.html?page=full India’s Ministry of Finance: http://f inmin.nic.in/ Return to table of contents
Return to table of contents Chapter 3: Selling U.S. Products and Services
• Using an Agent or Distributor • Establishing an Office • Direct Marketing • Joint Ventures/Licensing • Selling to the Government • Distribution and Sales Channels • Selling Factors/Techniques • Electronic Commerce • Trade Promotion and Advertising • Pricing • Protecting Your Intellectual Property • Due Diligence • Local Professional Services • Web Resources
Using an Agent or Distributor Return to top Remember the Scale of India and Consider a Regional Approach: Creating a local presence in India is strongly advised, but if your company isn’t ready to establish a branch off ice or a subsidiary, you can get this on-the-ground presence by appointing an agent, representative, or distributor. It’s vital to remember that India is a huge and diverse country, w ith over 30 regional languages. As such, it’s strategically important to consider taking a regional approach, and if your product has a w ide market appeal, w e advise f inding regional representatives and distributors. Defining the Terms: An agent may only procure business and w ill be paid through a commission. A representative normally w orks on a retention fee plus a commission on the sales generated. Also, a representative is similar to an indenting agent, w here the foreign company deals directly w ith an Indian importer and then an agent consolidates all the imports, taking a commission from the foreign company. A distributor acts as an importer and typically purchases the product on his ow n account and stocks the products before selling it to the end user. Due to the risk of stocking the products, the distributor’s compensation is higher than that of an agent or a representative. Use Caution when Establishing Critical Relationship: The Indo-American relationship is strong, and Indian f irms are eager to buy U.S. products and services. The market is opening as required by India's WTO commitments, and as a result, U.S. exporters w ill f ind strong interest from potential representatives and distributors for a broad range of products. How ever, the enthusiasm of potential partners must be w eighed against several factors before a relationship is considered. A thorough due diligence study is essential before establishing a relationship, no matter how positive initial meetings may be. When evaluating a distributor or agent, the Indian f irm’s business reputation, f inancial resources, w illingness and ability to invest, marketing strength, regional coverage, industry expertise, and credit w orthiness should be considered. An ideal distributor w ill have an extremely good banking relationship to enable the extension of credit and also have the capacity to market a full range of products and services. It is important that the agent or distributor have modern infrastructure and facilities such as w arehouses, service w orkshops, show rooms, and trained staff to meet and exceed the expected volume of business. The Real Gain is in the Growth Market: U.S. companies should be careful not to be influenced by the eagerness and persistence of a distributor or his representative. Sometimes Indian f irms represent so many companies that they have little time or interest in developing new markets. The Indian f irm may not have the vision to go beyond the existing list of contacts that they have nurtured over time. While in the short run, this can still provide very positive returns, the real edge w ill be in the areas that are currently underdeveloped. Therefore it is critical to objectively measure the ability, w illingness, and aggressiveness of the f irm in developing new netw orks, contacts, and areas of business. By checking multiple professional references, a U.S. company can gain broad insight into an Indian counterpart. Typical Pitfalls to Expect: The long list syndrome: U.S. companies should exercise pragmatic skepticism w hen the potential representative offers a long list of foreign clients. These lists may be outdated and the relationships may no
longer exist. On the other hand, if all of these relationships do exist, the distributor or agent may not be able to fulf ill all obligations and commitments to your product based on the time, f inancial, managerial, or logistical constraints of building the new relationship. The U.S. companies should confirm that the distributor or agent is able to represent the product along w ith the products of current clients. The no follow -through syndrome: U.S. companies should ensure that their distributor or agent is fully committed to promoting their product. Very often the distributors or the agents project a professional image backed by a qualif ied staff, w idespread distribution netw ork and a countryw ide presence. The U.S. company should make sure that such representatives do not leave the distribution of their products or services to the netw ork. It is imperative that U.S. companies carefully consider all factors prior to making the f inal selection of a distributor or agent. Other Issues to Consider: Advantages of a small distributor: A small distributor may be ideal for implementing a f lexible distribution strategy. That India is a vast nation of diverse states poses a logistical challenge to a distributor or to an agent. A small distributor having a presence w ithin a region of India w here customers live may be more advantageous, as know ledge of the local market may be a competitive advantage. A small distributor w ith good product know ledge and marketing skills is often more desirable than a big distributor w ho leaves the marketing of the product to a section or department of their larger organization. U.S. companies should consider appointing multiple representatives for different products w hen this is possible. Due diligence checks: India is a new and rapidly grow ing economy, and as such, simple and traditional methods of validating the credentials of a potential partner are less reliable, and a thorough due diligence study is critical. Before signing a representative’s agreement, a credit check of the proposed partner is imperative. The U.S. f irm should check w ith the distributor or agent’s bank to determine the potential partner’s f inancial health, reputation and credit w orthiness, and seek additional details from accountants, law yers, industrial associations, and other sources. For technical products, U.S. companies should also ensure the technical expertise of the distributor, the condition of the facilities, and the experience of the technical staff. Due care should be taken in f inalizing the contract details and/or memorandum of understanding. To identify agents and distributors, U.S. companies can take advantage of the International Partner Search (IPS) and Gold Key Service (GKS) programs offered by the U.S. Commercial Service through its seven off ices in India. To assist w ith due diligence background checks on local agents and distributors, U.S. companies can take advantage of the Commercial Service’s International Company Profile (ICP) service. Please see Chapter 10 for more information. Establishing an Office Return to top The most important parameters in choosing a location in India are: (1) physical infrastructure; (2) state government support and f lexibility; (3) cost and availability of pow er; and (4) the law and order situation. Other factors to take into account include labor availability and cost, labor relations and w ork culture, and proximity to resources and/or markets. In the area of labor law , an employer w ith more than 100 w orkers cannot f ire them w ithout permission from a government labor commissioner -- something usually impossible to obtain. Given the shortage of good commercial off ice space at reasonable prices in major Indian cities, business centers are a viable option for new companies w anting to establish a physical presence. Business centers are facilities that are ready to move in, w ired for communications, and air-conditioned. Billing is normally done on a monthly basis. For long-term use, discounts are generally available. Many state governments are creating special Technology Parks for selected industry sectors like softw are, biotechnology, and automotive. Type of Office: A foreign company or individual planning to set up business operations in India – but choosing not to establish a subsidiary or to form a joint venture w ith an Indian partner – can do so by establishing liaison, project, or branch off ices in India. Approval from the Reserve Bank of India (RBI) is required, and can be obtained by submitting form “FNC” w hich can be dow nloaded here. Such companies also have to register themselves w ith the Registrar of Companies (ROC) w ithin 30 days of setting up a place of business in India. Liaison or Representative Office: Many foreign companies initially establish a presence in India w ith a liaison or representative off ice that is not directly engaged in commercial transactions in India. The purpose
of these off ices is to oversee their netw orking efforts, promote aw areness of products, and to explore further opportunities for business and investment. A liaison off ice is not allow ed to undertake any commercial activity and cannot earn any revenue in India. As no revenue is generated, there are no tax implications to the off ice in India. Such off ices are not allow ed to charge any commission or receive other income from Indian customers for providing liaison services. All expenses are to be borne by inw ard remittances. A foreign company establishing a liaison off ice cannot repatriate money out of India. Branch Office: A branch off ice, like a liaison off ice, is not an incorporated company but an extension of the foreign company in India. A branch of a foreign company is limited to the follow ing activities by the RBI: representing the parent company and acting as its buying/selling agent; conducting research for the parent company, carrying out import and export trading activities; promoting technical and f inancial collaborations betw een Indian and foreign companies, rendering professional or consulting services, rendering services in information technology and development of softw are in India, and rendering technical support to the products supplied by the parent/group companies. A branch off ice actually does business in India and is subject to taxation in India. The branch off ice is allow ed to repatriate profits generated from their Indian operations to the parent company after paying taxes. How ever, a branch off ice is not allow ed to carry out manufacturing and processing activities directly (though it can sub-contract such activities to an Indian manufacturer). Project Office: Foreign companies sometimes set up a temporary project off ice to undertake projects in India aw arded to the parent company. It is essentially a branch off ice set up for the limited purpose of executing a specif ic project. Approval for project off ices is generally accorded for executing government-supported construction projects or w here the projects are f inanced by Indian and international f inancial institutions and multilateral organizations. In exceptional cases, approval is also given for private projects. Upon completion of the project, project off ices may remit outside India the surplus of the project, after meeting tax liabilities. None of these entities are permitted to acquire real estate w ithout prior RBI approval. How ever, they are allow ed to lease property in India for a maximum period of 5 years. Direct Marketing Return to top The Indian Direct Selling Association (IDSA) announced in March 2013 that the Indian Direct Selling Industry direct selling market size w as w orth $1.16 billion in 2011-12. The industry is expected to reach $1.97 billion by 2014‐15 and $ 6.18 billion by 2019-20. While the industry grew by 22 percent in 2011-12, it is expected to see a year-on-year grow th of around 20 percent over the next four years. Just tw o Indian states have detailed and focused guidelines for direct selling companies -- Kerala and Rajasthan. On a national level, the Indian government formed a committee to strengthen the regulatory and supervisory cooperation among agencies of both the state and federal governments w ith regards to fraudulent f inancial pyramid schemes. Direct sellers should have a license to do business in India and should f ile all mandatory tax returns. It is mandatory to have trademarks or licenses. According to IDSA the direct selling industry offers alternate employment opportunities in India and has contributed signif icantly in self-employment generation for the country over the years. The total distributor base of the Indian direct selling industry during 2011‐12 w as 4.8 million. It is expected to reach eight million by 2014‐15. The grow th of the total distributor netw ork stands at 22.5% in 2011‐12 over 2010‐11. For more information about export opportunities in this sector contact U.S. Commercial Service Industry Specialists: Manjushree Phookan at: [email protected] and Aliasgar Motiw ala at: Aliasgar.Motiw [email protected] Useful Links include: U.S. Commercial Service in India http://export.gov/india/ Ministry of Commerce http://commerce.nic.in/ Retailers Association of India w w w .rai.net.in Images Retail w w w .imagesretail.com/

Indian Direct Selling Association http://w w w .idsa.co.in/ India Brand Equity Foundation http://ibef.org/home.aspx Joint Ventures/Licensing Return to top This type of arrangement is quite common because India encourages foreign collaborations to facilitate capital investments, import of capital goods, and transfer of technology. That aside, India is a market that requires a careful approach because mistakes can be quite costly. Once a decision to go w ith a joint venture partner is made, it’s important to keep in mind the follow ing principles: define each partner's roles and expectations because equality and trust w ill help keep partners together; experience is a key ingredient; there is no substitute for thorough research; and consider the long term. There are tw o channels for foreign investment: the “automatic route” and the “government route.” Under the “automatic route,” the foreign investor or Indian company is not required to seek approval f rom the relevant central government agency or department (e.g., coal and lignite mining, pow er, industrial parks, petroleum and gas, non-banking f inance). Instead, the investor is expected to notify the Reserve Bank of India (RBI) of its investment via Form “FC (RBI)” w ithin 30 days of inw ard receipts and the issuance of shares (w w w .rbi.org.in/scripts/BS_View Forms.aspx). Investments subject to government approvals are described as taking the “government route,” and approval from vested ministries and agencies is required prior to the investment transaction. The approving entity varies depending on the applicant and the product:
• The Ministry of Commerce and Industry’s (MOCI) Department of Industrial Policy and Promotion (DIPP) oversees single-brand product retailing investment proposals as w ell as proposals made by Non-Resident Indians (NRIs) and Overseas Corporate Bodies (OCBs). An OCB is an entity that is at least 60 percent ow ned by NRIs, including overseas trusts.
• The MOCI’s Department of Commerce oversees proposals from export oriented units (i.e.,
industrial companies that intend to export their entire production of goods and services from India abroad).
• The Ministry of Finance’s Foreign Investment Promotion Board (FIPB) oversees all other
applications.
For Sector-Specif ic Guidelines for foreign direct investment, please see Chapter 6. The FIPB in the Ministry of Finance is a high-level central agency that deals w ith and clears proposals for investment in India. The chairman of the board is the Secretary of the Department of Economic Affairs. Other board members consist of the secretaries in the ministries of commerce and industries, and the Economic Relations Secretary in the Ministry of External Affairs. Other members such as senior government off icials and professional experts can be co-opted from government agencies and industry as required. Applications are received by the FIPB. For details on procedure please refer to the FIPB instruction at http://w w w .fipbindia.com/instructions.php. For NRI investment and for investment in the retail sector applications need to be submitted to Secretaries for Industrial Assistance (SIA). The SIA is w ithin the Department of Industrial Policy and Promotion in the Ministry of Commerce and Industry. It provides a single w indow for entrepreneurial assistance, investor facilitation, processing of all applications that require government approval, assisting entrepreneurs and investors in setting up projects (including liaison w ith other organizations and state governments) and monitoring the implementation of projects. The timeline for approval of applications made to FIPB and SIA that meet all the required criteria is usually one month. India has taken gradual steps tow ard FDI liberalization but the process is still quite cumbersome and allow ed w ith many limitations. In late 2012, India started allow ing FDI in multi-brand retail w ith foreign companies ow ning up to 51 percent of the entity w ith a few caveats. First and most importantly, each state can decide w hether to allow this FDI, meaning that few er than half the states in India have gone along w ith the plan. Secondly, the new rules require companies to invest $100 million, of w hich half has to be invested in back-end infrastructure in the f irst three years. While some new FDI continues to f low this year, the change has not caused a signif icant increase in FDI, perhaps due to the strings attached to the new rules.

The November 2011 National Manufacturing Policy (NMP) calls for greater local value addition requirements in government procurement in certain sectors (e.g., solar energy equipment, electronic hardw are, fuel eff icient transport equipment and IT based security systems). http://commerce.nic.in/w hatsnew /WhatsNew _detail.asp?id=35 Government approval is required for any foreign investment greater than 24 percent equity w hen the manufacturer is not a micro, small or medium-sized enterprise (MSME) and the entity w ill manufacture items reserved for the MSME sector (there are 20 specif ic goods and services on the reserved list. The list can be found at http://w w w .dcmsme.gov.in/publications/reserveditems/reserved2010.pdf ). An MSME is a company w ith a total investment in plant and equipment of under $2 million. The exact definition can be found at http://w w w .dcmsme.gov.in/ssiindia/defination_msme.htm. FDI policy is governed by the Foreign Exchange Management Act of 1999 and the RBI. Details on current caps and procedures are available at: http://dipp.nic.in/English/Polic ies/FDI_Circular_02_2011.pdf. Investment in the Following Areas are Accorded Priority in Considering Investment Applications: Items listed in the automatic approval list, w here conditions for automatic approval are not met; infrastructure; items w ith export potential; projects w ith large employment potential, particularly in rural areas; items w hich have a direct or indirect linkage w ith the agricultural sector; socially relevant projects such as hospitals and life-saving drugs; and projects w hich induct new technology or infuse capital. If the U.S. investor has w ritten a comprehensive proposal, provided details, and the FIPB is fully satisf ied that the investment meets India's industrial development goals, approval can be granted in as little time as three w eeks. Proposals that are badly formulated, do not meet FIPB goals, and invite objections on political, environmental, public health or w elfare grounds are likely to be denied. Investment in Existing Pharmaceutical Companies : In October 2011, FDI rules w ere changed for the pharmaceutical sector. For investments in new projects (green f ield investments), 100 percent FDI is still allow ed. In case of investment in existing companies (brow n field investments), FDI w ill be overseen by the Competition Commission of India (CCI) in accordance w ith India’s competition law s that w ill ensure a balance betw een public health concerns and FDI. At the time of this w riting no regulations for mergers and acquisitions of the existing pharmaceutical companies have been put in place. This additional government approval requirement is already causing delays for mergers and acquisitions that are currently in the pipeline. Industries Reserved for the Public Sector: Some industries are reserved exclusively for the public sector. The follow ing industries are not available for private investment unless a specif ic approval is obtained: arms and ammunition and allied items of defense equipment, defense aircraft and w arships, atomic energy, and railw ay transport. For more details please refer to the GOI Ministry of Commerce and Industry’s FDI policy, w hich can be found at: http://dipp.nic.in/English/Policies/Policy.aspx Compulsory Licensing: Six industries are subject to compulsory licensing in India. The need for licensing is attributed to safety, environmental, and defense related considerations. The licensing authority in this case is the Ministry of Industrial Development and the industries are: distillation and brew ing of alcoholic drinks; cigars and cigarettes of tobacco and manufactured tobacco substitutes; electronic aerospace and defense equipment of all types; industrial explosives including detonating and safety fuses, gun pow der, nitrocellulose and matches and hazardous chemicals. First Compulsory License to a Patented Pharmaceutical Product: In March 2012 the Controller General of Patents granted a generic drug manufacturer the right to make and sell a generic copy of a Bayer patented cancer drug, citing that Bayer not only charged a price that w as unaffordable to most Indians but also did not supply enough doses of the medication to make it available to patients in India. This case w as the f irst compulsory licensing of a patented drug in India and paves the w ay for a series of similar rulings in the future. Selling to the Government Return to top
The estimated size of the government procurement market at the Central government level in India is about $300 billion and it is expected to grow by more than 10 per cent annually in the coming years. Three sectors -- health including pharmaceuticals, railw ays, information technology and IT-enabled services represent a
large volume of the Indian public procurement market and are expected to grow signif icantly. Though public procurement accounts for 15 to 20 per cent of Indian economy there is no central law governing the sector. The situation is similar at the state level. At present only tw o states -- Karnataka and Tamil Nadu -- have a law governing public procurement. Multiplicity of law s and regulations are implemented by multiple agencies, and Indian government procurement practices and procedures often lack transparency and standardization, w hich can frustrate foreign suppliers. The process is improving under the influence of f iscal reform policies such those set dow n in their Defense Procurement Procedure and Manual in 2009 and the revised Defense Procurement Procedure in 2011 http://mod.nic.in/dpm/w elcome.html. Specif ic price and quality preferences for local suppliers w ere largely abolished in 1992. Recipients of preferential treatment are now supposedly limited to the small-scale industrial and handicrafts sectors, w hich represent a very small share of total government procurement. There are occasional reports of government-ow ned companies calling in the performance bonds of foreign companies, even w hen there w as no dispute over performance. It is not unusual for negotiations to drag on for months and be held up at more than one of the sundry levels w ithin the Indian bureaucracy for long periods w ith no discernible movement or reason given for lack of progress.
With this in mind some firms seek out local representatives w ho are familiar w ith the culture and customs of India, and are familiar w ith w ays to expedite their product or service through the maze of bureaucracy in Government ministries. When foreign f inancing is involved, principal government procurement agencies tend to follow multilateral development bank requirements for international tenders. How ever, in other purchases, current procurement practices can result in discrimination against foreign suppliers w hen goods or services of comparable quality and price are available locally. The Government of India regularly advertises its requirements for the purchase of supplies and new equipment. Defense Sales: While most of India’s defense equipment w as previously purchased from non-U.S. sources, India has recently expressed increased interest in U.S. technologies. The Indian defense sales market today offers great potential for defense suppliers, but U.S. businesses desiring to make defense related sales to India should be aw are that the process can be a daunting one. For more information about market opportunities in this sector contact Commercial Specialist Jitender Jassal at [email protected]. Local Representation is Invaluable: U.S. defense suppliers should assess the merits of having some representation in India to assist in market assessments, logistical support, and after-sales contact. This representation can either be through the supplier’s ow n off ice presence in India (see above section “Establishing an Office”), or through an authorized representative. Caution must be exercised w hen seeking local expertise because unless strict guidelines are follow ed, Indian law may be broken. In November 2001, the Government of India lif ted the ban on agents in defense purchases. Regulatory provisions w ere announced for Indian authorized representatives and agents, w here permissible, in defense purchases. Details of these provisions are posted on the w eb site of the Ministry of Defense at: http://mod.nic.in/new addition/repagent.htm. The regulations require both the principal as w ell as the potential local representative to meet the provisions stipulated – it is the foreign supplier that has to make an application to the Ministry to register the relationship reached w ith the agent. The regulations also call for complete disclosure of the principal agent relationship in all its aspects. The process for gaining clearance from the Government of India (GOI) to hire such a representative can also be very slow . These requirements have discouraged many established local representatives in the defense business from registering as agents for new defense deals. The Office of Defense Cooperation (ODC) w ithin the U.S. Embassy in New Delhi w orks w ith the Commercial Service in New Delhi to assist U.S f irms by providing contact details of Ministry of Defense and Military Service off ices that are the main purchasers of foreign defense goods for India and offer advice on strategies for defense related sales. The tender process that the GOI uses to acquire new defense equipment is relatively slow and complex, w ith the average time betw een initial release of a request for proposal and the f inal contract aw ard often taking several years. The most successful f irms are those w ith the endurance to follow the process through and the situational aw areness that comes from local representation or from contact w ith GOI off icials. Tenders are generally posted to the Internet, but most U.S. f irms w ill w ant to establish MOD contacts and understand emerging opportunities and the requirements process w ell before tenders are publicly announced at: http://w w w .tenders.gov.in/. Many ministries announce tenders specif ic to their ministry on their ow n w ebsite. A private portal to several Government of India w ebsites is found at: http://w ww.sarkaritel.com/ministries/
Distribution and Sales Channels Return to top There has been a signif icant expansion in distribution channels in India during the past few years. The size of the Indian retail market in 2011 exceeded $4.9 billion. It is projected that it w ill grow to $7.1 billion by 2016 averaging 7.5% grow th annually. The total number of retail distribution outlets in the country is estimated at over 12 million, mostly family-ow ned businesses. An annual grow th rate for the fast moving consumer goods (FMCG) sector is predicted at 10-12 percent during the next 10 years. A f irm can take its products to the user through a variety of channels. It can use different types of marketing intermediaries. It can structure its channel into a single-tier or a three-tier system. The three-tier system: Most Indian manufacturers use a three-tier selling and distribution structure that has evolved over the years: redistribution stockists, w holesalers and retailers. As an example, a FMCG company operating on an all-India basis could have betw een 40 and 80 redistribution stockists (RS). The RS w ill sell the product to betw een 100 and 450 w holesalers. Finally, both the RS and w holesalers w ill service betw een 250,000-750,000 retailers throughout the country. The RS w ill sell to both large and small retailers in the cities as w ell as interior parts of India. Depending on how a company chooses to manage and supervise these relationships, its sales staff may vary from 75 to 500 employees. Wholesaling is profitable by maintaining low costs w ith high turnover, w ith typical FMCG product margins anyw here from 4-5%. Many w holesalers operate out of w holesale markets. In urban areas, the more enterprising retailers provide credit and home-delivery. Now , w ith the advent of shopping malls impacting the retail sector, companies talk of direct delivery and discounts for large retail outlets. Outsourcing logistics: In recent years, there has been increased interest from companies to improve their distribution logistics in an effort to address a f iercely competitive market. This in turn has led to the emergence of independent distribution and logistics agencies to handle this important function. Marketers are increasingly outsourcing some of the key functions in the distribution and logistics areas to courier and logistics companies and searching for more eff icient w ays to reach the consumer. The courier netw ork in India now spreads to smaller Class IV tow ns (defined as tow ns w ith populations less than 50,000). Clearing and Forwarding: Most FMCG and pharmaceutical companies use clearing and forw arding (C&F) agents for distribution and each C&F agent services stocks in an area, typically a state. It is also important to note that duty structures vary among states for the same product, thus creating disparate pricing. But w ith the introduction of VAT at every stage from producer to end consumer, retail prices are now the same throughout India. With the cost of establishing w arehouses extremely high, C&F agents are fast becoming the norm. Recently companies have been utilizing the same distribution channels for products w ith complementary characteristics. India has eleven major seaports and 139 minor w orking ports along its tw o coasts, but in terms of gross w eight tonnage conveyed annually, Mumbai, Marmagao on the w est coast, and Vishakhapatnam and Chennai along the east coast are the most important ports in India. Mumbai, the f inancial capital of the country, is very important for the international cargo trade. Free Trade Warehousing Zones: In an effort to assist companies entering the Indian market and also to develop the Entrepot trade, the Government of India introduced free trade & w arehousing zones (FTWZ) as a special category of special economic zones w ith a focus on trading and w arehousing. The objective of the FTWZ is to create trade-related infrastructure to facilitate the import and export of goods and services w ith the freedom to carry out trade transactions in free currencies. These zones are to be established in areas close to seaports, airports or dry ports. FDI in these zones is allow ed up to 100% in the development and establishment of the zones and in their infrastructure facilities. The scheme envisages duty free import of all goods for w arehousing (except prohibited items such as arms and ammunition, hazardous w aste and special chemicals, organisms, materials, equipment and technology items). The maximum period that goods may be w arehoused w ithin the FTWZ is tw o years, after w hich the goods have to be re-exported or sold. On expiry of the tw o year period, customs duties as applicable w ould automatically become due unless the goods are re-exported w ithin a grace period of three months. Selling Factors/Techniques Return to top At f irst glance, the bulk of the purchasing pow er in India w ould appear to be concentrated in its urban markets. How ever, a majority of the Indian population lives in rural areas distributed over some 627,000 villages. The balance lives in 3,700 tow ns of w hich approximately 300 have a population of more than 100,000 inhabitants. It is said that the real India lives in the villages. All marketers, both Indian and foreign, have benefited by paying attention to the marketing potential of rural India.
Analysis of consumer purchase data over the last several years by various research agencies has show n that rural markets in India are grow ing as disposable income and literacy levels increase, and television access stimulates demand. Analysts predict that Indian rural consumers w orth $100 billion w ill drive consumption in 2012. Due to the influence of the media, consumption patterns in rural households have also changed signif icantly in recent years. Indians in rural areas are far more brand conscious, and this is generating demand for some products that w ere previously unfamiliar. Grow ing brand aw areness makes it all the more important for American companies entering the Indian market to register their brand name w ith the Indian trademark off ice. For more information on this visit: http://w w w .ipindia.nic.in/. For the country’s mega-marketers, rural reach is on the rise. Poor infrastructure, how ever, is a major problem that makes distribution diff icult and reduces demand for some products in rural areas. In order for sales techniques to be successful, distribution coverage is of prime importance. Indian consumers are serviced by an eff icient, but highly fragmented, trade system consisting of over 12 million retail and w holesale outlets, spread over many urban and rural population centers. India has the largest retail outlet density in the w orld, but the majority of these stores are very small in size and unorganized. With more than 500 million people under the age of 25, India’s rapidly grow ing population appears to present limitless opportunities, but many Indian and foreign companies have discovered that for many product categories, only a fraction of India’s 1.2 billion population can be regarded as potential customers. Many companies have been disappointed w ith the response to products launched in India over the past few years. Initially, these companies grossly overestimated the depth and size of the Indian market for their products. Projections for the grow ing Indian middle-class range from 150-200 million but these f igures have proven to be off the mark for certain products as marketed to the typical Western middle class consumer. Transposing brands and products from other markets did not w ork. Suitability and adaptation to Indian preferences and conditions are regarded as a signif icant benefit to Indian consumers and is therefore an important factor to be considered w hile designing a sales strategy. A f inal mistake is to enter India w ithout an eff icient distribution netw ork, forgetting that India is a market w ith poor infrastructure and logistics. A successful sales strategy w ill recognize and deal w ith the existence of strong local competition - this exists in many products and service categories and should not be underestimated. U.S. f irms must also carefully compare customer needs and the quality of latent demand w ith the level of service that they w ant to offer in India. Even among the aff luent middle class, much of their money is spent on need-based consumption rather than on luxury goods. While selling in the Indian market can be a complicated and diff icult experience for new entrants, this can be avoided if, at the outset, the market opportunity is assessed accurately and the capabilities of local competition are not underestimated. Only in unusual circumstances should new foreign entrants create a new and independent sales infrastructure, because it is very expensive in the short run, and requires sustained investment to build over the long run, even if the product is successful. Electronic Commerce Return to top In addition to traditional selling techniques, the Internet is also gaining importance as a selling method. India is now the third largest Internet user base w ith about 121 million users after China and the US. According to the government, India’s Internet user base is expected to grow almost six-fold to 700 million by 2014. These users can potentially use the Internet over shared connections, such as cyber cafes, homes and off ices. As the number of Internet users continues to increase w ith the reduction in cost of Internet access, the Indian e-commerce market w ill also expand. The latest data from the Internet and Mobil Association of India (IAMAI) estimates the e-commerce turnover w as $7.0 billion in 2010, up from $2.8 billion in 2008. The majority of these deals, 80%, are related to booking travel (airw ays and railw ays) and hotels, w ith the remainder in e-tailing, net banking, bill payments, stock trading, job searches, matrimonial searches, general classif ieds, online advertisement and online search marketing. The grow th in e-commerce is largely due to the increasing number of broadband users. India is expected to have over 175 million broadband connections by 2014. Service providers are upgrading their capacity, but in the short run the supply of broadband is still a cause of concern. A w ell-know n global technology research f irm is upbeat on the potential for online shopping in India. Similarly, industry experts believe that online business-to-business (B2B) commerce w ill increase substantially in India because it meets a genuine need and portals offering such services are built on strong revenue models.
India currently does not allow FDI in e-commerce. Trade Promotion and Advertising Return to top Over the years, the Indian economy has moved from being a controlled sellers’ market to a buyers’ market. With the opening of the economy came increased competition, and the need for increased advertising. Media availability has increased exponentially w ith unlimited competition. In the year 2011, the Indian advertising industry stood at $5.1 billion, recording a grow th of 8 percent. The grow th projections for the ad industry by industry experts for 2012 are 8-9 percent, w ith a total advertising sector of $5.6 billion. Practically every aspect of media is available for advertising, from print to outdoor advertising to satellite channels to movie theaters. Advertising in print continues to hold the largest share. Television advertising dominates the market w ith a share of 44.8 percent, follow ed by print w ith a share of 42.2 percent. Radio saw no grow th in 2011 at 3.1 percent share, and outdoor advertising has a 5.1 percent share of the advertising market. The Internet share claims the third largest share of the market at 3.8 percent. A w ell-know n industry consulting group predicts that Internet w ould become a 5 percent media. The key to gaining rural market share is increased brand aw areness, complemented w ith a w ide distribution netw ork. Rural markets are best covered by mass media - India’s vast geographical expanse and poor infrastructure pose problems for other media to be really effective. India has a diverse and grow ing number of daily new spapers. Print media reaches 70 percent of urban adults. Further, the number of readers in rural India is now roughly equal to that in urban India. The print media, almost completely controlled by the private sector, is w ell developed and advertising and promotional opportunities are available in a large number of new spapers including daily, w eekly or monthly business publications, new s magazines and industry-specif ic magazines. According to the Indian Readership Survey 2011 data The Times of India is the leading English new spaper daily in India, w ith a readership of 7.4 million, follow ed by Hindustan Times w ith 3.6 million. The Economic Times and Business World are the predominant business publications. The top Hindi daily is Dainik Jagran w ith readership 16 million. The leading magazines include India Today, Business India, Business Today, and Outlook. Advertising opportunities are also available on satellite and cable television channels. Doordarshan, the government-ow ned television netw ork, reaches almost 90 percent of the population. In addition, more than 100 satellite and cable television channels, including many U.S. and international channels such as STAR TV, CNN, NBC, Discovery, National Geographic and BBC, are available for advertising. New distribution platforms like Direct-to-Home (DTH) are increasing the subscriber base and raising subscription revenues. Radio, by far the least expensive and most traditional form of mass entertainment in the country, is staging a comeback in the lifestyles of Indians. Presently this medium is dominated by the government-ow ned All India Radio (AIR) and reaches over 99 percent of the people in India. Today privately- ow ned FM radio stations are present in 90 cities operating on 280 operating frequencies and reach 60 million people. According to an industry body report, FM radio is expected to grow at a CAGR of 16 percent annually and reach a size of $328 million by 2014. New formats such as satellite, internet and community radio have also begun to hit the market. U.S. companies interested in advertising in Indian media can w ork through the many advertising agencies in India. Many large and reputable U.S. and other international advertising agencies are present in India in collaboration w ith local advertising agencies. The advertising sector in India is technologically advanced. In addition to advertising, established public relations f irms are also available to U.S. companies that require such services. This segment has a few U.S. and other international companies present in collaboration w ith local partners. Mumbai remains the center of the advertising industry in India. U.S. companies can select from a number of quality international trade fairs, both industry-specif ic and horizontal, to display and promote their products and services. The U.S. Department of Commerce certif ies a number of Indian trade show s as good venues for U.S. companies; and the U.S. Commercial Service (CS) off ices in India directly organize U.S. participation in a number of selected trade show s every year. Trade development off ices of the U.S. Department of Commerce, U.S. industry associations, and individual U.S. states organize trade delegations and missions to visit India to explore prospects for doing business w ith local f irms in the private and public sectors. Participation in such trade missions, w hose programs in
India are managed by the U.S. Commercial Service, w ill be useful for American companies interested in doing business in India. You can also visit http://export.gov/india/tradeevents/index.asp for a list of trade events supported or organized by CS in India. The Commercial Service in India offers several easy and inexpensive options to begin promotion in the Indian market, w hich are particularly helpful to small and medium new -to-market companies.
• Commercial New s USA (CNUSA) is monthly catalog magazine circulated w orld-w ide through U.S. Commercial Service off ices w ith low -cost advertising opportunities; w hile it’s not country-specif ic, over 3,000 copies are circulated to selected buyers, agents/distributors, chambers of commerce and trade associations in India.
• U.S. Exporters can arrange for customized services through our Single Company Promotions. • Firms offering services to U.S. exporters and investors interested in India can be listed in our
online Business Service Providers directory for business. Pricing Return to top When formulating key strategies and making decisions about product pricing for the Indian market, it is important to remember that simple conversion of U.S. dollar prices to Indian rupees w ill not w ork in most cases. Also, the assumption that a latent niche market for premium products exists has often resulted in low sales volumes and negligible returns for some foreign companies. If the product can be imitated easily in terms of quality and service, international pricing w ill not w ork in India because local entrepreneurs w ill quickly adopt the same business opportunity. To reduce product import duties or other local costs and ensure a stable market share, several U.S. and other foreign companies have set up product assembly shops in India. Pricing decisions also have some bearing on product packaging. Many consumer product suppliers have found it helpful to package smaller portions at reduced prices rather than "economy" sizes. Although some Indian consumers are aw are of quality differences and insist on w orld-class products, many customers can sacrif ice quality concerns for price reductions Bargaining for the best price is a routine process of the buyer and seller in India. For consumer goods, especially for durables, the sellers often give discounts on the listed prices during festive seasons to attract more customers. Trade-ins of old products for new items are also increasingly popular among consumers. A pricing strategy must consider all of these factors. Another key consideration in pricing is Indian import tarif fs. These are high for most products, especially consumer products. There are pockets of aff luent Indians w ho can afford to buy a variety of luxury branded goods. How ever, in general, consumer consumption patterns are very different from those in many other countries. The middle class is grow ing exponentially, providing a fertile market for moderately priced items, but the prohibitive import tarif fs may serve to move some items out of the reach of the Indian middle class consumer. The 12.5 percent Value Added Tax (VAT) that is in effect in most states compounds this issue. Protecting Your Intellectual Property Return to top Indian law at present does not provide for protection against unfair commercial use of test or other data that companies submit to the government in order to obtain marketing approval for their pharmaceutical or agricultural chemical products. Without specif ic protection against unfair commercial use of clinical test data, companies in India seek immediate government approval for marketing of pharmaceutical and agrochemical products based on the original developer's data. In order to comply w ith its international obligations under the TRIPS Agreement, the Government of India had designated the Department of Chemicals and Petrochemicals, Ministry of Chemicals and Fertilizers as the responsible ministry to suggest measures that should be adopted in context of Article 39.3 of TRIPS Agreement and to consider w hether data protection can be offered under the existing legal provisions. An Inter-ministerial Committee w as constituted on February 10, 2004 under the Chairmanship of Secretary Reddy to act as a Consultative Group on the matter. The Committee released the Reddy Report on May 31, 2007. The Reddy Report f inds that the present Indian legal provisions on data protection are not adequate to meet the spirit of Article 39.3 of TRIPS Agreement, though it concludes that existing legislation may be amended to achieve TRIPS consistency. The report further recommends that an explicit legal mechanism in the Drugs and Cosmetics Act, 1940 and the Insecticides Act, 1968, and the Rules framed under these Acts, should be provided to ensure that undisclosed test data of the originator is not put to unfair commercial use
by others. The Ministry of Agriculture had drafted the Pesticides Management Bill, 2008 w hich includes provisions for data protection for agricultural chemicals and the Bill w as introduced in the Parliament on Oct 21, 2008. The Bill w as then referred to the Standing Committee on Agriculture for their recommendations. The Standing Committee’s recommended that the term of data protection in the bill be increased from three (3) years to f ive (5) years. The Ministry of Agriculture amended the Bill in accordance w ith the Standing Committee’s recommendations the amended Bill w as to be re-introduced during the Winter 2011 session but could not be taken up and w ill be re-introduced in the next Parliamentary session. While the Government of India has considered instituting a regulatory data protection system for agrochemicals, there has been little or no movement on providing data protection for pharmaceuticals. Copyrights: India is a signatory to the Berne Convention and India’s Copyright Act of 1957 provides for both civil and criminal penalties for copyright infringement. The Information Technology Act of 2000 includes penalties for the unauthorized copying of computer softw are. Penalties of up to $240,000 can be applied to unauthorized copying. Also, the penalty affords no immunity from prosecution under other law s. The GOI is not a party to either the 1996 WIPO Copyright Treaty (WCT) or the WIPO Performances and Phonograms Treaty (WPPT). India is now in the process of considering an amendment to its Copyright Act w hich includes provisions implementing the WPPT and WCT. The Copyright Amendments Bill w as f irst introduced into Parliament in April 2010 and referred to the Standing Committee on Human Resources Development for evaluation. The Standing Committee submitted its recommendations to Parliament in November 2010 and they w ere examined by the Ministry of Human Resources Development. The Ministry amended the Bill in accordance w ith the Standing Committee’s recommendations and w as planning to introduce the Copyright Amendments Bill during the Winter 2011 session. The Opposition party w as able to prevent the Bill from being taken up and the Ministry w ill seek to reintroduce the Bill during the next Parliamentary session in 2012. Enforcement of copyright continues to be a problem in India. The Indian Constitution delegates enforcement responsibility to the state governments. The central government can pass law s but the states are responsible for implementing them. The Central Bureau of Investigation (CBI), for example, w hich has inter-state jurisdiction, does not pursue IPR-related cases. The state, municipal or local police forces - although untrained - are charged w ith enforcing IPR law s. Piracy of copyrighted materials (particularly softw are, f ilms, music, popular f iction w orks and certain textbooks) remains a problem for both U.S. and Indian producers. India has considered introducing separate optical disc legislation and anti-camcording legislation to address w idespread copyright theft but these initiatives have not been implemented. Under existing law , copyright and trademark infringement are characterized as "cognizable offenses" w hich means that police have expanded search and seizure authority and can make arrests w ithout having a w arrant from the court. The law provides for minimum criminal penalties, including mandatory minimum jail terms. Courts rarely impose the full range of penalties prescribed under the law Due to backlogs in the court system and documentary and other procedural requirements, relatively few cases are prosecuted and U.S. and Indian industry report that piracy levels in all sectors remain high. Cable television piracy also continues to be a signif icant problem, w ith estimates of tens of thousands of illegal systems in operation in India. Copyrighted U.S. products are transmitted over this medium w ithout authorization, often using pirated videocassettes, VCDs, or DVDs as source materials. This w idespread copyright infringement has a signif icant detrimental effect on all motion picture market segments in India - theatrical, home video and television. For instance, pirated videos are available in major cities before their local theatrical release. The proliferation of unregulated cable TV operators has led to cable piracy. The GOI, through the Ministry of Information and Broadcasting, has set up an Anti-piracy Taskforce w hich w as constituted to recommend measures to combat f ilm, video, cable and music piracy in India. The Taskforce issued its report in August 2010 and has made several key recommendations. In its recommendations, the Taskforce has focused on mainstreaming instruments of policy and practice in an effort to make piracy substantially more risky and f inancially unattractive. The GOI is in the process of examining these recommendations and assessing how they can be implemented. Trademarks: India’s trademark legislation provides protection for trademarks and service marks. A bill amending the Trade Marks Act, 1999 to include provisions relating to the f iling of trademark applications under the Madrid Protocol has been cleared by the Parliament. India is expected to formally accede to the Madrid Protocol in the fall of 2012 and begin accepting applications in early 2013. The Intellectual Property Off ice has also upgraded its IT systems to allow for electronic f iling of trademark applications and the Government of India is now considering making e-f iling mandatory. Enforcement of trademarks in India’s courts is improving and several precedential judgments recognizing the concepts of “w ell-know n or famous marks” and “cross-border reputation” have been issued. The Foreign Exchange Management Act 1999
(FEMA) restricts the use of trademarks by foreign f irms unless they invest in India or supply technology. Geographical indications are protected under separate statutory provisions. Enforcement: India’s criminal justice system does not effectively support the protection of intellectual property. India’s criminal IPR enforcement regime, including border protection against counterfeit and pirated goods, remains w eak. There have been few reported convictions for copyright infringements resulting from raids, including raids against recidivists. Adjudication of cases is slow . Police action against pirates of motion pictures has improved somew hat since 2003. Obstruction of raids, leaks of confidential information, delays in criminal case preparation and the lack of adequately trained off icials have further hampered the criminal enforcement process. The GOI has also passed the Drugs and Cosmetics (Amendment) Act, 2008 w hich enhances the penalties for any adulterated and spurious drugs. The Drugs and Cosmetics (Amendment) Act, 2008 w ill also create specialized courts to hear cases under the Act. India w as considering legislation to establish a special Commercial Division Bench in all of its 21 High Courts w hich w ould have jurisdiction over IP disputes. How ever, this bill w as off icially w ithdraw n during the Winter 2011 Parliamentary Session due to problems w ith its scope and implementation. IPR enforcement at the border in India is improving. In order to empow er Customs Officials to seize goods infringing intellectual property rights at the border w ithout having to obtain an order from the court, Indian Customs Authorities have promulgated the Intellectual Property Rights (Imported Goods) Enforcement Rules, 2007. The Customs authorities have also initiated a records system that w ill allow rights holders to record their patent, trademark, copyright, design or GI registrations. It w ill also allow rights holders to request the suspension of clearance of potentially infringing goods. The electronic records system is now available at all ports of entry in India and contains over 400 records. U.S. Patent and Trade Office (USPTO) representatives have an off ice w ithin the Foreign Commercial Service in the U.S. Embassy in New Delhi that focuses exclusively on intellectual property issues. This off ice is currently w orking w ith the GOI and industry to promote high standards of IP protection and enforcement. IP Resources A w ealth of information on protecting IP is freely available to U.S. rights holders. Some excellent resources for companies regarding intellectual property include the follow ing:
• For information about patent, trademark, or copyright issues -- including enforcement issues in the US and other countries -- call the STOP! Hotline: 1-866-999-HALT or register at http://w ww.stopfakes.gov/.
• For more information about registering trademarks and patents (both in the U.S. as w ell as in foreign countries), contact the US Patent and Trademark Office (USPTO) at: 1-800-786-9199.
• For more information about registering for copyright protection in the US, contact the US Copyright Off ice at: 1-202-707-5959.
• For US small and medium-size companies, the Department of Commerce offers a "SME IP Advisory Program" available through the American Bar Association that provides one hour of free IP legal advice for companies w ith concerns in Brazil, China, Egypt, India, Russia, and . For details and to register, visit: http://w ww.abanet.org/intlaw /intlproj/iprprogram_consultation.html
• For information on obtaining and enforcing intellectual property rights and market-specif ic IP Toolkits visit: http://w ww.stopfakes.gov/ This site is linked to the USPTO w ebsite for registering trademarks and patents (both in the U.S. as w ell as in foreign countries), the U.S. Customs & Border Protection w ebsite to record registered trademarks and copyrighted w orks (to assist customs in blocking imports of IP-infringing products) and allow s you to register for Webinars on protecting IP.
• The U.S. Commerce Department has positioned IP attachés in key markets around the w orld. Contact information for the IP attaché in New Delhi, India at: [email protected].
Due Diligence Return to top The U.S. Commercial Service emphasizes the need for exercising prudent procedures and practices in all international business transactions. Every U.S. exporter is advised to conduct comprehensive due diligence
on potential partners in any foreign market to meet obligations under the Foreign Corrupt Practices Act of 1977. Local Professional Services Return to top Please contact the CS India at off ice.new [email protected]. Web Resources Return to top U.S. Commercial Service: http://export.gov/india/index.asp American Chamber of Commerce, India: http://w ww.amchamindia.com/ U.S. India Business Council: http://w w w.usibc.com/ Confederation of Indian Industry: http://w w w.cii.in/ Federation of Indian Chambers of Commerce and Industry: http://w w w.ficci.com/ Indo-American Chambers of Commerce: http://w w w.iaccindia.com/ The Franchising Association of India, w ww.fai.co.in Reserve Bank of India: http://w ww.rbi.org.in/ Government of India Directory: http://goidirectory.nic.in/ Government of India Ministry of Finance: http://f inmin.nic.in/ Government of India Ministry of Commerce and Industry: http://commerce.nic.in/ Foreign Exchange Management Act http://w ww.rbi.org.in/scripts/fema.aspx CRISIL online (similar to the Better Business Bureau in U.S.): http://crisil.com/index.jsp The Times of India: http://timesofindia.indiatimes.com/ The Economic Times: http://economictimes.indiatimes.com/ Business Standard: http://w ww.business-standard.com/ The Financial Express: http://w ww.financialexpress.com/index.php Ministry of Defense, Instruction on Agents of Foreign Sellers: http://mod.nic.in/new addition/repagent.htm
Return to table of contents
Return to table of contents Chapter 4: Leading Sectors for U.S. Export and Investment
Commercial Sectors • Defense and Civil Aviation • Education Services • Environment and Water • Franchising • Healthcare and Medical Equipment • Transportation Infrastructure (Roads, Ports, Railw ays) • Mining and Mineral Processing Equipment • Plastics • Pow er and Renew able Energy • Travel and Tourism
Agricultural Sectors • Cotton • Tree Nuts and Dry Fruits • Wood Products • Fresh Fruits • Pulses • Vegetable Oil • Planting Seeds • Snack Foods • Hides and Skins
Defense
Overview Return to top The Government of India is responsible for ensuring the defense of India and every part thereof. The Supreme Command of the Armed Forces is vested in the President. The responsibility for national defense rests w ith the Cabinet. The Raksha Mantri (Defense Minister) is the head of the Ministry of Defense. The principal task of the Defense Ministry is to obtain policy direction from the government on all defense and security related matters and communicate them for implementation to the services headquarters, inter-services organizations, production establishments and research and development organizations. It is also required to ensure effective implementation of the government's policy directions and the execution of approved programs w ithin the allocated resources. The Ministry of Defense (abbreviated as MoD) is charged w ith coordinating and supervising all agencies and functions of the government relating directly to national security and the Indian armed forces (including Indian Army, Indian Air Force, Indian Navy) and the Indian Coast Guard (a component of the paramilitary forces of India) and has the largest budget of India's federal departments. The Ministry of Defense is comprised of four departments, Department of Defense Production (DDP), Department of Defense Research & Development (DDR&D) + (DRDO) and Department of Ex-Servicemen Welfare and also Finance Division Market Trends Return to top

The Indian defense sector is one of the fastest grow ing markets globally for acquisition of military hardw are and technology. India imports 70 percent of its armament needs and has now replaced China as the w orld’s leading importer of w eapons since 2011. Russia and Israel are the leading defense suppliers to India. Indian defense expenditures, w hich refers to the part of the budget that is spent on the acquisition of all types of military hardw are and technology, are expected to record a CAGR of 6.59 percent during 2010-15, to reach an annual amount of $ 42.6 billion by 2015. India's off icial defense budget received a 14 percent hike w ith a total of $3.7 billion for FY 2013-14.
Of the total allocation for India’s defense, the Army w ill get $1.8 billion (49 percent), the Navy $660 million (18 percent), the Air Force $1.05 billion (28 percent) and the Defense Research and Development Organization (DRDO) $192 million (f ive percent).
Strong grow th in this sector is attracting foreign original equipment manufacturers (OEMs) and leading players from the domestic private sector such as Reliance, Tata, Mahindra, L&T and Punj Lloyd to enter the market. To encourage foreign participation the Government of India (GOI) has allow ed Foreign Direct Investment (FDI) of 26 percent in the Indian defense sector. How ever, there is a general consensus in the government to eventually raise the FDI limit to 49 percent. The local defense production is met by the Ordnance Factories Board (OFB) consisting of Indian ordinance factories engaged in the production of arms, ammunition and other equipment for military and civilian applications. Headquartered at Ayudh Bhaw an, Kolkata, it consists of 41 factories, nine training institutes, three regional marketing centers and four regional controllers of safety. OFB is the w orld’s largest government operated production company and the oldest industrial organization run by the GOI. It has a total w orkforce of about 164,000. It is often called the "Fourth Arm of Defense" and the "Force behind the Armed Forces" of India. The type of products produced by the ordnance is very diverse, ranging from various small arms to rockets, bombs, grenades, military vehicles, armored vehicles, chemicals, optical devices, parachutes, mortars, artillery pieces plus all associated ammunition, propellants, explosives and fuses.
With a core focus tow ards indigenization of defense production, steps have been taken at both central and state levels. The focus has been w ith the establishment of Special Economic Zones (SEZ) for manufacturing purposes. As an example, the state of Karnataka has set up a defense manufacturing zone in Chitradurga district and an aerospace park in Bangalore, w ith an objective to invite aerospace and defense manufacturing companies to have their presence in the state. The district already has become an attractive destination for defense manufacturing as the Indian Space Research Organization (ISRO), the Defense Research and Development Organization (DRDO) and the Bhabha Atomic Research Centre (BARC) have set up facilities. The Indian Institute of Science (IISc), based in Bangalore, has established a second campus in the district focused on research. More state specif ic initiatives to encourage local manufacturing for defense are expected.
Opportunities Return to top The Indian market is particularly promising for U.S. suppliers seeking joint-venture opportunities. U.S f irms can consider partnering w ith major Indian industrial houses such as the Tata Group, Ashok Leyland, Mahindra Group, the Kirloskar Brothers, Larsen and Toubro, Walchandnagar, and Wipro. All of these companies have diversif ied into the defense sector, forming joint ventures w ith foreign companies for both strategic and produce-specif ic projects.
The private sector has been playing a signif icant role in the defense industry as sub-contractors and ancillary industry, and suppliers of raw materials, semi-f inished products, parts and components to defense PSUs, ordnance factories, base w orkshops of the army, base repair depots of the air force, and the dockyards of the navy.
(Million) 2011 (estimated)
2012 (estimated)
2013 (estimated)
2014 (estimated)
Total Market Size 570 770 900 1200
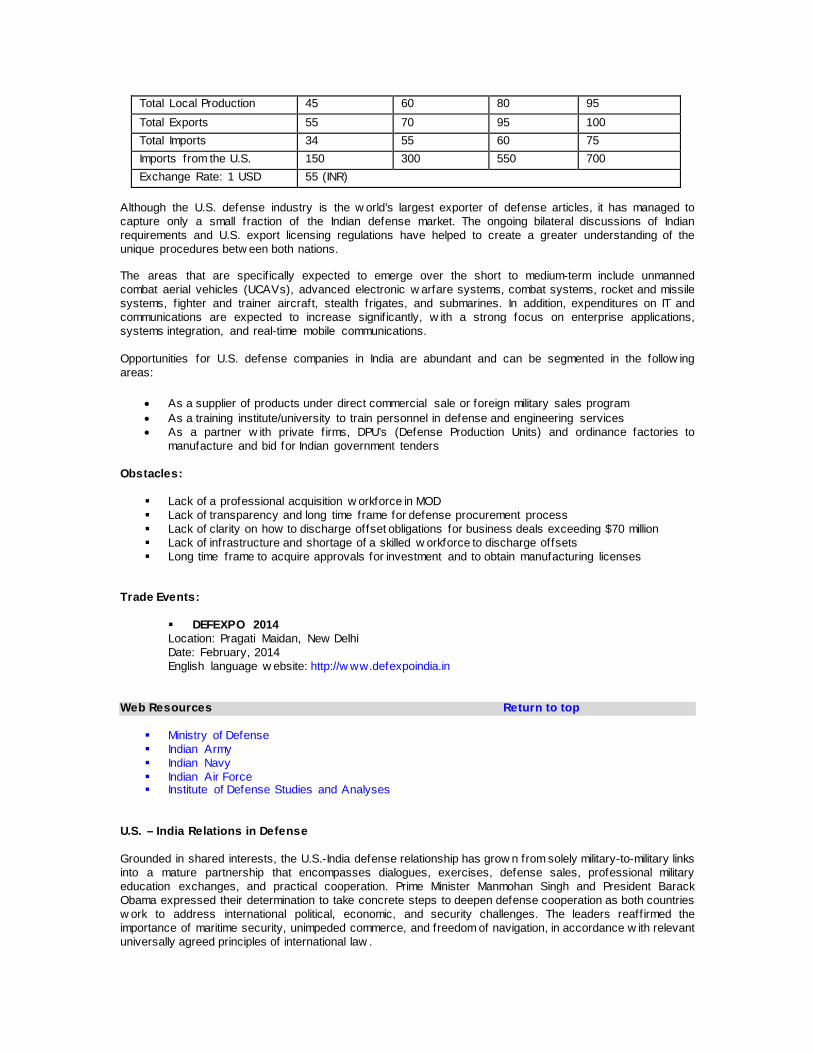
Although the U.S. defense industry is the w orld’s largest exporter of defense articles, it has managed to capture only a small fraction of the Indian defense market. The ongoing bilateral discussions of Indian requirements and U.S. export licensing regulations have helped to create a greater understanding of the unique procedures betw een both nations. The areas that are specif ically expected to emerge over the short to medium-term include unmanned combat aerial vehicles (UCAVs), advanced electronic w arfare systems, combat systems, rocket and missile systems, f ighter and trainer aircraft, stealth frigates, and submarines. In addition, expenditures on IT and communications are expected to increase signif icantly, w ith a strong focus on enterprise applications, systems integration, and real-time mobile communications. Opportunities for U.S. defense companies in India are abundant and can be segmented in the follow ing areas:
• As a supplier of products under direct commercial sale or foreign military sales program • As a training institute/university to train personnel in defense and engineering services • As a partner w ith private f irms, DPU’s (Defense Production Units) and ordinance factories to
manufacture and bid for Indian government tenders Obstacles:
Lack of a professional acquisition w orkforce in MOD Lack of transparency and long time frame for defense procurement process Lack of clarity on how to discharge offset obligations for business deals exceeding $70 million Lack of infrastructure and shortage of a skilled w orkforce to discharge offsets Long time frame to acquire approvals for investment and to obtain manufacturing licenses
Trade Events:
DEFEXPO 2014 Location: Pragati Maidan, New Delhi Date: February, 2014 English language w ebsite: http://w ww.defexpoindia.in
Web Resources Return to top
Ministry of Defense Indian Army Indian Navy Indian Air Force Institute of Defense Studies and Analyses
U.S. – India Relations in Defense Grounded in shared interests, the U.S.-India defense relationship has grow n from solely military-to-military links into a mature partnership that encompasses dialogues, exercises, defense sales, professional military education exchanges, and practical cooperation. Prime Minister Manmohan Singh and President Barack Obama expressed their determination to take concrete steps to deepen defense cooperation as both countries w ork to address international political, economic, and security challenges. The leaders reaff irmed the importance of maritime security, unimpeded commerce, and freedom of navigation, in accordance w ith relevant universally agreed principles of international law .
Total Local Production 45 60 80 95 Total Exports 55 70 95 100 Total Imports 34 55 60 75 Imports from the U.S. 150 300 550 700 Exchange Rate: 1 USD 55 (INR)
For more information about export opportunities in this sector contact U.S. Commercial Service, Senior Commercial Specialist, Jitender Jassal at: [email protected] Civil Aviation Overview Return to top India is the ninth biggest aviation market in the w orld. In terms of domestic traff ic, India is the fourth largest in the w orld behind the United States, China and Japan. Despite these numbers, India is one of the least penetrated air markets in the w orld (even low er than Sri Lanka, Pakistan and Nigeria) w ith 0.02 trips per capita as compared to 0.2 of China and 2.2 in the U.S. This reflects signif icant potential for future grow th. The Indian aerospace sector ranks among the w orld’s most dynamic. Boeing estimates that India w ill spend $130 billion to purchase 1150 aircraft by 2030. India has a total of 128 airports, out of w hich 15 are international airports, eight are custom airports w ith limited international operations, 80 are domestic airports and 25 are civil enclaves in defense airf ields. The Airports Authority of India (AAI) manages all the airports except Delhi, Mumbai, Hyderabad, Cochin and Nagpur, w hich are managed under a public private partnership (PPP) framew ork. The AAI controls India’s approximately 2.8 million nautical square miles of airspace. The AAI develops and manages airports and also provides air traff ic management services and air infrastructure. The traff ic at Indian airports has increased at a rate of 15.3% over the last nine years – primarily led by high grow th in domestic traff ic. In year 2010-2011 passenger air traff ic reached 143.3 million, and during the same period Indian airports handled 2.3 million MT tons of cargo. Starting from a relatively small base, the civil aviation sector in India faces the prospect of signif icant expansion as the overall economy recovers and India continues its fast rate of grow th. Market Size Return to top For a country of more than one billion people w ith a sizeable middle class that can afford air travel, the size of the aviation sector is relatively small. While the U.S. has on average 50,000 commercial scheduled aircraft movements per day, India has a little over 3,800 each day. Furthermore, much of the traff ic f low is located in the f ive major cities of the country: Mumbai in the West; Delhi in the North; Bangalore and Chennai (Madras) in the South; and Kolkata (Calcutta) in the East. India is ideally positioned as a major aviation hub at the crossroads betw een Europe, the Middle East and Asia Pacif ic. The fact that aviation w as a neglected sector for so long has allow ed airports such as Dubai and Singapore to effectively establish themselves as offshore hubs for Indian passengers, and they now have a signif icant head start. How ever, as India’s airports improve, and its airlines receive international aw ards for their service, there may be an opportunity to leverage its huge home market to compete w ith these longer established hubs. India has been successful in modernizing its largest airports through PPP w ith foreign participation – Delhi, Mumbai, Bangalore, Hyderabad and Cochin. Expansion is underw ay at other major airports – Chennai and Kolkata. The Hyderabad International Airport has been ranked among the w orld’s top f ive in the annual Airport Service Quality (ASQ) passenger survey along w ith airports at Seoul, Singapore, Hong Kong and Beijing. The Hyderabad International Airport is managed by a public-private joint venture consisting of the GMR Group, Malaysia Airports Holdings Berhad and both the State Government of Andhra Pradesh and Airport Authority of India (AAI). Maintenance, Repair and Overhaul (MRO) opportunities exist for servicing 1,000 commercial aircraft and 500 GA aircraft. MRO facilities are also expected to need additional ground support equipment. Both Boeing and Airbus have decided to invest in MRO facilities. Industry sources estimate that establishing a w orld class MRO w ill require an investment of over $250 million. MRO business is estimated to grow at 10 percent annually and reach $1.2 billion by 2013 and $2.4 billion by 2020. Airlines in India currently outsource major checks and aircraft servicing to MRO hubs like Singapore, Malaysia and Dubai. Worldw ide trends exhibit the gradual move tow ards third party MROs. Nearly half of U.S. based airlines’ maintenance is outsourced to MROs and 45 percent of military maintenance is outsourced to civilian MROs. Both

government and private players have evidenced keen interest in this area w ith the intention of providing reliable and cost-effective maintenance services to all Indian carriers. The aerospace sector in India is in the early stages of development and most of the domestic demand is being met through imports. Hence, opportunities for the U.S. aviation companies in the Indian aviation industry are abundant in the areas of technology, raw material development capabilities, international airw orthiness certif ications, developing skills, and providing f inancing. The present market size for airport and ground support equipment is estimated to be $440 million. Successful privatization of airport maintenance and ground support services w ill lead to another $100 million in market grow th over the next three years. The most promising sub-sectors in the airport equipment and ground-handling services continue to be technology-driven communication and ground services. The AAI has an annual budget of approximately $100 million for procurement of equipment, w hich is dependent on foreign technology. Airport Growth Beyond Metro Areas Return to top To ensure that the development of the sector w as not restricted to the metro cities alone, the GOI announced its plans to modernize 35 non-metro airports into w orld-class entities at an estimated cost of $1.2 billion. The airports to be modernized include Coimbatore, Tiruchi, Thiruvananthapuram, Visakhapatnam, Port Blair, Mangalore, Agatti, and Pune. The Ministry of Civil Aviation has also approved greenfield airports at Navi Mumbai, Goa, Durgapur, Kannur, and Saras. Upcoming Opportunities Return to top Investment opportunities of $ 110 billion are being envisaged up to 2020 w ith $80 billion in new aircraft and $30 billion in development of airport infrastructure, according to the Investment Commission of India. The Indian Ministry of Civil Aviation is also addressing other important issues that w ill result in long-to-medium term opportunities for U.S. companies. These opportunities include decreasing the systematic cost in the sector and determining the appropriate mechanism for providing air services to remote and commercially unviable sectors as part of a comprehensive long-term civil aviation policy. The Airport Economic Regulatory Authority (AERA) Bill w as passed by the Indian Parliament to ensure that India’s aviation infrastructure meets cost, eff iciency, and service targets by making policies consistent w ith the International Civil Aviation Organization (ICAO) standards. Some notable developments are:
• Indian Aerospace companies are grow ing. Hindustan Aeronautics Limited (HAL) w as ranked 40th in Flight International’s list of the top 100 aerospace companies last year.
• Aircraft manufacturing major Boeing is in the process of setting up a $100 million proposed Maintenance Repair Overhaul (MRO) facility in Delhi. Air India is also in the process of launching a Cargo Hub in Nagpur, w hile Deccan Aviation has already started one from the city.
• Modernization of Kolkata and Chennai airports are currently ongoing w ith a budget of $900 million.
• City side development of major airports. This includes hotels and other passenger related amenities.
• An Aerospace and Precision Engineering Special Economic Zone w ith a proposed investment of $641.2 million is being built at Adibatla, Ranga Reddy district, Andhra Pradesh.
• Augmentation of CNS/ATM system including ATFM, implementation of PBN, modernization of MET services and netw orking of civilian/military radars.
U.S. – India Relations in Civil Aviation Return to top U.S. – India relations in civil aviation are at an all-time high w ith regular exchanges at the highest levels by respective governments. U.S. exports of civil aviation equipment and services comprise over 15 percent of total U.S. exports to India.

The Ministry of Civil Aviation and the Federal Aviation Authority (FAA) of the United States meet regularly through the Joint Aviation Steering Committee. FAA also maintains an off ice at the U.S. Embassy in New Delhi. In 2007, The U.S. and India Aviation Cooperation Program (ACP) w as established at the initiative of the Department of Transportation and the Ministry of Civil Aviation. The ACP is a Public Private Partnership (PPP) betw een the U.S. Federal Aviation Administration (FAA), the U.S. Trade and Development Agency (USTDA), U.S. Commercial Service, U.S. companies, and the Government of India. U.S. companies are encouraged to become members of ACP to better explore and exploit opportunities in the Indian civil aviation sector. In 2010, civil aviation w as added as a new sub-committee under the High Technology Cooperation Group (HTCG). The HTCG w as constituted in 2002 and provides a forum for the tw o governments to promote and facilitate bilateral commerce in high technology sectors, including defense and strategic trade,biotechnology, and nanotechnology. The sub-committee meets periodically under the leadership of U.S. Department of Commerce and Indian Civil Aviation Secretary Zaidi to discuss mutual areas of cooperation in airport infrastructure. Resources Return to top For more information about export opportunities in this sector contact Jitender Jassal at [email protected]. Useful Links include: Ministry of Civil Aviation: http://w w w.civilaviation.gov.in Airports Authority of India: w ww.airportsindia.com Director General of Civil Aviation: http://dgca.nic.in Aviation Cooperation Program (ACP): w ww.acp-india.com
Education Services Overview Return to top India has one of the largest systems of higher education in the w orld. There are 568 universities in the country, including 291 state universities, 130 deemed universities (a status of autonomy granted to high performing institutes and universities by the Department of Higher Education), 42 central universities (established by the Department of Higher Education), 145 private universities, and 52 institutes of national importance, such as Indian Institute of Technology (IIT), and Indian Institute of Management (IIM). In addition, there are private and accredited universities, institutions created by an act of Parliament, independent institutes and over 16,000 colleges. Together they offer a w ide range of degree and diploma programs. Source: http://www.ugc.ac.in/stateuniversity.aspx Higher education in India is regulated by the University Grants Commission (UGC), All India Council of Technical Education (AICTE) and other councils established under applicable statutes for the regulation of education in specif ic f ields. Some of the councils and the specif ic f ields that they govern include Council of Architecture, Pharmacy Council of India, Indian Nursing Council, Medical Council of India, and Distance Education Council. Higher education institutions operating in India for at least 10 years can be conferred w ith a special status of ‘deemed universities’ (DUs) upon satisfying prescribed criteria. DUs have degree granting pow ers. AICTE is also the nodal body regulating the entry and operation of foreign universities / institutions in India. Market Data Return to top Higher education has alw ays been accorded a high priority status in the Indian society. The Government of India (GOI) aims to increase gross enrollment ratio in higher education to 30 percent by 2020, w hich means almost tripling the enrollment from 14 million to 47.2 million at a CAGR of 18 percent. The government has started programs to ensure continual supply of students for higher education programs. India has a severe shortage of higher education institutions for its booming population w here more than 30 percent of its 1.1 billion people are less than 14 years old. It is also generally accepted know ledge that quality of education varies w idely among Indian institutions. To meet the needs and to prepare its large youth population for tomorrow ’s careers, India does not have suff icient capacity. If India is to meet its goals, an additional 1,000 universities and 50,000 colleges are needed. India offers substantial opportunities for U.S. universities and other institutions of higher learning to establish programs and curriculum in India. Experts estimate the Indian education market at a potential value of $28 billion. United States - The chosen destination: India is primarily a “graduate market” for U.S. institutions interested in attracting students. With the mushrooming of international schools in the country and the return to India of many U.S. citizen children born to Indian American parents, w e anticipate an increase in interest in undergraduate study in the years to come. In the 2011/12 academic year, 100,270 students from India w ere studying in the United States (dow n 3.5 percent from the previous year). India is the second leading place of origin for students coming to the United States. Students from India make up approximately 13.1 percent of the total foreign student population in the Unites States. Academic Level: The majority of Indian students study at the graduate level. In 2011/12, their breakdow n w as as follow s:
Student Level Percentage of Total Students Undergraduate 13% Graduate 58.9% Other (Executive education) 1.5% OPT (Optional Practical Training) 26.7%
Note: Study abroad figures from Open Doors reflect credit given by U.S. campuses during the survey year to their students who studied abroad in the academic year just completed, including the summer term. Study abroad in 2011/12 will be reported in Open Doors 2012, once credit is awarded by the home campus. Source: Open Doors: Report on International Educational Exchange, published annually by IIE with support from the U.S. Department of State's Bureau of Educational and Cultural Affairs. For more information, including press releases on foreign students in the U.S. and U.S. study abroad, and FAQs, including definitions of foreign students and foreign scholars, visit www.iie.org/opendoors Competition for U.S. schools from other countries: American institutions have been losing signif icant market share to rivals from other countries, especially the United Kingdom and Australia. The United Kingdom, Australia, Canada and New Zealand have been aggressively promoting their programs in India. They have been actively participating in many education fairs and fully utilizing local education consultants as their marketing representatives to recruit students. Opportunities Return to top U.S. educational institutions can participate in the Indian education market in tw o w ays: by recruiting Indian students for their programs, or by creating educational exchange programs through joint ventures w ith Indian institutions. At present, foreign schools are not permitted to set up campuses and issue degrees in India. Sub-Sector Best Prospects Return to top The best prospects for the U.S. schools w ishing to attract Indian students or partner w ith an Indian school are as follow s:
i. Business and management ii. Engineering and Applied Sciences iii. Computer Science and IT iv. Social Sciences v. Physical and Life Sciences vi. Humanities vii. Medicine and Healthcare
(The prospects listed above are in the area of recruitment of India students and not for establishment of programs by the U.S. schools.) Of all these specialties, engineering and business education offer the best opportunities for the U.S. schools as they provide high-quality and comprehensive programs that have global brand recognition and enable high degree of global mobility. Regulatory Framework Foreign Institutions Return to top Entry of Foreign Entities
While 100% FDI in companies engaged in higher education is allow ed on the automatic approval route, regulatory issues have constrained the actual f low of FDI. The major bottle-necks have been the “not for profit principle” and lack of clarity on existing regulations. AICTE prohibits foreign investment either directly or indirectly in the sponsoring entity.
AICTE regulations for Foreign Universities
AICTE has in place regulations for foreign universities /institutes w hich propose to collaborate / enter into tw inning arrangement (w here a student does part of the course in India and part overseas) in technical education. The broad features of these regulations are:
• Franchising is not permitted. • Fee/seats are prescribed by AICTE. • Degree/institution to be recognized in the home country • Compliance w ith aff irmative action mandatory • For degree granting institutions, aff iliation w ith Indian University mandatory
Foreign University Campuses – Legislation Awaited
The Foreign Educational Institutions (regulation of entry and operations) Bill has been pending in Parliament since 2010. Key features of the Bill are:
• Institution should ow n the Campus • Franchising is not permitted • Prior Central government approval mandatory • Embassy to certify antecedents of the university • Reservation prevailing in the country should be applicable • Fee and admission policy w ill be regulated • No profiteering/commercialization allow ed • Some relaxations for universities of excellence if they fulf ill certain conditions • Requirement of a deposit of $10 million as corpus fund
U.S. and Indian Government Initiatives in Education Sector Obama-Singh 21st Century Knowledge Initiative: The Obama-Singh 21st Century Know ledge Initiative, launched in 2010, creates a path for higher education partnerships betw een U.S. and Indian institutions. Both governments have pledged $5 million for this endeavor, w hich w ill fund university linkages and junior faculty development. A Joint Working Group (JWG) w ith three members each from the United States and India has been constituted for implementation. The program has the follow ing broad components:
- Faculty Development - Academic Leadership Programs - Development of Community Colleges - Enhancing Institutional Linkages
The Office of U.S. - India Higher Education Cooperation (USIHEC) is a recent addition to United States – India Educational Foundation (USIEF). It has been established through an initiative of the U.S. Department of State's Bureau of Education and Cultural Affairs. USIHEC engages institutions of higher education in the United States and in India to foster and enhance linkages betw een them. It seeks to deepen institutional ties in numerous w ays: collaborative research, study abroad programs, faculty exchanges and conferences of higher education administrators from both countries. USIHEC administers the Obama-Singh 21st Century Know ledge Initiative Aw ards and maintains a database of Indo-U.S. Educational Collaborations. The off ice also provides briefings to visiting delegations of U.S. academics and administrators w ho are exploring India for further understanding of the Indian higher education system. Similar briefings are also provided to Indian academics and administrators seeking to strengthen academic partnerships w ith U.S. institutions. http://w w w .usief.org.in/Institutional-Collaboration/Obama-Singh-21st-Century-Know ledge-Init iat ive-Aw ards.aspx Web Resources Return to top For more information on opportunities in this sector contact U.S. Commercial Service - Industry Specialist – Sathya Prabha at [email protected] Useful links United States – India Educational Foundation w ww.usief.org.in Ministry of Human Resource Development (MHRD) w ww.education.nic.in University Grants Commission (UGC) w ww.ugc.ac.in All India Council of Technical Education (AICTE) w ww.aicte.ernet.in Central Board of Secondary Education (CBSE) w ww.cbse.nic.in National Institute of Open Schooling (NIOS) w ww.nos.org National Council of Educational Research and Training (NCERT) w ww.ncert.nic.in National Assessment and Accreditation Council (NAAC) w ww.naac-india.com India Gandhi National Open University (IGNOU) w ww.ignou.ac.in Distance Education Council (DEC) w ww.dec.ac.in Association of Indian Universities (AIU) w ww.aiuw eb.org National Board of Accreditation of AICTE w ww.nba-aicte.ernet.in
Environment and Water Overview Return to top It is estimated that 30-40 percent of India’s industrial units produce sizeable quantities of pollutants. There are about 3 million small-scale units in the country and most of these are not using any pollution control equipment. The Government of India has classif ied 17 industrial sectors as strong pollutants. India is one of the largest and one of the fastest grow ing producers of greenhouse gases. India’s pollution control equipment industry is grow ing at 10-12 percent annually, largely because of government initiatives and a proactive judiciary. Local production is limited to mainly standard, relatively low -tech equipment. Over thirty percent of market demand is met by imports. Germany, U.K., Japan, Canada, Australia, Netherlands, and Italy are among the major suppliers. The United States is the market leader for imports, having over 30 percent market share. Most of the leading international companies operate in India now . Until recently, the environmental goods and services sector used to refer to solutions for air, noise and marine pollution, land and w ater contamination, environmental analysis and consultancy, w aste management, and recycling. Now it also includes renew able energy technologies such as hydro, w ave and tidal pow er, geothermal, w ind and biomass, and emerging low -carbon activities like reduced emissions from the transport and construction sector, nuclear energy, energy management, carbon capture and storage, and carbon f inance. Some of the important environmental sectors include: w ater supply & w aste w ater treatment; solid w aste management; air and noise pollution; environmental goods and services; renew able energy, and clean development mechanism and carbon abatement technologies. The total market size is estimated to be over $8 billion, w ith renew able and energy eff iciency sectors capturing over 50 percent of the market share. Unit: USD million 2011 2012 2013
(estimated) 2014
(estimated) Total Market Size 6720 7390 8100 8500 Total Local Production 4700 5170 5900 6300 Total Exports 680 780 1300 1600 Total Imports 2700 3000 3500 3800 Imports from the U.S. 810 1270 1100 1150 Exchange Rate: N/A Total Market Size = (Total Local Production + Total Imports) – (Total Exports) The Indian pollution control equipment industry is unorganized and dominated by small-scale industrial f irms lacking the resources to invest in research and development. There are a few medium and large Indian engineering companies offering services and equipment as part of turnkey consulting services. For example, the w ater sector can be split into three categories: • Large players like VA Tech Wabag, Degremont, Hindustan Dorr-Oliver, Paramount, Ion Exchange, Thermax • Medium sized players like Doshion, Aquatech, Fontus Water, Driplex, TEAM, Ions Hydro • Over 500 small players The Ministry of Environment and Forest governs this sub sector and it has allocated a budget of over $300 million for pollution abatement. The private sector has been investing substantially in environmentally friendly production processes and accounts for nearly half of demand in this segment. Poor enforcement of environmental law s is a key reason for the low market potential compared to developed countries. But w ith grow ing aw areness about effects of pollution, and overall industrial and economic grow th, the demand for pollution control equipment is expected to grow steadily. Imports constitute over thirty percent of the total market share. Unlike other sectors, multi-lateral and bi-lateral agreements on ecology and the environment play a major role in this sector. This results in an increased demand for imported pollution control equipment, because donor-led investments normally require international quality equipment that is not manufactured in India. Multinational corporations w ith manufacturing facilities in India insist on the
replication of technology for pollution control. This often requires imports. The United States has traditionally enjoyed a dominant position in the market, w ith over 30 percent of market share. In some segments such as air pollution control equipment, imports from the United States constitute almost 40 percent of total imports.
The market has undergone a lot of change in the last few years. In the w ater sector today, there are a dozen medium-sized companies w hich have rapidly increased their operations and w on a number of projects. Also hundreds of small system integrators have formed all over the country, addressing local requirements. There has also been a geographical decentralization. In the last few years, many international majors have also entered the market. Indigenous development of various treatment vessels like resins, RO membranes and vessels have reduced costs and made various technologies easily available on a mass-scale. The other interesting trend in the market has been the move tow ards standardization of treatment systems as standard DM and RO plants have become more common over the last tw o years. Sub-Sector Best Prospects Return to top Most promising sub-sectors in pollution control equipment include (for the next 3-5 years): Sub Sector Grow th Energy Eff iciency and Renew able Energy 12% Water and Wastew ater Management 14% Air Pollution Control 8% Water is the most promising sub-sector. India’s w ater and w astewater market has grow n at a compounded annual grow th rate of 14 percent from 2000-2010. Frost & Sullivan research has indicated that the market earned revenue of over $1.2 billion in 2011. The business is almost equally split betw een the government and the private sector, but the industrial sector is grow ing at a higher rate than that of the municipal sector. The research indicates that pow er, food and beverage, pharmaceuticals, refineries and textiles are generating immense opportunities in the w ater and w astewater treatment equipment market. These industries prefer advanced treatment technological systems such as reverse osmosis (RO) membranes for treating their w astewater and their grow th is expected to drive equipment sales. Municipal w ater and w astew ater treatment is gaining importance, as the usage of disinfection systems such as ultraviolet, ozone, and electro chlorination is minimal in municipal w ater treatment plants at present. Market know ledge and skills have been increasing in recent times. For example, the w ater treatment market is gradually shifting from chemical treatment and DM plants to membrane technology. The concepts of w astewater recycling and zero discharge systems are grow ing quickly. Opportunities Return to top The business opportunity in air pollution control lies w ith the red category polluting companies such as cement, steel, iron and pow er industries. Ambient air quality monitoring for cities is also an area of major opportunity. In the w ater sector, the government sector is primarily involved in raw w ater treatment and sew age treatment operations. On the other hand, the private industrial sector includes equipment for clarif ication, sludge treatment, aeration, disinfection and f iltration. Conventionally, the market has used demineralisers for treatment. How ever, over the last few years, reverse osmosis technology has grow n in the market and gradually replaced DM. New er technologies like ultrafiltration and electrodialysis are also entering the market now . Some international companies in the w ater sector w ith a signif icant presence in India: • Veolia Water, France • Degremont, France • VA Tech Wabag, Austria • Thames Water, United Kingdom • GE Water, United States • Dow Chemicals, United States of America • Dupont, United States of America • Grundfos Pumps, Denmark

• KSB Pumps, Germany • Nalco Chemicals, United States of America • Drew treat Chemicals, United States of America • Krohne Marshall, Germany • Endress + Hauser, Germany • Emerson (Fisher Rosemount), United States of America • Koch Group, United States of America • Hydranautics, United States of America • Pentair Group, United States of America • Schlumberger / Actaris, France • Amiantit, Saudi Arabia • Netzsch, Germany • George Fischer • Aplaco, Saudi Arabia • Metrohm, Sw itzerland Web Resources Return to top For more information about export opportunities in this sector contact U.S. Commercial Service Industry Specialist: Arup Kumar Mitra at [email protected] Ministry of Environment and Forests http://w w w.envfor.nic.in Central Pollution Control Board http://w w w.cpcb.nic.in/ The Energy and Resources Institute (TERI) http://w ww.teriin.org Environmental Information System – ENVIS: India http://envis.nic.in/ Asian Development Bank http://w w w.adb.org World Bank http://w w w.worldbank.org

Franchising
Overview Return to top India is w itnessing an unprecedented consumption boom. While the rest of the w orld still faces the impact of the economic slow dow n, India is grow ing at approximately six percent per year. This has led to a population of over 300-350 million middle-income Indians w ith disposable incomes. This group continues to fuel the consumption demand in India. The many factors that contribute to increasing consumption include the emergence of a young urban elite population w ith increasing disposable income, changing lifestyles, mounting aspirations, penetration of satellite TV, increasing appetite for w estern goods, international exposure, options for quality retail space, and greater product choice and availability. The greater demand for goods in India is in turn generating a greater demand for franchises. Domestic Market A report by the Federation of Indian Chambers of Commerce and Industry estimates that over 30 percent of new food outlets, w hich are opening in almost all the cities across the country, are through the franchise system. As much as 17 percent of food and beverage outlets in the organized sector are operated by franchisors in the country. At present, there are 1,200 franchisors out of w hich 150 are exclusively covering food and beverage retail, 75 percent of w hich are of Indian origin and the rest are international. There are about 18,000 franchised restaurants in the country, and out of these 2,500 are managed by company-ow ned franchisors. A majority of the company-ow ned franchisors are engaged in food franchising. Other important sectors using a franchising business model are beauty salons and cosmetics, business services, apparel, education, food and beverage, retailing, and tours and travel. The biggest challenge for the franchise industry in India is that the government has not recognized it as a small business facilitator, unlike the United States. How ever, on December 16, 2009, the Government of India announced a liberalized policy, w hich removed the cap on royalty payments and government approvals. Prior to this change, businesses w ere required to obtain approvals for payments in excess of $2 million on one-time fees and f ive percent on ongoing fees. With these hurdles cleared, more U.S. franchises are expected to seek opportunities in India. Sub-Sector Best Prospects Return to top The top prospects for franchising include: food, education, retail, beauty salons/cosmetics, business services, apparel and travel/tourism.
Opportunities Return to top Since economic liberalization in 1991, India has w itnessed extensive grow th in the number of new businesses in the country. As a business model, franchising is ideally suited for Indian entrepreneurs. India has a vast pool of entrepreneurial energy and talent, and a pressing need for increasing self -employment and other employment opportunities. With the Indian economy recording a sustained annual GDP grow th rate of 5-6 percent, and the burgeoning Indian middle class promising to drive up nominal retail sales by 10 percent per year until 2015, the market is ripe for a franchising boom. Currently, the franchise market in India is estimated to be $3.3 billion. Franchising in India is grow ing at an impressive rate of approximately 30 percent. Over 1,200 franchise systems are already operating in India, and approximately 25 of these systems are run by international companies. How ever, these systems still represent a very small piece of the overall retail pie. As the Indian market matures to the level of other developed economies, organized retailing w ill increase its presence as noted above. Franchising is expected to grow its share w ithin retailing until it represents 50 percent of overall organized retail trade. Web Resources Return to top Reserve bank of India: http://w ww.rbi.org.in Franchising Association of India: http://w w w.fai.co.in/ Indian Brand Equity Foundation: http://w ww.ibef.org Government of India Ministry of Finance: http://f inmin.nic.in/

For more information about market opportunities in this sector, contact the U.S Commercial Service Industry Specialists in the follow ing cities: Mumbai - Aliasgar.Motiw [email protected] New Delhi –[email protected] Bangalore –[email protected] Chennai –[email protected] Hyderabad –[email protected] Kolkatta – [email protected]

Healthcare and Medical Equipment Return to top Overview The Indian healthcare sector is experiencing rapid change. Though this change has been under w ay for many years it has become signif icantly visible in the last decade, w ith a renew ed thrust from both the government and a grow ing market for healthcare services and products. The Indian healthcare industry w as estimated at around $78 billion in 2012 and expected to reach $280 billion by 2020, on the back of increasing demand for specialized and quality healthcare facilities. The market is highly fragmented and dominated by private players. The industry is rapidly developing and is being fueled by large investments from existing corporate hospital chains and new entrants backed by private equity investors. This grow th w ill be driven by healthcare facilities, public-private projects, medical diagnostic and pathological laboratories, and the health insurance sector. In addition, changing demographics, disease profiles and the shift from chronic to lifestyle diseases in the country has led to increased spending on healthcare delivery. The Indian population of 1.2 billion people is grow ing at a rate of 1.6 percent per year. A grow ing old age population above 100 million, w ith rising incidence of lifestyle diseases, combined w ith rising incomes and affordability and increased penetration of health insurance are fuelling grow th of the industry. How ever, considerable challenges exist in terms of service accessibility and patient care quality. As such, government support w ould inherently play a signif icant role in the overall development and grow th of the sector. Various innovative models are being explored to improve their performance and profitability, viz. telemedicine, specialty centers and day care centers. High upfront investments, long gestation periods, and rising real estate costs are compelling private players to innovate w ith business models and to expand into under penetrated tier II & III cities. As a result, these private players can capitalize on the opportunity to expand. The private sector is likely to contribute 80-85 percent of the $86 billion healthcare investment required by 2025. Health insurance is gaining high momentum in India. Gross health insurance premiums have increased at a CAGR of 30 percent from $733.9 million in 2006-2007 to $2.1 billion in 2010-2011. Penetration as a percentage of GDP has risen from 0.08 percent in 2008-2007 to 0.12 percent in 2010-11. This penetration of health insurance w ill signif icantly increase the affordability of healthcare services for the population. Several private insurance companies have entered the market and have empanelled hospitals to provide cashless treatment to subscribers of insurance companies. In India, healthcare is provided through primary care facilities and secondary and tertiary care hospitals. While the f irst tw o categories are fully managed by the government it is the tertiary care hospitals that are ow ned and managed either by the government or private sector. The private sector’s contribution to healthcare has been grow ing at a faster pace than government. The medical infrastructure market is estimated to have a grow th rate of 15 percent. Both the government and private sector are planning several new specialty and super-specialty hospital facilities, as w ell as planning to upgrade existing hospitals. India currently faces a chronic shortage of healthcare infrastructure, especially in rural areas and tier II and tier III cities, and it is expected that India w ill have a potential requirement of 1.75 million new beds by the end of 2025. The opportunity also exists for overseas organizations to set up hospitals in India through FDI. The new specialty and super-specialty hospital facilities depend on the import of high-end medical equipment, accounting for over 65 percent of the entire market. There is a need for sophisticated hospital equipment, especially operation theatre products. In view of the relatively low customs duty rates (9.2 to 15 percent) combined w ith an increasing number of healthcare centers specializing in advance surgery, India offers opportunities for the direct supply of high-technology, specialized medical equipment, products and systems.
The boom in medical tourism in the Indian healthcare sector is encouraging hospitals and hoteliers to strike alliances w ith each other. Presence of w orld-class hospitals and skilled medical professionals has strengthened India’s position as a preferred destination for medical tourism. According to industry estimates, the medical tourism market is expected to expand at a CAGR of 27 percent to reach $3.9 billion in 2014, up from $1.9 billion in 2011.

E-healthcare/telemedic ine, though in its infancy in India, is beginning to take root. Most public hospitals (funded by state governments) and private single and multi-super specialty hospitals have purchased customized hospital management systems and other medical based IT products. Given the poor availability of quality healthcare facilities outside the large and second tier cities, telemedicine is expected to become a viable business proposition.
To ensure quality healthcare, in October 2005, the Government of India increased the list of medical devices covered under the Drugs and Cosmetics Act of 1940, bringing fourteen categories of implantable devices under regulatory control. These include hypodermic syringes and needles, stents, heart valves, catheters, intra-ocular lenses, hip and knee implants, in vitro diagnostics devices, and bone cements. An approved central licensing authority must license these devices for manufacture, sale or distribution. Hospitals are also seeking quality accreditations like JCI, NABH and ISO. Unit: USD millions M edical Devices & Equipment
2011 2012 2013 (estimated)
2014 (estimated)
Total M arket Size 4186 5189 6272 7719 Total Local Production 513 520 527 534 Total Exports 62 75 91 110 Total Imports 3735 4744 5836 7295 Imports from the U.S. 454 499 (Est.) 549 604 Total Market Size = (Total Local Production + Total Imports) – (Total Exports) Data Sources: Statistical data are unofficial estimates from trade sources and industry. As this industry has not been well documented in the Indian context, the estimates of industry size vary significantly across different sources. Imports from the U.S.: United States Census Bureau Sub-Sector Best Prospects The most promising sub-sectors in the healthcare and medical equipment sector are: Medical Infrastructure Medical and Surgical Instruments Medical Imaging Electro Medical Equipment Orthopedic and Prosthetic Appliances Cancer Diagnostics Ophthalmic Instruments and Appliances Dental Equipment Opportunities The grow ing demand for quality healthcare and the absence of matching delivery mechanisms pose a challenge and certainly a great opportunity. In Infrastructure – building, equipping, managing and f inancing of super specialty hospitals in India via FDI is another area for future grow th. A proper supply of equipment and medical consumables w ill also be an area w ith signif icant opportunity for U.S. companies. Several leading U.S. purveyors of hospital equipment and supplies have opened Indian operations to cater to this grow ing market. Health insurance and hospital administration is another area in w hich U.S. companies can make a difference. This opportunity includes introducing and maintaining industry standards, and also classifying and certifying healthcare centers. Other grow th areas include diagnostic kits, reagents and hand-held diagnostic equipment. Imports constitute 50 percent of this market. Hand-held/portable diagnostic equipment (e.g., for blood sugar and blood pressure testing) is also a fast grow ing segment because India has around 45 million diabetics, a f igure expected to sw ell to 70 million by 2025.
Web Resources For more information about export opportunities in this sector contact U.S. Commercial Service Industry Specialist: Ruma Chatterjee at [email protected] Useful Links include: Central Drug Standard Control Organization (CDSCO) http://w w w.cdsco.nic.in Ministry of Health and Family Welfare (MOHFW) http://mohfw .nic.in/ Indian Medical Association http://w w w.ima-india.org The Medical Council of India (MCI) http://mciindia.org The Federation of Obstetric and Gynecological Societies of India http://w w w.fogsi.org The Association of Indian Medical Device Industry http://w w w.aimedindia.com/

Infrastructure (Roads, Ports, Railways) Overview Return to top The total investment in all ten infrastructure-related sectors during the recently completed Government of India’s (GOI) Eleventh Plan (2007-2012) totaled approximately $400 billion or about 7.2 percent of the GDP of w hich 37 percent w as sourced from the private sector. Of the total overall infrastructure investment, $156 billion w as spent on the development of roads, railw ays and ports w ith the private sector accounting for one-fif th of investment. Most of the private participation w as in the form of public–private partnerships. According to the revised estimates of the GOI Planning Commission, the Tw elfth Plan (2012 -2017) estimates a 50 percent contribution from the private sector out of a total plan outlay of approximately one trillion dollars. The 12th Plan projects $200 billion in spending on roads and bridges, $100 billion on railw ays and $32 billion on ports. India requires f inancing options, the latest technology, equipment, raw materials and technical services for building modern roads, high speed rail netw ork, freight corridors and large ports. Several U.S. companies are already w orking w ith Indian infrastructure developers primarily in the design and planning stages. How ever, signif icant scope remains for new companies to enter the market. Roads and Bridges: Roads and bridges account for 65 percent of freight and 85 percent of passenger traff ic in India. India’s road netw ork of 4.2 million km, including 76,000 km of national highw ays, is the second largest in the w orld. Passenger traff ic is projected to grow at 12-15 percent annually, w hile cargo traff ic w ill see grow th in the range of 15-18 percent. In order to attract private sector investment in road infrastructure, the Indian government allow s 100 percent FDI in the road sector. The GOI also bears the cost of feasibility studies, land, relocation of utilities, and environmental clearances. Among other subsidies are the subsidies of up to 40 percent of the total cost of the project, 100 percent tax exemption during any 10 consecutive years w ithin 20 years from the commissioning of the project, duty free importation of high capacity and modern road construction equipment, and the right to retain toll fees. The apex body for national road construction is the National Highw ay Authority of India (NHAI). In budget year 2012-13 NHAI is expected to issue tenders for the construction of 10,000 km of roads under the PPP model. GOI plans to establish National Expressw ay Authority of India, w hich w ill have a mission to oversee the construction of 1,000 km of expressw ays nationw ide. Railways: India’s plans for its railw ays include 25,000 km of new lines, 12,000 km of double tracks and 30,000 km of multiple tracks. Additionally, 14,000 km of lines w ill be electrif ied. In the near future, Indian railw ays w ill require 50 w orld-class stations, 280,000 w agons, 50,000 passenger coaches and 10,000 locomotives. All the metro rail projects in the country have been undertaken either by private entities, or through the PPP model including the follow ing:
• dedicated eastern and w estern freight corridors w ith high speed, high axle load and modern technology at a cost of $5 billion; and
• four out of six identif ied high speed rail corridors to provide bullet train services operating at 250-350 kmph for 3,539 km of total track length.
Many large foreign companies such as Siemens, Mitsubishi, and Bombardier are competing for numerous rail projects, the total size of w hich is estimated at $60 billion, such as rolling stock manufacturing plants, multi-modal logistics parks, cold -chain and port connectivity. Ports: India boats a long coastline of 7,500 km w ith 13 major more than 100 minor ports, w hich handle 90 percent of India's foreign trade by volume and 70 percent by value. The major ports handle about 75 percent of the cargo traff ic w ith tw o largest ports – Mumbai Port and Jaw aharlal Nehru Port Trust processing about 60 percent of India's container traff ic. Altogether, the Indian ports handled over one billion tons of cargo in 2011. Indian ports are dogged by congestion due to high turnaround time. Since most of the major ports operate at 100 percent capacity, an improvement in eff iciency w ill only be achieved through modernization of the cargo handling processes and introduction of state of the art technologies. Shipping lines continuously look for increasing size of vessels, w ithout dredging of the Indian ports. Another major deficiency in the ports infrastructure is poor connectivity to the existing transportation netw orks.
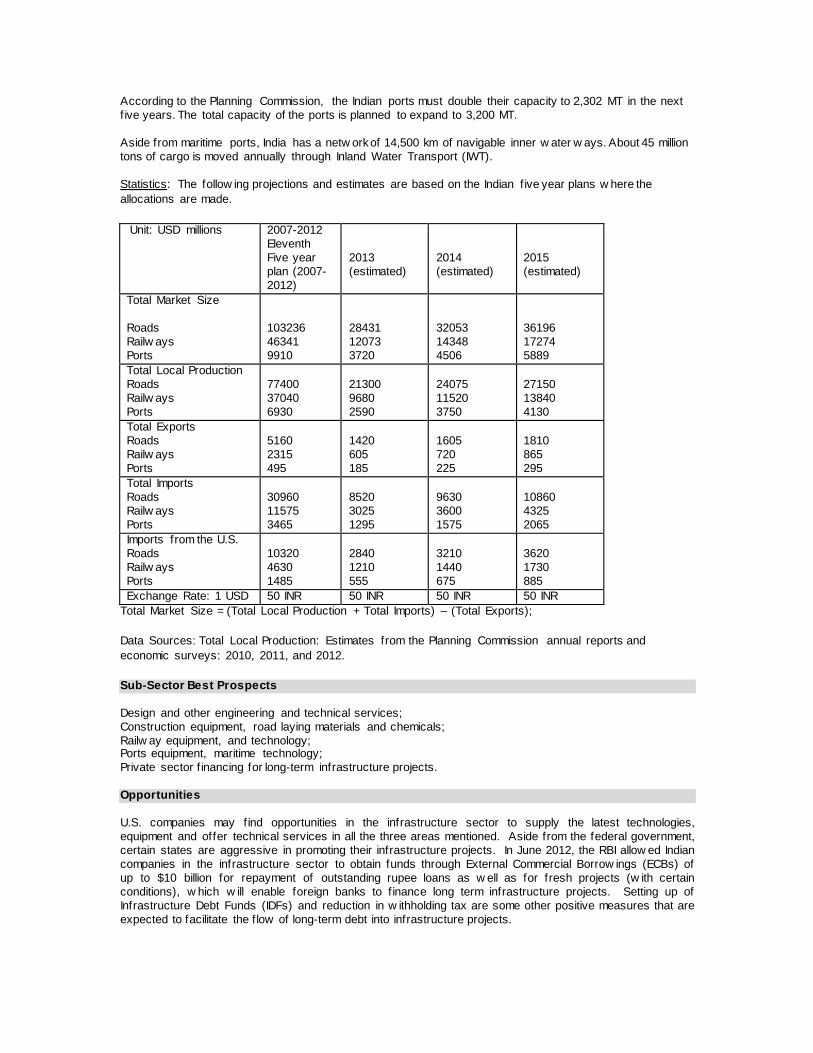
According to the Planning Commission, the Indian ports must double their capacity to 2,302 MT in the next f ive years. The total capacity of the ports is planned to expand to 3,200 MT. Aside from maritime ports, India has a netw ork of 14,500 km of navigable inner w ater w ays. About 45 million tons of cargo is moved annually through Inland Water Transport (IWT). Statistics: The follow ing projections and estimates are based on the Indian f ive year plans w here the allocations are made.
Unit: USD millions 2007-2012 Eleventh Five year plan (2007-2012)
2013 (estimated)
2014 (estimated)
2015 (estimated)
Total Market Size Roads Railw ays Ports
103236 46341 9910
28431 12073 3720
32053 14348 4506
36196 17274 5889
Total Local Production Roads Railw ays Ports
77400 37040 6930
21300 9680 2590
24075 11520 3750
27150 13840 4130
Total Exports Roads Railw ays Ports
5160 2315 495
1420 605 185
1605 720 225
1810 865 295
Total Imports Roads Railw ays Ports
30960 11575 3465
8520 3025 1295
9630 3600 1575
10860 4325 2065
Imports from the U.S. Roads Railw ays Ports
10320 4630 1485
2840 1210 555
3210 1440 675
3620 1730 885
Exchange Rate: 1 USD 50 INR 50 INR 50 INR 50 INR Total Market Size = (Total Local Production + Total Imports) – (Total Exports);
Data Sources: Total Local Production: Estimates from the Planning Commission annual reports and economic surveys: 2010, 2011, and 2012.
Sub-Sector Best Prospects Design and other engineering and technical services; Construction equipment, road laying materials and chemicals; Railw ay equipment, and technology; Ports equipment, maritime technology; Private sector f inancing for long-term infrastructure projects. Opportunities U.S. companies may f ind opportunities in the infrastructure sector to supply the latest technologies, equipment and offer technical services in all the three areas mentioned. Aside from the federal government, certain states are aggressive in promoting their infrastructure projects. In June 2012, the RBI allow ed Indian companies in the infrastructure sector to obtain funds through External Commercial Borrow ings (ECBs) of up to $10 billion for repayment of outstanding rupee loans as w ell as for fresh projects (w ith certain conditions), w hich w ill enable foreign banks to f inance long term infrastructure projects. Setting up of Infrastructure Debt Funds (IDFs) and reduction in w ithholding tax are some other positive measures that are expected to facilitate the f low of long-term debt into infrastructure projects.
Web Resources For more information about export opportunities in this sector contact U.S. Commercial Service Commercial Off icer James Golsen at [email protected] Useful Links include: Planning Commission, Government of India: http://infrastructure.gov.in/ National Highw ay Authority of India: w ww.nhai.org/ Indian Ports Association: http://ipa.nic.in/ Indian Railw ays: http://w w w.indianrailw ays.gov.in/ Infrastructure Conferences: http://w w w.indiainfrastructure.com/conf.html Indian Road Congress: http://irc.org.in
Mining & Mineral Processing Equipment
Overview Return to top India possesses signif icant mineral resources. The country’s mining sector employs over one million people and produces 87 different minerals. Its 2,649 mines are divided as follow s: 573 coal mines; 553 metallic minerals and 1,523 non-metallic minerals. India ranks among the top ten global producers for the follow ing metallic minerals: mica, barites, coal and lignite, iron ore, chromite, bauxite and manganese. India ranks third in w orldw ide production at 554 Million Metric Tons (MMT) in 2011-12 and consumption 649 MMT in 2011-12 of coal and lignite. The value of mineral production in India from April 2011- March 2012, excluding atomic minerals, w as approximately $38 billion, w hich show s a decrease of about 1.02 percent over the previous year. The decline in the value of mineral production is due to the restriction on exports as w ell as temporary discontinuance of mining due to lack of environmental clearances. About 51 MMT of coal w as imported during 2011-12 to bridge the shortfall of domestic production. The total estimated production during 2012-13 is 580.30 MMT and the estimated demand during the same year is 772.84 MMT. To bridge the gap betw een supply and demand, total projected coal imports are estimated at 142.93 MMT during 2012-13. Coal accounts for approximately 52 percent of the country's energy needs. Annual demand for coal is projected to be over 2 billion MT by 2032. The country has a potential coal-bearing area of approximately 17,303 sq. kilometers, of w hich only about half has been partially explored. India’s Investment Commission estimates that investment opportunities, valued at $30-40 billion, w ill be available over the next ten years to explore and develop new coal mines, manufacture and sell state-of-the-art mining equipment and technology, and to create related infrastructure for the off-take of mined coal. At present, coal is transported ineff iciently due to poor road and rail connectivity. The Indian market for mining and mineral processing equipment is estimated at over $3 billion. 80 percent of this is in the coal mining sector. Opencast mines contribute 88 percent of the total production, but there is a renew ed focus on underground mining. A number of large opencast mines, those w ith more than 10 million MT per annum capacity, are in operation. With the focus on increased productivity and private investment in mining, India is expected to become a major market for advanced mining equipment and technology from the United States, Australia, and Germany. A few large manufacturers in each product segment dominate the mining equipment industry. Most of the global technology leaders are present in India as joint venture companies, or have set up their ow n manufacturing facilities or marketing companies. The industry has made substantial investments in the recent past to set up manufacturing bases. Among Indian companies, Bharat Earth Movers Limited (BEML) is the largest and has licensing agreements w ith international collaborators. The Indian Mining and Construction Equipment (MCE) industry has over 200 players, w ith the top ten players accounting for over 75 percent of industry revenues. The Indian market is characterized by the presence of almost all the major international OEMs (Caterpillar, P & H, Komatsu, JCB) as w ell as Indian companies such as BEML, ACE and Escorts. The industry comprises a w ide array of products, namely, backhoe, w heeled loaders, hydraulic excavators, mobile cranes, dumpers, dozers, drills, and continuous miners, among others. The backhoe loader is the largest segment in unit terms, accounting for over 40 percent of industry volumes follow ed by hydraulic excavators (about 20 percent) and mobile cranes (about 15 percent). The revenue share of the industry is, how ever, skew ed by the relative cost and tonnage of equipment sold w ithin each category. Although the country has a fairly large domestic manufacturing base, the demand for direct imports of advanced equipment and technology is grow ing, particularly in coal mining. Government-ow ned mining companies are the biggest buyers. Moreover, the large domestic manufacturers have foreign licensing agreements, w hich allow indirect import of the critical components for local assembly and incorporation in the indigenous equipment. There is also an opportunity to directly participate in the mining services market, through operating coal beneficiation plants as w ell as new or abandoned underground mines on contract. The demand for such services is particularly high for the new coal block lessees in the private sector. There is also a grow ing market for clean coal technology, such as coal bed methane extraction, coal gasif ication and coal to liquid projects. Ancillary services such as w ater and air pollution and hazardous w aste management, as w ell as consulting for acquisition of mines in foreign countries provide additional opportunities.

Imports of low cost equipment: Indian mining companies are also importing low cost mining equipment from countries like China. Having a much larger domestic manufacturing base and a huge domestic market compared to India, Chinese equipment manufacturers have the competitive advantage of being signif icantly cheaper than the Indian equipment. A number of Chinese companies, including crane manufacturers like Zoomlin and w heel loader manufacturers like Sany, have already established a presence in India. They have manufacturing facilities, sales off ices or marketing partnerships w ith Indian companies for selling their products here. A rough estimate suggests that mining and construction machines from China have a market share of about 12 percent in the w heeled loader segment, around 13 percent in the bulldozer segment and a strong presence in the market for concrete mixers. How ever, the low cost of buying Chinese equipment is offset by w arranty and after sales service issues. To address these concerns, some Chinese manufacturers have initiated service partnerships w ith local established mining equipment manufacturers in India or set up their ow n service w orkshops. Although the domestic buyers are cautious about concerns related to quality and the availability of long-term after-sales service of Chinese equipment, future trends could be largely determined by the success of local partnerships in addressing these concerns. The longevity of such low cost equipment is also doubted by Indian customers and the resale value of the Chinese equipment is currently low . From marketing and customer service perspectives, U.S. companies should take advantage of their ability to compete on providing higher quality equipment, stronger w arranty support, spares and after sales service to demonstrate long-term commitment to Indian customers. Estimated size of mining equipment in India: Unit: USD millions 2010 2011 2012 2013
(estimated) 2014
(estimated) Total Market Size 2400 2750 3000 3200 3400 Total Local Production 2150 2400 2700 2900 3100 Total Exports 400 450 450 450 475 Total Imports 650 750 750 750 775 Imports from the U.S. 260 300 300 300 315 Exchange Rate: 1 USD Total Market Size = (Total Local Production + Total Imports) – (Total Exports) Data Sources: Total Local Production: Total Exports: Total Imports: Imports from U.S.: Statistical data are unoff icial estimates from various trade sources; 2013 & 2014 f igures are estimates. Demand for service and spares to increase in importance: For a majority of manufacturers, about 15 percent of revenue is earned from the sale of spares and services. This enables the manufacturers to sell their goods initially at a competitive price w hile earning more in the service contracts - a life cycle approach to profitability. How ever, at current levels, the contribution to revenues in the domestic market from spares and services contracts remains low , because there is a relatively small amount of equipment in the market to service and due to the availability of non-OEM spares. Although the lifecycle for equipment averages around seven years, in India one can f ind equipment that is over 20 years old and still functional. Spares for undercarriages, buckets and bucket teeth have to be replaced faster based on surface and usage w hile engines, transmissions and axles have to be overhauled after 4-5 years of use. Hence, there is a strong potential for annual maintenance contracts (AMCs) and an aftermarket for spares. Coal India Limited (CIL), the largest buyer of mining equipment in India, has standardized the practice of soliciting bids on the basis of equipment and seven year maintenance contracts (MARC). Pre-owned and rental equipment markets are still in their nascent stages: Although there is good potential for sales of used equipment in India, the market size of w hich is estimated at about three times the primary market, the country does not have an established common platform for trading in used equipment. There are also concerns about the import of used equipment, regarding quality and service/ availability of spares. The Indian government is considering a move to regulate the import of pre-ow ned mining equipment. The domestic manufacturers support this move. They argue that price competitiveness is not a major factor as India is perhaps one of low est priced market in the w orld. Analysis has show n that the price point for a new piece of equipment manufactured and marketed in India is in many instances equivalent to the cost of a tw o- to four-year old piece of used equipment sourced from the global market. Importing a 15-
year-old machine also includes older technology w hich may not be as eff icient and unlikely to meet emission and safety norms. Rental companies have perhaps a greater dependence on imports for specialty equipment like piling rigs, foundation drilling, or heavy lif ting equipment w hich are not currently manufactured here. The key equipment found in India’s rental f leet includes backhoe loaders, pick-and-carry (PNC) cranes, excavators, motor graders and vibratory compactors. The rental f irms are too dependent on imported equipment. The current rental market for earthmoving equipment in India is about 7-8 percent. In comparison, the global standard is about 50-80 percent. An average of 30 percent of the equipment sold in Europe, and over 60 percent in the U.K., goes to rental operators. A developed rental market ensures reduction in investment in projects by outsourcing the equipment requirement (including spares and services) and improving capacity utilization of equipment. There are a few major organized players in the Indian mining equipment rental market including Quippo Infrastructure Equipment Limited, Sanghvi Movers Limited (for cranes), ABG Infralogistics Limited, GMMCO Limited and TIL Limited (TIL-for Caterpillar equipment). Usually these companies have a large f leet of over 100 machines. How ever, the market continues to be serviced mainly by small f leet ow ners w ith less than 10 pieces of equipment each. Sub-Sector Best Prospects Return to top Coal India (CIL), a large government-ow ned conglomerate, plans to signif icantly enhance its production and productivity in the next f ive years. It is expected to invest heavily in large and specialized mining equipment and services, including long-w all loaders and draglines, jumbo drills, continuous miners, high-w all miners, pow ered support systems, excavators, shovels and rock cutters, mineral screening/ w ashing/crushing/grinding systems, mine safety systems, underground communication and safety systems. In keeping w ith the current emphasis on clean energy options, India w ill also purchase coal beneficiation, underground coal gasif ication, coal to liquid, coal bed methane and coal mine methane technologies. Services such as geophysical surveys on coal seams and consulting for acquisition of new mines at international locations w ill be in demand. In addition to new equipment, some of India's private developers of mines are also interested in exploring the possibility of getting used or reconditioned equipment at a reasonable cost. There is a strong interest in joint ventures w ith large, international mine operators to explore virgin mines in India. CIL mines more than 80 percent of India's coal reserves. Along w ith its eight subsidiaries, it is the largest buyer of coal mining equipment in the country. CIL runs a large f leet of nearly 6,000 heavy earthmoving machineries (HEMM), including 41 draglines, 670 shovels, 3,200 dump trucks, 1,000 dozers and 600 blast-hole drills. On average, CIL has purchased equipment valued at over $2 billion every year and announced capital expenditure plans w orth $6 billion to signif icantly augment its production capacity in the next f ive years. This includes plans for setting up 20 new coal preparation plants w ith a capacity of 111 MMT w ith an estimated capital outlay of $510 million. India’s estimated shortfall of thermal coal in 2015 is 189 MMT- 50 percent of the projected demand. Indian pow er, steel and cement companies are aggressively scouting for coal assets abroad to secure long term coal supply. Opportunities Return to top CIL is the largest company in India in terms of coal production. The company offers both investment and export opportunities for U.S. companies in the mining sector. It is also actively seeking to buy coal assets abroad, in the United States and elsew here. Details of various CIL tenders and investment opportunities, as w ell as its procurement processes are available at http://w w w.coalindia.in/. Tw o other government-ow ned companies in South India – Singareni Collieries Ltd. in Andhra Pradesh and Neyveli Lignite Corporation in Tamil Nadu -- are important end users of coal mining equipment. In the private sector, Tata Iron & Steel Company Ltd. (TISCO) in Jamshedpur, Jharkhand continues to be a major buyer of equipment for its captive coal mines. India's private sector pow er utility companies like Reliance, Adani, RPG Group, Jindal and Tata are also w orking on projects to develop, ow n and operate captive coal mines w hich w ill require the latest technology and equipment. The captive mine lessees are under pressure from the government to start mining coal from the virgin coal blocks leased to them in recent years. These mine ow ners w ill resort to mining contractors to start production of coal in the near future.
NMDC Limited is India’s largest iron ore producer and exporter, mining about 30 MMT from its three fully mechanized mines. Under expansion plans, the company aims to produce 50 million MT by 2015. It is also in a diversif ication mode, acquiring new mining leases in iron ore, coal and diamonds. Other large mining companies in India include Essel Mining, Rungta Mines, Orissa Minerals Development Company, Vedanta Resources, Hindalco, Nalco and Steel Authority of India. Given the recently liberalized Mineral Policy of the government, and w ith private entrepreneurs investing in the mining industry here, the opportunity for U.S. f irms to enter the Indian market through joint ventures, technical collaborations and operating leases has grow n immensely. Government-ow ned mines contribute 75 percent of the total value of all mineral production. In the last decade, how ever, the economy has been liberalized, tarif fs low ered, state enterprises privatized and the country opened to investment in mineral exploration. It is the avow ed policy of the government to w ithdraw from non-strategic sectors. Accordingly, public sector undertakings are being privatized gradually. In the iron ore sector, the second largest mineral mined in India in terms of quantity, 70 percent of the mining is done by the private sector. Likew ise, private investment, including FDI, is being allow ed to mine and process most minerals. India now allow s 100 percent FDI in mining and exploration of non-core minerals like gold, silver, and diamonds. 100 percent FDI is also permitted in oil exploration and captive mining of coal and lignite. 50 percent FDI is permitted under joint venture w ith a public-sector unit. In coal processing (w ashing and sizing), 100 percent FDI is allow ed. Over 200 coal blocks have been allocated to various end-users. Of these, approximately 28 blocks have started production. Total production from captive mines in 2011 w as approximately 38 million MT. Web Resources Return to top For more information about export opportunities in this sector contact U.S. Commercial Service Industry Specialist Shantanu Sarkar at [email protected] Key websites: Ministry of Coal and Mines http://w w w.coal.nic.in; http://mines.nic.in Coal India Limited http://w w w.coalindia.in Mineral Exploration Corporation Ltd. http://w w w.meclindia.com/ Central Mine Planning & Design Institute http://w w w.cmpdi.co.in/ Indian Institute of Coal Management, Ranchi http://w w w.iicm-india.com/ Publications of Indian Bureau of Mines http://ibm.nic.in/publication.htm Department of Heavy Industry http://w w w.dhi.nic.in Customs Duty http://w w w.cbec.gov.in/ India Mining w ww.infomine.com/countries/india.asp Indian Bureau of Mines w ww.ibm.nic.in Federation of Indian Mineral Industries w ww.fedmin.com Directorate General of Mine Safety w ww.dgms.net NMDC Limited w ww.nmdc.co.in

Plastics Industry Return to top Overview
PLASTIC INDUSTRY
April to March 2010-11(million
tons)
April to March 2011-12 (million
tons)
April to March
2012-13
April to March 2013- 14
(million tons) (estimated)
(million tons) (estimated)
Total Market Size (polymer consumption) (Including Plastic Products Imports)
8.74 9.6 10.5 11.4
Total Local Production 5.3 6.2 7.2 8.4
Total Exports 1.4 1.7 1.6 1.5
Total Imports 3.5 3.4 4.0 3.8
Imports from the U.S. (million dollars)
$743.80
Exchange Rate: 1 USD $45.29 $46.30 53.04
India is South Asia’s leading market for plastics. This is one of the fastest grow ing plastics markets in the w orld, w ith a gross turnover of approximately $22 billion and annual grow th of 12 percent. Yet per capita plastic consumption of seven kilograms is 13 times less than that of the United States at 95 kilograms, nine times less than that of Europe (65 kilograms) and four times less than the w orld average (26 kilograms) – a clear indicator of the huge potential that the Indian market holds. The tremendous rate of consumption of plastics in almost every aspect of consumers’ daily lives underscores the critical importance of this industry to the economic grow th of a country. The greatest potential exists for commodity plastics – polyethylene (PE), polypropylene (PP), polyvinylchloride (PVC) and polystyrene. Some explanations of this are current low per-capita consumption, end use industry grow th, increasing urbanization and changing lifestyles w hich are creating a greater demand for use of plastics in a variety of products and packaging. Total annual polymer consumption in India from April 2010 to March 2014 is estimated at 10.06 million tons, registering a grow th of nearly one million tons per year. The demand for polymers during 2011-12 w as 8.5 million tons and estimated to grow by 10.4 to 10.5 percent per year. Therefore, the estimated demand during 2012-13 is 9.4 million tons, in 2013-14, 10.5 to 10.6 million tons and 11.5 million tons in 2014-15. These f igures are supported by domestic capacity additions in polymers w hich stand at 8.9 million tons in 2011-12. Capacity during 2012-13 is 9.5 million tons, 10.4 million tons in 2013-14 and 11.5 million tons in 2013-14. There is a slow dow n in capacity additions due to the global economic slow dow n and this could extend into 2014-15. How ever, the demand is likely to grow due to the creation of dow nstream processing capacity resulting from greater demand for packaging in retail, the automotive sector and telecommunications equipment manufacturing. In 2010-11, local production w as estimated at 5.3 million tons and is expected to increase 37 percent by March 2014 to 8.4 million tons. During the same period, imports are estimated to rise by 10 percent per year to 3.8 million tons. Betw een April 2010 and March 2014, the average annual f igures are estimated at 6.77 million tons (local) and 3.67 million tons for imports. Based on polymer consumption data, India’s estimated additional requirement for machines by 2014-15 w ould be nearly 7,100 units, involving an investment of over $1.2 billion. By 2016-17, the requirement is estimated to grow to nearly 8,200 units w ith an investment crossing $1.7 billion. Assuming a compound annual rate of grow th in the number of units of plastic processing machinery over the past f ive years, India’s estimated additional requirement of machines by 2014-15 w ould be nearly 9,900 units involving an investment of over $927 million. New machinery w ill contribute to more effective capacity utilization. India is w illing to spend on advancements in new technology, new product designs, high output machines and
energy eff icient equipment to replace older machines. New entrepreneurs entering the sector to invest in plants w ill favor this approach. By 2016-17, the requirement is estimated to grow to over 12,200 units w ith an investment crossing $1.4 billion. It is reasonable to assume that, in the coming years, India could emerge as the third largest consumer of polymers after the United States and China. The Market India’s market for polymers has registered 1.2 times India’s GDP average grow th of eight percent during the f irst four years of 11th Five Year Plan (2006 – 2011). India maintains signif icant regional diversity in consumption of plastics w ith the w est accounting for 47 percent, north states consuming 23 percent and southern India 21 percent. The huge demand and potential for the industry has resulted in generating large and steady investments, resulting in a massive increase in capacity though the industry faces criticism from environmentalists and lacks in technology. Imports of polymers have also increased sharply in the recent past. The most popular American polymers include polyethylene, polyacetals, polyethers and epoxide resins, polycarbonates, alkyds, polyallyl esters, and parings. In terms of total volume of major petrochemical end products, the consumption of polymers (plastics, polyethylene, polypropylene and polyvinyl chloride) increased from 61 percent to 69 percent betw een 2005 and 2010. Polymers consitute 70 percent of the end products of India’s petrochemical industry. Commodity polymers constitute 85 percent of the market share of the total polymer market and polypropylene and polyethylene account for 61 percent of market share of total plastic production. Because India has a deficit in commodity polymers (PE PP PS PVC), one-third of its demand is met through imports. There are a few compounding units of engineering plastic in India but the base polymers or resins are imported. As of 2010-11, the Indian plastic industry comprised over 23,000 plastic processing units, more than 97,400 processing machines and 23.7 MMT of installed processing capacity. In terms of the number and types of machines, more than 62 percent w ere injection molding units follow ed by 30 percent extrusion and eight percent blow molding. The sector employs w ell over three million people. The major share of this large scale employment comes from the dow nstream plastics processing sector. The Indian plastic processing industry has seen a shift from low output/low technology machines to high output, high technology machines. India needs to import high production and automatic blow molding machines, multilayer blow molding, stretch blow molding machines, specif ic projects involving high capex like PVC calendaring, multilayer f ilm plants for barrier f ilms, and multilayer cast lines, BOPP and nonw oven. Also required are multilayer blow n f ilm line up to 9/11 layers, automatic block bottom bags production lines, higher tonnage injection moulding machines >2000T and higher tonnage >500 T all electric injection molding machines. The scope of application for plastics has increased signif icantly over the years w ith more and more sectors using it. There are many social and economic reasons for the grow th such as developments in packaging applications, the infrastructure boom, modernization of agriculture, better healthcare facilities, improved lifestyle, disposable income and greater rural penetration for distribution of a variety of industrial and consumer products. With the boom in the auto sector, renew ed investment in consumer goods like housew are products, the economies of scale are expected to force the processing industry to increase investment in large size, energy-eff icient machines. For example, electric injection molding machines are increasingly becoming popular due to their energy eff iciency, greater cleanliness, quick start-up, better repeatability, and quiet operations. In spite of higher costs, the industry is investing in these machines. The industrial market has experienced consumer marked preference for imported used injection molding machinery of late. Opportunities Return to top Investment opportunities in plastic manufacturing equipment and supplies is estimated to reach $10 billion by 2020. In addition, the existing plastic processing capacities offer a signif icant potential for upgrade through introduction of innovative technologies. At present, imported machinery accounts for about 40 percent of overall sales. There are more than 50 global manufacturers from China, Taiw an, Japan, Europe and the United States w ith shares in India’s plastics machinery market. How ever, a steep rise in raw material costs resulting from an increase in crude prices may affect future profit margins in the industry.

Some of the areas offering the best investment prospects in the plastic industry are:
• World-class high capacity machines
• Enhanced design capabilities, molds, tolls and dies and technological know -how manufacturing and management practices w ith an eye for quality and design
• Development of new products and applications
• Technology consultancy and technology transfer
• Foreign direct investment in the dow nstream sector, including in special economic zones, w hich have beneficial tax regimes
Since India is the highest recycler of plastic, there is huge grow th potential for plastic recycling technology for PET bottles, recycling of automotive parts and reuse as blended w ith virgin material, recycling of e-w aste, recycling of plastic w aste to fuel, energy recovery route from plastic w aste (incineration), and use of PE & PP w aste for road construction. The estimated investment in local plant and machinery for the recycling industry is about $27 million. In the agriculture sector, plastic utilization in India is a mere one percent in comparison to seven percent in developed countries. Applications such as plasticulture, w ater management, nursery management, surface cover clutivation and controlled environment agriculture offer huge potential. Auto manufacturers in India are also w orking hard to increase the use of lightw eight materials to reduce cost and save w eight for fuel economy. The average amount of plastic used in a car in India is 70 kilograms consuming plastic to the tune of 320 KTA w hich is expected to grow three times over in the next f ive years. The Indian polymers industry is oligopolistic w ith only three large producers - Reliance Industries Ltd., Haldia Petrochemcial Ltd., the Gas Authority of India Ltd. and Indian Oil Corporation (commissioned in 2010-11). Major polymers produced in India are polythene, polypropylene and polyvinyl chloride. Current polymer capacities are mostly underutilized w ith operating eff iciencies varying from 66 percent to 86 percent. India has a 360,000 TPA production capacity of PS and EPS. How ever, all these facilities are based on imported styrene since there is no local production. In the case of engineering plastic, there is a signif icant opportunity in India. ABS and polucarbonate are in great demand in India. ABS has a 100,000 TPA production capacity, w hile PC base resins are imported, though there are a few compunding units of PC in India. Production capacity of polyamides is limited, w hile other major engineering plastics are being imported to meet domestic demand. With Reliance commencing operations in Jamnagar, Gujarat for PP and, Indian Oil Corporation (IOC) commissioning a plant in Panipat, Haryana for PP and PEs, it is expected that the demand/supply situation w ill be balanced for polyethylenes and there w ill be a surplus of PP in coming years. How ever, the capacity is still expected to be short for polyvinyl chloride and the deficit is likely to continue for several years. A joint venture betw een state-ow ned Hindustan Petroleum Corporation Limited (HPCL) and LN Mittal Group w ill commence operations soon at a refinery of 9 MMTPA (Million Metric Tonnes per Annum ) in Bathinda, Punjab to produce clean fuels and polypropylene by processing heavy, sour and acidic crudes. Similarly, GAIL’s capacity expansion at Auriya is expected to increase the supply of plastic in northern India. The West Bengal Industrial Development Corporation Limited, has launched a fully integrated industrial park for petrochemical dow nstream industries. Another poly park cluster project is under development in the port tow n of Haldia, 125 km from Kolkata. This park w ould serve dow nstream units of Haldia Petrochemicals Limited. Companies supplying raw material/equipment in India include Rohm and Haas, Connell Brothers, GE Silicon, Moserbaer, Honeyw ell, and Ferromatik Milacron. Buyers of plastics technology and equipment in India include A.G. Industries (Automotive), Xpro India Ltd (Films), Jain Irrigation, Supreme Plastics Ltd. , Essel Propack, UFlex Ltd., Machino Plastics Ltd., and Machino Polymers. Technology Sources – ABB; Lummus, USA; Honeyw ell (UOP) USA; DuPont, USA; Exxon Mobile, USA, and Shell USA, among others. Resources Return to top For more information about export opportunities in this sector, contact U.S. Commercial Service Industry Specialist, Nisha Wadhaw an at Nisha.Wadhaw [email protected].
Useful Links include: Ministry of Chemicals and Fertilizers http://chemicals.nic.in/ Planning Commission http://planningcommission.nic.in/ Chemicals & Petrochemicals Manufacturers Association of India http://cpmaindia.com/ PlastIndia Foundation http://w w w.plastindia.org All India Plastic Manufacturing Association http://w w w.aipma.net/ Federation of Indian Chamber of Commerce and Industries (FICCI) w ww.ficci.com
Power Generation and Clean and Renewable Energy
Overview Return to top With an existing population of over 1.2 billion, India has a grow ing energy demand and an increasing pow er deficit. In the last f inancial year against a peak demand of 135,453 MW, total pow er availability w as 123,294 MW, a deficit of 12,000 MW. Today, more than 57 percent of the pow er generation in the country comes from coal pow er plants. Due to the shortage in the supply of coal, its side effects, and lack of clean coal supply, the Government of India (GOI) is increasingly looking at w ays to generate more pow er through renew able energy resources. To achieve this goal, the GOI has designed and implemented certain policies and has attempted to provide a consistent and stable regulatory environment. As a result, in the last f ive years, the renew able energy segment registered a compound annual grow th rate of approximately 20 percent w hile the conventional pow er generation segment grew only about seven percent. By the end of October 2012, India had an installed renew able energy pow er capacity of 26 GW contributing 12.5 percent of the total installed capacity. The grow th has been particularly signif icant in the w ind and solar sectors. The number of players including developers, manufacturers, and service providers in the tw o segments has also seen unprecedented grow th. Market Trends Return to top The renew able energy sector has seen signif icant grow th and capacity additions in the past few years. While earlier renew able energy projects w ere undertaken primarily by corporations and small players, now the sector has seen the entry of a number of independent pow er producers (IPPs), energy majors and large conglomerates like CLP India, Infratech, Tata Pow er, Reliance, Adani Pow er, Lanco, Larsen & Toubro, Punj Lloyd and several pure-players like Welspun Solar, Azure Pow er, Sun Edison, Vikram Solar, SunBorne Energy, and Kiran Energy. Domestic manufacturing capacity has also been on the rise. In w ind, Gamesha, Leitner Shriram, and ReGen Pow ertech are some of the players that have forayed into manufacturing. Wind manufacturing capacity in India presently stands at 10,000 MW and is expected to go up to 14,000 MW by 2014. In solar, the market is dominated by joint ventures and technical collaborations w ith foreign f irms that specialize in solar products. Some of the major PV cell and module makers include Moser Baer Photovoltaic, Tata Pow er Solar Systems, Titan Energy Systems, Solar Semiconductor, Photon Energy, and Indosolar Limited. The current cell and module manufacturing capacity in India is 1,100 MW and 1,800 MW. This is expected to increase to 2 GW and 3 GW, respectively. Many foreign players have either entered or announced their intention of entering the Indian renew able energy space. This is a direct result of being successful in their ow n countries and the potential in this sector in India. In the w ind segment, existing players like Gamesha and Enercon are expanding their manufacturing and new players like Titan Wind Energy Pte. and Gestamp Wind Steel are also setting up w ind equipment production in the country. In the concentrated solar pow er (CSP) segment, given that domestic manufacturing capacity for solar blocks components is insignif icant, CSP developers have opted for partnering w ith one of the major foreign technology providers either through direct partnerships or through an EPC contractor. Opportunities Return to top Transmission and Distribution: The source of the pow er sector's ailments is the poor operational eff iciency of the State Electricity Boards (SEB). Due to subsidized tarif fs to residential and agricultural consumers, low investment in transmission and distribution (T&D) systems, inadequate maintenance, and high levels of distribution losses (about 20 percent in India), theft, and uncollected bills, the SEBs are continually in f inancial distress. The GOI has set a target to add 100 GW of generation capacity in the XII Five-year Plan period to fulf ill its promise of “Pow er to all.” For the expected boost in the pow er sector, major policy changes at the central and the state level are to be expected. The Central Transmission Utility (CTU) w as set up w ith the objective to create a national grid connecting all state and regional grids in the country. In the past, electricity w as supplied by generating stations to load centers. How ever, w ith increased pow er generation capacity, the need for a national grid w as felt for bulk pow er transmission betw een the f ive major regions of India w ith minimal losses. India now plans to connect all regional grids into a national grid by 2014 to improve transmission of pow er across the country. The $18 billion plan to build the grid to increase country's inter-regional transmission capacity and enhance transfer of pow er from surplus regions to deficit areas is now
being implemented. As of January 2011, India's pow er transfer capacity stood at 20,750 MW, falling short of the XI Plan Period target of 32,650 MW. India now has a total length of around 240,000 km of transmission lines. Pow er transmission in India w as restricted to central and state utilities until the year 2006. Private sector investment w as allow ed in the form of 100 percent private equity or as a 74 percent joint venture w ith the CTU. The huge capital required for building eff icient transmission infrastructure has attracted numerous domestic and international players. The GOI is now actively encouraging private sector participation in transmission through PPPs and has identif ied select projects for implementation through competitive bidding. Opportunities in transmission capacity exist in the development of the national grid and intra-state transmission lines, ultra mega transmission projects (of 16 GW), and transmission joint venture projects. Seven inter-state transmission projects have been aw arded to the private sector. In addition, global tendering processes for f ive additional projects w ith an aggregate capital expenditure of $1.2 billion are in various stages of aw ard. Encouraged by the success of the GOI, several state governments have also identif ied intra-state transmission lines for implementation under the PPP framew ork through the franchise route and three such projects have been aw arded in the past year. There are distribution franchise opportunities in Maharashtra, Madhya Pradesh, and several other states. The challenge before the sector is to build a strong integrated grid netw ork that w ill allow large transfers from one part of the country to the other. The PPP model has so far elicited a positive response from all stakeholders and is set to see increased traction in the XII plan w ith a strong pipeline of projects. For India to become an integrated pow er player, the private sector w ill have to play a crucial role in establishing state-of-the-art pow er evacuation infrastructure in the country. Renewable Energy: The Indian renew able energy market is estimated to be w orth over $28 billion as of October 2012, grow ing at an annual rate of 22 percent in value terms. Grid connected renew able energy capacity accounted for 26 GW or 12.5 percent of the total installed grid capacity as of October 31, 2012. In terms of actual energy contribution, renew able energy contributed approximately six percent of pow er generation in the country. The leading sources include w ind pow er, small hydro pow er, and bagasse-based cogeneration. Solar, w hich has the highest potential, has grow n rapidly in the last 1-2 years to increase its share from negligible levels to four percent. Some of the key drivers for the grow th in the renew able energy sector include an increased focus on energy security and diversif ication in energy portfolio, policy and regulatory support, a continued demand for pow er and persistent electricity deficits, an increasing competitiveness of renew able energy vis-à-vis conventional sources, rural and remote region electrif ication, and mitigating climate change impact. Several incentives and programs have been launched to attract investment in the renew able energy sector such as feed-in tarif fs and renew able energy certif icate trading. This has helped in increasing investor returns w hile renew able purchase obligation specif ications have provided an assured market for solar and non-solar renew able energy development. In the past, the generation-based incentives have also played a key role in encouraging serious investors in the renew able energy segment. The Jaw aharlal Nehru National Solar Mission of the central government and state level policies of Gujarat, Rajasthan, and Karnataka have helped attract unprecedented investments in the solar pow er sector.
• Solar Power: Development in this sector has been driven by the government’s f lagship Jaw aharlal Nehru National Solar Mission (JNNSM) and state policies. This has led to the execution of almost 1,050 MW of solar pow er capacity in the last tw o years. Almost 80 percent of this capacity w as commissioned during 2012. Solar capacity addition is expected to accelerate w ith new capacities allotted under JNNSM and state-level programs in Gujarat, Rajasthan, Karnataka, Tamil Nadu, Odisha, Madhya Pradesh, Andhra Pradesh, Punjab, and Kerala. Over 3,000 MW of solar capacity is expected to come on line this year.
• Wind Power: India’s total w ind-based installed capacity is close to 18 GW and thus contributes 70
percent to the total renew able based installed capacity. 2011-2012 w as a record year for the w ind industry w hich w itnessed the highest ever annual capacity installation of 3,197 MW. The states w ith the highest installations are Tamil Nadu, Maharashtra, Gujarat, Rajasthan, and Karnataka. But the market for new w ind plants seems to have slow ed dow n substantially in 2012-13. The subdued performance w as due to the economic slow dow n, the w ithdraw al of the accelerated depreciation scheme, and the uncertainty surrounding the generation based incentive scheme for

w ind ow ners for the XII plan period. Despite the current slow dow n, w ind pow er continues to remain a mainstay of India’s renew able energy sector.
• Biomass: India has abundant bioenergy resources but only 10 percent of the total potential has been achieved so far. The estimated pow er generation capacity from biomass, including paddy husk, is 17,732 MW. In comparison the existing capacity is just 1,785 MW. Despite proven and mature technology, the segment continues to lag behind in attracting investors’ interest mainly due to concerns relating to the availability and procurement of biomass/feedstock as w ell as its pricing. This is expected to be corrected w ith the launch of the much aw aited National Bio Energy Mission in 2013.
• Small Hydro Power (SHP): SHP is seen as one of the major energy solutions in the hilly regions of the country w hich have several w ater bodies w ith reasonable energy potential. India currently has an installed grid-connected SHP capacity of over 3,400 MW but the Indian government aims to develop half of the identif ied potential of about 19,749 MW in the next ten years and is supporting SHP deployment through capital subsidies and preferential tarif fs.
• Waste to Energy: The GOI has developed a National Master Plan for development of w aste to
energy in India. The GOI estimates that the potential to generate pow er from municipal solid w aste w ill more than double by 2020, w hile the potential from industrial w aste is likely to increase by more than 50 percent. In a country w ith high population density and limited landfill capacity, w aste to energy pow er generation is a major priority.
• Nuclear: There should be opportunities in providing equipment and technology to boost India’s nuclear pow er plants, but the process has slow ed because of the environmental and security concerns and continued concerns over potential liability exposure for suppliers of equipment and designs.
• Energy Efficiency: The market potential for industrial energy eff iciency products and services is
projected to be approximately $27 billion in 2018. Opportunities in eff iciency improvement include smart grid metering and smart grids, IT and operation improvement.
• Smart Grids: At present the smart grid market in India is in a nascent stage but is projected to grow rapidly w ith plans to install several million smart meters in the next few years.
• Green Buildings: India has emerged as one of the w orld’s top destinations for green buildings and has implemented a number of home-rating schemes and building codes, w hich open up a w ide range of opportunities for U.S. companies in the energy eff iciency sector.
Web Resources Return to top For more information about export opportunities in this sector contact U.S. Commercial Service Industry Specialist Renie Subin at: [email protected] Useful Links include: Ministry of Pow er: w w w .pow ermin.gov.in Ministry of New and Renew able Energy: w w w .mnre.gov.in Central Electricity Authority - http://w w w .cea.nic.in/ Indian Renew able Energy Development Agency - w w w .ireda.gov.in Confederation of Indian Industry: http://w w w .cii.in/ Federation of Indian Chambers of Commerce and Industry: http://w w w.ficci.com/
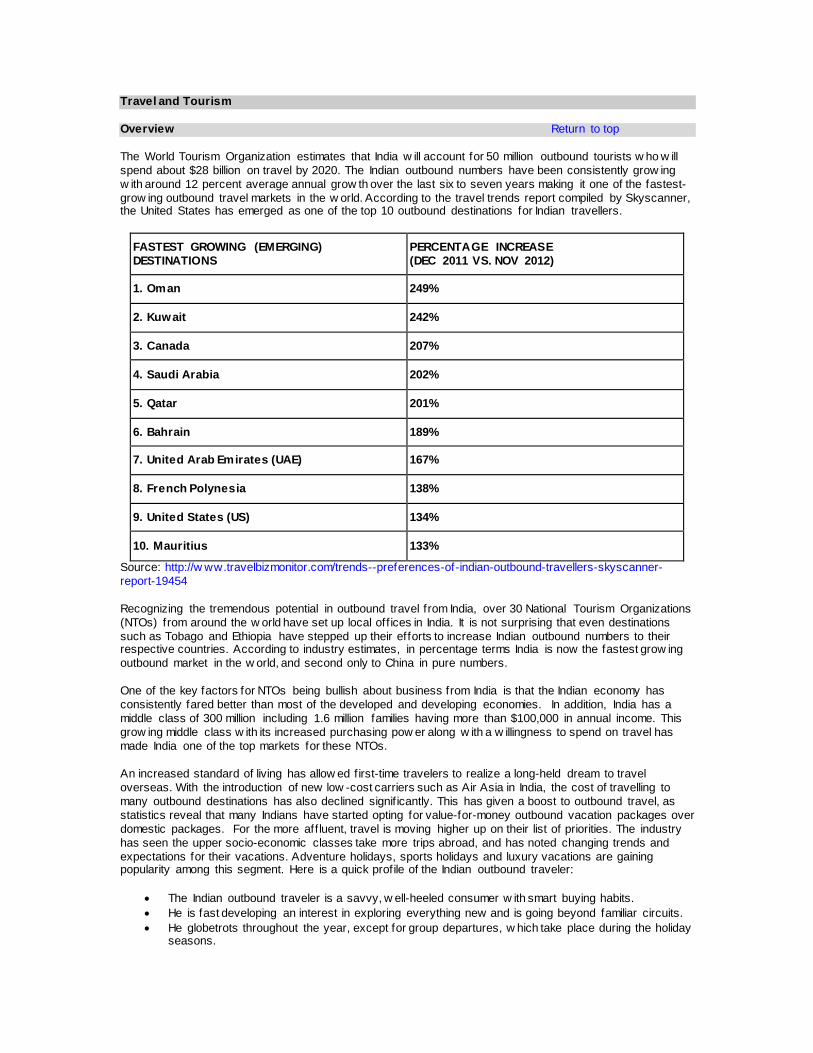
Travel and Tourism
Overview Return to top The World Tourism Organization estimates that India w ill account for 50 million outbound tourists w ho w ill spend about $28 billion on travel by 2020. The Indian outbound numbers have been consistently grow ing w ith around 12 percent average annual grow th over the last six to seven years making it one of the fastest-grow ing outbound travel markets in the w orld. According to the travel trends report compiled by Skyscanner, the United States has emerged as one of the top 10 outbound destinations for Indian travellers.
FASTEST GROWING (EMERGING) DESTINATIONS
PERCENTAGE INCREASE (DEC 2011 VS. NOV 2012)
1. Oman 249%
2. Kuwait 242%
3. Canada 207%
4. Saudi Arabia 202%
5. Qatar 201%
6. Bahrain 189%
7. United Arab Emirates (UAE) 167%
8. French Polynesia 138%
9. United States (US) 134%
10. Mauritius 133%
Source: http://w ww.travelbizmonitor.com/trends--preferences-of-indian-outbound-travellers-skyscanner-report-19454 Recognizing the tremendous potential in outbound travel from India, over 30 National Tourism Organizations (NTOs) from around the w orld have set up local off ices in India. It is not surprising that even destinations such as Tobago and Ethiopia have stepped up their efforts to increase Indian outbound numbers to their respective countries. According to industry estimates, in percentage terms India is now the fastest grow ing outbound market in the w orld, and second only to China in pure numbers. One of the key factors for NTOs being bullish about business from India is that the Indian economy has consistently fared better than most of the developed and developing economies. In addition, India has a middle class of 300 million including 1.6 million families having more than $100,000 in annual income. This grow ing middle class w ith its increased purchasing pow er along w ith a w illingness to spend on travel has made India one of the top markets for these NTOs. An increased standard of living has allow ed f irst-time travelers to realize a long-held dream to travel overseas. With the introduction of new low -cost carriers such as Air Asia in India, the cost of travelling to many outbound destinations has also declined signif icantly. This has given a boost to outbound travel, as statistics reveal that many Indians have started opting for value-for-money outbound vacation packages over domestic packages. For the more aff luent, travel is moving higher up on their list of priorities. The industry has seen the upper socio-economic classes take more trips abroad, and has noted changing trends and expectations for their vacations. Adventure holidays, sports holidays and luxury vacations are gaining popularity among this segment. Here is a quick profile of the Indian outbound traveler:
• The Indian outbound traveler is a savvy, w ell-heeled consumer w ith smart buying habits. • He is fast developing an interest in exploring everything new and is going beyond familiar circuits. • He globetrots throughout the year, except for group departures, w hich take place during the holiday
seasons.
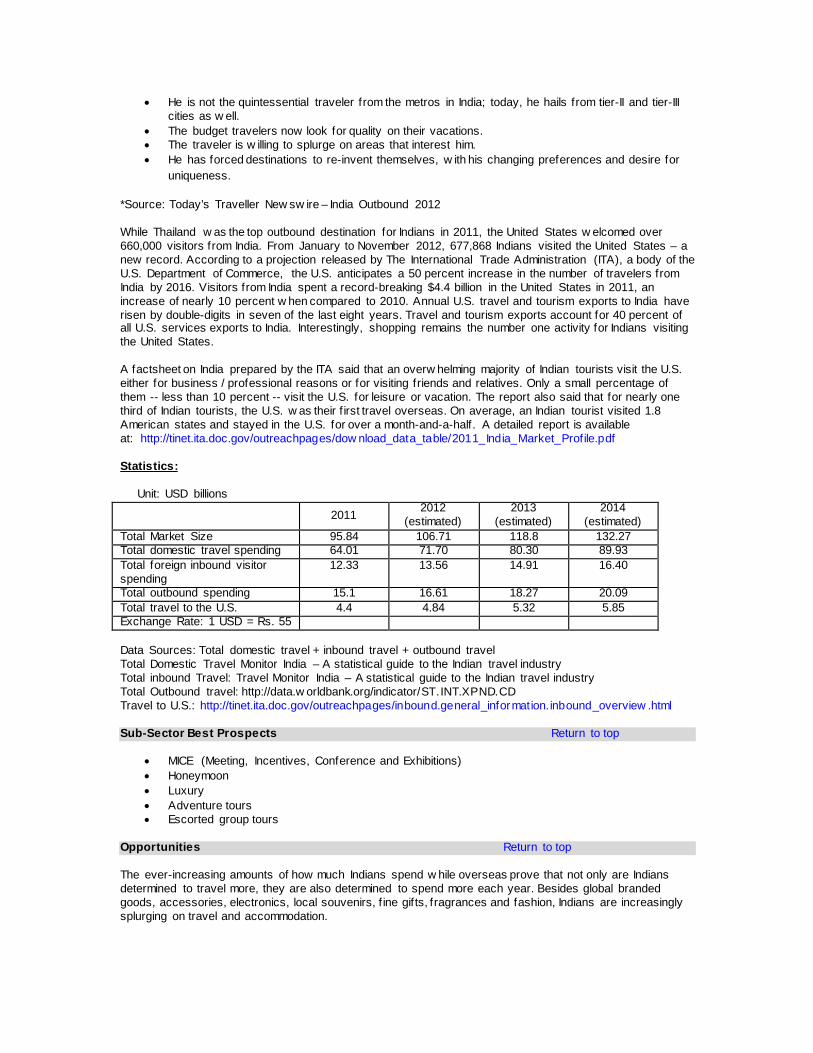
• He is not the quintessential traveler from the metros in India; today, he hails from tier-II and tier-III cities as w ell.
• The budget travelers now look for quality on their vacations. • The traveler is w illing to splurge on areas that interest him. • He has forced destinations to re-invent themselves, w ith his changing preferences and desire for
uniqueness.
*Source: Today’s Traveller New sw ire – India Outbound 2012 While Thailand w as the top outbound destination for Indians in 2011, the United States w elcomed over 660,000 visitors from India. From January to November 2012, 677,868 Indians visited the United States – a new record. According to a projection released by The International Trade Administration (ITA), a body of the U.S. Department of Commerce, the U.S. anticipates a 50 percent increase in the number of travelers from India by 2016. Visitors from India spent a record-breaking $4.4 billion in the United States in 2011, an increase of nearly 10 percent w hen compared to 2010. Annual U.S. travel and tourism exports to India have risen by double-digits in seven of the last eight years. Travel and tourism exports account for 40 percent of all U.S. services exports to India. Interestingly, shopping remains the number one activity for Indians visiting the United States. A factsheet on India prepared by the ITA said that an overw helming majority of Indian tourists visit the U.S. either for business / professional reasons or for visiting friends and relatives. Only a small percentage of them -- less than 10 percent -- visit the U.S. for leisure or vacation. The report also said that for nearly one third of Indian tourists, the U.S. w as their f irst travel overseas. On average, an Indian tourist visited 1.8 American states and stayed in the U.S. for over a month-and-a-half. A detailed report is available at: http://tinet.ita.doc.gov/outreachpages/dow nload_data_table/2011_India_Market_Profile.pdf Statistics: Unit: USD billions 2011 2012
(estimated) 2013
(estimated) 2014
(estimated) Total Market Size 95.84 106.71 118.8 132.27 Total domestic travel spending 64.01 71.70 80.30 89.93 Total foreign inbound visitor spending
12.33 13.56 14.91 16.40
Total outbound spending 15.1 16.61 18.27 20.09 Total travel to the U.S. 4.4 4.84 5.32 5.85 Exchange Rate: 1 USD = Rs. 55 Data Sources: Total domestic travel + inbound travel + outbound travel Total Domestic Travel Monitor India – A statistical guide to the Indian travel industry Total inbound Travel: Travel Monitor India – A statistical guide to the Indian travel industry Total Outbound travel: http://data.w orldbank.org/indicator/ST.INT.XPND.CD Travel to U.S.: http://tinet.ita.doc.gov/outreachpages/inbound.general_information.inbound_overview .html Sub-Sector Best Prospects Return to top
• MICE (Meeting, Incentives, Conference and Exhibitions) • Honeymoon • Luxury • Adventure tours • Escorted group tours
Opportunities Return to top The ever-increasing amounts of how much Indians spend w hile overseas prove that not only are Indians determined to travel more, they are also determined to spend more each year. Besides global branded goods, accessories, electronics, local souvenirs, f ine gifts, fragrances and fashion, Indians are increasingly splurging on travel and accommodation.

The travel trend has also been changing. While business travel, holiday and VFR (Visiting Family and Friends) trips still dominate outbound volumes, there is a new trend of people opting for niche products like sports tourism, luxury travels, honeymoon packages and cruises. It is not uncommon for aff luent Indians today to plan trips around cricket matches, golf tournaments, tennis matches, Formula-1 races, etc. MICE (Meeting, Incentives, Conference and Exhibitions) group-travel is one of the fastest grow ing segments of Indian outbound travel. Companies in India are realizing the benefits that accrue to their businesses from organizing MICE trips, w hich involve large or small groups of people from their company or industry meeting at interesting foreign destinations for conferences, trade exhibitions, focused business meetings, or just recreation. According to industry experts, betw een 1.2 and 1.5 million Indians w ill travel only for MICE purposes in the years ahead, and they w ill induce spending of around $1 billion. While this f igure may sound small as compared to developed markets, the Indian market for outbound MICE is grow ing at a very fast pace of 16 to 18 percent per year. Web Resources Return to top Visit USA Committee – India Chapter w ww.vusa.in Travel Agents Association of India w ww.travelagentsofindia.com/ Outbound Tour Operators Association of India http://w w w.otoai.org/ Travel Agents Federation of India w ww.tafionline.com/
Agricultural Sectors Return to top Cotton Tree Nuts and Dry Fruits Wood Products Fresh Fruits Pulses Vegetable Oil Planting Seeds Snack Foods Hides and Skins Agriculture’s share in India’s overall GDP is gradually declining w ith the current share at less than 14 percent w hile nearly 60 percent of the population depends on agriculture for its livelihood. Overall economic grow th w ould be improved by a better performing agricultural sector, w hich is w hy grow th in the sector is a priority of the Indian government. The government maintains a costly price support system for w heat and rice, and also subsidizes fertilizer, credit and other farm inputs. State governments provide farmers w ith free or subsidized electricity and irrigation w ater. The cumulative effect of these interventions has been to distort prices, planting patterns, and marketing. The agriculture sector suffers from declining public, and relatively small private, investment. There is a shortage of w arehouses and cold storage facilities, causing losses due to spoilage. Infrastructure such as roads, telecommunications, and electricity, is inadequate in rural areas and this impedes agricultural grow th. Although organized retail is grow ing w ith several large Indian corporations entering and expanding their operations, the recent economic slow dow n had a temporary negative impact on this sector. The optimism in the food retail sector stems from a vibrant and grow ing economy, increasing purchasing pow er, and an increasing number of urban consumers demanding a more international shopping experience. This provides an opportunity for the supply of various U.S. food products to India. How ever, success in introducing a new product in this highly price sensitive market depends on an effective pricing strategy and familiarity w ith India’s myriad food law s. High import tarif fs and competition from inexpensive domestic and third-country products are other challenges. Cotton Return to top India is the w orld’s second largest producer and exporter of cotton. India w ill be in the export market for the next few years, until domestic consumption catches up w ith the production surge. How ever, India w ill continue to import extra-long staple (ELS) and quality long staple cotton (28-34 mm), w ith occasional imports of medium staple cotton w hen international prices are favorable. The United States has been one of the leading suppliers of cotton to India over the past few years. U.S. cotton exports to India in CY 2012 w ere valued at about $106.5 million. Other major suppliers include Egypt, Australia, Commonw ealth of Independent States (CIS), and West Africa. Indian mills that import US Pima and upland cotton are appreciative of its superior quality, consistency and higher ginning yield. Tree Nuts Return to top Dry fruits and nuts (primarily almonds) have been one of the leading U.S. agricultural exports to India in the past, w ith exports in CY 2012 estimated at a record $330 million. The United States is the largest supplier of almonds (mostly in-shell) to India, w ith a market share of about 75 percent. Other suppliers include Australia, Syria, China, Iran, and Afghanistan. Afghani almonds enjoy a 100 percent concession on the basic import duty under the Indo-Afghan trade agreement. Almonds are a preferred nut in India and are gaining popularity among the grow ing middle-income population due to their nutritional and health benefits. India also imports small quantities of dates, pistachios, hazelnuts, prunes, and raisins, mainly from the United States, Iran, Afghanistan, Pakistan, and the Middle East.

Wood Products Return to top India has removed virtually all non-tarif f trade barriers on w ood product imports, although tarif fs remain high. Dw indling domestic supplies and restrictions on tree felling due to environmental concerns are likely to result in a more liberal import regime over the coming years. The domestic market is largely unorganized and highly price sensitive, but strong demand from the housing, furniture and construction sectors has made India a major market for imported w ood products, valued at $2.6 billion market in CY2012. Despite the preferential tarif f structure, logs’ share of India’s forest product imports has been declining over the past decade. U.S. w ood and w ood product exports to India in CY 2012 w ere valued at a record $49 million w ith processed w ood constituting 75 percent of the imports. Fresh Fruits Return to top India provides market access for most fresh fruits, although tarif fs are high. With a grow ing segment of consumers insisting on high standards and year-round availability, there is increasing demand for imported fresh fruits. U.S. exports of fresh fruit (mostly apples and table grapes) to India in CY 2012 w ere valued at $117 million. Market sources expect imports to continue to show excellent grow th over the coming years, w ith new products expected to enter the Indian market. Pulses Return to top India is the w orld’s largest importer of pulses (peas, lentils, and beans), w ith annual imports ranging from 2.5- 4.0 million tons. In IFY 2011/12 imports totaled 3.97 million tons. India is primarily a price (rather than quality) market w ith imports sourced largely from Canada, Myanmar, Australia, Russia, China and the United States. The typically higher-priced U.S. green and yellow peas, lentils and garbanzo beans (chickpeas) have become more price competitive in the Indian market in recent years due to higher domestic prices. As a result, imports of pulses from the U.S., mostly of dry green peas and some yellow peas, w itnessed signif icant grow th during the past 5 years, reaching a record 224 thousand tons in CY 2009, but subsequently declining to 167 thousand tons in CY 2012. Nevertheless, India remains the second largest export market for U.S. pulses after Mexico. Pulses are currently exempted from import tarif fs. Vegetable Oil Return to top India is the w orld’s largest edible oil importer, follow ed by China and the EU-27, w ith MY 2011-12 (Oct-Sep) imports estimated at 9.1 million tons. While low er-priced palm oil has traditionally dominated this price-sensitive market, exporters w ith competitively priced supplies of other oils, (for example soybean, cottonseed, corn, or sunflow er oil), often f ind buyers in India. On January 23, 2013, the government of India introduced a 2.5 percent import duty on crude edible vegetable oils (see Customs Notif ication No 02/2013). The import duty on refined vegetable oils stands unchanged at 7.5 percent. In CY 2010, U.S. soybean oil w as price competitive in India, resulting in commercial sales of around $133 million dollar, up 11 percent over CY 2009. CY 2011 exports w ere negligible due to higher U.S. prices. Planting Seeds Return to top India’s planting seed imports during the Indian f iscal year 2011-12 increased to $78.89 million as compared to $63.75 million during the previous IFY 2010-11. Imports from the United States increased to $6.84 million in 2011-12 as compared to $6.07 million in 2010-11. The Indian seed industry is undergoing a transformation, w hich includes an increasing role for private seed companies, the rising presence of multinational seed companies, and w ide-ranging changes in the regulatory framew ork. All of these w ill likely affect seed research, marketing, and trade in coming years. With demand for high quality fruits and vegetables grow ing from domestic consumers and the food processing industry, India’s seed imports are likely to grow . Snack Foods Return to top Consumers’ changing life styles and the increasing disposable income of the middle class have spurred rising demand for imported snack foods, despite competition from local players. CY 2012 exports of U.S. snack foods to India reached a record $6 million. Hides and Skins Return to top
India imported hides and skins w orth $81.9 million during CY 2012, about 13 percent less than the previous year. These w ere primarily used by the leather goods export sector. While India has historically imported from Europe, exporters from New Zealand, the Middle East and China have emerged as signif icant competitors. Imports of hides and skins from U.S. suppliers fell from approximately 2.5 million dollars in 2011 to 2.2 million dollars in 2012. Raw hide imports attract a zero tarif f in India w hile w et blues attract a tarif f of 14.71 percent. Web Resources Return to top Ministry of Agriculture, Department of Agriculture and Cooperation: http://agricoop.nic.in/ Ministry of Agriculture, Department of Animal Husbandry, Dairying and Fisheries: http://w ww.dahd.nic.in/dahd/default.aspx Ministry of Commerce and Industry; http://commin.nic.in/ Ministry of Consumer Affairs, Food & Public Distribution; http://fcamin.nic.in/ Ministry of Food Processing Industries; http://mofpi.nic.in/ Foreign Agricultural Service (FAS), United States Department of Agriculture: http://w w w.fas.usda.gov All India Food Processors’ Association: http://w ww.aifpa.net/ Forum of Indian Food Importers: http://w w w.fif i.in/ National Seed Association of India: http://nsai.co.in/ Solvent Extractors’ Association of India: http://w ww.seaofindia.com/ Return to table of contents

Return to table of contents Chapter 5: Trade Regulations, Customs and Standards
• Import Tariffs • Trade Barriers • Import Requirements and Documentation • U.S. Export Controls • Temporary Entry • Labeling and Marking Requirements • Prohibited and Restricted Imports • Customs Regulations and Contact Information • Standards • Trade Agreements • Web Resources
Import Tariffs Return to top In 1991, India began to initiate economic reforms that have made the trade regime increasingly more transparent. These reforms are complimented by a consistent decline in import tarif f rates over the past 15 years – from peak rates of 350 percent in June 1991 to an average of 10 percent today. How ever, India's tarif fs are still relatively high by international standards, and these high tarif fs and import restrictions have constrained U.S. f irms from selling in this market, and U.S. investors from importing competitive inputs in several industries. India's current regulations are guided by the Export Import (EXIM) Policy of 2009-2014. Imports are permitted in most cases w ithout a license. There are some exceptions w here items are prohibited or restricted (import permitted under license) or w here imports are allow ed only through a state-ow ned enterprise. As of April 2001, India removed quantitative restrictions (QR) on a f inal batch of 715 items, completing the process of phased trade policy liberalization that w as started in 1991. India has appealed to the Appellate Body of the World Trade Organization against the recommendations of a WTO panel report on its quantitative restrictions on the import of agricultural, textile, and industrial products. India has challenged the panel’s authority to determine w hether the balance of payments can be used to justify imposition of import restrictions and the overall compatibility of regional trade agreements w ith WTO norms. The removal of QRs and the prospect of further reduction in tarif fs to the Asian levels are likely to lead to a high degree of import competition. Tariff Rates: India has progressively cut duties and taxes since 1991, after it began sw itching from a Socialist-style system to a market economy. How ever, domestic industry still enjoys relatively high levels of protection in several areas. U.S. companies face tarif f and non-tarif f barriers that impede their exports. One such area of protection is in the agricultural sector w here Indian tarif fs remain high compared to international standards. For non-agricultural goods, how ever, India has made considerable progress in restructuring tarif fs. In February 2007, the Government of India (GOI) further reduced the peak applied customs duty on non-agricultural goods from 12.5 percent to 10 percent. The Indian government plans to gradually ease currency restrictions and reduce tarif fs to the low levels prevailing in other Asian countries in order to make the Indian environment more conducive to improved economic performance. Classification: As there are thousands of goods that are imported into India, it is not possible to prescribe rates of duty for each type of merchandise. The basic applicable legislation is the Indian Customs Act of 1962, and the Customs Tarif f Act of 1975. The Customs Act of 1962 w as created to control imports and prevent Illegal imports and exports of goods. The Customs Tariff Act specif ies the tarif fs rates and provides for the imposition of anti-dumping and countervailing duties. The Indian customs classif ication on tarif f items follow s the Harmonized Commodity Description and Coding System (Harmonized System or HS). Customs uses six-digit HS codes, the Directorate-General of Commercial Intelligence and Statistics (DGCI&S) uses eight-digit codes for statistical purposes, and the Directorate General of Foreign Trade (DGFT) has broadly extended the eight-digit DGCI&S codes up to 10 digits.
It is also w orth noting that the excise authorities use HS codes for classifying goods to levy excise duty (manufacturing taxes) on goods produced in India. How Customs Duty is calculated: All goods imported into India are subject to duty. There are several factors that go into calculating customs duty, including: Basic Customs Duty (BCD): This duty is levied either as 1) a specif ic rate based on the unit of the item (w eight, number, etc.), or more commonly, 2) ad-valorem, based on the assessable value of the item. In some cases, a combination of the tw o is used. Additional Customs Duty (ACD): This duty is typically referred to as Countervailing duty or (CVD) and is levied on the assessed value of goods plus basic customs duty. Goods that fall into this category are imported goods that have similar goods manufactured in India. The objective is to protect domestic industry from imports. Special Additional Customs Duty (known as Special CVD): Earlier know n as surcharge, Special CVD tax is applicable on all items. It is levied at the rate of 4 percent of the basic and the excise duty on all imports. Anti-dumping Duty: This is levied on specif ied goods imported from specif ied countries, including the United States, to protect indigenous industry from injury. Safeguard Duty: The Indian government may by notif ication impose a safeguard duty on articles after concluding that increased imported quantities and under current conditions w ill cause or threaten to cause serious injury to domestic industry. Customs Education Cess: Effective July 2004, India introduced a new education cess (duty) assessment. The current rate is three percent of Basic Customs Duty (BCD) and Additional Duty of Customs (ACD). Goods bound under international commitments have been exempted from this cess. Customs Handling Fee : The Indian government assesses a one percent customs handling fee on all imports in addition to the applied customs duty. Total Duty: Therefore, for most goods, total duty payable = BCD + ACD + Special CVD + Education Cess + Customs Handling Fee. Tariff rates, excise duties, regulatory duties, and countervailing duties are revised in each annual budget in February, and are published in various sources, including BIGs Easy Reference Customs Tariff edition. A copy of this book is kept at the USA Trade Information Center in Washington DC and more specif ic information from this guide is available to U.S. Companies by calling 800-USA-TRADE. While the Indian government publishes customs tarif fs rates there is no single off icial publication that has all information on tarif fs and tax rates on imports. Moreover, each Indian State levies taxes on interstate trade and commerce, w hich adds to the confusion. Effective April 2005, the Indian government implemented a Value-Added tax (VAT) system meant to replace the inter-state taxes, but implementation is not yet universal in all the States. Duty exemption plan: The Duty Exemption Plan enables duty free import of inputs required for export production. An advance license is issued under the duty exemption plan. The Duty Remission Plan enables post export replenishment remission of duty on inputs used in the export product. Duty Remission plan consists of (a) DFRC and (b) DEPB. DFRC permits duty free import charges on inputs used in the export product. The government has w ide discretionary pow er to declare full or partial duty exemptions “in the public interest” and to specify conditions such as end-use provisions. Almost half of India’s total inputs enter under concessional tarif fs, though the use of exemptions is falling in tandem w ith the tarif f -reduction program. Trade Barriers Return to top

Any restriction imposed on the free f low of trade is a trade barrier. Trade barriers can either be tarif f barriers (the levy of ordinary negotiated customs duties in accordance w ith Article II of the GATT) or non-tarif f barriers, w hich are any trade barriers other than tarif f barriers. Import Licensing: One of the most common non-tarif f barriers is the prohibition or restrictions on imports maintained through import licensing requirements. Though India has eliminated its import licensing requirements for most consumer goods, certain products face licensing related trade barriers. For example, the Indian government requires a special import license for motorcycles and vehicles that is very restrictive. Import licenses for motorcycles are provided to only foreign nationals permanently residing in India, w orking in India for foreign f irms that hold greater than 30 percent equity or to foreign nations w orking at embassies and foreign missions. Some domestic importers are allow ed to import vehicles w ithout a license provided the imports are counterbalanced by exports attributable to the same importer. Standards, testing, labeling & certification: The Indian government has identif ied 109 commodities that must be certif ied by its National Standards body, the Bureau of Indian Standards (BIS). The idea behind these certif ications is to ensure the quality of goods seeking access into the market, but many countries use them as protectionist measures. For more on how this relates to labeling requirements, please see the section on Labeling and Marking Requirements in this chapter. Anti-dumping and countervailing measures: Anti-dumping and countervailing measures are permitted by the WTO Agreements in specif ied situations to protect the domestic industry from serious injury arising from dumped or subsidized imports. India imposes these from time-to-time to protect domestic manufacturers from dumping. India’s implementation of its antidumping policy has, in some cases, raised concerns regarding transparency and due process. In recent years, India seems to have aggressively increased its application of the antidumping law . Export subsidies and domestic support: Several export subsidies and other domestic support is provided to several industries to make them competitive internationally. Export earnings are exempt from taxes and exporters are not subject to local manufacturing tax. While export subsidies tend to displace exports from other countries into third country markets, the domestic support acts as a direct barrier against access to the domestic market. Procurement: The Indian government allow s a price preference for local suppliers in government contracts and generally discriminates against foreign suppliers. In international purchases and International Competitive Bids (ICB’s) domestic companies gets a price preference in government contract and purchases. Service barriers: Services in w hich there are restrictions include: insurance, banking, securities, motion pictures, accounting, construction, architecture and engineering, retailing, legal services, express delivery services and telecommunication. Other barriers: Equity restrictions and other trade-related investment measures are in place to give an unfair advantage to domestic companies. The GOI continues to limit or prohibit FDI in sensitive sectors such as retail trade and agriculture. Additionally there is an unpublished policy that favors counter trade. Several Indian companies, both government-ow ned and private, conduct a small amount of counter trade. Import Requirements and Documentation Return to top Import licensing requirements: In the last decade, India has steadily replaced licensing and discretionary controls over imports w ith deregulation and simpler import procedures. The majority of import items fall w ithin the scope of India’s EXIM Policy regulation of Open General License (OGL). This means that they are deemed to be freely importable w ithout restrictions and w ithout a license, except to the extent that they are regulated by the provisions of the Policy or any other law . Imports of items not covered by OGL are regulated, and fall into three categories: banned or prohibited items, restricted items requiring an import license, and "canalized" items importable only by government trading monopolies and subject to Cabinet approval regarding timing and quantity. The follow ing are designated import certif icate issuing authorities: • The Department of Electronics for import of computer and computer related systems

• The Department of Industrial Policy and Promotion for organized sector f irms except for import of computers and computer based systems
• The Ministry of Defense for defense related items • The Director General of Foreign Trade for small-scale industries not covered in the foregoing. Capital goods can be imported w ith a license under the Export Promotion Capital Goods plan (EPCG) at reduced rates of duty, subject to the fulf illment of a time-bound export obligation. The EPGC plan now applies to all industry sectors. It is also applicable to all capital goods w ithout any threshold limits, on payment of a 5 percent customs duty. A duty exemption plan is also offered under w hich imports of raw materials, intermediates, components, consumables, parts, accessories and packing materials required for direct use in products to be exported may be permitted free of duty under various categories of licenses. For the actual user, a non-transferable advance license is one such license. For those w ho do not w ish to go through the advance-licensing route, a post-export duty-free replenishment certif icate is available. Advance License: An advance license is issued to allow duty free import of inputs, w hich are physically incorporated in the export product (making normal allow ance for w astage). In addition, fuel, oil, energy, catalysts etc. that are consumed in the course of their use to obtain the export product, may also be allow ed under the plan. Duty free import of mandatory spares up to 10 percent of the CIF value of the license, w hich are required to be exported/ supplied w ith the resultant product, may also be allow ed under Advance License. Advance license can be issued for: Physical exports: An advance license may be issued for physical exports to a manufacturer exporter or merchant exporter tied to supporting manufacturer(s) for import of inputs required for the export product. Intermediate supplies: An advance license may be issued for intermediate supply to a manufacturer-exporter for the import of inputs required in the manufacture of goods to be supplied to the ultimate exporter/deemed exporter holding another Advance License. Deemed exports: An advance license can be issued for deemed exports to the main contractor for import of inputs required in the manufacture of goods to be supplied to the categories mentioned in paragraph 8.2 (b), (c), (d) (e) (f), (g), (i) and (j) of the Policy. An advance license for deemed exports can also be availed by the sub-contractor of the main contractor to such project provided the name of the sub contractor(s) appears in the main contract. Such license for deemed export can also be issued for supplies made to United Nations Organizations or under the Aid Program of the United Nations or other multilateral agencies and paid for in foreign exchange. Import Declaration: Importers are required to furnish an import declaration in the prescribed bill of entry format, disclosing full details of the value of imported goods. Import Licenses (if applicable): All import documents must be accompanied by any import licenses. This w ill enable the customs to clear the documents and allow the import w ithout delay. Ex-factory invoice, freight and insurance certificates : These must be attached so that the customs can verify the price and decide on the classif ication under w hich the import tarif f can be calculated. Letter of Credit (L/C): All importers must accompany a copy of the L/C to ensure that payment for the import is made. Normally this document is counter-checked w ith the issuing bank so that outf low of foreign exchange is checked. Not all consignments are inspected prior to clearance, and inspection may be dispensed w ith for reputable importers. In the current customs set-up, an appointment w ith the clearing agents for clearance purposes w ill avoid delays. In general, documentation requirements, including ex-factory bills of sale, are extensive and delays are frequent. These cost investors time and money, including additional detention and demurrage charges, making it more expensive to operate and invest in India. For delayed clearances, importers seek release of shipments against a performance bond; furnishing a bank guarantee for this purpose is a more expensive
proposition. Customs have recently extended operations to 24 hours a day to ensure timely clearance of export cargo. U.S. Export Controls Return to top The Indian and the U.S. governments formed a High Technology Cooperation Group (HTCG) in November 2002 to facilitate and promote high technology bilateral trade. The Bureau of Industry and Security (BIS) (formerly know n as the Bureau of Export Administration, BXA) is the American government agency responsible for implementing and enforcing the Export Administration Regulations (EAR), w hich regulate the export and re-export of most commercial items. The BIS often refers to the items that they regulate as "dual-use" items, since these items have both commercial and military or proliferation applications, but purely commercial items w ithout an obvious military use are also subject to the EAR. For further inquiries regarding the list of items requiring U.S. export clearance contact: Director, Off ice of National Security and Technology Transfer Controls 14th Street and Constitution Avenue, NW U.S. Department of Commerce, Washington DC 20230 Telephone: 202-482-4196 Fax 202-482-4094 Website: http://w ww.bis.doc.gov/ For questions regarding end-use checks or to speak w ith enforcement, please contact: Director, Off ice of Enforcement Analysis 14th Street and Constitution Avenue, NW Room 4065 U.S. Department of Commerce, Washington DC 20230 Telephone: 202-482-4255 Fax 202-482-0971 Website: http://w ww.bis.doc.gov/ Temporary Entry Return to top The Indian Customs Act, 1962 allow s import of goods on a temporary basis into India. Section 74 of the Act provides for draw back on goods that are imported for a temporary period into India and exported out of the country. As per the Section 74, draw back is allow able on re-export of duty paid goods. When the goods are re-exported out of India, the exporter w ill be entitled to a draw back of a specif ied percentage of the duty paid at the time of import. The procedure for claiming duty draw back under Section 74 is governed by provisions of the Re-Export of Imported Goods (Draw back of Customs Duties) Rules, 1995. The rate of draw back available depends upon the time period for w hich the goods are stored in India or put to use. If goods are re-exported w ithout being put to use in India, 98 percent of the customs duty w ould be available as duty draw back, provided that the exports have taken place w ithin 24 months from the date of import. How ever, under section 75 of the Act, w here the goods are used in India subsequent to their import, the draw back is determined on the basis of the duration of use of the goods in India (the length of period from the date of clearance for home consumption and the date goods are placed under customs control for export). The procedure for claiming duty draw back under Section 75 is governed by provisions of the Customs and Central Excise Duties Draw back Rules 1995. In addition, General Exemption No 14 of the Customs Tariff allow s the import of goods for display or use at fair, exhibition, demonstration, seminar, congress and conferences, subject to specif ied conditions. ATA Carnet: An ATA Carnet is an International Uniform Customs document issued in 71 countries including India, w hich are parties to the Customs Convention on ATA Carnet. The ATA Carnet permits duty free temporary admission of goods into a member country w ithout the need to raise customs bond, payment of duty and fulf illment of other customs formalities in one or a number of foreign countries. The initials "ATA" are an acronym of the French and English w ord "Admission Temporaire / Temporary Admission".
Within the ICC World Chambers Federation, the World ATA Carnet Council (WATAC) runs the ATA system and its international guarantee chain. The Council is made up of representatives from the countries and territories w here Carnets are issued and accepted. Each country in the system has a single guaranteeing body approved by the national customs authorities and the ICC World Chambers Federation (Until June 2001, the International Bureau of Chambers of Commerce). The WCF is sponsored by the International Chamber of Commerce (ICC) in Paris. In India, Federation of Indian Chambers of Commerce and Industry (FICCI), is appointed as National Guaranteeing & Issuing Association for ATA Carnets. http://w w w .atacarnet.in/about-ata-carnet.html Labeling and Marking Requirements Return to top Labeling is an important element for products being exported to India. English is the favorable language for labeling. All packets or even containers should carry information depending upon the consignment. Indian Customs are strict and ensure that imported items have the legally required information before these enter the retail market or are sold for consumption, excluding those products that fall under the EOU segment. As per a Notif ication issued by the Ministry of Commerce on November 24, 2000, all pre-packaged commodities (intended for direct retail sale only) imported into India must carry the follow ing declarations on the label:
• Name and address of the importer • Generic or common name of the commodity packed • Net quantity in terms of standard unit of w eights and measurement. All units of w eight or
measurements must be metric. If the net quantity of the imported package is given in any other unit, its equivalent of standard units must be declared by the importer
• Month and year of packing in w hich the commodity is manufactured, packed or imported, and • The maximum retail sales price (MRP) at w hich the commodity in packaged form may be sold to
the end consumer. The MRP includes all taxes, freight transport charges, commission payable to dealers, and all charges tow ards advertising, delivery, packing, forw arding and the like.
Compliance of the above-stated requirements has to be ensured before the import consignments are cleared by Customs in India. The import of pre-packaged commodities such as raw materials, components, bulk import etc., that need to undergo further processing before they are sold to end consumers are not included under this labeling requirement. Labeling requirements for packaged food products as laid dow n in the Part VII of the Prevention of Food Adulteration (PFA) Rules, 1955, and the Standards of Weights and Measures (Packaged Commodities) Rules of 1977, require that the labels contain the follow ing information:
• Name, trade name or description • Name of ingredients used in the product in descending order of their composition by w eight or
volume • Name and complete address of manufacturer/packer, importer, country of origin of the imported
food (if the food article is manufactured outside India, but packed in India) • Net w eight, number or volume of contents • Distinctive batch, lot or code number • Month and year of manufacture and packaging • Month and year by w hich the product is best consumed • Maximum retail price
Wherever applicable, the product label also has to contain the follow ing:
• The purpose of irradiation and license number in case of irradiated food • Extraneous addition of coloring material • Non-vegetarian food – any food w hich contains w hole or part of any animal including birds, fresh
w ater or marine animals, eggs or product of any animal origin as an ingredient, not including milk or milk products – must have a symbol of a brow n color-f illed circle inside a brow n square outline prominently displayed on the package, contrasting against the background on the display label in close proximity to the name or brand name of the food.
• Vegetarian food must have a similar symbol of green color-f illed circle inside a square w ith a green outline prominently displayed

All declarations may be:
• Printed in English or Hindi on a label securely aff ixed to the package, or • Made on an additional w rapper containing the imported package, or • Printed on the package itself, or • May be made on a card or tape aff ixed f irmly to the package and bearing the required information
prior to customs clearance Products displaying only the standard U.S. label cannot enter. With regard to the shelf life of imported food items, a Notif ication issued by the Ministry of Commerce on July 30, 2001, states that: “Imports of all food products, domestic sale and manufacture of w hich are governed by the Prevention of Food Adulteration Act (PFA) shall also be subject to the condition that, at the time of importation, these products have a valid shelf life of not less than 60 percent of its original shelf life. The shelf life of the product is to be calculated based on the declaration given on the label of the product, regarding the date of manufacture and the due date of expiry.” Prohibited and Restricted Imports Return to top For the most current information on India’s Prohibited Import List, please see: http://exim.indiamart.com/freedlist/prohibited.html Customs Regulations and Contact Information Return to top Information from the Government of India’s Central Board of Excise and Customs, including FAQs for importers, is found here: http://w w w.cbec.gov.in/cae1-english.htm. Contact information and a telephone directory is included here: http://w w w.cbec.gov.in/tel-dir-ason21feb12.htm Standards Return to top
• Overview • Standards Organizations • Conformity Assessment • Product Certif ication • Accreditation • Publication of Technical Regulations • Labeling and Marking • Contacts
Overview Return to top Standards setting as a trend is gaining momentum in India. India has generally made efforts to match national standards in line w ith international norms, and most Indian standards are harmonized w ith ISO standards. Nonetheless, some Indian standards are not matched w ith international standards, and several recent standards-related regulations have created barriers to trade and posed challenges to expanding U.S. exports in certain sectors. India has also frequently failed to notify the WTO of new standards and allow time for discussion w ith its trading partners prior to implementation. Because of pressure from consumer rights groups, NGOs, and environmental activists there is a grow ing emphasis on product standards in India in various industry sectors. The proactive role of the judiciary in formulating legal framew ork and regulations for better standards and control in sectors such as the environment have also contributed to an increased aw areness and emphasis on product standards in India. But, for instance, w hile Indian food safety law s are outdated or in some cases more stringent than international norms, enforcement is w eak. Standards Organizations Return to top In India, voluntary standards are exclusively developed by the national standards body. The Bureau of Indian Standards (BIS), established under the Bureau of Indian Standards Act of 1986, is the national standards body of India responsible for development and formulation of standards. BIS is comprised of representatives of industry, consumer organizations, scientif ic and research bodies, professional organizations, technical institutions, Indian government ministries, and members of parliament.

Besides development and formulation of Indian Standards, BIS is involved w ith product certif ication, quality system certif ications and testing, and consumer affairs. The Ministry of Commerce, Government of India (GOI) has designated BIS as the National WTO-TBT Enquiry Point in accordance w ith its obligations to the agreement on Technical Barriers to Trade of the WTO. According to the agreement, BIS in liaison w ith the Indian Ministry of Commerce, issues notif ications on proposed technical regulations and certif ication systems in India to the WTO. BIS’s Technical Information Services Center responds to domestic and foreign requests for information about Indian standards, technical regulations and conformity assessment rules. U.S. companies that w ish to make comments on any notif ications can obtain copies of the text from BIS from the WTO-TBT Enquiry Point, Technical Information Services Center in BIS. BIS communicates comments to the Ministry of Commerce. BIS is the only organization in India authorized to operate quality certif ication plans under an Act of Parliament. It serves as the off icial member and sets policy for Indian participation in the International Organization for Standardization (ISO) and International Electro technical Commission (IEC). NIST Notify U.S. Service Member countries of the World Trade Organization (WTO) are required under the Agreement on Technical Barriers to Trade (TBT Agreement) to report to the WTO all proposed technical regulations that could affect trade w ith other Member countries. Notify U.S. is a free, w eb-based e-mail subscription service that offers an opportunity to review and comment on proposed foreign technical regulations that can affect your access to international markets. Register online at Internet URL: http://w ww.nist.gov/notifyus/
Conformity Assessment Return to top A list of testing organizations spread throughout the country providing conformity testing against relevant Indian standards is available from the BIS w ebsite at: http://w w w .bis.org.in/lab/lab.htm In association w ith technical GOI agencies and NGOs, BIS carries out periodic surveillance inspections of products under mandatory certif ication. A provision exists for sub-contracting certif ication surveillance activities to relevant competent agencies in specif ic areas. Certain types of steel, rubber, and electronic products are presently under such surveillance agreements. Product Certification Return to top BIS’s product standards are basically voluntary in nature, but subsequent to the removal of quantitative restrictions (QRs) on imports by India in 2000, the GOI, in order to provide protection to domestic producers in certain sectors, promulgated regulations dictating that imports of 109 products are subject to mandatory compliance w ith specif ied Indian quality standards. For compliance, all exporters/manufacturers of the 109 products are required to register w ith, and obtain certif ication from the Bureau of Indian Standards, before exporting such goods to India. The list of 109 products includes various food preservatives and additives, milk pow der, infant milk food, certain kinds of cement, household and similar electrical appliances, several types of gas cylinders, and multi-purpose dry batteries. These 109 products generally must be tested and certif ied by BIS in India. BIS now how ever, also has a system for foreign companies to receive automatic certif ication for products not manufactured in India. The system is based on a self-certif ication basis, under w hich a foreign manufacturer is permitted to apply the standards mark on the product after ascertaining its conformity to the Indian Standard licensed for. At the foreign manufacturer’s expense, BIS inspectors travel to the manufacturer’s country to inspect their production facility to pre-certify the company and its production system, and then authorizes subsequent monitoring and compliance by an independent inspector to ensure that the company maintains the specif ied standards. Information on the application procedure for BIS Product Certif ication Plan for foreign companies is available through the BIS w ebsite at: http://w w w .bis.org.in Exporters/manufacturers of these products also are required to maintain a presence in India. This requirement does not apply if the foreign manufacturer nominates an authorized representative in India w ho
agrees to be responsible for compliance w ith the provisions of BIS on behalf of the foreign manufacturer as per an agreement signed betw een the manufacturer and BIS. Under separate arrangements some products have been placed under special certif ication plans of lot or batch inspections carried out by BIS inspecting off icers. A majority of gas cylinders, deep w ell hand pumps and valves are certif ied through such plans. To facilitate international trade and cooperation, India has plans to harmonize its standards w ith other countries, primarily w ith its main trading partners. A serious effort is being made by BIS to have mutual recognition of standards w ith various countries so that other countries provide recognition of the Indian standards on certain products and vice versa. The BIS has expressed interest in having mutual recognition agreements w ith U.S. organizations. Accreditation Return to top The National Accreditation Board for Testing and Calibration Laboratories (NABL) established in 1985 as an autonomous body under the Department of Science & Technology is authorized by the GOI as the sole accreditation body for testing and calibration laboratories. More than 200 testing and calibration laboratories have been accredited to date. A list of accredited laboratories is available from NABL’s w ebsite at: http://w w w .nabl-india.org/nabl/html/about-intro.asp For international mutual acceptance of test results in order to be compliant w ith the WTO/Technical Barriers to Trade (TBT) regulations, NABL is a member of international organizations such as International Laboratory Accreditation Co-operation (ILAC) and Asia Pacif ic Laboratory Accreditation Co-operation (APLAC). NABL is a signatory to ILAC as w ell as APLAC Mutual Recognition Arrangements (MRA), based on mutual evaluation and acceptance of other MRA Partner laboratory accreditation systems. Indian manufacturing companies are investing in standards accreditation. The number of plants in India w ith ISO 9000 and ISO 14000 accreditation increased from a negligible f igure in the early nineties to many thousands today and numerous Indian companies have w on the Deming prize for total quality management. Publication of Technical Regulations Return to top An electronic version of Indian Standards is now available on CD-ROM from the Bureau of Indian Standards. Further information is available at http://w w w .bis.org.in/other/iscd.htm Contacts Return to top Bureau of Indian Standards Manak Bhavan, 9 Bahadur Shah Zafar Marg New Delhi 110 002, India Tel : 91-11-2323 0131, 2323 3375, 2323 9402 (10 lines) Fax : 91-11-2323 4062, 2323 9399, 2323 9382 Email : [email protected] Web: http://w w w.bis.org.in NABL Department of Science and Technology Technology Bhaw an, New Mehrauli Road New Delhi – 110 016 Tel no.: 91-11-2686 4642 / 2685 7661 Fax no.: 91-11-2686 4642 / 686 3866 Email : [email protected] Web: http://w ww.nabl-india.org/ Director General of Foreign Trade Ministry of Commerce & Industries Udyog Bhaw an, New Delhi 110 011 Tel: 91-11-2301 1777 Fax: 91-11-2301 8613 Web: http://dgft.nic.in/
Department of Consumer Affairs Off ice of the Additional Secretary (Weights & Measures) Krishi Bhaw an, New Delhi 110 001 Tel: 91-11-2338 3027 Fax: 91-11-2338 6575 Trade Agreements Return to top India has entered into bilateral and regional trading agreements over the years. These agreements, besides offering preferential tarif f rates on the trade of goods among member countries, also provide for w ider economic cooperation in the f ields of trade in services, investment, and intellectual property. The preferential arrangement/plans under w hich India is receiving tarif f preferences are the Generalized System of Preferences (GSP) and the Global System of Trade Preferences (GSTP). Presently, there are 46 member countries of the GSTP and India has exchanged tarif f concessions w ith 12 countries on a limited number of products. Other such preferential arrangements include the South Asian Association for Regional Cooperation (SAARC) Preferential Trading Agreement (SAPTA), the Bangkok Agreement and India–Sri Lanka Free Trade Agreement (ISLFTA). These arrangements/ agreements prescribe Rules of Origin that have to be fulf illed for exports to be eligible for tarif f preference. India and several Asian countries have signed a Comprehensive Economic Cooperation Agreement (CECA), w hich is an integrated package of agreements embracing trade in goods, services, investments and economic co-operations in education, science and technology, air services, and intellectual property. The agreements provide w ide-ranging exemptions and reductions on basic customs duty on products imported from Singapore into India. The Indian Ministry of Commerce projected that 60 percent of India's future trade w ould be accounted for by free trade agreements (FTAs), w ith such countries as Paraguay, Argentina, Brazil, Pakistan and even China. In a major policy shift, the government has decided to convert all Preferential/Free Trade Agreements (PFA/FTA) into Comprehensive Economic Cooperation Agreements (CECA). This goes beyond the Indian government’s bid in recent months to embrace bilateralism aggressively. The decision seems to be aimed at mollifying the World Trade Organization (WTO), w hich cautioned India against negotiating exclusively PFAs/FTAs. PTAs/FTAs usually involve structured reduction in tarif fs betw een tw o countries. CECAs w ould cover preferential relaxation of FDI rules vis-à-vis the partner country, tax holidays on investment and income, easing of visa restrictions etc. Trade in services too w ould come under the purview of CECA. Information on India’s bilateral trade agreements is available at the Ministry of Commerce and Industry w ebsite: http://commerce.nic.in/trade/international_ta.asp?id=2&trade=i Web Resources Return to top Trade regulations: Import tarif fs http://dgft.nic.in/ http://dgftcom.nic.in/exim/2000/policy/contents.htm http://w w w .dgciskol.nic.in/ http://w w w .cbec.gov.in/ Trade barriers http://w w w .ustr.gov/about-us/press-off ice/reports-and-publications/2011-0 http://commerce.nic.in/medium_term/contents.htm http://w w w .ustr.gov/ Import requirements and documentation http://dgftcom.nic.in http://dipp.nic.in/ U.S. export controls http://w w w .bis.doc.gov/ http://w w w .access.gpo.gov/bis/ear/ear_data.html

http://w w w .cbp.gov/ Temporary entry http://dgftcom.nic.in/exim/2000/policy/chap-02.htm http://w w w .atacarnet.in/ Labeling and marking requirements http://w w w .bis.org.in/cert/man.htm http://w w w .bis.org.in/cert/prooth.htm Prohibited and Restricted Imports http://commerce.nic.in/qr/default.asp Standards: Overview http://w w w .bis.org.in/bs/index.htm http://w w w .bis.org.in/org/obj.htm Standards Organizations http://w w w .bis.org.in/sf/pow ork.htm Conformity Assessment http://w w w .bis.org.in/lab/lab.htm http://w w w .bis.org.in/sf/nrstd.htm Product Certif ication http://w w w .bis.org.in/cert/fm.htm http://w w w .bis.org.in/cert/procert.htm http://w w w .bis.org.in/sf/nrstd.htm Accreditation http://w w w .nabl-india.org/nabl/html/contact.asp Publication of Technical Regulations http://w w w .bis.org.in/other/iscd.htm Labeling and Marking http://w w w .bis.org.in/cert/man.htm Trade agreements http://commerce.nic.in/ http://commerce.nic.in/trade/international_ta.asp?id=2&trade=i Return to table of contents
Return to table of contents Chapter 6: Investment Climate
• Overview of Foreign Investment Climate • Conversion and Transfer Policies • Expropriation and Compensation • Dispute Settlement • Performance Requirements and Incentives • Right to Private Ow nership and Establishment • Protection of Property Rights • Transparency of Regulatory System • Eff icient Capital Markets and Portfolio Investment • Competition from State Ow ned Enterprises • Corporate Social Responsibility • Political Violence • Corruption • Bilateral Investment Agreements • OPIC and Other Investment Insurance Programs • Labor • Foreign-Trade Zones/Free Ports • Foreign Direct Investment Statistics
Overview of Foreign Investment Climate Return to top
India’s sizeable and rapidly grow ing domestic market, w ell-regulated and grow ing f inancial markets, large English-speaking population, and its stable democratic government make it an attractive place for investors. How ever, India underperforms its vast potential. Major areas of concern include rampant corruption, complex and lengthy investment and business approval processes, antiquated land acquisition and labor law s, and poor contract enforcement. India’s historical preference for economic self -suff iciency informs current and proposed industrial and trade policies that protect domestic manufacturing, agriculture, and other sectors. In 2012, the World Bank’s International Finance Corporation ranks India 132 among 183 w orld economies in its ease of doing business survey and the Organization for Economic Co-operation and Development ranks India high as a closed economy in its Foreign Direct Investment Restrictiveness Index. Furthermore, India’s GDP grow th slow -dow n in the past year, its large f iscal and current account deficits, and persistent inf lation raise concerns about its economic outlook. In recent months, the government has taken some steps to ease Foreign Direct Investment (FDI) restrictions in certain sectors and to improve corporate governance law s. How ever, further policy reforms have been hung up in a stalemated parliament giving rise to uncertainty about the pace and eff icacy of additional measures for improving the investment climate.
Pow er and decision-making is decentralized in India, therefore investors should be prepared to face varying business and economic conditions across India’s 28 states and 7 union territories. There are differences at the state-level in political leadership, quality of governance, regulations, taxation, labor relations, and education levels. Although India prides itself on its rule of law , its courts have cases backlogged for years. By some accounts more than 30 million cases could be pending in various courts, including India’s high courts.
Nevertheless, companies have found w ays to succeed in this diff icult market. Indian conglomerates and high technology companies are by many measures equal in sophistication and prominence to their international counterparts. Certain industrial sectors, such as information technology, telecommunications, and engineering are globally recognized for their innovation and competitiveness. Foreign companies operating in India highlight that success requires a long-term planning horizon and a state-by-state strategy to adapt to the complexity and diversity of India’s markets.
Business Environment Indices: -- Transparency International Corruption Index (TI): India's ranking remained in the low er third tier
of countries. http://archive.transparency.org/publications/gcr -- Heritage Economic Freedom: The marginal change in India’s score reflects some improvements
in labor freedom that w ere offset by declining scores in business freedom, freedom from corruption, government spending, and monetary freedom. http://www.heritage.org/index/country/india
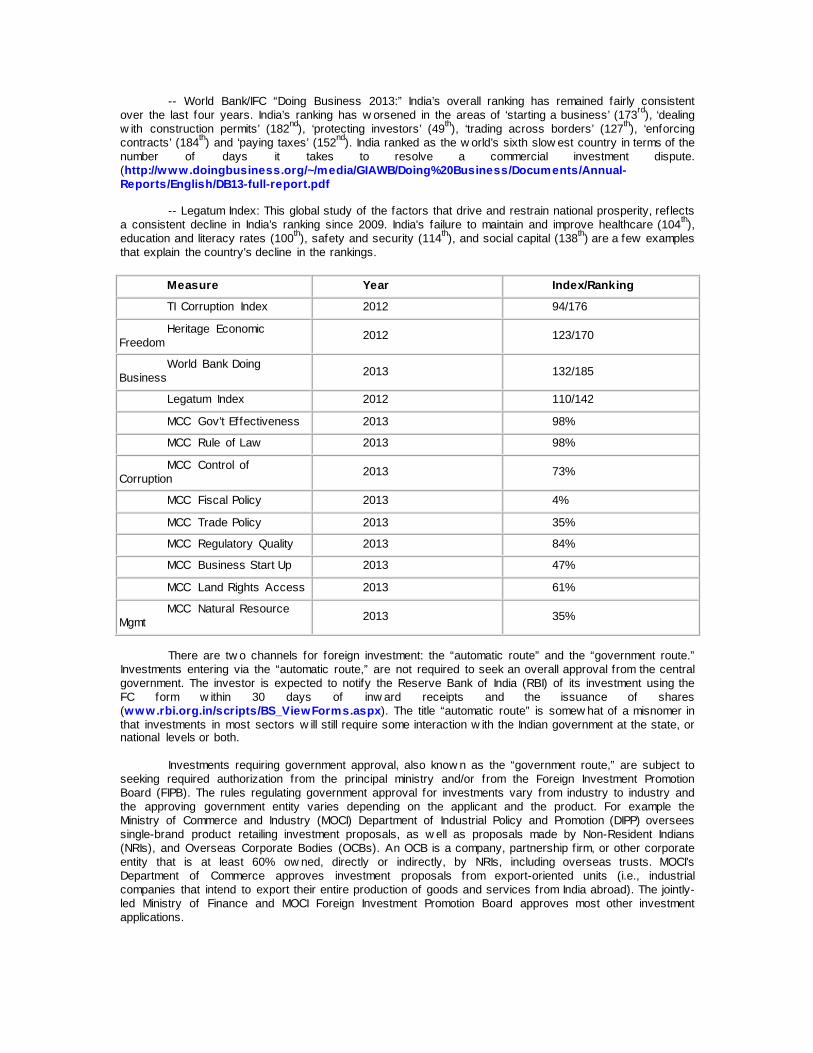
-- World Bank/IFC “Doing Business 2013:” India’s overall ranking has remained fairly consistent over the last four years. India’s ranking has w orsened in the areas of ‘starting a business’ (173rd), ‘dealing w ith construction permits’ (182nd), ‘protecting investors’ (49th), ‘trading across borders’ (127th), ‘enforcing contracts’ (184th) and ‘paying taxes’ (152nd). India ranked as the w orld’s sixth slow est country in terms of the number of days it takes to resolve a commercial investment dispute. (http://www.doingbusiness.org/~/media/GIAWB/Doing%20Business/Documents/Annual-Reports/English/DB13-full-report.pdf
-- Legatum Index: This global study of the factors that drive and restrain national prosperity, reflects
a consistent decline in India’s ranking since 2009. India's failure to maintain and improve healthcare (104th), education and literacy rates (100th), safety and security (114th), and social capital (138th) are a few examples that explain the country's decline in the rankings.
Measure Year Index/Ranking
TI Corruption Index 2012 94/176
Heritage Economic Freedom 2012 123/170
World Bank Doing Business 2013 132/185
Legatum Index 2012 110/142
MCC Gov’t Effectiveness 2013 98%
MCC Rule of Law 2013 98%
MCC Control of Corruption 2013 73%
MCC Fiscal Policy 2013 4%
MCC Trade Policy 2013 35%
MCC Regulatory Quality 2013 84%
MCC Business Start Up 2013 47%
MCC Land Rights Access 2013 61%
MCC Natural Resource Mgmt 2013 35%
There are tw o channels for foreign investment: the “automatic route” and the “government route.”
Investments entering via the “automatic route,” are not required to seek an overall approval from the central government. The investor is expected to notify the Reserve Bank of India (RBI) of its investment using the FC form w ithin 30 days of inw ard receipts and the issuance of shares (www.rbi.org.in/scripts/BS_ViewForms.aspx). The title “automatic route” is somew hat of a misnomer in that investments in most sectors w ill still require some interaction w ith the Indian government at the state, or national levels or both.
Investments requiring government approval, also know n as the “government route,” are subject to
seeking required authorization from the principal ministry and/or from the Foreign Investment Promotion Board (FIPB). The rules regulating government approval for investments vary from industry to industry and the approving government entity varies depending on the applicant and the product. For example the Ministry of Commerce and Industry (MOCI) Department of Industrial Policy and Promotion (DIPP) oversees single-brand product retailing investment proposals, as w ell as proposals made by Non-Resident Indians (NRIs), and Overseas Corporate Bodies (OCBs). An OCB is a company, partnership f irm, or other corporate entity that is at least 60% ow ned, directly or indirectly, by NRIs, including overseas trusts. MOCI’s Department of Commerce approves investment proposals from export-oriented units (i.e., industrial companies that intend to export their entire production of goods and services from India abroad). The jointly-led Ministry of Finance and MOCI Foreign Investment Promotion Board approves most other investment applications.

All new investments require a number of industrial approvals and clearances from different authorities such as Pollution Control Board, Chief Inspector of Factories, Electricity Board, and Municipal Corporation (locally elected entities), among others. To fast track the approval process for investments greater than $200 million, the Government of India in December 2012 established the Cabinet Committee on Investment (CCI). CCI is led by the Prime Minister and is expected to fast track large new investment proposals.
Sector-Specific Guidelines for FDI in key industries -- Banking: Aggregate foreign investment from all sources in all private banks is capped at 74%. For state-ow ned banks, the foreign ow nership limit is 20%. According to the 2011 road map for foreign bank entry, there are three distinct w ays to enter the Indian banking sector. The f irst is by establishing a branch in India. The second is to establish a w holly ow ned subsidiary, although it is important to note that foreign banks are permitted to have either branches or subsidiaries, but not both. The third is to establish a subsidiary w ith total foreign investment of up to 74%. Foreign investors are also allow ed to acquire an ailing bank. Although the RBI has never authorized this type of transaction, FII is limited to 10% of the total paid-up capital and 5% in cases w here the investment is from a foreign bank/bank group. Voting rights in private banks and state-ow ned banks are currently capped at 10% and 1%, respectively, and are not considered ow nership. The Banking Regulation (Amendment) Bill, w hich w ould align voting rights in private banks w ith shareholding, remains in a Parliamentary committee and has yet to be introduced. -- Manufacturing: 100% FDI is allow ed in most sub-categories of the manufacturing sector. How ever, the government maintains set asides for MSEs (Micro and Small Enterprises). The Government of India definition for ‘MSE’ is a company w ith less than $1 million in plant and machinery. Any investment in manufacturing that w ould not qualify as an MSE and manufactures items reserved for the MSE sector must enter via the Government route for FDI greater than 24%. Since 1997, the government has steadily decreased the number of sectors it protects under the national small-scale industry (SSI) policy. At its peak in the late 1990s, more than 800 categories w ere protected. The list is publicly available here: http://w w w .dcmsme.gov.in/publications/reserveditems/reserved2010.pdf. The 2011 National Manufacturing Policy (NMP) provides the framew ork for India’s local manufacturing requirements in various sectors including in the Information and Communications Technology (ICT) and clean energy sectors. -- Non-Banking Financial Companies (NBFC): 100% FDI is allow ed via the automatic route. NBFCs include: merchant banking, underw riting, portfolio management, f inancial consulting, stock-brokerage, asset management, venture capital, credit rating agencies, housing f inance, leasing and f inance, credit card businesses, foreign exchange brokerages, money changers, factoring and custodial services, investment advisory services, and micro and rural credit. All investments are subject to the follow ing minimum capitalization norms: $500,000 upfront for investments w ith up to 51% foreign ow nership; $5 million upfront for investments w ith 51% to 74.9% ow nership; $50 million total, w ith $7.5 million required up-front and the remaining balance w ithin 24 months, for investments w ith more than 75% ow nership. 100% foreign-ow ned NBFCs, w ith a minimum capitalization of $ 50 million, are allow ed to set up unlimited numbers of subsidiaries for specif ic NBFC activities and are not required to bring in additional capital. Sector % FDI Route Note
Advertising and Film 100% Automatic Includes f ilm production, exhibition, distribution, and related services and products
Agriculture (Farming) None
Agriculture-related Activities
100% Automatic Seed industry, f loriculture, horticulture, animal husbandry, aquaculture, f ish farming, and cultivation of vegetables and mushrooms
100% Government Tea plantations. Five years after making the initial investment in a tea plantation, foreign investors are required divest ow nership to allow for at least 26% Indian ow nership.
Airline Carriers (air transport services) 49% Government
Scheduled and non-scheduled airline carriers also (NRIs may ow n 100% of a domestic airline.) The decision w as announced in September, 2012, by the Cabinet Committee on Economic Affairs. Investments are

required to follow relevant SEBI regulations that include the Issue of Capital and Disclosure Requirements (ICDR) Regulations and the Substantial Acquisition of Shares and Takeovers (SAST) Regulations. (http://pib.nic.in/new site/PrintRelease.aspx?relid=87785)
74% Automatic Non-scheduled, chartered, and/or cargo airlines.
100% Automatic Investments in helicopter and seaplane services. Investors are required to seek approval from the Directorate General of Civil Aviation.
Airport Infrastructure
100% Automatic Green-field projects
74% Automatic Existing projects. FDI greater than 74% requires FIPB approval
49% Automatic Ground-handling businesses at airports. (NRIs are allow ed 100%). 49-74% Government
100% Automatic Maintenance and repair operations, f light training institutes, and technical training institutes.
Alcoholic Distillation and Brew ing 100% Automatic Requires a license from DIPP under the provisions of the
Industries (Development and Regulation) Act, 1951.
Asset Reconstruction Companies 49% Government
(FII is not allow ed)Where any individual investment exceeds 10% of the equity, investors are required to seek approval as delineated in the Securitization and Reconstruction of Financial Assets and Enforcement of Security Interest (SARFAESI) Act, 2002.
Automobiles 100% Automatic Local content requirements and/or export obligations apply.
Broadcasting
26% Government
(FDI, NRI, persons of Indian origin, and portfolio investment) frequency modulation terrestrial broadcasting. Subject to guidelines issued by the Ministry of Information and Broadcasting
49% Automatic Direct-to-home broadcasting and mobile TV. TV channels, irrespective of ow nership or management control, have to up-link from India and comply w ith the broadcast code issued by the Ministry of Information and Broadcasting.
74% Government
26% Government New s and current affairs channels w ith up-linking from India, including portfolio investment
100% Government Entertainment and general interest channels
49% Government Establishing up-linking hub/teleports (http://pib.nic.in/new site/PrintRelease.aspx?relid=87787)
Business Services 100% Automatic
Data processing, softw are development, and computer consultancy services. One hundred% FDI is allow ed for call centers and business processing outsourcing (BPO) organizations, subject to certain conditions.
Cable Netw ork 49% Approval is required, as articulated in the Cable Television Netw orks Rules, 1994
Coal/Lignite
100% Setting up or operating pow er projects and coal mines for captive consumption.
100% Automatic Coal processing plants, so long as the equity recipient does not sell processed coal in the open market.
100 Automatic Mining of coal or lignite for captive consumption
Coffee and Rubber 100% Automatic
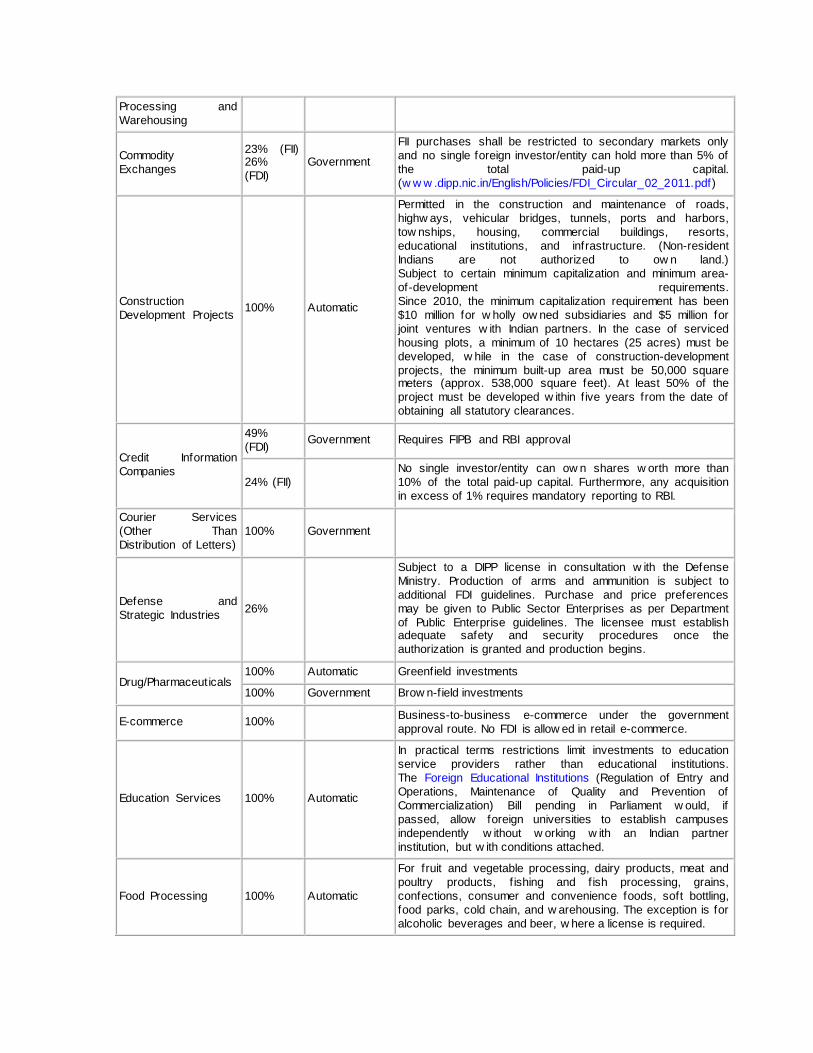
Processing and Warehousing
Commodity Exchanges
23% (FII) 26% (FDI)
Government
FII purchases shall be restricted to secondary markets only and no single foreign investor/entity can hold more than 5% of the total paid-up capital. (w w w .dipp.nic.in/English/Policies/FDI_Circular_02_2011.pdf)
Construction Development Projects 100% Automatic
Permitted in the construction and maintenance of roads, highw ays, vehicular bridges, tunnels, ports and harbors, tow nships, housing, commercial buildings, resorts, educational institutions, and infrastructure. (Non-resident Indians are not authorized to ow n land.) Subject to certain minimum capitalization and minimum area-of-development requirements. Since 2010, the minimum capitalization requirement has been $10 million for w holly ow ned subsidiaries and $5 million for joint ventures w ith Indian partners. In the case of serviced housing plots, a minimum of 10 hectares (25 acres) must be developed, w hile in the case of construction-development projects, the minimum built-up area must be 50,000 square meters (approx. 538,000 square feet). At least 50% of the project must be developed w ithin f ive years from the date of obtaining all statutory clearances.
Credit Information Companies
49% (FDI) Government Requires FIPB and RBI approval
24% (FII) No single investor/entity can ow n shares w orth more than 10% of the total paid-up capital. Furthermore, any acquisition in excess of 1% requires mandatory reporting to RBI.
Courier Services (Other Than Distribution of Letters)
100% Government
Defense and Strategic Industries 26%
Subject to a DIPP license in consultation w ith the Defense Ministry. Production of arms and ammunition is subject to additional FDI guidelines. Purchase and price preferences may be given to Public Sector Enterprises as per Department of Public Enterprise guidelines. The licensee must establish adequate safety and security procedures once the authorization is granted and production begins.
Drug/Pharmaceuticals 100% Automatic Greenfield investments
100% Government Brow n-field investments
E-commerce 100% Business-to-business e-commerce under the government approval route. No FDI is allow ed in retail e-commerce.
Education Services 100% Automatic
In practical terms restrictions limit investments to education service providers rather than educational institutions. The Foreign Educational Institutions (Regulation of Entry and Operations, Maintenance of Quality and Prevention of Commercialization) Bill pending in Parliament w ould, if passed, allow foreign universities to establish campuses independently w ithout w orking w ith an Indian partner institution, but w ith conditions attached.
Food Processing 100% Automatic
For fruit and vegetable processing, dairy products, meat and poultry products, f ishing and f ish processing, grains, confections, consumer and convenience foods, soft bottling, food parks, cold chain, and w arehousing. The exception is for alcoholic beverages and beer, w here a license is required.
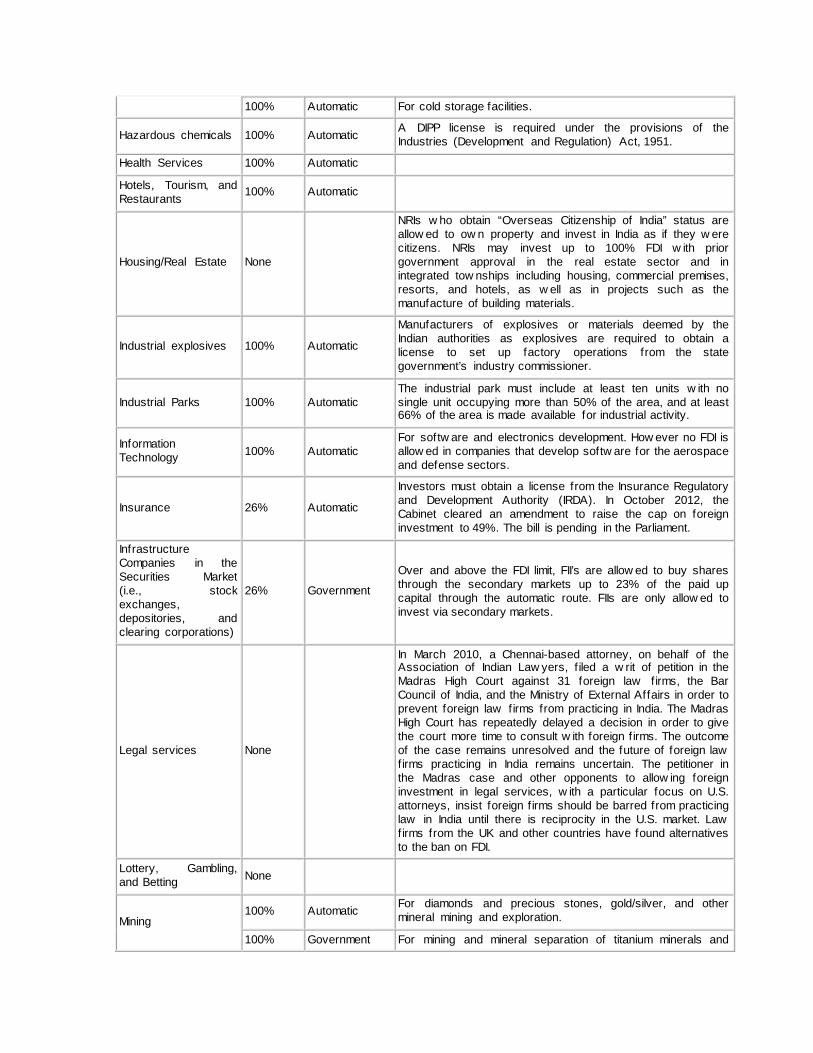
100% Automatic For cold storage facilities.
Hazardous chemicals 100% Automatic A DIPP license is required under the provisions of the Industries (Development and Regulation) Act, 1951.
Health Services 100% Automatic
Hotels, Tourism, and Restaurants 100% Automatic
Housing/Real Estate None
NRIs w ho obtain “Overseas Citizenship of India” status are allow ed to ow n property and invest in India as if they w ere citizens. NRIs may invest up to 100% FDI w ith prior government approval in the real estate sector and in integrated tow nships including housing, commercial premises, resorts, and hotels, as w ell as in projects such as the manufacture of building materials.
Industrial explosives 100% Automatic
Manufacturers of explosives or materials deemed by the Indian authorities as explosives are required to obtain a license to set up factory operations from the state government’s industry commissioner.
Industrial Parks 100% Automatic The industrial park must include at least ten units w ith no single unit occupying more than 50% of the area, and at least 66% of the area is made available for industrial activity.
Information Technology 100% Automatic
For softw are and electronics development. How ever no FDI is allow ed in companies that develop softw are for the aerospace and defense sectors.
Insurance 26% Automatic
Investors must obtain a license from the Insurance Regulatory and Development Authority (IRDA). In October 2012, the Cabinet cleared an amendment to raise the cap on foreign investment to 49%. The bill is pending in the Parliament.
Infrastructure Companies in the Securities Market (i.e., stock exchanges, depositories, and clearing corporations)
26% Government
Over and above the FDI limit, FII’s are allow ed to buy shares through the secondary markets up to 23% of the paid up capital through the automatic route. FIIs are only allow ed to invest via secondary markets.
Legal services None
In March 2010, a Chennai-based attorney, on behalf of the Association of Indian Law yers, f iled a w rit of petition in the Madras High Court against 31 foreign law firms, the Bar Council of India, and the Ministry of External Affairs in order to prevent foreign law firms from practicing in India. The Madras High Court has repeatedly delayed a decision in order to give the court more time to consult w ith foreign f irms. The outcome of the case remains unresolved and the future of foreign law firms practicing in India remains uncertain. The petitioner in the Madras case and other opponents to allow ing foreign investment in legal services, w ith a particular focus on U.S. attorneys, insist foreign f irms should be barred from practicing law in India until there is reciprocity in the U.S. market. Law firms from the UK and other countries have found alternatives to the ban on FDI.
Lottery, Gambling, and Betting None
Mining 100% Automatic For diamonds and precious stones, gold/silver, and other
mineral mining and exploration.
100% Government For mining and mineral separation of titanium minerals and
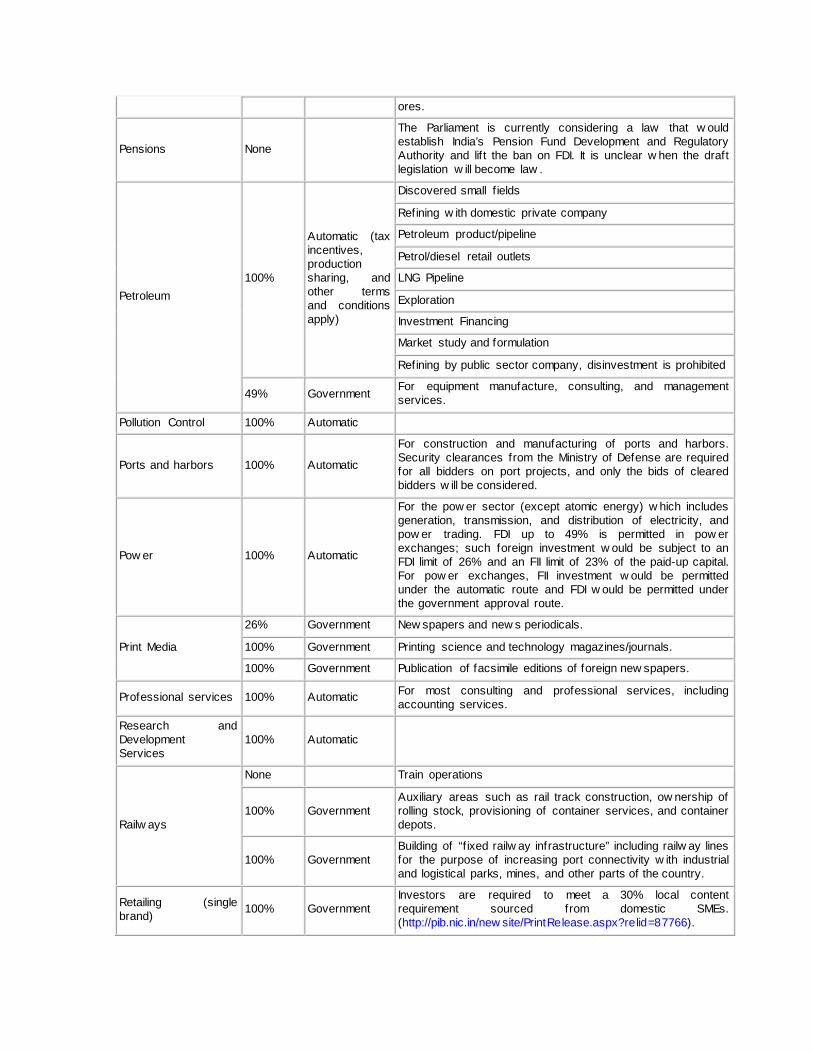
ores.
Pensions None
The Parliament is currently considering a law that w ould establish India’s Pension Fund Development and Regulatory Authority and lif t the ban on FDI. It is unclear w hen the draft legislation w ill become law .
Petroleum 100%
Automatic (tax incentives, production sharing, and other terms and conditions apply)
Discovered small f ields
Refining w ith domestic private company
Petroleum product/pipeline
Petrol/diesel retail outlets
LNG Pipeline
Exploration
Investment Financing
Market study and formulation
Refining by public sector company, disinvestment is prohibited
49% Government For equipment manufacture, consulting, and management services.
Pollution Control 100% Automatic
Ports and harbors 100% Automatic
For construction and manufacturing of ports and harbors. Security clearances from the Ministry of Defense are required for all bidders on port projects, and only the bids of cleared bidders w ill be considered.
Pow er 100% Automatic
For the pow er sector (except atomic energy) w hich includes generation, transmission, and distribution of electricity, and pow er trading. FDI up to 49% is permitted in pow er exchanges; such foreign investment w ould be subject to an FDI limit of 26% and an FII limit of 23% of the paid-up capital. For pow er exchanges, FII investment w ould be permitted under the automatic route and FDI w ould be permitted under the government approval route.
Print Media
26% Government New spapers and new s periodicals.
100% Government Printing science and technology magazines/journals.
100% Government Publication of facsimile editions of foreign new spapers.
Professional services 100% Automatic For most consulting and professional services, including accounting services.
Research and Development Services
100% Automatic
Railw ays
None Train operations
100% Government Auxiliary areas such as rail track construction, ow nership of rolling stock, provisioning of container services, and container depots.
100% Government Building of “f ixed railw ay infrastructure” including railw ay lines for the purpose of increasing port connectivity w ith industrial and logistical parks, mines, and other parts of the country.
Retailing (single brand) 100% Government
Investors are required to meet a 30% local content requirement sourced from domestic SMEs. (http://pib.nic.in/new site/PrintRelease.aspx?relid=87766).
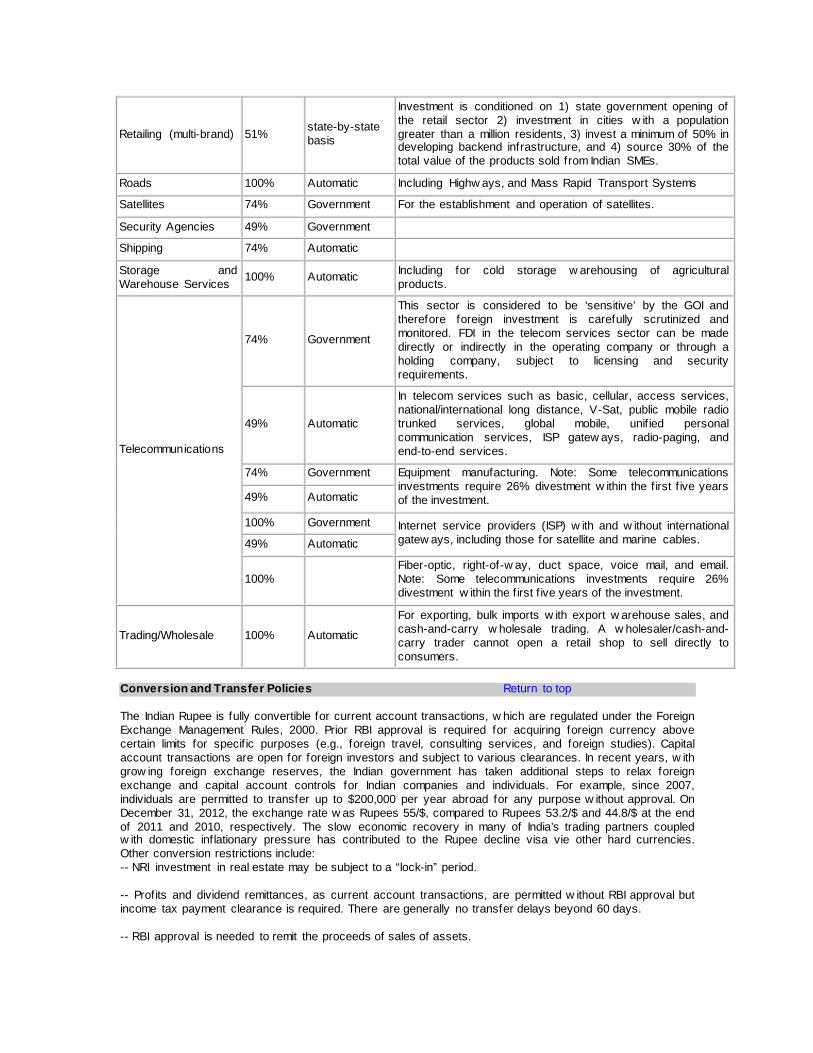
Retailing (multi-brand) 51% state-by-state basis
Investment is conditioned on 1) state government opening of the retail sector 2) investment in cities w ith a population greater than a million residents, 3) invest a minimum of 50% in developing backend infrastructure, and 4) source 30% of the total value of the products sold from Indian SMEs.
Roads 100% Automatic Including Highw ays, and Mass Rapid Transport Systems
Satellites 74% Government For the establishment and operation of satellites.
Security Agencies 49% Government
Shipping 74% Automatic
Storage and Warehouse Services 100% Automatic Including for cold storage w arehousing of agricultural
products.
Telecommunications
74% Government
This sector is considered to be ‘sensitive’ by the GOI and therefore foreign investment is carefully scrutinized and monitored. FDI in the telecom services sector can be made directly or indirectly in the operating company or through a holding company, subject to licensing and security requirements.
49% Automatic
In telecom services such as basic, cellular, access services, national/international long distance, V-Sat, public mobile radio trunked services, global mobile, unif ied personal communication services, ISP gatew ays, radio-paging, and end-to-end services.
74% Government Equipment manufacturing. Note: Some telecommunications investments require 26% divestment w ithin the f irst f ive years of the investment. 49% Automatic
100% Government Internet service providers (ISP) w ith and w ithout international gatew ays, including those for satellite and marine cables. 49% Automatic
100% Fiber-optic, right-of-w ay, duct space, voice mail, and email. Note: Some telecommunications investments require 26% divestment w ithin the f irst f ive years of the investment.
Trading/Wholesale 100% Automatic
For exporting, bulk imports w ith export w arehouse sales, and cash-and-carry w holesale trading. A w holesaler/cash-and-carry trader cannot open a retail shop to sell directly to consumers.
Conversion and Transfer Policies Return to top The Indian Rupee is fully convertible for current account transactions, w hich are regulated under the Foreign Exchange Management Rules, 2000. Prior RBI approval is required for acquiring foreign currency above certain limits for specif ic purposes (e.g., foreign travel, consulting services, and foreign studies). Capital account transactions are open for foreign investors and subject to various clearances. In recent years, w ith grow ing foreign exchange reserves, the Indian government has taken additional steps to relax foreign exchange and capital account controls for Indian companies and individuals. For example, since 2007, individuals are permitted to transfer up to $200,000 per year abroad for any purpose w ithout approval. On December 31, 2012, the exchange rate w as Rupees 55/$, compared to Rupees 53.2/$ and 44.8/$ at the end of 2011 and 2010, respectively. The slow economic recovery in many of India’s trading partners coupled w ith domestic inf lationary pressure has contributed to the Rupee decline visa vie other hard currencies. Other conversion restrictions include: -- NRI investment in real estate may be subject to a “lock-in” period. -- Profits and dividend remittances, as current account transactions, are permitted w ithout RBI approval but income tax payment clearance is required. There are generally no transfer delays beyond 60 days. -- RBI approval is needed to remit the proceeds of sales of assets.

-- Foreign partners may sell their shares to resident Indian investors w ithout RBI approval, provided the shares w ere eligible to be repatriated out of India. -- Global Depository Receipts and American Depository Receipts proceeds from abroad may be retained w ithout restrictions except for an end-use ban on investment in real estate and stock markets. FIPB approval is required in some cases. Up to $1 million per year may be remitted for transfer of assets into India. -- Foreign institutional investors (FII) may transfer funds from Rupee to foreign currency accounts and vice-versa at the market exchange rate. They may also repatriate capital, capital gains, dividends, interest income, and any compensation from the sale of rights offerings, net of all taxes, w ithout RBI approval. The RBI authorizes automatic approval to Indian industries for the payment associated w ith foreign collaboration agreements, royalty, and lump sum fees for transfer of technology and payments for the use of trademark and brand names w ith no limits. Royalties and lump sum payments are taxed at 10%. -- Foreign banks may remit profits and surpluses to their headquarters, subject to the banks’ compliance w ith the Banking Regulation Act, 1949. Banks are permitted to offer foreign currency-Rupee sw aps w ithout limits to enable customers to hedge their foreign currency liabilities. They may also offer forw ard cover to non-resident entities on FDI deployed after 1993. Expropriation and Compensation Return to top
India's image as an investment destination w as tarnished in 2010 and 2011 by high profile graft cases in the construction and telecom sectors, exacerbating existing private sector concerns about the government of India’s uneven application of its policies. In October 2012, India's Supreme Court cancelled 122 telecom licenses and the authorized spectrum held by eight operators under w hat came to be know n as the 2G scandal. Some of the operators affected by this cancellation stated in media reporting that they may exit India rather than w ait for new market rules to be issued. The U.S. Government continues to urge the Government of India to foster an attractive and reliable investment climate by reducing barriers to investment and minimizing bureaucratic hurdles for businesses. India and its political subdivisions w ould benefit from providing a secure legal and regulatory framew ork for the private sector, as w ell as institutionalized dispute resolution mechanisms that expedite commercial disagreements.
Dispute Settlement Return to top Foreign investors frequently complain about a lack of “sanctity of contracts.” According to the World Bank, India continues to be the sixth slow est country in the w orld in terms of the total number of days it takes to resolve a dispute. Indian courts are reported to be understaffed and lacking the technology needed to resolve the current backlog of unsettled cases. Media reports estimate that India has betw een 30 and 40 million backlogged legal cases countryw ide. Former Indian Law Minister Salman Khurshid acknow ledged the need to modernize the country’s antiquated legal system to support economic grow th. According to a 2012 PRS Legislative survey, a local research center and think tank, India has seen an increase of pending cases by 30% over the last decade. In an attempt to align its adjudication of commercial contract disputes w ith the rest of the w orld, in 1996, India enacted the Arbitration and Conciliation Act based on the UNCITRAL (United Nations Commission on International Trade Law ) model. Foreign aw ards are enforceable under multilateral conventions like the Geneva Convention. The Indian government established the International Center for Alternative Dispute Resolution (ICADR) as an autonomous organization under the Ministry of Law and Justice to promote the settlement of domestic and international disputes through alternate dispute resolution. The World Bank funded ICADR to conduct training for mediators in commercial disputes settlement. India is a member of the New York Convention of 1958 on the recognition and enforcement of foreign arbitral aw ards. Despite having signed this agreement, the Embassy is aw are of several cases in w hich Indian f irms have f iled spurious cases w ith Indian courts to delay paying the aw ards granted in arbitration to the U.S. party. India has yet to become a member of the International Center for the Settlement of Investment Disputes. The Permanent Court of Arbitration (PCA, The Hague) and the Indian Law Ministry agreed, in 2007, to establish a regional PCA off ice in New Delhi to provide an arbitration forum to match the facilities offered at The Hague at a far low er cost. Since then, no further progress has been made in establishing the off ice. In November 2009, the Department of Revenue’s Central Board of Direct Taxes established eight dispute resolution panels (DRPs) across the country to settle the transfer-pricing tax disputes of domestic and foreign companies in a faster and more cost-effective manner.

Performance Requirements and Incentives Return to top The government is currently pursuing local content requirements in specif ic areas including ICT, electronics, and clean energy to increase the manufacturing sector’s contribution to GDP. Foreign investors in India express concern about these policies and the negative impact they may have on India’s investment climate, especially if the GOI applies local content requirements to the private sector. The GOI has already issued f inalized notif ications on local content requirements for ICT equipment in government procurement. http://commerce.nic.in/whatsnew/National_Manfacturring_Policy2011.pdf Companies are free to select the location of their industrial projects. Foreign investors complain that antiquated land acquisition law s and uneven zoning regulations prevent them from establishing factories in their preferred location. The Ministry of Commerce and Industry, in recognition of the trouble foreign and domestic investors experience in acquiring land, has set aside land for 14 integrated industrial tow nships called National Investment and Manufacturing Zones (NIMZs). NIMZs offer investors a one-stop-approval process for investment; state-of-the-art infrastructure; pre-zoned land for industrial use; and other tax benefits. Seven basic NOC’s (No Objection Certif icate’s) are required for almost all investments and projects:
1. Tree Authority 2. Storm Water and Drain Department 3. Sew erage Department 4. Hydraulic Department 5. Environmental Department (concerned w ith debris management) 6. Traff ic and Coordination Department 7. CFO (f ire department clearance)
Visa Regulations: Foreign nationals executing projects and/or contracts in India are required to obtain an “employment” visa. All foreigners (including foreigners of Indian origin) visiting India for more than 180 days -- Student Visa, Medical Visa, Research Visa and Employment Visa -- are required to register w ith the Foreigners Regional Registration Officer (FRRO) in Delhi or the Foreigners Registration Officer (FRO) in their jurisdiction w ithin 14 days of their arrival. The employment of foreigners for periods longer than 12 months requires the approval of the Ministry of Home Affairs (MHA). Recently, MHA eased the rule requiring foreign nationals traveling to India on a multiple-entry Indian tourist visa to w ait a minimum of tw o months betw een visits to India, eliminating it entirely for most travelers. The Department of Telecommunications under the Ministry of Communications and Information Technology closely monitors the employment of foreign nationals in the telecom sector. Senior leadership and managers of the security operations, among others, are required to be citizens of India or obtain a security clearance from the Ministry of Home Affairs (MHA). More details regarding this and related rules are available on the MHA w ebsite: http://mha.nic.in/foreigDiv/pdfs/TourVISA-Schm.pdf. Taxes: The GOI provides a 10-year tax holiday for know ledge-based start-ups. Many states use local tax incentives to attract investment, and these benefits vary by state and by sector. Recent Government of India efforts to strengthen general anti-avoidance rules (GAAR) and expand tax authorities’ purview to collect taxes retrospectively on the indirect transfer of shares have created concerns and uncertainties for foreign investors. A coordinated international effort to dissuade the government from implementing these law s in 2012 resulted in a one-year reprieve that may be extended to 2016. Private industry remains hopeful the Government of India w ill follow through w ith promises to overhaul India’s direct and indirect tax regime. In 2009, the Government of India announced its intention to implement a Goods and Services Tax (GST) and streamline its Direct Tax Code (DTC). GST seeks to standardize taxes levied at all points in the supply chain concurrently by both the central and state governments. A GST w ould replace and harmonize India under one tax regime by eliminating national and state Value-Added Taxes (VATs), central excise taxes, and a number of other state-level taxes. Parliamentary gridlock and uneven support from the state governments have stalled progress. GST is considered by many economists to be one of the most critical reforms the government could undertake. Some economists estimate that moving to GST could increase India’s GDP grow th by 2%. Exports: In August 2009, MOCI released its foreign trade policy for f iscal years 2009-14, w hich highlighted various incentives for exporters w ith a particular emphasis on labor intensive sectors such as textiles, processed foods, leather, gems and jew elry, tea, and handloom-made items. The duty credit extended to exporters under this scheme is 3% of the free-on-board (FOB) export value. Exporters are also allow ed to import machinery and capital goods duty free. More information can be found here: http://dgft.gov.in/
Right to Private Ownership and Establishment Return to top Foreign and domestic private entities are allow ed to establish and ow n businesses in trading companies, subsidiaries, joint ventures, branch off ices, project off ices, and liaison off ices, subject to certain sector-specif ic restrictions. The Government of India does not permit investment in real estate by foreign investors, except for company property used to do business and for the development of most types of new commercial and residential properties. FIIs can now invest in Initial Public Offerings (IPOs) of companies engaged in real estate. They can also participate in pre-IPO placements undertaken by such real estate companies w ithout regard to FDI stipulations. To establish a business, various government approvals and clearances are required including incorporation of the company and registration under the State Sales Tax Act and Central and State Excise Acts’ zoned area; obtain environmental site approval; seek authorization for electricity and f inancing; and obtain appropriate approvals for construction plans from the respective state and municipal authorities. Promoters also need to obtain industry-specif ic environmental approvals in compliance w ith the Water and Air Pollution Control Acts. Petrochemical complexes, petroleum refineries, cement thermal pow er plants, bulk drug makers, and manufacturers of fertilizers, dyes, and paper, among others, must obtain clearance from the Ministry of Environment and Forests. The Foreign Exchange Management Regulations and the Foreign Exchange Management Act set forth the rules that allow foreign entities to ow n immoveable property in India and convert foreign currencies for the purposes of investing in India. These regulations can be found (http://rbi.org.in/scripts/BS_FemaNotifications.aspx?Id=175) and (http://www.rbi.org.in/scripts/fema.aspx). A foreign investment via the automatic route is allow ed the same rights as a citizen for the purchase of immovable property in India in connection w ith an approved business activity Protection of Property Rights Return to top India has adequate copyright law s, but enforcement is w eak and piracy of copyrighted materials is w idespread. India is a party to the Berne Convention, UNESCO, and the World Intellectual Property Organization (WIPO). In 2012, India amended its copyright law s and signed WIPO’s Beijing Treaty on the Protection of Audiovisual Performances. How ever, the copyright law still contains several broad exceptions for personal use and “fair dealing,” w eak protection against unlaw ful circumvention of technological protection measures, and lacks an effective notice and take-dow n system for online infringing materials. India updated its trademark law in recent years to bring it closer to international standards for f iling and granting trademarks. India’s Intellectual Property Off ice plans to implement trademark application f iling under the Madrid Protocol in 2013. This means that a single application can be used to register a trademark in any of the 84 member countries of the Madrid Protocol. Pharmaceutical and agro-chemical products can be patented in India. Plant varieties are protected by the Plant Varieties and Farmers’ Rights Act. Softw are embedded in hardw are may also be patented. How ever, the interpretation and application of the patent law lacks clarity, especially w ith regard to several important areas such as: compulsory license, pre-grant opposition provisions, and defining the scope of patentable inventions (e.g., w hether patents are limited to new chemical entities rather than incremental innovation). In 2012, India issued its f irst compulsory license for a patented pharmaceutical. In the case of Natco vs. Bayer, an Indian generics company called Natco sought and w as granted a compulsory license under India’s law s to make a generic version of Bayer’s kidney drug, Nexavar. Indian law does not protect against the unfair commercial use of test data or other data submitted to the government during the application for market approval of pharmaceutical or agro-chemical products. The Pesticides Management Bill (2008), w hich w ould allow data protection of agricultural chemical provisions, is stalled in Parliament. Indian law provides no statutory protection of trade secrets. The Designs Act meets India’s obligations under TRIPS (Trade-Related Aspects of Intellectual Property Rights) for industrial designs. The Designs Rules, w hich detail classif ication of design, conform to the international system and are intended to take care of the proliferation of design-related activities in various f ields. India’s Semiconductor Integrated Circuits Layout Designs Act is based on standards developed by WIPO; how ever, this law remains inactive due to the lack of implementing regulations. Transparency of Regulatory System Return to top
Despite progress, the Indian economy is still constrained by excessive rules and an overly complex bureaucratic system that has broad discretionary pow ers. India has a decentralized federal system of government in w hich states possess extensive regulatory pow ers. Regulatory decisions governing important issues such as zoning, land-use, and the environment vary betw een states. Opposition from labor unions and political constituencies slow s the pace of reform in land acquisition, environmental clearances, investment policy, and labor rights. The Central government has been successful in establishing independent and effective regulators in telecommunications, securities, insurance, and pensions. The Competition Commission of India (CCI), India's antitrust body, has started using its enforcement pow ers and is now taking cases against cartelization and abuse of dominance, as w ell as conducting capacity-building programs. In December 2012, the Government of India introduced amendments to the Competition Act 2002 that w ould empow er CCI to order search and seizure operations. Currently the commission’s investigation w ing is required to seek the approval of the local chief metropolitan magistrate for a search and seizure operation. In June 2011, the government enacted rules governing mergers and acquisitions. The Securities and Exchange Bureau of India (SEBI) enforces corporate governance and is w ell regarded by foreign institutional investors. In December 2012, the Lok Sabha (Low er House of Parliament) approved the Companies Bill 2011, w hich replaces the Companies Act 1956. The Bill brings India’s corporate governance rules in line w ith international standards. One aspect of the Bill that concerns foreign investors is a new mandatory rotation of audit partners. The Bill is pending approval from India’s Rajya Sabha (Upper House of Parliament) and a pro-forma authorization from the President before it w ill be in force. w hich w as introduced in Parliament in December 2011. Efficient Capital Markets and Portfolio Investment Return to top Indian capital markets are grow ing. The combined market capitalizations of the Bombay Stock Exchange (BSE) and the National Stock Exchange (NSE) surpassed $2.4 trillion in mid-November 2012. Low er than expected GDP grow th in India is often linked to the decline in the Indian benchmark index Sensex that is trading nearly 30% low er than its peak in January 2008. Together, the NSE and BSE account for 100% of total Indian stock market turnover. According to the World Federation of Exchanges, both the BSE and NSE rank among the top 10 bourses in the Asia-Pacif ic region in terms of market capitalization of the companies listed on their platforms. Spot prices for index stocks are usually market-driven and settlement mechanisms are in line w ith international standards. India’s debt and currency markets lag behind its equity markets. Although private placements of corporate debt have been increasing, daily trading volume remains low . Foreign portfolio investment and activities in India’s capital markets are regulated by a complex and onerous foreign institutional investor (FII) regime, analogous to China’s Qualif ied Foreign Institutional Investor regime. The FII regime sets caps on investment and the scope of business. It reflects India’ relatively closed capital account, the lack of market access for foreign f irms, and the strict regulation of the f inancial sector. FIIs investing in India’s capital markets must register w ith SEBI, India’s Securities and Exchange Commission (SEC) equivalent. They are divided into tw o categories: regular FIIs, w hich invest in both equity and debt; and 100% debt-fund FIIs. The list of eligible FIIs includes pension funds, mutual funds, banks, foreign central banks, sovereign w ealth funds, endow ment and university funds, foundations, charitable trusts and societies, insurance companies, re-insurance companies, foreign government agencies, international or multilateral organizations, broad-based funds, asset management companies, investment managers and hedge funds. FIIs must be registered and regulated by a recognized authority in their home country, meaning many US-based hedge funds cannot register as FIIs. FII registration can be made either as an investor or investor on behalf of its “accounts.” “Sub-account” means any person residing outside India on w hose behalf investments are made w ithin India by an FII. As of March 2012, there are a total of 1,765 FIIs registered in India and 6,322 sub-accounts. FIIs invested about $140 billion in India in 2011-12. While FIIs are allow ed to invest in all securities traded on India’s primary and secondary markets, unlisted domestic debt securities, and commercial paper issued by Indian companies, the Government of India imposes some restrictions based on investment type. As of November 2012, the allow ed limit for FII investment in domestic debt instruments is $65 billion. Of this, $45 billion is earmarked for investment in corporate bonds and the remaining $20 billion is earmarked for investment in government securities. On November 30, the Finance Minister announced an increase in FII limits in government securities and corporate bonds by $5 billion each, taking the total investment limit in domestic debt to $75 billion. The RBI is expected to release detailed guidelines soon. In the equities market, FII and sub-accounts can ow n up to 10% and 5%, respectively, of the paid-up equity capital of any Indian
company. Aggregate investment in any Indian company by all FIIs and sub-accounts is also capped at 24%, unless specif ically authorized by that company’s board of directors. “Naked short selling” is not permitted. FIIs are not permitted to participate in the new currency futures markets. Foreign f irms and persons are prohibited from trading in commodities. SEBI allow s foreign brokers to w ork on behalf of registered FIIs. FIIs can also bypass brokers and deal directly w ith companies in open offers. FII bank deposits are fully convertible and their capital, capital gains, dividends, interest income, and any compensation from the sale of rights offerings, net of all taxes, may be repatriated w ithout prior approval. NRIs are subject to separate investment limitations. They can repatriate dividends, rents, and interest earned in India and their specially designated bank deposits are fully convertible. Qualif ied Foreign Investors (QFIs) are allow ed to invest in the equity and debt schemes of mutual funds and equities. QFIs are defined as individuals, groups, or associations that reside in a Financial Action Task Force (FATF)-compliant foreign country, a country that is a signatory to the International Organization of Securities Commissions’ (IOSCO) multilateral Memorandum of Understanding, or a signatory of a bilateral MoU w ith SEBI. Limits on individual and aggregate investment for QFIs are 5% and 10% of the company’s paid-up capital, respectively. These limits are over and above the cap earmarked for foreign institutional investors (FIIs) and non-resident individuals (NRIs), w ho can invest directly in the Indian equity market. Foreign Venture Capital Investors (FVCIs) need to register w ith SEBI to invest in Indian f irms. They can also set up a domestic asset management company to manage the fund. All such investments are allow ed under the automatic route, subject to SEBI and RBI regulations and FDI policy. FVCIs can invest in many sectors including softw are business, information technology, pharmaceutical and drugs, bio-technology, nano-technology, biofuels, agriculture, and infrastructure. Companies incorporated outside India can raise capital in India’s capital market through the issuance of Indian Depository Receipts (IDRs). These transactions are subject to SEBI monitoring per the follow ing conditions: www.rbi.org.in/Scripts/NotificationUser.aspx?Id=5185&Mode=0. Companies are required to have pre-issued, paid-up capital and have free reserves of least $100 million, as w ell as an average turnover of $500 million during the three f inancial years preceding the issuance. In addition, the company must have been profitable for at least f ive years preceding the issuance, declaring dividends of not less than 10% each year and maintaining a pre-issue debt-equity ratio of not more than 2:1. Standard Chartered Bank, a British bank w hich w as the f irst foreign entity to list in India in June 2010, is the only f irm to have issued IDRs. In July 2011, a SEBI directive placed restrictions on conversion of actively traded IDRs in shares. The new SEBI directive describes illiquidity as an annualized turnover for the previous six months that is less than 5% of the total numbers of IDRs issued. External Commercial Borrow ing (ECB or direct lending to Indian entities by foreign institutions and non-banking f inance companies) is allow ed if the funds w ill be used for outw ard FDI or domestically for investment in industry, infrastructure, hotels, hospitals, or softw are. ECBs may not be used for on-lending, w orking capital, f inancial assets, or acquiring real estate or a domestic f irm. In December 2012, the RBI allow ed developers/builders for low cost affordable housing projects and housing f inance companies w ho f inance ow ners of low cost housing units, and micro f inance institutions and non-government organizations engaged in micro f inance activities to avail themselves of ECBs. As of December 2012, the all-in-costs ceilings for ECBs w ith an average maturity period of three to f ive years w as capped at 350 basis points over six month LIBOR and 500 points for loans maturing after f ive years. As the cost of credit is signif icantly less in overseas markets, Indian companies have borrow ed close to $27.8 billion in foreign currency through ECBs and FCCBs in the January-October 2012 period, of w hich $17 billion w as via the automatic route. Takeover regulations require disclosure upon acquisition of shares exceeding 5% of total capitalization. SEBI regulations require that any acquisition of 15% or more of the voting rights in a listed company w ill trigger a public offer. The public offer made by the acquiring entity (i.e., an individual, company, or other legal entity) must be for at least 20% of the company’s voting rights. Since October 2008, an ow ner holding betw een 55% and 75% of voting rights can acquire additional voting rights of up to 5% w ithout making a public offer (i.e., creeping acquisition). How ever, the buyer can make a creeping acquisition only by open market purchases and not through bulk/block/negotiated deals or preferential allotment. Furthermore, subsequent to this acquisition, the buyer’s total shares should not cross the 75% threshold. RBI and FIPB clearances are required to assume a controlling stake in an Indian company. Cross shareholding and stable shareholding are not prevalent in the Indian market. SEBI regulates hostile takeovers. Competition from State Owned Enterprises Return to top India’s public sector enterprises (PSEs), both at the central and state levels, play an important role in the country’s industrialization. As of 31st May 2012, there w ere as many as 249 CPSEs (excluding 7 insurance companies). The number of profit making Central Public Sector Enterprises (CPSEs) increased steadily from
143 CPSEs in 2004-05 to 160 CPSEs in 2010-11. The manufacturing sector constitutes the largest component of investment in CPSEs (45%) follow ed by services (35%), electricity (12%), and mining (8%). Foreigners are allow ed to invest in these sectors. The Ministry of Heavy Industries and Public Enterprises’ Department of Public Enterprises oversees CPSEs. CPSEs have a Board of Directors, w herein at least one third of the directors should be externally appointed w ithout being promoters or relatives of promoters. The chairman, managing director, and directors are appointed independently. Companies can appoint private consultants, senior retired off icers, and politically aff iliated individuals to their boards. A detailed CPSE guideline on corporate governance is listed in this w ebsite: dpe.nic.in/newsite/gcgcpse2010.pdf. As of 2011, the government had granted f ive CPSEs - Indian Oil Corporation, NTPC Limited, Oil and Natural Gas Corporation, Coal India Limited (CIL) and Steel Authority of India - “Maharatna” status, w hich allow s the management greater f inancial and operational freedom to expand the CPSE’s operations. Maharatna-designated CPSEs are allow ed to invest up to $1.1 billion w ithout government approval. The government plans to continue divesting itself of CPSEs, but intends to retain at least 51% ow nership. Foreign investors are allow ed to buy equity stakes in Maharatna and Navratna status companies via IPOs. Although there do not appear to be systemic advantages, CPSEs in some sectors enjoy pricing and bidding advantages over their private sector and foreign competitors. Over the last few years the government has increased the pace of reducing its equity ow nership in CPSEs, although there are no plans to sell majority shares of CPSEs to the private sector or to list more than 50% of the shares on any of the Indian stock exchanges. Corporate Social Responsibility Return to top The passage of the Companies Bill w ill mark a dramatic change in corporate social responsibility because the law includes a minimum requirement of spending on CSR activities companies are expected to meet. Once passed, the new legislation encourages publicly-held companies to spend 2% of annual their profits on CSR-related activities. In the proposed contribution guidelines that accompany the Bill, companies generating $200 million or more in sales, w ith a net w orth greater than $100 million, and that have earned annual profits greater than $1 million for three consecutive years must report their CSR expenditures or provide an explanation of w hy the company did not meet the minimum-voluntary CSR spending recommendation. Companies that do not report could be subject to penalties. New guidelines follow ing the passage of the Companies Bill passage have not yet been released on the Ministry’s w ebsite and CSR activities are not defined in the draft legislation. While there is w ide-spread support for encouraging more CSR activities in India, some companies have expressed concern about the lack of clarity and enforcement of the rules proposed in the Bill. Foreign companies operating in India should verify if they are subject to the Ministry of Corporate Affairs’ “National Voluntary Guidelines on Social, Environmental & Economic Responsibilities of Business,” w hich encourages large companies to voluntarily spend 2% of their profits on corporate social responsibility (CSR) activities. The guidelines also require companies to disclose details regarding their CSR-related expenditures: www.mca.gov.in/Ministry/latestnews/National_Voluntary_Guidelines_2011_12jul2011.pdf In 2012, Microsoft India w as a semifinalist in the annual Secretary of State’s Aw ard for Corporate Excellence because of its signif icant contributions to improving environmental aw areness in India. NGO’s w orking in India on CSR includes:
• ICCSR, the Indian Centre for Corporate Responsibility http://www.iccsr.org/ • Transparency International India (TII) http://www.transparencyindia.org/
TII sponsors the Advocacy and Legal Action Center, w hich runs an Anti-Corruption Hotline and provides training sessions on corporate governance and CSR. Political Violence Return to top There w ere no reported politically motivated attacks on U.S. companies operating in India in 2012. In Andhra Pradesh, protests, strikes, and violence related to the creation of a separate Telangana state continued and seem likely to continue into the foreseeable future. Local groups lodged complaints and threatened protests against U.S. companies, such as Google and Facebook, follow ing the release of the YouTube Innocence of Muslims video but no violence occurred. Communal tensions and violence in

Hyderabad’s Old City disrupted tourism and business in that area, but no U.S. companies w ere reported in the media to have been affected. Although the violence is restricted to certain areas and U.S. companies are generally not affected, city-w ide strikes have the ability to interfere w ith operations. There continue to be outbursts of violence related to insurgent movements in Jammu and Kashmir and similar events in some northeastern states. Maoist/Naxalite insurgent groups remain active in some eastern and central Indian states, including the rural areas of Bihar, Jharkhand, Chhattisgarh, West Bengal, and Orissa. Travelers to India are invited to visit the Department of State travel advisory w ebsite at: travel.state.gov/travel/cis_pa_tw/cis/cis_1139.html for the latest information and travel resources. Corruption Return to top While India’s struggle w ith f ighting corruption has heavily inf luenced Parliamentary sessions, media, and the public debate over the last year, little concrete action has been taken to curb the problem. Anti-corruption activist Arvind Kejriw al launched a series of corruption allegations against some of India’s richest and most high-profile individuals, including a senior cabinet minister, family members of the ruling party’s leader, and the president of the leading opposition party. U.S. f irms continue to point to corruption as the single greatest disincentive to doing business in India. In private conversations, foreign f irms note the lack of transparency in the rules of governance, extremely cumbersome off icial procedures, and excessive and unregulated discretionary pow ers afforded to politicians and low er-level bureaucrats as major obstacles to investing in India. India’s ranked 94 out of 174 countries surveyed in Transparency International’s Corruption Perception Index in 2012. India’s ranking, despite the national attention on the issue of combating corruption, w as nearly identical to the previous year's ranking of 95 out of 183 countries. The legal framew ork for f ighting corruption is addressed by the follow ing law s: the Prevention of Corruption Act, 1988; the Code of Criminal Procedures, 1973; the Companies Act, 1956; the Indian Contract Act, 1872; and the Prevention of Money Laundering Act, 2002. Anti-corruption law s amended since 2004, granted additional pow ers to vigilance departments in government ministries at the central and state levels and raised India’s Central Vigilance Commission (CVC) to be a statutory body. In May 2011, the GOI ratif ied the United Nations Convention against Corruption. In 2011, the Prime Minister had set an ambitious Parliamentary agenda to pass legislation intended to curb corruption. His arsenal of Bills aimed at reducing corruption included law s to create a national anti-corruption ombudsman, protect w histleblow ers, eliminate corruption in government procurement, punish bribery of foreign public off icials, address grievances against poor or corrupt delivery of government services and amendments to the Prevention of Money Laundering Act designed to expand the definition of money laundering. Most of these bills, how ever, remain stalled in Parliament. The national Right to Information Act, 2005, and equivalent state acts function similarly to the U.S. Freedom of Information Act, requiring government off icials to furnish information requested by citizens or face punitive action. The increased computerization of services, coupled w ith central and state government efforts to establish vigilance commissions, is opening up avenues to seek redress for grievances. U.S. Foreign Corrupt Practices Act: In 1977, the United States enacted the Foreign Corrupt Practices Act (FCPA), w hich makes it unlaw ful for a U.S. person, and certain foreign issuers of securities, to make a corrupt payment to foreign public off icials for the purpose of obtaining or retaining business for or w ith, or directing business to, any person. The FCPA also applies to foreign f irms and persons w ho take any act in furtherance of such a corrupt payment w hile in the United States. For more detailed information on the FCPA, see the FCPA Lay-Person’s Guide at: http://w w w .justice.gov/criminal/fraud/fcpa/ OECD Antibribery Convention: The OECD Antibribery Convention entered into force in February 1999. As of March 2009, there are 38 parties to the Convention including the United States (see http://w w w .oecd.org/dataoecd/59/13/40272933.pdf). Major exporters China, India, and Russia are not parties, although the U.S. Government strongly endorses their eventual accession to the Convention. The Convention obligates the Parties to criminalize bribery of foreign public off icials in the conduct of international business. The United States meets its international obligations under the OECD Antibribery Convention through the U.S. FCPA. India is not a party to the OECD. UN Convention: The UN Anticorruption Convention entered into force on December 14, 2005, and there are 158 parties to it as of November 2011 (http://w w w .unodc.org/unodc/en/treaties/CAC/signatories.html). The UN Convention is the f irst global comprehensive international anticorruption agreement. The UN Convention requires countries to establish criminal and other offences to cover a w ide range of acts of corruption. The UN Convention goes beyond previous anticorruption instruments, covering a broad range of
issues ranging from basic forms of corruption such as bribery and solicitation, embezzlement, trading in inf luence to the concealment and laundering of the proceeds of corruption. The Convention contains transnational business bribery provisions that are functionally similar to those in the OECD Antibribery Convention and contains provisions on private sector auditing and books and records requirements. Other provisions address matters such as prevention, international cooperation, and asset recovery. India signed the agreement in 2005 and ratif ied the agreement in 2011. Local Laws: U.S. f irms should familiarize themselves w ith local anticorruption law s, and, w here appropriate, seek legal counsel. While the U.S. Department of Commerce cannot provide legal advice on local law s, the U.S. Commercial Service can provide assistance w ith navigating the host country’s legal system and obtaining a list of local legal counsel. Assistance for U.S. Businesses: The U.S. Department of Commerce offers several services to aid U.S. businesses seeking to address business-related corruption issues. For example, the U.S. and Foreign Commercial Service can provide services that may assist U.S. companies in conducting their due diligence as part of the company’s overarching compliance program w hen choosing business partners or agents overseas. The U.S. Foreign and Commercial Service can be reached directly through its off ices in every major U.S. and foreign city, or through its Website at w w w .trade.gov/cs. The Departments of Commerce and State provide w orldw ide support for qualif ied U.S. companies bidding on foreign government contracts through the Commerce Department’s Advocacy Center and State’s Off ice of Commercial and Business Affairs http://export.gov/advocacy/. Problems, including alleged corruption by foreign governments or competitors, encountered by U.S. companies in seeking such foreign business opportunities can be brought to the attention of appropriate U.S. government off icials, including local embassy personnel and through the Department of Commerce Trade Compliance Center “Report A Trade Barrier” Website at tcc.export.gov/Report_a_Barrier/index.asp. Guidance on the U.S. FCPA: The Department of Justice’s (DOJ) FCPA Opinion Procedure enables U.S. f irms and individuals to request a statement of the Justice Department’s present enforcement intentions under the anti-bribery provisions of the FCPA regarding any proposed business conduct. The details of the opinion procedure are available on DOJ’s Fraud Section Website at w w w .justice.gov/criminal/fraud/fcpa. Although the Department of Commerce has no enforcement role w ith respect to the FCPA, it supplies general guidance to U.S. exporters w ho have questions about the FCPA and about international developments concerning the FCPA. Exporters and investors should be aw are that generally all countries prohibit the bribery of their public off icials, and prohibit their off icials from soliciting bribes under domestic law s. Most countries are required to criminalize such bribery and other acts of corruption by virtue of being parties to various international conventions discussed above. The DOJ and SEC recently published a guide to the FCPA, w hich can be found at http://w w w .justice.gov/criminal/fraud/fcpa/guide.pdf. Anti-Corruption Resources Additional resources for individuals and companies regarding combating corruption in global markets include the follow ing:
• Transparency International (TI) publishes an annual Corruption Perceptions Index (CPI). The CPI
measures the perceived level of public-sector corruption in 180 countries and territories around the w orld. The CPI is available at: http://cpi.transparency.org/cpi2011/. TI also publishes an annual Global Corruption Report w hich provides a systematic evaluation of the state of corruption around the w orld. It includes an in-depth analysis of a focal theme, a series of country reports that document major corruption related events and developments from all continents and an overview of the latest research f indings on anti-corruption diagnostics and tools. See: http://w w w .transparency.org/publications/gcr
• The World Bank Institute publishes Worldw ide Governance Indicators (WGI). These indicators assess six dimensions of governance in 213 countries, including Voice and Accountability, Political Stability and Absence of Violence, Government Effectiveness, Regulatory Quality, Rule of Law and Control of Corruption. See http://info.w orldbank.org/governance/w gi/index.asp. The World Bank Business Environment and Enterprise Performance Surveys may also be of interest and are available at: http://data.w orldbank.org/data-catalog/BEEPS.
• The World Economic Forum publishes the Global Enabling Trade Report, w hich presents the rankings of the Enabling Trade Index, and includes an assessment of the transparency of border administration (focused on bribe payments and corruption) and a separate segment on corruption and the regulatory

environment. See http://w w w .w eforum.org/s?s=global+enabling+trade+report.
• Additional country information related to corruption can be found in the U.S. State Department’s annual Human Rights Report available at http://w w w .state.gov/g/drl/rls/hrrpt/.
• Global Integrity, a nonprofit organization, publishes its annual Global Integrity Report, w hich provides
indicators for 106 countries w ith respect to governance and anti-corruption. The report highlights the strengths and w eaknesses of national level anti-corruption systems. The report is available at: http://report.globalintegrity.org/.
Bilateral Investment Agreements Return to top As of July 2012, India had concluded 82 bilateral investment agreements, including w ith the United Kingdom, France, Germany, Sw itzerland, Malaysia, and Mauritius. Of these, 72 are already in force. The complete list of agreements can be found at: http://www.finmin.nic.in/bipa/bipa_index.asp. In early 2012, media reported that Coal India lost in arbitration against an Australian f irm. The Australian f irm reportedly w on its case based on more favorable treaty language from a third country investment treaty. Since this ruling, several more cases are rumored to be in process. In February 2011, India signed Comprehensive Economic Cooperation Agreements (CEPAs)s w ith Japan and Malaysia. In 2009, India concluded a CEPA w ith ASEAN and a free trade agreement (FTA) in goods, services, and investment w ith South Korea. FTA negotiations w ith the EU and Canada are still under w ay and India is negotiating a CEPA w ith Thailand. In June 2012, the U.S. and India held the fourth round of Bilateral Investment Treaty (BIT) negotiations. India continues to seek social security totalization agreement w ith the United States. India recently concluded a totalization agreement w ith Canada. India has totalization agreements w ith Belgium, France, Germany, Sw itzerland, the Netherlands, Hungary, the Czech Republic, Denmark, and Luxembourg. The U.S. Department of Commerce’s International Trade Administration’s “Invest in America” program and “Invest India,” a joint venture betw een DIPP and the Federation of Indian Chambers of Commerce and Industry, signed a Memorandum of Intent in November 2009, to facilitate FDI in both countries. India and the United States have a double taxation avoidance treaty. OPIC and Other Investment Insurance Programs Return to top The United States and India signed an Investment Incentive Agreement in 1987, w hich covers Overseas Private Investment Corporate (OPIC) programs. OPIC is currently operating in India in the areas of renew able energy and pow er, telecommunications, manufacturing, housing, services, education, clean w ater and logistics in infrastructure, and could support an additional $200 million or more in 2013, in clean energy and other projects in India. OPIC’s total exposure in India is approximately $1.69 billion. Labor Return to top Although there are more than 20 million unionized w orkers in India, unions represent less 5% of the total w ork force. Most unions are linked to political parties. According to provisional f igures from the Ministry of Labor, 2 million w ork-days w ere lost to strikes and lockouts during the f irst nine months of 2012, as opposed to 10 million w ork-days lost in 2011, and 20 million in 2010, a marked improvement. Labor unrest occurs throughout India, though the reasons and affected sectors vary w idely. India's largest car manufacturer Maruti Suzuki experienced violent strikes in 2012. The company w as forced to shut dow n for a month leading to estimated losses around $300 million. In 2011, foreign companies in the manufacturing sector, such as General Motors, experienced labor problems in Gujarat, w hile others in the same sector report excellent labor relations. Some labor problems are the result of w orkplace disagreements over pay, w orking conditions, and union representation. Sometimes unrest is related to local political conditions beyond the companies’ control. The states of Gujarat, Kerala, Andhra Pradesh, Karnataka, and Rajasthan experience the most strikes and lockouts, according to government statistics. Sectors w ith the most labor unrest include banks, excluding insurance and pension, and the automobile industry. India’s labor regulations are among the w orld’s most stringent and complex, and limit the grow th of the formal manufacturing sector. The rules governing the payment of w ages and salaries are set forth in the Payment of Wages Act, 1936, and the Minimum Wages Act, 1948. Industrial w ages vary by state, ranging
from about $3.50 per day for unskilled w orkers to over $200 per month for skilled production w orkers. Retrenchment, closure, and layoffs are governed by the Industrial Disputes Act, 1947, w hich requires prior government permission to lay off w orkers or close businesses employing more than 100 people. Permission is not easily obtained, resulting in a high use of contract w orkers in the manufacturing sector to circumvent the law . Private f irms successfully dow nsize through voluntary retirement schemes. Foreign banks also require RBI approval to close branches. In August 2010, Parliament passed the Industrial Disputes (Amendment) Bill, 2010, w hich contains several provisions that: increase the w age ceiling prescribed for supervisors; bring disputes betw een contractors and contracted labor under the purview of the Ministry of Labor in consultation w ith relevant state or central government off ices; provide direct access for w orkers to labor courts or tribunals in case of disputes; seek more qualif ied off icers to preside over labor courts or tribunals; establish a grievance process; and empow er industrial tribunals-cum-courts to enforce decrees. Foreign-Trade Zones/Free Ports Return to top The GOI established several foreign trade zone schemes to encourage export-oriented production. These include Special Economic Zones (SEZ), Export Processing Zones (EPZ), Softw are Technology Parks (STP), and Export Oriented Units (EOU). The new est category is the National Industrial and Manufacturing Zones, of w hich there are 14 being established across India. These schemes are governed by separate rules and granted different benefits, details of w hich can be found at: www.sezindia.nic.in; www.stpi.in; and www.eouindia.gov.in/handbook_procedures.htm. SEZs are treated like foreign territory and therefore, businesses operating in SEZs are not subject to customs regulations, are not bound by FDI equity caps, receive exemptions from industrial licensing requirements, and enjoy tax holidays and other tax breaks. EPZs are industrial parks w ith incentives for foreign investors in export-oriented businesses. STPs are special zones w ith similar incentives for softw are exports. Export Oriented Units (EOUs) are industrial companies established anyw here in India that export their entire production and are granted: duty-free import of intermediate goods; income tax holidays; exemption from excise tax on capital goods, components, and raw materials; and a w aiver of sales taxes. As part of its new industrial policy, the Government of India has started to establish National Investment and Manufacturing Zones (NIMZ). Nine NIMZs are already in the planning stages and w ill be established as green-field integrated industrial tow nships w ith a minimum area of 5000 hectares. The NIMZ w ill be managed by a special purpose vehicle, headed by a government off icial. The available information about NIMZ suggests that foreign and domestic companies that establish their operations in a NIMZ w ill be able to seek government authorizations via a single approval ‘w indow ’ for all clearances. Foreign Direct Investment Statistics Return to top Table A: Inflow of FDI by top 5 countries (USD million) [FY is April 1 to March 31] Year 2007-08 2008-09 2009-10 2010-11 2011-12 2012-13*
TOTAL 24,581 27,331 25,888 21,383 35,121 14,788
Mauritius 11,096 11,229 10,376 6,987 9,942 6,757
Singapore 3,073 3,454 2,379 1,705 5,257 1,248
U.S.A. 1,089 1,802 1,943 1,170 1,115 323
U.K. 1,176 864 657 2711 7,874 611
Netherlands 695 883 899 1,213 1409 1,058
FDI/GDP(%) 2.4 3.2 3.7 1.6 2 GDP is taken at factor cost. * indicates FDI inf low s for April 2012- October 2012 only. Source: Secretariat for Industrial Assistance, Ministry of Commerce and Industry, GOI Table B: Inflow of FDI by top 5 countries (Rs billion) [FY is April 1 to March 31] Year 2007-08 2008-09 2009-10 2010-11 2011-12 2012-13*

TOTAL 987 1230 1231 973 1,651 804
Mauritius 445 508 497 318 467 367
Singapore 123 157 113 77 247 68
U.S.A. 44 80 92 53 53 17
U.K. 47 38 31 122 364 32
Netherlands 28 39 43 55 66 57
FDI/GDP(%) 2.4 3.2 3.7 1.6 2 GDP is taken at factor cost * indicates FDI inf low s for April 2012- October 2011 only. Source: Secretariat for Industrial Assistance, Ministry of Commerce and Industry, GOI Table C: FDI Inflows by Sector - Top 5 (USD millions) Sector April 2000 - October 2012 2012-13*
All Services (f in and non-fin) 35,952 3600
Computers/Softw are 11,456 251
Telecommunication 12,601 48
Construction - Development - tow nships, housing and built-up infrastructure including roads
21,430 691
* indicates data is for April - October 2012 only (FY is April 1 to March 31) Source: Secretariat for Industrial Assistance, Ministry of Commerce and Industry, GOI Table D: FDI Inflows by Sector - Top 5 (Rps billion) Sector April 2000 - October 2012 2012-13*
All Services (f in and non-fin) 1,653 195
Computers/Softw are 514 13
Telecommunication 573 2
Construction - Development - tow nships, housing and built-up infrastructure including roads
975 37
* indicates data is for April – October 2012 only (FY is April 1 to March 31) Source: Secretariat for Industrial Assistance
Return to table of contents Chapter 7: Trade and Project Financing
• How Do I Get Paid (Methods of Payment) • How Does the Banking System Operate • U.S. Banks and Local Correspondent Banks • Project Financing • Web Resources
How Do I Get Paid (Methods of Payment) Return to top Import f inancing procedures adhere to w estern business practices. The safest method of receiving payments is through an irrevocable letter of credit (L/C). The L/C should be payable in favor of the supplier against presentation of shipping documents through the importer’s bank. Importers open L/Cs valid for three to six months depending upon the terms of the agreement. Typically L/Cs are opened for a period of time to cover production and shipping, and they are normally paid w ithin seven w orking days of the receipt of goods. There are several lines of credit available to U.S companies. The most important source for f inance for the corporate sector continues to be the capital markets. Companies are not required to obtain prior permission from the GOI to access capital markets, but it is compulsory for companies to obtain Reserve Bank of India’s permission before issuing any shares to a non-resident investor. Indian companies can also issue American Depository Receipts (ADR) and Global Depository Receipts (GDR) w ithout any value limits. Several steps have been taken to improve liquidity in the ADR / GDR market abroad. Indian companies are increasingly accessing overseas markets to raise f inances through these instruments. Commercial banks continue to be the main source of short-term finance and w orking capital requirements of Indian f irms. Indian Companies also raise funds by issuing commercial paper and debentures, from inter-corporate borrow ings, and by accepting public deposits. Several term-lending public f inancial institutions provide local and foreign exchange loans for new capital investment projects. They also provide deferred payment loans, long-term w orking capital f inance, export credit and stock underw riting services. Lending banks secure their loans w ith company assets, corporate guarantees from a parent company, and, in some cases, by personal guarantees from company directors. Local and resident foreign companies are permitted to raise medium-to-long-term loans in foreign currency for projects requiring capital equipment, technology imports, or the purchase of aircraft or ships. The Indian government permits borrow ing through suppliers’ credits, buyers’ credits, syndicated loans, f loating-rate notes, revolving underw riting facilities and bonds. The RBI permits loans, w hich mature w ithin one year, to be repaid from net foreign exchange earnings w ithout prior government approval. Loans in foreign currencies can be obtained through foreign commercial banks, overseas f inancial institutions (e.g., the International Finance Corporation and the Asian Development Bank), and foreign export-credit agencies, in addition to Indian development and commercial banks. Indian companies can also raise foreign currency loans in accordance w ith the guidelines for External Commercial Borrow ings (ECBs), issued by the Ministry of Finance. There are no restrictions on the use of such loans, except that they cannot be used for stock market speculation. Once the RBI and Ministry of Finance have approved a loan and its terms, no limitations are placed on interest and principal payments. A f irm, how ever, must report to the RBI through its designated banker every time an interest payment is made. How Does the Banking System Operate Return to top India has an extensive banking netw ork, in both urban and rural areas. The banking system has three tiers. These are: the scheduled commercial banks; the regional rural banks, w hich operate in rural areas, not covered by the scheduled banks; and the cooperative and special purpose rural banks. Timely availability of adequate credit is of utmost importance for the development of the Indian rural economy and agriculture. At present Regional Rural Banks, commercial banks and credit cooperatives, encouraged mainly by the Government of India (GOI), undertake this function. The GOI, during the recent budget, announced that it w ould encourage private banks to open branches in rural areas, to service both farm and non-farm sectors. There are approximately 80 scheduled commercial banks, Indian and foreign; almost 200 regional rural banks; more than 350 central cooperative banks, 20 land development banks; and a number of primary
agricultural credit societies. Large Indian banks and most Indian f inancial institutions are in the public sector. Though public sector banks (27 of them) currently dominate the banking industry, numerous private and foreign banks exist. Several public sector banks are being restructured, and in some cases the government either has already reduced, or is in the process of reducing its ow nership. In terms of business, the state-ow ned banks account for more than 70 percent of deposits and loans. Private banks handle 17 percent of the market, and foreign banks located in metropolitan area account for approximately 13 percent of the market. The Reserve Bank of India (RBI) is the central banking institution. It is the sole authority for issuing bank notes and the supervisory body for banking operations in India. It supervises and administers exchange control and banking regulations, and administers the government's monetary policy. It is also responsible for granting licenses for new bank branches. The Deposit Insurance and Credit Guarantee Corporation, an organization promoted and fully funded by the RBI, offers deposit insurance facilities. The RBI directs banks to meet Bureau of Indian Standards guidelines. Indian banks must also adhere to the prudential norms laid dow n by the Basel Group. The Reserve Bank of India (RBI) also sets India’s exchange-control policy and administers foreign exchange regulations in consultation w ith the GOI. India's foreign exchange control regime is governed by the FEMA (Foreign Exchange Management Act), enacted w ith the objective of facilitating external trade and payments and for promoting the orderly development and maintenance of foreign exchange market in India, and to give effect to the liberalization announced in the economic policies. U.S. Banks and Local Correspondent Banks (Updated 03/13) Return to top LIST OF U.S. BANKS American Express Bank Ltd. Shailesh Baidw an Chief Executive Officer Cyber City, tow er C/8 DLF City Phase II, Sector 25 Gurgaon 122002, Haryana Telephone: 91-0124-4190555; 1800-419-1222 (Toll Free) Fax: 91-0124-2801144 Bank of America NA Kaku Nakhate Country Head and President (India) Express Tow ers 16th Floor, Nariman Point Mumbai 400 021 Telephone: 91-22-66323184 Fax: 91-22-2202 9016 J.P. Morgan Chase Ms. Kalpana Morparia Chief Executive Officer J. P. Morgan Tow er, Off CST Road, Kalina, Santacruz (E) Mumbai 400098 Tel: 91-22-61573000 Citibank N.A. Mr. Pramit Jhaveri City Country Off icer Citi Center, 5th Floor, Plot C-61 G Block, Bandra Kurla Complex Bandra (East), Mumbai 400 051, India Telephone: 91-22-40015757 Fax: 91-22-2653-5861 LIST OF U.S. FINANCIAL/LENDING INSTITUTIONS

Paula Tufro Deputy Chief of Staff Overseas Private Investment Corporation (OPIC) 1100 New York Avenue, N.W. Washington, D.C. 20527 Tel.: (202) 336-8799 Fax : (202) 408-9859 Email: [email protected] Website: http://w ww.opic.gov Raymond J. Ellis Vice President Global Business Development Division Export-Import Bank of the United States 811 Vermont Avenue, N.W., Off ice 911 Washington, DC 20571 Tel: 202-565-3674 Website: http://w ww.exim.gov Mr. Henry Steingass Regional Director U.S. Trade and Development Agency 1000 Wilson Boulevard, Suite-1600 Arlington, VA 22209 - 2131 Tel: 703-875-4357 Fax: 703-875-4009 Website: http://w ww.ustda.gov/ LIST OF REGIONAL MBD/IFI OFFICES Hun Kim Country Director- India Asian Development Bank 4, San Martin Marg P.O. Box 5331, Chanakyapuri New Delhi 110 021, India Tel: 91-11-24107200 Fax: 91-11-26870955 E-mail: [email protected] Website: http://beta.adb.org/countries/india/contacts Margaret Keshishian Director / Senior Commercial Off icer U.S. Commercial Liaison Office for ADB (CS/ADB) American Business Center 25th Floor, Ayala Life-FGU Building 6811 Ayala Avenue, Makati City, Metro Manila 1226 Philippines Tel: 63-2- 887-1345 Fax: 63-2- 887-1164 Email: Off [email protected] Website: http://export.gov/adb/aboutcsadb/index.asp Alessandro A. Pio Resident Director General ADB North American Representative Office 900 17th Street NW Suite 900 Washington DC 20006 Tel: 202-728-1500

Fax: 202-728-1505 Email: [email protected] Website: http://w ww.adb.org Anita George Regional Industry Director, Asia International Finance Corporation Maruti Suzuki Building 3rd & 4th f loor 1 Nelson Mandela Road Vasant Kunj, New Delhi 110 070 Tel: 91-11- 4111 1000/ 3000 Fax: 91-11- 4111 1001/ 3001 Email: [email protected] Website: http://w ww1.ifc.org/wps/wcm/connect/REGION__EXT_Content/Regions/South+Asia/Contacts/ Mr. Sudip Mozumder Advisor – External Affairs The World Bank 70 Lodi Estate New Delhi 110 003 Tel: 91-11-2461-7241 Fax: 91-11-2461-9393 Email: smozumder@w orldbank.org Website: http://w ww.worldbank.org David Fulton Advisor & Director of Business Liaison Office of the U.S. Executive Director U.S. Trade Advocacy Center Phone: (202) 458-0120 Fax: (202) 477-2967 E-mail: [email protected] Website: http://export.gov/w orldbank/contactus/index.asp Project Financing Return to top THE EXPORT-IMPORT BANK OF THE UNITED STATES The Export-Import Bank (Ex-Im Bank) is the off icial export credit agency of the United States and supports the purchase of U.S. goods and services by creditw orthy Indian buyers that may have diff iculty obtaining credit through traditional f inancing sources. Ex-Im Bank provides U.S. exporters w ith the f inancing tools they need to successfully compete for business in India. Ex-Im Bank support gives protection against international political and commercial risk, and gives U.S. exporters the ability to offer competitive f inancing to their Indian buyers through export credit insurance and loan guarantees. Over the past 70 years, Ex-Im Bank has supported more than $400 billion of U.S. exports w orldw ide. For more info on Ex-Im Bank please visit w ebsite: http://w w w .exim.gov. THE OVERSEAS PRIVATE INVESTMENT CORPORATION The Overseas Private Investment Corporation (OPIC) is an independent U.S. government agency w hose mission is to mobilize and facilitate the participation of U. S. private capital and skills in the economic and social development of less developed countries and areas, and countries in transition from non-market to market economies. OPIC assists U.S. companies by providing f inancing (from large structured f inance to small business loans), political risk insurance, and investment funds. OPIC complements the private sector in managing risks associated w ith foreign direct investment and supports U.S. foreign policy. OPIC w as established as an agency of the U.S. government in 1971 and currently does business in over 150 countries. For more info on OPIC please visit w ebsite: http://w w w .opic.gov/ U.S. TRADE AND DEVELOPM ENT AGENCY (USTDA)
The U.S. Trade and Development Agency (USTDA) advances economic development and U.S. commercial interests in developing and middle income countries. The agency funds various forms of technical assistance, feasibility studies, training, orientation visits and business w orkshops that support the development of a modern infrastructure and a fair and open trading environment. USTDA's strategic use of foreign assistance funds to support sound investment policy and decision-making in host countries creates an enabling environment for trade, investment and sustainable economic development. Operating at the nexus of foreign policy and commerce, USTDA is uniquely positioned to w ork w ith U.S. f irms and host countries in achieving the agency's trade and development goals. In carrying out its mission, USTDA gives emphasis to economic sectors that may benefit from U.S. exports of goods and services. For more information, please visit w ebsite: w w w .ustda.gov ASIAN DEVELOPM ENT BANK (ADB) Asia's premier non-profit f inancial institution, the Asian Development Bank (ADB), is headquartered in Manila, Philippines. The ADB’s major objective is the promotion of the social and economic w ell being of its developing member countries in Asia and the Pacif ic. This is achieved by lending funds to projects involving agriculture, energy, industry, transportation, and communication, as w ell as for social infrastructure projects such as w ater supply, sew age and sanitation, education, health and urban development. The ADB also invests in, and lends to, the private sector for Build-Ow n-Operate (BOO) and Build-Operate-Transfer (BOT) infrastructure, industrial and capital market development projects and mobilizes additional resources through co-f inancing arrangements, including the bank’s credit enhancement instruments such as guarantees and complementary f inancing plans. To learn more about ADB’s partnership w ith India, please visit: http://w ww.adb.org/Documents/Fact_Sheets/IND.pdf The U.S. Department of Commerce maintains a Congressionally mandated Commercial Liaison Office for the ADB (CS ADB). The Office's mission is to help American f irms access, enter and expand in Asian markets that benefit from ADB assistance. The off ice provides counseling, advocacy, project information, and conducts outreach programs in the region as w ell as in the U.S. to help U.S. f irms take advantage of commercial opportunities in countries borrow ing from the ADB. To perform its mandate, the off ice cooperates w ith the U.S. Director's Off ice at ADB and w orks closely w ith Commercial Service posts in the region. An American Senior Commercial Off icer heads the off ice, assisted by tw o Commercial Specialists. THE WORLD BANK The World Bank Group is one of the w orld's largest sources of development assistance. The World Bank supports the efforts of developing country governments to build schools and health centers, provide w ater and electricity, f ight disease, and protect the environment. The "World Bank" is the name that has come to be used for the International Bank for Reconstruction and Development (IBRD) and the International Development Association (IDA). Together these organizations provide low -interest loans, interest-free credit, and grants to developing countries. For information on World Bank engagement w ith India, please visit: http://w w w .w orldbank.org.in/ The World Bank's New Delhi off ice has an active public information center w ith a large collection of World Bank and other publications on India and international development, and documents on projects f inanced by the Bank. In recent years, the World Bank’s IBRD has been giving support for India’s economic policy reforms and expanded social and environmental programs. The U.S. Department of Commerce maintains a Commercial Liaison Office at the World Bank. The Office's mission is to help American f irms access, enter and expand in markets that benefit from World Bank assistance. The off ice provides counseling, advocacy, project information, and conducts outreach programs in the region as w ell as in the U.S. to help U.S. f irms take advantage of commercial opportunities in countries borrow ing from the World Bank. INTERNATIONAL FINANCE CORPORATION (IFC) The International Finance Corporation (IFC) promotes sustainable private sector investment in developing countries as a w ay to reduce poverty and improve people's lives. IFC is a member of the World Bank Group and is headquartered in Washington, DC. It shares the primary objective of all World Bank Group institutions: to improve the quality of the lives of people in its developing member countries. Established in 1956, IFC is the largest multilateral source of loan and equity f inancing for private sector projects in the developing w orld. It promotes sustainable private sector development primarily by f inancing private sector projects located in the developing w orld; helping private companies in the developing w orld mobilize
f inancing in international f inancial markets; providing advice and technical assistance to businesses and governments. Although the IFC coordinates its activities in many areas w ith the other institutions in the World Bank Group, the IFC generally operates independently as it is legally and f inancially autonomous w ith its ow n Articles of Agreement, share capital, management and staff. The IFC fosters sustainable economic grow th in developing countries by f inancing private sector investment, mobilizing capital in the international f inancial markets, and providing advisory services to businesses and governments. For more information on IFC please visit http://w w w .ifc.org. THE MULTILATERAL INVESTMENT GUARANTEE AGENCY The Multilateral Investment Guarantee Agency (MIGA), a member of the World Bank group, supplements the activities of the IBRD (International Bank for Reconstruction and Development), IFC (International Finance Corporation) and other international development f inance institutions. It complements the activities of national and regional development insurance through co-insurance and reinsurance agreements w ith these institutions, bilateral exchanges of information, and its membership in the Berne Union. MIGA issues guarantees against noncommercial risks for investments in its developing member countries. MIGA guarantees cover the follow ing risks: currency transfer, expropriation, w ar and civil disturbance and breach of contract by a host government. Since its inception in 1988, MIGA has issued nearly 800 guarantees w orth more than $14.7 billion for projects in 91 developing countries. MIGA is committed to promoting socially, economically, and environmentally sustainable projects that are above all, developmentally responsible. The agency mobilizes additional investment coverage through its Cooperative Underw riting Program (CUP), encouraging private sector insurers into transactions they w ould not have otherw ise undertaken, and helping the agency serve more clients. For more information please visit http://w w w .miga.org. Web Resources Return to top U. S. Government web resources: Overseas Private Investment Corporation http://w w w.opic.gov Export-Import Bank of the United States http://w ww.exim.gov U.S. Trade and Development Agency http://w w w.tda.gov Small Business Administration Office of International Trade http://w w w.sba.gov/oit/ Commodity Credit Corporation https://w ww.fsa.usda.gov/FSA/w ebapp?area=fsahome&subject=landing&topic=landing U.S. Agency for International Development http://w w w.usaid.gov Multilateral Development Bank web resources: Asian Development Bank http://w w w.adb.org/countries/india/main The World Bank http:/w ww.worldbank.org Multilateral Investment Guarantee Agency http://w ww.miga.org International f inance Corporation http://w w w.ifc.org State Bank of India and associates: State Bank of Bikaner and Jaipur (SBBJ) https://w ww.sbbjbank.com/ State Bank of Hyderabad (SBH) http://w ww.sbhyd.com State Bank of India (SBI) http://w ww.sbi.co.in Nationalized banks: Bank of India http://w ww.bankofindia.co.in/english/home.aspx Bank of Maharashtra http://w ww.bankofmaharashtra.in/ Central Bank of India https://w ww.centralbankofindia.co.in/intro.html Corporation Bank http://w ww.corpbank.com Indian Overseas Bank https://w ww.iobnet.co.in/ Oriental Bank of Commerce https://w ww.obcindia.co.in/obcnew /site/index.aspx United Bank of India http://w w w.unitedbankofindia.com/ Canara Bank http://w ww.canarabank.com/ Syndicate Bank http://w w w.syndicatebank.com/

Financial Institutions: Credit Guarantee Fund Trust for Small Industries (CGTSI) http://w w w.cgtsi.org.in Economic Development Corporation Limited, Goa – http://w w w.edc-goa.com Export-Import Bank of India – http://w w w.eximbankindia.com Himachal Pradesh Financial Corporation (HPFC) - http://hpfc.nic.in/ Indian Renew able Energy Development Agency Limited (IREDA) - http://w w w.ireda.in/ Industrial Development Bank of India (IDBI) – http://w ww.idbi.com Industrial Investment Bank of India Limited (IIBI) – http://w w w.iibiltd.com Pow er Finance Corporation Limited – http://w ww.pfcindia.com Insurance Companies: Agriculture Insurance Company of India Limited http://w w w.aicofindia.com/AICEng/Pages/Default.aspx Export Credit Guarantee Corporation of India Limited (ECGC) https://w ww.ecgc.in/ Insurance Regulatory and Development Authority http://w ww.irdaindia.org/ Life Insurance Corporation of India (LIC) http://w w w.licindia.com/dbs-index.htm General Insurance Corporation of India http://gicofindia.com/index.php?lang=en Oriental Insurance Company Limited (OICL) http://orientalinsurance.nic.in/ SBI Life Insurance Company Limited (SBI LIFE) http://w w w.sbilife.co.in/ Securities and Exchanges: Securities and Exchange Board of India http://w ww.sebi.gov.in/ Inter-connected Stock Exchange of India Limited (ISE) http://w ww.iseindia.com/ National Securities Depository Limited (NSDL) http://w ww.nsdl.co.in/ National Stock Exchange (NSE), India http://w w w.nse-india.com/ Stock Exchange, Mumbai (BSE) http://w ww.bseindia.com/ Other Nationalized banks: http://w ww.iba.org.in/view membanks.asp?id=1 Return to table of contents
Return to table of contents Chapter 8: Business Travel
• Business Customs • Travel Advisory • Visa Requirements • Telecommunications • Transportation • Language • Health • Local Time, Business Hours and Holidays • Web Resources
Business Customs Return to top One of the most striking features about India is the size and diversity of the country. Given its vastness and variety, there is no single w ay to understand India. That said, there are a couple of major issues that business visitors should keep in mind: The sense of time is much different for Indians than it is for Americans. If there is a business event such as a cocktail hour at night, it may begin at 7, but expect that people w ill not show up until an hour or so later. Although many Indians are aw are of Americans’ adherence to time, business meetings can also start late, so it’s important to keep your schedule f lexible. It is considered polite in India to inquire about dietary preferences, since Hindus abstain from beef, Muslims abstain from pork, and Indians of many religions practice vegetarianism. For your reference, some popular English-language guidebooks include: Lonely Planet India, Fodor's India, and the India Eyew itness Travel Guide. Travel Advisory Return to top The U.S. Department of State consular information sheet for India can be found at: http://travel.state.gov/travel/cis_pa_tw /cis/cis_1139.html We strongly urge U.S. travelers to review this information before their trip, w hich includes updated safety and security information. Visa Requirements Return to top A passport and visa are required for U.S. citizens traveling to India for any purpose. The U.S. Government cannot assist travelers w ho arrive in India w ithout proper documentation. The Indian Embassy outsources visa collection and delivery processing to Travisa Outsourcing: 1731 21ST. ST. NW, Washington, DC 20009 http://indiavisa.travisaoutsourcing.com/ How ever, the Embassy in Washington, D.C. and Consulates in New York, San Francisco, Chicago and Houston w ill continue to receive and service emergency visa cases from applicants of Indian origin on extreme compassionate grounds. They w ill also continue to directly accept visa applications from diplomatic/off icial/laissez-passers passport holders. For current entry and customs requirements for India, travelers may contact the Embassy of India at : 2536 Massachusetts Ave., NW, Washington, DC 20008 (202-797-4693) or the nearest Consulate General: Chicago (312-595-0405/0410), Houston (713-626-2148/9), New York (212-774-0600/0610/0662) or San Francisco (415-668-0683/0662). Information is also available at: http://w ww.indianembassy.org/
U.S. Companies that require travel of foreign businesspersons to the United States can go to the follow ing link at the State Department Visa Website: http://travel.state.gov/visa/visa_1750.html Telecommunications Return to top While telecommunication service is generally adequate in India, know ing w hat digits to dial can be a little complicated, especially betw een landlines and cell phones, and w hen making international calls. The follow ing dialing instructions are w orth keeping handy: Caller in USA to Local Cell Phone [011]+91+Local Cell number Caller in USA to Local Landline [011]+91+AC+Number Local landline to int’l number 00+CC+AC+Number Local landline to local long distance 0+AC+Number Local Landline to Local Cell phone Local cell number Local Cell to India Landline 0+AC+number Local Cell to Local Cell Local cell number Local Cell to Local Cell (in another city) 0+Cell number Local Cell to Int’l long distance 00+CC+AC+Number AC = area code CC = country code The country code for India is 91 Major Indian area codes: Ahmedabad 79 Bangalore 80 Chennai 44 Delhi 11 Hyderabad 40 Kolkata 33 Mumbai 22 Pune 20 Transportation Return to top To and From India There are just a few direct f lights to India from the United States on a U.S. carrier. Flight times are 14-16 hours. Air India also f lies direct. Destination Carrier Departure City New Delhi United New ark Mumbai United New ark Getting to South or East India from the United States requires connecting, w ith the most and fastest options through Europe. United/Lufthansa has a f ight connecting through Frankfurt, Delta/Air France through Paris, and British Airw ays through London. Travelers from the West Coast might consider going through Bangkok or Singapore. Within India Travel by road in India is dangerous. A number of U.S. citizens have suffered fatal traff ic accidents in recent years. Travel at night is particularly hazardous. Buses, patronized by hundreds of millions of Indians, are convenient in that they serve almost every city of every size. How ever, they are usually driven fast, recklessly, and w ithout consideration for off icial rules of the road. Trains are somew hat safer than buses, but train accidents still occur more frequently than in developed countries. In order to drive in India, one must have either a valid Indian drivers’ license or a valid international drivers’ license. How ever, the vast majority of foreign visitors to India hire a car and driver. This is highly recommended. Travelers should remember to use seatbelts in both rear and front seats w here available, and to ask their drivers to maintain a safe speed.
Heavy traff ic is the norm and includes (but is not limited to) overloaded trucks and buses, scooters, pedestrians, bullock and camel carts, horse or elephant riders en route to w eddings, and free-roaming livestock. Traff ic in India moves on the left. It is important to be alert w hile crossing streets and intersections, especially after dark as traff ic is coming in the “w rong” direction (i.e., from the left). If a driver hits a pedestrian or a cow , the vehicle and its occupants are at risk of being attacked by pedestrians. Such attacks pose signif icant risk of injury or death to the vehicle's occupants or at least of incineration of the vehicle. It can thus be unsafe to remain at the scene of an accident of this nature, and drivers may instead w ish to seek out the nearest police station. Language Return to top Although English is considered to be the off icial language of business, it is important to keep in mind that the American accent is very diff icult for the Indian ear to understand – likew ise, the Indian accent is often diff icult for Americans to understand – so at times, w e remain divided by a common language. Remember to speak slow ly and clearly. India has a diverse list of spoken languages among different groups of people. At least 30 different languages and around 2000 dialects have been identif ied, sixteen of w hich can be found on India’s currency. The Constitution of India has stipulated the usage of Hindi as the off icial language and English as the associate off icial language for off icial communication for the national government. Additionally, it contains a list of 22 scheduled languages. Health Return to top One of the major challenges for all travelers to India is staying healthy. While adequate to excellent medical care is available in the major population centers, it is usually very limited or unavailable in rural areas, so it is important to take precaution to avoid getting sick in the f irst place. Most important is to w ash your hands at every opportunity w ith w arm soapy w ater and for at least 20 seconds. Dry them w ith a paper tow el and use the tow el to turn off faucet handles. Wash your hands particularly before you handle food, after you handle food, before you eat, and also before you touch your face. Use an alcohol hand sanitizer w hen you cannot get to a faucet. Water and Ice: Do not drink hotel or restaurant w ater. Only bottled w ater, soft drinks, beer, w ine, hot tea and coffee are considered safe. Order all drinks w ithout ice. Meat and Fish: All meat and f ish should alw ays be cooked w ell done, ordered w ell done in restaurants, and eaten hot to prevent tapew orm, trichinosis, and other unw elcome guests. Salads, unpeeled fruit and vegetables: Generally, it is not safe to eat unpeeled fruit and vegetables. But if you are so inclined, you can prepare them properly in your hotel room (see below ). As beautiful as some of the salad bars look, they should be totally avoided in restaurants and in homes w here you are not certain about the kitchen practices. Many people get sick from salad bars in the 5 star hotel restaurants. Decontamination of fresh fruits and vegetables: Buy only fruits and vegetables w ithout holes or broken skin. Wash all fruits and vegetables w ith soap and w arm w ater. Clean each w ith a vegetable brush to remove dirt. Rinse in cold tap w ater. Soak all fruits and vegetables for 20 minutes in a 5% bleach solution. Prepare 5% bleach by adding one tablespoon of Clorox (household bleach, US or foreign) to one gallon of w ater. Rinse the fruits and vegetables w ith potable bottled w ater. Drain and allow to dry before refrigerating. Local milk: The medical staff of the U.S. Embassy does not recommend drinking local milk. In restaurants milk added to tea or coffee is boiled and therefore considered safe. To be sure, ask if the milk has been boiled. Diarrhea and dysentery are usually caused by ingesting food or w ater containing viruses, parasites, bacteria, or bacterial toxins. Hands (yours or someone else's), non-potable w ater and contaminated raw fruits and vegetables are the usual vehicles that carry the offending agent(s) into your mouth and then into the intestinal tract. Diarrhea is frequent loose stools, usually self-limited, and can be treated w ith supportive measures. Pepto-Bismol is quite effective in most cases. The routine use of Lomotil, Imodium, or antibiotics is discouraged. Dysentery is characterized by frequent loose stools accompanied by severe abdominal pain,
vomiting, fever, and/or blood, mucus, or pus in the stools. If diarrhea persists for longer than 24 hours or any of the symptoms of dysentery develop, you should seek medical care. As the treatment for diarrhea varies depending on its etiology (bacteria, giardia, amoeba, etc), it is preferable to identify the cause and take only those medications truly necessary. Most diarrhea is self-limited and w ill resolve in 3–5 days. In addition to any medications used for diarrhea, it is important to replace the f luid lost in the stool in order to maintain adequate hydration. Many of the symptoms are due to f luid and electrolyte (salts) loss. If adequate f luids cannot be taken, medical advice should be sought. To replace lost f luids and electrolytes, you should consume large amounts of liquids, especially Oral Rehydration Solution (ORS). ORS packets are available in most upscale hotels. Other helpful f luids include soft drinks and clear soup. Gatorade is not preferred. Eat a bland diet (bananas, rice, apple sauce, and toast). Avoid dairy products until recovery occurs. Seek medical care in the follow ing cases:
• diarrhea is accompanied by blood • diarrhea persists for more than 48 hours • vomiting persists • cramps are severe and/or are accompanied w ith persistent abdominal pain • persistent fever over 101 degrees F • noticeably reduced urinary output or loss of w eight
Most individuals rely on their thirst mechanism to "tell" them w hen to drink. In temperate climates this is adequate, but the thirst mechanism can become inadequate in tropical climates and individuals can become chronically dehydrated. You should drink at least 2 quarts (8 glasses) of non-alcoholic beverages daily to assist your body in maintaining a good f luid balance. Remember that alcohol is a dehydrating agent and can actually increase risk. Parasitic Diarrheal Infections are quite common throughout most of India. The tw o most common types are amebiasis and giardiasis. Diagnosis and treatment require stool examinations. Many amebic infections are w ithout symptoms. Symptomatic cases may present w ith mild abdominal discomfort and diarrhea alternating w ith periods of constipation or acute dysentery w ith fever, chills, and bloody or mucoid diarrhea. Giardiasis, w hile often asymptomatic, may also be associated w ith a variety of symptoms such as abdominal discomfort, bloating, vomiting, loose malodorous stools, fatigue, w eight loss, and "sulfur belches”. Information on vaccinations and other health precautions, such as safe food and w ater precautions and insect bite protection and malaria information, may be obtained from the Centers for Disease Control and Prevention’s hotline for international travelers at 1-877-FYI-TRIP (1-877-394-8747) or via the CDC’s Internet site at http://w w w nc.cdc.gov/travel/destinations/india.htm For information about outbreaks of infectious diseases abroad consult the World Health Organization’s (WHO) w ebsite at http://w w w .w ho.int/countries/ind/en/. Further health information for travelers is available at http://w w w .w ho.int/ith. Indian health regulations require all travelers arriving from Sub-Saharan Africa or other yellow -fever areas to have evidence of vaccination against yellow fever. Travelers w ho do not have such proof are subject to immediate deportation or a six-day detention in the yellow -fever quarantine center. U.S. citizens, w ho transit through any part of sub-Saharan Africa, even for one day, are advised to carry proof of yellow fever immunization. Medical insurance: We strongly urge Americans to consult w ith their medical insurance company prior to traveling abroad to confirm w hether their policy applies overseas and w hether it w ill cover emergency expenses such as a medical evacuation. Please see information on medical insurance overseas at http://travel.state.gov/travel/cis_pa_tw /cis/cis_1470.html. Local Time, Business Hours, and Holidays Return to top
Despite its geographic size, India has adopted one time zone, f ive and one-half hours ahead of Greenw ich Mean Time (GMT). It has not adopted daylight savings time and uses standard time countryw ide throughout the year. Therefore, the time difference betw een India and the United States varies depending on the time of year. India is nine hours and thirty minutes ahead of Washington, D.C., during daylight savings time and 10 hours and 30 minutes ahead of Washington, D.C., during standard time. The standard six-day w orking w eek is Monday through Friday, 9:30 a.m. to 5:30 p.m., w ith a half -day on Saturday. Normally lunch is for one hour, betw een 1:00 p.m. and 2:00 p.m. How ever, in some large cities such as Mumbai, businesses start w orking earlier to avoid congested traff ic w hile commuting. Central Government off ices are closed on Saturdays. Banking hours are 10:00 a.m. to 2:00 p.m. on w eekdays and 10:00 a.m. to 12:00 noon on Saturdays. In major metropolitan cities, several foreign and Indian-ow ned banks are beginning to provide 24-hour banking services. Web Resources Return to top http://w w w.state.gov http://travel.state.gov http://w w w.indianembassy.org http://w w w.tourisminindia.com/ http://w w w.jetairways.com/ http://w w w.airindia.com/ http://w w w.goindigo.in/ http://w w w.spicejet.com/
Return to table of contents Chapter 9: Contacts, Market Research, and Trade Events
• Contacts • Market Research • Trade Events
Contacts Return to top The U.S. Commercial Service India Senior Commercial Off icer is John McCaslin: [email protected] U.S. Commercial Service New Delhi The American Center 24, Kasturba Gandhi Marg Connaught Place New Delhi 110 001 Tel: (91–11) 2347 2000 Fax: (91–11) 2331 5172 Deputy Senior Commercial Off icer: Margaret Hanson-Muse [email protected] Principal Commercial Off icer: Greg O’Connor greg.o’[email protected] Commercial Off icer: Pat Cassidy [email protected] Commercial Off icer: Olga Ford [email protected] U.S. Patent and Trade Office (USPTO) IPR Attaché: Kalpana Reddy [email protected] Bureau of Industry and Security (BIS) Export Control Off icer: Perry Davis [email protected] U.S. Commercial Service Mumbai U.S. Consulate General C-49, G-Block Bandra Kurla Complex Bandra East Mumbai 400 051 Tel: (91–22) 2672 4000 Fax: (91–22) 2672 4400 Principal Commercial Off icer: Camille Richardson [email protected] U.S. Commercial Service Chennai American Consulate General 220 Anna Salai Chennai 600 006 Tel: (91–44) 2857 4477 Fax: (91–44) 2857 4212 Principal Commercial Off icer: James Golsen

[email protected] U.S. Commercial Service Kolkata The American Center 38-A, Jaw aharlal Nehru Road Kolkata 700 071 Tel: (91–33) 3984 6402 Fax: (91–33) 2288 1207 Principal Commercial Off icer: Richard Craig [email protected] U.S. Commercial Service Bangalore S2, II Floor, Red Cross Bhaw an 26, Racecourse Road Bangalore 560 001 Tel: (91–80) 2220 6401 / 04 Fax: (91–80) 2220 6405 Commercial Specialist: Manjushree Phookan [email protected] U.S. Commercial Service Ahmedabad JMC House, Suite #41/42 Ambaw adi, Opp. Parimal Garden Ahmedabad 380 006 Tel: (91–79) 2656 5210 / 16 Fax: (91–79) 2656 0763 Commercial Specialist: Sangeeta Taneja [email protected] U.S. Commercial Service Hyderabad 152, Taj Deccan Hotel Road No. 1, Banjara Hills Hyderabad 500 034 Tel: (91–40) 2330 5000 / 4025 Fax: (91–40) 2330 0130 Commercial Specialist: Radhakishore Pandrangi [email protected] Chambers of Commerce Ms. Nivedita Mehra Program Director, India U.S.-India Business Council 12 Hailey Road New Delhi 110001 INDIA Tel: + 91 - 011 - 4350 4964 / 4357 9861 Fax: + 91 - 011 - 4357 0860 Email: [email protected] Website: w ww.usibc.com Mr. Ajay Singha, Executive Director American Chamber of Commerce in India (AMCHAM) PHD House, 4th Floor, 4/2, Siri Institutional Area, August Kranti Marg, New Delhi -110016

Tel : +91-11-2652 5201/ 2652 5202 Fax : 91-11-2652 5203 Email : [email protected] Website: http://amchamindia.com Mr. Chandrajit Banerjee, Director General Confederation of Indian Industry (CII) CII Central Off ice Mantosh Sondhi Centre 23 Institutional Area Lodi Road, New Delhi-110003 Phone : +91-11-24629994 - 7 Fax : +91-11-24682229 Email : [email protected] Website: http://cii.in/ Dr A. Didar Singh Secretary General Federation of Indian Chambers of Commerce & Industry (FICCI) Federation House, Tansen Marg New Delhi 110001, India Tel: 91-11-23738760-70 Direct: +91-11-2335-7364 Fax: 91-11-23320714, 23721504 Email: [email protected] Website: http://f icci.com Mr. Atul Vyas, Regional Director Indo-American Chamber of Commerce (IACC) 4th Floor, PHD House, 4/2 Siri Institutional Area, August Kranti Marg, New Delhi 110 016 Tel: 91-11- 26963387 / 26531965 Fax: 91-11-26531954 E-mail: [email protected] Email: http://w w w.iaccindia.com Mr. D. S. Raw at Secretary General The Associated Chambers of Commerce & Industry of India (ASSOCHAM) ASSOCHAM Corporate Office, 1, Community Centre Zamrudpur Kailash Colony, New Delhi – 110 048 Tel: 46550555 (Hunting Line) Fax: 46536481/46536482 46536497/46536498 E-mail: [email protected] Website: http://w ww.assocham.org Ms. Susmita Shekhar Secretary General PHD Chamber of Commerce & Industry PHD House, 4/2 Siri Institutional Area August Kranti Marg, New Delhi 110016 Tel: 91-11-26863801-04, 49545454 Fax: 91-11-26855450, 49545451 Website: w ww.phdcci.in Email : [email protected] E-mail: [email protected]

Mr. Vikas Gadri Director General Off ice of Director General Bombay Chamber of Commerce & Industry The Ruby NW, 4th Floor, 29, Senapati Bapat Marg, (Tulsi Pipe Road) Dadar (West), Mumbai 400028 Tel : 61200202 (B) / 61200200 (B) Fax : 61200213 E-mail : dgoff [email protected] Website : w ww.bombaychamber.com E-Mail: [email protected] Reg. Off ice: Bombay Chamber of Commerce and Industry Mackinnon Mackenzie Building, 4, Shoorji Vallabhdas Road, Ballard Estate, Mumbai 400 001. Tel : 49100202 (D) / 49100200 (B) Fax : 49100213 Mr. Niranjan Hirnandani President, Indian Merchants’ Chamber IMC Bldg., IMC Marg, Churchgate, Mumbai - 400 020 India. Tel : 91-22-22046633 Fax : 91-22-22048508 / 22838281 E-Mail : [email protected] Website: http://w ww.imcnet.org/ Trade Associations Mr. Som Mittal President National Association of Software and Service Companies (NASSCOM) International Youth Centre Teen Murti Marg Chanakyapuri New Delhi - 110021, India Tel: +91-11-2301-0199 Fax: +91-11-2331- 5452 / 4767 0100 Email: [email protected] Website: http://w ww.nasscom.org Mr J V Ramamurthy President Manufacturers’ Association for Information Technology PHD House, 4th Floor, Opp. Asian Games Village New Delhi 110 016. India. Tel#: +91-11-2685 5487, 2685 4284, 2686 6976 Fax#: +91-11-2685 1321 E-mail: [email protected] Website: http://w ww.mait.com Mr. Vikram Sirur President Indian Machine Tool Manufacturers’ Association Bangalore International Exhibition Centre (BIEC) 10th Mile, Tumkur Road, Madavara post Bangalore - 562 123

T: +91 80 6624 6600 F: +91 80 6624 6661 Email: [email protected] http://w w w.imtma.in Mr. Vinnie Mehta Executive Director Automotive Component Manufacturers Association of India 6th Floor the Capital Court, Olof Palme Marg, Munirka, New Delhi 110 067. Tel.: +91 11 2616 0315 Fax: +91 11 2616 0317 E-mail: [email protected] http://w w w.acmainfo.com Mr. Dinesh Gupta President - India Chapter American Society of Heating, Refrigerating and Airconditioning Engineers (ASHRAE) and Indian Society of Heating, Refrigerating and Airconditioning Engineers (ISHRAE) K-43 Kailash Colony (Basement) New Delhi 110048, India Tel: +91-11-416-35655 Fax: +91-11-29234925 E-mail: [email protected] Website: http://w ww.ashraeindia.org Mr. B. Seenaiah President Builders’ Association of India G-1/G-20, Commerce Centre, J. Dadajee Road, Tardeo, Mumbai 400034 Tel.: (91-22) 23514134, 23514802, 23520507 Fax : (91-22) 23521328 E-mail: [email protected]; [email protected]. Website: http://w ww.baionline.in/ Mr. Manish U. Doshi President Indian Drug Manufacturers' Association 102-B, Poonam Chambers,'A' Wing, 1st Floor Dr. A. B. Road Worli, Mumbai - 400 018. Tel: +91 - 22 - 2494 4624 / 2497 4308 Fax: +91 - 22 - 24950723 Email : [email protected]; [email protected] Website: http://w w w.idma-assn.org Vishal Gakhar Director General Indian Electrical & Electronics Manufacturers Association 501, Kakad Chambers, 132, Dr. Annie Besant. Road, Worli, Mumbai 400018, INDIA. Tel: +91 22 2493 0532 / 6528 / 6529 Fax: +91 22 2493 2705 Email: [email protected] Website: http://w ww.ieema.org Mr. Ranjit Shahani President Organisation of Pharmaceutical Producers of India Peninsula Chambers, Ground Floor, Ganpatrao Kadam Marg,
Low er Parel, Mumbai 400 013. Tel: +91 22 24918123, 24912486, 66627007 Fax: +91 22 24915168 E-Mail : [email protected] Website: http://w ww.indiaoppi.com Mr. A. P. Mull President Consulting Engineers Association of India OCF Plot No.2, Pocket 9, Sector – B, (Behind Jagannath Institute of Management Studies) Vasant Kunj, New Delhi 110070 Tel: 91-11- 26134644, Telefax: 91-11- 26139658 E-mail: [email protected] Website: http://w ww.ceaindia.com/ Professor S.K. Brahmachari Chairman Consultancy Development Centre Core 4B 2nd Floor, India Habitat Centre Lodhi Road New Delhi – 110 003 Tel : 91 11 24602601, 24602915, 24601533, 24648268 Fax: 91 11 24602602, 24643082 Email: [email protected] Website: w ww.cdc.org.in Mr. Gurpal Singh Deputy Director General Head - Defence & Aerospace Confederation of Indian Industry Plot No. 249-F Udyog Vihar Phase - IV Gurgaon, Haryana, India. - 122015. Tel : +91-124- 4014060-67 Fax : +91-124-4234170 Email: [email protected] Website: w ww.cii.in Market Research Return to top To view market research reports produced by the U.S. Commercial Service please go to the follow ing w ebsite: http://export.gov/mrktresearch/index.asp Research is available to U.S. citizens and U.S. companies. Registration to the site is required, but free of charge. Trade Events Return to top Please click on the link below for information on upcoming trade events. http://export.gov/tradeevents/index.asp http://export.gov/india/tradeevents/index.asp Return to table of contents

Chapter 10: Guide to Our Services The President’s National Export Initiative aims to double exports over f ive years by marshaling Federal agencies to prepare U.S. companies to export successfully, connect them w ith trade opportunities and support them once they do have exporting opportunities. The U.S. Commercial Service offers customized solutions to help U.S. exporters, particularly small and medium sized businesses, successfully expand exports to new markets. Our global netw ork of trade specialists w ill w ork one-on-one w ith you through every step of the exporting process, helping you to:
• Target the best markets w ith our w orld-class research • Promote your products and services to qualif ied buyers • Meet the best distributors and agents for your products and services • Overcome potential challenges or trade barriers • Gain access to the full range of U.S. government trade promotion agencies and their services,
including export training and potential trade f inancing sources To learn more about the Federal Government’s trade promotion resources for new and experienced exporters, please click on the follow ing link: http://w ww.export.gov/ For more information on the services the U.S. Commercial Service in India offers to U.S. exporters, please click on the follow ing link: http://export.gov/india/servicesforu.s.companies/index.asp
The Commercial Service in India (CS India)
CS India is one of the U.S. Commercial Service’s largest operations, w ith 7 off ices, 9 American off icers and over 45 Indian staff members, all of w hom are based in India. Our staff members have a w ealth of sector-specif ic experience and understand w ell how to deliver exceptional service to U.S. companies. Our off ices are located in New Delhi, Mumbai, Chennai, Kolkata, Bangalore, Hyderabad, and Ahmedabad. Please see Chapter 9 for information on how to get in touch w ith us. Our off ices w ork in conjunction w ith the entire netw ork of the Commercial Service, w hich includes domestic U.S. Export Assistance Centers throughout the United States. To find an office near you, visit: http://export.gov/usoff ices/index.asp We are happy to provide U.S. companies w ith our on-hand research, know ledge, and counseling services free of charge. Contact any of our India off ices to schedule a visit or a conference call. We also offer U.S. companies specif ic partner search, due diligence, research, and business facilitation services tailored to your company’s needs at very nominal fees. Our standard services are listed below . We are also able to offer customized solutions to f it your company’s needs.
Gold Key Service Our best know n and most w idely used service is our Gold Key Service (GKS). This service is designed to provide business facilitation support for U.S. businesspeople traveling to India to explore local business opportunities. You w ill receive: • Appointments w ith pre-qualif ied sales representatives and partners, appropriate government off icials,
related associations and others • Customized market and industry briefings w ith U.S. Commercial Service staff in advance of your travel
to develop your schedule • Escort by a U.S. Commercial Service staff member for meetings • Assistance w ith travel and accommodation at preferred rates • Post meeting assistance w ith U.S. Commercial Service staff to discuss results of meetings and develop
appropriate follow -up strategies
Coverage The GKS is available in 7 Indian cities: New Delhi, Mumbai, Chennai, Kolkata, Bangalore, Ahmedabad, and Hyderabad. Based on your company’s goals, as provided by you in a business confidential questionnaire, CS India w ill provide you w ith a pre-GKS assessment for one or all of these markets. Then, as part of your schedule development, w e w ill discuss w ith you w hich cities w e believe to hold the best potential for your product or service to help your company make the best decision on w here to travel. Duration of the GKS and Schedule of Meetings The GKS is scheduled for a minimum of one day in each selected city. On average, companies w ill have four pre-screened meetings a day. As appropriate, appointments are scheduled at the Indian companies' off ices, or at our off ices w hen needed to eliminate drive time and facilitate additional meetings. Price and Delivery Time A GKS costs $700 for SMEs/$2300 for large companies for the f irst day in each city. All GKS requests w ill be confirmed by the country-w ide GKS Program Manager only after the payment is received by the U.S. Commercial Service, New Delhi. Typically six w eeks are needed to set up an effective GKS agenda. Please contact Program Manager to inquire about shorter lead times. GKS Questionnaire and Product/Company Catalogs A completed GKS questionnaire and 10 sets of company catalogs or literature should be received by CS India at least four to six w eeks prior to your GKS program to ensure the best possible service. This allow s us to thoroughly identify potential business partners according to your company requirements. You w ill be given specif ic instructions on w here to send the catalogs/literature. Please note that appointments w ith Indian f irms w ill often only be scheduled after they receive your catalogs/literature. Therefore, timely delivery of the U.S. company/product catalogs is critical to ensure high quality meetings.
International Company Profile An International Company Profile (ICP) is a due-diligence check that helps U.S. companies evaluate potential business partners. The report includes factual data as w ell as CS India’s evaluation to help U.S. f irms assess risk, reliability, and capability. The ICP analyzes the overall strength of an Indian company and provides useful information collected from our industry contacts, local publications/press, and other sources. An ICP provides:
• A detailed background report, based on a variety of research sources, including an on-site or telephone interview w ith a Commercial Specialist
• A listing of the company's senior management • Main business activities and product/service lines • Comments from company references • Banking and f inancial information [note: an ICP is not a credit report and, therefore may not
contain the detailed f inancial information that is obtainable from mercantile credit agencies. How ever, reliable basic f inancial information is included in the report]
• CS India insight on w hether the prospective partner can meet your needs - trading experience, market coverage, stature, business connections in the country
Price and Delivery Time The follow ing pricing schedule is for a standard ICP in India w ith a delivery time of 20 business days from receipt of payment: $600 for SMEs/$900 for large companies - for ICP checks conducted w ithin the city and adjoining areas that can be covered w ithin off ice hours $600 for SMEs/$900 for large companies + actual travel cost - for ICP checks that require a Commercial Service specialist to travel outside the city (not overnight stay)
International Partner Search For U.S. companies looking for representatives in India to expand business and boost export sales, w e w ill locate, screen, and assess potential qualif ied overseas sales representatives, agents, distributors, joint venture partners, licensees, franchisees or strategic partners for your products or services. The International Partner Search (IPS) is designed to help identify suitable Indian companies and distributors w ho are keen to represent U.S. f irms in India. If your f irm is small, new to exporting, or if you don't have resources for research or overseas travel, this service provides an easy, economical, quick-access opportunity to enter the Indian market. Price and Delivery Time For $550 for SMEs/$1400 for large companies per business category per city, the IPS service provides the contacts you need to launch your marketing efforts in India. Turnaround time is 30 w orking days from the day w e receive your company's product literature. As a next step, if you plan a visit to India you may also order our Gold Key Service for appointments w ith prospective agents and distributors and key government off icials relevant for your industry. IPS Coverage India is a regionally diverse market, so you may w ish to order a separate IPS for each region. The IPS service is available at all our seven posts: Northern India (New Delhi), Eastern India (Kolkata), Western India (Mumbai, Ahmedabad), and Southern India (Chennai, Bangalore, Hyderabad). If you w ant to do an IPS search in only one of our seven posts, w e can help you pick the most appropriate post for your search. CS India prefers to carry out a pre-IPS survey for all IPS requests to assess its feasibility. Product/Company Catalog Ten to f if teen sets of product /company catalogs should be received by the CS India at least prior to the expected delivery time of the report. For more information: For answ ers to questions on our product and service offerings, please contact: Ms. Nisha Wadhaw an Tel: 91-11-2331 6841, Fax: 91-11-2331 5172 Email: nisha.w adhaw [email protected] or Contact your local U.S. Export Assistance Center (USEAC) To locate the USEAC nearest to you, visit: http://export.gov/usoff ices/index.asp U.S. exporters seeking general export information/assistance or country-specif ic commercial information can visit http://w ww.export.gov To the best of our know ledge, the information contained in this report is accurate as of the date published. How ever, The Department of Commerce does not take responsibility for actions readers may take based on the information contained herein. Readers should alw ays conduct their ow n due diligence before entering into business ventures or other commercial arrangements. The Department of Commerce can assist companies in these endeavors. Return to table of contents