Embed Size (px)
Citation preview

A Study of Cathodoluminescence and Trace ElementCompositional Zoning in Natural Quartz from VolcanicRocks: Mapping Titanium Content in Quartz
William P. Leeman,1,* Colin M. MacRae,2 Nick C. Wilson,2 Aaron Torpy,2 Cin-Ty A. Lee,1
James J. Student,3 Jay B. Thomas,4 and Edward P. Vicenzi5
1Department of Earth Science, Rice University, 6100 S. Main St., Houston, TX 77005, USA2Microbeam Laboratory, CSIRO Process Science & Engineering, Clayton Laboratories, Gate 1, Normanby Road,Clayton, Victoria 3168, Australia
3Department of Earth and Atmospheric Sciences, Central Michigan University, 314 Brooks Hall, Mount Pleasant,MI 48859, USA
4Department of Earth & Environmental Sciences, Rensselaer Polytechnic Institute, 110 8th St., Troy, NY 12180, USA5Smithsonian Institution, Museum Conservation Inst., 4210 Silver Hill Rd., Suitland, MD 20746, USA
Abstract: This article concerns application of cathodoluminescence ~CL! spectroscopy to volcanic quartz andits utility in assessing variation in trace quantities of Ti within individual crystals. CL spectroscopy providesuseful details of intragrain compositional variability and structure but generally limited quantitative informa-tion on element abundances. Microbeam analysis can provide such information but is time-consuming andcostly, particularly if large numbers of analyses are required. To maximize advantages of both approaches,natural and synthetic quartz crystals were studied using high-resolution hyperspectral CL imaging ~1.2–5.0 eVrange! combined with analysis via laser ablation inductively coupled plasma mass spectrometry ~LA-ICPMS!.Spectral intensities can be deconvolved into three principal contributions ~1.93, 2.19, and 2.72 eV!, for whichintensity of the latter peak was found to correlate directly with Ti concentration. Quantitative maps of Tivariation can be produced by calibration of the CL spectral data against relatively few analytical points. Suchmaps provide useful information concerning intragrain zoning or heterogeneity of Ti contents with thesensitivity of LA-ICPMS analysis and spatial resolution of electron microprobe analysis.
Key words: cathodoluminescence, LA-ICPMS, titanium, quartz
INTRODUCTION
It is well documented that natural quartz samples can havewide concentration ranges for many trace elements ~e.g., Ti,Al, Li, Fe, K, contents may vary from sub-ppm up to severalhundred ppm; see references cited below!, depending onconditions and mode of formation. For example, hydrother-mal “vein” quartz associated with various types of oredeposits often has distinctive ranges of Ti, Al, and otherelements reflecting specific compositions and temperaturesof associated mineralizing or metamorphic fluids ~Holness& Watt, 2001; Monecke et al., 2002; Müller et al., 2003a,2003b, 2010; Götze et al., 2004; Landtwing & Pettke, 2005;Rusk et al., 2006, 2008, 2011; Lehmann et al., 2009!. Ticontents in metamorphic and igneous quartz samples alsodisplay significant ranges and vary with inferred crystalliza-tion temperature or other factors ~Suttner & Leininger,1972; Watt et al., 1997; Müller et al., 2002, 2003a; Götzeet al., 2005; Student et al., 2006; Sato & Santosh, 2007; Warket al., 2007; Wiebe et al., 2007; Leeman & Lee, 2008; Shaneet al., 2008; Campbell et al., 2009; Kohn & Northrup, 2009;Larsen et al., 2009; Spear & Wark, 2009; Storm & Spear,2009; Vazquez et al., 2009; Girard & Stix, 2010; Huang &Audétat, 2012; Matthews et al., 2012!. Numerous workers
have demonstrated the efficacy of cathodoluminescence ~CL!spectroscopy in documenting the existence and details ofsuch compositional variations in quartz ~and other miner-als!, as well as a correlation between Ti content and relativespectral intensity ~e.g., Mason, 1987; Marshall, 1988; Götzeet al., 2001; Peppard et al., 2001; Landtwing & Pettke, 2005!.However, quantitative use of CL intensity data is limitedowing to uncertainties in their dependence on specific com-positional and/or structural details. Other considerationsinclude the difficulty in obtaining high-precision CL inten-sity data. For example, it is well known that CL intensitygenerally is a function of sample surface condition and ~forcertain materials! decreases with time of electron exposure~Luff & Townsend, 1990; Müller et al., 2003b; Mason et al.,2005!. Furthermore, CL spectra comprise contributions fromnumerous emission bands, many of which originate fromstructural defects and the presence of diverse trace impuri-ties other than Ti ~Perny et al., 1992; Stevens-Kalceff &Phillips, 1995; Müller et al., 2003b; Stevens-Kalceff, 2009!.
Evaluation of elemental contributions to CL spectralintensities has primarily benefited from application of mi-crobeam techniques, as bulk analyses of quartz may becompromised by the presence of mineral or fluid inclusions~cf. Götze et al., 2004!. Electron microprobe analysis ~EMPA!,secondary ion mass spectrometry, and laser ablation-inductively coupled plasma mass spectrometry ~LA-ICPMS!
Received March 16, 2012; accepted August 21, 2012*Corresponding author. E-mail: [email protected]
Microsc. Microanal. 18, 1322–1341, 2012doi:10.1017/S1431927612013426 Microscopy AND
Microanalysis© MICROSCOPY SOCIETY OF AMERICA 2012

are now commonly used for trace element analysis of quartzand other minerals ~Flem et al., 2002; Ulrich et al., 2009; seereferences above! and are variably effective depending onconcentration levels, sample size, and other factors. How-ever, due to limited access to these instruments, consider-ation of analytical precision, spatial resolution, and detectionlimit in some cases, and analytical cost, it is desirable toimprove on the quantitative application of CL spectroscopyfor mapping Ti concentration in quartz. Another advantageis that such maps provide two-dimensional information onspatial distribution, with micron scale resolution, that ben-efits interpretation. This article summarizes our efforts inthis direction, following an approach analogous to that ofMacRae et al. ~2005, 2008, 2009!, who investigated theutility of CL spectra in mapping distributions of rare-earthelements ~REE! in the mineral scheelite at trace concentra-tions ~� ppm levels!.
The present work was motivated by the experiments ofWark and Watson ~2006!, who first demonstrated a system-atic correlation between Ti content in quartz and tempera-ture of its formation from silicate melts at 1.0 GPa pressure.Application of their “Ti-in-quartz” ~or TitaniQ, for short!geothermometer to natural quartz-bearing igneous rocksprovides a new tool to evaluate crystallization temperaturesand thermal histories of silicic magmas. In subsequentexperiments, Thomas et al. ~2010! demonstrated that Ticoncentrations in quartz also exhibit significant pressuredependence, and they formulated a “PTitaniQ” thermoba-rometer that ideally can provide additional constraints onpressure ~i.e., depth! of silicic magma reservoirs in theEarth’s crust. Huang and Audétat ~2012! confirmed a pres-sure dependence and also documented that Ti solubility inquartz increases with crystal growth rate and with traceconcentrations of Li and Al; an empirical thermobarometerbased on their experiments differs from that of Thomaset al. ~2010!. Application of this approach depends in detailon additional parameters—in particular, the thermodynamicactivity of TiO2 component in the melt or fluid from whichquartz precipitates. Problems with quantification of thisparameter have been discussed extensively in recent articles~Ghiorso & Gualda, 2011; Thomas & Watson, 2012; Wilsonet al., 2012!. Although detailed interpretation of Ti varia-tions in quartz is at an early stage of development, therecognition of complex compositional zonation in manynatural quartz samples implies variably complicated growthhistories that depend strongly on the specific geologic con-text for each sample. Here, we present a useful means ofquantitatively assessing the natural variations and brieflydiscuss some implications of these data for magmaticprocesses.
METHODS AND MATERIALS
SamplesThe rationale for this study is to combine measurements onboth natural and synthetic quartz samples for which thereexists sufficient characterization to quantitatively evaluate
the significance of observed Ti variations. Table 1 providesbasic sample information that is elaborated further below.
The geologic aspect of this work stems from a recon-naissance investigation of natural quartz phenocrysts fromrhyolitic rocks of the Snake River Plain ~SRP!-Yellowstonevolcanic province, southern Idaho, and adjacent Wyoming~cf. Bonnichsen et al., 2008; Leeman & Lee, 2008!. Thesecrystals formed in slowly cooling silica-rich magmas withincrustal reservoirs. Considering petrologic and geophysicalconstraints, Leeman et al. ~2008! inferred that these mag-mas formed at depths of approximately 10 km, which israther shallow in the crust, due to injections of hotterbasaltic magmas at these depths. This notion is supportedby experimental studies of Almeev et al. ~2009, 2012!, whoexperimentally replicated mineral assemblages in two SRPrhyolites at relatively low pressures ~ca. 2–4 kbar; equivalentdepths between 5–10 km!, elevated temperatures ~.9008C!,and low water contents ~,1.5% H2O!. It is likely that theseconditions correspond to the uppermost portion of a largermagmatic system such as that currently below the Yellow-stone caldera ~cf. Smith et al., 2009!.
Eruption of such magmas between ca. 12 to 0.1 Maproduced large pyroclastic deposits and rhyolite lavas. Inaddition to quartz, these rocks contain other primaryphenocrysts ~including ortho- and clinopyroxenes, alkalifeldspar, plagioclase, magnetite, and ilmenite! for whichindependent two-pyroxene, two-feldspar, and two-oxidegeothermometers have been developed. Applications ofthese geothermometers ~cf. Honjo et al., 1992; Andrewset al., 2009; Cathey & Nash, 2009; Vazquez et al., 2009; Ellis& Wolff, 2010! suggest magmatic temperatures between ca.800–1,0008C for most samples, with values approaching1,1008C in some cases. Such high temperatures are generallyconsistent with the absence of hydrous minerals ~amphib-ole, biotite! in nearly all rhyolites from this province ~cf.Honjo et al., 1992; Cathey & Nash, 2004; Ellis & Wolff,2012!. Most samples selected for investigation have beencharacterized for mineral chemistry and thermometry, whichfacilitates evaluation of PTitaniQ thermobarometry andprovides additional constraints on petrologic models fororigin and evolution of the rhyolites. Specifically, we presentdata for rhyolites from the Yellowstone center ~YNP; cf.Bindeman & Valley, 2001; Vazquez et al., 2009; Girard &Stix, 2010! and rhyolitic lavas and domes from the smalland relatively young Magic Reservoir eruptive center ~MREC;Leeman, 1982; Honjo & Leeman, 1987! in the central SRP.Additional samples of early voluminous rhyolites from thelatter region ~cf. Bonnichsen et al., 2008! have been studiedto lesser extent and are not included in this article.
As part of this study, we also analyzed one late Precam-brian rhyolite ~CMB-Allph10; CMB for short! from thePortage Lake Volcanics of the Keweenawan province innorthern Michigan. This sample was included because itcontains large ~ca. 2 mm! quartz phenocrysts that previ-ously had been found to exhibit extreme zonation in CLintensity and Ti content ~Student et al., 2006!. Finally,polished mounts of synthetic quartz from several Ti-doped
Ti-CL Calibration 1323

experiments of Thomas et al. ~2010! were included to allowcomparison of their EMPA Ti data with our LA-ICPMSanalyses of the same samples.
For most natural samples, concentrates of quartz wereprepared by standard heavy liquid and magnetic separationmethods, and representative grains were mounted in epoxyand studied in polished section. This approach was used
in most cases so as to efficiently survey a moderate numberof grains, as the number ~or surface area! of exposed grainsin a given thin section of the rocks was limited ~,5%! inmany cases. It should be noted that many grains arefractured remnants of larger phenocrysts, but original rimscan be recognized based on crystal morphology. To providemore precise spatial context and to evaluate intragrain
Table 1. Sample Information and Temperature Constraints.
Sample Unit Description T constraintsa
Geologic Samples
Yellowstone volcanic center (YNP)~Bindeman & Valley, 2001; Vazquez et al., 2009!
YL-96-19 Gibbon Hill dome Young ~;0.15 Ma! extracaldera extrusivedome
811 Zr-sat841 Zr'-sat864 MELTSa
YL-96-20 Middle Biscuit Basin flow Early ~0.54 Ma! post-caldera lava aftereruption of Lava Creek Tuff ~0.64 Ma!
818 Zr-sat853 Zr'-sat905 Mt-Ilm851 MELTS
Magic Reservoir eruptive center (MREC)~Leeman, 1982; Honjo & Leeman, 1987; Honjo et al., 1992!
L81-20 Rhy. of Magic Reservoir ~Tmr! Earliest ~;5 Ma! lava filling caldera-likedepression
899 Zr-sat1082 Zr'-sat1020 2-Px1015 2-Fsp953 MELTS
L81-25 Rhy. of Magic Reservoir ~Tmr! Earliest ~;5 Ma! lava filling caldera-likedepression
889 Zr-sat1078 Zr'-sat1020 2-Px1036 2-Fsp945 MELTS
WBQ Rhy. of Wedge Butte ~Tyd! Later ~;3 Ma! eruption 802 Zr-sat834 Zr'-sat875 MELTS
L80-37 Rhy. of Dinosaur Ridge ~Tyd! Later ~3.3 Ma! eruption n.a.b
L80-34 Rhy. of Rattlesnake Butte ~Tyd! Young ~2.9 Ma! eruption 787 Zr-sat818 Zr'-sat899 MELTS
Keweenawan rhyolite~Student et al., 2006, 2007!
CMB-Allph-10 Portage Lake Volcanics Rhyolite cobbles in conglomerate 873 MELTS
Synthetic quartz samples~Thomas et al., 2010!
QTiP-11 Experimental run product Quartzaverage Ti � 96 ppm
8758C15 kbar
QTiP-10 Experimental run product Quartzaverage Ti � 167 ppm
9408C15 kbar
QTiP-7 Experimental run product Quartzaverage Ti � 18 ppm
7008C15 kbar
QTiP-19 Experimental run product Quartzaverage Ti � 307 ppm
9008C10 kbar
aMELTS liquidus T calculated assuming 3 kbar pressure and 3% H2O. Zr-sat and Zr'-sat are Zr saturation Ts as originally defined byWatson and Harrison ~1983! and revised by Perkins and Nash ~2002!, respectively, based on Zr content in each sample; all samplescontain trace zircon. Mineral thermometry is based on compositions of coexisting magnetite-ilmenite ~Mt-Ilm!, ortho- andclinopyroxene ~2 Px!, or plagioclase and K-feldspar ~2 Fsp! pairs ~cf. Honjo et al., 1992; other references in text!.bn.a. � not applicable.
1324 William P. Leeman et al.

compositional zoning, a few samples were studied in thinsection.
ANALYTICAL METHODS
General ApproachPreliminary CL maps were made of representative quartzgrains using a low-resolution CL luminoscope ~Smithson-ian Institution, Washington, D.C., USA! to evaluate appar-ent mineral zoning and to guide selection of analyticalpoints in an initial round of analyses by LA-ICPMS ~seebelow!. Selected samples were subsequently repolished atCSIRO ~Clayton, VIC, Australia! to remove surface damagefrom both the laser and electron flood gun, and quantitativeCL spectra were acquired for selected analyzed grains. Be-cause of surface damage imparted by the laser, spectral datawere necessarily integrated for areas adjacent to the originalanalysis spots. To provide more direct comparison of spec-tral and composition data, another round of LA-ICPMSanalyses was made on freshly polished regions for whichhigh-resolution CL spectroscopic imagery was available.The next sections describe in more detail the respectiveanalytical approaches.
LA-ICPMS StudiesLA-ICPMS analyses were done at Rice University using a213 nm New Wave laser ablation system coupled to aThermoFinnigan Element 2 magnetic sector inductivelycoupled plasma mass spectrometer. The laser typically wasoperated at 40–55 mm spot size with a 10 Hz pulse rate at afluence of 10 J/cm2. Attempts to use smaller spots ~down to25 mm! near grain rims were generally unsatisfactory owingto sample decrepitation during laser heating. Vaporizedmaterial was transported from the ablation cell using a 1.3L/min flow of He, then introduced into the torch with theaid of 0.9 L/min of Ar sample gas. Analyses were done inmedium mass resolution mode ~m/Dm-3,000! to resolvemolecular interferences. The following masses were mea-sured: 23Na, 25Mg, 27Al, 30Si, 31P, 39K, 43Ca, 45Sc, 49Ti, 51V,52Cr, 55Mn, 57Fe, cZn, 69Ga, 89Y, 91Zr, and the 40Ar40Ardimer; some runs also included 11B, 7Li, 63Cu, and 64Zn.Because interferences are negligible for 49Ti, all reported Ticoncentrations are based on this isotope. For each mass, weanalyzed a 120% mass window ~180% for 40Ar40Ar! witheight samples per 100% peak and a sample dwell time of0.01 s. This large mass window was necessary for peakcentering, after which only an 80% mass window was inte-grated for quantitative evaluation. Mass scans were operatedin EScan mode ~0.03 s for each consecutive peak jump!, butseveral large jumps in the magnetic field were necessary~0.3 s of magnetic settling time!. One sweep across theentire mass range ~from Na to Zr! required 3.0 s. A gasbackground of ;10 scans was first taken, followed by ;40scans during actual ablation. Total ablation time for a mea-surement was on the order of 2 min during which time thelaser excavated about 100 mm of material. Long-term driftof the mass calibration was corrected during each analysis
by locking the calibration to the 40Ar40Ar dimer. Small massoffsets to the mass calibration were assigned before eachday’s measurements. Sensitivity in medium mass resolutionwas ;2,000 cps/ppm for the above ablation and ICPMSconditions.
Converting signal intensities to concentrations was doneby first subtracting the gas background from the ablationsignal. The background-corrected signals were then normal-ized to an internal standard, which was chosen to be 30Si~SiO2 assumed � 100% for quartz! following Longerichet al. ~1996!. The background-corrected, Si-normalized sig-nal intensities of external standards were plotted againstSi-normalized concentrations using GEOREM preferred val-ues for concentrations ~cf. Table 2!, and from this a multi-standard calibration curve regressed through the origin wasestablished. This calibration curve was then used to convertthe signal intensities of unknowns to concentrations.
Time-resolved analyses ~Fig. 1! were monitored foranomalous concentrations of other elements to identifypotential complications due to ablation of melt/fluid inclu-sions or intergrown minerals. Individual cycles showingsuch anomalies were excluded during data reduction. Manynatural quartz grains contain significant Li ~;15–40 ppm!and B ~;1–5 ppm!, and small amounts of Na ~for nearly allsamples, ,40 ppm!, Al ~,200 ppm!, and Fe ~,100 ppm!;most other elements monitored were usually below theirdetection limit ~defined as three times the backgroundcounts!. None of these elements show any significant corre-lation with Ti content.
Data for this article were collected in several sessions in2007–2009. Results of replicate standard analyses for themost recent session are presented in Table 2. Intraday preci-sion ~relative standard deviation, or RSD! for multiple analy-ses was on the order of 6% or better for all calibrationstandards. ATHO-G ~RSD � 3%! and NIST-612 ~RSD �12%!, which contains only 44 ppm Ti, were analyzed asindependent checks on accuracy. Data for most standardsagree with preferred values ~cf. GEOREM website! withintheir estimated uncertainties, including standard averagesover five earlier sessions. However, average Ti in the Na-tional Institute of Standards and Technology ~NIST! stan-dards and ATHO-G is skewed above the preferred values by11–23% ~average discrepancy � 15%!. Because these Si-richstandards have matrix compositions closest to quartz, acorrection of 15% was applied to all quartz samples tocompensate for matrix effects ~cf. Morrison et al., 1995!.Based on these results as well as replicate analyses of naturalsamples, we conservatively estimate external reproducibilityof Ti concentration to be within 610% for samples.100 ppm, and within 6 20% for samples ,100 ppm.Table 3 presents representative data for the samples used inthis study.
Spectral StudiesPrior to analysis, each sample was highly polished using0.25 mm diamond paste followed by 20 nm colloidal silicasolution dispersed in water to minimize surface damage
Ti-CL Calibration 1325

that can lead to CL active centers ~Remond et al., 2000!.This preparation is deemed critical to obtaining high qual-ity CL data. Hyperspectral data ~200–990 nm! were col-lected on selected grains by stage scanning in 2-mm steps~2 � 2 mm pixel resolution! on a JEOL 8500F ~JEOL Ltd.,Tokyo, Japan! electron microprobe ~EMPA! at 20 kV accel-erating voltage and 40 nA beam current. This instrument isequipped with an integrated grating CL spectrometer andcharge-coupled device detector ~MacRae et al., 2009!. Acritical advantage of this system is the short data acquisitiontime ~dwell time of 30 ms! required per pixel, as thisminimizes effects of surface damage and time-dependentCL intensity. For each pixel, wavelength dispersive X-raydata were simultaneously collected for Ti, Al, Fe, Mg, and Siin addition to a full energy dispersive X-ray spectrum toidentify any inclusions or other anomalies encountered.
Acquisition of a typical CL map area of 1700 � 1400 pixels~3.4 � 2.8 mm! required about 23 h. Complete spectral datawere acquired for each pixel, allowing analysis and construc-tion of spatial maps of all measured parameters. It shouldbe noted that, over the period of this study, changes in theinstrument configuration and evolution of data acquisitionmethods introduced some variation in exact peak positionsand intensities. Differences in surface condition and arti-facts from prior electron beam or laser damage could alsocontribute to differences in CL spectral response over thecourse of this study.
In detail, the CL spectra were deconvolved in energyspace using Chimage software ~Harrowfield et al., 1993! tofit a series of Gaussians to the major and minor peakswithin the CL spectra. Three principal contributions ~peaksnear 1.93, 2.19, and 2.72 eV; equivalent wavelengths near
Figure 1. LA-ICPMS data acquisition. ~a! Example of ICPMSintensity profiles ~log-scale! for selected elements monitored dur-ing analysis of standard SRM-612. The time decay reflects adecreasing volume of entrained sample vapor as the laser burrowsdeeper. After background correction, variations in sample signalare compensated by normalizing element intensities to that for30Si. As seen in the lower panel, the normalized signals are rela-tively constant. ~b! Similar diagram for a natural volcanic quartzsample ~A5; rhyolite of Magic Reservoir! from the Snake RiverPlain, showing data for selected elements. This is a satisfactoryanalysis, with relatively constant Si-normalized element ratios forTi and other elements that are above background levels. ~c! Similardiagram for a synthetic quartz sample ~QTiP-7!. In this case,Si-normalized ratios for Ti are notably erratic after the first 25analysis cycles. This is attributed to sample heterogeneity as alsoreflected by significant zoning of CL intensity for this sample.
1326 William P. Leeman et al.

642, 566, and 456 nm! appear to be satisfactorily resolved inmost samples. The first two peaks likely correspond tononbridging oxygen hole ~NBOH! and intrinsic quartz con-tributions ~cf. Luff & Townsend, 1990; Stevens-Kalceff &Phillips, 1995; Stevens-Kalceff, 2009; Vasyukova et al., 2013!;however, intensity of the third spectral component is stronglycorrelated with Ti4� content, particularly for specific sam-ples ~see details below!. Figure 2 shows representative CLspectra for three areas in a zoned quartz crystal. The spectradiffer primarily in the intensity of the ca. 2.7 eV peak, withnearly twofold difference in intensity for areas containing28 and 57 ppm Ti. The other prominent peak ~ca. 1.9 eV!has nearly uniform intensity for all three areas sampled butshows diminishing relative prominence as Ti content in-creases. Figure 3 shows a map of 2.7 eV CL intensity for arepresentative quartz grain, illustrating complex patterns ofinternal zoning; a false color scale is used to enhance thevariation in CL intensity, and a line profile is presented tohighlight the main topological features. Deconvolved energypeaks are illustrated for distinctively high and low CL areas.Relative intensities for these energy peaks vary considerablywithin many samples, and to an even greater extent betweensamples. As Ti content decreases, the lower energy peaksbecome increasingly prominent ~Fig. 2!. For this reason,total CL intensity ~or “grayscale” intensity as used byLandtwing & Pettke, 2005!, for example, cannot be expectedto vary linearly in detail with content of Ti or other excitonelements.
Each of the resolved energy contributions can bemapped separately to illustrate the last point. This is illus-trated in Figure 4, which provides examples of the mapdistribution of intensity for the 1.95, 2.32, and 2.7 eVresolved components for a representative sample, the latterof which directly reflects the distribution of Ti. In particu-lar, it can be seen that intensities and gradients in the 1.95
and 2.32 eV maps are quite low and reflect relatively uni-form CL contributions inherent to the quartz structure.However, all images clearly reflect the distinctive over-growth of Ti-rich quartz on an earlier formed lower-Ticore. The 2.7 eV map provides maximum detail, indicatinga somewhat oscillatory growth pattern for the core area, andapparent truncation of the grain before final overgrowth ofthe rim. Implications of such growth patterns will be dis-cussed later.
Other AnalysesWe utilize EMPA data obtained at Rennselaer PolytechnicInstitute ~RPI! using a Cameca SX-100 instrument ~Cam-eca, Madison, WI, USA! and methods as discussed by Tho-mas et al. ~2010! and references therein. A four-spectrometerdata acquisition system is used to measure trace Ti contents,and calibration is based on analysis of a rutile ~TiO2!standard. Approaching the effective detection limit of ca.15 ppm, precision is approximately 650%. At concentra-tions above 100 ppm, precision is better than 610%. How-ever, sample heterogeneity can be a limiting factor onprecision ~cf. Table 4!.
We also refer to LA-ICPMS data obtained at VirginiaPolytechnic Institute ~VPI! for quartz and melt inclusions.There, an Agilent 7500ce ICPMS ~Allied Electronics, Inc.,Fort Worth, TX, USA! is coupled with a GeoLas 193 nmlaser system ~Coherent Inc., Santa Clara, CA, USA!, andcalibration is based on analysis of the NIST standards usedat Rice University. Overall precision and accuracy are com-parable between the two labs.
RESULTS
Analytical results are presented in Table 3. Because we areconcerned with the potential correlation of Ti content with
Table 2. LA-ICPMS Analyses of Standard Reference Glasses ~Rice University!.
Standard BHVO BCR BIR NIST610 NIST612 ATHO-G
Average Nov. 2009 16,358 14,387 5,297 501 49 1,888SD 910 881 172 22 6 57RSD 5.6% 6.1% 3.2% 4.4% 11.8% 3.0%N 9 7 5 6 4 4PV-Ti ppm 16,300 14,100 5,400 452 44 1,529%D Avg:PV 0.4% 2.0% �1.9% 10.9% 10.5% 23.5%Previous sessionsAverage of session means ~N � 5! 16,475 14,129 5,418 n.d.a 45 1,791SD 414 656 140 n.d. 2 163RSD 2.6% 5.0% 2.5% n.d. 4.5 9.1%
Note: Data shown for November 2009 analyses correspond to majority of data in Table 2. Calibration curve for @Ti ppm/Si ppm# versus@Ti-int/Si-int# is based on first four standards assuming preferred values ~PV! for Ti and Si taken from the GEOREM website. AverageTi concentration and standard deviation are based on N individual analyses for each standard. NIST-612 and ATHO-G were not usedfor calibration but analyzed as an independent checks on accuracy. Precision is better than ca. 6% for all standards except the low-TiNIST-612 ~12%!. Accuracy ~%D Avg:PV! is better than 2% for high-Ti standards, but a bias of ;11% is apparent for the NISTstandards and ;23% for ATHO-G, all of which have systematically higher Si and distinctive matrix composition. Reported data inTable 2 are based on a 15% reduction of measured Ti content for all quartz samples as these more closely match matrix compositionsof the high-Si standards. Standards data from previous sessions are in close agreement ~see averages of earlier session means!.an.d. � not determined.
Ti-CL Calibration 1327
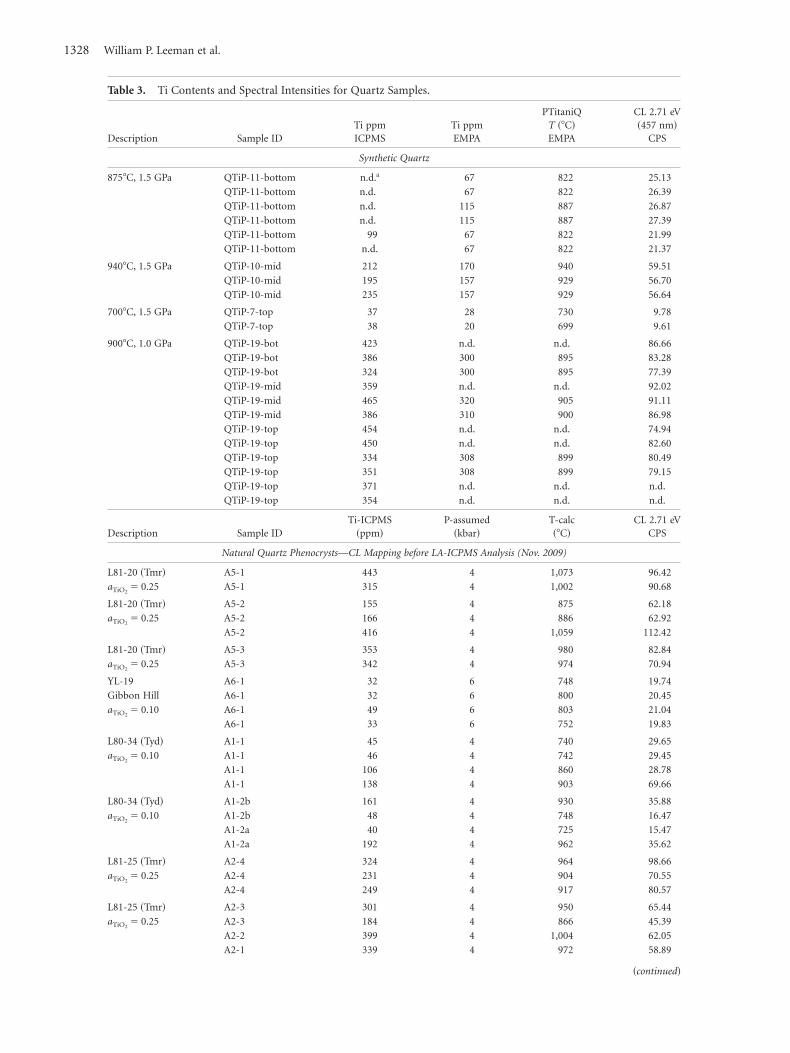
Table 3. Ti Contents and Spectral Intensities for Quartz Samples.
Description Sample IDTi ppmICPMS
Ti ppmEMPA
PTitaniQT ~8C!EMPA
CL 2.71 eV~457 nm!
CPS
Synthetic Quartz
8758C, 1.5 GPa QTiP-11-bottom n.d.a 67 822 25.13
QTiP-11-bottom n.d. 67 822 26.39
QTiP-11-bottom n.d. 115 887 26.87
QTiP-11-bottom n.d. 115 887 27.39
QTiP-11-bottom 99 67 822 21.99
QTiP-11-bottom n.d. 67 822 21.37
9408C, 1.5 GPa QTiP-10-mid 212 170 940 59.51
QTiP-10-mid 195 157 929 56.70
QTiP-10-mid 235 157 929 56.64
7008C, 1.5 GPa QTiP-7-top 37 28 730 9.78
QTiP-7-top 38 20 699 9.61
9008C, 1.0 GPa QTiP-19-bot 423 n.d. n.d. 86.66
QTiP-19-bot 386 300 895 83.28
QTiP-19-bot 324 300 895 77.39
QTiP-19-mid 359 n.d. n.d. 92.02
QTiP-19-mid 465 320 905 91.11
QTiP-19-mid 386 310 900 86.98
QTiP-19-top 454 n.d. n.d. 74.94
QTiP-19-top 450 n.d. n.d. 82.60
QTiP-19-top 334 308 899 80.49
QTiP-19-top 351 308 899 79.15
QTiP-19-top 371 n.d. n.d. n.d.
QTiP-19-top 354 n.d. n.d. n.d.
Description Sample IDTi-ICPMS
~ppm!P-assumed
~kbar!T-calc~8C!
CL 2.71 eVCPS
Natural Quartz Phenocrysts—CL Mapping before LA-ICPMS Analysis (Nov. 2009)
L81-20 ~Tmr! A5-1 443 4 1,073 96.42
aTiO2� 0.25 A5-1 315 4 1,002 90.68
L81-20 ~Tmr! A5-2 155 4 875 62.18
aTiO2� 0.25 A5-2 166 4 886 62.92
A5-2 416 4 1,059 112.42
L81-20 ~Tmr! A5-3 353 4 980 82.84
aTiO2� 0.25 A5-3 342 4 974 70.94
YL-19 A6-1 32 6 748 19.74
Gibbon Hill A6-1 32 6 800 20.45
aTiO2� 0.10 A6-1 49 6 803 21.04
A6-1 33 6 752 19.83
L80-34 ~Tyd! A1-1 45 4 740 29.65
aTiO2� 0.10 A1-1 46 4 742 29.45
A1-1 106 4 860 28.78
A1-1 138 4 903 69.66
L80-34 ~Tyd! A1-2b 161 4 930 35.88
aTiO2� 0.10 A1-2b 48 4 748 16.47
A1-2a 40 4 725 15.47
A1-2a 192 4 962 35.62
L81-25 ~Tmr! A2-4 324 4 964 98.66
aTiO2� 0.25 A2-4 231 4 904 70.55
A2-4 249 4 917 80.57
L81-25 ~Tmr! A2-3 301 4 950 65.44
aTiO2� 0.25 A2-3 184 4 866 45.39
A2-2 399 4 1,004 62.05
A2-1 339 4 972 58.89
~continued!
1328 William P. Leeman et al.
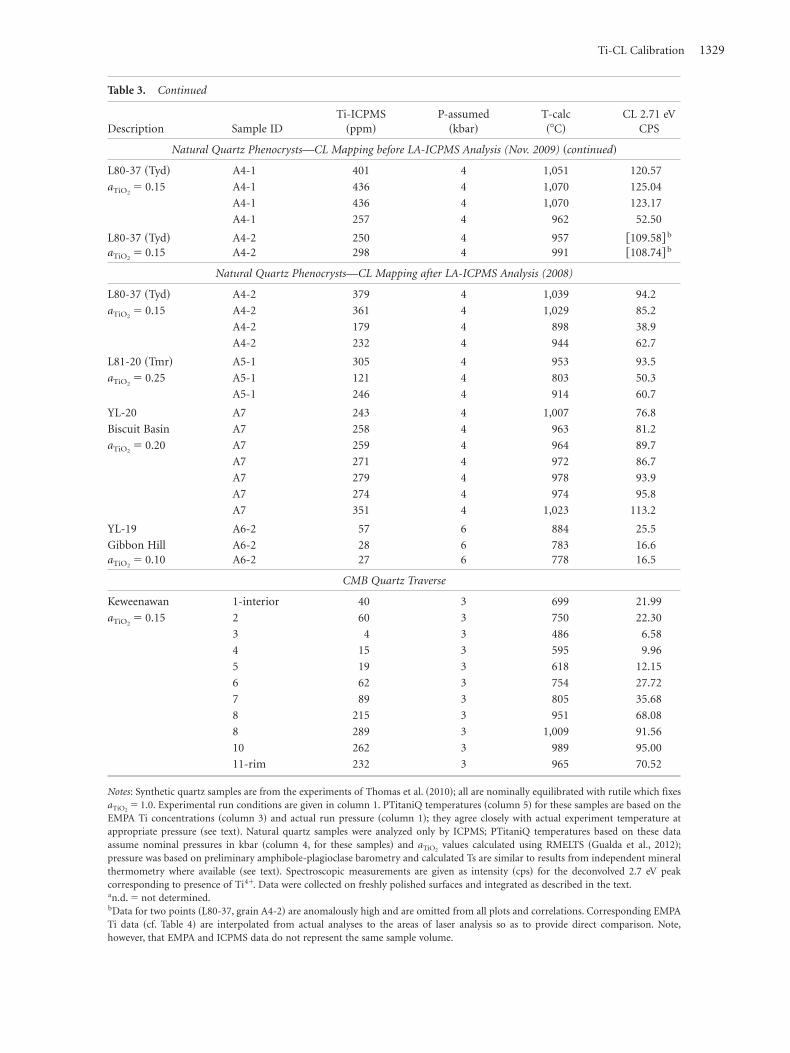
Table 3. Continued
Description Sample IDTi-ICPMS
~ppm!P-assumed
~kbar!T-calc~8C!
CL 2.71 eVCPS
Natural Quartz Phenocrysts—CL Mapping before LA-ICPMS Analysis (Nov. 2009) ~continued!
L80-37 ~Tyd! A4-1 401 4 1,051 120.57
aTiO2� 0.15 A4-1 436 4 1,070 125.04
A4-1 436 4 1,070 123.17
A4-1 257 4 962 52.50
L80-37 ~Tyd! A4-2 250 4 957 @109.58# b
aTiO2� 0.15 A4-2 298 4 991 @108.74# b
Natural Quartz Phenocrysts—CL Mapping after LA-ICPMS Analysis (2008)
L80-37 ~Tyd! A4-2 379 4 1,039 94.2
aTiO2� 0.15 A4-2 361 4 1,029 85.2
A4-2 179 4 898 38.9
A4-2 232 4 944 62.7
L81-20 ~Tmr! A5-1 305 4 953 93.5
aTiO2� 0.25 A5-1 121 4 803 50.3
A5-1 246 4 914 60.7
YL-20 A7 243 4 1,007 76.8
Biscuit Basin A7 258 4 963 81.2
aTiO2� 0.20 A7 259 4 964 89.7
A7 271 4 972 86.7
A7 279 4 978 93.9
A7 274 4 974 95.8
A7 351 4 1,023 113.2
YL-19 A6-2 57 6 884 25.5
Gibbon Hill A6-2 28 6 783 16.6aTiO2
� 0.10 A6-2 27 6 778 16.5
CMB Quartz Traverse
Keweenawan 1-interior 40 3 699 21.99
aTiO2� 0.15 2 60 3 750 22.30
3 4 3 486 6.58
4 15 3 595 9.96
5 19 3 618 12.15
6 62 3 754 27.72
7 89 3 805 35.68
8 215 3 951 68.08
8 289 3 1,009 91.56
10 262 3 989 95.00
11-rim 232 3 965 70.52
Notes: Synthetic quartz samples are from the experiments of Thomas et al. ~2010!; all are nominally equilibrated with rutile which fixesaTiO2
� 1.0. Experimental run conditions are given in column 1. PTitaniQ temperatures ~column 5! for these samples are based on theEMPA Ti concentrations ~column 3! and actual run pressure ~column 1!; they agree closely with actual experiment temperature atappropriate pressure ~see text!. Natural quartz samples were analyzed only by ICPMS; PTitaniQ temperatures based on these dataassume nominal pressures in kbar ~column 4, for these samples! and aTiO2
values calculated using RMELTS ~Gualda et al., 2012!;pressure was based on preliminary amphibole-plagioclase barometry and calculated Ts are similar to results from independent mineralthermometry where available ~see text!. Spectroscopic measurements are given as intensity ~cps! for the deconvolved 2.7 eV peakcorresponding to presence of Ti4�. Data were collected on freshly polished surfaces and integrated as described in the text.an.d. � not determined.bData for two points ~L80-37, grain A4-2! are anomalously high and are omitted from all plots and correlations. Corresponding EMPATi data ~cf. Table 4! are interpolated from actual analyses to the areas of laser analysis so as to provide direct comparison. Note,however, that EMPA and ICPMS data do not represent the same sample volume.
Ti-CL Calibration 1329

CL intensity, Table 3 shows intensities of the deconvolved2.71 eV ~458 nm! contribution for each sample investigated.Intensities are integrated for surface areas equivalent to thecorresponding laser analysis spot. Also shown are the Ti
concentrations determined by LA-ICPMS and, where avail-able, EMPA.
Approximate temperatures are also indicated based onapplication of the PTitaniQ thermobarometer ~Thomaset al., 2010!. For synthetic quartz, which was grown in thepresence of rutile, these are calculated using aTiO2
melt-rutile � [email protected]., activity of Ti in melt relative to rutile ~or pure TiO2!;subsequently designated as aTiO2
for brevity# , and using theknown pressure of the synthesis runs; these calculationssimply verify the accuracy of the PTitaniQ algorithm forexamples of the calibration runs. Note that absolute devia-tions for all calibration data relative to P-T values predictedby the model @Thomas et al., 2010; equation ~9!# average60.9 kbar and 6208C, respectively. For natural samples,aTiO2
is calculated using the Rhyolite-MELTS program~RMELTS; Gualda et al., 2012!, and nominal pressure valuesconsistent with ~1! experimental results of Almeev et al.~2012!, ~2! inferred depths of the magma reservoirs asdiscussed earlier ~cf. Table 1!, and preliminary amphibole-plagioclase barometry ~cf. Anderson & Smith, 1995! on twoMREC rhyolites. For the rhyolite compositions studied ~cf.Bindeman & Valley, 2001; Leeman, unpublished data!, andfor average melt inclusions in Keweenawan quartz ~Studentet al., 2007!, aTiO2
values cluster near 0.15 and 0.25. Becausethese values vary little as a function of pressure and increaseonly slightly with increasing H2O content, we conclude thatthe calculated range in activity largely reflects differences inmagmatic TiO2 content. Values used for individual samplesare indicated in Table 3. Also, for comparison, if all experi-ments of Thomas et al. ~2010! are recalculated using thethermobarometer algorithm of Huang and Audétat ~2012!,pressures are underestimated by an average of 4.5 kbar~using the experimental T!; conversely, temperature is over-estimated by an average of 858C ~using the experimental P!.
Figure 2. Relation between CL spectral intensity and variation in Ti content for representative quartz grain fromsample A6 ~YL-19; rhyolite of Gibbon Hill, Yellowstone!. ~a! Map of CL intensity ~warmer colors � higher intensity!,with loci of laser analyses. ~b! Spectra are shown for areas adjacent to analysis spots numbered 1–3, with data averagedover zones of similar overall intensity. Spot #1 corresponds to higher Ti ~57 ppm! than spots #2 and #3 ~both ca.28 ppm!. Note that spectral peak near 1.9 eV corresponds to intrinsic CL productivity for quartz, and its intensity isuncorrelated with Ti content. Intensity of spectral peak centered near 2.7 eV varies closely with Ti content.
Figure 3. Example of spectral deconvolution. ~a! CL map for arepresentative quartz grain from sample A5 ~rhyolite of MagicReservoir, Tmr!, showing well-developed banding and truncationsin CL intensity. ~b! Line profile between points 1 and 2 ~in panel a!shows variation in intensity of the deconvolved 2.7 eV peak withposition across the grain. Open circles annotate distinctive high-and low-intensity points along the profile. ~c, d! DeconvolvedGaussian peak contributions to the overall CL spectra are illus-trated for areas of anomalously high and low CL intensity. Majorpeaks are associated with CL emission due to substitution of Ti4�
for Si4� on structural sites ~Ti! and the presence of NBOH in thecrystal structure; a small peak near 2.3 eV is associated with defectstructures.
1330 William P. Leeman et al.

For convenience the PTitaniQ thermobarometer is utilizedfor later discussion in this article.
One principal goal of this study was to evaluate theaccuracy and precision of LA-ICPMS data for Ti in quartzsamples. To this end, we analyzed a number of previouslycharacterized samples. The first is a single large quartz grainin sample CMB ~Student et al., 2006! that was analyzed byboth EMPA ~RPI! and LA-ICPMS ~VPI! to document coreto rim variation in Ti. We conducted a parallel LA-ICPMStraverse that closely replicates the previous data ~Fig. 5!,
with concentrations ranging from less than 5 to nearly300 ppm Ti. Line profiles for the two sets of LA-ICPMS dataare remarkably similar, especially considering that analysisspots were necessarily offset. Both LA-ICPMS datasets areslightly elevated in Ti relative to the EMPA data, but differ-ences are within analytical uncertainties of the two methodsfor the majority of analyzed areas. A second comparisoncan be made based on EMPA ~RPI! and LA-ICPMS ~Rice!analyses of quartz in selected Snake River Plain rhyolites.Results are shown ~Fig. 6! for one representative example.Again, the ICPMS data appear to be slightly elevated forcomparable points ~especially near the crystal rim!, butdifferences in sample volume could partly be responsible fordivergence of these data. For example, one ICPMS pointaveraged 94 ppm, but concentrations varied significantlywith depth ~123–78 ppm!.
Further comparison was attempted using syntheticquartz samples that were previously analyzed by EMPA atRPI ~Thomas et al., 2010!. As noted earlier, these samplesexhibit CL zoning indicative that some grew in two distinctstages—e.g., an early “skeletal” framework ~brighter CL!followed by infilling of compositionally distinctive quartz
Figure 4. CL intensity maps for quartz from a high temperaturerhyolite lava ~sample A2; rhyolite of Magic Reservoir, Tmr!. Re-solved components ~see text! were estimated for each pixel thenused to map spatial variation in intensity for each resolved energypeak. Color scales adjacent to each image indicate the range inintensity observed as counts per second or, in the case of the 2.7 eVpeak, Ti content based on linear correlation between intensity andconcentration. Note that NBOH ~1.95 eV! contributions are en-hanced in the crystal core where Ti content is lowest.
Figure 5. ~a! Grayscale CL intensity map showing loci of analysistransects in a large quartz grain from sample CMB ~Portage LakeVolcanics!. Note presence of a now-crystallized melt inclusion~MI! in near-euhedral dark core of the large grain. ~b! Superposedline profiles for Ti concentrations obtained by LA-ICPMS ~RU,this study; VPI, Student et al., 2006! and by EMPA ~RPI, Studentet al., 2006!. Note that all transects arbitrarily begin near core ofthe crystal ~along white curved line! and progress outward towardthe crystal rim.
Ti-CL Calibration 1331

~darker CL; cf. Fig. 7a!. The EMPA resolution is sufficient toobtain meaningful analyses of the two populations, albeitsome heterogeneity is evident. On the other hand, consider-ing the coarser resolution of LA-ICPMS analyses, it wasimpossible to ensure that a single quartz domain was sam-pled in any given analysis, even with a more focused laserspot ~down to 25 mm!. Although not conspicuous in mostof the time-series analyses, intergrowths of the distinctdomains were likely encountered as the laser burrowedbeneath the crystal surface ~e.g., as seen in Fig. 1c!. Anotherfactor to consider is that the samples were repolished follow-ing EMPA analysis, such that the surface exposed to LA-
ICPMS analysis differed slightly from that analyzed by EMPA.Consequently, for direct comparison it was necessary tointerpolate the EMPA data to estimate Ti content near eachlaser spot; these estimates are tabulated in Table 3. Althoughsampling of compositionally zoned crystals proved difficult,as evident in the data scatter, the LA-ICPMS and EMPA Tianalyses for these samples are surprisingly well correlated~Fig. 7b!.
Overall, these comparisons demonstrate close agree-ment for Rice LA-ICPMS and RPI EMPA analysis, especiallyconsidering the intrinsic heterogeneity of most of the com-parison samples. The LA-ICPMS method presents distinctadvantages in precision and sensitivity at concentrationsbelow 50 ppm. However, orders of magnitude larger sampleanalysis volume can be a disadvantage for LA-ICPMS whenworking with strongly zoned crystals and adversely affectsresolution of concentration gradients over small distances,such as near crystal rims or near other steep interfaces. Also,all examples confirm a bias toward higher Ti content viaICPMS compared to EMPA analysis; further work usinglow-Ti standards ~and ideally quartz samples of near-identical matrix composition! is needed to resolve thisdiscrepancy. Nevertheless, we find that ICPMS data aresufficiently precise to evaluate relative variations at concen-tration ranges observed in natural quartz samples.
DISCUSSION
A second principal objective of this work was to establishthe extent to which the CL spectra for quartz can be used toquantitatively assess the distribution of Ti therein. This isaddressed directly in a series of correlation plots ~Fig. 8!.Again, we note that in two cases CL data were acquired afterLA-ICPMS analysis, such that the two datasets correspondto closely adjacent but not identical sample areas. Also, intwo cases, LA-ICPMS analysis followed the spectral analysisof each grain and afterward CL data could be integratedprecisely from the areas sampled by the laser.
Data for the CMB quartz phenocryst ~Fig. 8a! areexceptionally well correlated ~R2 � 0.98! despite the factthat the data are not exactly spatially congruent. Using theregression equation to calculate Ti contents from 2.7 eV CLintensities for this sample, the observed LA-ICPMS measure-
Table 4. EMPA Titanium Analyses for Synthetic Quartz.
Sample EMPA Average SD % RSD N ICPMS Average SD % RSD N
QTiP-7 20.5 7.4 36.1% 10 32 8.5 26.5% 2QTiP-10 158.5 16.5 10.4% 10 214 20.0 9.3% 3
Bright CL 165.5 7.9 4.7% 8 — — — —Dark CL 135.5 0.7 0.5% 2 — — — —
QTiP-11 92.9 27.3 29.4% 10 99 — — 1Bright CL 118.6 4.3 3.6% 5 — — — —Dark CL 67.2 2.3 3.4% 5 — — — —
QTiP-19 301.3 24.5 8.1% 15 388 48.8 12.6% 12
Note: EMPA data were collected using a Cameca SX-100 electron microprobe with 15 kV accelerating potential, 200 na beam current,and 400 s counts on four spectrometers. Analytical procedures are discussed in Thomas et al. ~2010! and references therein.
Figure 6. Volcanic quartz phenocryst ~sample WBQ-7, rhyolite ofWedge Butte, Snake River Plain; Tyd! showing CL zoning and adecrease in Ti content from core to rim. EMPA ~black numbers,hexagon spots! and ICPMS ~white numbers, white circles! showsimilar concentration gradients, albeit the latter clearly sample alarger volume. In one case, ICPMS data record significant variabil-ity in Ti content ~78 to 123 ppm!, increasing with depth beneaththe surface. Inset shows photomicrograph of sample surface “bat-tleground” following laser attack, with pit diameters of 40 mm ~formost! to 160 mm ~1!. There is a nearly twofold decrease in Ti fromcore ~ca. 240 ppm! to rim ~ca. 100 ppm!. Original EMPA data andCL image were obtained at RPI.
1332 William P. Leeman et al.

ments are reproduced within 15% for all but a few pointswith low concentration ~e.g., Ti , 40 ppm!.
Data for the synthetic quartz samples ~Fig. 8b! are alsowell correlated ~R2 � 0.94!, despite the fact that individualsamples are heterogeneous to varying extent. Averages of
the individual EMPA data for these samples are provided inTable 4 and, superposed on the figure, they reinforce thegeneral agreement between analytical methods. In this case,the scale of heterogeneity and relative sampling volumes foreach method appear not to introduce a significant bias.
Figure 7. ~a! CL image of synthetic quartz QTiP-10 reveals distinct CL domains and heterogeneous distribution of Tibased on EMPA analysis at RPI ~see Table 4!. ~b! Correlation plot showing EMPA versus LA-ICPMS Ti analyses for allanalyzed synthetic quartz samples. Although the regression line through all data is very close to a perfect correlation,ICPMS data are systematically higher than EMPA data. In detail there is considerable scatter in LA-ICPMS results,particularly for the highest Ti sample. Also, the range in EMPA data ~indicated by vertical gray bars! is significantlygreater than the expected analytical precision in some cases—reflecting sample heterogeneity. As indicated in Table 4,EMPA Ti content appears to be bimodal in some samples ~QTiP-10 and -11!.
Figure 8. Correlation of 2.7 eV CL intensity with Ti content of various quartz populations. ~a! Data for single crystal inKeweenawan sample CMB, with CL data acquired after LA-ICPMS analysis on adjacent spots. ~b! Data for experimen-tally produced synthetic quartz with CL data acquired first. ~c! Data for selected volcanic quartz phenocrysts, with CLdata acquired after LA-ICPMS analysis on adjacent spots. ~d! Data for selected volcanic quartz phenocrysts, with CLdata acquired prior to LA-ICPMS analysis. Dashed lines link multiple analyses from individual grains.
Ti-CL Calibration 1333

Using the regression between intensity of the 2.7 eV peakand EMPA data, Ti concentration is predicted with betterthan 30% accuracy for all but sample QTiP-7, which has thelowest Ti content ~ca. 25 ppm!; data for sample QTiP-19~ca. 300 ppm! are predicted within better than 10%.
Data for the remaining volcanic quartz samples aremore complex than expected. For the first round of analyses~Fig. 8c!, the data as a whole are reasonably well correlated~R2 � 0.87! but clearly appear to fall into distinct sub-groups. In particular, correlations between Ti and CL inten-sity are significantly stronger for data restricted to singlecompositionally zoned grains ~R2s of 0.96 and 0.89, respec-tively, for quartz in samples A4 and A7!. Data for the secondround of analyses are more scattered and exhibit a loweroverall correlation ~R2 � 0.81!. In this case, data wereobtained for five different samples but, unlike the first case,multiple spots on multiple grains were analyzed for mostsamples. There appear to be systematic correlations forsome grains or parts thereof, but multiple grains from agiven sample are not always well correlated. It is also appar-ent that data from two samples ~A4 and A5! have differentranges of CL intensity for the periods of analysis. While thismay in part reflect extraction of spectral data from differentspots on the grains, the data subsets have similar ranges inTi content. It is likely that the CL collected after the initialICPMS analysis contained localized defects induced by thelaser, which led to variations in the observed CL response.Stevens-Kalceff ~2009! reported changes in the 2.7 eV peakover time due to beam irradiation. Such changes may beascribed to oxygen-defect centers that, in this case, may havebeen induced by the laser. Since CL spectra were collected asclose as practical to the laser analysis pits, this could havebeen a significant source of error. For the CL data collectedprior to the second round of laser analysis, the variation inCL yield with Ti concentration across a number of quartzgrains may be due to one or more of the following:
1. Differences in analysis volume. The laser ablates materialfrom depths over tens of microns compared to themicron-scale depth for the CL emission.
2. Scales of compositional heterogeneity. The volcanic quartzmay have varied Ti contents over submicron lengthscales, such that the relocation of where the laser analysishad been performed is critical to extraction of exactlycorresponding CL spectra. Although the laser analysisregions were carefully selected to be as homogenous aspossible, it was not always possible to avoid small-scaleheterogeneities—particularly in the subsurface volumesampled by the laser. For example, the quartz CL maps~cf. Figs. 4, 10, and 11! illustrate both heterogeneousregions and fine scale zoning in many samples.
3. Varied controls on CL centers within and between sam-ples. Titanium impurities can occur in a number ofradiative and nonradiative configurations in quartz ~e.g.,Ti3�, Ti4�, substitutional, and interstitial!. The volcanicquartz may contain variable relative proportions of theradiative to nonradiative sites giving rise to a further
source of error ~Stevens-Kalceff, 2009!. On the otherhand, Raman spectral data and density functional theorymodeling indicate that Ti dominantly substitutes as Ti4�
for Si4� on tetrahedral coordination sites ~four oxygenatoms! in the quartz structure ~Thomas et al., 2010!.Moreover, there is little evidence for occurrence of Ti3�
in natural samples owing to relatively oxidized redoxconditions in the Earth’s crust.
These results demonstrate that under ideal conditionsit is possible to attain a high correlation between CL spec-tral intensity ~2.7 eV peak! and Ti content in quartz—particularly in single crystals for which conditions favor anear-uniform spectral response. However, further work isneeded to understand second-order differences in CL re-sponse between samples and, in some cases, between indi-vidual quartz grains in a given sample. In general, forexacting applications, it seems advisable to calibrate thatresponse on at least a sample-by-sample basis—as is wellexemplified by results for the Keweenawan quartz.
APPLICATIONS
We next consider potential applications of high-resolutionCL spectral analysis to interpretations of the growth historyof quartz in magmatic systems, and the underlying petro-logic processes recorded during that growth. Evidence formultiple growth stages, possible resorption, and overgrowthsof new quartz provide insights into how magmas are aggre-gated and stored in the crust. Coupled with compositionalinformation on melt inclusions and/or mineral intergrowths,it may be possible to add further compositional and tempo-ral constraints ~cf. Matthews et al., 2012; Thomas & Watson,2012; Wilson et al., 2012!. Development of the PTitaniQmethodology adds another tool for potentially constrainingphysical conditions for magmatic processes, albeit differ-ences in calibration and interpretation remain to be re-solved. In this section we briefly consider examples of theinformation content in the CL maps and how they may beutilized to enhance petrologic interpretation.
The highly zoned Keweenawan quartz phenocryst isparticularly noteworthy because of the intricate zonationthat it displays. Figure 9 presents two images of this grain.The first is a map of CL 1.93 eV intensity that shows thecore region to be dominated by intrinsic quartz CL. Thesecond image presents a map of Ti distribution, derivedfrom the 2.7 eV CL peak intensity, based on the strongcorrelation of these parameters shown in Figure 8a. Individ-ual data points from our LA-ICPMS traverse are plotted onthe figure to emphasize the precision of the concentrationcontours. This map brings out details that cannot be gleanedeasily from direct spot analysis. The small dark core region,generally characterized by less than ;15 ppm Ti, is ofdubious magmatic origin; it could possibly represent en-trained restitic material ~i.e., relict unmelted material! froma near-solidus melting regime in the crust. In contrast, thedark blue inner core is interpreted as magmatic in origin asit has euhedral morphology, includes a trapped melt inclu-
1334 William P. Leeman et al.

sion ~now crystallized!, and has fairly uniform Ti contentnear 50 ppm. For illustration, application of the PTitaniQthermobarometer ~using a nominal pressure of 3 kbar andaTiO2
� ;0.15, as calculated using RMELTS for melt inclu-sion data from other grains! suggests that such low Ticontents likely correspond to magmatic temperatures nearor below 7508C; such low-T melts are likely to be water-rich~i.e., near the water-saturated solidus for silicic materials;Johannes & Holtz, 1996!. Subsequent accretion on the euhe-dral core of higher-Ti quartz ~yellow-green region in Fig. 9b!proceeded until concentrations reached ;200 ppm; thiscould reflect combined effects of increasing T and decom-pression ~Müller et al., 2009; Thomas & Watson, 2012!. The
anhedral outer form of this zone ~yellow/red interface!suggests a period of resorption, after which a major over-growth rim ~red-orange area! formed with high and rela-tively uniform Ti content ~;260–290 ppm!. The latterovergrowth reflects a major change in the magmatic system.Several processes ~e.g., magma ascent and decompression,volatile exsolution, magma mixing! or combinations thereofcould possibly produce the sharp transition ~cf. Liu et al.,2006; Müller et al., 2009; Thomas et al., 2010; Thomas &Watson, 2012!. Finally, the thin outermost rim is character-ized by a sharp decrease in Ti to levels near 100 ppm; themap best illustrates this, as it was difficult to obtain LA-ICPMS data near the crystal edge. However, the irregular,
Figure 9. Further views of zoned Keweenawan phenocryst ~CMB! seen in Figure 2. ~a! Map of 1.93 eV intrinsic CL;note extremely low overall intensity with maxima in core area containing very low Ti ~,30 ppm!. ~b! Map of Tidistribution throughout the exposed quartz grain obtained from 2.7 eV CL calibrated against Ti measurements fromthis study ~see Fig. 8a!. The new ICPMS data are superposed to illustrate excellent fit in detail with the map. Thepreliminary temperature estimates were based on the PTitaniQ geothermometer ~Thomas et al., 2010! using aTiO2
�0.15 and nominal pressure of 3 kbar. The resulting range in crystallization temperature overlaps Zr saturationtemperatures for melt inclusions in quartz grains from the same locality ~cf. Student et al., 2007!.
Figure 10. Maps of 2.7 eV CL intensity convertedto Ti ppm using analytical data for individualgrains: ~a, b! sample A2 ~L81-25!; ~c, d! sample A5~L81-20!. All grains are from the same volcanicunit, rhyolite lava of Magic Reservoir ~Tmr; Honjo& Leeman, 1987!.
Ti-CL Calibration 1335

variably embayed contact between outer and inner zones ofthe rim indicate that the grain was undergoing dissolutionin a magma reservoir for some time, then cooled relativelyquickly ~i.e., preserving a steep concentration gradient!,during which time the outermost rim formed.
Other quartz Ti maps are presented to further illustratethe information content they convey ~Figs. 10, 11!. Calibra-tions of the spectral maps are based on a limited number ofanalyses ~cf. Table 3! for the highlighted grains, and interpre-tation is enhanced by application of the PTitaniQ thermo-
Figure 11. Maps of 2.7 eV CL intensity convertedto Ti ppm using analytical data for individualgrains: ~a! sample A4 ~L80-37; rhyolite ofDinosaur Ridge!; ~b! sample A6 ~YL-19, rhyolite ofGibbon Hill, Yellowstone!; ~c, d! sample A1~L80-34, rhyolite of Rattlesnake Butte!.
Figure 12. P-T diagrams showing isopleths of Ti content in quartz compositions at indicated aTiO2values calculated
with RMELTS and the PTitaniQ model of Thomas et al. ~2010!. Loci are shown for the water-saturated “granite” solidus~WGS! and dry “granite” liquidus ~DGL! for reference ~cf. Holtz et al., 2001!. Light-shaded rectangle delimits the rangeof pressure ~ca. 2–4 kbar! over which SRP rhyolite mineral assemblages were experimentally replicated ~Almeev et al.,2009, 2012!. ~a! Gibbon Dome rhyolite ~aTiO2
� 0.10!, showing isopleths for core ~ca. 57 ppm Ti! and rim ~28 ppm!compositions. Zr and Zr' saturation Ts ~Tzr; ca. 820–8608C! and liquidus curve ~calculated with RMELTS assuming 3%H2O in melt and NNO redox buffer! provide constraints on temperature. Bold arrow indicates general P-T trendinferred during progressive quartz growth. Small fluctuations in Ti in the broad rim of this quartz can be explained bysubtle temperature and/or composition fluctuations within the magma reservoir. ~b! Similar diagram for a hightemperature MREC rhyolite ~L81-20! with aTiO2
~0.20! showing isopleths for core ~ca. 150 ppm Ti! and maximum-Tiovergrowth ~“Rim,” 440 ppm! compositions. Independent T estimates based on oxide ~Tox!, pyroxene ~Tpx!, andfeldspar ~Tfsp! thermometry, and Zr saturation ~Tzr! suggest a maximum magmatic temperature near 1,0208C. Tliquidus curve for this sample is calculated with RMELTS assuming 1.5% H2O in melt and NNO redox buffer. Twohypothetical P-T paths are suggested to explain variations in quartz composition. A ~bold solid trend! invokes simpledecompression between core and overgrowth stages; B ~bold dashed trend! invokes heating and decompression.
1336 William P. Leeman et al.
barometer, where values of aTiO2are calculated using
RMELTS assuming that bulk rock compositions approxi-mate the magmatic liquids. Figure 10 presents Ti maps forrepresentative grains from two samples of a high-T MRECrhyolite lava flow ~central Snake River Plain!. This unit isinterpreted to represent a rhyolitic magma into which ap-proximately 10% basaltic magma was mixed ~Honjo &Leeman, 1987!. The quartz grains in this volcanic unit arestrongly zoned and have among the highest Ti contentsmeasured ~up to 443 ppm!, consistent with inferred mag-matic temperatures greater than 1,0008C ~Honjo et al.,1992!. Unsurprisingly, the Ti maps reflect complex growthhistories, albeit the record is incomplete in any one grainbecause of fragmentation. However, it is evident that crystalgrowth varied from relatively low-Ti cores to maximum-Tiintermediate zones and, finally, reverted back to lower-Tirims—similar to zoning in the Keweenawan quartz.
Figure 11 presents images of rhyolite dome samplesfrom the central Snake River Plain ~A1, A6! and fromYellowstone ~YL-19!. Compared to the previous example,mineral thermometry indicates significantly lower tempera-tures for these samples ~Honjo et al., 1992; Vazquez et al.,2009! although such information is not currently availablefor sample A4. Very distinct growth histories are evident inthese samples. Multiple grains in sample A1 have high-Ticores ~up to 200 ppm; consistent with temperatures .9008C!and normal overgrowths of lower-Ti quartz ~ca. 40 ppm!with a sharp interface between these domains. Thus, quartzgrowth began in a relatively hot magma followed by rapidcooling, perhaps triggered by its ascent to a shallow, lower-Tmagma reservoir prior to eruption. In contrast, sample A4quartz records a significantly warmer magma with Ti con-tents exceeding 400 ppm ~ca. .10008C!. The mapped grainsrecord frequent oscillations, with maximum Ti in the rims,suggestive of a strong heating event just prior to eruption.Given the elevated temperatures, this could signify thateruption was triggered by emplacement of a new batch ofhotter magma into the reservoir. Sample A6 is distinctive inthat it has relatively low Ti overall ~ca. 27–60 ppm!, withhighest values in the core region. In this case, the originalmagma is inferred to have been relatively cool compared tothe previous examples, and the bulk of the quartz appar-ently grew under cooler conditions than the core. However,fine oscillation in Ti content is apparent and signifies aprotracted cooling history, perhaps with minor thermalperturbations, consistent with dynamic and complex scenar-ios that have been proposed for the magma system beneathYellowstone ~cf. Vazquez et al., 2009; Girard & Stix, 2010!.
Finally, we attempt to integrate the textural observa-tions with constraints derived from the Ti systematics. Tothis end, it is instructive to consider the interrelationsamong magma composition ~Ti content and aTiO2
!, pres-sure, and temperature. Using equation ~9! of Thomas et al.~2010! and aTiO2
values calculated using RMELTS, it ispossible to determine the loci of Ti isopleths in P-T space~Fig. 12!. It should be noted that other methods of estimat-ing aTiO2
~e.g., based on assumed equilibrium among melt
and coexisting magnetite and ilmenite! tend to producesomewhat higher values than RMELTS, and their use willshift positions of the isopleths upward in the diagram.However, as discussed by Ghiorso and Gualda ~2011, 2012!and Thomas and Watson ~2012!, there is reason to questionmineral-based estimates of activity as the oxide minerals inmany rhyolites do not appear to represent equilibriumcompositions. As we will show, the RMELTS-based esti-mates combined with PTitaniQ appear to predict realistic ifnot unique scenarios for quartz growth.
We first consider the Gibbon Hill rhyolite ~YL-19;Fig. 12a!, which contains “normally zoned” quartz with Tidecreasing from core to rim ~;60 to 27 ppm!. This style ofzoning is commonly observed and can be explained mosteasily by cooling of the host magma at constant or decreas-ing pressure. In this case, constraints on formation of thequartz core are provided by Zr saturation temperatures near;820–8608C, and by the RMELTS calculated liquidus formelts of YL96-19 composition assuming a maximum of 3%H2O in the melt ~inferred from compositions of meltinclusions in Yellowstone rhyolites; Gansecki, 1998!. Offsetof the 57 ppm Ti isopleths to lower temperatures withrespect to the calculated liquidus is consistent with experi-ments ~Almeev et al., 2009, 2012! on similar rhyolites inwhich quartz forms ca. 508C below the liquidus ~i.e., itforms later than clinopyroxene and sanidine feldspar!.These factors are consistent with initial quartz growth froma water-bearing melt at pressures as low as ;4 kbar, andpossibly as high as ;6 kbar ~assuming magmatic tempera-tures up to ;9008C, or near the upper limit for all Yellow-stone rhyolites!. Rim formation could have occurred over arange of temperatures depending on the exact cooling path~only one simple example is shown in the figure!. However,the breadth of the rim and subtle oscillatory variations in Ticontent therein ~Fig. 11b! suggest that the quartz resided ina magma reservoir at conditions near the 27 ppm Tiisopleth for some time prior to eruption. It is also possiblethat the quartz cores formed in a distinct warm magma andwere entrained as xenocrysts ~foreign crystals! or restite~relicts from partially remelting an older silicic intrusion! ina later magma from which the broad rim crystallized ~cf.Girard & Stix, 2010; Watts et al., 2012!. In either case,despite uncertainty as to the exact pressure, the rims formedunder cooler conditions than the core.
The second example considered is the complex high-TMREC rhyolite ~Tmr; L81-20; Figs. 11c, 11d! that has high-Tiquartz overgrowths ~up to ;440 ppm! on low-Ti cores~;150 ppm!; although outermost rims revert to lower Ti~;200 ppm! compositions, the step-like increase is a com-mon feature in volcanic quartz and such “reverse zoning” isoften attributed to heating ~cf. Wark et al., 2007!. Ti iso-pleths are plotted for the end member core and rim compo-sitions ~Fig. 12b!. Theoretically, quartz of these compositionscould form at any P-T conditions along the respectiveisopleths. Independent temperature constraints ~Zr satura-tion, 2-pyroxene, and 2-feldspar thermometers; RMELTSliquidus calculations assuming a maximum of 1.5% H2O in
Ti-CL Calibration 1337
the magma, cf. Almeev et al., 2012! imply that actual condi-tions are limited to the shaded regions along the isopleths.These are also bounded roughly by the schematic “drygranite liquidus,” which crosses the 440 ppm isopleth andestablishes a firm upper limit on temperature for formationof the high-Ti overgrowth. If core formation is also limitedby the aforementioned temperature constraints, then weinfer that this occurred at higher pressures ~ca. .6 kbar!; anupper limit is near 9 kbar as the 150 ppm isopleth ap-proaches within 508C of the calculated rhyolite liquidus.Two scenarios are outlined to explain the observed zoning.The first ~“A”! involves decompression along a hypotheticalpath, during which partial resorption of the core occurs ~cf.Müller et al., 2009!, followed by storage of the magma atlow pressure ~ca. �3 kbar! during which the overgrowthforms. The second scenario ~“B”! involves a combination ofdecompression and heating by hot intrusive basalt ~Honjo& Leeman, 1987!. In this case, the initial rhyolite could havecrystallized core quartz at pressures substantially lower ~pos-sibly as low as ca. 3 kbar!, in which case path “B” could be asextreme as an isobaric spike in temperature. In both cases,after formation of the high-Ti overgrowth, a period ofcooling is required to form the outer rim; oscillations in Ticontent likely signify intermittent fluctuations in tempera-ture during the final repose.
It is acknowledged that the above scenarios are general-ized and based on some assumptions that require furthertesting. For example, magma composition is not necessarilyconstant during the entire growth history of the quartzphenocrysts, in which case aTiO2
values and water contentcould have varied causing shifts in the isopleths and liqui-dus curves. These issues can be addressed with carefulpetrologic study of melt and mineral inclusions in thequartz. However, our objective here is to illustrate how Tidistributions in quartz can potentially enhance our under-standing of complex magmatic systems.
CONCLUSIONS
Two principal goals of this study were to evaluate analyticalmethods for measuring Ti distributions in natural quartzand methods for quantifying CL images thereof. LA-ICPMSand EMPA methods are widely used and both are useful.The latter provides higher spatial resolution but has lowersensitivity. Also, at Ti concentrations below ca. 50 ppm,poorer precision is a limitation for exacting applications.LA-ICPMS has greater sensitivity but poorer spatial resolu-tion due to the large sample volume that is excited duringanalysis; this is disadvantageous when working with hetero-geneous samples. However, the ability to simultaneouslymeasure a large number of other trace elements via LA-ICPMS is a significant advantage. Although both methodsprovide high quality data for Ti, it is apparent that betterstandards are needed at low concentration levels to improvecalibration and to evaluate matrix effects.
High-resolution CL spectral analysis provides remark-able images of deconvolved spectral components and, in
combination with direct analysis, can be used to producedetailed maps of spatial variation in Ti content based onintensity of the 2.7 eV peak. This work demonstrates thatother resolvable components of the CL spectra vary in rela-tive intensity depending on the absolute intensity of the2.7 eV peak, with the following consequences. First, the totalCL intensity provides only a qualitative approximation forTi content. Second, other CL excitons can contribute dispro-portionately to the 2.7 eV peak such that, at low concentra-tions of Ti, the correlation between resolved peak intensityand Ti content is degraded. Despite this, we note very goodcorrelation between Ti content and intensity of the 2.7 eVpeak for single quartz grains, especially when there is a largerange in Ti. On the other hand, correlation lines are some-times offset for grains from different samples, and in somecases we observe variability in grains within a given sample.To some extent this can be attributed to nonuniform surfaceconditions, but other factors likely contribute. For example,differences in internal structure ~e.g., defect numbers andtype!, concentrations of other trace constituents ~H2O, Al,Fe, etc.!, and artifacts of radiation damage ~electron beam,laser! may be contributing factors. Consequently, it is pru-dent to calibrate CL-based maps with direct analyses insofaras possible. With the hyperspectral system at CSIRO, it ispossible to produce detailed concentration profiles of com-positional variations at the 2-mm scale. Back tests suggestthat Ti concentrations can be predicted with accuracy betterthan 15% where concentration levels exceed 40 ppm.
Regarding applications of the data, a fundamental ques-tion concerns how Ti variations in quartz respond to spe-cific magmatic processes. The ability to map subtlecompositional variations in fine detail via CL images is apowerful tool that can help quantify physical conditions andrates ~e.g., via analysis of diffusion profiles; cf. Cherniaket al., 2007; Wark et al., 2007; Matthews et al., 2012! attend-ing magmatic processes. Combination of quantitative mod-eling and textural analysis offers a means of deducingconditions of magma formation, storage, ascent, and mix-ing. To reach the full potential of these developments, contro-versies regarding calibration of Ti solubility in quartz andrelated thermodynamic parameters must be resolved.
ACKNOWLEDGMENTS
W.P.L. thanks the Department of Mineral Sciences, Smithson-ian Institution for access to facilities and assistance withsample preparation, the National Science Foundation ~NSF!for providing time to conduct this research while employedthere, and Ilya Bindeman for providing the Yellowstonequartz separates. J.B.T. acknowledges support from the NSF~grant number EAR-0440228 to E.B. Watson! for experimen-tal studies on the solubility of Ti in minerals. J.J.S. thanksBob Bodnar and Scott Mutchler for access to VPI facilitiesand for analytical support. The authors thank C. Davidson~CSIRO! for preparing samples for CL analysis. We also thankAndreas Audétat and an anonymous reviewer for detailedreviews that were of great help in improving the article.
1338 William P. Leeman et al.

REFERENCES
Almeev, R., Holtz, F., Kuschel, L., Nash, B. & Cathey, H.~2009!. Experimental constraints on rhyolite magma genesis,Yellowstone hotspot. Geochim Cosmochim Acta 73~12!, A30.
Almeev, R.R., Bolte, T., Nash, B.P., Holtz, F., Erdmann, M. &Cathey, H.E. ~2012!. High temperature, low H2O silicic mag-mas of the Yellowstone hotspot: An experimental study, J Petrol53, 1837–1866.
Anderson, J.L. & Smith, D.R. ~1995!. The effects of temperatureand fO2 on the Al-in-hornblende barometer. Am Mineral 80,549–559.
Andrews, G.D.M., Branney, M.J., Bonnichsen, B. & McCurry,M. ~2009!. Rhyolitic ignimbrites in the Rogerson Graben, south-ern Snake River Plain volcanic province: Volcanic stratigraphy,eruption history and basin evolution. Bull Volcanol 70, 269–291.
Bindeman, I.N. & Valley, J.W. ~2001!. Low-d18O rhyolites fromYellowstone: Magmatic evolution based on analyses of zirconsand individual phenocrysts. J Petrol 42, 1491–1517.
Bonnichsen, B., Leeman, W.P., Honjo, N., McIntosh, W.C. &Godchaux, M.M. ~2008!. Miocene silicic volcanism in south-western Idaho: Geochronology, geochemistry, and evolution ofthe central Snake River Plain. Bull Volcanol 70, 315–342.
Campbell, M.E., Hanson, J.B., Minarik, W.G. & Stix, J. ~2009!.Thermal history of the Bandelier magmatic system: Evidencefor magmatic injection and recharge at 1.61 Ma as revealed bycathodoluminescence and titanium geothermometry. J Geol117, 469–485.
Cathey, H.E. & Nash, B.P. ~2004!. The Cougar Point Tuff: Impli-cations for thermochemical zonation and longevity of high-temperature, large-volume silicic magmas of the MioceneYellowstone hotspot. J Petrol 45, 27–58.
Cathey, H.E. & Nash, B.P. ~2009!. Pyroxene thermometry ofrhyolite lavas of the Bruneau–Jarbidge eruptive center, CentralSnake River Plain. J Volcanol Geotherm Res 188, 173–185.
Cherniak, D.J., Watson, E.B. & Wark, D.A. ~2007!. Ti diffusionin quartz. Chem Geol 236, 65–74.
Ellis, B.S. & Wolff, J.A. ~2010!. Petrologic constraints on thedevelopment of a large-volume, high temperature, silicic magmasystem: The Twin Falls eruptive centre, central Snake RiverPlain. Lithos 120, 475–489.
Ellis, B.S. & Wolff, J.A. ~2012!. Complex storage of rhyolite inthe central Snake River Plain. J Volcanol Geotherm Res 211–212,1–11.
Flem, B., Larsen, R.B., Grimstvedt, A. & Mansfeld, J. ~2002!. Insitu analysis of trace elements in quartz by using laser ablationinductively coupled plasma mass spectrometry. Chem Geol 182,237–247.
Gansecki, C.A. ~1998!. 40Ar/39Ar geochronology and pre-eruptivegeochemistry of the Yellowstone Plateau Volcanic Field rhyo-lites. PhD Dissertation. Stanford, CA: Stanford University.
Ghiorso, M.S. & Gualda, G.A.R. ~2011!. A method for estimatingthe activity of titania in magmatic liquids from the composi-tions of coexisting rhombohedral and cubic iron-titanium ox-ides. Eos, Trans Am Geophys Union 91, Fall Meeting Abst.V11A-2486.
Ghiorso, M.S. & Gualda, G.A.R. ~2012!. A method for estimatingthe activity of titania in magmatic liquids from the composi-tions of coexisting rhombohedral and cubic iron-titanium ox-ides. Contrib Mineral Petrol doi:10.1007/s00410-012-0792-y.
Girard, G. & Stix, J. ~2010!. Rapid extraction of discrete magmabatches from a large differentiating magma chamber: The
Central Plateau Member rhyolites, Yellowstone Caldera, Wyo-ming. Contrib Mineral Petrol 160, 441–465.
Götze, J., Plötze, M., Graupner, T., Hallbauer, D.K. & Bray,C.J. ~2004!. Trace element incorporation into quartz: A com-bined study by ICP-MS, electron spin resonance, cathodolumi-nescence, capillary ion analysis, and gas chromatography.Geochim Cosmochim Acta 68, 3741–3759.
Götze, J., Plötze, M. & Habermann, D. ~2001!. Origin, spectralcharacteristics and practical applications of the cathodolumi-nescence of quartz—A review. Mineral Petrol 71, 225–250.
Götze, J., Plötze, M. & Trautmann, T. ~2005!. Structure andluminescence characteristics of quartz from pegmatites. AmMineral 90, 13–21.
Gualda, G.A.R., Ghiorso, M.S., Lemons, R.V. & Carley, T.L.~2012!. Rhyolite-MELTS: A modified calibration of MELTSoptimized for silica-rich, fluid-bearing magmatic systems. JPetrol 53, 875–890.
Harrowfield, I.R., MacRae, C. & Wilson, N.C. ~1993!. Chemi-cal imaging in electron microprobes. In Proceedings of the 27thAnnual MAS Meeting 1993, pp. 547–548. New York: MicrobeamAnalysis Society.
Holness, M.B. & Watt, G.R. ~2001!. Quartz recrystallization andfluid flow during contact metamorphism: A cathodolumines-cence study. Geofluids 1, 215–228.
Holtz, F., Johannes, W., Tamic, N. & Behrens, H. ~2001!. Maxi-mum and minimum water contents of granitic melts generatedin the crust: A reevaluation and implications. Lithos 56, 1–14.
Honjo, N., Bonnichsen, B., Leeman, W.P. & Stormer, J.C. ~1992!.Mineralogy and geothermometry of high-temperature rhyo-lites from the central and western Snake River Plain. BullVolcanol 54, 220–237.
Honjo, N. & Leeman, W.P. ~1987!. Origin of hybrid ferrolatitelavas from the Magic Reservoir eruptive center, Snake RiverPlain, Idaho. Contrib Mineral Petrol 96, 163–177.
Huang, R. & Audétat, A. ~2012!. The titanium-in-quartz ~TitaniQ!thermobarometer: A critical examination and re-calibration.Geochim Cosmochim Acta 84, 75–89.
Johannes, W. & Holtz, F. ~1996!. Petrogenesis and ExperimentalPetrology of Granitic Rocks. Berlin: Springer Verlag.
Kohn, M.J. & Northrup, C.J. ~2009!. Taking mylonites’ tempera-tures. Geology 37, 47–50.
Landtwing, M. & Pettke, T. ~2005!. Relationships between SEM-cathodoluminescence response and trace element compositionof hydrothermal vein quartz. Am Mineral 90, 122–131.
Larsen, R.B., Jacamon, F. & Krontz, A. ~2009!. Trace elementchemistry and textures of quartz during the magmatic-hydrothermal transition of Oslo Rift granites. Mineral Mag 73,691–707.
Leeman, W.P. ~1982!. Geology of the Magic Reservoir area, SnakeRiver Plain. Idaho Bur Mines Geol Bull 26, 369–376.
Leeman, W.P., Annen, C. & Dufek, J. ~2008!. Snake River Plain-Yellowstone silicic volcanism: Implications for magma genesisand magma fluxes. Geol Soc London Spec Publ 304, 235–259.
Leeman, W.P. & Lee, C.-T.A. ~2008!. Taking the temperature ofrhyolites from the Yellowstone hotspot track: Evaluation of theTi-in-Quartz method. Geochim Cosmochim Acta 72~12!, A906.
Lehmann, K., Berger, A., Gotte, T., Ramseyer, K. & Wieden-beck, M. ~2009!. Growth-related zonations in authigenic andhydrothermal quartz characterized by SIMS-, EPMA-, SEM-CL- and SEM-CC-imaging. Mineral Mag 73, 633–643.
Liu, Y., Anderson, A.T., Wilson, C.J.N., Davis, A.M. & Steele,I.M. ~2006!. Mixing and differentiation in the Oruanui rhyolite
Ti-CL Calibration 1339

magma, Taupo, New Zealand: Evidence from volatiles and traceelements in melt inclusions. Contrib Mineral Petrol 151, 71–87.
Longerich, H.P., Jackson, S.E. & Gunther, D. ~1996!. Laserablation inductively coupled plasma mass spectrometric tran-sient signal data acquisition and analyte concentration calcula-tion. J Anal At Spectrom 11, 899–904.
Luff, B.J. & Townsend, P.D. ~1990!. Cathodoluminescence ofsynthetic quartz. J Phys-Condens Mat 2, 8089–8097.
MacRae, C.M., Wilson, N.C. & Brugger, J. ~2008!. Hyperspec-tral cathodoluminescence microanalysis—Mapping at the partper million level. IUMAS IV Conference, Perth, Australia, Feb-ruary 10–15, 2008.
MacRae, C.M., Wilson, N.C. & Brugger, J. ~2009!. Quantitativecathodoluminescence mapping with application to a KalgoorlieScheelite. Microsc Microanal 15, 222–230.
MacRae, C.M., Wilson, N.C., Johnson, S.A., Phillips, P.L. &Otsuki, M. ~2005!. Hyperspectral mapping—Combiningcathodoluminescence and X-ray collection in an electron mi-croprobe. Microsc Res Techniq 67~5!, 271–277.
Marshall, D.J. ~1988!. Cathodoluminescence of Geological Materi-als. London: Unwin Hyman Ltd.
Mason, R.A. ~1987!. Ion microprobe analysis of trace elements incalcite with an application to the cathodoluminescence zona-tion of limestone cements from the Lower Carboniferous ofSouth-Wales, UK. Chem Geol 64, 209–224.
Mason, R., Clouter, M. & Goulding, R. ~2005!. The lumines-cence decay-time of Mn2� activated calcite. Phys Chem Mineral32, 451–459.
Matthews, N.E., Pyle, D.M., Smith, V.C., Wilson, C.J.N., Hu-ber, C. & Van Hinsberg, V. ~2012!. Quartz zoning and thepre-eruptive evolution of the ;340 ka Whakamaru magmasystems, New Zealand. Contrib Mineral Petrol 163, 87–107.
Monecke, T., Kempe, U. & Götze, J. ~2002!. Genetic significanceof the trace element content in metamorphic and hydrother-mal quartz: A reconnaissance study. Earth Planet Sci Lett 202,709–724.
Morrison, C.A., Lambert, D.D., Morrison, R.J.S., Ahlers, W.W.& Nicholls, I.A. ~1995!. Laser ablation-inductively coupledplasma-mass spectrometry: An investigation of elemental re-sponses and matrix effects in the analysis of geostandard mate-rials. Chem Geol 119, 13–29.
Müller, A., Herrington, R., Armstrong, R., Seltman, R., Kir-win, D., Stenina, N. & Kronz, A. ~2010!. Trace elements andcathodoluminescence of quartz in stockwork veins of Mongo-lian porphyry-style deposits. Mineral Depos 45, 707–727.
Müller, A., Kronz, A. & Breiter, K. ~2002!. Trace elements andgrowth patterns in quartz: A fingerprint of the evolution of thesubvolcanic Podlesí Granite System ~Krusnéhory Mts., CzechRepublic!. Bull Czech Geol Surv 77, 135–145.
Müller, A., René, M., Behr, H.-J. & Kronz, A. ~2003a!. Traceelements and cathodoluminescence of igneous quartz in topazgranites from the Hub Stock ~Slavkovsky Les Mts., CzechRepublic!. Mineral Petrol 79, 167–191.
Müller, A., van den Kerkhof, A.M., Behr, H.-J., Kronz, A. &Koch-Müller, M. ~2009!. The evolution of late-Hercyniangranites and rhyolites documented by quartz—A review. EarthEnv Sci T R Soc 100~Special issue 1–2!, 185–204.
Müller, A., Wiedenbeck, M., Van den Kerkhof, A.M., Kronz,A. & Simon, K. ~2003b!. Trace elements in quartz: A combinedelectron microprobe, secondary ion mass spectrometry, laserablation ICPMS, and cathodoluminescence study. Eur J Mineral15, 747–763.
Peppard, B.T., Steele, I.M., Davis, A.M., Wallace, P.J. & Ander-son, A.T. ~2001!. Zoned quartz phenocrysts from the rhyoliticbishop tuff. Am Mineral 86, 1034–1052.
Perkins, M.B. & Nash, B.P. ~2002!. Explosive silicic volcanism ofthe Yellowstone hotspot: The ash fall tuff record. Geol Soc AmBull 114, 367–381.
Perny, B., Eberhardt, P., Ramseyer, K., Mullis, J. & Pankrath,R. ~1992!. Microdistribution of Al, Li, and Na in quartz: Possi-ble causes and correlation with short-lived cathodolumines-cence. Am Mineral 77, 534–544.
Remond, G., Phillips, M.R. & Roque-Carmes, C. ~2000!. Impor-tance of instrumental and experimental factors on the interpre-tation of cathodoluminescence data from wide band gapmaterials. In Cathodoluminescence in Geosciences, Pagel, M.,Barbin, V., Blanc, P. & Ohnenstetter, D. ~Eds.!, pp. 59–126.Heidelberg: Springer Verlag.
Rusk, B.G., Koenig, A. & Lowers, H. ~2011!. Visualizing traceelement distribution in quartz using cathodoluminescence, elec-tron microprobe, and laser ablation-inductively coupled plasma-mass spectrometry. Am Mineral 96, 703–708.
Rusk, B.G., Lowers, H.A. & Reed, M.H. ~2008!. Trace elements inhydrothermal quartz: Relationships to cathodoluminescent tex-tures and insights into vein formation. Geology 36, 547–550.
Rusk, B.G., Reed, M.H., Dilles, J.H. & Kent, A.J.R. ~2006!.Intensity of quartz cathodoluminescence and trace elementcontent in quartz from the porphyry copper deposit at Butte,Montana. Am Mineral 91, 1300–1312.
Sato, K. & Santosh, M. ~2007!. Titanium in quartz as a record ofultrahigh-temperature metamorphism: The granulites of Ku-rur, southern India. Mineral Mag 71, 143–154.
Shane, P., Smith, V.C. & Nairn, I. ~2008!. Millennial timescaleresolution of rhyolite magma recharge at Tarawera volcano:Insights from quartz chemistry and melt inclusions. ContribMineral Petrol 156, 397–411.
Smith, R.B., Jordan, M., Steinberger, B., Puskas, C.M., Far-rell, J., Waite, G.P., Husen, S., Chang, W.L. & O’Connell,R.O. ~2009!. Geodynamics of the Yellowstone Hotspot andMantle plume: Seismic and GPS imaging, kinematics, andmantle flow. J Volcanol Geotherm Res 188, 26–56.
Spear, F.S. & Wark, D.A. ~2009!. Cathodoluminescence imagingand titanium thermometry metamorphic quartz. J MetamorphGeol 27, 187–205.
Stevens-Kalceff, M.A. ~2009!. Cathodoluminescence micro-characterization of point defects in a-quartz. Mineral Mag 73,585–605.
Stevens-Kalceff, M.A. & Phillips, M.R. ~1995!. Cathodolumi-nescence micro-characterization of the defect structure of quartz.Phys Rev B 52, 3122–3134.
Storm, L.C. & Spear, F.S. ~2009!. Application of the titanium-in-quartz thermometer to pelitic migmatites from the AdirondackHighlands, New York. J Metamorph Geol 27, 479–494.
Student, J.J., Wark, D.A., Mutchler, S.R. & Bodnar, R.J. ~2006!.Pristine rhyolite glass melt inclusions in quartz phenocrystsfrom the 1.1 Ga midcontinent rift system, Keweenaw Penin-sula, Michigan. Eos, Trans Am Geophys Union 87, Fall MeetingSuppl., Abstract V23C-0619.
Student, J.J., Wark, D.A., Mutchler, S.R. & Bodnar, R.J. ~2007!.Thermal evolution of Proterozoic ~.1 Ga! rhyolite magmabased on analysis of melt inclusions and trace elements inquartz from the Keweenaw Peninsula of Michigan. Institute onLake Superior Geology 53rd Annual Meeting, Proceedings andAbstracts, 53~P1!, 77–78.
1340 William P. Leeman et al.

Suttner, L.J. & Leininger, R.K. ~1972!. Comparison of traceelement content of plutonic, volcanic and metamorphic quartzfrom southwestern Montana. Bull Geol Soc Am 83, 1855–1862.
Thomas, J.B. & Watson, E.B. ~2012!. Application of the Ti-inquartz thermobarometer to rutile-free systems. Reply to: Acomment on: “TitaniQ under pressure: The effect of pressureand temperature on the solubility of Ti in quartz” by Thomaset al. Contrib Mineral Petrol 164, 369–374.
Thomas, J.B., Watson, E.B., Spear, F.S., Shemella, P.T., Nayak,S.K. & Lanzirotti, A. ~2010!. TitaniQ under pressure: Theeffect of pressure and temperature on the solubility of Ti inquartz. Contrib Mineral Petrol 160, 743–759.
Ulrich, T., Kamber, B., Jugo, P. & Tinkham, D. ~2009!. Imagingelement distribution patterns in minerals by laser ablation-inductively coupled plasma mass spectrometry ~LA-ICP-MS!.Can Mineral 47, 1001–1012.
Vasyukova, O.V., Goemann, K., MacRae, C.M., Wilson, N.C. &Kamenetsky, V.S. ~2013!. Cathodoluminescence properties ofquartz eyes from porphyry-type deposits: Implication to theirorigin. Am Mineral doi.org/10.2138/am.2013.4018.
Vazquez, J., Kyriazis, F., Reid, M.R., Sehler, R.C. & Ramos, F.C.~2009!. Thermochemical evolution of young rhyolites at Yellow-stone: Evidence for a cooling but periodically replenished post-caldera magma reservoir. J Volcanol Geotherm Res 188, 186–196.
Wark, D.A., Hildreth, W., Spear, F.S., Cherniak, D.J. & Wat-son, E.B. ~2007!. Pre-eruption recharge of the bishop magmasystem. Geology 35, 235–238.
Wark, D.A. & Watson, E.B. ~2006!. The TitaniQ: A titanium-in-quartz geothermometer. Contrib Mineral Petrol 152, 743–754.
Watson, E.B. & Harrison, T.M. ~1983!. Zircon saturation revis-ited: Temperature and composition effects in a variety of crustalmagma types. Earth Planet Sci Lett 64, 295–304.
Watt, G.R., Wright, P., Galloway, S. & McLean, C. ~1997!.Cathodoluminescence and trace element zoning in quartzphenocrysts and xenocrysts. Geochim Cosmochim Acta 61,4337–4348.
Watts, K.E., Bindeman, I.N. & Schmitt, A.K. ~2012!. Crystalscale anatomy of a dying supervolcano: An isotope and geo-chronology study of individual phenocrysts from voluminousrhyolites of the Yellowstone caldera. Contrib Mineral Petrol 164,45–67.
Wiebe, R.A., Wark, D.A. & Hawkins, D.P. ~2007!. Insights fromquartz cathodoluminescence zoning into crystallization of theVinalhaven granite, coastal Maine. Contrib Mineral Petrol 154,439–453.
Wilson, C.J.N., Seward, T.M., Allan, A.S.R., Charlier, B.L.A. &Bello, L. ~2012!. A comment on: “TitaniQ under pressure: Theeffect of pressure and temperature on the solubility of Ti inquartz” by Jay B. Thomas, E. Bruce Watson, Frank S. Spear,Phillip T. Shemella, Saroj K. Nayak and Antonio Lanzirotti.Contrib Mineral Petrol 164, 359–368.
Ti-CL Calibration 1341