Embed Size (px)
Citation preview

10/22/2010
1
Does the Does the Passenger Train Passenger Train have a Future? have a Future?
DAVID DAVID BURNSBURNSRAILROAD RAILROAD INDUSTRIAL INDUSTRIAL ENGINEERING ENGINEERING CONSULTANTCONSULTANTCHICAGOCHICAGO, USA, USA

10/22/2010
2
The Answer!The Answer!The Answer!The Answer! YES NO MAYBE
It depends on where it is
2

10/22/2010
3
Types of Passenger Trains People want to travel for work and pleasure It started with the horse Then came the bicycle, Motor cycle, Car
Somewhere in this transition are the Urban commuter metro and LRV trains Urban, commuter, metro, and LRV trains Regional train Intercity and perhaps high speed trainsIntercity and, perhaps, high speed trains
3

10/22/2010
4
Travel is Proportional to IncomeTravel is Proportional to Income
Comparison of US Miles per Capita and GDP per Capita
35000 45000
25000
30000
35000
pita
30000350004000045000
pita
10000
15000
20000
les
per
Cap
15000200002500030000
DP p
er C
ap
WW II
0
5000
10000Mil
05000100005000
GD
1920 1940 1960 1980 2000 2020
Miles per Capita per Year GDP per Capita4

10/22/2010
5
As Income Increases, Mode ChangesAs Income Increases, Mode ChangesUS km per Capita by ModeUS km per Capita, by Mode
35000
20000
25000
30000
er C
apita
10000
15000
20000
nnua
l Km
pe
0
5000
1900 1910 1920 1930 1940 1950 1960 1970 1980 1990 2000
An
Car Rail Transit Air
5

10/22/2010
6
Cars are inevitableCars are inevitable
6

10/22/2010
7
Vehicles per 1000 population & IncomeVehicles per 1000 population & Income60000900
40000
50000
60000
600
700
800
900
ncom
e (PPP
)
pulation
20000
30000
40000
300
400
500
600
Per Ca
pita I
cles /10
00 Pop
0
10000
0
100
200
Vehic
C T k t P C it I
2005 data2005 data
Cars Trucks, etc Per Capita Income
7
10/22/2010
8
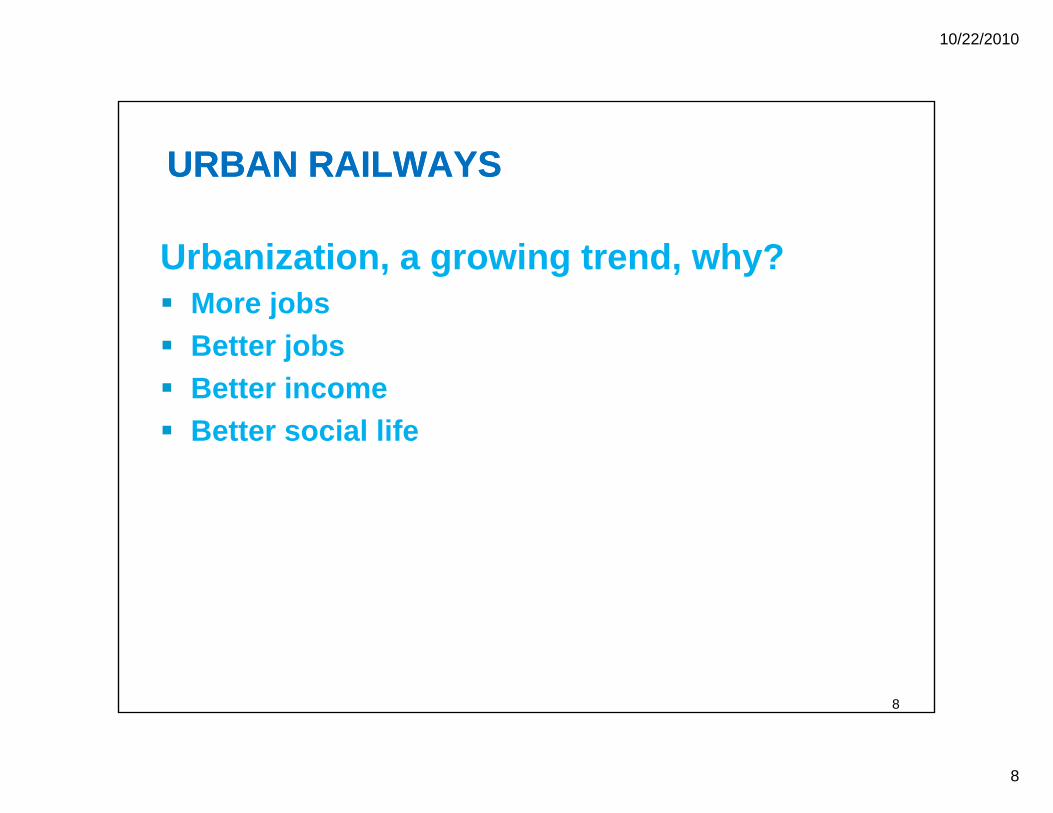
URBAN RAILWAYSURBAN RAILWAYS
Urbanization, a growing trend, why? More jobs More jobs Better jobs Better income Better social life
8

10/22/2010
9
The Urban Travelers' ChoiceThe Urban Travelers' Choice
Which mode would you choose?Which mode would you choose?
THE NANO
9

10/22/2010
10
Almost everybody will choose to own a car Almost everybody will choose to own a car which increases congestionwhich increases congestiongg
Which Which Increases Increases
pollutionpollution Increases lost Increases lost
timetimetimetime Increases the Increases the
need for need for constructionconstructionconstructionconstruction
Lowers Lowers property valuesproperty valuesEtcEtc Etc.Etc.
10

10/22/2010
11
As Income and City Population Increase, Rail Mass Transit Becomes a NecessityRail Mass Transit Becomes a Necessity
10
12
n)
6
8
10
tion
(mill
ion
0
2
4
Popu
lat
Wh d it d t t t b
$0 $5,000 $10,000 $15,000 $20,000 $25,000 $30,000 $35,000
Per Capita Income (PPP)
When does a city need to construct urban railways?
11

10/22/2010
12
So the City is Forced to Build an Urban So the City is Forced to Build an Urban RailwayRailwayRailwayRailway
There are basically 3 types: Light Rail Vehicles (LRV) or maybe Bus Rapid Transit
Stations every 500 m Route length 12 to 15 km Metro RailMetro Rail
Stations 1.5 to 4 km Route length 15 to 30 km Commuter Rail
Stations 4 to 10 km Route length 25 to 80 km
All are expensive! Except BRT
12

10/22/2010
13
Cost of Urban Rail Cost of Urban Rail –– very expensivevery expensive
Beijing - $75 million per km Delhi - above ground, $24 million per km Delhi – underground $56 million per km Delhi – underground, $56 million per km Bangkok - above ground, $55 million per km
London - $75 to $360 million per km Los Angeles - $100 to $200 million per km
However, Bus Rapid Transit (However, Bus Rapid Transit (BRTBRT) is as low as $10 ) is as low as $10 million per kmmillion per kmmillion per kmmillion per km
13
10/22/2010
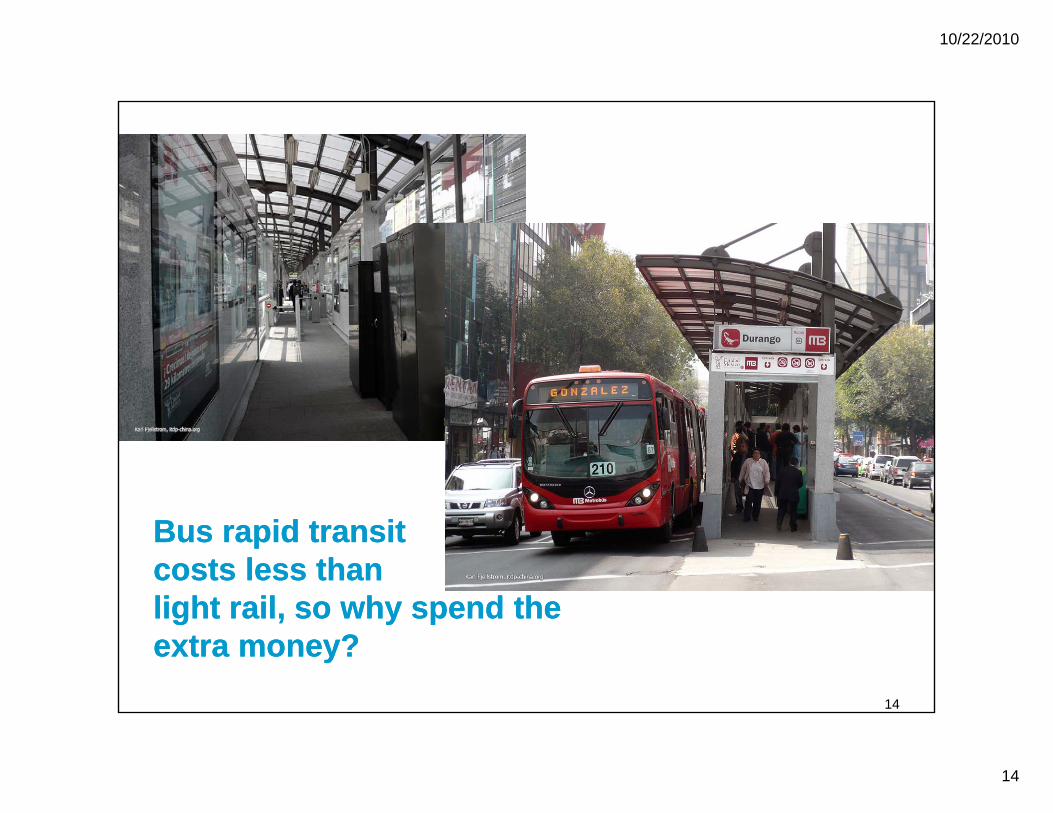
14
Bus rapid transit Bus rapid transit costs less than costs less than light rail so why spend thelight rail so why spend thelight rail, so why spend the light rail, so why spend the extra money?extra money?
14

10/22/2010
15
People want to ride the trains? BUTPeople want to ride the trains? BUT
Given the choice, most people want to ride in their i diti d ith th i b k down air conditioned cars with their own background
music
Commuting by public transit (rail & bus) Dallas: 4.5%, New York: 20%, Paris: 24%, Tokyo: 57%, Osaka: 60%, Singapore: 65%Tokyo: 57%, Osaka: 60%, Singapore: 65% Why the difference?
15

10/22/2010
16
When a City’s Population is 35 million, this When a City’s Population is 35 million, this what is needed what is needed -- Tokyo Tokyo
16

10/22/2010
17
The System will Require a Large Subsidy The System will Require a Large Subsidy if Ridership looks Like Thisif Ridership looks Like Thisif Ridership looks Like Thisif Ridership looks Like This
0 1 2 3 4 5 6 7 8 9 10 11 12 13 14 15 16 17 18 19 20 21 22 23 24
One North American Railway needs 180 coaches for peak hours, and no more than 18 coaches the rest of the day
17
10/22/2010
18
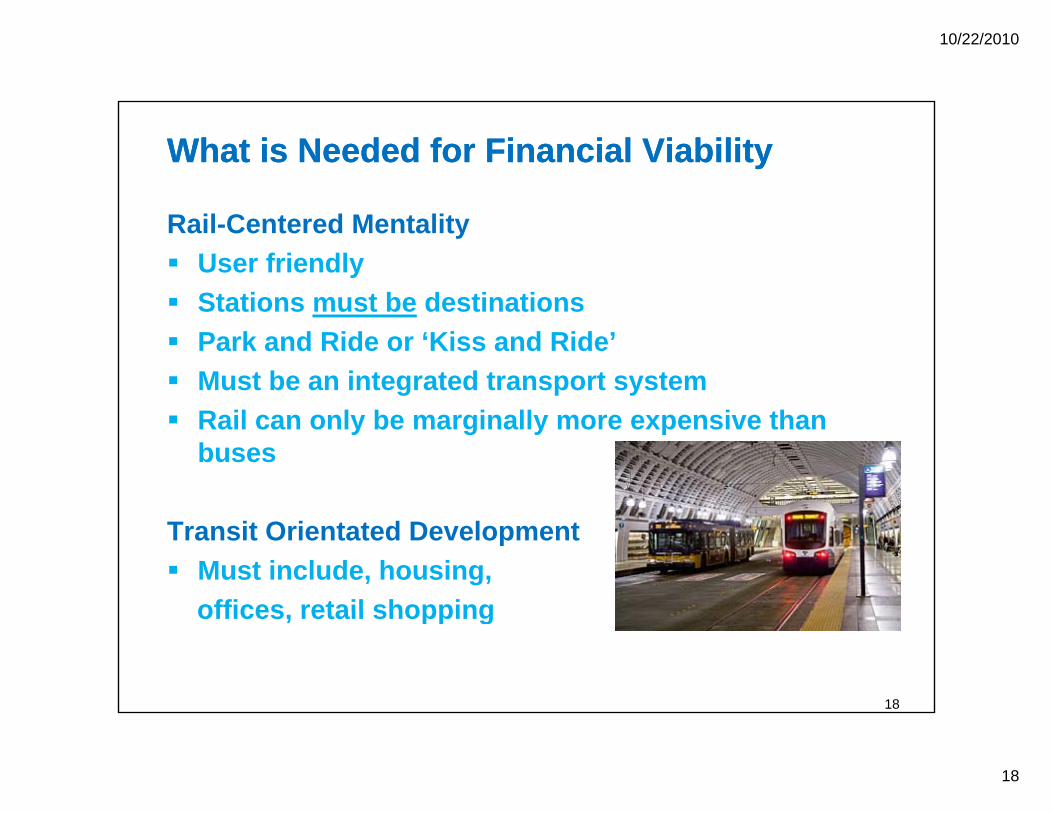
What is Needed for Financial ViabilityWhat is Needed for Financial Viability
Rail-Centered Mentality User friendly Stations must be destinations Stations must be destinations Park and Ride or ‘Kiss and Ride’ Must be an integrated transport system Rail can only be marginally more expensive than
buses
Transit Orientated Development Must include, housing,
offices retail shoppingoffices, retail shopping
18

10/22/2010
19
Example of User Friendly Example of User Friendly –– Berlin Main Berlin Main StationStationStationStation
Intercity, regional, and urban y, g ,trains in one station Trains on 3 levels with lifts and escalators to the middle of the platforms Shops, restaurants, parking for 800 cars, bus connections Indoor connection to offices
Note: Note: German population density 25% German population density 25% that of Bangladeshthat of Bangladesh
19

10/22/2010
20
Housing Development Played a Major Role in Housing Development Played a Major Role in Building MetrosBuilding MetrosBuilding MetrosBuilding Metros
Note: Information for houses can be obtained at stationNote: Information for houses can be obtained at station20

10/22/2010
21
Property and Urban Railways Development Property and Urban Railways Development Must be CoordinatedMust be Coordinated
A tt t t di t dAn attempt at coordinated property development and urban railUnfortunately rail and property
Offices Unfortunately, rail and property are being developed separately
Station21

10/22/2010
22
Japan’s Railways Japan’s Railways -- successful successful
Urban Transport 26%26%
Real Estate 20% Entertainment
andand Communications 12%
Travel 13% Travel 13% Hotels 9% Retail 16%
Hanshin-Department-Umeda-Store owned by Hanshin Electric Railway Adjacent to an Osaka Station
22
10/22/2010
23
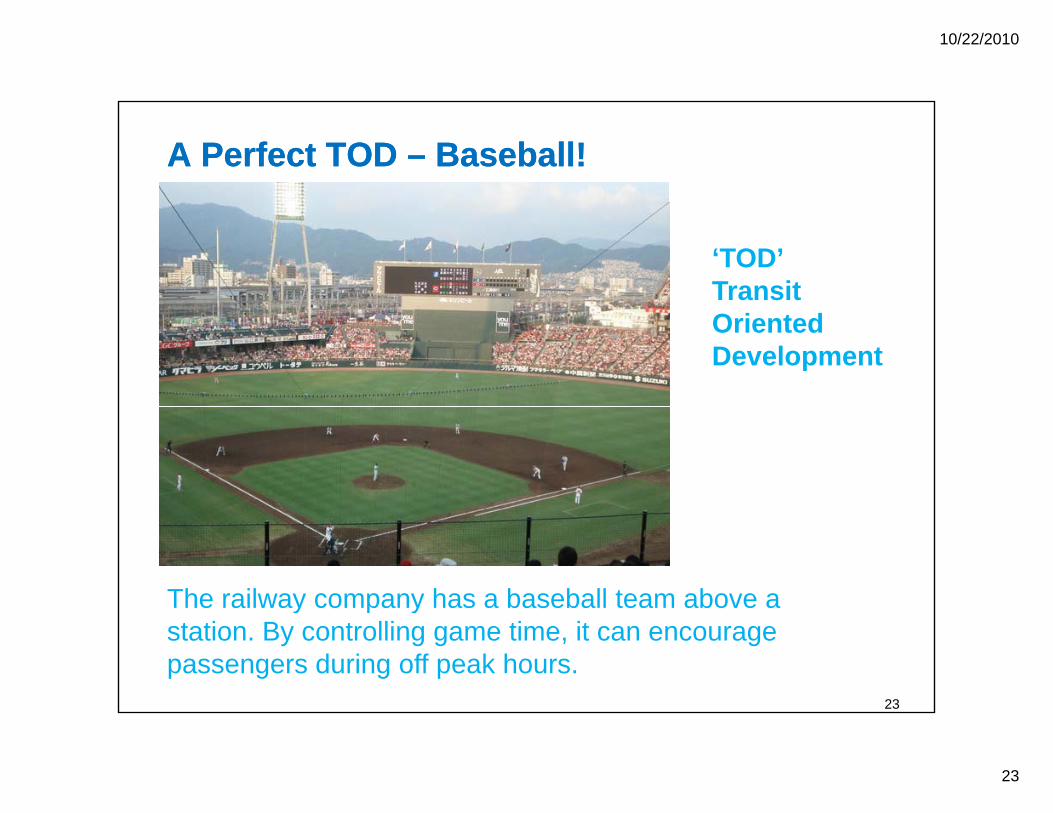
A Perfect A Perfect TODTOD –– Baseball!Baseball!
‘TOD’Transit Oriented Development
The railway company has a baseball team above a y p ystation. By controlling game time, it can encourage passengers during off peak hours.
23

10/22/2010
24
Hong Kong Hong Kong –– does it does it rightright Typical Cash Flow IncomeTypical Cash Flow Incomerightright Typical Cash Flow IncomeTypical Cash Flow Income
Property Development 48%Property Development 48% Property Management 10%Property Management 10% Station Businesses 11%Station Businesses 11% Station Businesses 11%Station Businesses 11% Railway 31%Railway 31%
Storage yard and workshop24

10/22/2010
25
Restrictions on cars Restrictions on cars –– a musta mustGovernment restrictions on ownership
Parking Restrictions on car ownership, Japan, Singapore, Hong Kong
A l i ti Annual inspection
Pricing constraint on usage Fuel taxFuel tax Toll ways Congestion Charging
25

10/22/2010
26
Subsidy is Required unless using the Subsidy is Required unless using the ‘Japanese’ approach‘Japanese’ approachJapanese approachJapanese approach
Some urban railways cover as little as 28% of the operating costsoperating costs
Almost none cover construction cost Almost all dedicated urban railways require
substantial subsidy taxes?substantial subsidy – taxes?
130149
Percentage coverage of
28 32 43 44 4466 70 70
Percentage coverage of operating costs
26

10/22/2010
27
Urban Railways ConclusionUrban Railways Conclusion
Urban railways are a necessity for cities where size and income that road traffic causes congestion
Urban railways MUST be actively involved in urbanUrban railways MUST be actively involved in urban planning - NOT the reverse
Governments should ‘encourage’ property developers to build urban railwaysdevelopers to build urban railways
Proactive approach is essential National and, especially, city governments must
actively discourage automobile ownership and useactively discourage automobile ownership and use
98% of commuters want rail mass transit for the other person to ride! A quote from the ‘The Onion’
27

10/22/2010
28
FinallyFinally
Urban Rail Urban Rail -- You build for your You build for your d hild bd hild bgrandchildren because you grandchildren because you
probably cannot justify building probably cannot justify building it today it today
But, if you wait for tomorrow, you will be able But, if you wait for tomorrow, you will be able to afford to build it even less then today!to afford to build it even less then today!
28

10/22/2010
29
Regional and InterRegional and Inter--City TrainsCity Trains No regional and intercity trains cover their fully
allocated costs Almost all passenger service require annualAlmost all passenger service require annual
subsidies In high income countries, rail national market share
less than 10%, except Japanless than 10%, except Japan On corridors rail seldom has more than 30% market
share
So is there a future?
29

10/22/2010
30
US Travel by Intercity RailUS Travel by Intercity Rail
70%80%90%
30%40%50%60%
WW II
New coaches
0%10%20%30% WW II
Expressway construction begins
Source: AAR and Eno Foundation
Travel increases BUT NOT BY TRAIN!!!!!
1910 1930 1950 1970 1990 2010g
Travel increases BUT NOT BY TRAIN!!!!!
30

10/22/2010
31
National Rail Market SharesNational Rail Market Shares France 9% German 8% Britain 6% USA 0.2% Brazil 0.1%?
Switzerland 12% Japan 30%
What does this tell you? Switzerland gives a clue, but Japan appears to have the answer
31

10/22/2010
32
Wh The Japanese Use the Train, Why?The Japanese Use the Train, Why? Must have off street parking to own a car Annual car inspection $1000 Gasoline $5.66 per gallon High speed train every 15 minutes There is a ‘Railway Mentality’ Excellent public urban transportation
Train fare Tokyo Osaka $130 Plane fare Tokyo Osaka $146 180.00
200.00Short Term Driving Costs
Plane fare Tokyo Osaka $146 Highway toll Tokyo Osaka $130
20 0040.0060.0080.00
100.00120.00140.00160.00
However discount airlines are causing market share to decline
32
0.0020.00
Paris Lyon Tokyo Osaka
Madrid Barcelona
Chicago St Louis
Highway Toll Gas Cost

10/22/2010
33
So Why Take a Regional or Intercity So Why Take a Regional or Intercity T i ?T i ?Train?Train?
A id th ti Avoid the congestion Ticket price cheaper than plane ticket Convenience Save time Able to work en-route The service and food is better? The service and food is better? Better for the environment
33

10/22/2010
34
Intercity car travel congestion Intercity car travel congestion usually not a problemusually not a problem
34

10/22/2010
35
Typical Price Comparison90
Typical Range of costs/prices for about 500 Typical Range of costs/prices for about 500 km of travelkm of travel
90
80
70
60
50
per p
erso
n
40
30
US
$ p
20
10
0Trains are seldom the
0 cheapest way to travel
35

10/22/2010
36
Buses can offer more frequent serviceBuses can offer more frequent service
=
Capital costs are about the same!
36

10/22/2010
37
On Price and Frequency the Bus is On Price and Frequency the Bus is Strong CompetitionStrong Competition
In the USA an intercity ybus ticket can be as low as $1
In Sweden the bus isIn Sweden the bus is 35% the price of the train
And both offer service from outside the train station!And both offer service from outside the train station!37

10/22/2010
38
ConvenienceConveniencePl CI t it T i Plane House walk to bus Wait Bus to train
Car House to car Drive Congestion delay?
Intercity Train House walk to bus Wait Bus to train Bus to train
Wait Train to Airport Check in
Congestion delay? Car to House
Bus to train Wait Intercity Train Wait Check in
Wait Fly Wait for luggage Which isWhich is
Wait Train to bus Wait Bus Wait for luggage
Wait Train to bus Wait
Which is Which is more more convenient?convenient?
Bus Walk to house
Bus Walk to house
convenient?convenient?
38

10/22/2010
39
Work on Train? But how much more Work on Train? But how much more would you pay?would you pay?would you pay?would you pay?
Businessmen are usuallyBusinessmen are usually prepared to pay a premium ticket price
$60 h l f ti $60 per hour value of time saved (according to UK MoT) Businessmen may pay $60 per hour more y p y p But even if they did, typically only 30% of passengers
are businessmen
39

10/22/2010
40
Impact of Frequency7
Train Speed is not that ImportantTrain Speed is not that Important
4
5
6
Ho
1
2
3urs
0200 250 300 350 400 450 500
Distance km Car 150 km/hr 200 km/hr 250 km/hr 300 km/hr Plane
• Up to 200 km car requires least time• 300 km less than 1 hour time difference between modes• 400 km only at 300 km/hr saves 1.5 hours
Waiting an extra hour for the train, a journey up to 300 km quicker by car
• If you have to wait an hour for the train, up to 400 km car can be just as fast
40

10/22/2010
41
Frequency Needs PassengersFrequency Needs PassengersFrequency Needs PassengersFrequency Needs Passengers
To justify frequency, you need population In a developed country, the average person makes
about only 5 long distance trips a year If 10% are by rail, for hourly service, population
centers of 4 to 8 million are required to fill the trains If a higher percent choose train, reduces population
centers, but how? If 30% are by rail, for hourly service population
centers of 1.5 to 2.5 million are required
41

10/22/2010
42
The Regional TrainThe Regional Train
An extension of the urban commuter railway Primarily for longer distance commuting As opposed to subsidized by city it should be As opposed to subsidized by city, it should be
subsidized by regional government to promote development of its region
Does not need to go fast max speed 150fast, max. speed 150 km/hr
42

10/22/2010
43
Is High Speed Rail the Answer?Is High Speed Rail the Answer?g pg p
High speed rail corridors may have 85% of train and l t ffiplane passenger traffic
But will seldom have more than 30% if cars and busses are included, except in Japan
Washington to New York corridor is only about 8% of market share which, compared to the national average of 0.2%, is very good!
43
10/22/2010
44
Passenger Trains Generate Economic Passenger Trains Generate Economic Benefits Benefits ‘Environmentally Friendly’ with a Lower ‘carbon foot
print’ Reduces need for roads Safer than road Less pollutionp Could be operated with electricity
Will the traveler choose the train because it is Will the traveler choose the train because it is ‘Environmentally friendly’? - Maybe a few will
But, who will pay the railway for the economic benefits? The private health insurance companies!?!
44

10/22/2010
45
Is Concessioning or PPP the Answer?Is Concessioning or PPP the Answer?gg
Privately operated railways tend to be more efficient but they need sufficient revenueefficient, but they need sufficient revenue
Private companies are unlikely to invest heavily in an existing passenger railwayM f t d i f t t t t ill Manufacturers and infrastructure contractors will build a new system. Without a generous subsidy, they will seldom operate the system for more than the warranty timethe warranty time
45

10/22/2010
46
ConclusionsConclusions
Regional and Intercity Trains have a Transport Role but: Can only be justified where the population size
requires frequent servicerequires frequent service For success there has to be a ‘Rail Mentality’ People prefer to ride a train and not a bus, but the bus
is cheaper and usually more frequentis cheaper and usually more frequent Legislation against cars is almost a necessity for
financial viabilityA ll t b t t t i it An excellent urban transport system is a necessity
46

10/22/2010
47
Conclusions ContinuedConclusions Continued
Revenue from property management and development around stations is a necessity
Must have consistent source of subsidyMust have consistent source of subsidy Regional railways should be subsidized by the
region in which they operate On most routes high speed is less important than On most routes, high speed is less important than
frequency
With all this, maybe regional and intercity passenger trains make economic sense
47

10/22/2010
48
“It does not matter how fast It does not matter how fast the intercity trains are sothe intercity trains are sothe intercity trains are so the intercity trains are so long as they are frequent, on long as they are frequent, on ti d LOOK th hti d LOOK th htime, and LOOK as though time, and LOOK as though they go fast!” they go fast!” Quote of a United States State Governor
48