Embed Size (px)
Citation preview

This is an Open Access document downloaded from ORCA, Cardiff University's institutional
repository: http://orca.cf.ac.uk/63875/
This is the author’s version of a work that was submitted to / accepted for publication.
Citation for final published version:
Adcock, Christopher, Hua, Xiuping, Mazouz, Khelifa and Yin, Shuxing 2014. Does the stock
market reward innovation? European stock index reaction to negative news during the global
financial crisis. Journal of International Money and Finance 49 (B) , pp. 470-491.
10.1016/j.jimonfin.2014.06.004 file
Publishers page: http://dx.doi.org/10.1016/j.jimonfin.2014.06.004
<http://dx.doi.org/10.1016/j.jimonfin.2014.06.004>
Please note:
Changes made as a result of publishing processes such as copy-editing, formatting and page
numbers may not be reflected in this version. For the definitive version of this publication, please
refer to the published source. You are advised to consult the publisher’s version if you wish to cite
this paper.
This version is being made available in accordance with publisher policies. See
http://orca.cf.ac.uk/policies.html for usage policies. Copyright and moral rights for publications
made available in ORCA are retained by the copyright holders.
0
Does the Stock Market Reward Innovation? European Stock Index Reaction to Negative News during the Global Financial Crisis
by
Christopher Adcock(1), Xiuping Hua(2), Khelifa Mazouz(3) and Shuxing Yin(1) (1) Sheffield University Management School, Sheffield, UK; (2) University of Nottingham, Ningbo, China;
(3) Cardiff University, Cardiff, UK
Abstract
This study uses data on 27 European stock indices over the period from January 2007 to December 2012 to investigate the relationship between innovations and the market reaction to negative news during the financial crisis. We use the bivariate BEKK-GARCH approach to estimate time-varying betas and abnormal returns. We show that index prices of countries in the high (low) innovation groups experience significantly positive (negative) abnormal returns on and following the negative news announcement dates. We also find that index beta changes following the arrival of bad news is negatively associated with a country’s innovativeness. This finding suggests that innovations promote economic stability and enhance investors’ confidence in a country’s ability to cope during difficult times. Thus, policy makers who are concerned with sustainable growth should encourage R&D investments by adopting effective policies and avoid unnecessary cuts in R&D expenditures even during times of crisis. A study of the pre-crisis period from January 2001 to December 2006, using the same methods, indicates that investors value innovation more during difficult times. JEL classification: G1; O2; O3 Keywords: Innovation; R&D investments; Stock price reaction; Time-varying betas. Corresponding Author: Shuxing Yin Sheffield University Management School Conduit Road Sheffield, S10 1FL United Kingdom Email: [email protected]
1
1. Introduction
A recent OECD (2009) report suggests that the recession, which began with the financial
crisis of 2007, has impacted research and development (R&D) in OECD countries. In the
fourth quarter of 2008, a decline in R&D expenditure, or at best slower growth, was apparent.
Moreover, R&D expenditure declined by a record 4.5% in 2009 across the OECD, with falls
in all major OECD countries except South Korea and France. However, as is shown in this
paper, the performance of stock markets in OECD countries during the crisis period has
exhibited heterogeneity. The study reported in this paper sheds light on the role of innovation
in building investor confidence and in stimulating economic recovery. The argument that
motivates this work is that if innovation improves profitability and reduces investment costs,
it should also increase investors’ confidence in a country’s ability to withstand the effect of
difficult economic conditions. More specifically, if investors’ confidence increases with
innovation, the stock markets of innovation-intensive countries would be less adversely
affected by negative news about the global economy. We investigate this issue by examining
the reaction of European stock market indices to the arrival of major negative news during
the recent global financial crisis. We choose to focus our analysis on European markets for
several reasons. First, Europe is a significant player in the global economy, with the GDP of
the euro-zone area ($13 trillion) being almost equal to that of the US ($15 trillion). Secondly,
whilst the financial crisis started in the US, its impact was greater and it lasted longer in
Europe (Weisbrot, 2014). Thirdly, the European sovereign debt crisis had a significant effect
on investors’ confidence and was blamed for the slow recovery in the US and the global
economy. Finally, the considerable variations in European countries’ commitments to
innovations and the fact that these countries are not affected in the same way by the financial
crisis make Europe a perfect environment to study the link between innovation and a county’s
ability to cope during difficult times.
This paper is motivated both by theoretical literature and empirical evidence at firm
and country level. Chen and Zhang (2009) develop a model in which firms with higher
expected profitability and lower investment costs provide higher expected returns. To test
whether the market rewards innovation, existing empirical studies focus almost exclusively
on the impact of R&D investments and patents on firm value (see for example Griliches,
1981; Jaffe, 1986; Hall et al, 2005), the short-term stock price reaction to R&D
announcements (for example Chan et al, 1990; Saad and Zantout, 2009) and the long-term

2
stock returns associated with past R&D investment (for example Chan et al, 2001; Eberhart
et al, 2004). However, the results of these studies are far from conclusive. For example, Chan
et al (2001) find firms with higher R&D investment experience no better long-term risk-
adjusted excess returns than the rest of their sample firms. However, Porter (1992), Hall
(1993) and Hall and Hall (1993) show that investors fail to foresee the rewards from long-
term R&D investments and thus undervalue R&D-intensive stocks. Eberhart et al (2004)
show that firms exhibit significant positive risk-adjusted excess returns for the five-year
period following R&D expenditure increases. They interpret it as an evidence of investors’
under reaction to the benefit of R&D increases.
While several studies show that innovations stimulate economic growth (Aghion and
Howitt, 1998; Grossman and Helpman, 1991; Solow, 1956) and promote nations’ competitive
advantage (Porter, 1998), evidence on the relationship between innovations and aggregate
stock market returns is relatively scarce. Hsu (2009) argues that if innovation raises the
expected productivity and profitability of the representative firm, it should also improve the
overall efficiency and reduce investment costs at the aggregate level. Consistent with this
prediction, Hsu finds that innovations have positive and distinct predictive power for U.S.
and other countries market returns and premiums. The study in this paper also uses country
level data to investigate the relationship between innovation and market returns and
premiums. However, unlike Hsu (2009), who attempts to explain the time series of market
returns using innovation shocks, we investigate the behaviour of market returns and betas
following the arrival of negative news about the global economy. This leads to new insights
about the relationship between innovation and investor confidence in a country’s ability to
cope during difficult economic climates. We argue that the productivity and efficiency
benefits associated with innovations are likely to be even more crucial during crisis periods,
particularly as customers switch to lower-priced products/services providers in order to
reduce their expenditure.
This argument suggests that firms and economies with continued investments in
innovations are more likely to survive the recession and position themselves well for the
recovery periods, whereas others may be forced to cut their R&D expenditure to ensure short-
term survival at the expense of the long-term performance (see, for example, Smallbone et al,
1999). Thus, if innovations help firms to respond properly in times of trouble, investors might
3
be less worried about losing their wealth in times of trouble and may therefore react less
adversely, or even positively, to the arrival of negative news about the global economy.
To investigate this issue, we estimate abnormal returns and time-varying betas for 27
European country indices around informed negative shocks. These which are defined as the
World index returns in the lowest 5th percentile that can be matched with the timelines of the
crisis released by the BBC, European Central Bank (ECB), Federal Reserve Bank of St Louis
and The Guardian1 newspaper. We argue that if innovations enhance investors’ confidence,
one would expect a positive association between innovation measures and event day
abnormal returns, as recessions may have less adverse effect on the competitiveness and
profitability of firms in innovation-intensive economies. We also examine the effect of
innovation on the co-movement of local stock market indices and the World index during
crisis periods. As above, it can be argued that the stability of economies with continuous
investments innovations is less likely to be threatened by recession, as firms in these markets
are better equipped to cope with the challenges imposed by global economic downturns. Thus,
negative news about the global economy should have less impact on the time varying betas,
which are a measure of stability and riskiness, of stock markets of highly innovative countries.
Taking into account different levels of innovation, we provide a direct comparison for
27 European markets. The innovation measures are based on government budget
appropriations or outlays on research and development as a percentage of GDP, the actual
R&D expenditures as a percentage of GDP, the ratio of knowledge based researchers to total
employment and the number of patent applications per million inhabitants. The 27 countries
are split into high (30%), medium (40%) and low (30%) innovation groups. Consistent with
the investor confidence view, we show that countries with higher innovation measures
experience much smaller negative stock price reactions to negative news events. The results
also suggest that abnormal returns around days of informed negative shocks are positively
related to the cross-country variation in innovation variables. The results are robust to
different measures of innovation and after controlling for the effects of other economic
1 See the following links for further details: http://www.ecb.int/ecb/html/crisis.en.html, http://www.guardian.co.uk/business/2012/aug/07/credit-crunch-boom-bust-timeline, http://timeline.stlouisfed.org/index.cfm?p=timeline, and http://www.bbc.co.uk/news/business-13856580

4
variables. We also show that changes in stock market index betas tend to exhibit a negative
association with a country’s innovativeness. This relationship is particularly pronounced
when government support to R&D activities is used to measure innovation. We attribute the
observed decline in the co-movement between innovation-intensive stock indices with the
World index to the superior performance of highly innovative firms during global downturns.
To investigate whether these findings are unique to the crisis period, the analysis is
also carried out for the period January 2001 to December 2006. We find that the positive
reaction of innovation-intensive country indices to the arrival of negative news is unique to
the times of crisis. This finding indicates that investors value innovation more during difficult
times.
The paper is organized as follows. Section 2 provides a brief review of the literature
and develops the hypotheses to be tested. Section 3 presents a brief description of the global
financial crisis and its impact on the European countries. Section 4 presents the data, defines
the variables and reports the descriptive statistics. Section 5 describes the methodology.
Section 6 reports the empirical results and Section 7 discusses the implications of our
findings and concludes.
2. Related Literature and Hypothesis Development
Several studies, including Stein (1988), Porter (1992) and Hall (1993), argue that investors
focus excessively on short-term profits and under-value firms with long-term investments,
such as R&D, which create strategic options for a firm and are a major source of competitive
advantage (see, for example, Ansoff, 1995; Porter, 1998). However, Jensen (1993) argues
that not all R&D investments are likely to be profitable. If investors overlook this possibility,
they are more likely to overvalue the stocks of R&D-intensive firms. Several studies
investigate the issue of whether R&D intensive stocks are over- or under-valued by
examining the stock price behaviour following the announcement of corporate R&D
investments.
One stream of the empirical literature focuses on the short-term stock price reaction to
R&D expenditure announcements. Chan et al (1990) and Zantout and Tsetsekos (1994) show
that stock markets react positively to increased R&D expenditure announcements by

5
technology firms. Saad and Zantout (2009) find a negative stock price response to public
announcements on discontinuation of R&D programs in science and technology industries.
Szewczyk et al (1996) report a positive association between Tobin's q, a measure of
investment opportunities, and stock price reaction to the announcement of R&D investments.
Using a sample of 157 US firms for the period 1968-1974, Griliches (1981) finds that one
additional dollar spent on R&D boosts a firm’s market value by $2 and an additional patent
boosts the market value by around $200,000 over the long term. Hall et al (2005) show that
the book value of assets, number of patents per dollar of R&D and number of citations per
patent have significant impacts on market value, with an extra citation per patent enhancing a
firm’s market value by about 3%. Ehie and Olibe (2010) report a positive association
between R&D investments and market value for both manufacturing and services industries.
While the majority of studies report a positive short-term price reaction to increased
R&D expenditure announcements, others show that the market reaction to R&D investments
varies considerably across time and regions. For example, Hall (1993) reports a sharper
decrease in the market valuation of R&D investment in the US manufacturing industry during
1986 – 1991 than that observed during 1979 – 1983. She attributes such a decline to a lower
rate of return to R&D and a higher discount rate for R&D investments due to uncertainty.
Erickson and Jacobson (1992) find that R&D investments do not increase the market value of
US firms, after taking into consideration other firm-specific factors. Hall and Oriani (2006)
find that R&D is valued by French and German investors, but not by Italian ones. Booth et al
(2006) and Karjalainen (2008) find that investors better value R&D expenditures in a market-
based financial system than those in a bank-based financial system.
Another stream of empirical studies focuses on the long-term performance of firms
with different R&D investments. Pakes (1985) uses a sample of 120 US firms over the period
1968-1975 to investigate the dynamics among patents (measured by the number of successful
patent applications), R&D expenditures and stock returns. He finds that the events that lead
the market to re-valuate the firm are significantly correlated with unpredictable changes in
both R&D and the patents of the firm. Lev and Sougiannis (1996) find a positive and
significant coefficient on the R&D variable, defined as the weighted sum of past R&D
expenses, in cross-sectional stock returns over the 12 months subsequent to the release of
current period accounting information. Eberhart et al (2004) find that US firms with
unexpected R&D increases experience significantly positive risk-adjusted excess stock

6
returns for 5 years following the firm’s R&D increase. They argue that investors
systematically underreact to R&D increases that are considered as long-term beneficial
investments. Similarly, Eberhart et al (2004) show all groups of firms benefit from R&D
investments, but R&D expenditures of high-tech firms generate significantly higher abnormal
returns than low-tech firms. Their evidence suggests that the market is slow to recognise the
full benefit of R&D investments and the delay in incorporating the R&D benefits is greater in
the case of high-tech firms. In contrast, Chan et al (2001) do not find any significant
difference in average risk-adjusted excess return between US firms with and without R&D
investments.
While research on the effectiveness of R&D investments is evident, little attention has
been given the impact of innovations, the by-products of R&D investments, on firms’ ability
to cope during difficult times. This study uses country level data to investigate the
relationship between a country’s innovativeness and its stock index price reaction to the
announcement of major bad news about the global economy. The efficient market hypothesis
(EMH) suggests that stock price should reflect all relevant information immediately and
accurately. Thus, stock prices are expected to decrease on the days when negative news
arrives to the market. However, we argue that the extent of stock market index price reaction
to negative news may depend on a country’s innovativeness. It has been argued that R&D
expenditure creates intangible assets, such as patents and intellectual property (see, for
example, Hall, 1993; Sougiannis, 1994; Al-Horani et al, 2003). According to Porter (1998),
these intangible assets are considered to be among the most important sources of a nation’s
competitive advantage. Knowledge management has also been regarded as one of key
determinants of a country’s ability to exploit its own innovative efforts in order to improve its
competitiveness in the global economy (Schwab, 2012). We argue that if investors can
foresee the rewards from innovations, their confidence about the country’s ability to cope
during difficult times will increase. Therefore, we expect stock indices of innovation-
intensive countries to be less adversely affected by the arrival of negative news about the
global economy. This leads to:
Hypothesis 1: Abnormal returns on the day of the informed negative shock are positively
associated with a country’s investment in innovations.

7
The extant literature focuses on the riskiness of R&D investment relative to
investments in physical assets. Chan et al (2001) argues that payoffs from R&D investments
involve a larger degree of uncertainly and their benefits are likely to materialise much later
than benefits from investments in physical assets. Consistent with this view, Al-Horani et al
(2003) find a positive association between the cross-sectional UK expected returns and R&D
expenditure. Their evidence implies that intangible assets resulting from R&D activities are
riskier than tangible assets. The main objective of the study reported in this paper is not to
compare the relative riskiness of tangible and intangible assets. Instead, we investigate the
link between innovations and the change in stock market index betas following the arrival of
major negative news. We argue that if innovations help firms to develop competitive
advantage, highly innovative firms would be better for disruptive economic conditions and
recessions should, therefore, have less adverse impact on their performance and the stability
of their cash flows.
The impact of negative news announcements on individual stock betas is widely
examined in the literature. Several studies, including Hamada (1972), Appleyard and Strong
(1989), Monkhouse (1997), show that the arrival of bad news tends to reduce equity value,
increase firm leverage and increase stock betas. Others, such as Kalay and Lowenstein (1985)
and Patell and Wolfson (1979), argue that surprises increase uncertainty and stock betas
increase following negative news announcements. The uncertain information hypothesis
(UIH) of Brown et al (1988) suggests that stock betas increase following both positive and
negative news. The authors argue that in incomplete information environment, investors may
use the parameters of a conditional probability distribution to estimate the various potential
outcomes. Since the full extent and the ultimate impact of the arrival of good or bad news
about a firm’s future prospects may still be uncertain, risk-averse investors may choose to
apply high discount rates and set stock prices significantly below their conditional expected
values.
The concept of time varying betas is relevant to this study for two important reasons.
First, failure to control for event-induced changes in beta may result in biased abnormal
returns estimates. For instance, Benamraoui et al (2013) show that the price patterns
following profit warning announcements disappear completely after adjusting for event-
induced systematic risk. Similarly, Mazouz and Saadouni (2009) find that the price effects of
index revisions are sensitive to the time-varying risk adjustments. Specifically, they show that
8
OLS-based abnormal returns indicate that the price effect associated with the index revision
is temporary, whereas market models with time varying betas imply that both additions and
deletions experience permanent price change. Secondly, if innovation-intensive firms cope
better during periods of economic distress, the arrival of negative news should have a less
adverse impact on the riskiness and value of the stock market in countries that invested more
in innovation, leading us to:
Hypothesis 2: Beta changes following informed negative shocks are negatively associated
with a country’s investment in innovation.
3. The Financial Crisis in Europe
The financial crisis began in the summer of 2007 due to the bursting of the US housing
bubble. The sharp decline in US house prices caused the value of the securities backed by
American real estate to collapse and interbank markets to freeze (Strahan, 2008;
Brunnermeier and Pedersen, 2009). This, in turn, caused widespread insolvencies among
financial institutions in the US and globally. In 2008, the fourth largest US investment bank,
Leman Brothers, filed for bankruptcy and the US government-sponsored enterprises Fannie
Mae and Freddie Mac were placed into conservatorship. During the same year, Northern
Rock and the Bradford & Bingley Building Society were nationalised by the British
government and the governments of Belgium, France, and Luxembourg had to inject $9.2
billion to Dexia, the world’s largest lender to municipalities. The Belgian, Dutch, and
Luxembourg governments also injected $16.4 billion into banking and insurance company
Fortis (Jackson, 2009).
As investor confidence collapsed, financial distress transferred to business and
household demand and the economy in Europe entered the steepest downturn on record since
the 1930s. The European economy shrank by nearly 4% in 2009, the sharpest contraction in
the EU's history (European Commission, 2009). This economic downturn triggered sovereign
debt problems in Europe, making it almost impossible for some Eurozone countries,
particularly Greece, Ireland, Portugal, Spain and Italy (PIIGS), to service their debt
obligations without the assistance of third parties, such as the European Central Bank (ECM)
and the International Monetary Fund (IMF). The fears of sovereign debt crisis had severe
economic and political consequences in both Europe and globally. The unemployment rate in

9
European also rose sharply, with Spain and Greece being the worst hit with unemployment
rates exceeding 26% (Aridas and Ventura, 2011). In addition to the adverse economic effects,
the European crisis saw major political shifts in the leading powers of the worst hit countries,
including Greece, Ireland, Italy, Portugal, Spain, Slovenia and Slovakia.
The European countries adopted different policies to stimulate economic growth.
Many central banks in Europe, including the ECB and the Bank of England cut interest rates
(to 1.5% and 0.5%, respectively), approaching the Federal Reserve rate of 0.25%. In addition,
the Bank of England has committed a total of £375 billion to quantitative easing since 2009
(BBC, 2013). However, other European governments, particularly those that received funds
from the EC, ECB and IMF, used budget tightening (that is, raising taxes and lowering
expenditure) as a means to fight the crisis. Greece, for example, cut its healthcare spending
by more than 40% and Portugal reduced the number of private sector workers covered by
union contracts from 1.9 million to 300,000 (Weisbrot, 2014). This austerity policy also
affected the R&D budget, with R&D expenditure dropping by a record of 4.5% in 2009
across the OCED countries, except South Korea and France.
The fears of contagion risk in Europe began to diminish by the second half of 2012
following the successful policy measures taken by EU leaders and the ECB, which include
fiscal consolidation and structural reforms among the worst affected countries. Whilst these
actions helped to restore investors’ confidence in the Eurozone, some countries, particularly
Greece and Cyprus, are still in need for funds from the ECB and IMF to restore recovery and
stimulate growth.
4. Data Variable Definitions and Descriptive Statistics
For the crisis period, we analyse 27 European stock market indices2 over the period from
January 2007 to December 2012.The stock market indices are from Datastream. The proxy
for the World market portfolio is the Datastream World index. Yearly innovation measures
and macroeconomic variables are obtained from the Eurostat and World Development
Indicators, respectively. Informed negative shocks are identified by matching the lowest 5th
percentile of the World Index returns during the study period with the timelines of crisis from
2 The other European stock markets are excluded due to unavailability of the DS index data.
10
the BBC, ECB, Federal Reserve Bank of St Louis and The Guardian. To avoid confounding
effects when tracking the post-shock abnormal returns, multiple price shocks in a 10-days
post the event window are excluded from our analysis. By applying these criteria, we
indentified 20 informed negative shocks over the study period, with a mean (median) of
-4.54% (-4.51%) and values ranging from highest of -2.2% to the lowest of -6.65%.
---------------------------------------------------------------------------------------------------------------- Insert Table 1 about here
----------------------------------------------------------------------------------------------------------------
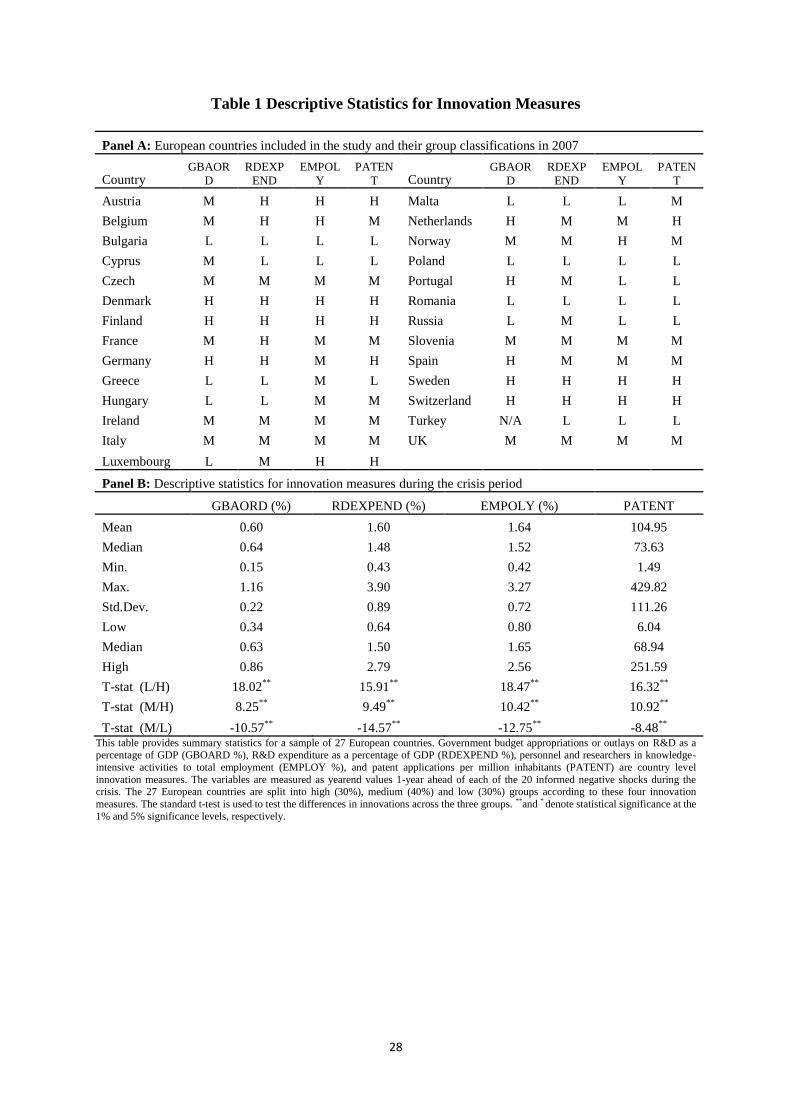
We use government budget appropriations or outlays on R&D as a percentage of GDP
(denoted GBOARD), R&D expenditure as a percentage of GDP (RDEXPEND), personnel
and researchers in knowledge-intensive activities to total employment (EMPLOY) and patent
applications per million inhabitants (PATENT) to capture different aspects of a country’s
innovativeness. Specifically, GBAORD measures government’s support to R&D activities
and the priority of public funding of R&D placed by central governments; RDEXPEND
captures the governments’ R&D actual expenditure; EMPLOY is a measure of skilled
workforce working in technological innovation; PATENT is a measure of innovation output.
Table 1 reports the descriptive statistics of the different innovation measures. We split
the 27 European countries into high (30%), medium (40%) and low (30%) groups according
to each of these four innovation measures and report the results in Panel A of Table 13.Panel
B of Table 1 suggests the presence of wide discrepancies in the level of innovativeness across
the sample countries. Specifically, the GBAORD averages 0.60%, with values varying from a
minimum of 0.15% for Malta to a maximum of 1.16 % for Finland. Similarly, the
RDEXPEND values range from 3.9% for Finland to 0.43% for Cyprus with a mean (median)
of 1.60% (1.48%). Finland has the highest EMPLOY of 3.27%, while Romania has the
lowest EMPLOY value of 0.42%. It also shows that the average PATENT is 104.95, with
Switzerland and Russia having 429.82 and 1.49 patent applications per million inhabitants,
respectively. Standard t-tests suggest that the variations in innovations across the three groups
are significantly different from zero.
3 To save space, each country’s group classifications in 2007 are illustrated in Panel A of Table 1. Yearly group classifications and more detailed descriptive statistics are available upon request.
11
After discussing innovation measures, we consider other potential determinants of the
variations in cross-country stock returns. These variables include openness of goods trading,
that is imports plus exports as a percentage of GDP (TRADEOPEN), local inflation rate
(INFLATION), official exchange rate to US$ (EXRATE), the size of financial intermediaries
relative to the same of the whole economy, that is domestic credit provided by the banking
sector as a percentage of GDP (Credit/GDP) and the size of the stock market relative to size
of the whole economy, that is the market capitalisation of listed companies as percentage of
GDP (MV/GDP). Our choice of these variables is guided by the findings of relevant studies
in the literature. For example, Darrat and Zhong (2005) and Li et al (2004) show that trade
openness increases co-movement across stock markets. Fama (1981) predicts a negative
association between inflation and stock returns, as inflation is known to have an adverse
effect on the real economy. Dornburch and Fisher (1980) argue that the currency movements
affect international competitiveness and thus affecting the future cash flows of firms and their
stock returns. Allen and Gale (2003) show that stock returns are positively related to the
development of a country’s financial system, as a sufficiently liquid banking system allows
stock market traders to smooth their trades and minimise price volatility. Finally, Martin and
Rey (2000) argue that assets with larger demand have a higher price. They find that larger
financial areas exhibit higher asset prices, implying a positive association between MV/GDP
and stock returns.
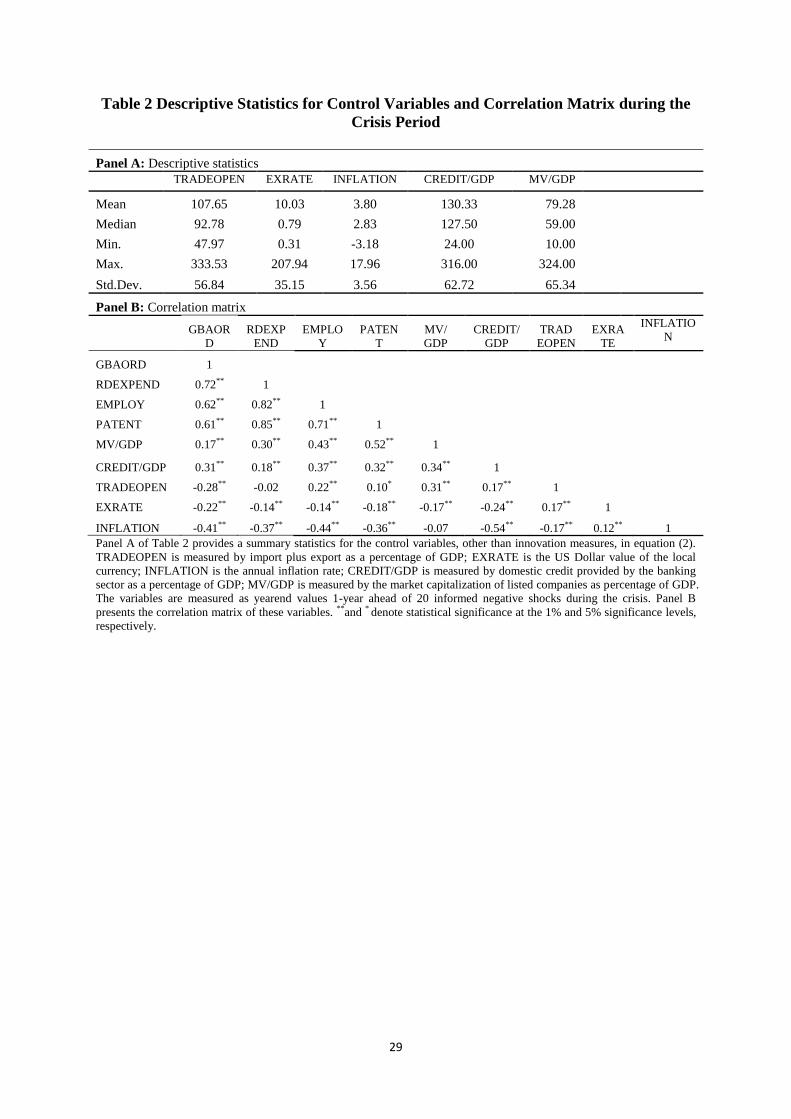
Table 2 reports descriptive statistics and the correlations between the various variables
used in our analysis. Panel A of Table 2 shows that TRADEOPEN has an average of
107.65%, with values ranging from 47.97% for Turkey to 333.53% for Luxembourg. The
average inflation rate during the crisis across 27 European countries is 3.8%. Ireland
experienced a deflation of -3.18%, while Russia has the highest inflation rate of 17.96%.
Norway (Cyprus) has the smallest (largest) Credit/GDP. Romania (Luxembourg) has the
smallest (largest) MV/GDP. Panel B of Table 2 presents the correlation matrix of the
variables used in our analysis. The correlations among the four innovation measures range
from 0.61 between PATENT and GBAORD to 0.85 between PATENT and RDEXPEND. It
indicates that governments’ R&D expenditures have a positive impact on patent applications.
Thus, policy makers who are concerned with competitive success and wealth creation should
encourage R&D investments by adopting effective policies, such as providing fiscal
incentives, grants and subsidies of private R&D projects. INFLATION is also highly

12
correlated with CREDIT/GDP, with a correlation coefficient of -0.54. This finding is
consistent with Boyd et al’s (2000) argument that an increase in inflation drives down the
real rate of return and exacerbates credit market frictions. This, in turn, will have adverse
effects on both financial intermediation and capital investments. The correlation between the
remaining variables is relatively low (that is, less than 0.5 in absolute value) numerically,
even though many of the estimated coefficients are significantly different from zero.
----------------------------------------------------------------------------------------------------------------
Insert Table 2 about here ----------------------------------------------------------------------------------------------------------------
5. Methodology
This section describes the methods used to estimate abnormal returns and time varying betas
around informed negative shocks. It also outlines the multiple regression models used to
investigate the impact of investment in innovations on stock market reactions and its
systematic risks.
5.1 The BEKK-GARCH based event study
It has been widely documented in the literature that stock betas vary considerably over time,
as firms’ leverage, investment opportunities and other characteristics change (see, for
example, Black, 1976 and Christie, 1982). Several studies, including Mandelbrot (1963) and
Fama (1965), show that daily stock return series are heteroskedastic. The Lagrange Multiplier
(LM) test suggests the presence of the Autoregressive Conditional Heteroskedasticity
(ARCH) effect in the residuals of the market model of all 27 stock market indices included in
our analysis4. Following McKenzie et al (2000), we employ the cumulative sum of recursive
residual squares (CUMSUMSQ) test to determine whether beta coefficients are constant or
time varying. Our results show that the recursive residuals from CUMSUMSQ tests for all 27
stock market indices fall outside the 5% bounds, indicating the parameters of the market
model are time varying. Figure 1 provides a typical example of a graphical illustration of the
CUMSUMSQ test results5.
4 Further details on the LM test are available from the corresponding author on request. 5 Graphical illustrations of the CUMSUMSQ test of the remaining sample countries are also available upon
request.
13
---------------------------------------------------------------------------------------------------------------- Insert Figure 1 about here
----------------------------------------------------------------------------------------------------------------
The time varying nature of the beta coefficients and the presence of heteroskedasticity
in the index returns impair the power of the traditional market model in an event study6. To
overcome this problem, we use the bivariate form of Engle and Kroner’s (1995) BEKK-
GARCH (1,1) model, which allows the market model betas to vary systematically over time
and for the residual errors to be heteroskedastic. This model has also been used by Tsui and
Yu (1999), Choudhry (2005) and Choudhry et al (2010), among others, to estimate abnormal
returns. The conditional bivariate mean model is specified as
, , (1)
where and are random error terms. The conditional covariance matrix of the residual
series allows the conditional variance and correlation of both country and World index
returns to vary over time
[ ] [ ], (2)
, (3)
where is the information set of the past values of the error term ; is the
conditional covariance between country index and World index returns; and are
conditional variances of country index and World index returns, respectively. , and are
2 x 2 matrices of parameters. Estimated values are indicated with a hat, for example . The
time-varying beta of index i, , is defined in the usual way and is estimated by
⁄ . (4)
6 Although the market model abnormal returns are generally higher than those of BEKK-GARCH (1, 1), our conclusions are not sensitive to the abnormal return estimation technique. More details of these results are available upon request.

14
To account for the potential effect of beta changes on the abnormal returns around informed
negative shocks, beta adjusted abnormal returns, , are estimated as
. (5)
For N indices, the average beta adjusted abnormal returns and the cumulative beta adjusted
abnormal returns are calculated in the usual way as
∑ ∑ , (6)
where is the cumulative abnormal return of stock index i over a window of S days
starting on the day of the event, that is ∑ The two test statistics used to
assess the statistical significance of and , are as follows
⁄ ⁄ ⁄ ⁄ , (7)
where and are the estimated standard deviations of the ARi,t and CARi,s,
respectively, and are estimated as
√ ∑ , √ ∑ . (8)
When standard assumptions hold, T1 and T2 follow Student t-distributions with N – 1 degrees
of freedom.7 Following Benamraoui et al (2013), the impact of negative news
announcements on country index betas is estimated using the following equation
, (9)
where is index i’s estimated pre-event beta, measured over [-201,-1] window prior to
the announcement date. The subscript of denotes the number of days after
the event day t. , , ..., are dummy variables with a value of unity if , 7 For robustness purposes, we also use Newey-West Heteroskedasticity and Serial Correlation Consistent estimator and J-Statistic of Campbell et al (1997). The conclusions are unchanged.
15
, ..., , respectively, and zero otherwise. is the estimated change in
the beta measured over the window of length n after the event date. The standard paired t-test
and the non-parametric Wilcoxon Signed Rank Test are used to test if the pre-event and post-
event betas are significantly different.
5.2 Multiple regression analysis
The following panel regression model is used to examine the relationship between
investments in innovations and stock market reaction to the announcement of major bad news
about the global economy
. (10)
To test our hypotheses, we estimate Equation (10) using the announcement day
abnormal return and then beta changes as the dependent variables. Hypothesis 1 is
tested by using as the dependent variable in Equation (10). This hypothesis predicts that will be positive and statistically significant. Furthermore, hypothesis 2 is tested by using as the dependent variable. If this hypothesis holds, the parameter will be negative and
statistically significant. A specific innovation variable is denoted by IV and X represents the
vector of control variables, namely TRADEOPEN, EXRATE, INFLATION, Credit/GDP and
MV/GDP. All these variables are as previously defined (see Section 4) and their values are
taken at the yearend prior to a given event. To avoid multi-collinearity related issues, the
inclusion of highly correlated variables in the same regression model is avoided.
6. Empirical Results
The empirical results are presented in three subsections. Sections 6.1 and 6.2 are concerned
with the crisis period from 2007. Section 6.1 discusses abnormal return estimates around
informed negative shocks. Section 6.2 reports the changes in stock index betas following the
announcements of negative news about the global economy. Section 6.3 presents the
analogous results for the pre-crisis period 2001 to 2006.
16
6.1 Abnormal returns analysis
Table 3 reports the event day average abnormal returns and the post-event cumulative
abnormal returns for all 27 countries in the study and for the four subsamples of countries
classified using the four different innovation measures described above. The event day
abnormal return is negative (-0.08%), but is not statistically significant different from zero.
The cumulative abnormal return over the windows [0, 10], [0, 20] and [0, 30] following
informed negative shocks are also not significantly different from zero. This suggests that on
average the national stock indices of the 27 European countries in the study were not
vulnerable to the announcement of negative news about the global economy during the recent
financial crisis.
To test whether innovations affect stock market reactions to news about the global
economy, we divided the 27countries into three groups, high (30%), medium (40%), and low
(30%), based on each of the innovation measures described in Section 4. Table 3 shows that
event day abnormal returns increase with innovation. The event day abnormal return for
countries in the low innovation groups are negative and significantly less than zero8 for three
out of the four measures. The cumulative abnormal returns over the windows [0, 10], [0, 20]
and [0, 30] associated with this particular group of countries are also negative and statistically
significant, indicating that such a negative reaction is long-lived. The significantly negative
cumulative abnormal returns observed over the windows [1, 10], [1, 20] and [1, 30] imply the
presence of price continuation patterns following the arrival of bad news about the global
economy. This finding is consistent with Lasfer et al (2003), who show that large negative
index price changes are followed by negative abnormal price performance. It should be noted,
however, that there is some evidence in Panels A and C of Table 3 that the effect is
weakening by day 30.
Table 3 shows that the abnormal returns associated with the countries in the medium
innovation groups are not significantly different from zero. However, countries in the highest
innovation groups react positively to the arrival of negative news about the global economy.
Specifically, the event day abnormal returns associated with countries with the 30% highest
values of the classifiers GBAORD, RDEXPEND, EMPLOY and PATENT are 0.11%, 0.25%,
8 To allow for the time difference between locations, we also estimate cumulative abnormal returns in the event
window [0, 1]. The conclusions remain largely unchanged.
17
0.29% and 0.19%, respectively. The cumulative abnormal returns over longer event windows
[0, 10], [0, 20] and [0, 30], are positive and, with a few exceptions, statistically significant at
the 1% level. This evidence suggests that positive market reaction to negative news about the
global economy is long-lived. We also find positive price continuation patterns in the indices
of countries in the high innovation groups with positive abnormal returns on event days
followed by positive price performance in the windows up to 20 days.
Table 3 also provides the t-statistics for differences in cumulative abnormal returns
between different innovation groups. Cumulative abnormal returns associated with countries
in the high innovation groups are significantly higher than those in the low innovation groups.
We also show that countries in the medium innovation groups tend to outperform those in the
low innovation groups around the announcement of bad news about the global economy.
These findings are robust to the different innovation measures.
---------------------------------------------------------------------------------------------------------------- Insert Table 3 about here
----------------------------------------------------------------------------------------------------------------
We use multiple fixed effects panel data regressions, Equation (10), with abnormal
return on the event day as the dependent variable to verify the validity of the results after
accounting for the effect of other well known determinants of country level returns. 9 The
Hausman test suggests that the use of fixed effects is more appropriate than a random effects
specification for our data. Table 4 reports the coefficients of panel data regressions on the
event day abnormal returns. The t-statistics are shown in parentheses. Consistent with the
investors’ confidence view, the coefficients on the innovation measures in Models 1 through
8 are positive and statistically significant. The coefficient of MV/GDP, which measures the
relative size of the financial market, is negative and statistically significant. This finding is
similar to the small firm effect but contradicts Martin and Rey’s (2000) view that larger
financial markets ought to exhibit higher asset prices. The remaining control variables are not
significantly related the abnormal returns.
Overall, the results suggest that the index price reaction to negative shocks is positively
associated with a country’s innovativeness. While the positive association between 9 Our conclusions remain consistent when cumulative abnormal returns over longer windows post the informed negative shocks are used as the dependent variables in equation (10).

18
innovations and firm value is well documented in the literature (see Chan et al, 1990; Zantout
and Tsetsekos, 1994; Eberhart et al, 2004, among others), this study is the first to show that
stock markets in innovation-intensive markets react favourably to stressful economic
circumstances. We argue that this evidence is consistent with Hypothesis 1, which suggests
investments in innovations enhances investors’ confidence in firms’ ability to compete
effectively during difficult times. This finding is also consistent with several other studies in
the literature, which suggest that innovations can create future opportunities to provide firms
with distinct competitive advantage. Rhodes and Stelter (2009), among others, posit that
turbulent times bring with them opportunities and threats. Hartman (2009) argues that
innovations increase the flexibility and the speed at which firms respond to changing
conditions. Several studies argue that firms adapt to economic downturns by implementing
business strategies centred on innovations. For example, Clifford (1977) and Picard and
Rimmer (1999) posit that firms tend to respond to recession conditions by developing new
products and targeting new market niches. Chou and Chan (2002) argue that innovations
enable firms to attract customers by improving their quality and brand or maintaining low
prices in price-sensitive markets. Thus, the positive abnormal returns observed in the case of
stock indices of innovation-intensive countries following the arrival of bad news about the
global economic may reflect the distinct competitive advantage and ability of innovative-
intensive firms to adapt quickly and effectively to disruptive economic conditions.
----------------------------------------------------------------------------------------------------------------
Insert Table 4 about here ----------------------------------------------------------------------------------------------------------------
6.2 Changes in betas analyses
Table 5 presents the changes in market index betas following informed negative shocks.
Panel A shows that the average pre-event beta is 0.8185. The paired-test suggests that the
pre- and post-event betas are not significantly different from each other, except for the
window [0, 30] in which a significant beta decrease is observed after informed negative
shocks.10 This finding implies that, on average, the arrival of bad news about the global
economy does not affect the uncertainty and the index betas of our sample countries.
10 Similar results are obtained when the non-parametric Wilcoxon signed rank test is used to test the statistical significance of the beta changes.

19
To investigate the relationship between the index betas and investment in innovations,
countries are divided into high (30%), medium (40%) and low (30%) groups based on each of
our four innovation measures. Consistent with Jensen’s (1993) view that investment in
innovations carries higher uncertainty, Table 5 shows that pre-event index betas increases
with a country’s innovativeness. For example, the average pre-event beta associated with
countries in the high, medium and low GBOARD groups are 0.9765, 0.8366 and 0.63,
respectively. Similarly, the average pre-event betas for countries in the high, medium and low
RDEXPEND groups are 0.9588, 0.8407 and 0.6477, respectively. Similar, although weaker,
patterns are also observed when countries are split according to EMPLOY and PATENT. The
differences in the pre-event index betas between countries in the high and low innovation
groups are statistically significant, irrespective of innovation measures.
----------------------------------------------------------------------------------------------------------------
Insert Table 5 about here ----------------------------------------------------------------------------------------------------------------
Table 5 also compares the pre- and post-event betas associated with the different
innovation groups. The results suggest that innovations are important determinants of the
index betas reaction to the arrival of negative news about the global economy. We show that
changes in index betas tend to exhibit a negative association with a country’s innovativeness.
This relationship is particularly more pronounced in the cases of GBOARD and RDEXPEND
and when post-event betas are measured over longer windows. For example, the average
index betas of countries in the high GBOARD group exhibits a significant decline from
0.9765 over the window [-201, -1] to 0.9212 over the window [0, 30]. However, the average
index beta associated with countries in the medium and low GBOARD groups experience a
consistent increase up to 20 days after the event. This increase is statistically significant in the
case of countries in the medium GBOARD group for event windows [0, 5] and [0, 10].
Similar findings are reported when RDEXPEND is a proxy for innovation. Specifically, the
group of countries with the highest RDEXPEND experience a consistent decline in index
betas over a 30-day period after informed negative shocks. This decrease is significant for
windows [0, 20] and [0, 30] following the event. Countries in the medium RDEXPEND
group exhibit significant average beta increase for up to 20 days post-informed negative
shocks. However, the average betas of countries in the low RDEXPEND also declines in the
post-event periods, but the decrease is only significant for windows [0, 20] and [0, 30]. The
20
variations of betas across different groups are much less pronounced when EMPLOY and
PATENT are used as proxies for innovation.
We run multiple fixed effects panel data regressions (Equation 10 with as the
dependent variable) to investigate whether the results are robust after accounting for the
effect of the control variables. The use of fixed effects regressions rather than random-effects
are justified by Hausman tests. Table 6 reports the coefficients of panel data regressions on
changes in betas for the window [0, 20] following the arrival of negative news about the
global economy.11 The t-statistics are shown in parentheses. Models 1 through 8 indicate the
presence of negative association between index betas and innovation measures. However, this
relationship is only statistically significant when GBOARD is used as a proxy for innovation.
The coefficient on TRADEOPEN in Table 6 is positive and statistically significant, reflecting
the fact that openness increases co-movements across stock markets (Li et al, 2004). The
coefficient on INFLATION is also positive and statistically significant, implying that high
inflation increases riskiness of firm’s capital investment and stock beta (Pindyck, 1984).
Finally, the significantly negative association between index beta changes and CREDIT/GDP
indicates that stock market systematic risk is lower in countries with more developed banking
systems. The statistical significance of the remaining explanatory variables, namely MV/GDP
and EXRATE, is sensitive to the model specification. Furthermore, when the estimated
coefficients of these variables are significantly different from zero, it is only at the 5% level.
The results of time varying beta analysis provide a partial support for Hypothesis 2,
which predicts that the announcement of negative news has less negative impact on the
riskiness of stock markets of the countries in the high innovation groups. The support is
particularly more pronounced, when GBOARD is used as an innovation measure. While
existing studies show that the arrival of negative surprises increases uncertainty and increase
stock betas (see, for example, Brown et al, 1998; Kalay and Lowenstein, 1985; Patell and
Wolfson, 1979), our results indicate that innovations may reduce uncertainty around negative
surprises by enabling firms to exploit the opportunities and overcome the threats imposed by
the global economic downturns. Thus, the reduced co-movement between stock indices of
innovation-intensive countries and the World market portfolio may reflect the superior
performance of highly innovative firms during crisis periods.
11 The regressions are also run using betas for windows [0, 5], [0, 10], [0, 30] post the informed shocks. The results are consistent.

21
----------------------------------------------------------------------------------------------------------------
Insert Table 6 about here --------------------------------------------------------------------------------------------------------------- 6.3 The pre-crisis results
Thus far, the results suggest that innovation helps to restore investors’ confidence and that
stock indices of innovation-intensive countries react positively to the arrival of negative news
during the financial crisis. To examine whether these results are unique to the crisis period,
we investigate the stock market index reaction to the arrival of negative news prior the US
subprime crisis that is from January 2001 to December 2006. In line with the earlier analysis,
we use the bivariate BEKK GARCH-based event study methodology to estimate abnormal
returns and time-varying betas. We also match the lowest 5th percentile of the DataStream
World index returns with news announcements by the ECB to identify our events (that is,
informed negative shocks). This matching resulted in 18 events over the pre-crisis period,
with a mean (median) of -1.81% (-1.58%) and values ranging from -3.38% to -1.08%.
Table 7 presents the post-event abnormal returns associated with the entire sample
and the three subsamples of countries ranked on their innovation measures. Panel A shows
that the average abnormal return associated with the 27 European indices on the event day is
significantly negative. The cumulative abnormal returns are also significantly negative up to
30 day following bad news announcements, implying that European stock indices underreact
to the arrival of negative news. This finding is consistent with Lasfer et al (2003), who find
that stock market indices underreact to both negative and positive shocks in the short-term.
Table 7 also shows that the post-shock cumulative abnormal returns associated with high-
and medium-innovation countries are not significantly different from zero. However, the
cumulative abnormal returns of low-innovation countries remain negative and statistically
significant up 30 days following the negative news announcements. This finding suggests
innovation helps stock indices to absorb negative news more quickly. The stock indices of
low innovation group exhibit larger price drops than those of high innovation group. The t-
statistics indicate that the presence of some differences in the reaction between high- and
low-innovation countries, but the statistical significance of difference is not consistent across
innovation measures and estimation windows. Specifically, the differences in the cumulative
abnormal returns of high and low innovation groups are only significant in the cases of

22
GBAORD and REDEXPEND over the windows [0, 20] and [0, 30], respectively. We also
estimate Equation (10) using data from the pre-crisis period. We find GBAORD is the only
innovation measure that affects the index price reaction to negative news. The coefficient on
GBAORD is positive and statistically significant, implying that stock indices of countries
with high GBAORD exhibit lower negative reaction to negative news than those in the low
GBAORD category. The details of these results are omitted from the paper to save space, but
are available from the corresponding author on request.
---------------------------------------------------------------------------------------------------------------- Insert Table 7 about here
----------------------------------------------------------------------------------------------------------------
We also examine the link between innovation and the changes in the stock index betas
following the arrival of negative news in the pre-crisis period. The results in Table 8 indicate
that the average index beta of the sample countries increase significantly from 0.5889 over
the window [-201, -1] to 0.6875 over the window [0, 30]. The post-shock index betas
increase significantly for the high-, medium- and low-innovation groups. This finding is
robust to different innovation measures and estimation windows. Contrary to the results from
the crisis period, the t-statistics in Table 8 also suggest that the index betas of high innovation
countries increase more than those in the low innovation category. We estimate the pre-crisis
data using multiple fixed effect panel data regressions, Equation (10), with over the
window [0, 20] as the dependent variable. We find that GBAORD is the only innovation
measure that affects index beta changes. Specifically, the coefficient on GBAORD is
negative and significant, after controlling for the country fixed effect and other determinants
of the beta changes. This finding implies that the index betas of high GBAORD countries are
less adversely affected by the negative news announcement. As above, these results are
available on request.
---------------------------------------------------------------------------------------------------------------- Insert Table 8 about here
----------------------------------------------------------------------------------------------------------------
Overall, the pre-crisis data analysis provides some evidence that innovations may help
to reduce the adverse effect of bad news announcement on the index prices and betas.
However, the positive cumulative abnormal returns and the beta declines associated with

23
innovation-intensive country indices following negative news are unique to the times of crisis.
This finding suggests that investors value innovation more during difficult times.
7. Implications and conclusions
The study uses country level data to test whether stock markets reward innovations. It
contributes to the literature by linking innovations to investors’ confidence in a country’s
ability to cope during times of economic and financial turmoil. We argue that if innovations
enable firms and economies to develop distinct competitive advantage, which helps them to
cope with difficult economic conditions and if investors can anticipate the rewards of
innovations from a long-term prospective, the riskiness and value of stock market indices of
highly innovative countries should be less vulnerable to the announcement of negative news
about the global economy. We use the bivariate form of Engle and Kroner’s (1995) BEKK
model to investigate the price and beta reaction of the European stock market indices to
arrival of major bad news during the recent global financial crisis.
The results of this study suggest that the stock market reaction to the arrival of
negative news about the global economy do depend on a country’s innovativeness.
Specifically, we find that stocks in innovation-intensive economies offer higher returns and
lower risk during crisis episodes. This evidence implies that innovation helps firms and
economies to cope better during crisis. It also implies that assets in highly innovative
economies offer investors opportunities to protect their wealth in crisis times. Further
analysis suggests that the positive cumulative abnormal returns and the beta declines
observed in the case of innovation-intensive country indices following negative news are
unique to the crisis periods. This evidence suggests that investors value innovation more
during difficult times.
Our findings also have important implications for both managers and policy makers.
The positive index price reaction of innovation-intensive countries to the negative global
economic outlook suggests that investors reward innovation. In other words, while
commitments to R&D expenditures may hurt current earnings, they are necessary for
competitive success (or even survival) during economic downturns. Thus, managers who are
seeking to maximise shareholder wealth should continue to invest in innovation without
fearing short-term negative effects on the stock price. Furthermore, as innovations contribute

24
to economic stability, policy makers who are concerned with sustainable economic growth
should encourage R&D investments by adopting effective polices, such as R&D tax credits
and direct subsidies of private R&D projects. Governments should also avoid unnecessary
cuts in R&D expenditures even during the crisis periods, as cutting R&D expenditure may
have a significant negative impact on competitiveness the long-term. Becker and Pain (2008),
for example, show that the poor performance of the UK manufacturing sector during the
1990s was caused by the decline in UK government financing of R&D projects in the
preceding periods.
The evidence reported in this study opens several other paths for future research. For
example, it may be useful to investigate the relationship between investments in innovation
and stock market liquidity during crisis episodes. This analysis may shed some light on the
extent to which investor perceive innovative economies as places for safety during global
economic downturns. Other extensions could shift the focus from stocks to other asset classes.
For instance, it can be argued that if innovations promote economic stability, default risk of
bonds and borrowing costs should exhibit a negative association with a country’s
innovativeness.
References Aghion, P., and Howitt, P. (1992) A model of growth through creative destruction.
Econometrica, 60, 323–351. Allen, F., and Gale, D. (2000) Comparing financial systems, Cambridge, MIT Press. Al -Horani, A., Pope, P.F. and Stark, A.W. (2003) Research and development activity and
expected returns in the United Kingdom, Review of Finance, 7, 27-46. Ansoff, I. (1965) Corporate strategy, New York, McGraw Hill. Appleyard, T.R., and Strong, N.C. (1989) Beta geared and ungeared: The case of active Debt
management. Accounting and Business Research, 19,170-174. Aridas, T. and Ventura, L. (2011). Public deficit by country 2006-2013. Retrieved from
http://www.gfmag.com/tools/global-database/economic-data/10395-public-deficitby-country.html#axzz2F4acSK9o
BBC (2014) What is quantitative easing? Retrieved from http://www.bbc.co.uk/news/business-15198789 Becker, B., and Pain, N. (2008) What determines industrial R&D expenditure in the UK?,
The Manchester School, 76, 66-87. Benamraoui, A., Mazouz, K., Saadouni, B. and Yin, S. (2013) Stock price reaction to profit
warnings: the role of time varying betas, working paper. Black, F. (1976) The dividend Puzzle, Journal of Portfolio Management, 2, 5-8. Booth, G.G., Junttila, J., Kallunki, J.P., Sahlstrom, P. and Rahiala, M., (2006) How
does the financial environment affect the stock market valuation of R&D spending? Journal of Financial Intermediation, 15, 197–214.
25
Brown, K. C., Harlow, W. V. and Tinic, M. C. (1988) Risk aversion, uncertain information and market efficiency, Journal of Financial Economics, 22, 355–385.
Boyd, J. H., Levine, R., and Smith, D. B. (2000). The impact of inflation on financial sector development, Journal of Economic Literature, 31, 1-19.
Brunnermeier, M.K. and Pedersen, L.H. (2009) Market liquidity and funding liquidity, Review of Financial Studies, 22, 2201-2238.
Campbell, J.Y., A. Lo, and MacKinlay., A. C. (1997) The Econometrics of Financial Markets. Princeton University Press, Princeton, N.J.
Chan, L., Lakonishok, J. and Sougiannis, T. (2001) The stock market valuation of research and development expenditures, Journal of Finance, 56, 2431–2457.
Chan, S.H., Martin, J.D. and Kensinger, J.W. (1990) Corporate research and development expenditures and share value, Journal of Financial Economics, 26, 255-276.
Chen, L., and Zhang, L. (2010) A better three-factor model that explains more anomalies, Journal of Finance, 65, 563-595.
Chou, T-J., and Chen, F-T. (2004) Retail pricing strategies in recession economies: The case of Taiwan, Journal of International Marketing, 12, 82-102.
Choudhry, T. (2005) Time-varying beta and the Asian financial crisis: Investigating the Malaysian and Taiwanese firms, Pacific-Basin Finance Journal, 13, 93–118.
Choudhry, T., L. Lu and K. Peng. (2010) Time-varying beta and the Asian financial crisis: Evidence from the Asian industrial sectors, Japan and the World Economy, 22, 228-234.
Christie, A. A. (1982) The stochastic behavior of common stock variances: Value, leverage and interest rate effects, Journal of Financial Economics, 10, 407 – 432. Clifford, D. (1977) Thriving in a recession, Harvard Business Review, 55, 57‐ 65. Darrat, A. F., and Zhong, M. (2005) Equity market linkage and multinational trade accords:
The case of NAFTA, Journal of International Money and Finance, 24, 793-817. Dornbusch, R., and Fisher, S. (1980) Exchange rates and the current account, American
Economic Review, 70, 960-971. Eberhart, A., Maxwell, W. and Siddique, A. (2004) An examination of the long-term
abnormal stock returns and operating performance following R&D increases, Journal of Finance, 59, 623-650.
Ehie, I. C. and Olibe, K. (2010) The effect of R&D investment on firm value: An examination of US manufacturing and service industries, International Journal of Production Economics, 128, 127-135.
Engle, R.F. and Kroner, K.F. (1995) Multivariate simultaneous GARCH, Econometric Theory, 11, 122-150.
Erickson, G. and Jacobson, R. (1992) Gaining comparative advantage through discretionary expenditures: The returns to R&D and advertising, Management Science, 38, 1264–1279.
European Commission (2009) Economic Crisis in Europe: Causes, Consequences and Responses. Retrieved from
http://ec.europa.eu/economy_finance/publications/publication15887_en.pdf EuroStat (2012) Science, technology and innovation in Europe, Luxembourg, Statistical
Office of the European Union. Fama, E. (1965). The behavior of stock market price, Journal of Business, 38, 34-105. Fama, E. F. (1981) Stock returns, real activity, inflation and money, American Economic
Review, 71, 545-565. Griliches, Z. (1981) Market value, R&D and patents, Economic Letters, 7,183–187. Grossman, G. and Helpman, E. (1991) Innovation and Growth in the Global Economy.
Cambridge, MA, MIT Press.
26
Hall, B. H. (1993) The stock market’s valuation of R&D investment during the 1980’s, American Economic Review, 83, 259–264.
Hall, B. H. and Hall, R. E. (1993) The value and performance of U.S. corporations, Brookings Papers on Economic Activity, 1, 1-34.
Hall, B.H., Jaff, A.B. and Trajtenberg, M. (2005) Market value and patent citations, Rand Journal of Economics, 36, 16-38.
Hall, B.H. and Oriani, R. (2006) Does the market value R&D investment by European firms? Evidence from a panel of manufacturing firms in France, Germany and Italy, International Journal of Industrial Organization, 24, 971-993.
Hamada, R.S. (1972) The effect of the firm’s capital structure on the systematic risk of common stocks, Journal of Finance, 27, 435-452.
Hartman, N. (2009) Sure ways to tackle uncertainty in tough time, Financial times, Managing in a Downturn Series, Retrieved from http://www.ft.com/reports/managingdownturn
Hsu, P-H. (2009) Technological innovations and aggregate risk premiums, Journal of Financial Economics, 94 , 264-279.
Jackson, J. K. (2009) The financial crisis: Impact on and response by the European Union, Congressional Research Service Report for Congress
Jaffe, A. B. (1986) Technological opportunity and spillovers of R&D: Evidence from firms’ patents, profits, and market value, American Economic Review, 76, 984–1001.
Jensen, M.C. (1993) The modern industrial revolution, exit and the failure of internal control systems, Journal of Finance, 48, 831-880.
Kalay, A. and Lowenstein, U. (1985) Predictable events and excess returns: The case of dividend announcements, Journal of Financial Economics, 14, 423-449.
Karjalainen, P. (2008) R&D investments: The effects of different financial environments on firm profitability, Journal of Multinational Financial Management, 18, 79-93.
Lasfer, M.A., A. Melnik and Thomas, D. (2003) Short-term reaction of stock markets in stressful circumstances, Journal of Banking and Finance, 27, 1959-1977.
Lev, B. and Sougiannis. T. (1996) The capitalization, amortization, and value-relevance of R&D, Journal of Accounting & Economics, 21,107-138.
Li, K., Morck, R., Yang, F. and Yeung, B. (2004) Firm-specific variation and openness in emerging markets, Review of Economics and Statistics, 86, 658-669.
Mandelbrot, B. (1963) The Variation of Certain Speculative Prices, Journal of Business, 39, 147-165.
Martin P., and Rey, H. (2000) Financial integration and asset returns, European Economic Review, 44, 1327-1350.
Mazouz, K., and Saadouni, B. (2007) New evidence on the price and liquidity effects of the FTSE 100 index revisions, International Review of Financial Analysis, 16, 223-241.
Mckenzie, M. D., Brooks, R. D. and Faff, R.W. (2000) The use of domestic and world market indexes in the estimation of time-varying betas, Journal of Multinational Financial Management, 10, 91−106.
Monkhouse, P.H.L. (1997) Adapting the APV methodology and the beta gearing formula to the dividend imputation tax System, Accounting and Finance, 37, 69-88.
OECD (2009) Policy Responses to the Economic Crisis: Investing in Innovation for Long-Term Growth, Paris, OECD.
Pakes, A. (1985) On patents, R&D, and the stock market rate of return, Journal of Political Economy, 93, 390–409.
Patell, J. and Wolfson, M. (1979) Anticipated information releases reflected in call option prices, Journal of Accounting and Economics, 2, 117-140.
Picard, R.G., and Rimmer, T. (1999) Weathering a recession: Effects of size and diversification on newspaper companies, The Journal of Media Economics, 12, 1-18.
27
Pindyck, R. S. (1984) Risk, inflation, and the stock market, American Economic Review, 74, 335-51.
Porter, M. E. (1992) Capital disadvantage: American’s failing capital investment system, Harvard Business Review, 70, 65-82.
Porter, M. E. (1998) Competitive advantage: Creating and sustaining superior performance, PLACE, Free Press.
Rhodes, D., and Stelter, D. (2009) Seize advantage in a downturn, Harvard Business Review, 87, 50-58.
Saad, M., and Zantout, Z. (2009) Stock price and systematic risk effects of discontinuation of corporate R&D programs, Journal of Empirical Finance, 16, 568–581.
Schwab, K. (2012) The global competitiveness report 2011-2012. World Economic Forum: Geneva.
Smallbone, D., North, D., and Kalantaridis, C. (1999) Adapting to peripherality: A study of small manufacturing firms in northern England, Entrepreneurship and Regional Development, 11, 109-128.
Solow, R. (1956) A contribution to the theory of economic growth, Quarterly Journal of Economics, 70, 65–94.
Sougiannis, T. (1994) The accounting based valuation of corporate R&D, The Accounting Review, 69, 44-68.
Strahan, P. (2008) Liquidity production in 21st century banking, NBER WP No. 13798.
Stein, J. C. (1988) Takeover threats and managerial myopia, The Journal of Political Economy, 96, 61-80.
Szewczyk, S. H., Tsetsekos, G. P. and Zantout, Z. (1996) The valuation of corporate R&D expenditures: Evidence from investment opportunities and free cash flow, Financial Management, 25,105-110.
Tsui, A. K. and Yu, Q. (1999) Constant conditional correlation in a bivariate garch model: Evidence from the stock market in china, Mathematics and Computers in Simulation, 48, 503-509.
Weisbrot, M. (2014) Why has Europe’s economy done worse than the US? The Guardian, 16 January 2014.
Zantout, Z. and Tsetsekos, G. (1994) The wealth effects of announcements of R&D expenditure increases, Journal of Financial Research, 17, 205-216.
28
Table 1 Descriptive Statistics for Innovation Measures
Panel A: European countries included in the study and their group classifications in 2007
Country GBAOR
D RDEXP
END EMPOL
Y PATEN
T Country GBAOR
D RDEXP
END EMPOL
Y PATEN
T
Austria M H H H Malta L L L M
Belgium M H H M Netherlands H M M H
Bulgaria L L L L Norway M M H M
Cyprus M L L L Poland L L L L
Czech M M M M Portugal H M L L
Denmark H H H H Romania L L L L
Finland H H H H Russia L M L L
France M H M M Slovenia M M M M
Germany H H M H Spain H M M M
Greece L L M L Sweden H H H H
Hungary L L M M Switzerland H H H H
Ireland M M M M Turkey N/A L L L
Italy M M M M UK M M M M
Luxembourg L M H H Panel B: Descriptive statistics for innovation measures during the crisis period
GBAORD (%) RDEXPEND (%) EMPOLY (%) PATENT
Mean 0.60 1.60 1.64 104.95
Median 0.64 1.48 1.52 73.63
Min. 0.15 0.43 0.42 1.49
Max. 1.16 3.90 3.27 429.82
Std.Dev. 0.22 0.89 0.72 111.26
Low 0.34 0.64 0.80 6.04
Median 0.63 1.50 1.65 68.94
High 0.86 2.79 2.56 251.59
T-stat (L/H) 18.02** 15.91** 18.47** 16.32**
T-stat (M/H) 8.25** 9.49** 10.42** 10.92**
T-stat (M/L) -10.57** -14.57** -12.75** -8.48** This table provides summary statistics for a sample of 27 European countries. Government budget appropriations or outlays on R&D as a percentage of GDP (GBOARD %), R&D expenditure as a percentage of GDP (RDEXPEND %), personnel and researchers in knowledge-intensive activities to total employment (EMPLOY %), and patent applications per million inhabitants (PATENT) are country level innovation measures. The variables are measured as yearend values 1-year ahead of each of the 20 informed negative shocks during the crisis. The 27 European countries are split into high (30%), medium (40%) and low (30%) groups according to these four innovation measures. The standard t-test is used to test the differences in innovations across the three groups. ** and * denote statistical significance at the 1% and 5% significance levels, respectively.
29
Table 2 Descriptive Statistics for Control Variables and Correlation Matrix during the Crisis Period
Panel A: Descriptive statistics TRADEOPEN EXRATE INFLATION CREDIT/GDP MV/GDP
Mean 107.65 10.03 3.80 130.33 79.28 Median 92.78 0.79 2.83 127.50 59.00 Min. 47.97 0.31 -3.18 24.00 10.00 Max. 333.53 207.94 17.96 316.00 324.00 Std.Dev. 56.84 35.15 3.56 62.72 65.34 Panel B: Correlation matrix
GBAOR
D RDEXP
END EMPLO
Y PATEN
T MV/ GDP
CREDIT/GDP
TRADEOPEN
EXRATE
INFLATION
GBAORD 1 RDEXPEND 0.72** 1
EMPLOY 0.62** 0.82** 1 PATENT 0.61** 0.85** 0.71** 1
MV/GDP 0.17** 0.30** 0.43** 0.52** 1
CREDIT/GDP 0.31** 0.18** 0.37** 0.32** 0.34** 1 TRADEOPEN -0.28** -0.02 0.22** 0.10* 0.31** 0.17** 1
EXRATE -0.22** -0.14** -0.14** -0.18** -0.17** -0.24** 0.17** 1
INFLATION -0.41** -0.37** -0.44** -0.36** -0.07 -0.54** -0.17** 0.12** 1 Panel A of Table 2 provides a summary statistics for the control variables, other than innovation measures, in equation (2). TRADEOPEN is measured by import plus export as a percentage of GDP; EXRATE is the US Dollar value of the local currency; INFLATION is the annual inflation rate; CREDIT/GDP is measured by domestic credit provided by the banking sector as a percentage of GDP; MV/GDP is measured by the market capitalization of listed companies as percentage of GDP. The variables are measured as yearend values 1-year ahead of 20 informed negative shocks during the crisis. Panel B presents the correlation matrix of these variables. ** and * denote statistical significance at the 1% and 5% significance levels, respectively.
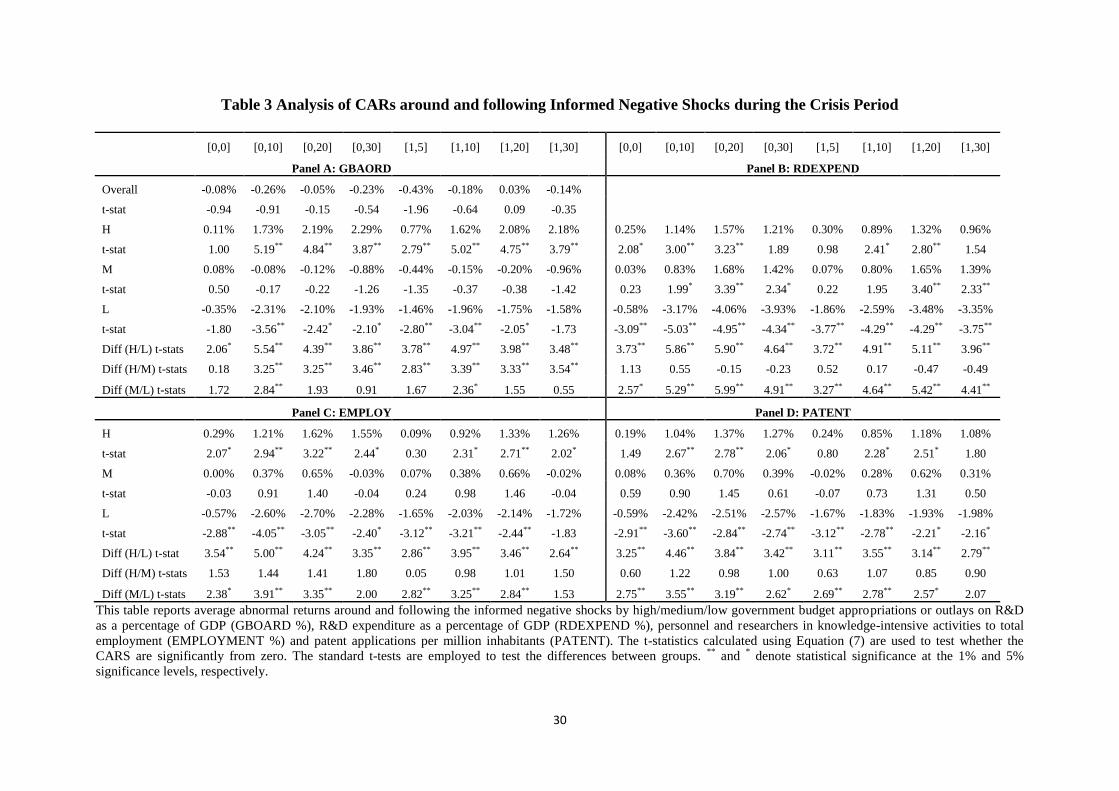
30
Table 3 Analysis of CARs around and following Informed Negative Shocks during the Crisis Period
[0,0] [0,10] [0,20] [0,30] [1,5] [1,10] [1,20] [1,30] [0,0] [0,10] [0,20] [0,30] [1,5] [1,10] [1,20] [1,30]
Panel A: GBAORD
Panel B: RDEXPEND
Overall -0.08% -0.26% -0.05% -0.23% -0.43% -0.18% 0.03% -0.14% t-stat -0.94 -0.91 -0.15 -0.54 -1.96 -0.64 0.09 -0.35 H 0.11% 1.73% 2.19% 2.29% 0.77% 1.62% 2.08% 2.18%
0.25% 1.14% 1.57% 1.21% 0.30% 0.89% 1.32% 0.96%
t-stat 1.00 5.19** 4.84** 3.87** 2.79** 5.02** 4.75** 3.79**
2.08* 3.00** 3.23** 1.89 0.98 2.41* 2.80** 1.54
M 0.08% -0.08% -0.12% -0.88% -0.44% -0.15% -0.20% -0.96%
0.03% 0.83% 1.68% 1.42% 0.07% 0.80% 1.65% 1.39%
t-stat 0.50 -0.17 -0.22 -1.26 -1.35 -0.37 -0.38 -1.42
0.23 1.99* 3.39** 2.34* 0.22 1.95 3.40** 2.33**
L -0.35% -2.31% -2.10% -1.93% -1.46% -1.96% -1.75% -1.58%
-0.58% -3.17% -4.06% -3.93% -1.86% -2.59% -3.48% -3.35%
t-stat -1.80 -3.56** -2.42* -2.10* -2.80** -3.04** -2.05* -1.73
-3.09** -5.03** -4.95** -4.34** -3.77** -4.29** -4.29** -3.75**
Diff (H/L) t-stats 2.06* 5.54** 4.39** 3.86** 3.78** 4.97** 3.98** 3.48**
3.73** 5.86** 5.90** 4.64** 3.72** 4.91** 5.11** 3.96**
Diff (H/M) t-stats 0.18 3.25** 3.25** 3.46** 2.83** 3.39** 3.33** 3.54**
1.13 0.55 -0.15 -0.23 0.52 0.17 -0.47 -0.49
Diff (M/L) t-stats 1.72 2.84** 1.93 0.91 1.67 2.36* 1.55 0.55
2.57* 5.29** 5.99** 4.91** 3.27** 4.64** 5.42** 4.41**
Panel C: EMPLOY Panel D: PATENT
H 0.29% 1.21% 1.62% 1.55% 0.09% 0.92% 1.33% 1.26%
0.19% 1.04% 1.37% 1.27% 0.24% 0.85% 1.18% 1.08%
t-stat 2.07* 2.94** 3.22** 2.44* 0.30 2.31* 2.71** 2.02*
1.49 2.67** 2.78** 2.06* 0.80 2.28* 2.51* 1.80
M 0.00% 0.37% 0.65% -0.03% 0.07% 0.38% 0.66% -0.02%
0.08% 0.36% 0.70% 0.39% -0.02% 0.28% 0.62% 0.31%
t-stat -0.03 0.91 1.40 -0.04 0.24 0.98 1.46 -0.04
0.59 0.90 1.45 0.61 -0.07 0.73 1.31 0.50
L -0.57% -2.60% -2.70% -2.28% -1.65% -2.03% -2.14% -1.72%
-0.59% -2.42% -2.51% -2.57% -1.67% -1.83% -1.93% -1.98%
t-stat -2.88** -4.05** -3.05** -2.40* -3.12** -3.21** -2.44** -1.83
-2.91** -3.60** -2.84** -2.74** -3.12** -2.78** -2.21* -2.16*
Diff (H/L) t-stat 3.54** 5.00** 4.24** 3.35** 2.86** 3.95** 3.46** 2.64**
3.25** 4.46** 3.84** 3.42** 3.11** 3.55** 3.14** 2.79**
Diff (H/M) t-stats 1.53 1.44 1.41 1.80 0.05 0.98 1.01 1.50
0.60 1.22 0.98 1.00 0.63 1.07 0.85 0.90
Diff (M/L) t-stats 2.38* 3.91** 3.35** 2.00 2.82** 3.25** 2.84** 1.53 2.75** 3.55** 3.19** 2.62* 2.69** 2.78** 2.57* 2.07 This table reports average abnormal returns around and following the informed negative shocks by high/medium/low government budget appropriations or outlays on R&D as a percentage of GDP (GBOARD %), R&D expenditure as a percentage of GDP (RDEXPEND %), personnel and researchers in knowledge-intensive activities to total employment (EMPLOYMENT %) and patent applications per million inhabitants (PATENT). The t-statistics calculated using Equation (7) are used to test whether the CARS are significantly from zero. The standard t-tests are employed to test the differences between groups. ** and * denote statistical significance at the 1% and 5% significance levels, respectively.

31
Table 4 Determinants of Average Abnormal Returns on the Day of Informed Negative Shocks during the Crisis Period
Variable Model 1 Model 2 Model 3 Model 4 Model 5 Model 6 Model 7 Model 8
GBAORD 0.010
0.011
(3.75) **
(4.07) *
RDEXPEND 0.003
0.003
(5.15) **
(4.88) **
EMPLOY
0.004
0.004
(5.03) **
(4.73) **
PATENT
0.002
0.002
(3.24) **
(3.24) **
EXRATE 0.001 0.002 0.002 0.002 0.001 0.002 0.002 0.002
(0.56) (0.76) (0.75) (0.80) (0.67) (0.77) (0.76) (0.79)
INFLATION -0.019 -0.035 -0.033 -0.035
(-1.09) (-1.69) (-1.65) (-1.68)
CREDIT/GDP
0.002 0.002 0.002 0.002
(1.34) (1.15) (1.15) (1.42)
TRADEOPEN 0.001 0.001 0.001 0.001 0.001 0.002 0.002 0.002
(0.80) (0.86) (1.04) (0.84) (0.82) (0.87) (1.25) (1.07)
MV/GDP -0.003 -0.003 -0.003 -0.002 -0.004 -0.003 -0.003 -0.003
(-3.17) ** (-2.87) ** (-3.00) ** (-2.43) * (-3.31) ** (-2.90) * (-3.04) ** (-2.49) *
Constant -0.005 -0.004 -0.006 -0.001 -0.008 -0.008 -0.010 -0.005
(-1.59) (-1.69) (-2.40) * (-0.59) (-3.00) ** (-2.95) ** (-3.37) ** (-2.10) *
Obs 520 540 540 540 520 540 540 540
Adj R^2 0.18 0.19 0.19 0.18 0.18 0.19 0.19 0.18 This table shows the results of fixed effects panel regressions of the abnormal returns on the day of informed negative shocks for all the 27 European countries. Government budget appropriations or outlays on R&D as a percentage of GDP (GBOARD %), R&D expenditure as a percentage of GDP (RDEXPEND %), personnel and researchers in knowledge-intensive activities to total employment (EMPLOYMENT %), and patent applications per million inhabitants (PATENT) are innovation measures. TRADEOPEN is measured by import plus export as a percentage of GDP; EXRATE is the US Dollar value of the local currency; INFLATION is the annual inflation rate; CREDIT/GDP is the domestic Credit provided by banking sector as a percentage of GDP. MV/GDP is the market Capitalization of listed companies as a percentage of GDP. The t-statistics are shown in parentheses. ** and* denote statistical significance at the 1% and 5% significance levels, respectively.
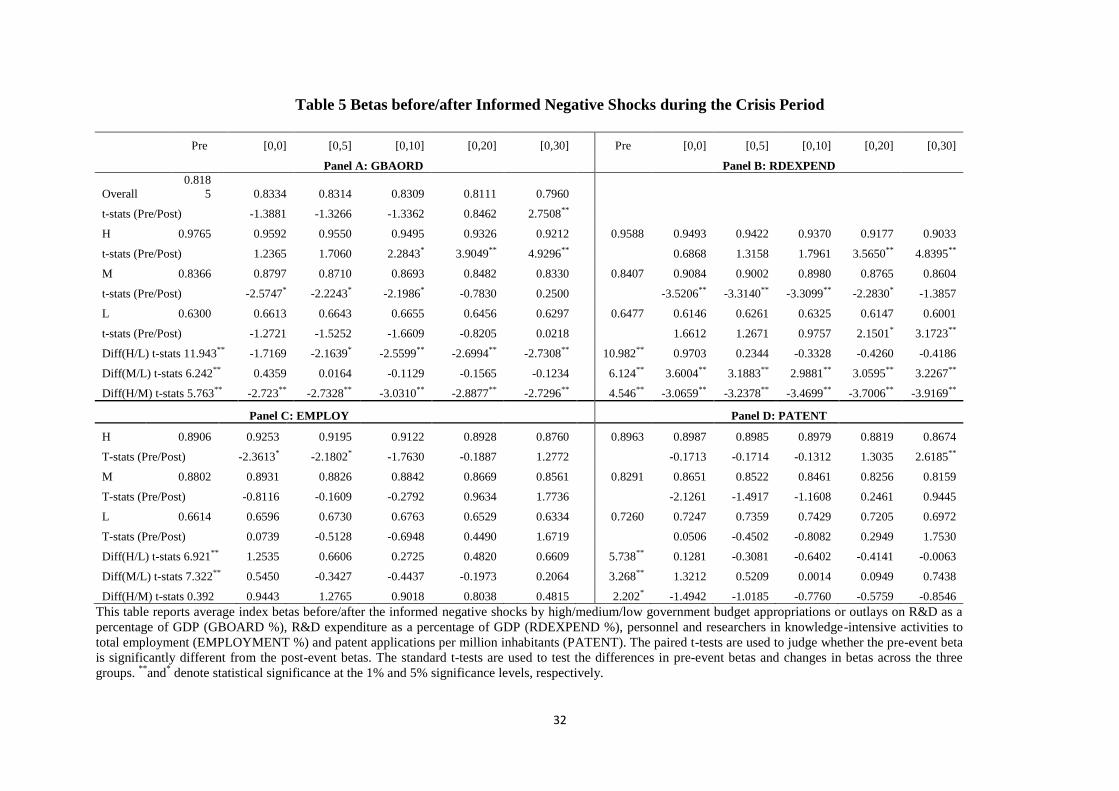
32
Table 5 Betas before/after Informed Negative Shocks during the Crisis Period
Pre [0,0] [0,5] [0,10] [0,20] [0,30]
Pre [0,0] [0,5] [0,10] [0,20] [0,30]
Panel A: GBAORD
Panel B: RDEXPEND
Overall 0.818
5 0.8334 0.8314 0.8309 0.8111 0.7960 t-stats (Pre/Post) -1.3881 -1.3266 -1.3362 0.8462 2.7508** H 0.9765 0.9592 0.9550 0.9495 0.9326 0.9212
0.9588 0.9493 0.9422 0.9370 0.9177 0.9033
t-stats (Pre/Post) 1.2365 1.7060 2.2843* 3.9049** 4.9296**
0.6868 1.3158 1.7961 3.5650** 4.8395**
M 0.8366 0.8797 0.8710 0.8693 0.8482 0.8330
0.8407 0.9084 0.9002 0.8980 0.8765 0.8604
t-stats (Pre/Post) -2.5747* -2.2243* -2.1986* -0.7830 0.2500
-3.5206** -3.3140** -3.3099** -2.2830* -1.3857
L 0.6300 0.6613 0.6643 0.6655 0.6456 0.6297
0.6477 0.6146 0.6261 0.6325 0.6147 0.6001
t-stats (Pre/Post) -1.2721 -1.5252 -1.6609 -0.8205 0.0218
1.6612 1.2671 0.9757 2.1501* 3.1723**
Diff(H/L) t-stats 11.943** -1.7169 -2.1639* -2.5599** -2.6994** -2.7308**
10.982** 0.9703 0.2344 -0.3328 -0.4260 -0.4186
Diff(M/L) t-stats 6.242** 0.4359 0.0164 -0.1129 -0.1565 -0.1234
6.124** 3.6004** 3.1883** 2.9881** 3.0595** 3.2267**
Diff(H/M) t-stats 5.763** -2.723** -2.7328** -3.0310** -2.8877** -2.7296**
4.546** -3.0659** -3.2378** -3.4699** -3.7006** -3.9169**
Panel C: EMPLOY Panel D: PATENT
H 0.8906 0.9253 0.9195 0.9122 0.8928 0.8760
0.8963 0.8987 0.8985 0.8979 0.8819 0.8674
T-stats (Pre/Post) -2.3613* -2.1802* -1.7630 -0.1887 1.2772
-0.1713 -0.1714 -0.1312 1.3035 2.6185**
M 0.8802 0.8931 0.8826 0.8842 0.8669 0.8561
0.8291 0.8651 0.8522 0.8461 0.8256 0.8159
T-stats (Pre/Post) -0.8116 -0.1609 -0.2792 0.9634 1.7736
-2.1261 -1.4917 -1.1608 0.2461 0.9445
L 0.6614 0.6596 0.6730 0.6763 0.6529 0.6334
0.7260 0.7247 0.7359 0.7429 0.7205 0.6972
T-stats (Pre/Post) 0.0739 -0.5128 -0.6948 0.4490 1.6719
0.0506 -0.4502 -0.8082 0.2949 1.7530
Diff(H/L) t-stats 6.921** 1.2535 0.6606 0.2725 0.4820 0.6609
5.738** 0.1281 -0.3081 -0.6402 -0.4141 -0.0063
Diff(M/L) t-stats 7.322** 0.5450 -0.3427 -0.4437 -0.1973 0.2064
3.268** 1.3212 0.5209 0.0014 0.0949 0.7438
Diff(H/M) t-stats 0.392 0.9443 1.2765 0.9018 0.8038 0.4815
2.202* -1.4942 -1.0185 -0.7760 -0.5759 -0.8546 This table reports average index betas before/after the informed negative shocks by high/medium/low government budget appropriations or outlays on R&D as a percentage of GDP (GBOARD %), R&D expenditure as a percentage of GDP (RDEXPEND %), personnel and researchers in knowledge-intensive activities to total employment (EMPLOYMENT %) and patent applications per million inhabitants (PATENT). The paired t-tests are used to judge whether the pre-event beta is significantly different from the post-event betas. The standard t-tests are used to test the differences in pre-event betas and changes in betas across the three groups. ** and* denote statistical significance at the 1% and 5% significance levels, respectively.

33
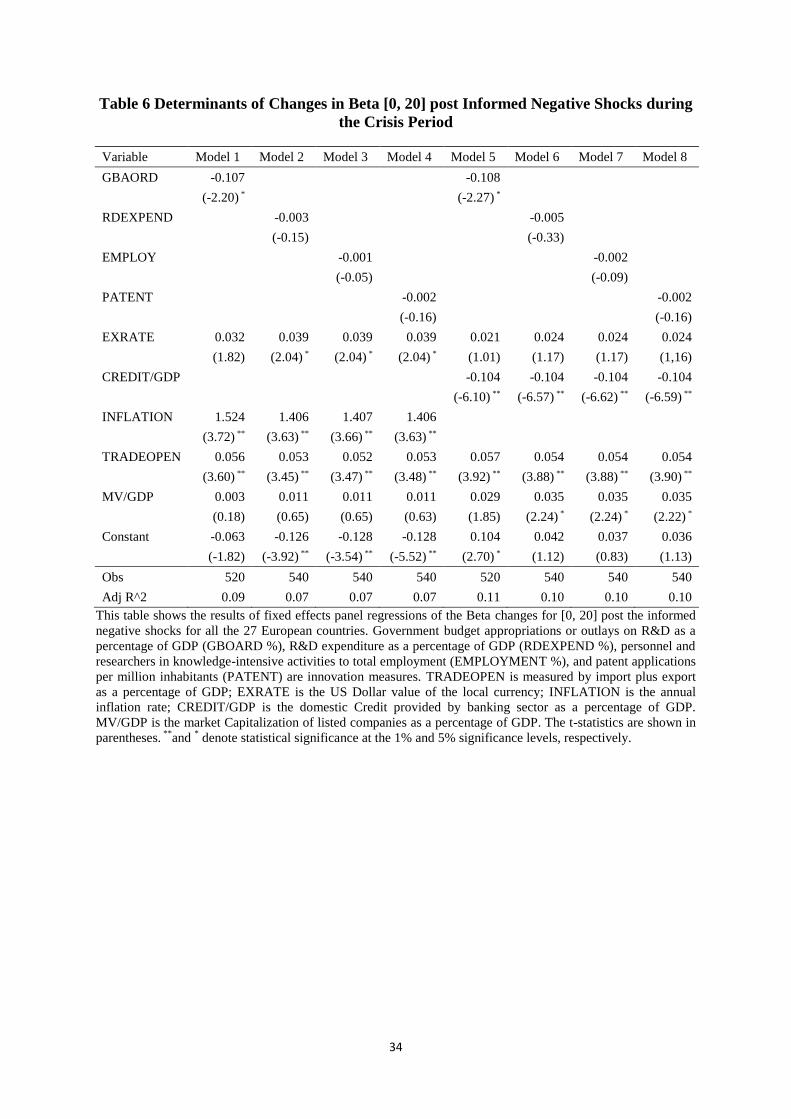
34
Table 6 Determinants of Changes in Beta [0, 20] post Informed Negative Shocks during the Crisis Period
Variable Model 1 Model 2 Model 3 Model 4 Model 5 Model 6 Model 7 Model 8
GBAORD -0.107
-0.108
(-2.20) *
(-2.27) *
RDEXPEND
-0.003
-0.005
(-0.15)
(-0.33)
EMPLOY
-0.001
-0.002
(-0.05)
(-0.09)
PATENT
-0.002
-0.002
(-0.16)
(-0.16)
EXRATE 0.032 0.039 0.039 0.039 0.021 0.024 0.024 0.024
(1.82) (2.04) * (2.04) * (2.04) * (1.01) (1.17) (1.17) (1,16)
CREDIT/GDP
-0.104 -0.104 -0.104 -0.104
(-6.10) ** (-6.57) ** (-6.62) ** (-6.59) **
INFLATION 1.524 1.406 1.407 1.406
(3.72) ** (3.63) ** (3.66) ** (3.63) **
TRADEOPEN 0.056 0.053 0.052 0.053 0.057 0.054 0.054 0.054
(3.60) ** (3.45) ** (3.47) ** (3.48) ** (3.92) ** (3.88) ** (3.88) ** (3.90) **
MV/GDP 0.003 0.011 0.011 0.011 0.029 0.035 0.035 0.035
(0.18) (0.65) (0.65) (0.63) (1.85) (2.24) * (2.24) * (2.22) *
Constant -0.063 -0.126 -0.128 -0.128 0.104 0.042 0.037 0.036
(-1.82) (-3.92) ** (-3.54) ** (-5.52) ** (2.70) * (1.12) (0.83) (1.13)
Obs 520 540 540 540 520 540 540 540
Adj R^2 0.09 0.07 0.07 0.07 0.11 0.10 0.10 0.10 This table shows the results of fixed effects panel regressions of the Beta changes for [0, 20] post the informed negative shocks for all the 27 European countries. Government budget appropriations or outlays on R&D as a percentage of GDP (GBOARD %), R&D expenditure as a percentage of GDP (RDEXPEND %), personnel and researchers in knowledge-intensive activities to total employment (EMPLOYMENT %), and patent applications per million inhabitants (PATENT) are innovation measures. TRADEOPEN is measured by import plus export as a percentage of GDP; EXRATE is the US Dollar value of the local currency; INFLATION is the annual inflation rate; CREDIT/GDP is the domestic Credit provided by banking sector as a percentage of GDP. MV/GDP is the market Capitalization of listed companies as a percentage of GDP. The t-statistics are shown in parentheses. ** and * denote statistical significance at the 1% and 5% significance levels, respectively.
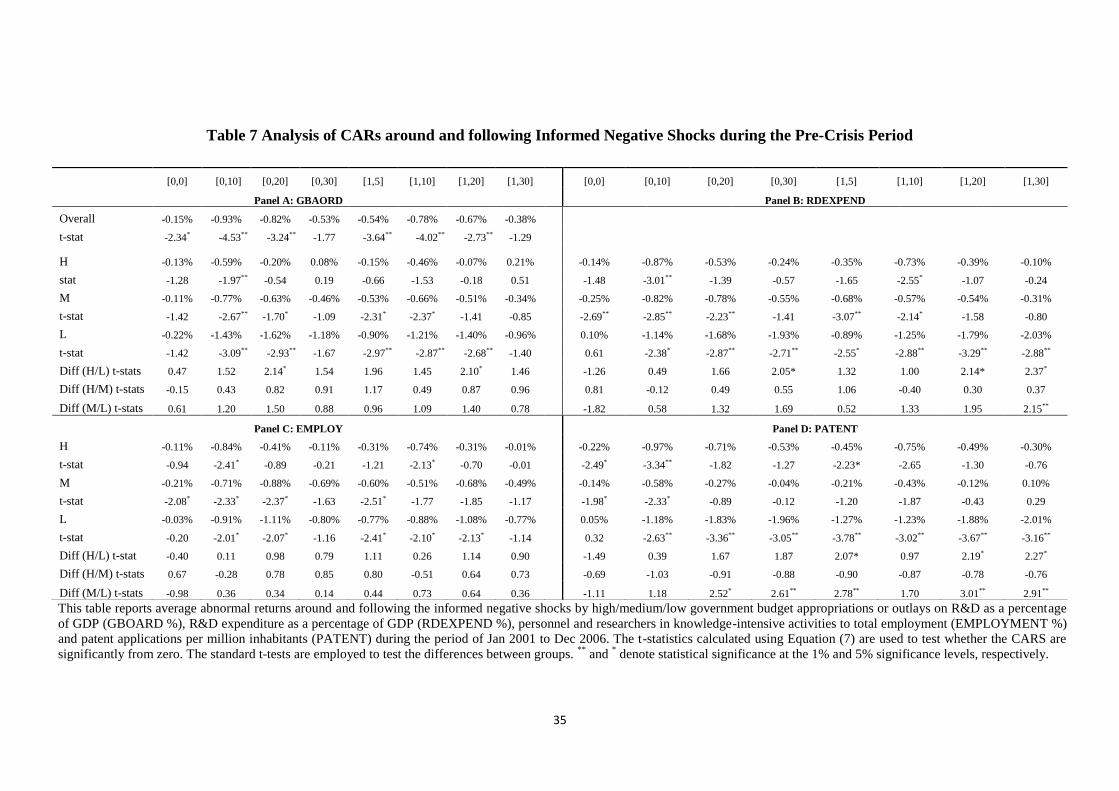
35
Table 7 Analysis of CARs around and following Informed Negative Shocks during the Pre-Crisis Period
This table reports average abnormal returns around and following the informed negative shocks by high/medium/low government budget appropriations or outlays on R&D as a percentage of GDP (GBOARD %), R&D expenditure as a percentage of GDP (RDEXPEND %), personnel and researchers in knowledge-intensive activities to total employment (EMPLOYMENT %) and patent applications per million inhabitants (PATENT) during the period of Jan 2001 to Dec 2006. The t-statistics calculated using Equation (7) are used to test whether the CARS are significantly from zero. The standard t-tests are employed to test the differences between groups. ** and * denote statistical significance at the 1% and 5% significance levels, respectively.
[0,0] [0,10] [0,20] [0,30] [1,5] [1,10] [1,20] [1,30]
[0,0] [0,10] [0,20] [0,30] [1,5] [1,10] [1,20] [1,30]
Panel A: GBAORD
Panel B: RDEXPEND
Overall -0.15% -0.93% -0.82% -0.53% -0.54% -0.78% -0.67% -0.38% t-stat -2.34* -4.53** -3.24** -1.77 -3.64** -4.02** -2.73** -1.29
H -0.13% -0.59% -0.20% 0.08% -0.15% -0.46% -0.07% 0.21%
-0.14% -0.87% -0.53% -0.24% -0.35% -0.73% -0.39% -0.10%
stat -1.28 -1.97** -0.54 0.19 -0.66 -1.53 -0.18 0.51
-1.48 -3.01** -1.39 -0.57 -1.65 -2.55* -1.07 -0.24
M -0.11% -0.77% -0.63% -0.46% -0.53% -0.66% -0.51% -0.34%
-0.25% -0.82% -0.78% -0.55% -0.68% -0.57% -0.54% -0.31%
t-stat -1.42 -2.67** -1.70* -1.09 -2.31* -2.37* -1.41 -0.85
-2.69** -2.85** -2.23** -1.41 -3.07** -2.14* -1.58 -0.80
L -0.22% -1.43% -1.62% -1.18% -0.90% -1.21% -1.40% -0.96%
0.10% -1.14% -1.68% -1.93% -0.89% -1.25% -1.79% -2.03%
t-stat -1.42 -3.09** -2.93** -1.67 -2.97** -2.87** -2.68** -1.40
0.61 -2.38* -2.87** -2.71** -2.55* -2.88** -3.29** -2.88**
Diff (H/L) t-stats 0.47 1.52 2.14* 1.54 1.96 1.45 2.10* 1.46
-1.26 0.49 1.66 2.05* 1.32 1.00 2.14* 2.37*
Diff (H/M) t-stats -0.15 0.43 0.82 0.91 1.17 0.49 0.87 0.96
0.81 -0.12 0.49 0.55 1.06 -0.40 0.30 0.37
Diff (M/L) t-stats 0.61 1.20 1.50 0.88 0.96 1.09 1.40 0.78
-1.82 0.58 1.32 1.69 0.52 1.33 1.95 2.15**
Panel C: EMPLOY
Panel D: PATENT
H -0.11% -0.84% -0.41% -0.11% -0.31% -0.74% -0.31% -0.01%
-0.22% -0.97% -0.71% -0.53% -0.45% -0.75% -0.49% -0.30%
t-stat -0.94 -2.41* -0.89 -0.21 -1.21 -2.13* -0.70 -0.01
-2.49* -3.34** -1.82 -1.27 -2.23* -2.65 -1.30 -0.76
M -0.21% -0.71% -0.88% -0.69% -0.60% -0.51% -0.68% -0.49%
-0.14% -0.58% -0.27% -0.04% -0.21% -0.43% -0.12% 0.10%
t-stat -2.08* -2.33* -2.37* -1.63 -2.51* -1.77 -1.85 -1.17
-1.98* -2.33* -0.89 -0.12 -1.20 -1.87 -0.43 0.29
L -0.03% -0.91% -1.11% -0.80% -0.77% -0.88% -1.08% -0.77%
0.05% -1.18% -1.83% -1.96% -1.27% -1.23% -1.88% -2.01%
t-stat -0.20 -2.01* -2.07* -1.16 -2.41* -2.10* -2.13* -1.14
0.32 -2.63** -3.36** -3.05** -3.78** -3.02** -3.67** -3.16**
Diff (H/L) t-stat -0.40 0.11 0.98 0.79 1.11 0.26 1.14 0.90
-1.49 0.39 1.67 1.87 2.07* 0.97 2.19* 2.27*
Diff (H/M) t-stats 0.67 -0.28 0.78 0.85 0.80 -0.51 0.64 0.73
-0.69 -1.03 -0.91 -0.88 -0.90 -0.87 -0.78 -0.76
Diff (M/L) t-stats -0.98 0.36 0.34 0.14 0.44 0.73 0.64 0.36
-1.11 1.18 2.52* 2.61** 2.78** 1.70 3.01** 2.91**
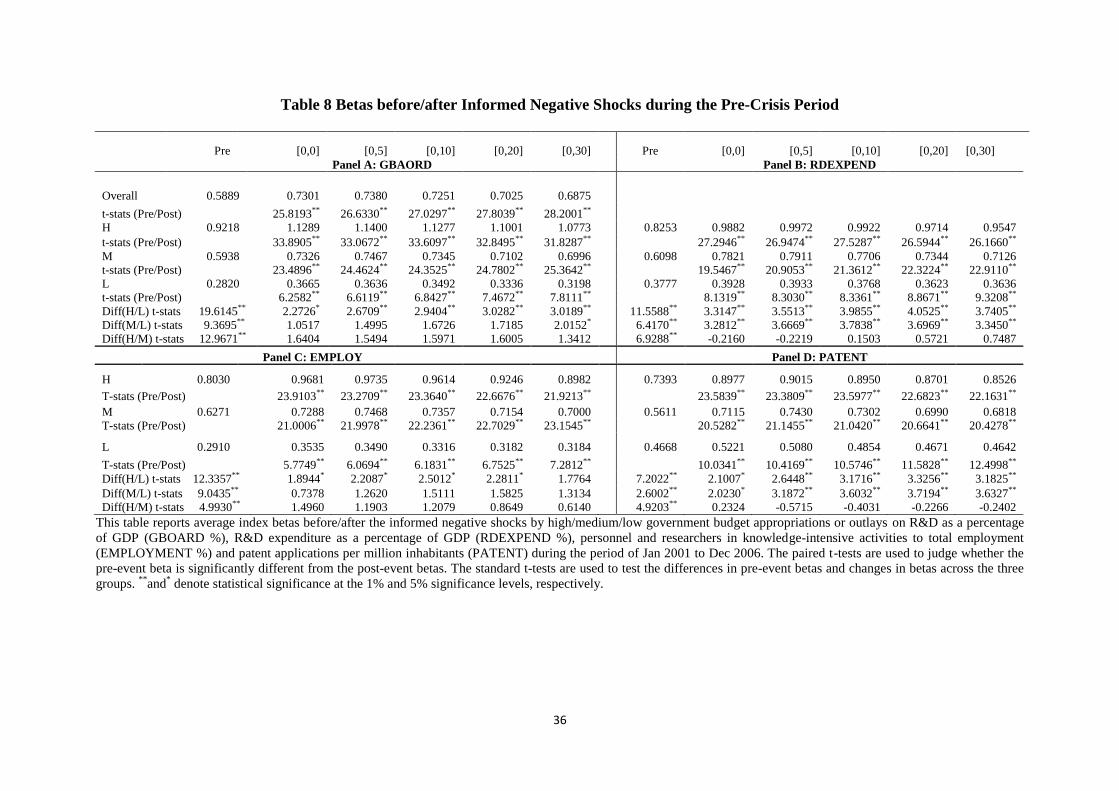
36
Table 8 Betas before/after Informed Negative Shocks during the Pre-Crisis Period
Pre [0,0] [0,5] [0,10] [0,20] [0,30]
Pre [0,0] [0,5] [0,10] [0,20] [0,30]
Panel A: GBAORD
Panel B: RDEXPEND
Overall 0.5889 0.7301 0.7380 0.7251 0.7025 0.6875
t-stats (Pre/Post) 25.8193** 26.6330** 27.0297** 27.8039** 28.2001**
H 0.9218 1.1289 1.1400 1.1277 1.1001 1.0773 0.8253 0.9882 0.9972 0.9922 0.9714 0.9547 t-stats (Pre/Post) 33.8905** 33.0672** 33.6097** 32.8495** 31.8287**
27.2946** 26.9474** 27.5287** 26.5944** 26.1660**
M 0.5938 0.7326 0.7467 0.7345 0.7102 0.6996 0.6098 0.7821 0.7911 0.7706 0.7344 0.7126 t-stats (Pre/Post) 23.4896** 24.4624** 24.3525** 24.7802** 25.3642**
19.5467** 20.9053** 21.3612** 22.3224** 22.9110**
L 0.2820 0.3665 0.3636 0.3492 0.3336 0.3198 0.3777 0.3928 0.3933 0.3768 0.3623 0.3636 t-stats (Pre/Post) 6.2582** 6.6119** 6.8427** 7.4672** 7.8111**
8.1319** 8.3030** 8.3361** 8.8671** 9.3208**
Diff(H/L) t-stats 19.6145** 2.2726* 2.6709** 2.9404** 3.0282** 3.0189** 11.5588** 3.3147** 3.5513** 3.9855** 4.0525** 3.7405** Diff(M/L) t-stats 9.3695** 1.0517 1.4995 1.6726 1.7185 2.0152* 6.4170** 3.2812** 3.6669** 3.7838** 3.6969** 3.3450** Diff(H/M) t-stats 12.9671** 1.6404 1.5494 1.5971 1.6005 1.3412 6.9288** -0.2160 -0.2219 0.1503 0.5721 0.7487
Panel C: EMPLOY Panel D: PATENT
H 0.8030 0.9681 0.9735 0.9614 0.9246 0.8982
0.7393 0.8977 0.9015 0.8950 0.8701 0.8526
T-stats (Pre/Post) 23.9103** 23.2709** 23.3640** 22.6676** 21.9213**
23.5839** 23.3809** 23.5977** 22.6823** 22.1631** M 0.6271 0.7288 0.7468 0.7357 0.7154 0.7000
0.5611 0.7115 0.7430 0.7302 0.6990 0.6818
T-stats (Pre/Post) 21.0006** 21.9978** 22.2361** 22.7029** 23.1545**
20.5282** 21.1455** 21.0420** 20.6641** 20.4278**
L 0.2910 0.3535 0.3490 0.3316 0.3182 0.3184
0.4668 0.5221 0.5080 0.4854 0.4671 0.4642
T-stats (Pre/Post) 5.7749** 6.0694** 6.1831** 6.7525** 7.2812**
10.0341** 10.4169** 10.5746** 11.5828** 12.4998** Diff(H/L) t-stats 12.3357** 1.8944* 2.2087* 2.5012* 2.2811* 1.7764
7.2022** 2.1007* 2.6448** 3.1716** 3.3256** 3.1825**
Diff(M/L) t-stats 9.0435** 0.7378 1.2620 1.5111 1.5825 1.3134
2.6002** 2.0230* 3.1872** 3.6032** 3.7194** 3.6327** Diff(H/M) t-stats 4.9930** 1.4960 1.1903 1.2079 0.8649 0.6140
4.9203** 0.2324 -0.5715 -0.4031 -0.2266 -0.2402
This table reports average index betas before/after the informed negative shocks by high/medium/low government budget appropriations or outlays on R&D as a percentage of GDP (GBOARD %), R&D expenditure as a percentage of GDP (RDEXPEND %), personnel and researchers in knowledge-intensive activities to total employment (EMPLOYMENT %) and patent applications per million inhabitants (PATENT) during the period of Jan 2001 to Dec 2006. The paired t-tests are used to judge whether the pre-event beta is significantly different from the post-event betas. The standard t-tests are used to test the differences in pre-event betas and changes in betas across the three groups. ** and* denote statistical significance at the 1% and 5% significance levels, respectively.
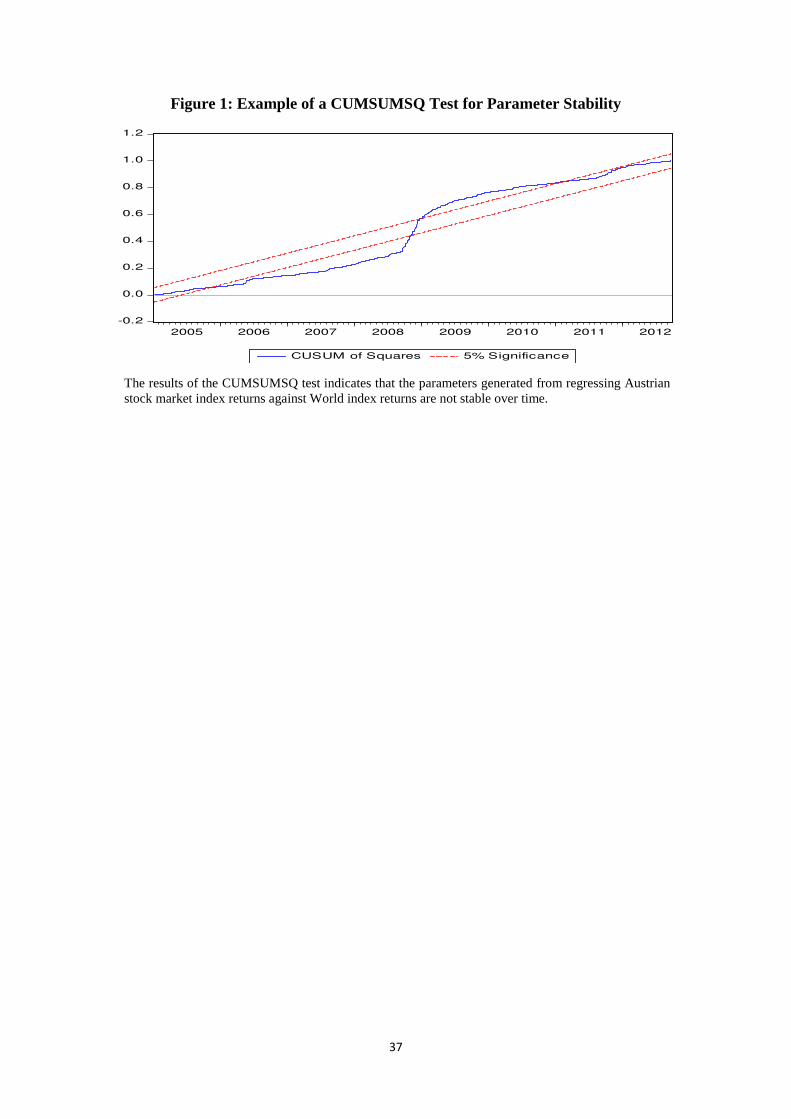
37
Figure 1: Example of a CUMSUMSQ Test for Parameter Stability
The results of the CUMSUMSQ test indicates that the parameters generated from regressing Austrian stock market index returns against World index returns are not stable over time.
-0.2
0.0
0.2
0.4
0.6
0.8
1.0
1.2
2005 2006 2007 2008 2009 2010 2011 2012
CUSUM of Squares 5% Significance