Embed Size (px)
Citation preview

90
Szarowská, I., (2017). Does public R&D expenditure matter for economic growth? GMM approach. Journal of International Studies, 10(2), 90-103. doi:10.14254/2071-8330.2017/10-2/6
Does public R&D expenditure matter for economic growth? GMM approach
Irena Szarowská
School of Business Administration, Silesian University,
Karviná, Czech Republic
Email: [email protected]
Abstract. The aim of the paper is to quantify the impact of public research and
development (R&D) expenditure on economic growth. The empirical evidence
focuses on the 20 selected EU member states in the period of 1995-2013. The
research is based on a dynamic panel regression model (Generalized Method of
Moments). The results confirm positive and statistically significant impact of
government R&D expenditure, which is the main driver for economic growth
during the analysed period. Contrary, business expenditure on the same is found
to be insignificant. Traditional growth variables (higher share of qualified human
resources and higher intensity of investments) report the positive effects,
although in the case of investments – only partial one. The significance for R&D
coefficient remains robust to different sub-periods.
Keywords: research and development, economic growth, direct funding, incentives,
GMM.
JEL Classification: O38, H25, F63
Received: May, 2016
1st Revision: January, 2017
Accepted: May, 2017
DOI: 10.14254/2071-
8330.2017/10-2/6
1. INTRODUCTION
Research and development (R&D) is of crucial importance in creation of knowledge, products and
technologies as has been recognised in (Solow, 1956; Köhler et al., 2012; OECD, 2012; Szarowská 2013,
2016; Halásková & Halásková 2015, Freimane & Bāliņa 2016; Marcelino-Jesus et al. 2017). Generally,
governments have three main instruments for financing R&D (own R&D, direct and indirect funding), each
having advantages and disadvantages from the perspective of economic theory (David et al., 2000). Direct
support is more focused on long-term research, while indirect channnels primarily support short-term
applied research and increase incremental innovations (Westmore, 2013). The European Commission
(2003) reports that most OECD/EU member countries apply a mix of direct and indirect measures to
support R&D. Several countries have introduced or extended fiscal instruments to support R&D. Indirect
fiscal R&D incentives reduce the costs of R&D for a wide variety of firms, including SMEs. Fiscal incentives
are recommended to be used to support private R&D because these schemes have the potential to address
a wide range of firms, including SMEs, and leave the decision as to the contents of the research to their
Journal
of International Studies
Sci
enti
fic
Pap
ers
© Foundation of International
Studies, 2017 © CSR, 2017

Irena Szarowská
Does public R&D expenditure matter for economic growth? GMM approach
91
discretion. If well designed, fiscal schemes can contribute to raising the overall level of in-vestment in
business R&D.
The financial crisis obliged many governments to introduce tough fiscal consolidation measures,
prioritizing other issues over R&D. In 2012 the share of public R&D expenditure in the total government
expenditure was lower than in 2007 for half of the EU member states (OECD, 2012). On the other hand,
Hud and Hussinger (2015) pointed out that in order to prevent firms from reducing their R&D expenses
and maintain the national R&D capacities, policymakers in many countries reacted immediately to the crisis
and increased the public R&D budgets. Anyway, limited financial resources and pressure to balance
expenditure on innovation against expenditure on other policies force the governments to look for newer
instruments.
The aim of the paper is to examine and quantify the impact of public R&D expenditure on economic
growth in the selected European Union (EU) member states in the period of 1995–2013. The paper
summarizes direct and indirect public funding instruments for R&D used in the EU countries and analyzes
the impact of R&D expenditure and tax incentives on GDP growth. Basic source of data here is the Eurostat
database, which is complemented by information from the OECD. The article is organized as follows. The
next section presents theoretical background and the literature review. The following chapter introduces
methodology and data. The empirical part is focused on basic forms of funding R&D as well as testing and
quantifying impact of R&D expenditure on economic growth. Conclusion summarizes main findings.
2. THEORETICAL BACKGROUND
The neoclassical growth model known as Solow-Swan model (1956) considers the long-run economic
growth. This model explains the economic growth with the capital accumulation, productivity, population
growth and technological progress as the dominant drivers of economic growth. The model recognized the
significance of the positive impact of technology on growth, but it is considered as exogenous. Next, the
development of endogenous growth theory has provided many new visions into the sources of economic
growth. Dzambaska (2013) points out, the essence of the new theory is that growth is an effect of rational
economic decisions.
Barro and Sala-i-Martin (2003) modelled technological progress as an expansion of the variety of
intermediate goods used by producers. The rate of growth depends on various characteristics of preferences
and technology, including the willingness to save, the level of the production function, the cost of R&D,
and the scale of the economy (measured by the quantity of a fixed factor, such as raw labor or human
capital). Some alternative specifications of the R&D technology can preserve most of the growth
implications while eliminating the apparently counterfactual scale effects. Barro and Sala-i-Martin´s
equilibrium growth rate in the model corresponds to the exogenous rate of technological change in the
Solow–Swan (1956) models. They note that if the diffusion of ideas from one country to an-other is rapid,
the model explains why the technology in all countries would improve over time. Therefore, the model can
explain why the long-term growth rate of the world’ s real per capita GDP would be positive.
Steger (2005) writes that growth models which focus on R&D are used for explaining sustained
economic growth in industrialized countries. The first generation of R&D-based growth models suffered
from the scale effect, according to which the long-run growth rate increases with the size of the economy.
A second generation of R&D-based growth models have been developed, which are not spurred by the
scale effect – so called non-scale growth models. The second generation of R&D-based growth models
implies a strong ineffective-ness proposition, according to which public policy is powerless to affect the

Journal of International Studies
Vol.10, No.2, 2017
92
long-run growth rate. Perez-Sebastian (2007) notes that even policy in Jones-type non-scale models (1995)
has no long-run growth effects and level effects can be substantial.
Svennson (2008) presents an overview of the economic literature on the relationships between R&D
investments and economic growth. He discusses positives and negatives of different types of public funding
of R&D and analyses what differentiates R&D from other forms of input and why spillover effects occur.
Becker’s study (2015) offers the most systematic review and critical discussion focused on R&D literature
(more than 120 papers). She gives attention especially to mutual comparision between conclusions of
published studies.
The empirical evidence is often focus on studies that econometrically analyse the impact of R&D tax
incentives on key policy goals of the instrument. Since a primary goal of R&D tax incentives is to raise R&D
spending by enterprises, most studies look at input additionality, i.e. the change in private R&D expenditure
that can be attributed to the tax incentive (Castellacci & Lie, 2015; Ientile & Mairesse, 2009). Some of studies
were official evaluations commissioned by governments and conducted as part of policy implementation
(Faria et al., 2011). The studies are typically based on firm-level panel data and either cover periods before
and after the introduction of a tax incentive, or they analyse the effects of changes in the generosity of R&D
tax incentives. E.g. Hall and Van Reenen (2000) study the econometric evidence on the effectiveness of
fiscal incentives for R&D. In imperfect state of knowledge, they conclude that a dollar in tax credit for R&D
stimulates a dollar of additional R&D.
Guellec and de la Potterie (2004) introduce factors important for the growth. These factors are the
absorptive capability, the origin of funding, the socioeconomic objectives of government support, and the
type of public institutions that perform R&D. Garland and Allen (1995) analyze the relative importance of
public and private R&D in the economic growth of different countries. They confirm that private R&D has
a greater impact on growth than public R&D, which is to a large degree devoted to basic research. Bilbao-
Osorio and Rodriguez-Pose (2004) present results which indicate that R&D investment, as a whole, and
higher education R&D investment in peripheral regions of the EU, in particular, are positively associated
with innovation. The existence and strength of this association are, however, contingent upon region-
specific socio-economic characteristics, which affect the capacity of each region to transform R&D
investment into innovation and, eventually, innovation into economic growth.
Berliant and Fujita (2011) state that long-run economic growth is positively related to the effectiveness
of pairwise R&D worker interaction and to the effectiveness of public knowledge transmission. Kim (2011)
investigates the effect of R&D stock for economic growth during the years 1976–2009. Guadalupi et al.
(2013) also confirm the hypothesis that the technological change stimulates the economic growth. Especially
the less advanced EU regions, in which the public expenditure in R&D is higher, report the higher GDP
growth rate.
Silaghi et al. (2014) empirically estimate the role of private and public R&D for growth of Central and
Eastern European Countries during 1998–2008 and public R&D is found to be statistically insignificant.
Brautzsch et al. (2015) analyze the macroeconomic effects of R&D subsidies in the business cycle. Their
findings suggest that the R&D program counter-acts the decline of GDP by 0.5%. Compared to the strongly
discussed alternative uses of subsidies for private consumption, R&D spending is more effective.
Köhler et al. (2012) summarize results of 18 published papers and note that regardless of a growing
number of studies on the effect of R&D expenditure and tax incentives, the knowledge about the
effectiveness of R&D expenditure and how a scheme should be de-signed to maximise its impact, remains
limited.
Bilas et al. (2016) note the issues of economic growth and development are constantly re-evaluated,
especially after occurrence and severe consequences of the economic and financial crisis of 2008-2009. They

Irena Szarowská
Does public R&D expenditure matter for economic growth? GMM approach
93
use dynamic panel data and panel generalized method of moments as an estimator and find out that Gross
domestic expenditure on R&D on average depends on gross domestic expenditure on R&D previous year
with coefficient 0.77 and on annual GDP per capita growth rate with coefficient -0.0073.
Recently, Afonso and Sarabanda (2017) extend the existing R&D growth literature by focusing on the
short-medium-long run effects of the informal sector on R&D intensity, wage inequality and economic
growth by considering 18 OECD countries between 1990 and 2008 and they show that the steady state is
unique and stable; the share of informal economy in production affects negatively R&D intensity and wage
equality.
In accordance with presented papers and empirical studies, it can be concluded that literature offers
support for all ideas about importance and impact of R&D on economic growth – positive, negative and
zero. The variety of findings is generated due to differences used in econometric models, country samples,
observation period and considered variables. Therefore, the aim of the article is to quantify impact of public
R&D expenditure on economic growth in selected EU member states.
3. RESEARCH METHODOLOGY AND DATA
The empirical analysis is based on the methodology of Barro and Sala-i-Martin (2003), which is adapted
to the framework of this study. Empirical evidence is based on unbalanced annual panel data of the EU
member states in a period 1995–2013 (the longest available time series). The sample selection is limited by
the availability of data. That’s why, the empirical evidence is performed for 20 EU countries, namely Belgium
(BE), Bulgaria (BG), Czech Republic (CZ), Denmark (DK), Germany (DE), Ireland (IE), Spain (ES),
Finland (FI), France (FR), Hungary (HU), Italy (IT), Latvia (LV), Netherlands (NL), Poland (PO), Portugal
(PT), Romania (RO), Slovak Republic (SK), Slovenia (SI), Sweden (SE) and United Kingdom (UK).
In order to test whether R&D expenditure matters for economic performance, there are estimated
econometric models. The basic dynamic panel model is defined in (1):
GDPit = β0 + β1 GDPit-1 + β2 GERDit + β3 INVit + β4 HRSTit + εit, (1)
where β1 to β4 contain the coefficients assigned to the independent variables, and β0 is a constant, the
subscript t indexes the year, i country. GDP means GDP growth per capita expressed by the amount of
GDP per capita in purchasing power parity (EU28), the series for GDP are converted into logs. GERD
means Gross domestic expenditure on R&D, INV is expressing investment ratio on the GDP, HRST as a
share of the active population classified as HRST (i.e. having successfully completed an education at the
third level or being employed in science and technology) as a percentage of total active population aged 15–
74, and ε is the error term. R&D expenditure are expressed not only as GERD, but also split its main
components: business R&D (BUSINESS), and government (GOV) as well as higher education (EDU)
R&D expenditure which make up public R&D. In this way it is possible to assess which types of activities
has an effect on economic growth.
From a methodological perspective, the research is based on a dynamic panel regression model.
Compared to the cross-sectional analyses, the panel regression has a very important option of including
individual effects (i.e. the existence of heterogeneity across cross-sectional units). This makes presented
evidence more credible, given the relatively small number of countries and short time series. Estimations
are based on dynamic panel data estimators using the differenced Generalized Method of Moments (GMM)
with Arellano-Bond type instruments (Arellano & Bond, 1991):

Journal of International Studies
Vol.10, No.2, 2017
94
lnGDPit = β1 lnGDPit-1 + β2 dGERDit + β3 dINVit + β4dHRSTit + εit (2)
where d denotes first difference of a variable. Correlation of the residuals and endogeneity problem is
corrected by instrumenting dGDPit-1 with various dependent variable lags, different lag combinations were
used to test robustness of results, and outcomes were mainly quite similar. Hence, the below models include
a lag of one period and fixed effects as is usual in this type of studies (Perez-Sebastian, 2007; Silaghi et al.,
2014). The software E-Views (9) is used for estimations.
The GMM is a generic method for estimating parameters in statistical models. Usually it is applied in
the context of semi parametric models, where the parameter of interest is finite-dimensional, whereas the
full shape of the distribution function of the data may not be known. GMM is popular in estimating
structural economic models, as it requires much less conditions on model disturbances than Maximum
Likelihood. Another important advantage is that it is easy to obtain parameter estimates that are robust to
heteroscedasticity of un-known form (Hansen, 1982). For a model specification, Dynamic Panel Data Model
Wizard is applied. The wizard aids in specifying members of the class of dynamic panel data models with
fixed effects. Arellano and Bond (1991) designed models for panels with a large number of cross-sections
and a shorter time series.
Many studies point out that using non-stationary macroeconomic variable in time series analysis causes
superiority problems in regression. Thus, a unit root test should precede any empirical study employing such
variables. Recent literature suggests that panel-based unit root tests have higher power than unit root tests
based on individual time series. Panel unit root tests are similar, but not identical, to unit root tests carried
out on a single series (Verbeek, 2000). Used panel unit root tests (Levin, Lin, & Chu, 2002; Breitung, 2000;
Im, Pesaran, & Shin, 2003; Fisher-type tests using ADF and Fisher PP tests) confirm the stationary of all
time series on the first difference (except GDP, which is stationary on level data), results are available on
request.
4. RESULTS AND DISCUSSION
Financial support of R&D
It is known that R&D is fundamental for the knowledge-based economies’ competitiveness and
support of R&D and innovation is also a political measure. In line with Lisbon strategy and Europe 2020
targets, investment in European R&D should be raised to 3% of GDP but this target was not reached yet.
Gross domestic expenditure on R&D (GERD) is total intra-mural expenditure on R&D performed on the
national territory during a given period. GERD includes R&D performed within a country and funded from
abroad but excludes payments for R&D performed abroad. GERD is usually reported for sectors of
performance: business enterprise, higher education, government and private not-for-profit institutions
serving households. Average EU-28’s R&D expenditure was 2.02% GDP (Eurostat database and OECD,
2014). The importance of the source of funding has been recognized in one of the Barcelona targets of the
Lisbon agenda where it is said that the appropriate split for R&D is 1/3 financed by public funds and 2/3
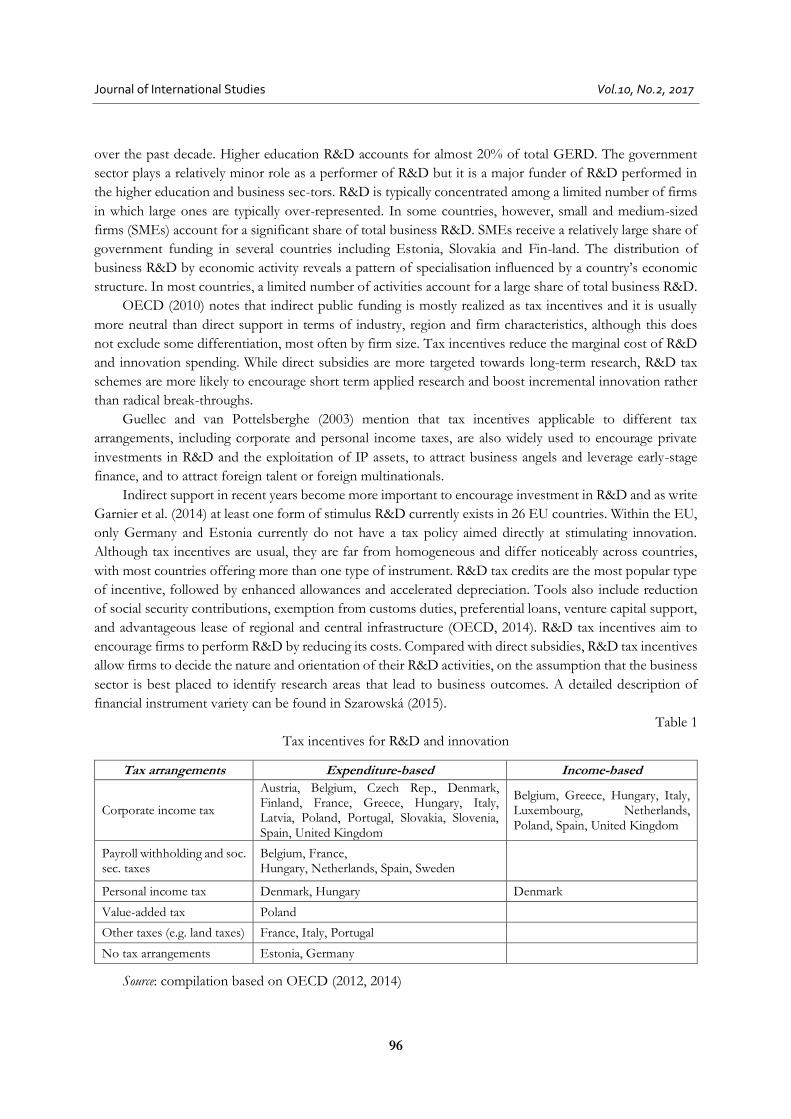
by private (European Commission, 2013). Figure 1 shows total R&D expenditure (GERD) divided into
performing sectors in 2013 (the latest available time serie).

Irena Szarowská
Does public R&D expenditure matter for economic growth? GMM approach
95
Figure 1. R&D expenditure by performing sectors
Source: author’s compilation based on OECD data
Business enterprise expenditure on R&D (BERD) records gross expenditures on R&D performed by
all firms, organisations and institutions whose primary activity is the production of goods and services for
sale to the general public, and the private non-profit institutions mainly serving them. Government-funded
business R&D is the component of R&D performed by business enterprises attributed to direct government
funding. It includes grants and payments for R&D contracts for procurement, but not R&D tax incentives,
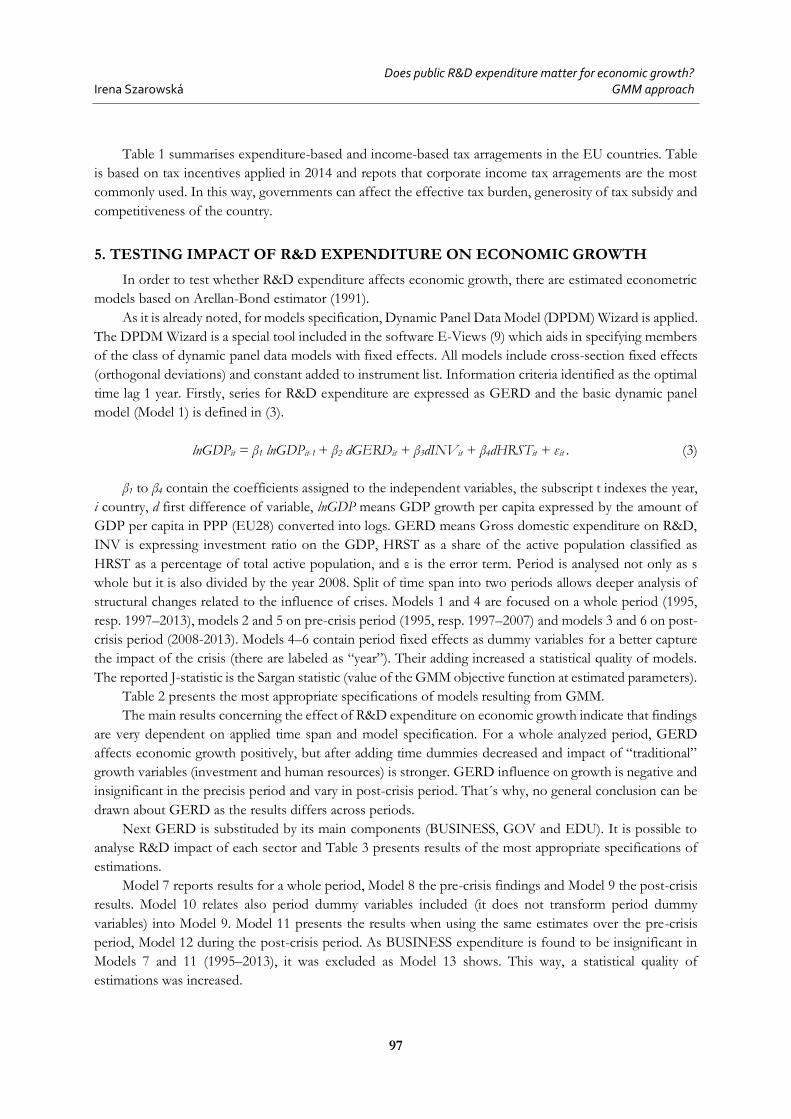
repayable loans or equity investments. Figure 2 presents a share of direct and indirect public funding of
business R&D expenditure in 2013.
Figure 2. Direct and indirect government funding of BERD in % GDP
Source: author’s compilation based on OECD data
As OECD (2015) reports, the business sector accounts for the largest share of R&D per-formed in
most economies and more than 60% of expenditure on R&D (GERD). This share has remained fairly stable
0
10
20
30
40
50
60
70
80
90
100
SI IE HU BE SW FI DE DK FR NL CZ IT ES PT SK PL
Business enterprises Higher education Government Private non-profit
%
0,00
0,05
0,10
0,15
0,20
0,25
0,30
0,35
SK NL PT PL IT FI DK IE ES DE ES UK BE FR CZ SW HU SI
Direct government funding Indirect government support
%
Journal of International Studies
Vol.10, No.2, 2017
96
over the past decade. Higher education R&D accounts for almost 20% of total GERD. The government
sector plays a relatively minor role as a performer of R&D but it is a major funder of R&D performed in
the higher education and business sec-tors. R&D is typically concentrated among a limited number of firms
in which large ones are typically over-represented. In some countries, however, small and medium-sized
firms (SMEs) account for a significant share of total business R&D. SMEs receive a relatively large share of
government funding in several countries including Estonia, Slovakia and Fin-land. The distribution of
business R&D by economic activity reveals a pattern of specialisation influenced by a country’s economic
structure. In most countries, a limited number of activities account for a large share of total business R&D.
OECD (2010) notes that indirect public funding is mostly realized as tax incentives and it is usually
more neutral than direct support in terms of industry, region and firm characteristics, although this does
not exclude some differentiation, most often by firm size. Tax incentives reduce the marginal cost of R&D
and innovation spending. While direct subsidies are more targeted towards long-term research, R&D tax
schemes are more likely to encourage short term applied research and boost incremental innovation rather
than radical break-throughs.
Guellec and van Pottelsberghe (2003) mention that tax incentives applicable to different tax
arrangements, including corporate and personal income taxes, are also widely used to encourage private
investments in R&D and the exploitation of IP assets, to attract business angels and leverage early-stage
finance, and to attract foreign talent or foreign multinationals.
Indirect support in recent years become more important to encourage investment in R&D and as write
Garnier et al. (2014) at least one form of stimulus R&D currently exists in 26 EU countries. Within the EU,
only Germany and Estonia currently do not have a tax policy aimed directly at stimulating innovation.
Although tax incentives are usual, they are far from homogeneous and differ noticeably across countries,
with most countries offering more than one type of instrument. R&D tax credits are the most popular type
of incentive, followed by enhanced allowances and accelerated depreciation. Tools also include reduction
of social security contributions, exemption from customs duties, preferential loans, venture capital support,
and advantageous lease of regional and central infrastructure (OECD, 2014). R&D tax incentives aim to
encourage firms to perform R&D by reducing its costs. Compared with direct subsidies, R&D tax incentives
allow firms to decide the nature and orientation of their R&D activities, on the assumption that the business
sector is best placed to identify research areas that lead to business outcomes. A detailed description of
financial instrument variety can be found in Szarowská (2015).
Table 1
Tax incentives for R&D and innovation
Tax arrangements Expenditure-based Income-based
Corporate income tax
Austria, Belgium, Czech Rep., Denmark, Finland, France, Greece, Hungary, Italy, Latvia, Poland, Portugal, Slovakia, Slovenia, Spain, United Kingdom
Belgium, Greece, Hungary, Italy, Luxembourg, Netherlands, Poland, Spain, United Kingdom
Payroll withholding and soc. sec. taxes
Belgium, France, Hungary, Netherlands, Spain, Sweden
Personal income tax Denmark, Hungary Denmark
Value-added tax Poland
Other taxes (e.g. land taxes) France, Italy, Portugal
No tax arrangements Estonia, Germany
Source: compilation based on OECD (2012, 2014)
Irena Szarowská
Does public R&D expenditure matter for economic growth? GMM approach
97
Table 1 summarises expenditure-based and income-based tax arragements in the EU countries. Table
is based on tax incentives applied in 2014 and repots that corporate income tax arragements are the most
commonly used. In this way, governments can affect the effective tax burden, generosity of tax subsidy and
competitiveness of the country.
5. TESTING IMPACT OF R&D EXPENDITURE ON ECONOMIC GROWTH
In order to test whether R&D expenditure affects economic growth, there are estimated econometric
models based on Arellan-Bond estimator (1991).
As it is already noted, for models specification, Dynamic Panel Data Model (DPDM) Wizard is applied.
The DPDM Wizard is a special tool included in the software E-Views (9) which aids in specifying members
of the class of dynamic panel data models with fixed effects. All models include cross-section fixed effects
(orthogonal deviations) and constant added to instrument list. Information criteria identified as the optimal
time lag 1 year. Firstly, series for R&D expenditure are expressed as GERD and the basic dynamic panel
model (Model 1) is defined in (3).
lnGDPit = β1 lnGDPit-1 + β2 dGERDit + β3dINVit + β4dHRSTit + εit . (3)
β1 to β4 contain the coefficients assigned to the independent variables, the subscript t indexes the year,
i country, d first difference of variable, lnGDP means GDP growth per capita expressed by the amount of
GDP per capita in PPP (EU28) converted into logs. GERD means Gross domestic expenditure on R&D,
INV is expressing investment ratio on the GDP, HRST as a share of the active population classified as
HRST as a percentage of total active population, and ε is the error term. Period is analysed not only as s
whole but it is also divided by the year 2008. Split of time span into two periods allows deeper analysis of
structural changes related to the influence of crises. Models 1 and 4 are focused on a whole period (1995,
resp. 1997–2013), models 2 and 5 on pre-crisis period (1995, resp. 1997–2007) and models 3 and 6 on post-
crisis period (2008-2013). Models 4–6 contain period fixed effects as dummy variables for a better capture
the impact of the crisis (there are labeled as “year”). Their adding increased a statistical quality of models.
The reported J-statistic is the Sargan statistic (value of the GMM objective function at estimated parameters).
Table 2 presents the most appropriate specifications of models resulting from GMM.
The main results concerning the effect of R&D expenditure on economic growth indicate that findings
are very dependent on applied time span and model specification. For a whole analyzed period, GERD
affects economic growth positively, but after adding time dummies decreased and impact of “traditional”
growth variables (investment and human resources) is stronger. GERD influence on growth is negative and
insignificant in the precisis period and vary in post-crisis period. That´s why, no general conclusion can be
drawn about GERD as the results differs across periods.
Next GERD is substituded by its main components (BUSINESS, GOV and EDU). It is possible to
analyse R&D impact of each sector and Table 3 presents results of the most appropriate specifications of
estimations.
Model 7 reports results for a whole period, Model 8 the pre-crisis findings and Model 9 the post-crisis
results. Model 10 relates also period dummy variables included (it does not transform period dummy
variables) into Model 9. Model 11 presents the results when using the same estimates over the pre-crisis
period, Model 12 during the post-crisis period. As BUSINESS expenditure is found to be insignificant in
Models 7 and 11 (1995–2013), it was excluded as Model 13 shows. This way, a statistical quality of
estimations was increased.

Journal of International Studies
Vol.10, No.2, 2017
98
Table 2
Panel regression estimations (GMM) for GERD
Variable Model 1 Model 2 Model 3 Model 4 Model 5 Model 6
Ln GDP(–1) 0.609*** 0.569*** 0.501*** 0.615*** 0.583*** 0.595***
dGERD 0.069*** –0.018 0.029* 0.002* –0.010 –0.013
dINV 0.003*** 0.015 –0.001 0.009*** 0.016*** 0.001
dHRST 0.008*** 0.008** 0.003** 0.006*** 0.007* 0.002
"1997" 0.071 –0.113**
"1998" 0.036 0.030
"1999" 0.036 –0.035**
"2000" 0.028 –0.030**
"2001" 0.054* –0.039***
"2002" 0.056* –0.013
"2003"
0.072** –0.003
"2004" 0.056 0.013*
"2005" 0.058 –0.005
"2006" 0.063* –0.008
"2007"
0.068* –0.005
"2008" 0.102*** –0.015**
"2009" 0.126*** 0.015**
"2010" 0.082** 0.023***
"2011" 0.079** –0.009**
"2012" 0.074* 0.003
"2013" 0.093** –0.012***
S.E. of reg. 0.101 0.118 0.022 0.096 0.113 0.019
S.D.dep. var. 0.254 0.269 0.031 0.254 0.269 0.031
Instrumental rank
156 69 90 173 80 96
J–statistics 152.6 58.1 91.8 148.8 56.7 92
Observations 335 215 120 335 215 120
Note: Symbols ***, ** and * denote statistical significance at the 1%, 5% and 10% level.
Source: author’s calculations
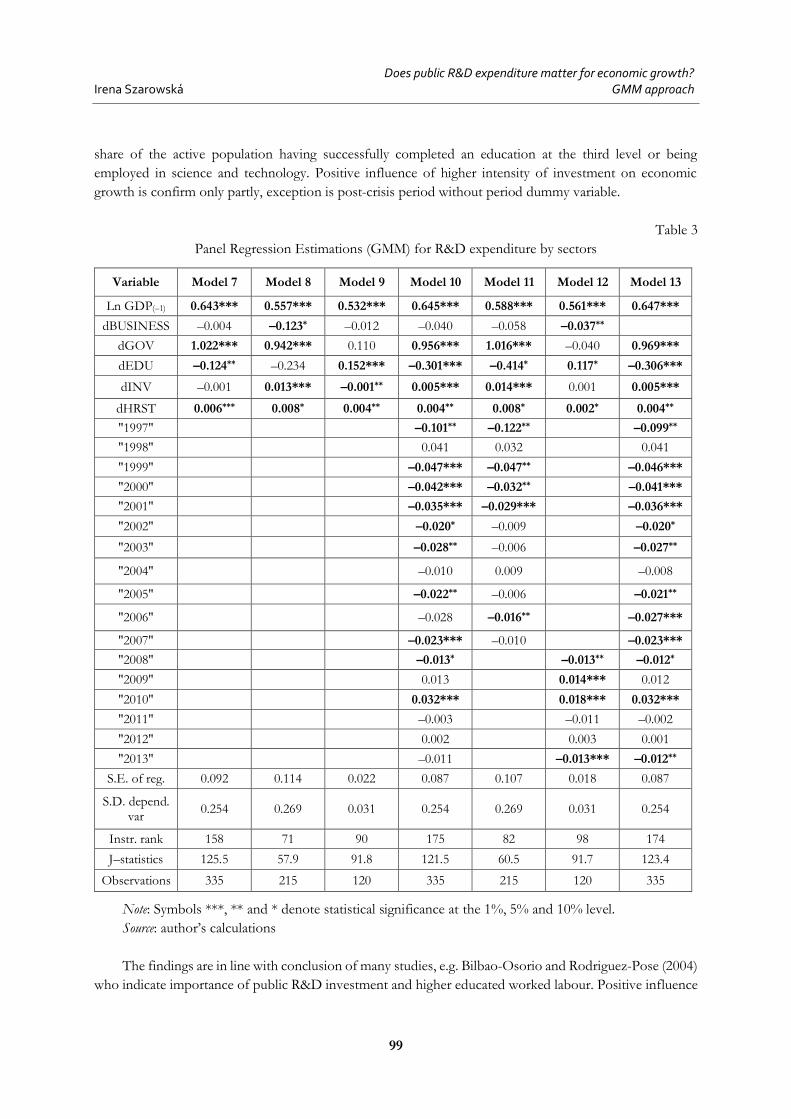
Table 3 shows that the estimated coefficients of GOV expenditure are positive and statistically
significant (except Model 12, in which is negative and statistically insignificant). This finding confirms that
increase of government R&D expenditure contributes to the economic growth. It is necessary to point out
that its influence is the main driver for economic growth with stronger effect that traditional growth
variables (investment and human capital approximated by HRST). Contrary, business R&D expenditure
seems to have negative influence on economic growth, as coefficients are negative and moreover often
statistically in-significant during the reported periods. Hence, business R&D expenditure is excluded in
Model 13 and it improves the quality of the estimation. EDU affects economic performance diversely – in
pre-crisis period mostly negatively, in post-crisis period positively. It supports assumption about increasing
importance of higher education expenditure, generally. Results also confirm positive impact of a higher
Irena Szarowská
Does public R&D expenditure matter for economic growth? GMM approach
99
share of the active population having successfully completed an education at the third level or being
employed in science and technology. Positive influence of higher intensity of investment on economic
growth is confirm only partly, exception is post-crisis period without period dummy variable.
Table 3
Panel Regression Estimations (GMM) for R&D expenditure by sectors
Variable Model 7 Model 8 Model 9 Model 10 Model 11 Model 12 Model 13
Ln GDP(–1) 0.643*** 0.557*** 0.532*** 0.645*** 0.588*** 0.561*** 0.647***
dBUSINESS –0.004 –0.123* –0.012 –0.040 –0.058 –0.037**
dGOV 1.022*** 0.942*** 0.110 0.956*** 1.016*** –0.040 0.969***
dEDU –0.124** –0.234 0.152*** –0.301*** –0.414* 0.117* –0.306***
dINV –0.001 0.013*** –0.001** 0.005*** 0.014*** 0.001 0.005***
dHRST 0.006*** 0.008* 0.004** 0.004** 0.008* 0.002* 0.004**
"1997" –0.101** –0.122** –0.099**
"1998" 0.041 0.032 0.041
"1999" –0.047*** –0.047** –0.046***
"2000" –0.042*** –0.032** –0.041***
"2001" –0.035*** –0.029*** –0.036***
"2002" –0.020* –0.009 –0.020*
"2003" –0.028** –0.006 –0.027**
"2004" –0.010 0.009 –0.008
"2005" –0.022** –0.006 –0.021**
"2006" –0.028 –0.016** –0.027***
"2007" –0.023*** –0.010 –0.023***
"2008" –0.013* –0.013** –0.012*
"2009" 0.013 0.014*** 0.012
"2010" 0.032*** 0.018*** 0.032***
"2011" –0.003 –0.011 –0.002
"2012" 0.002 0.003 0.001
"2013" –0.011 –0.013*** –0.012**
S.E. of reg. 0.092 0.114 0.022 0.087 0.107 0.018 0.087
S.D. depend. var
0.254 0.269 0.031 0.254 0.269 0.031 0.254
Instr. rank 158 71 90 175 82 98 174
J–statistics 125.5 57.9 91.8 121.5 60.5 91.7 123.4
Observations 335 215 120 335 215 120 335
Note: Symbols ***, ** and * denote statistical significance at the 1%, 5% and 10% level.
Source: author’s calculations
The findings are in line with conclusion of many studies, e.g. Bilbao-Osorio and Rodriguez-Pose (2004)
who indicate importance of public R&D investment and higher educated worked labour. Positive influence

Journal of International Studies
Vol.10, No.2, 2017
100
of government R&D expenditure is confirmed also by Castellacci and Lie (2015), Ientile and Mairesse
(2009), Hall and Van Reenen (2000) or Kim (2011). Becker (2015) supports especially conclusions about
importance of high-skilled human capital and investment. Perez-Sebastian’s conclusion (2007) supports the
findings about R&D as a whole as states that R&D models have no definite long-run growth effects and
level effects can be substantial. Also Freimane and Bāliņa (2016) report statistically significant impact of
R&D expenditures on the economic growth in the EU countries based on panel data regressions in the
period of 2000–2013. The significance for R&D coefficient remains robust to different sub-periods, but the
level of significance decreases as a sub-sample of new EU countries was considered.
In terms of a business R&D expenditure, the results are not in line with the findings of earlier empirical
studies focused on impact of private expenditure and economic growth, such as Becker (2015), Garland and
Allen (1995), Silaghi et al. (2014) or Brautzsch et al. (2015). The variety of findings is generated due to
differences used in econometric models, country samples, observation periods and considered variables.
Arnold et al. (2011) were able to theoretically derive an error correction form to be estimated for both
a neoclassical augmented Solow model, respectively for constant returns to a scale endogenous growth
model. In order to empirically discriminate between these setups, they exploit different non-linear
restrictions implied by the models regarding the relation-ship between factor shares and speed of
convergence. While acknowledging that there are theoretical derivations of error correction forms under
both neoclassical and endogenous growth setups, it is not considered restrictions on the production
function, since the article has no interest in discriminating between the two frameworks. In this context the
long-run estimated coefficients can be viewed as the standard concept of long-run propensities, i.e. the long-
run change in the dependent variable given a ceteris paribus permanent increase in the explanatory variable
of interest.
6. CONCLUSIONS
The article focuses on R&D expenditure, its funding and the aim of the paper was to quantify influence
of R&D expenditure on economic growth in selected EU member states in the period 1995–2013. The
presented empirical evidence is based on unbalanced annual panel data of 20 EU countries.
Review of theoretical literature and empirical studies shows that importance and impact of R&D on
economic growth is not unequivocal and published studies present positive as well as negative effects.
This research confirms that there is a trend to combine direct public funding from both national and
EU sources and indirect public funding instruments. Governments offer direct support through public
procurement for R&D and a variety of grants, subsidies, loans or equity funding. While direct subsidies are
more targeted towards long-term research and growth, indirect funding and R&D tax schemes are more
likely to encourage short-term applied research and boost incremental innovation. Due to limited financial
resources, indirect support has become more important in recent years.
The direct empirical evidence tested whether R&D expenditure matters for economic performance.
R&D expenditure were investigated not only as a whole GERD, but also as its components: business R&D,
and government as well as higher education R&D expenditure which make up public R&D. Moreover, time
span was divided into a pre-crisis and a post-crisis period. Explanatory variables were not examined in
individual regressions, but the study used GMM applied on dynamic panel data and estimations are based
on Arellan-Bond estimator (1991). An important finding resulting from this research is that the dynamic
pan-el analysis confirms positive and statistically significant impact of government R&D on economic
growth conclusively. Its effect is the main driver for economic growth with stronger effect that traditional
growth variables (investment and human capital approximated by HRST). Surprisingly, business R&D
Irena Szarowská
Does public R&D expenditure matter for economic growth? GMM approach
101
expenditure was found to be negative and statistically insignificant in most cases. Possible reason can be
found in development of business and public R&D expenditure when the financial and economic crisis hit
the EU in 2008. R&D expenditure of the business sector distinctly fell in 2008 and 2009 (and also in next
years, see OECD 2012). As Cincera et al. (2012) note, businesses usually decrease the amount they spend
on R&D during economic crisis as a cost-reduction strategy in time of economic pressure and tight credit
constraints, the similar development was reported also in some countries in the sample. Based on the
presented data it can be concluded that higher education R&D expenditure influences economic growth
diversely – in the pre-crisis period negatively, in the post-crisis period positively. It supports assumption
about increasing importance of higher education expenditure, generally.
All reported models were estimated for unbalanced annual panel data using first difference GMM
procedure of Arellano, Bond (1991) with robust standard error, consistent with panel-specific
autocorrelation and heteroscedasticity. That allowed removing the individual effects. Some variables like
GERD and INV might suffer endogeneity problems with respect to the GDP growth; therefore the lagged
values of variables were used. Instrumental variables were tested with the Sargan J test. Respective null
hypothesis is that there are no correlations between instruments and residuals. Autocorrelation problem was
tested with the Arellano-Bond test for 1 and 2 lags. For all reported models Arellano-Bond test could not
reject the null hypothesis of absence of autocorrelation in the residuals.
Future research will be focused on smaller and more homogenous groups of countries and more
accurate specification of a short-term and a long-term impact of R&D variables on economic growth.
ACKNOWLEDGEMENT
This paper ensued thanks to the support of Student Grant System of Silesian University SGS/17/2015
“Financial instruments of public support for research and development in the European Union” and of the
Ministry of Education, Youth and Sports Czech Republic within the Institutional Support for Long-term
Development of a Research Organization in 2017.
REFERENCES
Afonso, Ó., & Sarabanda, R. (2017). The impact of the informal economy on R&D, wage inequality and economic
growth. Applied Economics Letters, 24(1), 39-44. doi: 10.1080/13504851.2016.1158913.
Arellano, M., & Bond, S. (1991). Some tests of specification for panel data: Monte Carlo evidence and an application
to employment equations. The review of economic studies, 58(2), 277-297. doi:http://dx.doi.org/10.2307/2297968
Arnold, J., Bassanini, A., & Scarpetta, S. (2011). Solow or Lucas? Testing speed of convergence on a panel of OECD
countries. Research in Economics, 65(2), 110-123. doi:http://dx.doi.org/10.1016/j.rie.2010.11.005
Barro, R., & Sala-i-Martin, X. (2003). Economic growth. Cambridge: MIT Press.
Becker, B. (2015). Public R&D policies and private R&D investment: A survey of the empirical evidence. Journal of
Economic Surveys, 29(5), 917-942. doi:http://dx.doi.org/10.1111/joes.12074.
Berliant, M., & Fujita, M. (2011). The dynamics of knowledge diversity and economic growth. Southern Economic Journal,
77(4), 856-884. doi:10.4284/0038-4038-77.4.856.
Bilas, V., Bosnjak, M., & Cizmic, T. (2016). Relationship between Research and Development and Economic Growth
in the EU Countries. Economic and Social Development: Book of Proceedings, 223-230.
Bilbao‐Osorio, B., & Rodríguez‐Pose, A. (2004). From R&D to innovation and economic growth in the EU. Growth
and Change, 35(4), 434-455. doi:10.1111/j.1468-2257.2004.00256.x.
Brautzsch, H. U., Günther, J., Loose, B., Ludwig, U., & Nulsch, N. (2015). Can R&D subsidies counteract the
economic crisis?–Macroeconomic effects in Germany. Research Policy, 44(3), 623-633.
http://dx.doi.org/10.1016/j.respol.2014.11.012.
Journal of International Studies
Vol.10, No.2, 2017
102
Breitung, J. (2001). The local power of some unit root tests for panel data. In Nonstationary panels, panel cointegration, and
dynamic panels (pp. 161-177). Emerald Group Publishing Limited.
Castellacci, F., & Lie, C. M. (2015). Do the effects of R&D tax credits vary across industries? A meta-regression
analysis. Research Policy, 44(4), 819-832. http://dx.doi.org/10.1016/j.respol.2015.01.010
Cincera, M., Cozza, C., Tübke, A., & Voigt, P. (2012). Doing R&D or not (in a crisis), that is the question…. European
planning studies, 20(9), 1525-1547. doi:10.1080/09654313.2012.709064.
David, P. A., Hall, B. H., & Toole, A. A. (2000). Is public R&D a complement or substitute for private R&D? A review
of the econometric evidence. Research policy, 29(4), 497-529. doi:http://dx.doi.org/10.3386/w7373.
Dzambazka, E. (2013). Emprical Analysis of FDI and Tax Incentives on the Economic Growth in the Republic of
Macedonia. Economic Development, (3), 103-127.
European Commission (2013). Research and innovation performance in EU member states and associated countries. Luxembourg:
Publications Office of the European Union.
European Commission (2003). Rising EU R&D Intensity - Improving the Effectiveness of Public Support Mechanisms for Private
Sector Research and Development: Fiscal Measures. Luxembourg: Office for Official Publications of the European
Communities.
Faria, P., da Silva Martins, F. V., & Brandão, E. F. M. (2011). How R&D and tax incentives influence economic growth:
Econometric study for the period between 1995 and 2008 of EU-15 (No. 442). Universidade do Porto, Faculdade de
Economia do Porto. Retrieved from http://www.fep.up.pt/investigacao/workingpapers/11.11.21_wp442.pdf
Freimane, R., & Bāliņa, S. (2016). Research and development expenditures and economic growth in the EU: A panel
data analysis. Economics and Business, 29(1), 5-11. doi:https://doi.org/10.1515/eb-2016-0016.
Garland, G. H., Allen, D. B. (1995). Returns on public and private R&D. 3rd International Meeting of the Decision-Sciences-
Institute on Competing in the Global Marketplace, 12–14 June 1995, Puebla, Mexico.
Garnier, G., György, E., Heineken, K., Mathé, M., Puglisi, L., Ruà, S., ... & Van Mierlo, A. (2014). A wind of change?
Reforms of Tax Systems since the launch of Europe 2020. Reflets et perspectives de la vie économique, 53(2), 75-111.
doi:10.2778/70031.
Guadalupi, L., Tutore, A. V., Matricano, D., & Andreottola, F. (2013). The relationship between technological change
and economic growth in less advanced European Regions. 5th Annual EuroMed Conference of the EuroMed Academy
of Business, 04–05 October 2012, Montreux, Switzerland.
Guellec, D., & Van Pottelsberghe de la Potterie, B. (2004). From R&D to productivity growth: Do the institutional
settings and the source of funds of R&D matter?. Oxford Bulletin of Economics and Statistics, 66(3), 353-378.
doi:http://dx.doi.org/10.1111/j.1468-0084.2004.00083.x
Guellec, D., & Van Pottelsberghe De La Potterie, B. (2003). The impact of public R&D expenditure on business R&D.
Economics of innovation and new technology, 12(3), 225-243. doi:10.1080/10438590290004555
Halásková, R., & Halásková, M. (2015). Current issues of research and development policy in EU countries. Proceedings
of the 13th International Conference Economic Policy in the European Union Member Countries, 2–4 September 2015,
Karolinka, Czech Republic, 161–174.
Hall, B., & Van Reenen, J. (2000). How effective are fiscal incentives for R&D? A review of the evidence. Research
Policy, 29(4), 449-469. doi:http://dx.doi.org/10.1016/S0048-7333(99)00085-2
Hansen, L. P. (1982). Large sample properties of generalized method of moments estimators. Econometrica: Journal of the
Econometric Society, 50, 1029-1054.
Hud, M., & Hussinger, K. (2015). The impact of R&D subsidies during the crisis. Research policy, 44(10), 1844-1855.
doi:http://dx.doi.org/10.1016/j.respol.2015.06.003
Ientile, D., & Mairesse, J. (2009). A policy to boost R&D: Does the R&D tax credit work?. EIB papers, 14(1), 144-169.
Im, K. S., Pesaran, M. H., & Shin, Y. (2003). Testing for unit roots in heterogeneous panels. Journal of econometrics,
115(1), 53-74.
Jones, C. I. (1995). R & D-based models of economic growth. Journal of political Economy, 103(4), 759-784.
doi:http://dx.doi.org/10.1086/262002
Kim, J. W. (2011). The economic growth effect of R&D activity in Korea. Korea and the World Economy, 12(1), 25-44.
Irena Szarowská
Does public R&D expenditure matter for economic growth? GMM approach
103
Köhler, C., Laredo, P., & Rammer, C. (2012). The impact and effectiveness of fiscal incentives for R&D. Compendium
of Evidence on the effectiveness of Innovation Policy. Retrieved from:
www.nesta.org.uk/sites/default/files/the_impact_and_effectiveness_of_fiscal_incentives.pdf
Levin, A., Lin, C. F., & Chu, C. S. J. (2002). Unit root tests in panel data: asymptotic and finite-sample properties.
Journal of econometrics, 108(1), 1-24.
Marcelino-Jesus, E., Sarraipa, J., Beça, M., & Jardim-Goncalves, R. (2017). A framework for technological research
results assessment. International Journal of Computer Integrated Manufacturing, 30(1), 44-62.
doi:10.1080/0951192X.2016.1145806
OECD. (2010). R&D tax incentives: rationale, design, evaluation. Paris: OECD Innovation Policy Platform.
OECD. (2012). OECD science, technology and industry outlook 2012. Paris: OECD Publications Service.
doi:http://dx.doi.org/10.1787/19991428
OECD. (2014). OECD science, technology and industry outlook 2014. Paris: OECD Publications Service.
doi:http://dx.doi.org/10.1787/19991428
OECD. (2015). OECD science, technology and industry scoreboard 2015: innovation for growth and society. Paris: OECD
Publishing. doi:http://dx.doi.org/10.1787/20725345
Perez-Sebastian, F. (2007). Public support to innovation and imitation in a non-scale growth model. Journal of Economic
Dynamics and Control, 31(12), 3791-3821. DOI: 10.1016/j.jedc.2006.12.011.
Silaghi, M. I. P., Alexa, D., Jude, C., & Litan, C. (2014). Do business and public sector research and development
expenditures contribute to economic growth in Central and Eastern European Countries? A dynamic panel
estimation. Economic Modelling, 36, 108-119. doi:http://dx.doi.org/10.1016/j.econmod.2013.08.035.
Solow, R. M. (1956). A contribution to the theory of economic growth. The quarterly journal of economics, 70(1), 65-94.
doi:http://dx.doi.org/10.2307/1884513
Steger, T. M. (2005). Welfare Implications of Non‐scale R&D‐based Growth Models. The Scandinavian Journal of
Economics, 107(4), 737-757. doi:http://dx.doi.org/10.1111/j.1467-9442.2005.00426.x
Svennson, R. (2008). Growth through research and development – what does the research literature say?. Stockholm: Vinnova.
Szarowská, I. (2013). Trends of COFOG government expenditure in the EU15. 10th International Conference Economic
Policy in the European Union Member Countries, 19–21 September 2012, Vendryne, Czech Republic, 280-290.
Szarowská, I. (2015). Direct and indirect funding of R&D and generosity of tax subsidy for R&D in selected countries
EU. X International Conference on Applied Business Research, 14–18 September 2015, Madrid, Spain, 990-999.
Szarowská, I. (2016). Impact of Public R&D Expenditure on Economic Growth in Selected EU Countries. 9th
International Scientific Conference “Business and Management”, 12–13 May 2016, Vilnius, Lithuania, doi:
10.3846/bm.2016.XX (in press).
Verbeek, M. (2000). A guide to modern econometrics. New York: John Wiley & Sons Inc.
Westmore, B. (2013). R&D, Patenting and growth: the role of Public Policy. Paris: OECD Publishing.
doi:http://dx.doi.org/10.1787/5k46h2rfb4f3-en.