Embed Size (px)
Citation preview

DOES PLAYING CHESS IMPROVE MATH LEARNING?
PROMISING (AND INEXPENSIVE) RESULTS FROM ITALY
EDUC 680
PROF. ROBERT BORUCH
GRADUATE SCHOOL OF EDUCATION
UNIVERSITY OF PENNSYLVANIA
BARBARA ROMANO
December 21, 2011

2
Table of content!
Abstract ...................................................................................................................................... 3
Introduction ................................................................................................................................ 4!
The existing evidence on the effectiveness of learning chess ......................................... 4!
The study design ........................................................................................................................ 6!
Recruitment of schools and random assignment of classes ............................................. 7!
Outcome measures and data collection ............................................................................. 8!
Empirical results ......................................................................................................................... 9!
Testing the equivalence of experimentals and controls ................................................... 10!
Does learning chess have a positive effect on math achievement? .................................. 12!
Did some group gain more than others from SAM? ........................................................ 14!
Cost of the intervention (Cost-effectiveness) ........................................................................... 16!
Discussion and Conclusions ..................................................................................................... 16!
Attrition ............................................................................................................................ 16!
Did chess learning displaced reading achievement? ........................................................ 17!
Lack of external validity .................................................................................................. 18
Concluding remarks ......................................................................................................... 20
Bibliography ............................................................................................................................. 19!

3
ABSTRACT
Background: The existing evidence on the effect of chess on math learning is inconclusive
Aim of research: Explore effectiveness of teaching chess in elementary school, by means of a
low budget RCT, sustained by a highly committed research team
Setting: 33 schools, located in three quarter of Italian regions, volunteering to
participate in an RCT
Intervention: About 30 hours of chess instruction by certified staff in the course of 3rd
grade
Research design Each school participates with at least two 3rd grade classes, one of which is
randomly selected to be delayed to 4th grade.
Data collection: A math pre-test and a post-test are administered to all students of the
experimental and control classes.
Analysis methods: Simple t-test are performed, then estimates are adjusted with multiple
regression and corrected for clustering, and effect sizes are computed.
Interactions are extensively explored.
Results: Main finding is that in Italy learning chess in school in 3rd grade increases
math achievement by a third of a standard deviation. Interactions are
significant for two crucial variables: residing in the south and being foreign
born. Southern students present an effect size almost twice as large as their
northern colleagues (relevant because the south always score much worse in
standardized tests). Foreign born students score analogously better than the
native born.
Limitations: The study is weak on external validity, due to the volunteer and network-
related nature of participation in the program.
Extensions: Important development would be to randomly select schools within which the
randomly assign classes, providing incentive for school participation and
eventually correcting for non-compliance.

4
Introduction
The study presented in this paper examines the effects of being taught to play chess in the
course of the 3rd grade, specifically the effect on mathematics achievement of pupils attending
Italian elementary public schools. The study was severely underfunded but it was made possible by
the volunteer work of a small number of researchers committed to rigorous education research. The
team included, in addition to the author of this paper, Gianluca Argentin, Alberto Martini and
Alessandro Dominici. This project was called SAM (Scacchi e Apprendimento della Matematica—
Chess and Math Learning).
The intervention consisted in approximately 30 hours of classroom instruction provided to 3rd
graders by instructors certified by the Italian Chess Federation (ICF). The intervention was
implemented in over 30 schools located in 14 regions during the 2010/11 school year, under the
leadership of the Piemonte Regional branch of the ICF, with the financial support of a grant-
making foundation. The funds available for the intervention were about ! 30,000 and the budget
allocated to the evaluation was less than ! 4,000.
The existing evidence on the effectiveness of learning chess!
In few countries chess are taught as a constituent element part of the school curricula. This is
an old tradition in the Eastern European Countries, but chess are taught as well in some school
district in Canada, America and even in Europe. It is not clear whether in these countries this
practice is a matter of tradition or chess could really play a role in improving overall school
performance, and in particular math achievement.
Undoubtedly playing chess requires strong problem solving abilities and chess players show
uncommon memory and concentration abilities (Sweller, Clark, Kirschner, 2006). The heart of the
matter is: are these characteristics entirely pre-existing or playing chess contributes to develop
them? Common sense suggests that there is a mixture of the two: people with certain

5
characteristics approach chess and chess help them to improve (amplify) these traits. If this is true,
chess could be used to help people who usually won’t approach chess to improve their problem
solving, concentration and memory abilities?
Some educational psychologists object to this possibility. Sweller, Clark, Kirschner (2006)
for example relate problem-solving in a particular subject to memories developed in that particular
subject. They write: “The superiority of chess masters comes not from having acquired clever,
sophisticated, general problem-solving strategies but rather from having stored innumerable
configurations and the best moves associated with each in long-term memory.” So that problem-
solving – as memory – would be ‘subject specific’ and using chess to improve math problem-
solving would be a failure: “minimal instructional guidance in mathematics leads to minimal
learning” (Kirschner, Sweller, & Clark, 2006).
On the other hand some studies claims that chess promotes academic performance through
developing visual memory, attention span, spatial reasoning skills, capacity to predict and anticipate
consequences, critical thinking, self-confidence, self-respect and problem solving skills (Berkman,
2004; Buki, 2008; Campitelli, 2008, Hong, 2007).
Ferguson (1983) with the American Chess Federation founded the Chess in Schools Program
which initially began in New York's Harlem School district. Early in the program, the focus was on
improving math skills for adolescents through improved critical thinking and problem solving
skills. Remarkably, the ACF reports that chess improves among those taught:
“Ability to use critical thinking (e.g. criteria to drive decision making and evaluate
alternatives in testing) improved scores by 17.3% for students regularly engaged in chess classes,
compared with only 4.56% for children participating in other forms of enriched activities."
The mathematics curriculum in New Brunswick, Canada, is a text series called "Challenging
Mathematics" which uses chess to teach logic from grades 2 to 7. Using this curriculum, the

6
average problem-solving score of pupils in the province increased from 62% to 81%. The Province
of Quebec, where the program was first introduced, has the best math marks in Canada.
Liptrap (1998) in his study on “Chess and Standard Test Scores” shows that chess improve
both math and reading scores for elementary students as it is also suggested by the Marguiles
(1998) study “The Effect of Chess on Reading Scores".
Despite all these studies, the evidence produced is not convincing and inconclusive. Some
studies rely on too few cases to be defensible, others are focused on students already active in
playing chess (Thomson, 2003), for others is not possible to understand from the available
understand how the experimental and control group were selected.
The study design
The intervention finds its motivation in the theory presented above, suggesting that problem
solving and abilities are not only “subject-specific”, but could be developed in different ways.
Namely the intervention is based on the idea that math abilities—such as critical-thinking, solving
strategies, reasoning and concentration—could be enhanced by learning chess and not only by
solving math problems. The underlying theory of change is represented in the following logic
model:

7
Figure 1. The SAM program Logic Model
The SAM intervention consisted of 20 to 30 hours of chess instruction delivered in the
classroom during regular school hours by a certified instructor. The actual number of hours of
instruction varied depending on the school’s availability of resources and on the number of hours
that the regular classroom teachers made available for it. We have no evidence of the effect of
different hours on the outcomes, as they were not randomly assigned.
Two research questions are the focus of this study: (a) being taught chess in third grade does
improve math achievement? and (b) being taught chess in third grade is more effective for some
students than for others?
Recruitment of schools and random assignment of classes
The enrollment of schools in the study was totally voluntary. Actually, no general
announcement was made, rather an existing network of schools was alerted of the opportunity.
Such network consisted mainly of the schools that in the past years had worked with the Italian
Chess Federation. The only condition for a school to be enrolled was to adhere to SAM with at least
two 3rd grade classes, one of which was later denied chess instructions in 3rd grade.
We were forced to use this approach because the lack of resources to conduct a systematic
!"#$%&'()$*+*),-(+.*/0*/1
!"#$%&'($',2%/*/1
!"#$%&'()%/)'/+$,+*%/
!"#$%&'(2#,+*,-($',2%/*/1
!"#$%&'(2%-&*/1(2+$,+'1*'2(
Activity
34(+%(54(.%6$2(%7(8.'22(*/2+$6)+*%/(+,61.+(*/()-,22(9:(
,(8.'22(;,2+'$
Outcomes Outcomes
!"#$%&'(1'%"'+$:(0/%<-'=1'
!"#$%&'(",+.(0/%<-'=1'

8
nationwide recruitment effort to guarantee external validity. All the schools that accepted the
protocol were included in SAM—namely they had to accepted the following condition: at least one
of the 3rd grade classes enrolled was randomly assigned to receive SAM in 4th grade, while all the
others received the treatment in 3rd grade.
At the conclusion of the recruitment process, there were 123 classrooms in 33 schools, located
in 14 out of the 20 Italian regions. Of these 123 classes, 58 were controls and 65 were
experimentals.
Outcome measures and data collection
The students were assessed at the beginning and at the end of the end of the 2010/11 school
year. The outcome of interested was math achievement. To measure achievement at the pre-test, we
used the INVALSI standardized test used in the previous year by the National Institute for
Education Evaluation (INVALSI). The INVALSI’s is a standardized test administered at the end of
year to all Italian 2nd grade students. We considered it an adequate instrument, because at the
beginning of the 3rd grade math abilities should be almost the same as at the end of the 2nd grade.
Given that all the students in our study took the INVALSI test at the end of School Year 2009/10,
we used the 2008/09 INVALSI test to avoid the risk some learning effect. The students that took the
pre-test where 1,996 (almost 97% of the eligible ones.)
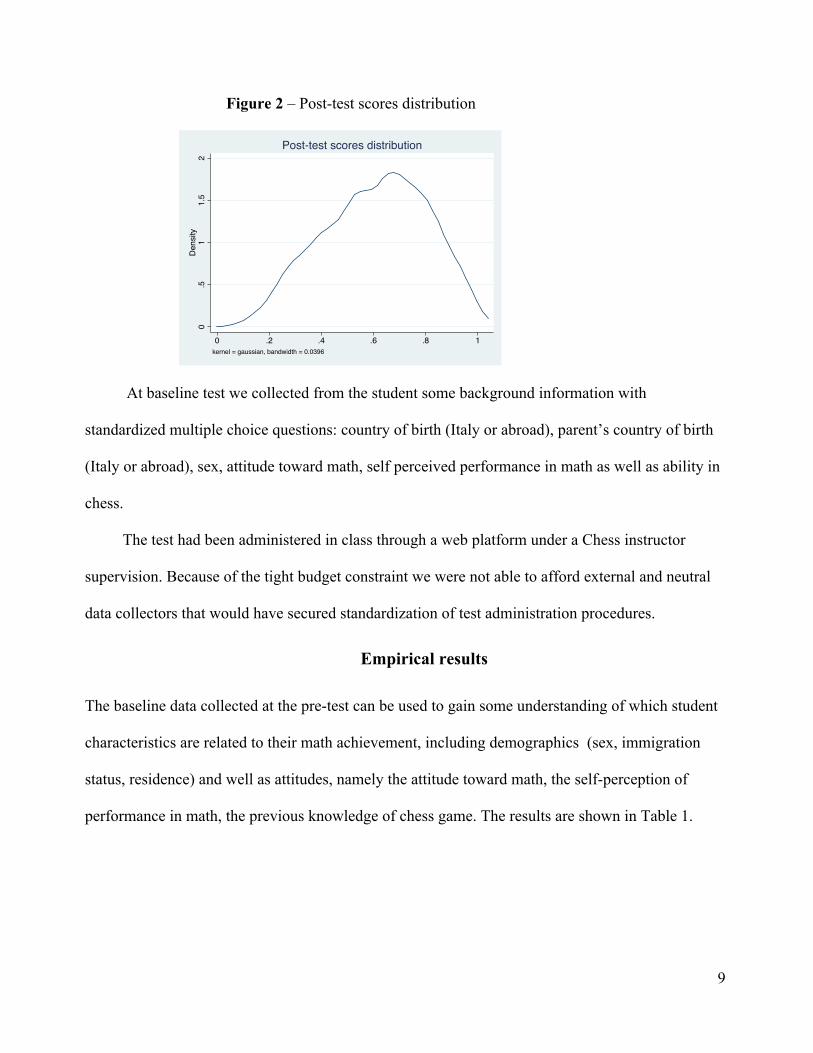
For the post-test, a brand new test was developed. The constructs measured were the same as
in the pre-test, but the difficulty was higher. The distribution of the post-test scores reported in
Figure 2 shows that the test, even if a little bit negatively skewed, was able to discriminate and there
were no ceiling nor floor effects. Therefore there should be no “instrumentation” threats to internal
validity. Both pre and post-test consisted of 28 multiple-choice items. The scores are presented in
percentage of correct answers.
9
Figure 2 – Post-test scores distribution
At baseline test we collected from the student some background information with
standardized multiple choice questions: country of birth (Italy or abroad), parent’s country of birth
(Italy or abroad), sex, attitude toward math, self perceived performance in math as well as ability in
chess.
The test had been administered in class through a web platform under a Chess instructor
supervision. Because of the tight budget constraint we were not able to afford external and neutral
data collectors that would have secured standardization of test administration procedures.
Empirical results
The baseline data collected at the pre-test can be used to gain some understanding of which student
characteristics are related to their math achievement, including demographics (sex, immigration
status, residence) and well as attitudes, namely the attitude toward math, the self-perception of
performance in math, the previous knowledge of chess game. The results are shown in Table 1.
0.5
11.
52
Den
sity
0 .2 .4 .6 .8 1kernel = gaussian, bandwidth = 0.0396
Post-test scores distribution

10
Table 1 – Differences in pre-test scores by student characteristics
While neither sex nor residence have a significant effect, being foreign born status has a
sizeable negative effect that lowers performance on the pre-test by 6 to 8 percentage points. As
expected, students who like math or with good self perceived math abilities, perform better on the
pre-test. However, they score only about 4 percentage point higher than their classmates.
Testing the equivalence of experimentals and controls
The pre-test scores and the information collected with the baseline questionnaire allow us to
check for the equivalence between experimentals and controls. We considered both the
demographic characteristics of the student as well as the self-reported measures.
Male Female64.39 63.23 -0.11 1.41Yes No
59.71 65.77 -6.48 5.75
Yes No56.37 64.86 -8.49 4.74North South 64.20 63.33 0.8 1.21Yes Not so much/No
65.99 62.33 3.75 4.57Yes Not so much/No
67.33 62.96 4.36 5.05Well Not so well/No63.56 63.89 -0.3 0.31
"Do you do well in math?"
Either parent foreign born
Foreign born
Student Characteristics Mean score on pre test difference t-statitsitc
"Do you know how to play chess?"
North-South residence
"Do you like math?"
Sex
11
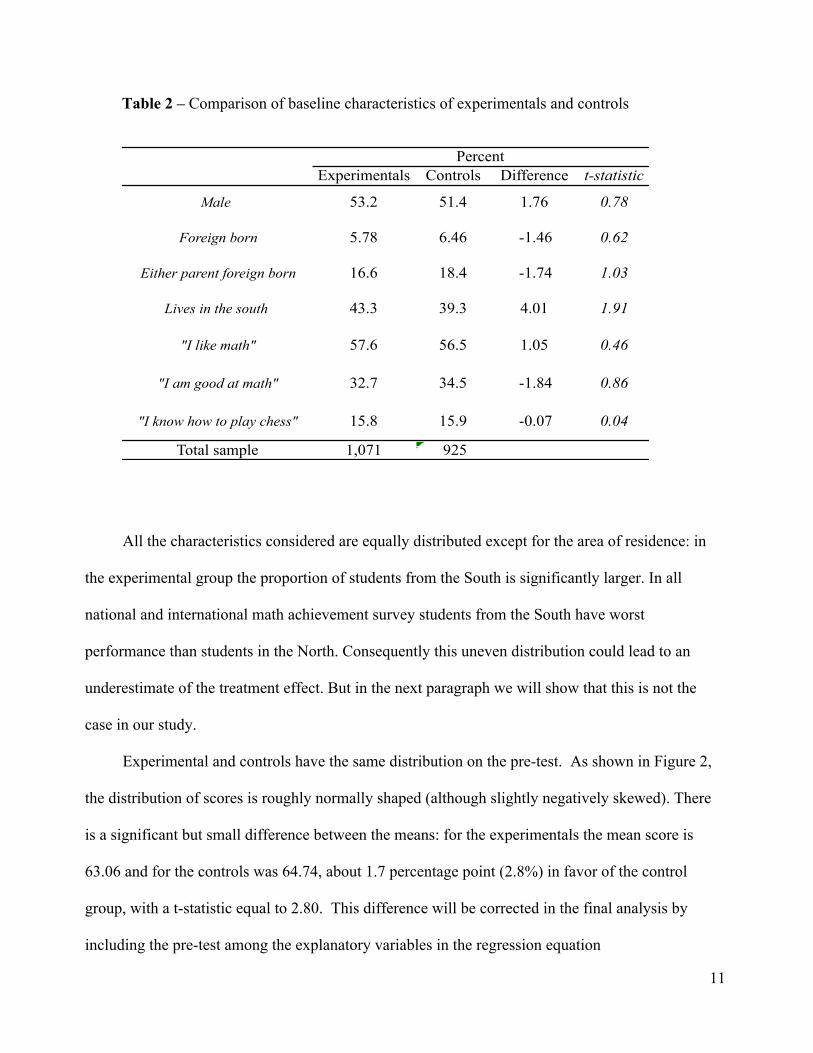
Table 2 – Comparison of baseline characteristics of experimentals and controls
All the characteristics considered are equally distributed except for the area of residence: in
the experimental group the proportion of students from the South is significantly larger. In all
national and international math achievement survey students from the South have worst
performance than students in the North. Consequently this uneven distribution could lead to an
underestimate of the treatment effect. But in the next paragraph we will show that this is not the
case in our study.
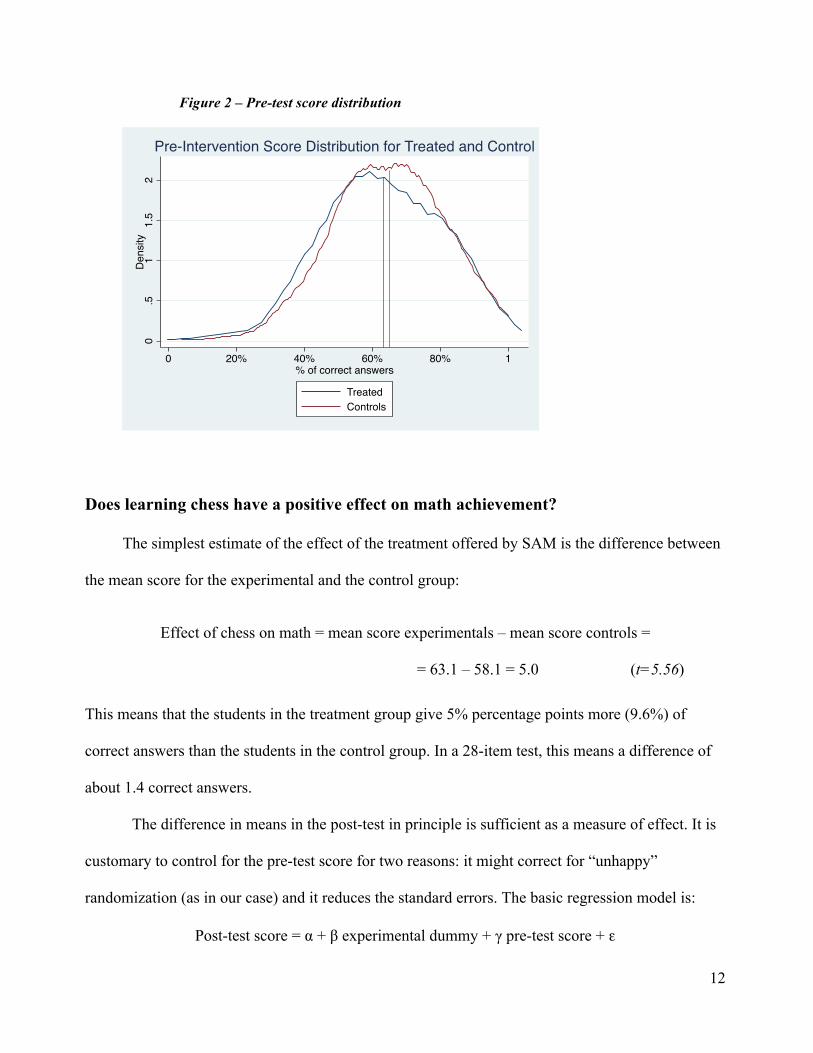
Experimental and controls have the same distribution on the pre-test. As shown in Figure 2,
the distribution of scores is roughly normally shaped (although slightly negatively skewed). There
is a significant but small difference between the means: for the experimentals the mean score is
63.06 and for the controls was 64.74, about 1.7 percentage point (2.8%) in favor of the control
group, with a t-statistic equal to 2.80. This difference will be corrected in the final analysis by
including the pre-test among the explanatory variables in the regression equation
Experimentals Controls Difference t-statistic
Male 53.2 51.4 1.76 0.78
Foreign born 5.78 6.46 -1.46 0.62
Either parent foreign born 16.6 18.4 -1.74 1.03
Lives in the south 43.3 39.3 4.01 1.91
Total sample 1,071 925
"I know how to play chess" 15.8 15.9 -0.07 0.04
"I am good at math" 32.7 34.5 -1.84 0.86
Percent
"I like math" 57.6 56.5 1.05 0.46
12
Figure 2 – Pre-test score distribution
Does learning chess have a positive effect on math achievement?
The simplest estimate of the effect of the treatment offered by SAM is the difference between
the mean score for the experimental and the control group:
Effect of chess on math = mean score experimentals – mean score controls =
= 63.1 – 58.1 = 5.0 (t=5.56)
This means that the students in the treatment group give 5% percentage points more (9.6%) of
correct answers than the students in the control group. In a 28-item test, this means a difference of
about 1.4 correct answers.
The difference in means in the post-test in principle is sufficient as a measure of effect. It is
customary to control for the pre-test score for two reasons: it might correct for “unhappy”
randomization (as in our case) and it reduces the standard errors. The basic regression model is:
Post-test score = " + # experimental dummy + $ pre-test score + !
0.5
11.
52
Den
sity
0 120% 40% 60% 80%% of correct answers
TreatedControls
Pre-Intervention Score Distribution for Treated and Control
13
where the impact is the estimated value of # and randomization guarantees that the usual
assumptions on the error term are satisfied. Controlling for the differences in the pretest, the
average effect of the treatment goes up to 0.068, that is 6.8 percent more correct answers for the
experimental with respect to the controls.
More informative is to express the impact through the simple formula of effect size:
Effect Size = (Mean of experimental group – Mean of control group)/Pooled Standard Deviation
The effect size of SAM is 0.068/0.20 = 0.34
Therefore we can conclude that, based on our experiment, being taught how to play chess in
3rd grade improves on average math achievement by a third of a standard deviation. According to
Lipsey, Bloom et al. (2009) an effect size greater than 0.25 is “educationally significant”.
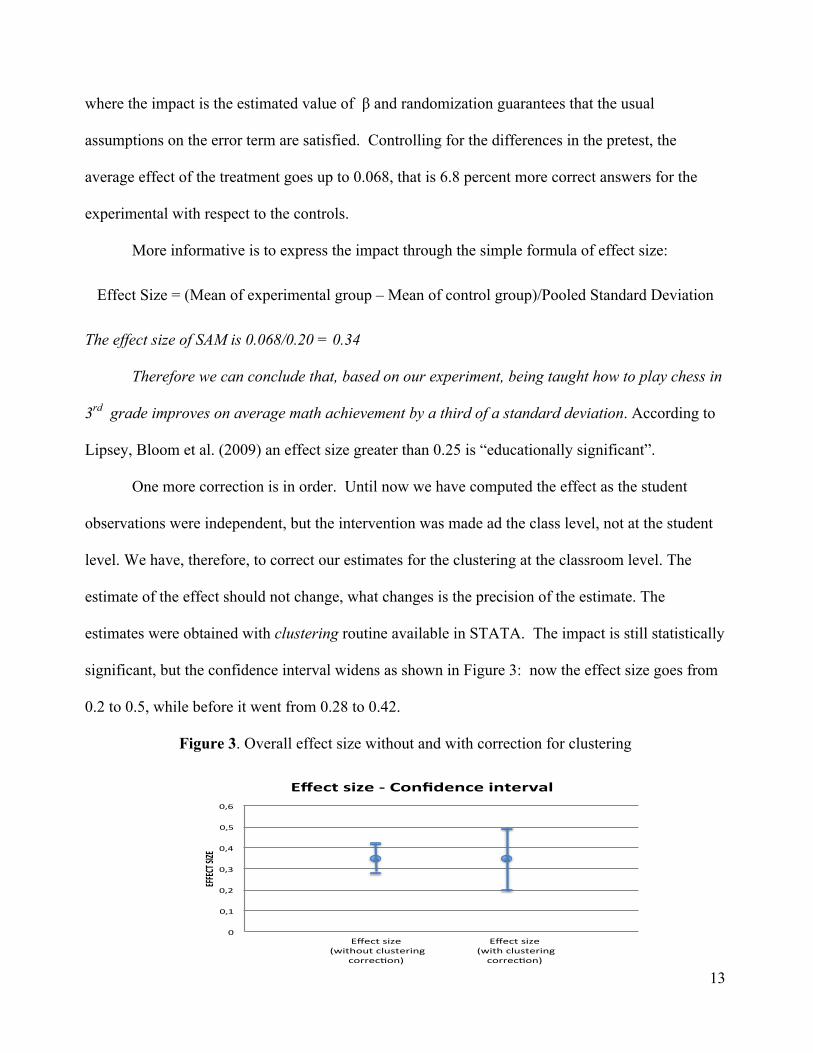
One more correction is in order. Until now we have computed the effect as the student
observations were independent, but the intervention was made ad the class level, not at the student
level. We have, therefore, to correct our estimates for the clustering at the classroom level. The
estimate of the effect should not change, what changes is the precision of the estimate. The
estimates were obtained with clustering routine available in STATA. The impact is still statistically
significant, but the confidence interval widens as shown in Figure 3: now the effect size goes from
0.2 to 0.5, while before it went from 0.28 to 0.42.
Figure 3. Overall effect size without and with correction for clustering
!"
!#$"
!#%"
!#&"
!#'"
!#("
!#)"
!""!#
$%&'(!
%
!)*+,%-./*%0%#1234*2+*%.2,*5678%
*+,-."/01,""230.4"-56/.,7089"
-:77,-;:8<"
*+,-."/01,""230.4:6."-56/.,7089"
-:77,-;:8<"
14
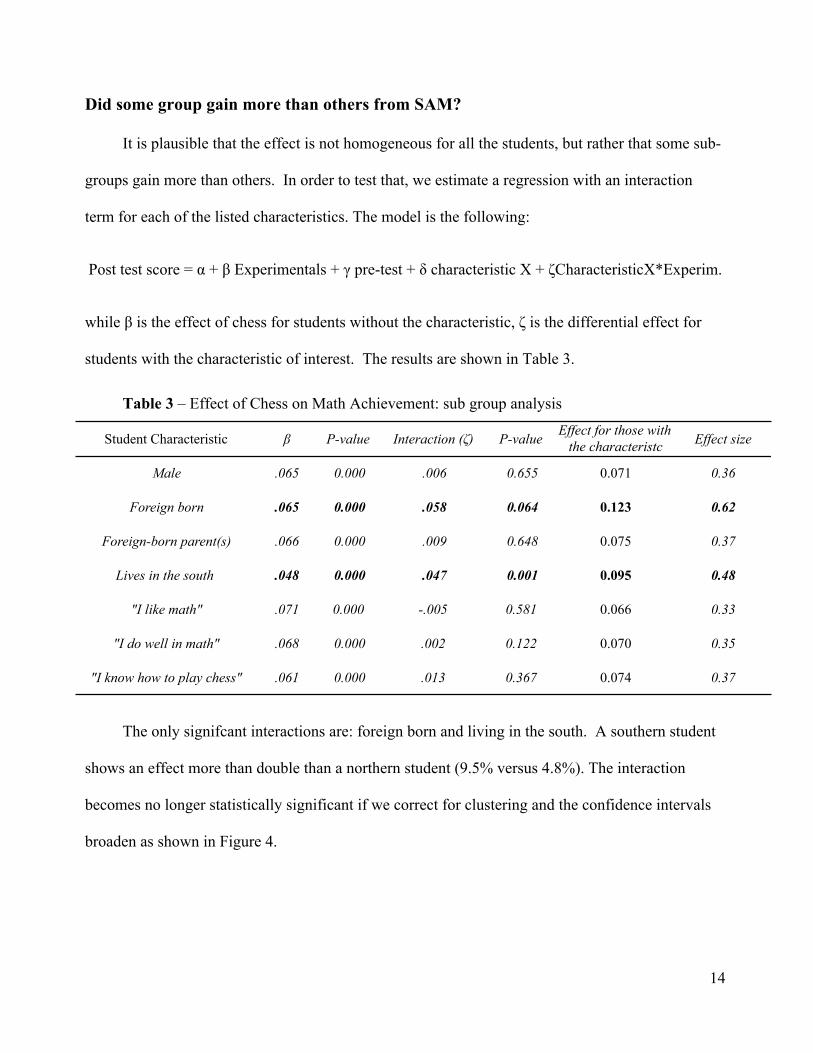
Did some group gain more than others from SAM?
It is plausible that the effect is not homogeneous for all the students, but rather that some sub-
groups gain more than others. In order to test that, we estimate a regression with an interaction
term for each of the listed characteristics. The model is the following:
Post test score = " + # Experimentals + $ pre-test + % characteristic X + &CharacteristicX*Experim.
while # is the effect of chess for students without the characteristic, & is the differential effect for
students with the characteristic of interest. The results are shown in Table 3.
Table 3 – Effect of Chess on Math Achievement: sub group analysis
The only signifcant interactions are: foreign born and living in the south. A southern student
shows an effect more than double than a northern student (9.5% versus 4.8%). The interaction
becomes no longer statistically significant if we correct for clustering and the confidence intervals
broaden as shown in Figure 4.
Student Characteristic ! P-value Interaction (") P-valueEffect for those with
the characteristc Effect size
Male .065 0.000 .006 0.655 0.071 0.36
Foreign born .065 0.000 .058 0.064 0.123 0.62
Foreign-born parent(s) .066 0.000 .009 0.648 0.075 0.37
Lives in the south .048 0.000 .047 0.001 0.095 0.48
"I like math" .071 0.000 -.005 0.581 0.066 0.33
"I do well in math" .068 0.000 .002 0.122 0.070 0.35
"I know how to play chess" .061 0.000 .013 0.367 0.074 0.37
15
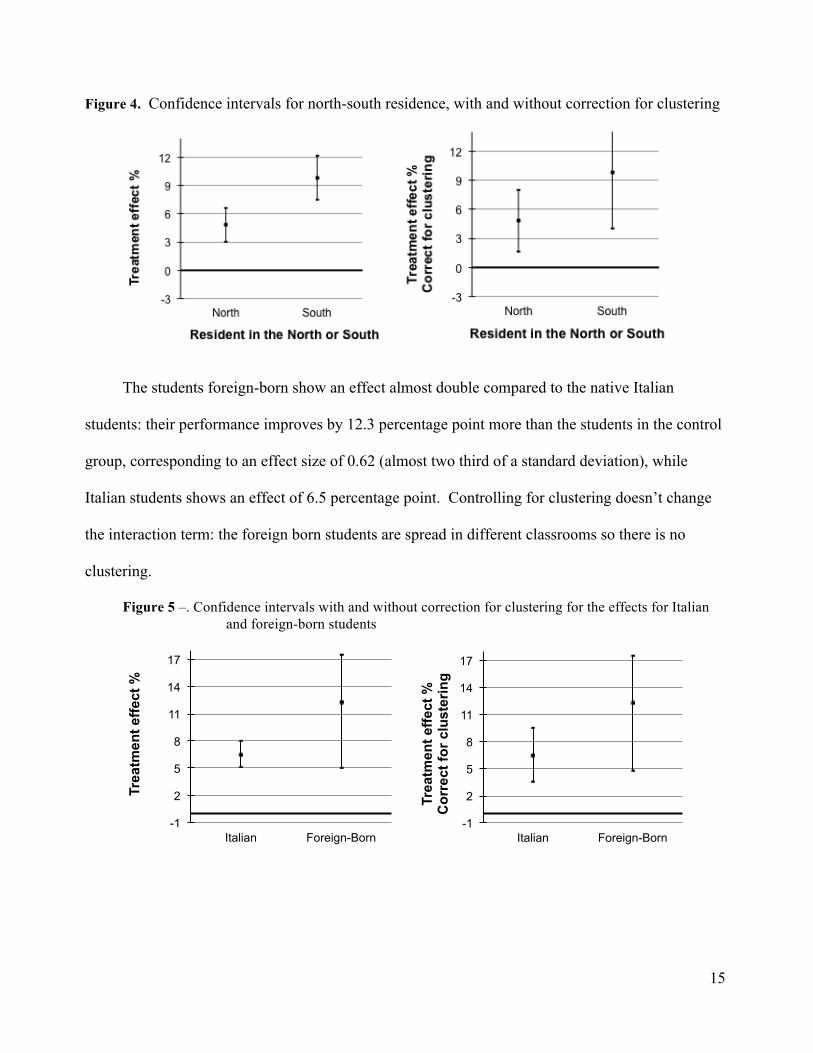
Figure 4. Confidence intervals for north-south residence, with and without correction for clustering
The students foreign-born show an effect almost double compared to the native Italian
students: their performance improves by 12.3 percentage point more than the students in the control
group, corresponding to an effect size of 0.62 (almost two third of a standard deviation), while
Italian students shows an effect of 6.5 percentage point. Controlling for clustering doesn’t change
the interaction term: the foreign born students are spread in different classrooms so there is no
clustering.
Figure 5 –. Confidence intervals with and without correction for clustering for the effects for Italian and foreign-born students
-1
2
5
8
11
14
17
Italian Foreign-Born
Trea
tmen
t effe
ct %
-1
2
5
8
11
14
17
Italian Foreign-Born
Trea
tmen
t eff
ect %
C
orre
ct fo
r cl
uste
ring

16
Cost of the intervention (Cost-effectiveness)
In the introduction we explained that SAM has been realized ‘on a shoestring’. Here we try to
estimate the cost-effectiveness of the intervention at the “shadow-price”. These are “prices for
goods and services that are supposed to reflect their true benefit and cost” (Rossi, Lipsey, Freeman.
2004).
The estimated at “shadow price” cost for 1,000 students is ! 72,000 (these include instructors
compensation, teaching materials, management costs. instructors’ professional development)
Cost for each student = 72,000/1000 = 72 !
Standardization in ! 1000 unit = 72/1000 = 0.072
Cost-effectiveness = Cost per student/Effect size = 0.072/0.36 = 0.2
This represents the cost-effectiveness computing the overall effect-size. If we look at the two
subgroups with bigger gains we have:
Southern students = 0.072/0.48 = 0.15
Foreign-born students = 0.072/0.62 = 0.08
Thus, teaching chess to foreign-born students appears to be the most cost-effective way to improve
math performance.
Discussion and Conclusions
Attrition
The students at the pre-test where 1,996 (1,071 experimentals and 925 controls), and the two
groups were equivalent, as we have shown in the equivalence study.
It is important to analyze the overall and differential attrition between the two conditions,
because “both contribute to the potential bias of the estimated effect of an intervention” (What
Works Clearinghouse, 2009)
17
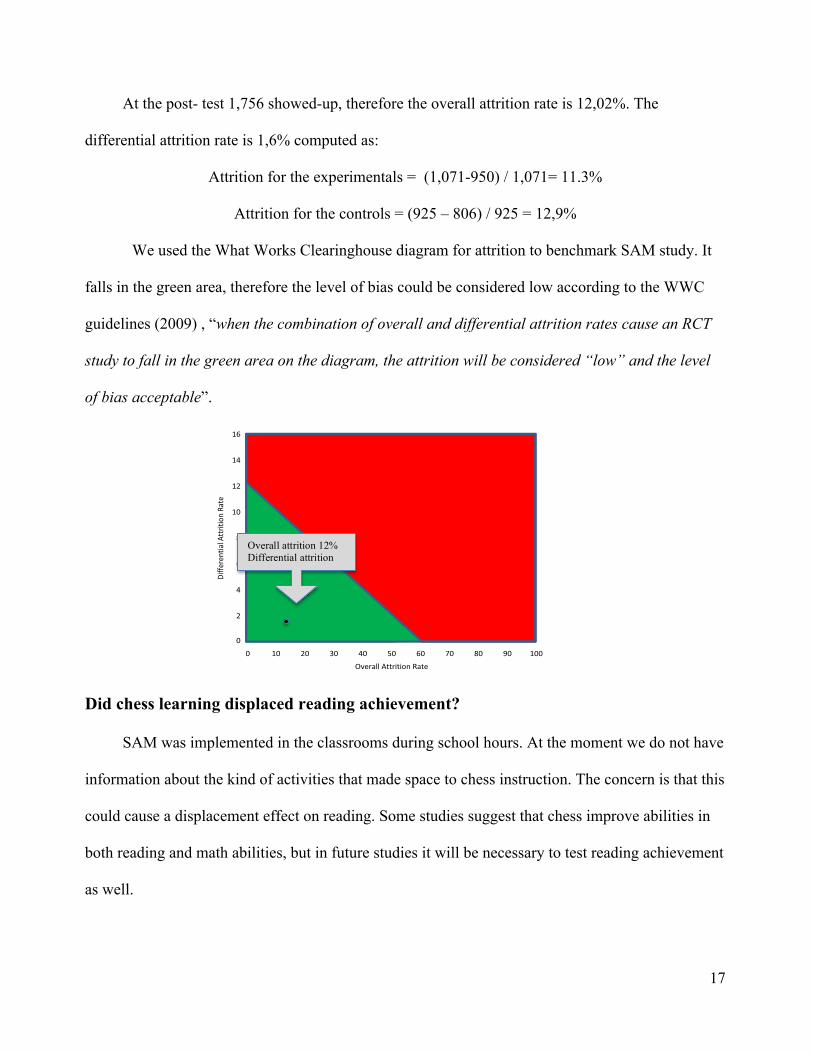
At the post- test 1,756 showed-up, therefore the overall attrition rate is 12,02%. The
differential attrition rate is 1,6% computed as:
Attrition for the experimentals = (1,071-950) / 1,071= 11.3%
Attrition for the controls = (925 – 806) / 925 = 12,9%
We used the What Works Clearinghouse diagram for attrition to benchmark SAM study. It
falls in the green area, therefore the level of bias could be considered low according to the WWC
guidelines (2009) , “when the combination of overall and differential attrition rates cause an RCT
study to fall in the green area on the diagram, the attrition will be considered “low” and the level
of bias acceptable”.
Did chess learning displaced reading achievement?
SAM was implemented in the classrooms during school hours. At the moment we do not have
information about the kind of activities that made space to chess instruction. The concern is that this
could cause a displacement effect on reading. Some studies suggest that chess improve abilities in
both reading and math abilities, but in future studies it will be necessary to test reading achievement
as well.
(Updated April 2009)
16
14
12
Diffe
rential!A
ttrition!Ra
te
10
8
6
4
2
0
!0 10 20 30 100
Overall!Attrition!Rate
40 50 60 70 80 90
Equivalence
If the study design is an RCT with high levels of attrition or a QED, the study must demonstrate baseline equivalence of the intervention and comparison groups for the analytic sample. Quick reviews examine a wide range of studies that examine effects on a diverse set of outcomes. Therefore, the key characteristics on which baseline equivalence must be established varies across studies. These pre-intervention characteristics should include baseline versions of the key outcome measures (collected prior to the intervention) or student characteristics that are likely to be highly correlated with these outcomes. They should also include key demographic characteristics that are likely to be correlated with key outcome measures, such as race/ethnicity or gender.
Groups are considered equivalent if the reported differences in pre-intervention characteristics of the groups are less than or equal to one-quarter of the pooled standard deviation in the sample, regardless of statistical significance. However, if differences are greater than 0.05 standard deviations and less than or equal to one-quarter of the pooled standard deviation in the sample, the analysis must control analytically for the individual-level pre-intervention characteristic(s) on which the groups differ. If pre-intervention differences are greater than 0.25, the study is not consistent with standards. In addition, if there is evidence that the populations were drawn from very different settings (such as rural versus urban, or high-SES versus low-SES), these settings may be deemed too dissimilar to provide an adequate comparison.
Overall attrition 12% Differential attrition 1.7

18
Lack of external validity
The intervention was made using a preexisting network without general announcement and
recruitment on large scale. All schools where volunteer and we do not have enough information to
judge it they are representative of the overall population of Italian schools (or at least of the schools
operating in the same area). Important development would be to randomly select schools within
which randomly assign classes, providing incentive for school participation and eventually
correcting for non- compliance
Concluding remarks
Despite a low budget, enthusiasm and commitment made it possible to mount a fairly well
designed study. We hope it could serve as an example of how evidence can be gathered to improve
the quality of education in Italy.
19
Bibliography
Berkman, R. M. (2004). The Chess and Mathematics Connection: More than Just a Game. Mathematics
Teaching in the Middle School, 9(5), 246-250.
Buki, J., & Ho, F. (2008). The Effect of Math and Chess Integrated Instruction on Math Scores | PRLog. The
Chess Academy. Retrieved from http://www.prlog.org/10086633-the-effect-of-math-and-chess-
integrated-instruction-on-math-scores.html
Campitelli, G., & Gobet, F. (2008). The role of practice in chess: A longitudinal study. Learning and
Individual Differences, 18, 446-458. doi:10.1016/j.lindif.2007.11.006
Ferguson R. (1983). "Developing Critical and Creative Thinking Through Chess",
Hong, S., & Bart, W. M. (2007). Cognitive Effects of Chess Instruction on Students at Risk for Academic
Failure. International Journal of Special Education, 22(3), 89-96.
Lipsey M., Bloom H., Hill C., Rebeck Black A. How Big is Big Enough? Achievement Effect Sizes in
Education. University of Pennsylvania Graduate School of Education, February 2007.
Liptrap J. M. (1998). Chess and Standard Test Scores
Marguiles S. (1991) "The Effect of Chess on Reading Scores: District Nine Chess Program Second Year
Report" Ph.D. dissertation. Retrieved from http://www.givewell.org/files/Analysis/margulies.pdf
Rossi, P. H., Lipsey, M. W., & Freeman, H. E. (2004). Evaluation. A Systematic Approach. Seventh Edition.
Thousand Oaks, CA: Sage.
Scholz, M., Niesch, H., Steffen, O., Ernst, B., Loeffler, M., Witruk, E., & Schwarz, H. (2008). Impact of
Chess Training on Mathematics Performance and Concentration Ability of Children with Learning
Disabilities. International Journal of Special Education, 23(3), 138-148.
Smith, J. P., & Cage. Bob N. (2000). The Effects of Chess Instruction on the Mathematics Achievement of
Southern, Rural, Black Secondary Students. Research in the Schools, 7(1), 19-26.
Sweller, J. & Clark, R.E. Kirschner, P.A. (2006). Why minimal guidance during instruction does not work:
An analysis of the failure of constructivist, discovery, problem-based, experiential, and inquiry based
teaching. Educational Psychologist, 41, 75-86.

20
Thompson M. (2003). Does the playing of chess lead to improved scholastic achievement? Issues In
Educational Research, Vol 13, 2003. Retrieved from http://www.iier.org.au/iier13/thompson.html
What Works Clearinghouse (2009). WWC Quick review protocol. Version 2.0 . Retrived from
http://ies.ed.gov/ncee/wwc/DownloadSRG.aspx