Embed Size (px)
Citation preview
Journal of Applied Finance & Banking, vol.1, no.1, 2011, 213-240 ISSN: 1792-6580 (print version), 1792-6599 (online) International Scientific Press, 2011
Does Government Linked Companies (GLCs)
perform better than non-GLCs?
Evidence from Malaysian listed companies Nazrul Hisyam Ab Razak1, Rubi Ahmad2 and Huson Aliahmed Joher3
Abstract
The purpose of this paper is to examine the impact of an alternative
ownership/control structure of corporate governance on firm performance.
Specifically, we investigated the governance system of government linked
companied (GLCs) in Malaysia. In this paper, we examine governance mechanism
and firm performance of Malaysian GLCs and non-GLCs over a 11 year period
from 1995 to 2005. We only select a sample of companies which are listed in
Main Board. We chose a sample of 210 firms. We used Tobin’s Q which is an
indicator of market performance is used as a proxy for company’s performances;
meanwhile ROA is used to determine accounting performance. . This paper is to
determines whether after controlling firm specific characteristics such as corporate
governance, agency cost, growth, risk and profitability, GLCs perform better than
non-GLCs. Findings highlight that non-GLCs performance is better GLCs in term
1 Faculty of Economics and Management, Universiti Putra Malaysia, e-mail: [email protected] 2 Faculty of Business and Accountancy, Universiti Malaya, e-mail: [email protected] 3 School of Accounting, Economics and Finance, Deakin University, Australia, e-mail: [email protected] Article Info: Revised: April 20, 2011. Published online: May 31, 2011.

214 Does GLCs perform better than non-GLCs?
of corporate governance, and other firm specific characteristics. The relationship
between ownership structure and firm performance has been issue of interest
among academics, investors and policy makers as one of key issues in
understanding the effectiveness of alternative governance systems where
government ownership serves as a control mechanism.
JEL classification numbers: G32
Keywords: Government ownership, Government linked companies, corporate
governance.
1 Introduction
Not many researches have been specifically done on government ownership and
firm value. Ang and Ding compared the financial and market performance of
Government Link Singaporean Companies (GLC) with non-GLCs in [4], where
each has a different set of governance structure, the key difference is government
ownership. Similarly the main objective in this paper is to determine whether
GLCs perform better than non-GLCs after controlling firm specific characteristics
such as corporate governance, agency cost, growth, risk and profitability. Besides
that, we also look on which of these companies specific characteristic for each
GLCs and non-GLCs explain performance of companies in Malaysia. In this
situation, we concentrate on government involvement in public listed companies
in Bursa Malaysia and compare with other selected companies which categorized
as non GLCs. We like to know whether government involvement will lead to
positive or negative impact on company performance. Countries like Singapore,
China, Korea and India as well as Malaysia which their government who is a part
of stakeholders in company and holding more than 20% and will lead to decision
making for companies. Some of these countries established their own organization
to manage or invest in domestics companies as well as overseas.

N.H. Razak, R.Ahmad and H.A. Joher 215
2 Review of Literature
The understanding on the empirical differences in corporate control particularly
government involvement has advanced recently. Many researchers discussed on
structure of ownership and performance but there is a limited study on discussing
the determinant of government ownership and performance specifically, on
comparing the performance of government ownership with non government
ownership.
The relationship between ownership structure and company performance has been
an important research topic during the last decades, and has produced ongoing
debate in the literature of corporate finance. Theoretical and empirical research on
the relationship between ownership structure and firm performance was originally
motivated by the separation of ownership from control [5] and more recently, by
agency theory (see [9] and [14]). Definitely, shareholders of company wish to
maximize value while managers prefer self-interested strategies which are far
from maximizing value, and in the absence of either appropriate incentives or
sufficient monitoring, managers can exercise their discretion to the detriment of
owners.
A number of studies have discussed ownership and company performance.
LaPorta, Silanes and Shleifer in his first study on ownership investigated the
ultimate control in company, [16]. He divided the owners into five types of
ultimate owners: (1) a family or an individual, (2) the State, 930 a widely held
financial institution such as a bank or an insurance company, (4) a widely held
corporation, or (5) miscellaneous, such as a corporative, a voting trust, or a group
with no single controlling investors. State control is a separate category because it
is a form of concentrated ownership in which the State uses firms to pursue
political objectives, while the public pays for losses, [24].
216 Does GLCs perform better than non-GLCs?
In [7], Claessen, Djankov and Lang have improved the study done by [16] and
applied it into East Asia. They investigated the separation of ownership and
control in 2980 public companies in 9 East Asian countries. Their findings
supported that corporate control typically enhances pyramid structure and cross
holding firms in all East Asian countries. Only for Singapore, about half of the
samples companies are controlled by state. Lemmon and Lins continued the
discussion on ownership structure, corporate governance and firm value from 800
firms in eight East Asian countries, [17]. Their findings showed that cumulative
stock returns of firms where managers and their families separate their control and
cash flow rights through pyramid ownership structures are lower by 12 percentage
points compared to those of other firms during the crisis period. They failed to
find any evidence that firms with a separation between cash flow rights and
control rights exhibit changes in performance different from firms with any such
separation during pre-crisis period.
Orden and Garmendia examined the relationship between ownership structure and
corporate performance in Spanish companies, [21]. Ownership structure has been
analyzed in terms of concentration of control and the type of investor exerting
control. Company performances which used in research were return on assets
(ROA) and return on equity (ROE). One of the findings is that companies under
control of government showed negative impact and have worse performance that
other ownership structures. Zeitun and Tian examined the impact of ownership
structure mix on company performance and the default risk of a sample of 59
publicly listed firms in Jordon from 1989 to 2002, [31]. The main findings were:
ownership structure has significant effects on the accounting measurement return
on assets (ROA); government shares are significantly negative related to the
company’s performance ROA and ROE (return on equity) but the results showed
positive related to market performance, Tobin’s Q.
N.H. Razak, R.Ahmad and H.A. Joher 217
Gursoy and Aydogan described on their paper [12] on main characteristics of
ownership structure of the Turkish nonfinancial companies listed on the Istanbul
Stock Exchange (ISE) and examined the impact of ownership structure on
performance and risk-taking behavior of Turkish companies. Specifically, they
tries to find out if foreign ownership (FRGN), government ownership (GOV),
cross ownership (CROSS), family ownership (FAM) and affiliation to a
conglomerate (CONG) has any impact on performance. Results indicated
government ownership show negative and significant when correlated with
accounting measurements (ROA and ROE) and when they controlled leverage and
size, it was negative but significant with market measurement (share price to EPS,
P/E).
Majority of studies have shown negative result when looking on government
ownership and performance or firm valuation. There are many reasons that explain
why government ownership results in poor financial performance. First, the
government is guided by social altruism, which may not be in line with the profit
motive. Second, the government is not the ultimate owner, but the agent of the real
owners – the citizens. And it is not the real owners who exercise governance, but
the bureaucrats. There is no personal interest for bureaucrats in ensuring that an
organization is run efficiently or governed well since they do not have any
benefits from good governance. Government-controlled companies may respond
to signals from the government to enhance national welfare or other non-profit
considerations, which may not relate well to a goal of value maximization, [27]. A
government corporation or government-owned corporation is a legal entity created
by a government to exercise some of the powers of the government. It may
resemble a not-for-profit corporation as it is not necessarily required to provide the
shareholders with return on their investment through price increase or dividends.
Its sole goal is to provide some kind of good or service for the public.

218 Does GLCs perform better than non-GLCs?
Not many researches have been specifically done on government ownership and
firm value. Ang and Ding compared the financial and market performance of
Government Link Singaporean Companies (GLC) with non-GLCs [4], where each
has a different set of governance structure, the key difference is government
ownership. Their study found that GLCs on average exhibit higher valuations than
non-GLCs, even after controlling for firm specific factors such as profitability,
leverage, firm size, industry and foreign ownership. Majumdar compared the
financial performance of state owned, private owned, and mixed state-private
ownership firms in India from 1973 to 1989, [19]. His analysis suggests that the
most profitable firms were privately owned followed by mixed ownership. State
owned enterprises had the worst performance. A majority of other studies in India
and abroad draw similar conclusions (see [22], [23] and [24]).
Tian and Estrin found that government ownership reduce corporate value due to
political interference in China, [26]. Also in another paper Xu, Pan, Wu and Yim
found that government enterprises have lower profitability than non-government
enterprises, [29]. In [30], Xu and Wang examined the performance of domestic
Chinese firms in various ownership categories versus foreign-invested enterprises
(FIEs) based on two nation-wide surveys conducted by the National Bureau of
Statistics in 1998 and 2002. They found that both domestic non-state-owned firms
and foreign-invested enterprises performed better than state-owned enterprises. At
the same time, three categories of Chinese firms privately owned, collectively
owned, and shareholding had higher performance levels than the foreign invested
enterprises. For European countries, especially Germany, Companies which are
under Treuhand (govt.’s privatization agency) and Management KGs (government
ownership organization) performed better than before privatization, [8].
Bortolotti and Faccio studied the change in government control of privatized firms
in OECD countries, [6]. In their research, they used the term of golden share
which is defined as a set of State’s special power and statutory constraints on
N.H. Razak, R.Ahmad and H.A. Joher 219
privatized companies.4 One of findings shows that the ultimate voting rights held
by government in company (i), in year (t) showed positive and significant
correlation after controlling country and firm specific explanatory variables
(which one of variables is ROE and market to book value). In another study [15],
Kirchmaer and Grant on corporate ownership structure and performance in Europe
identified state ownership is a third largest shareholder type in Italy and France.
Summary results for both countries found that state ownership showed negative
relationship between performance and corporate governance and other control
variables. Relevantly, major factor was the influences of politician on company
decision making, as well as protection from market discipline.
Bureaucrats and governments respond to various interest groups (e.g. trade
unions) as part of their social agenda, [18]. Finally, even if the public can exercise
control directly, it is unlikely to be effective because of the extreme dispersion of
the principals. Any social or non-social benefits are likely to be so diffused among
the electorate that it is unlikely that there will be much of an incentive to exercise
any governance over the organization to ensure it performs effectively, [2]. There
is considerable awareness about the poor financial performance of governments
owned enterprises and the governments have started the process of privatization in
recent years. However, the progress has been extremely slow. Many vested
interests – employees, unions, bureaucrats and other political realities impede the
process of privatization.
4Special power include (i) the right to appoints members in corporate board;(ii) the right to consent to or to veto the acquisition of relevant interests in the privatized companies; (iii) other rights such as to consent to the transfer of subsidiaries, dissolution of the company, ordinary management, etc.
220 Does GLCs perform better than non-GLCs?
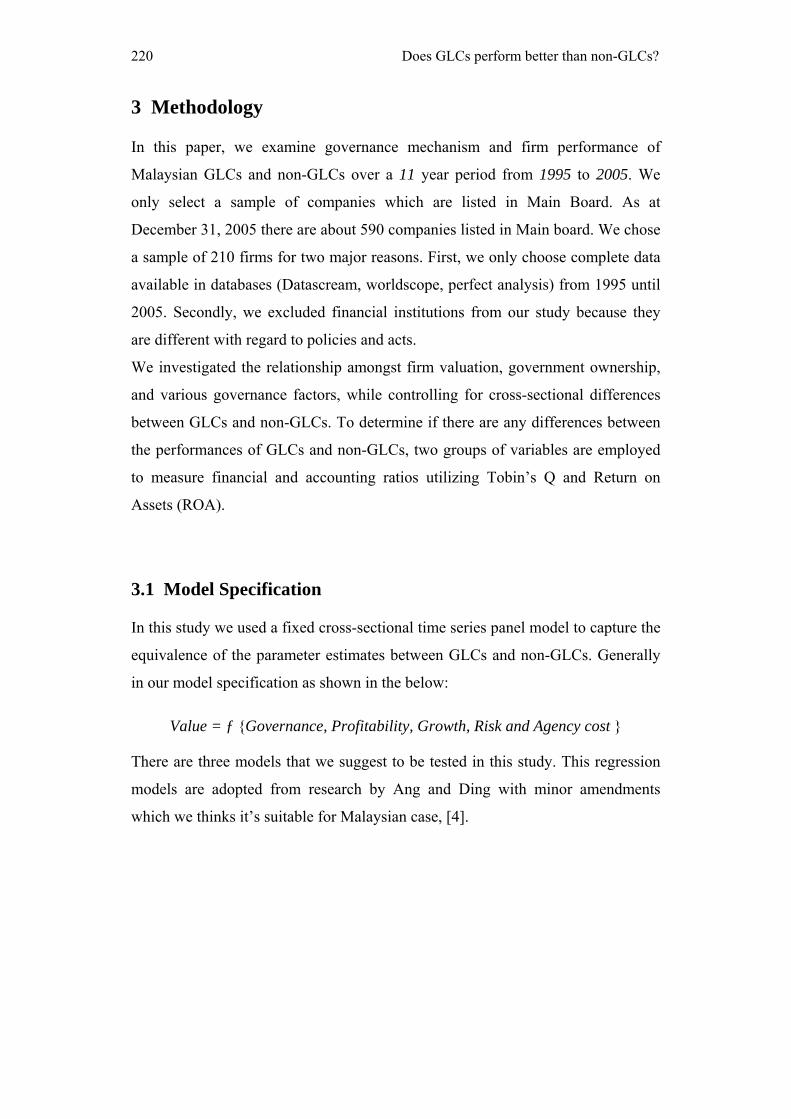
3 Methodology
In this paper, we examine governance mechanism and firm performance of
Malaysian GLCs and non-GLCs over a 11 year period from 1995 to 2005. We
only select a sample of companies which are listed in Main Board. As at
December 31, 2005 there are about 590 companies listed in Main board. We chose
a sample of 210 firms for two major reasons. First, we only choose complete data
available in databases (Datascream, worldscope, perfect analysis) from 1995 until
2005. Secondly, we excluded financial institutions from our study because they
are different with regard to policies and acts.
We investigated the relationship amongst firm valuation, government ownership,
and various governance factors, while controlling for cross-sectional differences
between GLCs and non-GLCs. To determine if there are any differences between
the performances of GLCs and non-GLCs, two groups of variables are employed
to measure financial and accounting ratios utilizing Tobin’s Q and Return on
Assets (ROA).
3.1 Model Specification
In this study we used a fixed cross-sectional time series panel model to capture the
equivalence of the parameter estimates between GLCs and non-GLCs. Generally
in our model specification as shown in the below:
Value = ƒ {Governance, Profitability, Growth, Risk and Agency cost }
There are three models that we suggest to be tested in this study. This regression
models are adopted from research by Ang and Ding with minor amendments
which we thinks it’s suitable for Malaysian case, [4].
N.H. Razak, R.Ahmad and H.A. Joher 221
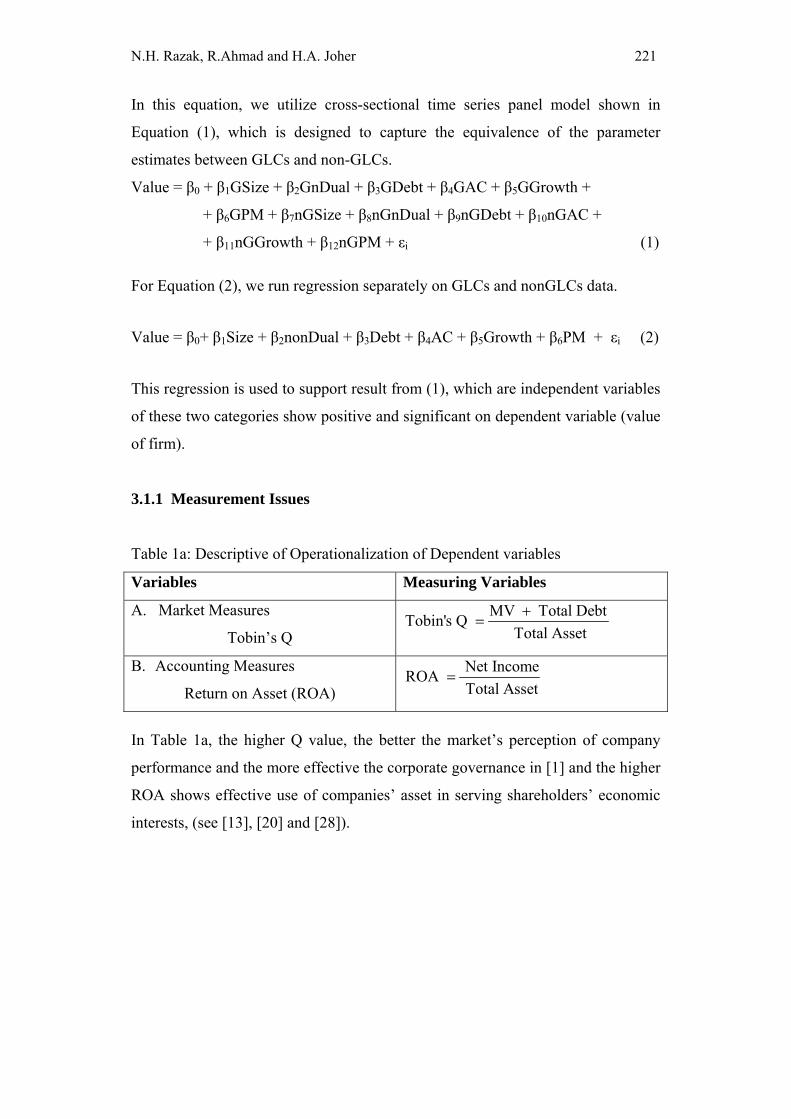
In this equation, we utilize cross-sectional time series panel model shown in
Equation (1), which is designed to capture the equivalence of the parameter
estimates between GLCs and non-GLCs.
Value = β0 + β1GSize + β2GnDual + β3GDebt + β4GAC + β5GGrowth +
+ β6GPM + β7nGSize + β8nGnDual + β9nGDebt + β10nGAC +
+ β11nGGrowth + β12nGPM + εi (1)
For Equation (2), we run regression separately on GLCs and nonGLCs data.
Value = β0+ β1Size + β2nonDual + β3Debt + β4AC + β5Growth + β6PM + εi (2)
This regression is used to support result from (1), which are independent variables
of these two categories show positive and significant on dependent variable (value
of firm).
3.1.1 Measurement Issues
Table 1a: Descriptive of Operationalization of Dependent variables
Variables Measuring Variables
A. Market Measures
Tobin’s Q
MV Total DebtTobin's Q Total Asset+
=
B. Accounting Measures
Return on Asset (ROA)
Net IncomeROA Total Asset
=
In Table 1a, the higher Q value, the better the market’s perception of company
performance and the more effective the corporate governance in [1] and the higher
ROA shows effective use of companies’ asset in serving shareholders’ economic
interests, (see [13], [20] and [28]).
222 Does GLCs perform better than non-GLCs?
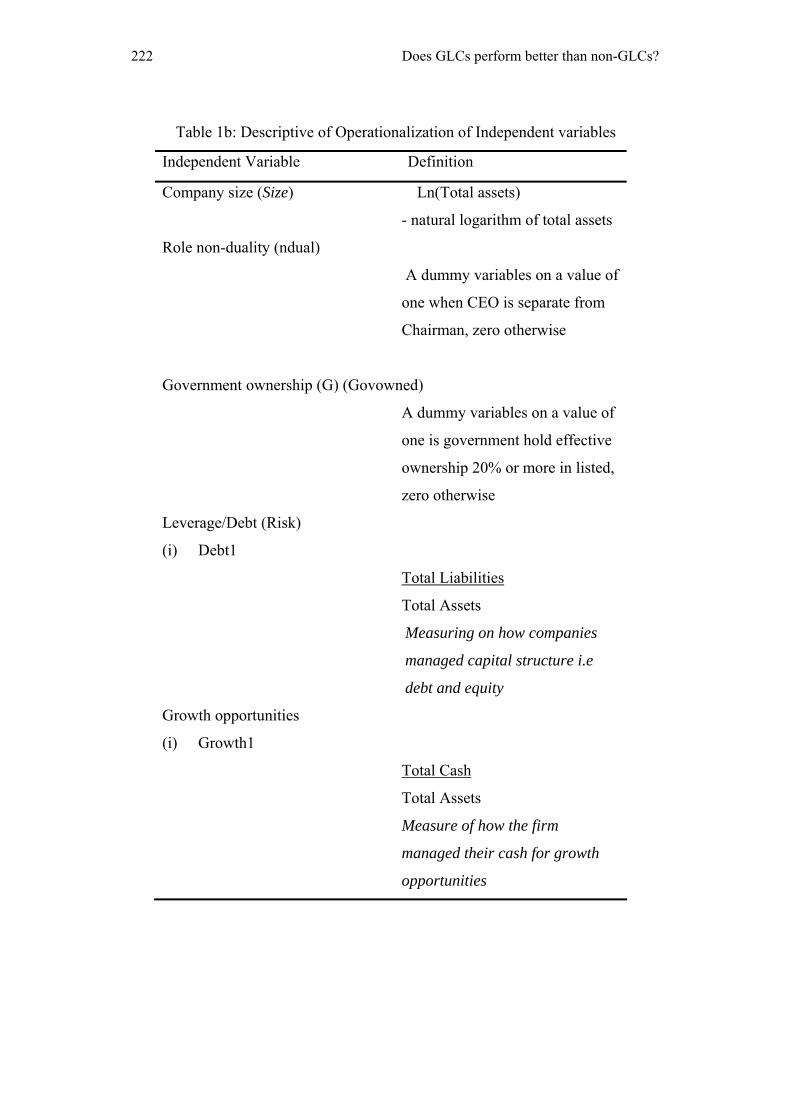
Table 1b: Descriptive of Operationalization of Independent variables
Independent Variable Definition
Company size (Size) Ln(Total assets)
- natural logarithm of total assets
Role non-duality (ndual)
A dummy variables on a value of
one when CEO is separate from
Chairman, zero otherwise
Government ownership (G) (Govowned)
A dummy variables on a value of
one is government hold effective
ownership 20% or more in listed,
zero otherwise
Leverage/Debt (Risk)
(i) Debt1
Total Liabilities
Total Assets
Measuring on how companies
managed capital structure i.e
debt and equity
Growth opportunities
(i) Growth1
Total Cash
Total Assets
Measure of how the firm
managed their cash for growth
opportunities
N.H. Razak, R.Ahmad and H.A. Joher 223
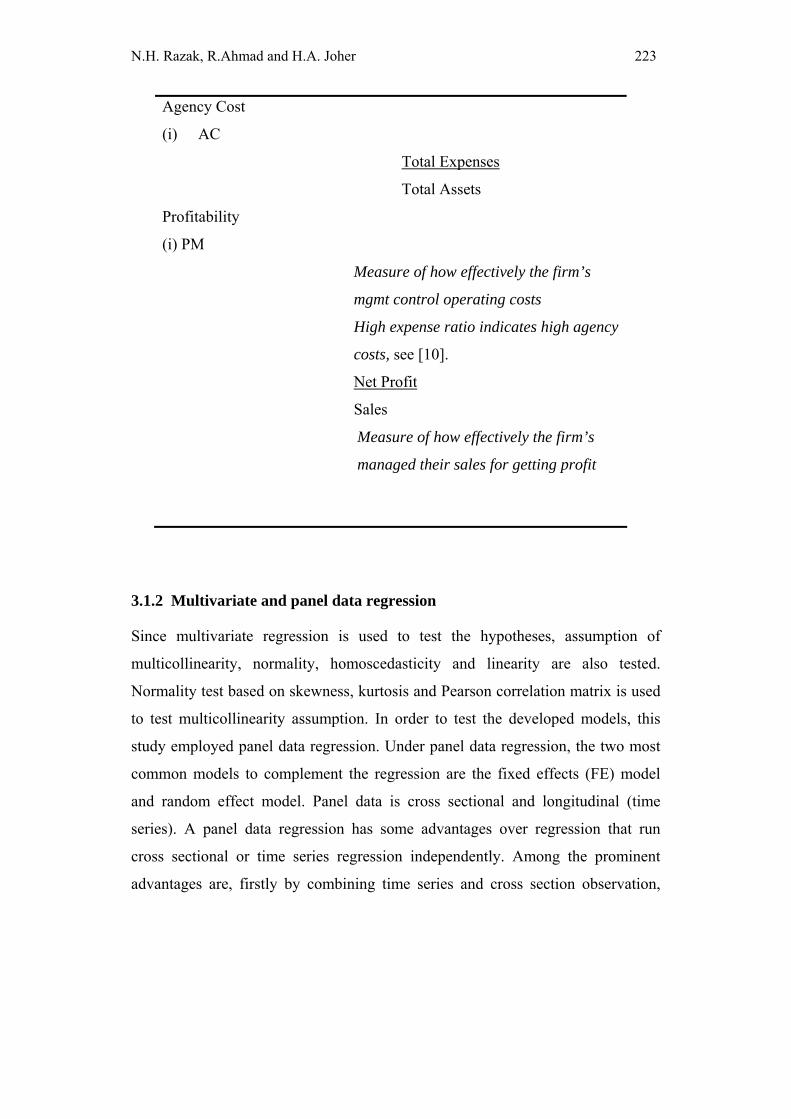
Agency Cost
(i) AC
Total Expenses
Total Assets
Profitability
(i) PM
Measure of how effectively the firm’s
mgmt control operating costs
High expense ratio indicates high agency
costs, see [10].
Net Profit
Sales
Measure of how effectively the firm’s
managed their sales for getting profit
3.1.2 Multivariate and panel data regression
Since multivariate regression is used to test the hypotheses, assumption of
multicollinearity, normality, homoscedasticity and linearity are also tested.
Normality test based on skewness, kurtosis and Pearson correlation matrix is used
to test multicollinearity assumption. In order to test the developed models, this
study employed panel data regression. Under panel data regression, the two most
common models to complement the regression are the fixed effects (FE) model
and random effect model. Panel data is cross sectional and longitudinal (time
series). A panel data regression has some advantages over regression that run
cross sectional or time series regression independently. Among the prominent
advantages are, firstly by combining time series and cross section observation,
224 Does GLCs perform better than non-GLCs?
panel data give more informative data, variability, less collinearity among the
variables, more degree of freedoms and more efficiency, [11]. Secondly, by
making data available for thousand units, a panel data can minimize the biasness
that might happen if individuals or firms level data are divided into broad
aggregates. Lastly, panel data can better detect and measure effects that simply
cannot be observed in pure cross-section or pure time series data.
4 Result and analysis
While various forms of acceptable governance in each country evolves from a
country’s history, values, and culture, certain characteristics of superior
governance have been documented in the literature (e.g. [24]). We have
considered the role of corporate governance and government control in the context
of Malaysian firms and its capital market and examined the issue of value
relevance of corporate governance and governmental control in assessing firm
value. We compare the financial performance of GLCs with non-GLCs, and
determine whether government ownership and various governance measures
contribute to accounting and market based firm valuation, using panel and pooled
regression analyses.
From that, we extracted companies which are government owned to determine
whether various corporate governances have significant impact on accounting and
market based firm valuation.
Before estimating the proposed models, the stationary normal distribution of the
data, multicollinearity, autocorrelation and heteroskedascity problems are some
econometrics issues that need to be identified and ratified. This section will
provide results of the various econometrics tests that help to detect these
problems. In addition various remedies to these problems are also suggested.
N.H. Razak, R.Ahmad and H.A. Joher 225
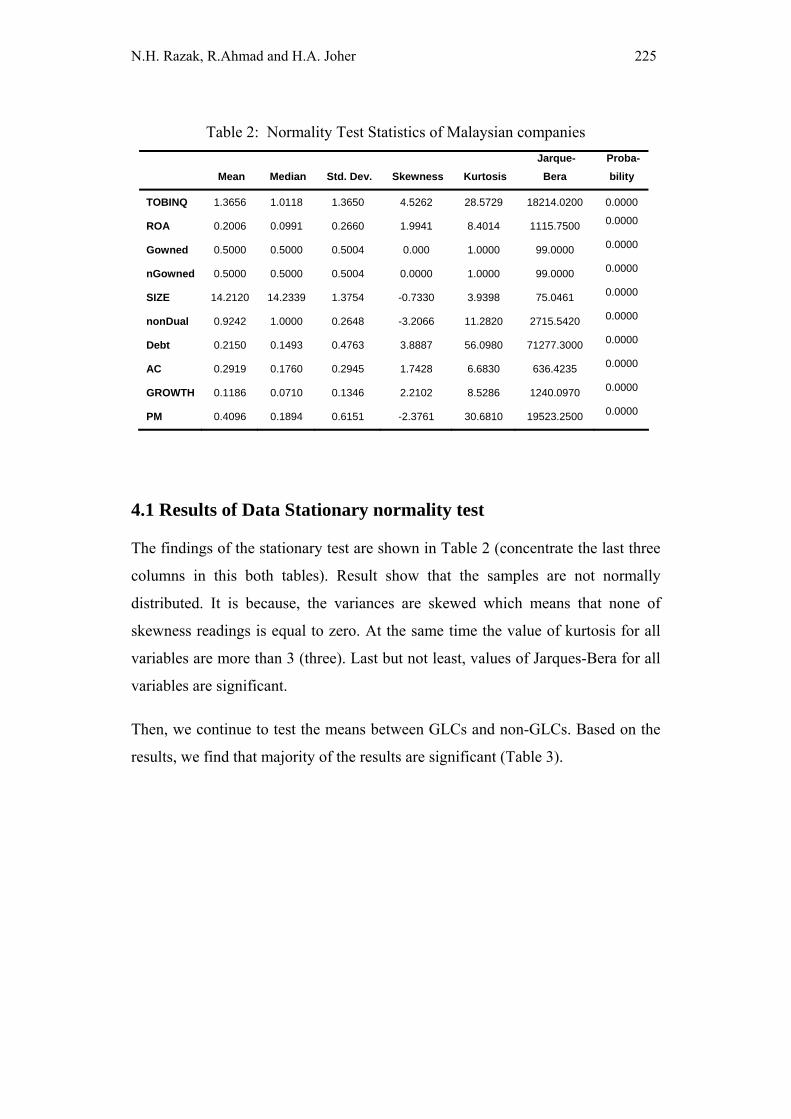
Table 2: Normality Test Statistics of Malaysian companies
Mean Median Std. Dev. Skewness Kurtosis Jarque-
Bera Proba- bility
TOBINQ 1.3656 1.0118 1.3650 4.5262 28.5729 18214.0200 0.0000
ROA 0.2006 0.0991 0.2660 1.9941 8.4014 1115.7500 0.0000
Gowned 0.5000 0.5000 0.5004 0.000 1.0000 99.0000 0.0000
nGowned 0.5000 0.5000 0.5004 0.0000 1.0000 99.0000 0.0000
SIZE 14.2120 14.2339 1.3754 -0.7330 3.9398 75.0461 0.0000
nonDual 0.9242 1.0000 0.2648 -3.2066 11.2820 2715.5420 0.0000
Debt 0.2150 0.1493 0.4763 3.8887 56.0980 71277.3000 0.0000
AC 0.2919 0.1760 0.2945 1.7428 6.6830 636.4235 0.0000
GROWTH 0.1186 0.0710 0.1346 2.2102 8.5286 1240.0970 0.0000
PM 0.4096 0.1894 0.6151 -2.3761 30.6810 19523.2500 0.0000
4.1 Results of Data Stationary normality test
The findings of the stationary test are shown in Table 2 (concentrate the last three
columns in this both tables). Result show that the samples are not normally
distributed. It is because, the variances are skewed which means that none of
skewness readings is equal to zero. At the same time the value of kurtosis for all
variables are more than 3 (three). Last but not least, values of Jarques-Bera for all
variables are significant.
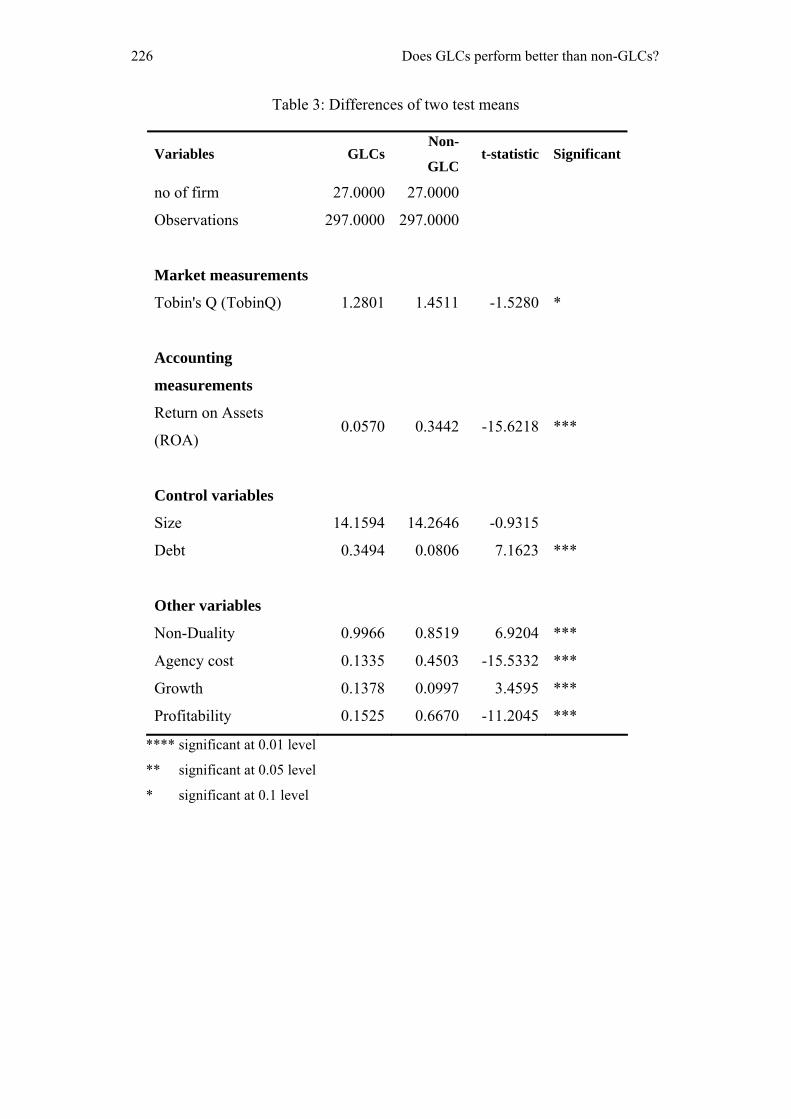
Then, we continue to test the means between GLCs and non-GLCs. Based on the
results, we find that majority of the results are significant (Table 3).
226 Does GLCs perform better than non-GLCs?
Table 3: Differences of two test means
Variables GLCsNon-
GLCt-statistic Significant
no of firm 27.0000 27.0000
Observations 297.0000 297.0000
Market measurements
Tobin's Q (TobinQ) 1.2801 1.4511 -1.5280 *
Accounting
measurements
Return on Assets
(ROA) 0.0570 0.3442 -15.6218 ***
Control variables
Size 14.1594 14.2646 -0.9315
Debt 0.3494 0.0806 7.1623 ***
Other variables
Non-Duality 0.9966 0.8519 6.9204 ***
Agency cost 0.1335 0.4503 -15.5332 ***
Growth 0.1378 0.0997 3.4595 ***
Profitability 0.1525 0.6670 -11.2045 ***
**** significant at 0.01 level
** significant at 0.05 level
* significant at 0.1 level
N.H. Razak, R.Ahmad and H.A. Joher 227
4.2 Financial and market performance
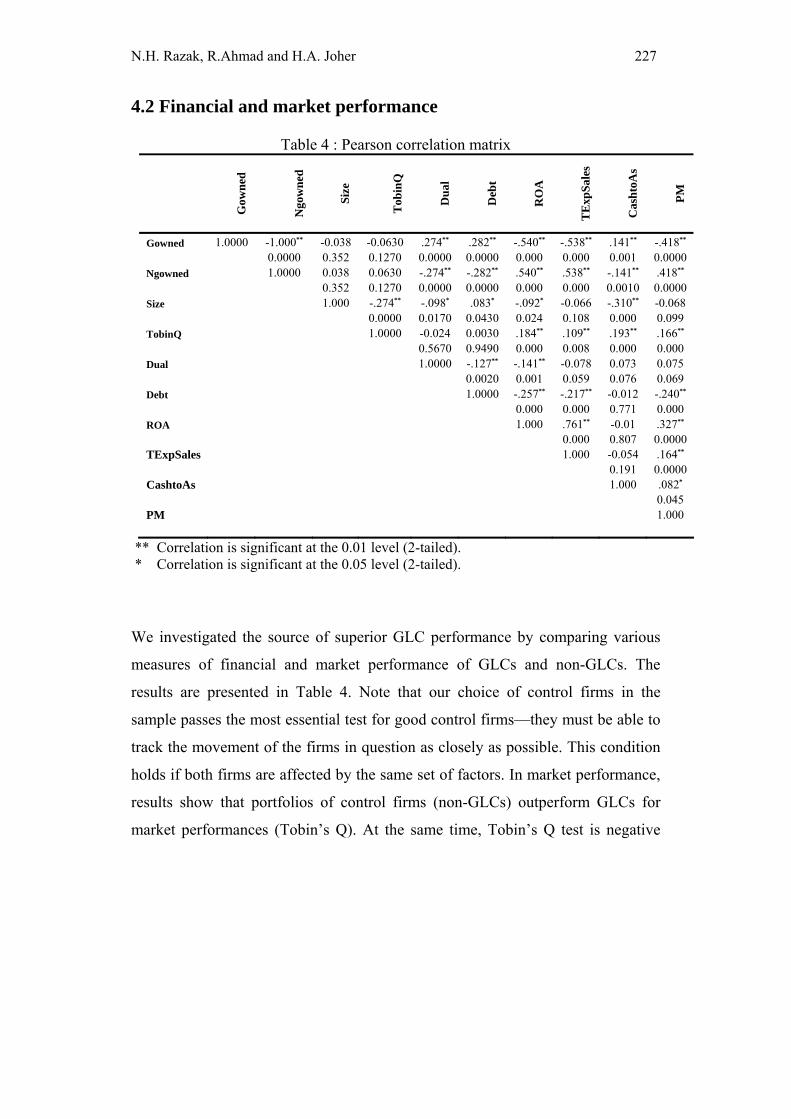
Table 4 : Pearson correlation matrix
G
owne
d
Ngo
wne
d
Size
Tob
inQ
Dua
l
Deb
t
RO
A
TE
xpSa
les
Cas
htoA
s
PM
Gowned 1.0000 -1.000** -0.038 -0.0630 .274** .282** -.540** -.538** .141** -.418** 0.0000 0.352 0.1270 0.0000 0.0000 0.000 0.000 0.001 0.0000 Ngowned 1.0000 0.038 0.0630 -.274** -.282** .540** .538** -.141** .418** 0.352 0.1270 0.0000 0.0000 0.000 0.000 0.0010 0.0000 Size 1.000 -.274** -.098* .083* -.092* -0.066 -.310** -0.068 0.0000 0.0170 0.0430 0.024 0.108 0.000 0.099 TobinQ 1.0000 -0.024 0.0030 .184** .109** .193** .166** 0.5670 0.9490 0.000 0.008 0.000 0.000 Dual 1.0000 -.127** -.141** -0.078 0.073 0.075 0.0020 0.001 0.059 0.076 0.069 Debt 1.0000 -.257** -.217** -0.012 -.240** 0.000 0.000 0.771 0.000 ROA 1.000 .761** -0.01 .327** 0.000 0.807 0.0000 TExpSales 1.000 -0.054 .164** 0.191 0.0000 CashtoAs 1.000 .082* 0.045 PM 1.000
** Correlation is significant at the 0.01 level (2-tailed). * Correlation is significant at the 0.05 level (2-tailed).
We investigated the source of superior GLC performance by comparing various
measures of financial and market performance of GLCs and non-GLCs. The
results are presented in Table 4. Note that our choice of control firms in the
sample passes the most essential test for good control firms—they must be able to
track the movement of the firms in question as closely as possible. This condition
holds if both firms are affected by the same set of factors. In market performance,
results show that portfolios of control firms (non-GLCs) outperform GLCs for
market performances (Tobin’s Q). At the same time, Tobin’s Q test is negative

228 Does GLCs perform better than non-GLCs?
and significant at the 1% level. For accounting purpose (ROA 5, the result shows
GLCs perform better than non GLCs. We find that ROA’s result is positive and
significant at the 1% level. On the same token, we refer to Table 4 (Pearson’s
correlation coefficient)6, when the result explains that GLCs have negative
correlation with Tobin’s Q but not with ROA. It indicates that non-GLCs perform
well on market performance and not on accounting performance. This negative
correlation is due to the decrease in share prices for government companies
especially after Asian economic crisis.
As mentioned earlier, government owned a large percentage of market
capitalization therefore, it played a major role in decreasing the market price when
crisis hit Malaysia until recovery section in 2000 onwards. Our result is
inconsistent with that of Ang and Ding [4] and Singh and Siah [25]. Their study
suggested that GLCs outperform non-GLCs on both counts of profitability (ROA
and ROE). Ang and Ding’s result in Singapore study show that GLCs are able to
achieve at least similar levels of profitability and are as efficient as non-GLCs.
In determining the leverage, we tested the debt ratio (Total Debt to Total Assets).
We found that leverage ratio shows that GLCs have lower debt than non GLCs
with negative correlation but significant at 5% level. It means that non-GLCs tend
to have larger leverage than GLCs. Similarly, we look on growth opportunities
for both sides. Results show that GLCs tend to have lower asset turnover than
non-GLCs.7 We also found that GLCs maintain a significantly higher cash to asset
ratio than non-GLCs and it is positively correlated and significant at the 1% level.
Because of higher debt structures of GLCs they tend to hold higher amount of
cash to meet greater interest payments and unexpected cash shortfalls. GLCs and 5 It’s support by GLCs have higher profit margin than non-GLCs in Table 4. 6 Table 4 presents the correlation matrix between independent and dependent variables. Result shows that no multicollinearity problem as the correlation is relatively low. 7 The finding of a lower asset tournover among GLCs is not inconsistent with that of Singh and Siah in [25], where GLCs exhibits a higher asset turnover in three industries and lower turnover in four other industries.

N.H. Razak, R.Ahmad and H.A. Joher 229
their investment companies have to provide their own cash reserves against
distress and are not expected to be financially dependent on the government.
In measuring agency costs, we examined the expense to assets [3] and results
show that GLCs in fact have lower expenses at the 1% level.8 This finding is
supported by Pearson’s correlation in Table 4 which shows negative correlation
and significant for both ratios. The finding indicates that GLCs in Malaysia are
different from the generally inefficient nationalized firms that are run by the
government and are more apt at managing expenses than non-GLCs.
In summary, we can conclude that GLCs tend to exhibit higher valuation than
non-GLCs due to their ability to earn higher returns on their investments. GLCs
also run more efficient and with lower operation expenses than non-GLCs. The
results support our hypothesis that GLCs outperform non-GLCs not only in
market based valuation measures, but also in accounting based measures of
internal process efficiency.
5 Panel and pooled regression analysis Prior evidence shows that investors value good corporate governance. If certain
governance measures are positively related to firm value, we can determine if
government involvement in GLCs helps to increase firm value by emphasizing
those areas of corporate governance. Therefore, we used panel and pooled
regression by equation (1).
8 Total expenses include administration expenses, interest expenses and depreciation.

230 Does GLCs perform better than non-GLCs?
Table 5: Fixed Panel regressions on performance(s) and independent variables
Panel A (i):
Tobin’s Q with Fixed effect
Panel B (i):
ROA with Fixed effect
Variable
Coef-
ficient t-Statistic Prob. Variable
Coef-
ficient
t-
Statistic Prob.
C 2.3847 4.5894 0.0000 C 0.2207 2.7426 0.0063
GSize -0.0464 -1.4273 0.1540 GSize -0.0078 -1.5238 0.1281
GnDual -0.8987 -1.3789 0.1685 GnDual -0.0678 -0.7973 0.4256
GDebt 0.2712 1.5108 0.1314 GDebt -0.0464 -1.3345 0.1826
GAC -0.3239 -1.1637 0.2450 GAC -0.0127 -0.2784 0.7808
GGrowth 1.2650 4.1464*** 0.0000 GGrowth 0.1371 2.3586** 0.0187
GPM 0.1285 1.8568* 0.0638 GPM 0.0891 7.2864*** 0.0000
nGSize -0.1024 -3.028*** 0.0026 nGSize -0.0120 -2.2796** 0.0230
nGnDual -0.4207 -3.1541*** 0.0017 nGnDual -0.0863 -3.6486*** 0.0003
nGDebt 0.0221 0.2620 0.7934 nGDebt -0.0173 -1.2816 0.2005
nGAC 0.5006 3.6584*** 0.0003 nGAC 0.7967 31.7288*** 0.0000
nG
Growth 0.5209 1.4367 0.1513
nG
Growth -0.1120 -1.7794* 0.0757
nGPM 0.3270 3.2939*** 0.0010 Ngpm 0.0300 1.7180* 0.0863
R-
squared 0.1092
R-
squared 0.7616
Adj R-
squared 0.0908
Adj R-
squared 0.7566
F-
statistic 5.9363
F-
statistic 154.6317
Prob
(F-stat) 0.0000
Prob
(F-stat) 0.0000
*** Correlation is significant at the 0.01 level ** Correlation is significant at the 0.05 level * Correlation is significant at the 0.1 level
N.H. Razak, R.Ahmad and H.A. Joher 231
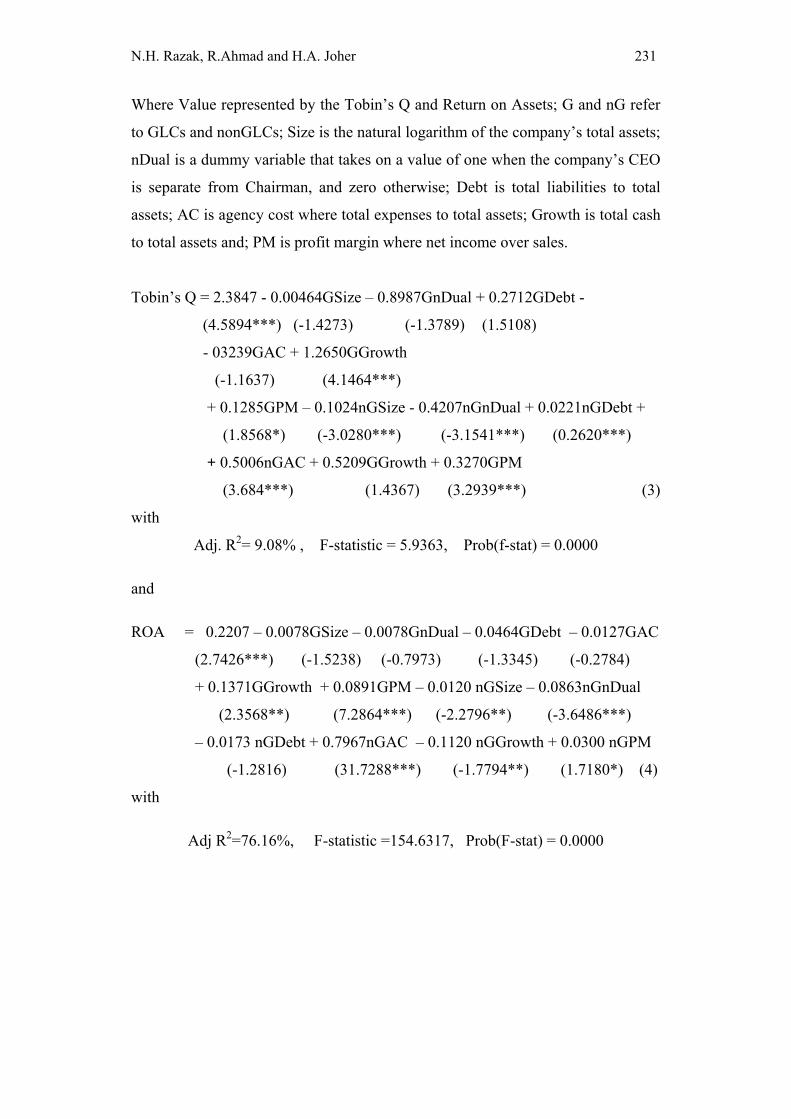
Where Value represented by the Tobin’s Q and Return on Assets; G and nG refer
to GLCs and nonGLCs; Size is the natural logarithm of the company’s total assets;
nDual is a dummy variable that takes on a value of one when the company’s CEO
is separate from Chairman, and zero otherwise; Debt is total liabilities to total
assets; AC is agency cost where total expenses to total assets; Growth is total cash
to total assets and; PM is profit margin where net income over sales.
Tobin’s Q = 2.3847 - 0.00464GSize – 0.8987GnDual + 0.2712GDebt -
(4.5894***) (-1.4273) (-1.3789) (1.5108)
- 03239GAC + 1.2650GGrowth
(-1.1637) (4.1464***)
+ 0.1285GPM – 0.1024nGSize - 0.4207nGnDual + 0.0221nGDebt +
(1.8568*) (-3.0280***) (-3.1541***) (0.2620***)
+ 0.5006nGAC + 0.5209GGrowth + 0.3270GPM
(3.684***) (1.4367) (3.2939***) (3)
with
Adj. R2= 9.08% , F-statistic = 5.9363, Prob(f-stat) = 0.0000
and
ROA = 0.2207 – 0.0078GSize – 0.0078GnDual – 0.0464GDebt – 0.0127GAC
(2.7426***) (-1.5238) (-0.7973) (-1.3345) (-0.2784)
+ 0.1371GGrowth + 0.0891GPM – 0.0120 nGSize – 0.0863nGnDual
(2.3568**) (7.2864***) (-2.2796**) (-3.6486***)
– 0.0173 nGDebt + 0.7967nGAC – 0.1120 nGGrowth + 0.0300 nGPM
(-1.2816) (31.7288***) (-1.7794**) (1.7180*) (4)
with
Adj R2=76.16%, F-statistic =154.6317, Prob(F-stat) = 0.0000
232 Does GLCs perform better than non-GLCs?
We report the results of a panel regression with fixed effect by (1) in Table above.
In Equation (3), we find that our result is significant at any level of significance,
which resulted in F-statistic = 5.9363. Our adjusted R2 of 9.08% shows that there
is no heteroskedascitiy. Firm values of Tobin’s Q is positive and significant even
after controlling for common governance measure such as non duality, firm
specific differences such as profitability, risk and growth. In details, in market
measurement, we found only growth and profitability of GLCs significant and
positive. Non-GLCs size, non-duality, agency cost and profitability show
significant but different relationship. And agency cost and profitability indicate
significant positive relationship at any level of correlation additionally size and
non-duality are negative but significant. Debt and growth in non-GLCs do not
show any significant relationship significant. As the overall conclusion, we
identify that size of non-GLCs has effect on market performance but not for GLCs
which is negatively correlated with 1% level of significant. It’s mean that small
size of company in non-GLCs will lead to high company performance but not for
larger company.
For accounting measurements (ROA) in equation, we find that adjusted R-squared
is 75.66% and F-statistics of this equation is 154.63 is significant at any level of
significance. In Equation 1a, results show that growth and profitability in GLCs
are positive and significant. Meanwhile, for non-GLCs, growth shows significant
(but negative) relationship and for size, non-duality, agency cost and profitability
it is different from market measurement.
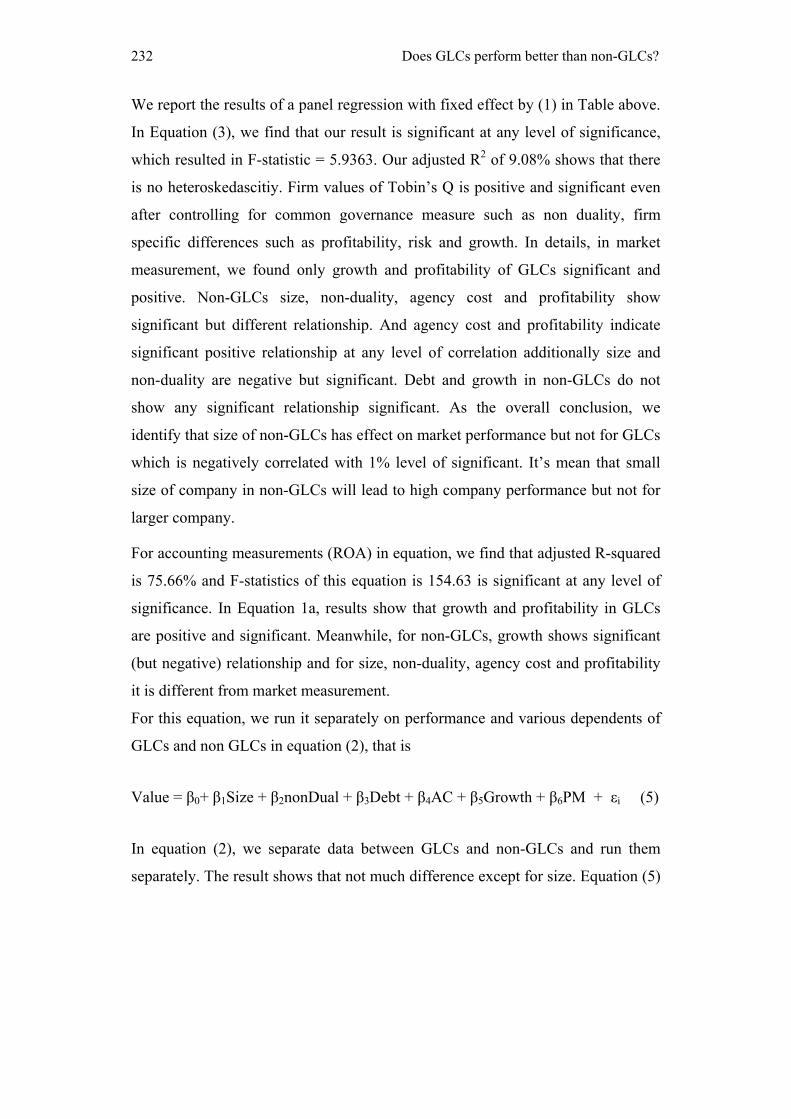
For this equation, we run it separately on performance and various dependents of
GLCs and non GLCs in equation (2), that is
Value = β0+ β1Size + β2nonDual + β3Debt + β4AC + β5Growth + β6PM + εi (5)
In equation (2), we separate data between GLCs and non-GLCs and run them
separately. The result shows that not much difference except for size. Equation (5)
N.H. Razak, R.Ahmad and H.A. Joher 233
indicates size has negative significant relationship but not in accounting
measurement.
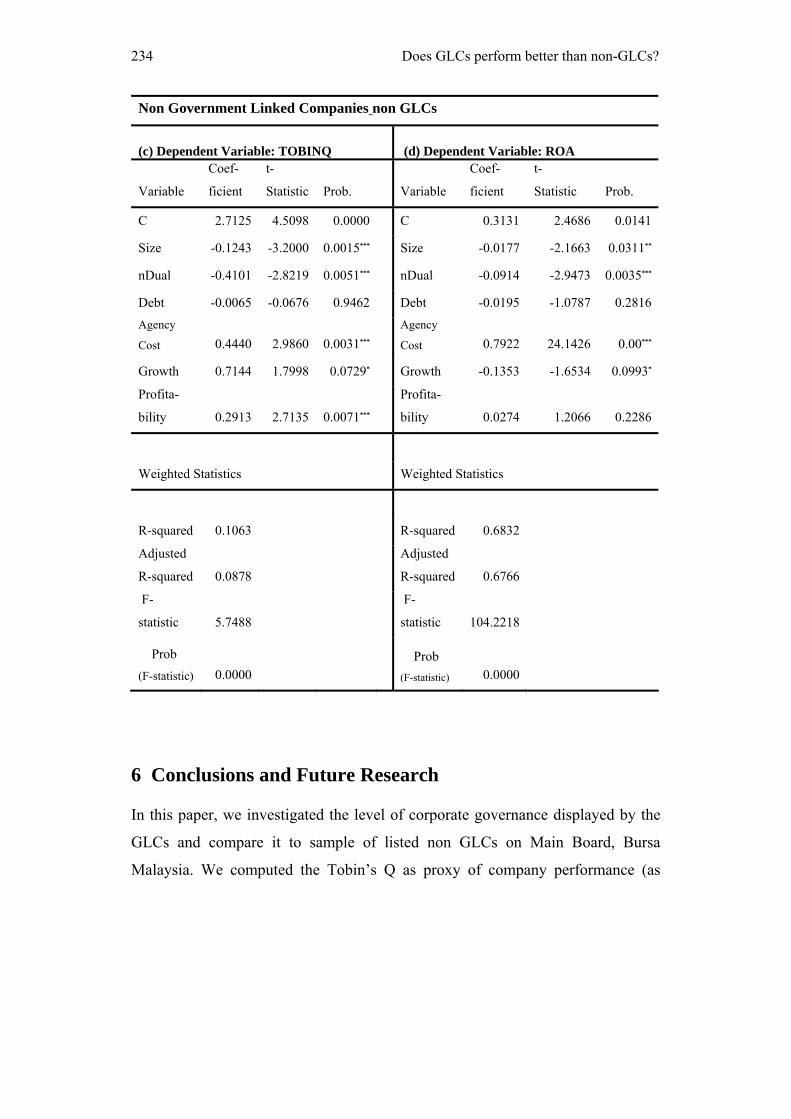
Whereas, for non-GLCs, the results show that only debt is not significant. Also,
debt and profitability is not significant at any level of significance. Table 6 shows
that result of non-GLCs is better than GLCs due to many variables show
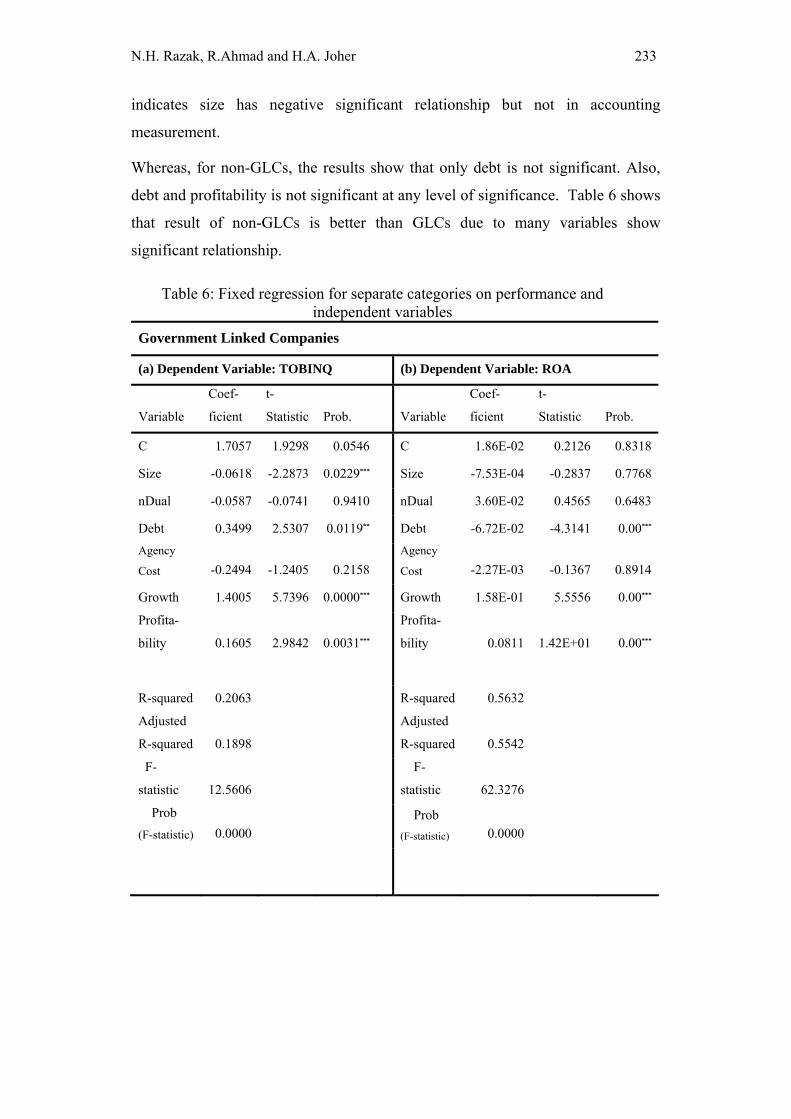
significant relationship.
Table 6: Fixed regression for separate categories on performance and independent variables
Government Linked Companies
(a) Dependent Variable: TOBINQ (b) Dependent Variable: ROA
Variable
Coef-
ficient
t-
Statistic Prob. Variable
Coef-
ficient
t-
Statistic Prob.
C 1.7057 1.9298 0.0546 C 1.86E-02 0.2126 0.8318
Size -0.0618 -2.2873 0.0229*** Size -7.53E-04 -0.2837 0.7768
nDual -0.0587 -0.0741 0.9410 nDual 3.60E-02 0.4565 0.6483
Debt 0.3499 2.5307 0.0119** Debt -6.72E-02 -4.3141 0.00*** Agency
Cost -0.2494 -1.2405 0.2158 Agency
Cost -2.27E-03 -0.1367 0.8914
Growth 1.4005 5.7396 0.0000*** Growth 1.58E-01 5.5556 0.00***
Profita-
bility 0.1605 2.9842 0.0031***
Profita-
bility 0.0811 1.42E+01 0.00***
R-squared 0.2063 R-squared 0.5632
Adjusted
R-squared 0.1898
Adjusted
R-squared 0.5542
F-
statistic 12.5606
F-
statistic 62.3276
Prob (F-statistic) 0.0000
Prob (F-statistic) 0.0000
234 Does GLCs perform better than non-GLCs?
Non Government Linked Companies non GLCs
(c) Dependent Variable: TOBINQ (d) Dependent Variable: ROA
Variable
Coef-
ficient
t-
Statistic Prob. Variable
Coef-
ficient
t-
Statistic Prob.
C 2.7125 4.5098 0.0000 C 0.3131 2.4686 0.0141
Size -0.1243 -3.2000 0.0015*** Size -0.0177 -2.1663 0.0311**
nDual -0.4101 -2.8219 0.0051*** nDual -0.0914 -2.9473 0.0035***
Debt -0.0065 -0.0676 0.9462 Debt -0.0195 -1.0787 0.2816 Agency
Cost 0.4440 2.9860 0.0031*** Agency
Cost 0.7922 24.1426 0.00***
Growth 0.7144 1.7998 0.0729* Growth -0.1353 -1.6534 0.0993*
Profita-
bility 0.2913 2.7135 0.0071***
Profita-
bility 0.0274 1.2066 0.2286
Weighted Statistics Weighted Statistics
R-squared 0.1063 R-squared 0.6832
Adjusted
R-squared 0.0878
Adjusted
R-squared 0.6766
F-
statistic 5.7488
F-
statistic 104.2218
Prob (F-statistic) 0.0000
Prob (F-statistic) 0.0000
6 Conclusions and Future Research
In this paper, we investigated the level of corporate governance displayed by the
GLCs and compare it to sample of listed non GLCs on Main Board, Bursa
Malaysia. We computed the Tobin’s Q as proxy of company performance (as
N.H. Razak, R.Ahmad and H.A. Joher 235
market measurement) and ROA (as accounting measurement) to determine the
degree to which government involvement and corporate governance affects
company performance. We found that GLCs exhibit lower valuations than non-
GLCs, even after controlling for firm specific factors such as profitability, size,
non-duality, agency cost, risk and growth opportunities.
We compared the financial and market performance of GLCs with non-GLCs,
while each have a different set of governance structure, the key difference is
government ownership. We found that non-GLCs perform better than GLCs after
examining corporate governance and factors which influence company
performance such as risk, growth and leverage. In GLCs, we found that majority
of variables have significant relationship except debt and growth (in ROA, growth
show significant) but for GLCs, only growth and profitability are significant but
not others. As conclusion, although separate analysis shows government
ownership performs better than non-GLCs (with the sample of 210 companies),
but when we utilized matched sample for comparison, we found out that
performance of non-GLCs is better than GLCs which is because three out of thirty
companies in GLCs which are Tenaga Nasional Berhad (TNB), Telekom and
SIME DARBY need to be dropped (can not match with other non-GLCs in our
sample). These three companies have given a huge impact on performance of
GLCs For the reason that besides their large market capitalization, they are also
monopoly and leader in their industries.
Finally additional research on this topic using other types of analysis is needed.
Much can be learned from the progress that has been by previous studies. In many
ways current study lends support for the literature at hand and future studies is
needed to add up other independent variables on corporate governances, industry
factors to get a clearer picture of corporate governance in Malaysia. At the same
time other studies can work on improvement of current measurements of
performances.
236 Does GLCs perform better than non-GLCs?
References
[1] E.W. Anderson, C. Fornell and D.R. Lehmann, Customer Satisfaction,
Market Share and Profitability, Journal of Marketing, 58, (July 1994), 53-66.
[2] W.A. Andrews and M.J. Dowling, Explaining Performance Changes in
Newly Privatized Firms, Journal of Management Studies, 7, (1998), 601-617.
[3] J.S. Ang, R.A. Cole and J.W. Lin, Agency cost and ownership structure,
Journal of Finance, 55, (2000), 81-106.
[4] J.S. Ang and D.K Ding, Government ownership and the performance of
government linked companies: The Case of Singapore, Journal of Multiple
Financial Management, (2005), 1-25.
[5] A.A. Berle and G. Means, The modern corporation and private property,
Commerce Clearing House, New York, 1932.
[6] Bernardo Bortolotti, Marcella Fantini, and Carlo Scarpa, Why do
Governments Sell Privatised Companies Abroad?, Working Paper,
Fondazione ENI-Enrico Mattei (FEEM), Milan, (2000).
[7] S. Claessens, S. Djankov and L.H.P. Lang, Who controls east Asian
corporations, The World Bank, Working Paper, (1999).
[8] I.J.A. Dyck and K.H. Wruck, Organization structure, contract design and
government ownership: a clinical analysis of German privatization, Journal
of Corporate Finance: Contracting, Governance and Organization, 4,
(1997), 265-299.
[9] E.F. Fama and M.C. Jensen, Separation of ownership and control, Journal of
Law and Economics, 26, (1983), 301-325.
[10] C. Florackis and A. Ozkan, Agency Costs and Corporate Governance
Mechanisms: Evidence For UK Firms, Working Paper, University of York,
UK, (2004).
[11] D.M. Gujarati, Basic econometric International Edition, 4th ed. McGraw-
Hill, Inc., New York, 2003.
N.H. Razak, R.Ahmad and H.A. Joher 237
[12] G. Gursoy and K Aydogan, Equity ownership structure risk taking and
performance: an empirical investigation in Turkish listed companies,
Emerging Market Finance and Trade, 38(6), (2002), 6-25.
[13] R. Haniffa and M. Hudaib, Corporate governance structure and performance
of Malaysian listed companies, Journal of Business Finance and Accounting,
(2006), 1-29.
[14] M.C. Jensen, Agency cost of free cash flow, corporate finance and takeovers,
American Review, 76, (1986), 471-517.
[15] T. Kirchmaer and J. Grant, Corporate Ownership and Performance in Europe,
European Management Review, 3(2), (2005), 231-245.
[16] R.LaPorta, F. Lopez-de-Silanes and A. Shleifer, Corporate ownership around
the World, Journal of Finance, 54, (1999), 471-517.
[17] M. Lemmon and K.V. Lins, Ownership Structure, Corporate Governance,
and Firm Value: Evidence from the East Asian Financial Crisis, Journal of
Finance, 58(4), (2001), 1445-1468.
[18] Florencio López-de-Silanes, Determinants of Privatization Prices, Q. J.
Econ., 112, (1997), 965-1025.
[19] Sumit K. Majumdar, Assessing Comparative Efficiency of the State-Owned,
Mixed and Private Sectors in Indian Industry, Pub. Choice, 96, (1996), 1-24.
[20] J. McConnell and H. Servaes, Equity ownership and the faces of debt,
Journal of Financial Economics, 27, (1995), 595-613.
[21] O.D. Orden and A. Garmendia, Does it matter ownership structure?
performance in Spanish companies, Journal of European Financial
Management, (2005), 1-40.
[22] K. Ramaswamy, Organizational ownership, competitive intensity and firm
performance: An empirical study of the Indian manufacturing sector,
Strategic Management Journal, 22, (2001), 989-998.
[23] Andrei Shleifer, State versus private ownership, J. Econ. Persp., 12, (1998),
133-150.

238 Does GLCs perform better than non-GLCs?
[24] A. Shleifer and R.W. Vishny, A survey of corporate governance, Journal of
Finance, 52, (1997), 737-783.
[25] K. Singh and H.A. Siah, The strategies and success of government linked
corporation in Singapore, Research Paper, Series 98-06, Faculty of Business
Administration, National University of Singapore, (1998).
[26] L. Tian and S. Estrin, Retained state shareholding in China PLCs: does
government ownership reduce corporate value?, IZA Discussion Paper, No.
1493, IZA Born, (2005).
[27] Aidan R. Vining, and Anthony E. Boardman, Ownership versus competition:
Efficiency in Public Enterprise, Pub. Choice, 73, (1992), 205-239.
[28] Weir and P. McKnigh, Internal and external governance mechanisms: their
impact on the performance of large UK public companies, Journal of
Business Finance and Accounting, 29, (2003), 579-611.
[29] D. Xu, Y. Pan, C. Wu and B. Yim, Performance of domestic and foreign –
Invested enterprises in China, Journal of World Business, 41(3), (2006),
261-274.
[30] Xiaonian Xu and Yan Wang, Ownership structure, corporate governance and
firms’ performance: The Case of Chinese Stock Companies, Working Paper,
Washington, D.C., World Bank, (2005).
[31] R. Zeitun and G.G. Tian, Does ownership affect a firm’s performance and
default risk in Jordan?, Corporate Governance, 7(1), (2007), 66-82.

N.H. Razak, R.Ahmad and H.A. Joher 239
Appendix
A. LIST OF GOVERNMENT LINKED COMPANIES
No Company Industry
1 Boustead Holdings trading 2 Boustead Property trading 3 Cements Industries production 4 Central Ind Corp trading 5 Faber Group trading 6 Golden Hope plantation 7 Guthrie Rope plantation 8 Highland & Lowland plantation 9 Island & Penisular properties
10 Johan Ceramics trading 11 Kump Guthrie plantation 12 M'sian Airport trading 13 Mentakab Rubber plantation 14 MRCB trading 15 MISC trading 16 Negara Properties properties 17 Opus trading 18 Petronas Dagangan trading 19 Petronas Gas trading 20 Proton Holding consumer product 21 Sime UEP plantation 22 Time Engineering trading 23 TIME Dot Com production 24 Tractors Holdings production 25 UAC Berhad trading 26 UMWS consumer product 27 YaHorng production

240 Does GLCs perform better than non-GLCs?
B. LIST OF NON- GOVERNMENT LINKED COMPANIES
No Company Industry
1 Berjaya Trading
2 Keramat Production
3 Fraser & Neave Production
4 Lion Corporation Property
5 Tiong Nam Transport S B Trading
6 Asiatic Plantations
7 Batu Kawan Trading
8 Berjaya Holding Consumer product
9 Berjaya Toto Consumer product
10 Choo Bee Metal Ind Production
11 Faber Trading
12 Gamuda Plantations
13 GlenealyPlantations Plantations
14 IOI Corporation Trading
15 KL Infrastructure Grp Trading
16 Kuala Lumpur Kepong Plantations
17 Malayan United Industries Trading
18 Malayawata Steel Production
19 Malaysia Aica Production
20 Malaysian Mosaics Trading
21 MMC Corporation Trading
22 MOL.COM Plantations
23 Mycom Plantations
24 Nam Fatt Trading
25 PK Resources Production
26 PPB Group Plantations
27 Resort World Consumer product