Embed Size (px)
Citation preview

DOES FISHING PRESSURE AFFECT THE
FEEDING ECOLOGY OF SEA SNAKES? FINAL REPORT – OCTOBER 2019
Shawn Dsouza, Research Assistant
Chetan Rao, Programme Officer
Muralidharan M., Field Director
Biodiversity and Resource Monitoring – Flagships Program, Dakshin Foundation.

1
CONTENTS
About Dakshin Foundation ........................................................................................................ 2
Introduction and Background .................................................................................................... 3
Methods and Challenges ............................................................................................................ 5
Sampling ................................................................................................................................ 6
Boat based surveys ............................................................................................................. 6
Fisheries dependent sampling ............................................................................................ 7
Tissue sampling and morphometric measurements ........................................................... 7
Visual gut content analysis .................................................................................................... 8
Catch monitoring and sampling ............................................................................................. 8
Stable isotope analysis ........................................................................................................... 8
Data analysis .......................................................................................................................... 9
Challenges ............................................................................................................................ 10
Key Findings and Results ........................................................................................................ 11
Resource partioning between H. schisitosus and H. curtus ................................................. 11
Resource Partitioning within Species .................................................................................. 14
Resource overlap between sea snakes and fisheries ............................................................ 17
Discussions, Implications, Conclusion and Way forward ....................................................... 19
Key Outcomes .......................................................................................................................... 22
Acknowledgements .................................................................................................................. 23
References and Further Reading .............................................................................................. 24
Appendix A: List of sea snake prey species observed in gut content ...................................... 28
Appendix B: Sea snakes of Sindhudurg poster ........................................................................ 29

2
ABOUT DAKSHIN FOUNDATION
Dakshin Foundation is a registered not-for-profit, non-governmental organization. Since its
establishment in 2008, we have undertaken a range of projects that deal with conservation.
Dakshin works with an understanding that challenges of conserving our environment is one
that necessitates an active engagement between the natural and social sciences where
conservationists accommodate expertise that transcends disciplinary boundaries. Dakshin’s
applied scientific research aims at filling some of the critical gaps in our current knowledge of
marine ecosystems. Through long-term monitoring of select ecosystems and taxa, our research
aims to advance our understanding of the patterns and processes that maintain ecosystem
function and resilience to anthropogenic stress and climate-induced changes.

3
INTRODUCTION AND BACKGROUND
Humans have been venturing out to sea to gather food for thousands of years. Over those years,
the methods of fishing have changed and have become efficient at gathering these resources.
However, with these technological innovations, new issues have emerged. Today, the global
fishing industry is faced with a crisis of sustainability with problems such as overexploitation
and bycatch at the forefront (Ababouch et al. 2016; Agardy 2000).
Gear selectivity is a major issue for fisheries today due to the accidental catch of non –
commercial species. This phenomenon has been termed as ‘bycatch’ (Alverson et al. 1994;
Hall, Alverson, and Metuzals 2000; Davis 2002). Bycatch threatens populations of marine
megafauna such as sea turtles in trawl nets and longlines and sharks in long-line tuna fisheries
(Cambiè et al. 2013; Molina and Cooke 2012). Understanding bycatch to mitigate its effects is
a major step towards implementing ecosystem based fisheries management and ensuring
fisheries sustainability (Zhou 2008; Trochta et al. 2018).
Bycatch related mortalities are apparent in fisheries around the world and its effects on
populations have been studied extensively (Molina and Cooke 2012; Fry, Milton, and
Wassenberg 2001; Milton 2001). However, there are multiple non – lethal effects and indirect
fisheries interactions that go largely unnoticed (Wilson et al. 2014). These can include
behavioural changes in predators and their prey, increased physiological stress and alteration
of entire coastal food webs (Ryer 2002; Revuelta et al. 2018; Díaz López 2018; Jackson et al.
2001).
Predators are vital in regulating ecosystem processes through top-down forcing (Paine 1966;
Schmitz 2007). The selective removal of top predators from ecosystems can have far ranging
effects on the lower trophic levels including regime shifts and mesopredator release (Myers et
al. 2007). Resource availability also plays a comparable role in maintaining ecosystem stability
through bottom up processes such as competition (Schoener 1968; 1974). These trophic forces
work together to maintain biodiversity and other local ecosystem processes such as nutrient
turn over (Terborgh 2015).
Sea snakes are a recent and diverse lineage of marine reptiles. They belong predominantly to
the Hydrophiid lineage in the family Elapidae. They are found throughout shallow coastal
waters in the tropics with exception of the Atlantic Ocean (Bonnet, Rasmussen, and Brischoux
2016; Dunson 2000). Sea snakes play an important role in maintaining the trophic structure of

4
coastal ecosystems through their role as mesopredators (Voris 1972). Fisheries pose a major
threat to sea snakes throughout their range, with mortality due to bycatch playing a major role
in observed declines over the past two decades (Elfes et al. 2013). The implication of these
local extirpations is still unknown. In addition, the effects of fisheries interactions on sea snake
physiology and ecology is not fully understood.
A B
Study species: Beaked sea snake (Hydrophis schistosus, A) and Shaw’s sea snake (H. curtus, B)
Dakshin Foundation has been working in the Sindhudurg district of Maharashtra since 2016,
studying species diversity in sea snakes in the region. Our work has primarily focused on the
bycatch of sea snakes in gillnet and trawl fisheries operating in Malvan (Rao et al. 2017). We
observed multiple species of sea snakes caught in both gears with Hydrophis schistosus and H.
curtus being the most abundant. We observed high mortalities in both the species; however,
H. curtus was more vulnerable to bycatch mortality. In addition, we observed that the species
assemblage of sea snakes in bycatch on the west coast has changed drastically in the last two
decades with large declines in the proportion of H. curtus (Rao et al, in review). However, the
reasons for these declines are still not well understood.
To study interactions between fisherman and sea snakes from an ecological perspective, we
asked the following questions:
1. Does resource use differ between Hydrophis curtus and H. schistosus off the
Sindhudurg coast?
2. Does resource use in sea snakes vary by sex and developmental stage?
3. Are sea snake prey species commercially important and to what extent?
4. If so, how does this overlap affect interspecific and intraspecific interactions among sea
snakes?

5
METHODS AND CHALLENGES
We use a combination of stable isotope analysis and visual gut content analysis to describe
patterns of inter and intraspecific resource use and contrast the same with previous studies on
sea snakes.
We carried out field observations and collections in two phases; January 2018 – April 2018
and November 2018 – May 2019. We chose the Sindhudurg district of Maharashtra given our
ongoing long-term engagement in the region (Rao et al. 2017). The bulk of our field
observations were carried out in Malvan, along with brief surveys in the villages on Tambaldeg
and Vayangani (Figure 1)
Figure 1: Map of study sites.
Malvan is a busy fishing town with multiple gears operating at once. We focused our sampling
mainly on gillnets and trawlers operating out of the port. Vayangani and Tambaldeg are both
hamlets with limited small-scale fishing in the inshore waters (Karnad, Gangal, and Karanth
2014). However, trawlers operate throughout the district, hence even these smaller villages are
characterised by moderate to high fishing pressure (Figure 1).

6
SAMPLING
BOAT BASED SURVEYS
Boat based sampling at Vayangani.
We carried out surveys between 3:00 – 6:00 and 19:00 – 23:00, using a locally hired boat (28
ft, out board motor). We used a modified point survey methodology with randomly placed
points in a 2km X 1km quadrant laid in the survey area (Figure 2). Each point was visited and
surveyed for 10 mins. 4 LED panels powered by a 12-volt lead battery were outfitted to the
boat, two on each side. Sea snakes attracted by the lights were observed and recorded to the
lowest possible taxonomic level. We also collected environmental variables such as water
temperature, air temperature, wind speed and depth at each point (Udyawer et al. 2016).
Figure 2: Example of sampled area and random points placed for boat-based sampling.

7
FISHERIES DEPENDENT SAMPLING
Sea snakes were collected from gillnets and trawlers at the time when the boats landed. Fishing
and gear information such as haul time, depth, substrate, etc. were recorded at the time of
collection.
Sea snake caught in a gill net at Malvan.
TISSUE SAMPLING AND MORPHOMETRIC MEASUREMENTS
Blood samples from the caudal vein were taken from live snakes using a 20G 0.7mm x 20mm
heparinised syringe and collected in a heparinised centrifuge tube (Lemons et al. 2012; Moore,
Lemaster, and Mason 2000). The samples were then centrifuged at 10,000 rpm for 10 mins and
the plasma is separated and stored in a different vial. Samples were stored at – 20 deg. Celsius
until processing. Scale samples were taken from dead snakes and stored in 99% alcohol until
processing. Sea snakes were measured (snout to vent length and body length) and weighed. All
live snakes were released after sampling and measurement.

8
VISUAL GUT CONTENT ANALYSIS
Puffer fish extracted from sea snake gut.
Presence of gut content was visually assessed and regurgitated gut content was collected,
identified and measured (Lobo, Vasudevan, and Pandav 2005). For dead snakes, gut content
was extracted by dissection. Specimens were scored on a scale from 1 to 4 based on the level
of digestion (Table 1). Tail tissue samples were collected for all gut content specimens.
Specimen score Description
1 Intact specimen
2 Head partially digested
3 Head completely digested; body partially
digested.
4 Specimen completely digested, unidentifiable
mass/ bones
Table 1: Condition scores for gut content specimens
CATCH MONITORING AND SAMPLING
Catch from random vessels (trawlers and gillnets) were characterised (composition and
biomass) to build the trophic niche of fisheries (Mashjoor, Jamebozorgi, and Kamrani 2018).
The 20 most abundant fish of reasonable size (i.e. with respect to gape of sea snakes and other
mesopredators) caught in gillnets, trawlers and beach seines were sampled for tail tissue,
weighed and measured.
STABLE ISOTOPE ANALYSIS
Tissue samples collected from snakes and fish specimens were preserved and frozen before
being taken to the lab. Blood samples were centrifuged to separate blood cells from plasma and

9
stored in a freezer. Scale and fish fin samples were stored in 70% ethanol. The preservatives
were then decanted in the lab before drying all samples in an oven at 50ºc for 72 - 96 hours.
Dried samples were then pulverised and homogenised using a mortar and pestle. We carried
out lipid extraction using the Bligh and Dyer (1959) method for only sea snake scale samples
as high lipid content can contfound comparison carbon isotope data among samples (Post et al.
2007). Lipid extraction was carried out for high lipid content samples only such as sea snake
scale samples and not for low lipid content samples such as fish fins and blood plasma (Figure
3). Processed samples were sent to the labs at University of Agricultural Sciences, Bangalore
and Centre for Earth Sciences, Indian Institute of Science, Bangalore for Isotope Ratio Mass
Spectroscopy.
Figure 3: Effects of lipid extraction on δ13C from sea snake scales.
DATA ANALYSIS
We analysed our data in R 3.5.2. We used diversity and similarity indices from the ‘vegetarian’
package to compare dietary range and overlap between and within sea snake species (Schoener
1968; Jost 2006). We used parametric t – tests and the Kruskal – Wallis non parametric test to
compare prey morphometrics across groups.
For stable isotope analysis, we used the SIBER package (Jackson et al. 2011). We used a
Bayesian model to estimate parameters (isotopic means and variance – covariance matrices)
for standard ellipses and computed standard ellipse area (SEA) to compare niche width among
groups. We calculated probability of niche width difference on posterior distributions of SEA.
We also used posteriors of estimated ellipses to calculate overlap in isotopic niche. We used a
linear model to test the effect of SVL on isotope ratios of both plasma and scales.

10
We computed relative proportions of various fish and invertebrate families in samples from
gill net and trawler landings. We used the sample proportions to calculate catch composition
over the sampling period and compared each gear to sea snake diet.
CHALLENGES
We faced a number of logistical issues during the implementation of the project, the foremost
being bad weather and unsuitable sea conditions making boat-based sampling difficult for most
of our field work. In addition, our original control site, Tambaldeg, did not have appropriate
topography for conducting regular boat surveys. We are thus, unable to present detailed
findings of our boat surveys, and have included the protocols developed over the course of the
field work. Due to delays with the isotope ratio mass spectrometry, we are only able to present
preliminary results of our stable isotope analysis. We are working on completing our analysis
in the coming months.

11
KEY FINDINGS AND RESULTS
A total of 793 snakes were sampled from gillnets (254.71 haul hours) and trawl nets (567.91
haul hours) in two field phases between January 2018 and May 2019. Hydrophis schistosus
was the most abundant (76.29%) followed by Hydrophis curtus (22.5%). We also found 3 other
species; H. cyanocintus, H. caerulescens and H. viperinus sporadically in the catch. We
collected scale and plasma samples from a subsample of the dominant species (Table 2);
however, we were able to analyse only a subset of the samples this time.
Species No. of samples collected No. of samples analysed
Scales Plasma Scales Plasma
Hydrophis curtus 28 29 12 5
Hydrophis
schistosus 49 107 23 25
Table 2: Number of tissue samples collected and analysed (IRMS) for each snake species.
Of the snakes encountered, 129 had some gut content present in their digestive tracts (36 – HC,
93 – HS). We identified 57.9% of the specimens to specific level (27 prey species) and 69.3%
to family level (19 families) from sea snake gut contents. A large proportion of the gut content
observed was unidentifiable beyond the family level. We considered only specimens with a
condition score of less than 3 (Table 1) for morphometric analysis. We collected a total 249 fin
samples from 60 species (31 families) for stable isotope analysis; we are currently in the
process of analysing the samples.
RESOURCE PARTIONING BETWEEN H. SCHISITOSUS AND H. CURTUS
We identified a greater number of prey families in the diet of H. schistosus (14 families) than
H. curtus (11 families, Figure 4). H. schistosus fed predominantly on a single family,
Tetraodontidae, comprising 34.93% of specimens collected. Plotosids, Ariids and Clupiids
made up 19.4 % of H. schistosus diet. We did not find such dominance/preference of prey
families in the H. curtus diet. Hence, second order prey diversity (Shannon Index) was lower
in H. schistosus gut content (6.72 ± 0.86) than in H. curtus (9 ± 0.91). Seven fish families were
found to be predated by both snake species (Morista – Horn Similarity = 0.25 ± 0.1).
Prey size did not vary significantly with SVL for either species; however, sample sizes for the
comparison were low. Prey length and weight were not significantly different among species
However, we found that H. schistosus predated on individuals with higher maximum body girth
(Table 3, p < 0.05).

12
Figure 4: Relative proportions of prey families in gut content of sea snakes.
Snake Species Sample Size Prey Length
(cm) ± SD
Prey Weight (g)
± SD
Prey Girth (cm)
± SD*
H. schistosus 32 11.83±3.96 31.15±19.81 3.57±1.1
H. curtus 11 9.65±3.92 21.3±19.45 2.76±0.79
Table 3: Size of prey specimens observed in gut content of H. schistosus and H. curtus. *Prey girth
was found to be significantly different (p < 0.05).
Figure 5: Posterior standard ellipses (n = 10) depicting isotopic niches of H. schistosus and H. curtus.

13
Species Tissue δ13C ± SD δ15N ± SD
Hydrophis curtus Plasma -17.51±0.63 13.09±0.83
Scales -15.42±0.57 14.32±1.48
Hydrophis schistosus Plasma -16.77±1.14 14.48±1.06
Scales -14.93±1.28 15.29±0.85
Table 4: Mean (± SD) isotopic values for plasma and scales of both sea snake species.
Standard ellipses show that both species occupy similar positions in isotopic space (Figure 5).
However, larger sample size in H. schistosus may contribute to greater apparent variability
(and hence uncertainty) in ellipse estimation when compared to H. curtus. In addition, isotope
values show enrichment in scale tissues in both species when compared to plasma (Table 4,
Figure 5).
Figure 6: Comparing SEA (isotopic niche width) computed from posterior ellipses across sea snake
species and tissues
Standard ellipse area (SEA) is larger in H. schistosus than H. curtus for both scales (P = 0.47)
and plasma (P = 0.82, Figure 6). The posterior distribution of SEA has a right skewed long tail
(masked by the limits of the graph for visual clarity) possibly due to the low sample size. SEA
is slightly larger in scales (SEA = 3.41 ± 0.75) compared to plasma (1.89 ± 1.1) in H. curtus (P
= 0.9); however, both tissues exhibit similar SEA in H. schistosus. Overlap between H.
curtus and H. schistosus seems to be higher when comparing long term resource use (scales,
0.4 ± 0.06) than in the short term (plasma, 0.1 ± 0.08).
14
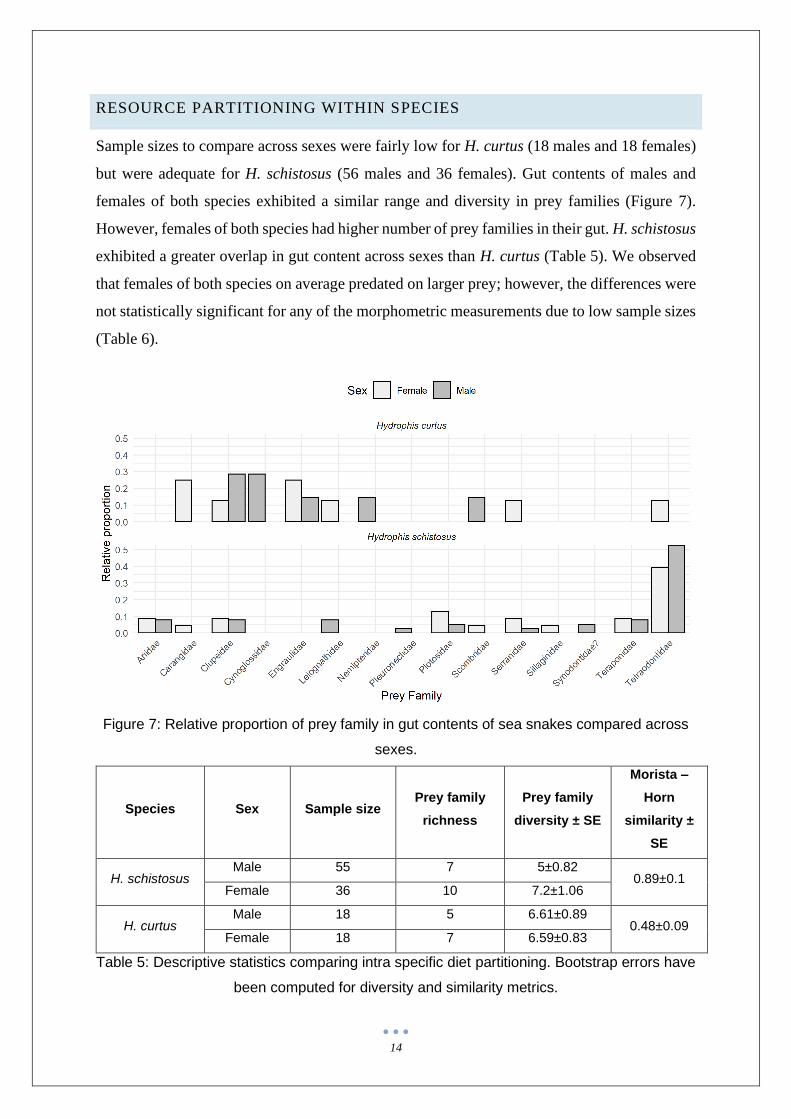
RESOURCE PARTITIONING WITHIN SPECIES
Sample sizes to compare across sexes were fairly low for H. curtus (18 males and 18 females)
but were adequate for H. schistosus (56 males and 36 females). Gut contents of males and
females of both species exhibited a similar range and diversity in prey families (Figure 7).
However, females of both species had higher number of prey families in their gut. H. schistosus
exhibited a greater overlap in gut content across sexes than H. curtus (Table 5). We observed
that females of both species on average predated on larger prey; however, the differences were
not statistically significant for any of the morphometric measurements due to low sample sizes
(Table 6).
Figure 7: Relative proportion of prey family in gut contents of sea snakes compared across
sexes.
Species Sex Sample size Prey family
richness
Prey family
diversity ± SE
Morista –
Horn
similarity ±
SE
H. schistosus Male 55 7 5±0.82
0.89±0.1 Female 36 10 7.2±1.06
H. curtus Male 18 5 6.61±0.89
0.48±0.09 Female 18 7 6.59±0.83
Table 5: Descriptive statistics comparing intra specific diet partitioning. Bootstrap errors have
been computed for diversity and similarity metrics.

15
Species Sex Sample size
Prey standard
length (cm) ±
SD
Prey Weight
(g) ± SD
Prey girth
(cm) ± SD
H. schistosus Male 18 10.77±3.86 27.16±19.04 3.3±1.21
Female 13 13.13±3.93 35.36±20.82 3.98±0.88
H. curtus Male 6 8.31±3.5 16±21.88 2.51±0.5
Female 5 11.26±4.16 26.6±17.38 3.06±1.04
Table 6: Morphometric comparison of gut content specimens by sex.
Figure 8: Posterior standard ellipses comparing isotopic niche among sexes within species.
Species Isotope Term Estimate Standard error p - value
Hydrophis schistosus
δ13C (Intercept) -16.954 1.689 0
SVL (mm) 0.024 0.020 0.239
δ15N (Intercept) 14.415 1.197 0
SVL (mm) 0.010 0.014 0.466
Hydrophis curtus
δ13C (Intercept) -13.713 1.786 0
SVL (mm) -0.028 0.029 0.359
δ15N (Intercept) 11.842 4.824 0.033
SVL (mm) 0.040 0.078 0.616
Table 7: Model summary comparing change in isotope ratios with SVL (mm).

16
Sample size for plasma was low for all groups (sexes in each species) and hence has been
omitted from analysis. Males and females of both species occupy similar isotopic niches;
however, uncertainty of estimation is high due low sample sizes (Figure 8). SEA is slightly
larger for both females of both species; it is more prominent in H. curtus (P = 0.83) than H.
schistosus (P = 0.66). The posterior distribution of SEA has a right skewed long tail (masked
by the limits of the graph for visual clarity) possibly due to the low sample size (Figure 9).
Overlap in isotopic niche is higher in H. curtus (0.42 ± 0.1) compared to H. schistosus (0.18 ±
0.12).
Figure 9: Comparing standard ellipse area (niche width) computed from posterior ellipses
among sexes within species.
Figure 10: Comparing change in isotope ratios with SVL (mm).

17
Our VGCA sampling was not adequate to compare diets and prey preference across
developmental stages. Snout to vent length (mm) had little effect on δ13C and δ15N (Figure 10,
Table 7).
RESOURCE OVERLAP BETWEEN SEA SNAKES AND FISHERIES
Snake Species No. of prey families
recorded
No. of prey families
targeted by
trawlers
Prey families
targeted by gillnets
H. curtus 10 9 7
H. schistosus 13 9 7
Table 8: Overlap in catches of trawlers and gill nets with sea snake prey species.
Figure 11: Average catch biomass per sample in gill nets and trawlers, error bars indicate standard
deviation.
We sampled 38 gillnets (35.41 haul hours) and 162 trawler (835.3 haul hours) landings. There
was high variation in biomass landed by both gears (Figure 11). On average, trawler catch
consisted of 75.97% low value bycatch by weight, belonging to 49 families in total. Gillnets
on the other hand targeted 15 families. A large proportion of sea snake prey families were
caught by both gears (Table 8). These species were of high relative importance to both fisheries

18
and sea snakes, comprising a high proportion of the commercial landings (Figure 4 & 12).
Figure 12: Fish families found in gillnet (left) and trawler (right) catches. Sea snake prey families are
marked in blue. Only the top 10% of trawler catches are represented for readability.
19
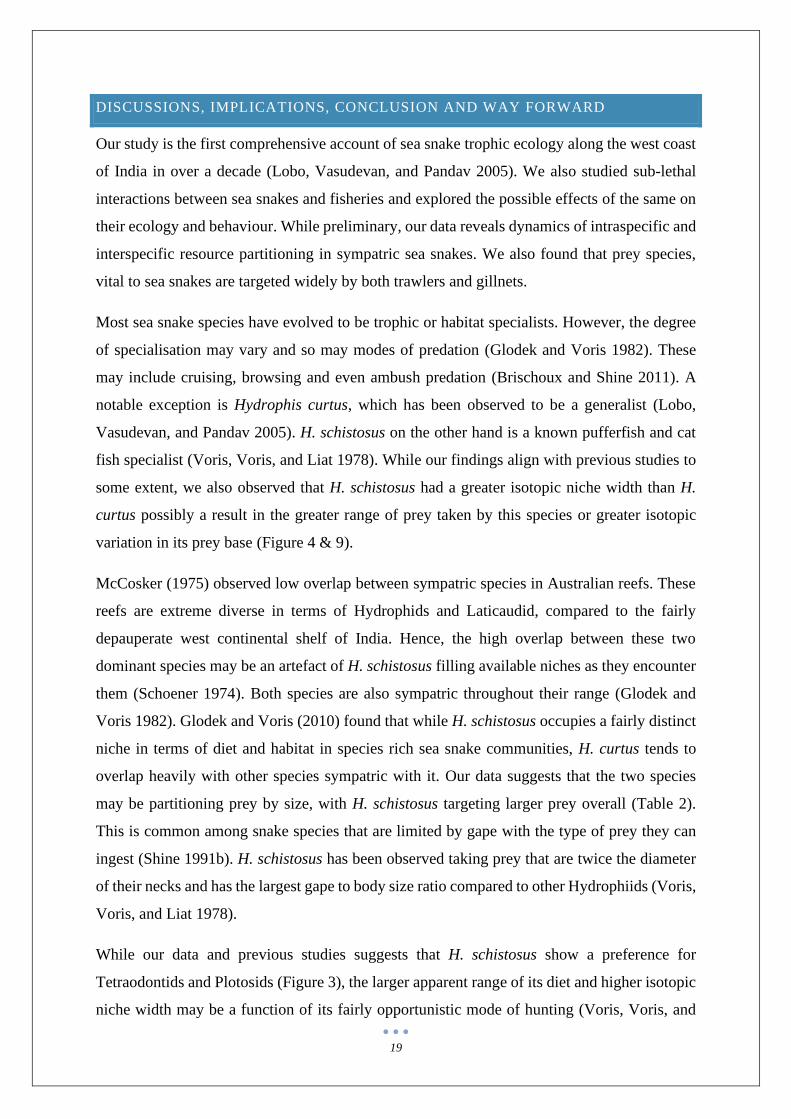
DISCUSSIONS, IMPLICATIONS, CONCLUSION AND WAY FORWARD
Our study is the first comprehensive account of sea snake trophic ecology along the west coast
of India in over a decade (Lobo, Vasudevan, and Pandav 2005). We also studied sub-lethal
interactions between sea snakes and fisheries and explored the possible effects of the same on
their ecology and behaviour. While preliminary, our data reveals dynamics of intraspecific and
interspecific resource partitioning in sympatric sea snakes. We also found that prey species,
vital to sea snakes are targeted widely by both trawlers and gillnets.
Most sea snake species have evolved to be trophic or habitat specialists. However, the degree
of specialisation may vary and so may modes of predation (Glodek and Voris 1982). These
may include cruising, browsing and even ambush predation (Brischoux and Shine 2011). A
notable exception is Hydrophis curtus, which has been observed to be a generalist (Lobo,
Vasudevan, and Pandav 2005). H. schistosus on the other hand is a known pufferfish and cat
fish specialist (Voris, Voris, and Liat 1978). While our findings align with previous studies to
some extent, we also observed that H. schistosus had a greater isotopic niche width than H.
curtus possibly a result in the greater range of prey taken by this species or greater isotopic
variation in its prey base (Figure 4 & 9).
McCosker (1975) observed low overlap between sympatric species in Australian reefs. These
reefs are extreme diverse in terms of Hydrophids and Laticaudid, compared to the fairly
depauperate west continental shelf of India. Hence, the high overlap between these two
dominant species may be an artefact of H. schistosus filling available niches as they encounter
them (Schoener 1974). Both species are also sympatric throughout their range (Glodek and
Voris 1982). Glodek and Voris (2010) found that while H. schistosus occupies a fairly distinct
niche in terms of diet and habitat in species rich sea snake communities, H. curtus tends to
overlap heavily with other species sympatric with it. Our data suggests that the two species
may be partitioning prey by size, with H. schistosus targeting larger prey overall (Table 2).
This is common among snake species that are limited by gape with the type of prey they can
ingest (Shine 1991b). H. schistosus has been observed taking prey that are twice the diameter
of their necks and has the largest gape to body size ratio compared to other Hydrophiids (Voris,
Voris, and Liat 1978).
While our data and previous studies suggests that H. schistosus show a preference for
Tetraodontids and Plotosids (Figure 3), the larger apparent range of its diet and higher isotopic
niche width may be a function of its fairly opportunistic mode of hunting (Voris, Voris, and
20
Liat 1978). The increased range of potential prey may result in more variable isotopic
signatures of H. schistosus tissue (Bearhop et al. 2004). Similarly, H. curtus has also been
known as a sit and wait predator using the water column to opportunistically find prey. This is
reflected by our data in terms of the greater diversity of specimens found in this species gut.
Lobo (2005) also observed a similar trend, adding that gut composition also varied with time
of day, lending support to this hypothesis. The smaller isotopic niche width of H. curtus may
be an artefact of low sample sizes in our preliminary data (Table 2).
Both species exhibited low overlap in isotopic niche (space occupied on the isotope biplot
depicted by standard ellipses, eg. Figure 5 & 8) among sexes indicating resource divergence.
However, in terms of prey preference, both species show high similarity in gut content among
sexes (Table 5). MacArthur and Levins (1964) proposed the principle of limiting similarity of
resource use, stating that a species with similar resource use along one niche axes (eg. trophic
axis) must partition themselves along other niche axes (eg. habitat) in order to reduce
competitive pressure. Hence, while sexes among sea snakes may show high overlap in diet, the
difference in isotopic niche may be due differing resource use along another niche axis. The
apparent divergence may also be caused in part by different life history traits among sexes in
Hydrophiids, such as females coming closer to shore before and during parturition and possible
starvation during gestation. While prey size was not significantly different, we expect a
difference in preference by sex as females are usually larger than males in most snake species
(Shine 1991a).
Our sampling was not adequate to analyse resource use across developmental stages. However,
our anecdotal observations suggest that H. schistosus juveniles feed on smaller individuals of
the same prey base. Instead of comparing among developmental classes (neonates, juveniles
and adults), we tested the effect of SVL on isotopic composition of sea snake tissues As snakes
grow throughout their lives, the animals’ size is a good proxy for its age. We found no effect
of SVL on both isotopic ratios indicating relative stability in the resource and habitat use for
the SVL range we were able to test. However, we lack information for smaller individuals
which may have differing resource use.
Lobo’s (2005) study of the diet of H. curtus found in trawler bycatch observed an almost 75%
overlap of H. curtus diet with trawler bycatch species. Our findings reveal the further threat of
possible resource depletion by both trawlers and gill net fleets (Figure 6). On the other hand,
Fry et al. (2001) found little to no overlap of sea snake bycatch species with bycatch from

21
prawn trawlers in Northern Australia. This may suggest a geographical trend in intensity of
trophic interactions between sea snakes and fisheries. However, further investigation is
necessary for conclusive inference.
Our observations suggest a scenario in which fisheries pose a two-fold threat to sea snakes and
other coastal mesopredators. We hypothesise that fisheries may play a dual role as predator,
through targeted removal or bycatch mortality as well as a large-scale competitor with
uncontrolled exploitation leading to resource depletion (Rao et al. 2017). We suggest that
resource depletion has a controlling effect on mesopredator release that can occur as a result of
the local extinction of top predators, namely large sharks in this case (J. B. C. Jackson et al.
2001; Myers et al. 2007; Estes et al. 2011; Steneck 2012). Thus, fisheries may have a much
larger effect on coastal food webs than previously thought.
Visual gut content analysis presents inherent biases due to the snapshot nature of the sampling
and the requirement for large sample sizes (Newsome et al. 2007). As H. curtus is now
inherently rare in the region (Rao et al. 2017), gaining the sample size necessary to make
inferences with VGCA alone is challenging. While preliminary, stable isotope analysis has
enabled meaningful insight into the ecology of these threatened and elusive species. Going
forward, we hope to test hypotheses regarding possible niche shifts in sea snakes and other
marine mesopredators in response to fishing intensity. We are also in the process of developing
methodologies to use stable isotopes to study food web wide effects of fisheries, including
constructing isotopic niches of fleets to quantify and compare overlap with important
mesopredators. We hope to gain a better understanding of the ecological, physiological and
population level effects of fisheries on mesopredators.

22
KEY OUTCOMES
Workshop with local stakeholders at Malvan.
Our work has been covered multiple times by local news outlets such as Tarun Bharat and
Mumbai Mirror. Members of the team have also written popular articles to raise awareness
about these issues with the public (listed below). We conducted outreach workshops with
fishermen to communicate our findings with them and are currently planning further local
engagements. We also created and distributed outreach materials in the form of a poster
(Appendix C). In the coming months, we hope to publish our findings in the form of a peer
reviewed journal paper and make our data open to other researchers. We also plan to continue
our work in the Sindhudurg region and expand our research to other parts of the coast.
Popular Articles:
1. Creasey, M. and Dsouza, S. 2019. Sailing into an uncertain future. Current Conservation.
2. Dsouza, S. 2019. Scaly business: A day in the life of a sea snake ecologist. Current Conservation.
3. Rao. C. Serpents of the sea. Hornbill. August 2018. Print
23
ACKNOWLEDGEMENTS
I would like to sincerely thank the Mangrove Foundation and the Rufford Foundation for their
support with funding and logistics. I thank the Maharashtra Forest Department, District
Collectors Office, Sindhudurg, and the Malvan Police for help with permits. I am greatly
indebted to Gerwyn and Priscilla Dsouza and their family for graciously letting us use their
house as a field base. We thank Abhilasha Sharma, Yogesh Waghmare, Udita Bansal, Trisha
Gupta and all our volunteers and interns for their help with field work. Finally, we would like
to express our utmost gratitude to Dr. Kartik Shanker, Dr. Naveen Namboothri and Dr. Maria
Thaker for their invaluable inputs and support.

24
REFERENCES AND FURTHER READING
Ababouch, L., J. Alder, A. Anganuzzi, U. Barg, D Bartley, M. Bernal, G. Bianchi, et al. 2016.
“The State of World Fisheries and Aquaculture.” Food and Agriculture organization.
Agardy, Tundi. 2000. “Effects of Fisheries on Marine Ecosystems: A Conservationist’s
Perspective.” ICES Journal of Marine Science 57 (3): 761–765.
https://doi.org/10.1006/jmsc.2000.0721.
Alverson, Dayton L., Mark H. Freeberg, Steven A. Murawski, and J.G. Pope. 1994. “A Global
Assessment of Fisheries Bycatch and Discards.” FAO Fisheries Technical Paper 339,
no. 339: 233. https://doi.org/No. 339.
Bearhop, Stuart, Colin E. Adams, Susan Waldron, Richard A. Fuller, and Hazel MacLeod.
2004. “Determining Trophic Niche Width: A Novel Approach Using Stable Isotope
Analysis.” Journal of Animal Ecology 73 (5): 1007–12. https://doi.org/10/fwwxks.
Bligh, E. G., and W. J. Dyer. 1959. “A Rapid Method of Total Lipid Extraction and
Purification.” Can. J. Biochem. Physiol 37: 911–17.
Bonnet, Xavier, Arne R Rasmussen, and François Brischoux. 2016. “Sea Snakes.”
Brischoux, François, and Richard Shine. 2011. “Morphological Adaptations to Marine Life in
Snakes.” Journal of Morphology 272 (5): 566–572.
https://doi.org/10.1002/jmor.10933.
Cambiè, Giulia, Noela Sánchez-Carnero, Toni Mingozzi, Ramón Muiño, and Juan Freire.
2013. “Identifying and Mapping Local Bycatch Hotspots of Loggerhead Sea Turtles
Using a GIS-Based Method: Implications for Conservation.” Marine Biology 160 (3):
653–65. https://doi.org/10.1007/s00227-012-2120-5.
Davis, Michael W. 2002. “Key Principles for Understanding Fish Bycatch Discard Mortality.”
Canadian Journal of Fisheries and Aquatic Sciences 59 (11): 1834–43.
https://doi.org/10.1139/f02-139.
Díaz López, Bruno. 2018. “‘Hot Deals at Sea’: Responses of a Top Predator (Bottlenose
Dolphin, Tursiops Truncatus ) to Human-Induced Changes in the Coastal Ecosystem.”
Behavioral Ecology, 1–10. https://doi.org/10.1093/beheco/ary162.
Dunson, William a. 2000. “Sea Snakes.” Copeia 2000 (4): 1136–37.
https://doi.org/10.1643/0045-8511(2000)000[1136:BR]2.0.CO;2.
Elfes et al. 2013. “Fascinating and Forgotten: The Conservation Status of Marine Elapid
Snakes.” Herpetological Conservation and Biology 8 (August 2012): 37–52.
Estes, James A., John Terborgh, Justin S. Brashares, Mary E. Power, Joel Berger, William J.
Bond, Stephen R. Carpenter, et al. 2011. “Trophic Downgrading of Planet Earth.”
Science 333 (6040): 301–6. https://doi.org/10/dgv2m3.
Fry, G. C., D. A. Milton, and T. J. Wassenberg. 2001. “The Reproductive Biology and Diet of
Sea Snake Bycatch of Prawn Trawling in Northern Australia: Characteristics Important
for Assessing the Impacts on Populations.” Pacific Conservation Biology 7 (1): 55–73.
https://doi.org/10.1071/PC010055.
Glodek, Garrett S, and Harold K Voris. 1982. “Marine Snake Diets : Prey Composition ,
Diversity and Overlap.” Copeia, no. 3: 661–66.
Hall, Martin A, Dayton L Alverson, and Kaija I Metuzals. 2000. “By-Catch : Problems and
Solutions” 41 (00). https://doi.org/10.1016/S0025-326X(00)00111-9.

25
Jackson, Andrew L., Richard Inger, Andrew C. Parnell, and Stuart Bearhop. 2011. “Comparing
Isotopic Niche Widths among and within Communities: SIBER - Stable Isotope
Bayesian Ellipses in R.” Journal of Animal Ecology 80 (3): 595–602.
https://doi.org/10.1111/j.1365-2656.2011.01806.x.
Jackson, Jeremy B. C., Michael X. Kirby, Wolfgang H. Berger, Karen A. Bjorndal, Louis W.
Botsford, Bruce J. Bourque, Roger H. Bradbury, et al. 2001. “Historical Overfishing
and the Recent Collapse of Coastal Ecosystems.” Science, New Series 293 (5530): 629–
38.
Jost, Lou. 2006. “Entropy and Diversity.” Oikos 113 (2): 363–375.
https://doi.org/10.1111/j.2006.0030-1299.14714.x.
Karnad, Divya, Mayuresh Gangal, and Krithi K. Karanth. 2014. “Perceptions Matter: How
Fishermen’s Perceptions Affect Trends of Sustainability in Indian Fisheries.” Oryx 48
(02): 218–27. https://doi.org/10.1017/S0030605312001251.
Lemons, GE, T Eguchi, BN LyonV, R LeRoux, and JA Seminoff. 2012. “Effects of Blood
Anticoagulants on Stable Isotope Values of Sea Turtle Blood Tissue.” Aquatic Biology
14 (3): 201–206. https://doi.org/10.3354/ab00397.
Lobo, Aaron Savio, Kartikeyan Vasudevan, and Bivash Pandav. 2005. “Trophic Ecology of
Lapemis Curtus (Hydrophiinae) along the Western Coast of India.” Copeia, no. 3
(June): 637 – 641. https://doi.org/10.1111/jfb.12378.
MacArthur, Robert, and Richard Levins. 1964. “Competition, Habitat Selection, and Character
Displacement in a Patchy Environment.” Proceedings of the National Academy of
Sciences of the United States of America 51 (6): 1207. https://doi.org/10/ckmtkz.
Mashjoor, Sakineh, Fatemeh Heidary Jamebozorgi, and Ehsan Kamrani. 2018. “Fishery-
Induced Inter-Annual Changes in the Mean Trophic Level , the Northern Sea of Oman
off the Iranian Coast , 2002 – 2011.”
McCosker, John E. 1975. “Feeding Behavior.” The Biology of Sea Snakes, 217.
Milton, David A. 2001. “Assessing the Susceptibility to Fishing of Populations of Rare Trawl
Bycatch: Sea Snakes Caught by Australia’s Northern Prawn Fishery.” Biological
Conservation 101 (3): 281–290. https://doi.org/10.1016/S0006-3207(00)00232-9.
Molina, Juan M., and Steven J. Cooke. 2012. “Trends in Shark Bycatch Research: Current
Status and Research Needs.” Reviews in Fish Biology and Fisheries 22 (3): 719–737.
https://doi.org/10.1007/s11160-012-9269-3.
Moore, Ignacio T., Michael P. Lemaster, and Robert T. Mason. 2000. “Behavioural and
Hormonal Responses to Capture Stress in the Male Red-Sided Garter Snake,
Thamnophis Sirtalis Parietalis.” Animal Behaviour 59 (3): 529–34.
https://doi.org/10.1006/anbe.1999.1344.
Myers, R. A., J. K. Baum, T. D. Shepherd, S. P. Powers, and C. H. Peterson. 2007. “Cascading
Effects of the Loss of Apex Predatory Sharks from a Coastal Ocean.” Science 315
(5820): 1846–50. https://doi.org/10/dvdhrh.
Newsome, Seth D, Carlos Rio, Martinez del, Stuart Bearhop, and Donald L Phillips. 2007. “A
Niche for Isotope Ecology.” Frontiers in Ecology and the Environment 5 (8): 429–436.
https://doi.org/10.1890/060150.01.
Paine, Robert T. 1966. “Food Web Complexity and Species Diversity” 100 (910): 65–75.
Post, David M., Craig A. Layman, D. Albrey Arrington, Gaku Takimoto, John Quattrochi, and
Carman G. Montaña. 2007. “Getting to the Fat of the Matter: Models, Methods and
26
Assumptions for Dealing with Lipids in Stable Isotope Analyses.” Oecologia 152 (1):
179–89. https://doi.org/10.1007/s00442-006-0630-x.
Rao, Chetan, M Muralidharan, Kartik Shanker, and Naveen Namboothri. 2017. “Effect of
Fishing Practices on Species Assemblages of Sea Snakes off the Sindhudurg Coast of
Maharashtra , India .,” 12.
Revuelta, O., F. Domènech, N. Fraija-Fernández, P. Gozalbes, O. Novillo, J. Penadés-Suay,
and J. Tomás. 2018. “Interaction between Bottlenose Dolphins (Tursiops Truncatus)
and Artisanal Fisheries in the Valencia Region (Spanish Mediterranean Sea).” Ocean
and Coastal Management 165 (July): 117–125.
https://doi.org/10.1016/j.ocecoaman.2018.08.001.
Ryer, CH. 2002. “Trawl Stress and Escapee Vulnerability to Predation in Juvenile Walleye
Pollock: Is There an Unobserved Bycatch of Behaviorally Impaired Escapees?” Marine
Ecology Progress Series 232 (May): 269–79. https://doi.org/10.3354/meps232269.
Schmitz, Oswald J. 2007. “PREDATOR DIVERSITY AND TROPHIC INTERACTIONS.”
Ecology 88 (10): 2415–26. https://doi.org/10/d27hc7.
Schoener, Thomas W. 1968. “The Anolis Lizards of Bimini: Resource Partitioning in a
Complex Fauna.” Ecology 49 (4): 704–26. https://doi.org/10/ftq72t.
Schoener, Thomas W. 1974. “Resource Partitioning in Ecological Communities.” Science 185
(4145): 27–39.
Shine, Richard. 1991a. “Intersexual Dietary Divergence and the Evolution of Sexual
Dimorphism in Snakes.” The American Naturalist 138 (1): 103–122.
https://doi.org/10.1086/285207.
———. 1991b. “Why Do Larger Snakes Eat Larger Prey Items ?” Functional Ecology 5 (4):
493–502.
Steneck, R. S. 2012. “Apex Predators and Trophic Cascades in Large Marine Ecosystems:
Learning from Serendipity.” Proceedings of the National Academy of Sciences 109
(21): 7953–54. https://doi.org/10/gf8s5r.
Terborgh, John W. 2015. “Toward a Trophic Theory of Species Diversity.” Proceedings of the
National Academy of Sciences 112 (37): 11415–22. https://doi.org/10/f7src7.
Trochta, John T., Maite Pons, Merrill B. Rudd, Melissa Krigbaum, Alexander Tanz, and Ray
Hilborn. 2018. “Ecosystem-Based Fisheries Management: Perception on Definitions,
Implementations, and Aspirations.” PLoS ONE 13 (1): 1–9.
https://doi.org/10.1371/journal.pone.0190467.
Udyawer, Vinay, Mark Read, Mark Hamann, Michelle R. Heupel, and Colin A. Simpfendorfer.
2016. “Importance of Shallow Tidal Habitats as Refugia from Trawl Fishing for Sea
Snakes.” Journal of Herpetology 50 (4): 527–533. https://doi.org/10.1670/15-026.
Voris, H. K. 1972. “The Role of Sea Snakes (Hydrophiidae) in the Trophic Structure of Coastal
Ocean Communities.” J Mar Biol Assoc India 14: 429–42.
Voris, H. K., H. H. Voris, and L. B. Liat. 1978. “The Food and Feeding Behavior of a Marine
Snake, Enhydrina Schistosa (Hydrophiidae).” Copeia 1978 (1): 134–146.
https://doi.org/10.2307/1443834.
Wilson, Samantha M., Graham D. Raby, Nicholas J. Burnett, Scott G. Hinch, and Steven J.
Cooke. 2014. “Looking beyond the Mortality of Bycatch: Sublethal Effects of
Incidental Capture on Marine Animals.” Biological Conservation 171: 61–72.
https://doi.org/10.1016/j.biocon.2014.01.020.

27
Zhou, Shijie. 2008. “Fishery By-Catch and Discards : A Positive Perspective from Ecosystem-
Based Fishery Management,” 308–15.

28
APPENDIX A: LIST OF SEA SNAKE PREY SPECIES OBSERVED IN GUT CONTENT
Snake Species Prey Family Prey Species Percentage
Hydrophis curtus
Carangidae Alepes sp. 15.38
Carangidae Caranx heberi 7.69
Clupeidae Sardinella longiceps 7.69
Clupeidae Sardinella sp. 15.38
Engraulidae Thryssa dussumieri 7.69
Leiognathidae Leiognathus sp. 15.38
Nemipteridae Nemepteris sp. 7.69
Scombridae Rastrelliger kanagurta 7.69
Serranidae Epinephelus
diacanthus 7.69
Tetraodontidae Lagocephalus inermis 7.69
Hydrophis
schistosus
Ariidae Arius caelatus 1.89
Ariidae Arius maculatus 3.77
Ariidae Arius sp. 1.89
Carangidae Megalapsis cordyla 1.89
Clupeidae Sardinella longiceps 1.89
Clupeidae Sardinella sp. 5.66
Leiognathidae Leiognathus
brevirostris 1.89
Plotosidae Plotosus lineatus 7.55
Plotosidae Plotosus sp. 1.89
Scombridae Rastrelliger kanagurta 1.89
Serranidae Epinephelus
diacanthus 3.77
Serranidae Epinephelus sp. 1.89
Sillaginidae Sillago sihama 1.89
Teraponidae Terapon puta 3.77
Teraponidae Terapon sp. 1.89
Teraponidae Terapon theraps 3.77
Tetraodontidae Arothron sp. 3.77
Tetraodontidae Chelonodon laticeps 7.55
Tetraodontidae Lagocephalus inermis 41.51

29
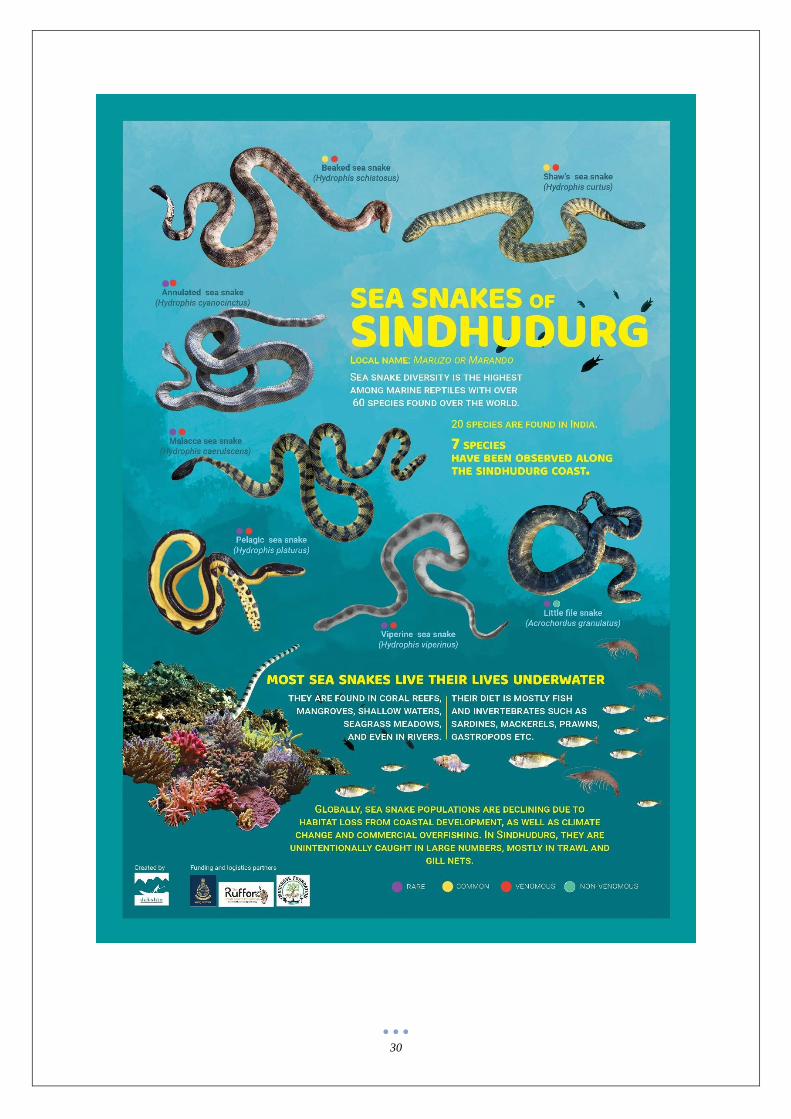
APPENDIX C: SEA SNAKES OF SINDHUDURG POSTER
30