Embed Size (px)
Citation preview

UCRL-CONF-204819
DOE's Effort to Reduce TruckAerodynamic Drag-Joint Experiments andComputations Lead to Smart Design
R.C. McCallen, K. Salari, J. Ortega, L. DeChant, B. Hassan, C.Roy, W.D. Pointer, F. Browand, M. Hammache, T.Y. Hsu, A.Leonard, M. Rubel, P. Chatalain, R. Englar, J. Ross, D.Satran, J.T. Heineck, S. Walker, D. Yaste, B. Storms
June 22, 2004
34th AIAA Fluid Dynamics Conference and ExhibitPortland, OR, United StatesJune 28, 2004 through July 1, 2004

Disclaimer
This document was prepared as an account of work sponsored by an agency of the United States Government. Neither the United States Government nor the University of California nor any of their employees, makes any warranty, express or implied, or assumes any legal liability or responsibility for the accuracy, completeness, or usefulness of any information, apparatus, product, or process disclosed, or represents that its use would not infringe privately owned rights. Reference herein to any specific commercial product, process, or service by trade name, trademark, manufacturer, or otherwise, does not necessarily constitute or imply its endorsement, recommendation, or favoring by the United States Government or the University of California. The views and opinions of authors expressed herein do not necessarily state or reflect those of the United States Government or the University of California, and shall not be used for advertising or product endorsement purposes.
American Institute of Aeronautics and Astronautics1
DOE’s Effort to Reduce Truck Aerodynamic Drag – JointExperiments and Computations Lead to Smart Design
Rose C. McCallen1, Kambiz Salari2, and Jason M. Ortega3
Lawrence Livermore National Laboratory, Livermore, CA 94551
Larry J. DeChant4 and Basil Hassan5
Sandia National Laboratories, Albuquerque, NM 87185-0825
Christopher J. Roy6
Auburn University, Auburn, AL 36849
W. David Pointer7
Argonne National Laboratory, Argonne, IL 60439
Fred Browand8, Mustapha Hammache9, and Tsun-Ya Hsu10
University of Southern California, LosAngeles, CA 90089-1191
Anthony Leonard11, Mike Rubel12, and Philippe Chatalain13
Caltech, Pasadena, CA 91125
Robert Englar14
Georgia Tech Research Institute, Atlanta, GA 30332
James Ross15, D. Satran16, James T. Heineck17, Stephen Walker18, and D. Yaste19, B. Storms 20
NASA Ames Research Center, Moffet Field, CA 94035
At 70 miles per hour, overcoming aerodynamic drag represents about 65% of the totalenergy expenditure for a typical heavy truck vehicle. The goal of this US Department ofEnergy supported consortium is to establish a clear understanding of the drag producingflow phenomena. This is being accomplished through joint experiments and computations,leading to the ‘smart’ design of drag reducing devices. This paper will describe our objectiveand approach, provide an overview of our efforts and accomplishments, and discuss ourfuture direction.
1 Engineer, Center for Applied Scientific Computing, P.O. Box 808 L-98, AIAA member.2 Engineer, New Technologies Engineering Division, P.O. Box 808 L-644, AIAA member.3 Engineer, New Technologies Engineering Division, P.O. Box 808 L-644, AIAA member.4 Engineer, Aerosciences & Compressible Fluid Mechanics Dept., PO Box 5800 MS 0825, AIAA member.5 Manager, Aerosciences & Compressible Fluid Mechanics Dept., PO Box 5800, MS 0825, Associate Fellow AIAA.6 Assistant Professor, Aerospace Engineering Dept., 211 Aerospace Engineering Bldg., Senior Member AIAA.7 Nuclear Engineer, Nuclear Engineering Division, NE-208, AIAA Member.8 Professor, Aerospace & Mechanical Engineering, MS 1191, not a member.9 Research Assistant Professor, Aerospace & Mechanical Engineering, MS 1191, not a member.10 Post Doctoral Researcher, Aerospace & Mechanical Engineering, MS 1191, not a member.11 Professor of Aeronautics, Engineering & Applied Science, 1200 East California Blvd. MC 301-46, not a member.12 Graduate Student, Graduate Aeronautical Laboratories, 1200 East California Blvd. MC 205-45, not a member.13 Graduate Student, Graduate Aeronautical Laboratories, 1200 East California Blvd. MC 205-45, not a member.14 Principal Research Engineer, Aerospace, Transportation & Advanced Systems, Code 0844, Associate Fellow, AIAA.15 Deputy Chief, Systems Analysis Branch, MS 260-1, Associate Fellow, AIAA.16 Aeronautical Projects and Program Office, MS 260-1, Senior Member, AIAA.17 Aeronautical Projects and Program Office, MS 260-1, not a member.18 Aeronautical Projects and Program Office, MS 260-1, not a member.19 Aeronautical Projects and Program Office, MS 260-1, not a member.20 Aeronautical Projects and Program Office, MS 260-1, not a member.

American Institute of Aeronautics and Astronautics2
I. Introductionmodern Class 8 tractor-trailer can weigh up to 80,000 pounds and has a wind-averaged drag coefficient aroundCD = 0.6 (CD = drag / (dynamic pressure . projected area)). More energy is consumed in overcoming
aerodynamic drag as the vehicle speed increases. Figure 1 contains the estimated horsepower associated withaerodynamic drag in comparison to the power required to overcome rolling resistance and to supply neededauxiliary power, plotted as a function of speed.At 70 miles per hour, a common highway speedtoday, overcoming aerodynamic drag representsabout 65% of the total energy expenditure for atypical heavy truck vehicle. Reduced fuelconsumption for heavy vehicles can beachieved by altering truck shapes to decreasethe aerodynamic resistance or drag. It isconceivable that present day truck dragcoefficients might be reduced by as much as50%. This reduction in drag would representapproximately a 25% reduction in fuel use athighway speeds. An estimated total savings of$1.5 billion per year can be recognized in theUnited States alone for just a 6% reduction infuel use.
The project goal for our United StatesDepartment of Energy (DOE) supportedConsortium is to establish a clear understandingof the drag producing flow phenomena throughjoint experiments and computations, leading tothe ‘smart’ design of drag reducing devices. Asdiscussed in the following section, past experimental efforts by other research and development teams have usuallyprovided only the change in overall body drag due to the installation of add-on devices.1 Local detailed flow orpressure measurements were not typically included. Without a detailed knowledge of the velocity and pressurefields, early experimenters drew conclusions on the mechanisms for drag reduction and optimized the design of add-on devices by gathering overall body drag with variations in size and shape of the device. Current experimentalefforts by the DOE Consortium involve the use of state-of-the-art instrumentation, measurement techniques, anddiagnostics at Reynolds numbers representative of highway conditions that capture the velocity field and transientsurface pressure about a tractor-trailer. These detailed and accurate results can be used to not only provide insightinto the flow phenomena, but also to validate the computational models and tools. Computational efforts include thedevelopment and demonstration of the ability to simulate and analyze aerodynamic flow around heavy truckvehicles using existing and advanced computational fluid dynamics (CFD) tools. These tools can then be used, inconjunction with full-scale experiments, to guide the design refinement of devices for optimum performance. Thefinal products are specific device concepts that can significantly reduce aerodynamic drag, and thus improve fuelefficiency, in addition to an experimental data base and validated CFD tools. The documented findings continue toprovide clear guidance on methods of computational simulation and experimental modeling techniques for capturingthe flow phenomena around a heavy vehicle and add-on drag reducing devices.
This DOE Heavy Vehicle Aeodynamic Drag Consortium is a collaborative effort of 7 organizations: LawrenceLivermore National Laboratory (LLNL), Sandia National Laboratories (SNL), and Argonne National Laboratory(ANL), University of Southern California (USC), California Institute of Technology (Caltech), National Aeronauticsand Space Administration Ames Research Center (NASA Ames), and Georgia Tech Research Institute (GTRI)(Figure 2). The DOE Energy Efficiency and Renewable Energy, Office of FreedomCAR & Vehicle Technologies(CAR stands for Cooperative Automotive Research), is supporting the consortium’s effort.
The contributions and role of each organization in the Consortium are complimentary and sometimesoverlapping to encourage close collaboration between the organizations. NASA, USC, GTRI, and LLNL allcontribute to the experimental effort by conducting both wind tunnel and road experiments often in a joint effort.SNL, ANL, LLNL, and Caltech all contribute to the computational effort including computational modeling of fullbody aerodynamics and the investigation and design of add-on devices. SNL and LLNL have producedcomputational results for the integrated benchmark geometry called the Ground Transportation System (GTS) model
A
Figure 1. Horsepower required to overcome aerodynamic dragand rolling friction/accessories as a function of travel speed fora typical Class 8 tractor-trailer.
Level Highway Speed, MPH

American Institute of Aeronautics and Astronautics3
(Figure 3)2,3, ANL for the Generic Conventional Model (GCM) (Figure 4), and LLNL for investigations of thetractor-trailer gap and trailer wake flow. Caltech has performed ground-breaking research and development of agridless vortex method and continues to work on turbulence model development and benchmark simulationsutilizing their advanced vortex method approach. USC, GTRI, NASA, and LLNL are involved in thedemonstration and design optimization of devices. USC is investigating an acoustic drag reducing device that hasbeen named ‘Mozart’, GTRI continues their investigation of a blowing device with wind tunnel and full-scale tracktesting, USC and NASA performed very detailed wind tunnel investigations of an angled-plate trailer base dragreduction device called ‘base flaps’ and USC is in theprocess of performing full-scale road tests with thebase flaps in collaboration with the CaliforniaPartnership for Advanced Transportation Highways(PATH), and LLNL has developed and wind tunneltested a new concept for underbody drag reductionand has developed and computationally modeled atractor-trailer-gap device. An overview of this workwith emphasis on accomplishments are provided hereand further details can be found in the sited individualand team publications in the Reference section of thispaper.
As mentioned above, the DOE Consortium hasinvestigated the flow field around the GCM geometry(Figure 4) both experimentally and computationally.The experimental data provides details of the transienttractor-trailer gap flow and wake flow due to themassively separating flow from the trailing edge ofthe trailer, and the computational effort continues towork towards accurately capturing the importantcharacteristics of the wake flow. This work hasprovided detailed insight into the flow phenomena,which has lead to the successful development of dragreduction devices. For example, we have found thatpartial closure of the tractor-trailer gap with a singlesplitter plate is adequate in hindering the high dragsituation of blow through, whereas past designs used afull closure device or the traditional cab sideextenders. Evaluation of a trailer base flap device(~15% reduction in drag) with the use of a low-boytrailer and/or side skirts (~10% reduction in drag)indicates an expected combined drag reduction of 22to 25% (Figure 4). The reduction in fuel use athighway speeds is about half the reduction in drag.Thus, use of these devices should provide an 11 to12% fuel savings which is estimated to result in a $3billion per year fuel cost savings in the United States.
Efforts continue in the investigation of acousticand pneumatic devices to reduce base and separationdrag, and some new ideas for reducing tractor-trailergap and underbody drag. Plans are to continue workon the use of computational modeling and full-scaletesting to refine and optimize the design of add-ondevices. Future new areas being investigated arewheel and wheel-well aerodynamics related to brake cooling, tire splash and spray, and to determine their impact onunderbody and trailer base drag reducing devices. This will involve an investigation of the flow characteristics ofrotating wheels and the wheel-well and their coupling to the underbody and wake flow utilizing experiments andcomputations.
Figure 2. Consortium members in NASA Ames 12-footpressure wind tunnel.
Figure 3. GTS model installed in the NASA Ames 7- by10-Ft wind tunnel.

American Institute of Aeronautics and Astronautics4
This paper provides background on past experimental efforts in heavy vehicle aerodynamics, and an overview ofour efforts and accomplishments. Details on how the work of the DOE consortium builds and expands on pastefforts are provided, along with detailed experimental information on the flow phenomena about a tractor-trailer, aswell as an added, complimentary computational modeling effort. This paper also includes a discussion of our futuredirection and how this includes our continued efforts to encourage the use of drag reducing technology.
II. BackgroundA wealth of information on the aerodynamics of heavy vehicles can be found in the open literature dating back to
at least the early 1970’s. A recent review paper by Kevin Cooper, Aerodynamics Laboratory, NRC Canada1
provides an overview of experiments performed by NRC Canada that demonstrate the benefits of drag-reducingtechnology. More recent work can be found in the proceedings of the UEF Conference on The Aerodynamics ofHeavy Vehicles: Trucks, Buses and Trains held in Monterey, California in December of 20024.
Almost all of the early work involved wind tunnel and road testing to investigate the effect of tractor-cab shapingor edge rounding of tractor and trailer and the performance of a range of add-on drag reducing devices. Early effortswere very successful at designing tractor-mounted aero devices or tractor-shaping with edge rounding that providedsignificant wind-averaged drag reductions, ∆CD(Vt), of order 0.15 to 0.25 at truck road speeds, Vt, of 55mph whichcan provide fuel savings of roughly 3,000 to 5,000 US gallons per year, per truck1. Most importantly, these tractormodifications were welcomed by the industry as early as the 1980’s and are evident today in the more streamlinetractors with rounded edges and aero-shields. However, trailer or tractor-trailer gap mounted devices that wereshown in the 1980s to provide significant drag reduction are even still not in wide use. These devices include trailerside skirts that reduce underbody drag, trailer boat-tails that reduce base drag, and tractor-trailer side extenders ormid-plain seals that reduce gap drag.
There are several possible reasons why industry has not utilized modifications that reduce base, gap, andunderbody drag. Fleet operators typically purchase several trailers for every tractor, so trailer add-on devices mustbe more economical than a tractor add-on device to recover cost. Maintenance cost is a concern, as well as initialcost. Truck drivers can have difficulty keeping their mud flaps secured, so side skirts are considered added nuisance.In addition, side skirts can restrict access to the underside of the trailer and tractor. Most trailers have rear loadingand the doors must fold completely back for dock loading and unloading. Fleet operators are concerned of thepossible damage to trailer base mounted boattails that need to be moved out of the way or retracted to open reardoors, resulting in higher maintenance costs. This may also pose an additional burden on the driver. It should also benoted that up until the spring of 2002, the U.S. had regulations requiring that the trailer underslide protection orbumper had to hang off of the protruding boattail. Most boattails are made of light weight materials and are notdesigned to support a heavy metal bumper. Fortunately this regulation has changed so that the bumper need not besupported by the boattail. Also, boattails can protrude from the back of a trailer up to 5 feet.
As mentioned above, almost all of the early work involved wind tunnel and road testing. Computationalmodeling was not used to guide experiments or design. There are enormous amounts of data that consist exclusivelyof full-body drag coefficients measured with a force balance for wind tunnel tests and fuel consumptionmeasurements for road tests. Local detailed flow or pressure measurements were not typically included. Without adetailed knowledge of the velocity and pressure fields, early experimenters drew conclusions on the mechanisms fordrag reduction and optimized the design of add-on devices by gathering overall body drag with variations in size andshape of the device.
It was the goal of the DOE Consortium to generate a data base of detailed wind tunnel data that providesvalidation for computational tools, as well as insight into the flow phenomena about a tractor and trailer. To acquirethe needed velocity and pressure measurements, the NASA Ames Team developed new and innovative dataacquisition techniques. With the early 2002 tests in the NASA 7-ft by 10-ft wind tunnel, the Team was one of thefirst to successfully use three-dimensional Particle Image Velocimetry (PIV) in a production wind tunnel.5 Per thedirection of our industrial collaborators, we were encouraged to construct experiments that would determine ifreduced scale and reduce Reynolds number (Re) testing was appropriate in capturing the flow phenomena for heavyvehicles or if full-scale testing was required. In 2003, the NASA Ames 12-ft Pressure Wind Tunnel was utilized tocapture detailed data for a realistic truck geometry at varying Re while maintaining a given Mach number (Ma).6
Ongoing computational modeling, combined with experimental validation, continues to provide insight into thecomplex bi-modal flow between the tractor and trailer and the transient wake flow with and without base dragreduction devices. The steady Reynolds-averaged Navier-Stokes (RANS) modeling approach typically used byindustry has been investigated by our DOE Consortium. The results provide guidelines for use of steady RANS for

American Institute of Aeronautics and Astronautics5
heavy vehicle drag predictions and design of add-on devices. It has been found that the computed overall vehicledrag is highly dependent on the choice of steady RANS turbulence model. Solutions may disagree withmeasurements by 0.5 to 50% for 0 degree yaw and by even higher percentages at yaw angles. Thus, the performanceof steady RANS models for a given geometry is not predictable and experimental results to determine accuracy arecritical when relying on steady RANS for design guidance. Efforts continue into the investigation of unsteadyRANS and hybrid RANS/large-eddy simulation (LES) approaches to improve predictive capabilities. Further detailson our experimental, computational, and design efforts are presented in the following section of this paper.
The issue of how to introduce the drag-reducing technology to the market has been a challenge, as it was for theearly investigators. The DOE Consortium continues to address this issue by encouraging and providing opportunitiesfor interactions and communications with industry. The original DOE multi-year program plan7 was constructed andevolved based on direct input and guidance from tractor and trailer manufacturers and fleet operators throughseveral DOE workshops with industry and visits to industry sites. The consortium participants from ANL havesuccessfully formed an alliance with a tractor manufacturer through the support of a DOE Collaborative Researchand Development Agreement (CRADA) allowing for direct interaction on our computational model development.In 2003, DOE formed a complimentary DOE Industry Consortium to work with our existing DOE Consortium ofR&D laboratories and universities. The DOE Industry Consortium is specifically tasked to address the issue ofgetting advanced technology on trucks. The tractor manufacturers are also strongly encouraged and do attend ourworking group meetings that occur once or twice a year. Involvement of fleet operators and trailer manufacturershas been much more difficult. We continue our efforts to work with the American Trucking Association toencourage dialogue with the fleet operators.
III. Overview of AccomplishmentsThe following is an overview of the DOE Heavy Vehicle Aerodynamic Drag Consortium’s accomplishments in
the project’s 3 focus areas: 7
• Drag reduction devices• Experimental testing• Computational modeling
Detailed reports are being provided by each participating organization as papers submitted for this 34th AIAA FluidDynamics Conference.
A. Drag Reduction DevicesThere are three areas identified for aero drag reduction and several drag reduction devices have been investigated
(Figure 4):• Tractor-Trailer Gap: Stabilizing devices, cab extenders• Wheels/Underbody: Skirts/lowboy trailer (∆CD ~ 0.05), splitter plate• Trailer Base: Boattail plates (∆CD ~ 0.05), base flaps (∆CD ~ 0.08), rounded edges, and pneumatics
The drag reduction for various device add-ons is shown in Figure 4, as a function of vehicle yaw angle. Theseresults were obtained in the NASA Ames 12-foot Pressure Wind Tunnel (PWT) using the realistic GenericConventional Model (GCM) geometry, tested at realistic highway Reynolds numbers (Re = 1.1 million and 6million based on trailer width for 1/8th scale model, representative of 15 and 80 mph for a full-scale vehicle). Sideand roof extenders are shown to significantly reduce the drag at high yaw. Base flaps, as shown in a close-up inFigure 5, are expected to provide 50% more drag reduction than boattails, per comparison of wind tunnelexperiments. For a tractor-trailer with a CD = 0.55 the percent drag reduction (∆CD/CD) utilizing base flaps (~15%)and side skirts and/or a low-boy trailer (~10%) is estimated at 22 to 25 percent. Thus, the use of base flaps and skirtswould provide an 11 to 12 percent fuel savings which should result in a $3 billion per year fuel cost savings in theUS. (Note that the cost of the device and possible maintenance over the year should also be considered fordetermining the overall cost savings to the fleet owner.)
The base flaps are simple flat plates mounted on the edges of the back end of a trailer. The lengths of the platesmatch the dimensions of the trailer base (two 11.5 ft long plates on the sides and two 8.5 ft long plates on the topand bottom for a full-scale vehicle). The width of the plates or how much they protrude from the trailer is about 1/4the width of the trailer or about 2 feet. Tilting the flaps about 20 degrees inward away from being flush with thetrailer sides appears to provide the optimum drag reduction. The optimum flap angle for an on-road vehicle is yet tobe determined, but we expect it to be near 20 degrees.

American Institute of Aeronautics and Astronautics6
Development has continued on tangential blowing aircraft-based technology to reduce heavy vehicle drag byeliminating aft separation on the trailer and recovering base pressure on the back doors (Figure 6). Smaller-scaletunnel results have shown measured drag reductions as high as 15% due to blowing and 10-12% due to the device’scorner rounding, for a total of 25-27%. Blowing also has the potential to increase drag for use in braking, to reducedrag due to side winds, and to overcome directional instabilities due to side gusts. A recorded 5-6% fuel economyincrease (not accounting for energy use for blowing) resulted from limited on-track heavy vehicle fuel economytests. Configuration problem areas have been identified and corrected during follow-on tests, and these are nowbeing re-tested during a second full-scale road test. Previous wind tunnel test results can be found in the referencedliterature8.
Figure 6. Pneumatic device mountedon test vehicle.
Figure 5. Base flaps (gold colored)mounted on back end of trailer (blue) inNASA Ames’ 12-foot pressure wind tunnel.
Figure 4. a) Baseline GCM configuration in the NASA Ames 12’pressurized wind tunnel; and b) Drag coefficient curves for various add-on drag reduction devices.

American Institute of Aeronautics and Astronautics7
B. Experimental Findings and Suggested GuidanceThe 1/8th-scale Ground Transportation System (GTS) model was studied experimentally in the NASA Ames 7- by10-foot Wind Tunnel (Figure 3)5. Previous tests with the GTS model were also performed in 1995 by SNL at theTexas A&M University Low Speed Wind Tunnel2,3. Designed for validation of computational results, the GTSmodel has a simplified geometry with a cab-over-engine design and no tractor-trailer gap. As a furthersimplification, all measurements of the GTS model were made without wheels. Aerodynamic boattail plates werealso tested on the rear of the trailer to provide a simple drag reduction device for computational investigation (Figure7). Unlike the follow-on experiments performed in the NASA 12-foot Pressure Wind Tunnel (PWT), theseexperiments, in the 7-foot by 10-foot tunnel, were for a low Reynolds number (1 million) with this simplified GTSgeometry and without the control of Mach number that is possible in the PWT. (There are also experimental resultsfor the GCM geometry in the 7-foot by 10-foot NASA Ames wind tunnel.)
The experimental measurements include body-axis drag, surface pressures, surface hot-film anemometry, oil-film interferometry, and 3-D particle image velocimetry (PIV). Again, the purpose of obtaining this level of detailon the flow field is for computational model validation, as well as further advancing the understanding of the flowcharacteristics about a heavy vehicle. The goal is to then use this information and computational tools to moreeffectively design drag reducing design characteristics.
The wind-averaged drag coefficient with and without boattail plates was 0.225 and 0.277, respectively. PIVmeasurements behind the model reveal a significant reduction in the wake size due to the flow turning provided bythe boattail plates. The bottail plates have the same flow characteristics of a backward-facing step. A smallrecirculation zone forms in the step region behind the trailing edge of the trailer and the outside of the plate,
providing a low pressure region along the base edge of the trailer that turns the flow inward towards the center of thetrailer base, reducing the size of the wake. Figure 8 provides the measured drag coefficient as a function of yawangle with and without (baseline) boattail plates, demonstrating substantial drag reduction at all yaw angles with asimple base-drag device.
Hot-film measurements on the side of the cab indicate laminar separation with turbulent reattachment within0.08 trailer width for zero and ±10 degrees yaw. Oil film interferometry provided quantitative measurements of skinfriction and qualitative surface flow visualization. Both the hot-film and oil-film measurements provided helpfulinformation for computational flow modeling, as well as further insight into general flow characteristics about heavyvehicles.
The methodology for calculation of the force and pressure coefficients is included in the NASA TechnicalMemorandum5 to facilitate comparison between computation and experiment. The NASA Technical Memorandumalso includes a complete set of the experimental data and the surface definition of the model is included on a CD-ROM for further analysis and comparison.
As mentioned above, experiments have been conducted on a Generic Conventional Model (GCM) in the NASAAmes 7-ft by 10-ft wind tunnel for Reynolds numbers (Re) of 1 million based on the width of the trailer, which
0.20
0.22
0.24
0.26
0.28
0.30
0 4 8 12 16
CD
Yaw angle, deg
BaselineRun 7
Boattail platesRun 14
Figure 8. Effect of boattail plates on drag coefficientfor Re = 2 million.
Figure 7. Photograph of boattailplates installed on rear of trailer.

American Institute of Aeronautics and Astronautics8
corresponds to a full-scale vehicle traveling at roughly 15-mph. As also mentioned in the previous section,additional experiments have been performed on the GCM geometry in the NASA Ames 12-ft pressure wind tunnel(PWT) for Re of 1 and 6 million, where the later corresponds to a full-scale vehicle traveling at 80-mph.
Geometry configurations on the GCM in the PWT included the addition of tractor side extenders, a low-boytrailer, and boattails and base flaps on the trailer’s trailing edge. The results in the PWT are obtained for a constantMach number (Ma = 0.15) by pressurizing the tunnel. This allows for the determination of Re and geometry effects.Yaw angles were varied from +14 to -14 degrees measured from the vehicle length axis and wind direction so thataccurate wind-averaged drag could be determined, in addition to determining the effect of yaw angle. The followingis a list of experimental techniques and measurements:
• Internal balance measured the vehicle forces and moments• Load cells measured the drag for the body axis and yawing moment of the tractor• Static pressure taps on the model (476) and taps on the walls and floor (368) measured static pressure
conditions• Unsteady pressure transducers (14) provide a pressure time history on the surface of the vehicle• Three-dimensional PIV provided a time history of the velocity field on planes in the wake of the vehicle
and in the tractor-trailer gap.Drag measurements alone are not sufficient to provide an understanding of the impact of geometry modifications
and direction for design improvements. It is recommended that advanced measurement techniques like PIV andpressure sensitive paint (PSP) be included. These advanced techniques provide important information on the globaland local structure of the flow and can provide clear design direction and computational model validation. Forexample, in the next section, it is shown that steady RANS modeling does not capture the structure of the trailer basewake, while (for some turbulence model choices and geometries) it can capture the overall vehicle drag. In addition,as shown below, PIV measurements in the tractor-trailer gap have provided insight into the bi-modal nature of theflow and the high and low drag situations for various gap sizes, giving direction to design options for tractor-trailergap closure devices.
Figure 9 shows the measured drag coefficient for the GCM in the PWT with and without base flaps. This figurenot only shows the effectiveness of the base flaps at all yaw angles, but it also provides some insight as to Reynoldsnumber effects. The following are the determined Re effects based on the PWT experiments with the GCM:
• Re effects on CD are in general minimal for experiments with Re above 1 million (Figure 10). Thisfinding supports the common use of scaled down vehicles and Re below typical highway Re forexperimentation.
• Some Re influence was apparent on the flow structure in the tractor-trailer gap and the back end of thetrailer. It was most apparent in the upper portion of the flow region in the gap and in the wake. Thus,some inaccuracies should be considered when evaluating gap and wake drag reduction devices at lowerthan highway Re. For example, see difference in results for side extenders at two different Re measuredin the 12-foot PWT shown in Figure 11. Low Re experiments should provide estimates, but accurateoptimization of devices may require road testing.
• Edge radius effects and/or the cleanliness of the vehicle upstream flow are critical to achieving accuratepredictions. Corner radii on the leading edge of the vehicle should provide Re > 50,000, based oncorner radius and tunnel freestream velocity (Figure 12). Tripping the flow at the vehicle leading edgemay also be required to avoid flow separation (Figure 13).
Figure 9. Drag coefficient versus yaw angle with and without base flapsfor Re = 1.1 million and 6 million.

American Institute of Aeronautics and Astronautics9
0.0
0.1
0.2
0.3
0.4
0.5
0 1 2 3 4 5 6 7
Reynolds Number
CD
bo
dy
GCM
Tractor alone
Figure 10. Drag versus Reynolds number for the GCM at zero yawin the 12-foot PWT.
Figure 11. Examples of Re effects in trailer gap with side extendersmeasured with GCM in 12-foot PWT.
Reynolds Number (in millions)

American Institute of Aeronautics and Astronautics10
Figure 12. Effect of front edge radius on drag of isolated cabwhere’r’ is the radius of curvature for the front edges of the GTS geometry.
Area Reynolds number
CD
50,000 100,000 150,000 200,000 250,000 300,000 350,000 400,000
0.60
0.55
0.50
0.45
0.40
0.35
r = 2.0”
r = 0.5”
Edge Reynolds number
CD
-10,000 10,000 30,000 50,000 70,000 90,000
0.60
0.55
0.50
0.45
0.40
0.35
r = 2.0”
r = 0.5”

American Institute of Aeronautics and Astronautics11
Figure 13. Means of assuring attached flow on front of GTS geometry by triping flow (figure on right).
C. Computational Findings and Suggested GuidelinesTeam members from LLNL, SNL, ANL, and Caltech are investigating a wide range of turbulence models
including steady and unsteady Reynolds-averaged Navier-Stokes (RANS and URANS, respectively), large-eddysimulation (LES), and hybrid methods that use a combination RANS and LES models in the simulation. In addition,various numerical approaches are being considered including finite volume, finite element, and vortex methods. Thefocus thus far has been steady RANS with and without the use of wall functions. Wall functions provide anapproximation to the flow field in the wall region and the boundary layer is not resolved.
Flow simulations of the GTS model at 0° and 10° yaw in the NASA Ames’s 7-foot by 10-foot wind tunnel andthe modified GTS with the non-dimensional gap distance of 0.72at 0° yaw in the USC tunnel have been generated and analyzed.Steady and unsteady RANS flow simulations are performed withNASA’s Overflow code9 that uses overset grids and the SandiaSACCARA code10,11 that uses multi-block, structured grids. Forall GTS simulations in the NASA wind tunnel, the flow conditionis obtained from the available experimental data: Mach number0.28, Reynolds number 2.08x10⁶ (based on trailer width), totalpressure 102649.2 N/m2, total temperature 284.5K, static pressure97339.1 N/m2, static temperature 280.2 °K, and air density 1.206kg/m3.
Figure 14 shows a complex flow field with multiple vorticalstructures and a separation bubble at the leeward side of thevehicle highlighted by particle traces around the GTS geometry at10° yaw in the NASA Ames’s 7-foot by 10-foot wind tunnel.Table 1 provides the computed drag coefficient and the experimentally measured drag values. The subscript Wrefers to the static pressure measured on the test-section tunnel wall and the subscript R refers to the static pressuremeasured upstream of the test section5. The drag coefficients obtained from the simulations are based on thedynamic pressure calculated using the test section dynamic pressure. All turbulence models have similar predictionsfor viscous drag; however, the one-equation Spalart-Almaras (SA) and Menter k-ω (SST) models significantly over-predict the pressure drag. Similarly, the Wilcox k-ω model over predicts the pressure drag, but provides a dragcoefficient closest to the experimental value. All tested RANS turbulence models have difficulty with predicting theexperimentally measured pressure drag. Since the trailer wake has a significant influence on the pressure drag, thissuggests that RANS turbulence models could have difficulty predicting the correct flow structure in the wake of thetrailer.
Figure 14. Particle traces for the GTS modelat 10° yaw.
flow separationbubble
flow separation bubble
boundary layer
attached flow
American Institute of Aeronautics and Astronautics12
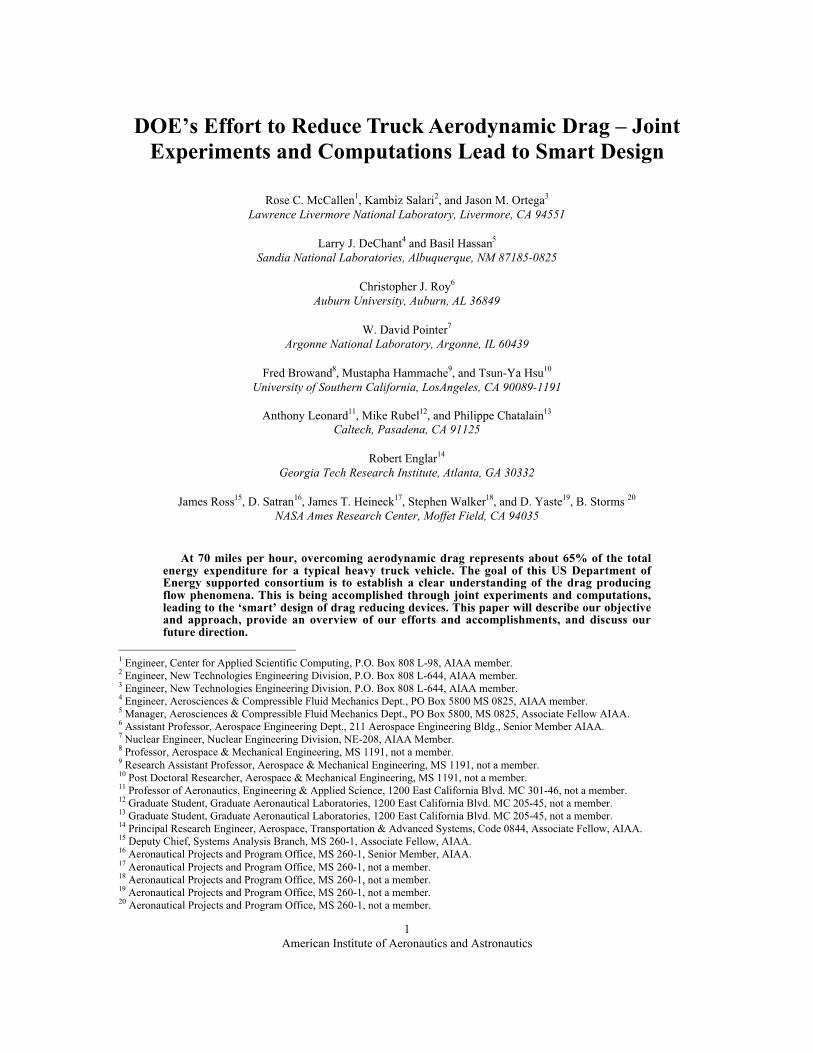
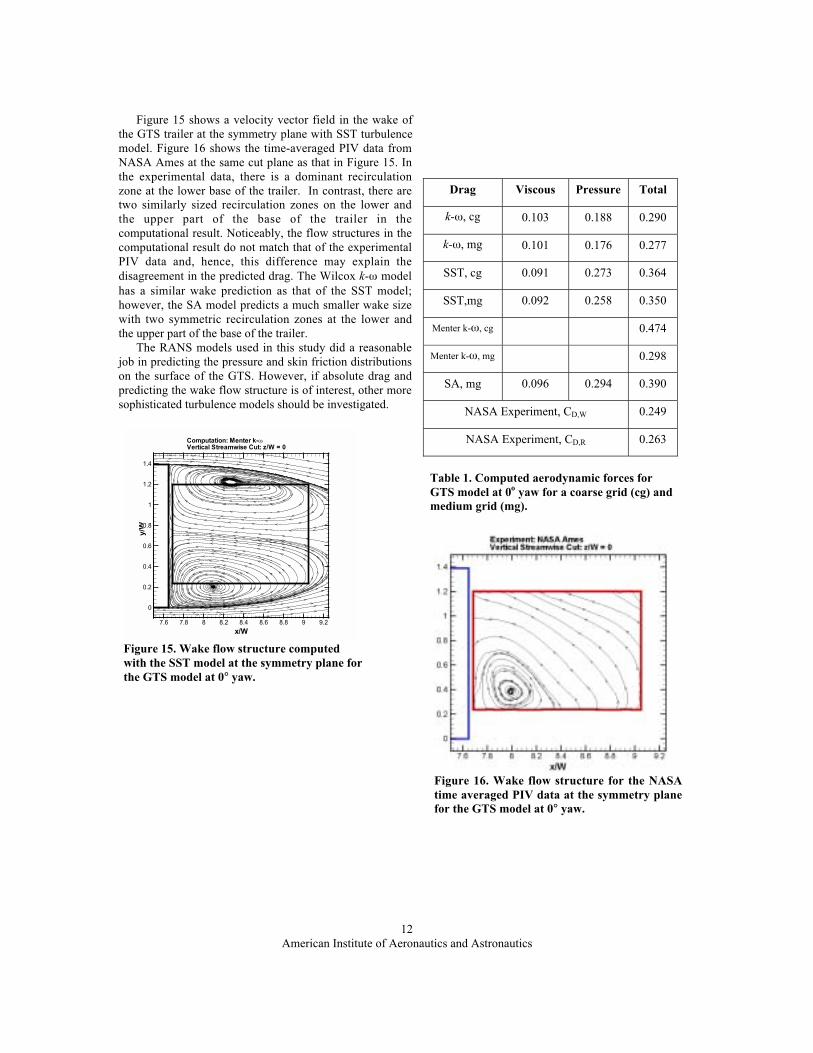
Figure 15 shows a velocity vector field in the wake ofthe GTS trailer at the symmetry plane with SST turbulencemodel. Figure 16 shows the time-averaged PIV data fromNASA Ames at the same cut plane as that in Figure 15. Inthe experimental data, there is a dominant recirculationzone at the lower base of the trailer. In contrast, there aretwo similarly sized recirculation zones on the lower andthe upper part of the base of the trailer in thecomputational result. Noticeably, the flow structures in thecomputational result do not match that of the experimentalPIV data and, hence, this difference may explain thedisagreement in the predicted drag. The Wilcox k-ω modelhas a similar wake prediction as that of the SST model;however, the SA model predicts a much smaller wake sizewith two symmetric recirculation zones at the lower andthe upper part of the base of the trailer.
The RANS models used in this study did a reasonablejob in predicting the pressure and skin friction distributionson the surface of the GTS. However, if absolute drag andpredicting the wake flow structure is of interest, other moresophisticated turbulence models should be investigated.
Drag Viscous Pressure Total
k-ω, cg 0.103 0.188 0.290
k-ω, mg 0.101 0.176 0.277
SST, cg 0.091 0.273 0.364
SST,mg 0.092 0.258 0.350
Menter k-ω, cg 0.474
Menter k-ω, mg 0.298
SA, mg 0.096 0.294 0.390
NASA Experiment, CD,W 0.249
NASA Experiment, CD,R 0.263
Table 1. Computed aerodynamic forces forGTS model at 0o yaw for a coarse grid (cg) andmedium grid (mg).
Figure 16. Wake flow structure for the NASAtime averaged PIV data at the symmetry planefor the GTS model at 0° yaw.
x/W
y/W
7.6 7.8 8 8.2 8.4 8.6 8.8 9 9.2
0
0.2
0.4
0.6
0.8
1
1.2
1.4
Computation: Menter k-ωVertical Streamwise Cut: z/W = 0
Figure 15. Wake flow structure computedwith the SST model at the symmetry plane forthe GTS model at 0° yaw.

American Institute of Aeronautics and Astronautics13
a) Computation (left image), USC experiment (right image), Symmetric condition
b) Computation (left image), USC experiment (right image), Asymmetric condition
Figure 18. Comparison of computed and USC experimental data at the gap mid-height at 0° yaw computedwith the k-ω model for the modified GTS geometry with 0.72 gap size.
Unsteady RANS simulations were conducted on the USC modified GTS geometry with a normalized gapdistance of 0.72, which is above the critical gap distance of 0.5.12 (The USC geometry has a more rounded nose thanthat at the standard GTS geometry to prevent premature separation for low Re experiments.) At this gap distance,the flow experiences unsteadiness and could have multiple stable modes that are either symmetric or asymmetric.Also, the drag contribution from the gap flow significantly increases due to this unsteady behavior. Low drag for thegap relates to stable symmetric flow and high drag relates to the unsteady asymmetric flow. Figure 17 presents asnapshot of the unsteady flow field around the modified GTS model highlighted by particle traces colored byvelocity magnitude. This figure shows the external flow reaching into the gap and exiting on the side. This is the
Figure 17. Particle traces colored byvelocity magnitude computed with the k-ω model for the modified GTS geometryat 0° yaw with 0.72 gap size.
Tractor
Trailer
FlowTractor
Trailer
Flow
Tractor
Trailer
Flow Tractor
Trailer
Flow

American Institute of Aeronautics and Astronautics14
typical unsteady asymmetric flow representing a high drag situation. The unsteady RANS simulation conducted withOverflow is capturing the symmetric and asymmetric flow field in the gap as shown in Figure 18. This figurecompares the computed results with the USC experimental data.
We are also developing guidelines for the accurate prediction of heavy vehicle aerodynamic drag coefficientsusing commercial CFD software. In these studies, computational predictions from the commercial CFD codeStar-CD13 are being compared with detailed velocity, pressure and force balance data from experiments completedin the 7-foot. by 10-foot wind tunnel at NASA Ames14,15 using the GCM geometry. The pressure distribution alongthe vehicle surface using a half-vehicle model with a near-vehicle cell size of 8 mm, a near-wall cell size limit of 0.5mm and the Menter k-ω SST model with a wall function is shown in Figure 19.
The following are the general observations andguidelines for steady RANS modeling:
• Conclusions on predictive capability of aturbulence model can only be determinedwith grid converged solutions. Predictedflow structures in separated regions, likethe trailer wake, vary significantly withgrid refinement. Variation in overall dragis not substantial but still apparent withgrid refinement.
• When using wall functions, the first wallpoint should be held fixed while refiningthe grid (i.e., the distance from this gridpoint to the wall should not change), but itis appropriate to decrease the width of thewall elements while refining the grid (i.e.,refinement in direction tangent to walls).
• The computed overall vehicle drag ishighly dependent on the choice ofturbulent steady RANS model. Solutionsmay disagree with measurements by 0.5to 50% for 0 degree yaw and by evenhigher percentages at yaw angles. Thus,the performance of steady RANS modelsfor a given geometry is not predictable
and experimental results to determine accuracy is critical when relying on steady RANS for designguidance.
• Steady RANS models generally can capture the flow on the front and sides of the vehicle, where theflow stays attached and does not exhibit separation and recirculation zones.
• The flow structure in the trailer wake presented by the time-averaged experimental data does notcompare with that computed with the steady RANS models. The trailer wake is a region of transient fullflow separation and large recirculation zones. Thus, use of steady RANS to evaluate drag reductiondevices in the trailer wake and tractor-trailer gap may provide inaccurate design guidance.
Near term plans are to organize similar types of guidelines related to the performance of unsteady RANS, LES,and hybrid models.
We also continue to pursue the development of vortex particle methods for heavy vehicle aerodynamics. Thesemethods have evolved rapidly in the past ten years and have the benefit of requiring only a surface mesh on thevehicle. Preliminary LES-type simulations, using a vortex method, of flow past the GTS configuration arepromising.16,17
IV. Conclusions and Future DirectionThe DOE Heavy Vehicle Aero Drag Team has modeled the flow field around a generic conventional model both
experimentally and computationally. This effort has provided detailed insight into the flow phenomena, which haslead to the successful development of drag reduction devices. Evaluation of a base flap drag device (~15 % dragreduction) with the use of a low boy trailer and/or side skirts (~10 % drag reduction) indicates an expected drag
Figure 19. Surface contour plot showing the predictedsurface pressure distribution along the surface of theGCM. Areas shown in red are areas of peak positivepressure and areas shown in blue are areas of peaknegative pressure. Selected flow streamlines are alsoshown to illustrate the movement of air over thevehicle.

American Institute of Aeronautics and Astronautics15
reduction of 22 to 25 %. Use of these devices should provide an 11 to 12 percent fuel savings which is estimated toresult in a $3 billion per year fuel cost savings in the US.
To recognize these levels of fuel savings by the effective use of drag reduction devices, the involvement andacceptance by tractor manufacturers, trucking associations, fleet owners, and drivers is critical. Our DOEConsortium continues to solicit input and feedback from these organizations for design and effective use of dragreducing technology.
Future plans are to continue to develop and evaluate drag reducing conceptual designs computationally andencourage and work with industry to road test the most promising drag reducing devices. Road tests with base flapsand SAE track tests with the pneumatic device are planned for fiscal year 2004.
There are several characteristics that are not being captured in our wind tunnel testing that may be more easilycaptured with full-scale road testing. For example, the influence of the stationary road and the moving truck are notbeing captured in our stationary floor and stationary vehicle wind tunnel experiments. It may be important toinvestigate this influence for underbody and base drag reducing devices, like side skirts and base flaps, to determinethe effect of tire rotation, underbody to road clearances, and to determine optimum shaping. Road testing the dragreduction devices provides
• On-road fuel savings• Optimal flap deflection angle for various tractor-trailer geometries• Optimal flap shape, length• Optimum skirt height, shape• Durability, practicality, safety, ease of operation of proposed devices• Impact on truck braking capability
It is recommended that road testing include• Instantaneous broadcast fuel rate (1/2 second updates)• Repeated forward and back trip runs over known, instrumented highways (e.g., South-to-North and
North-to-South runs)• The use of SAE Standards
Plans are to demonstrate “actual” fuel savings from road tests and attempt to interest OEMs in collaborating onthis testing effort.
Efforts continue in the investigation of acoustic18 and pneumatic devices to reduce base and separation drag, andsome new ideas for reducing tractor-trailer gap and underbody drag. Plans are to continue work on the use ofcomputational modeling and full-scale testing to refine and optimize the design of add-on devices. Future new areasbeing investigated are wheel and wheel-well aerodynamics related to brake cooling, tire splash and spray, and todetermine their impact on underbody and trailer base drag reducing devices. This will involve an investigation of theflow characteristics of rotating wheels and the wheel-well and their coupling to the underbody and wake flowutilizing experiments and computations.
Data reduction and analysis of the experimental data for the GCM geometry continues and computations of flowaround the GCM geometry will continue to be compared to this experimental data and analyzed, so that guidancecan be provided on use of unsteady RANS and hybrid RANS/large-eddy simulation methods.
AcknowledgmentsThe Consortium members would like to thank the DOE Energy Efficiency and Renewable Energy, Office ofFreedomCAR & Vehicle Technologies for their continued support, and acknowledge Dr. Sidney Diamond,Technical Area Development Specialist, and Dr. Jules Routbort, Senior Scientist and Technical Program Managerfor Heavy Vehicle Systems, for having the vision and providing the direction to form this consortium effort. Theircontinued enthusiastic support is greatly appreciated. The Team would also like to express our gratitude to ourProject administrator at LLNL, Helen Magann, for her attention to details, endless scheduling of meetings, andassistance with documents and presentations.
This work was performed under the auspices of the U.S. Department of Energy by the University of California,Lawrence Livermore National Laboratory under Contract No. W-7405-ENG-48.
Sandia is a multiprogram laboratory operated by Sandia Corporation, a Lockheed Martin Company, for the UnitedStates Department of Energy's National Nuclear Security Administration under contract DE-AC04-94AL85000.

American Institute of Aeronautics and Astronautics16
The submitted manuscript has been created by the University of Chicago as Operator of Argonne NationalLaboratory (“Argonne”) under Contract No. W-31-109-ENG-38 with the U.S. Department of Energy.
References1Cooper, K. R., “Truck Aerodynamics Reborn – Lessons from the Past,” Proceedings of the 2003 SAE International Truck
and Bus Meeting and Exhibition, Fort Worth, Texas, November 10-12, 2003, SAE Technical Paper Series, 2003-01-3376.2Gutierrez, W. T., Hassan, B., Croll, R. H., and Rutledge, W. H., “Aerodynamics Overview of the Ground Transportation
Systems (GTS) Project for Heavy Vehicle Drag Reduction,” SAE Paper No. 960906, SP 1145, 1996.3Croll, R. H., Gutierrez, W. T., Hassan, B., Suazo, J. A., and Riggins, A. J., “Experimental Investigation of the Ground
Transportation System (GTS) Project for Heavy Vehicle Drag Reduction,” SAE Paper No. 960907, SP 1145, 1996.4McCallen, R. C., Browand, F., Ross, J. C. (eds.), The Aerodynamics of Heavy Vehicles: Trucks, Buses and Trains, Lecture
Notes in Applied and Computational Mechanics, Vol. 19, Springer-Verlag, Heidelberg, to be published August 2004.5Storms, B. L., Ross, J. C., Heineck, J. T., Walker, S. M., Driver, D. M., and Zilliac, G. G., “An Experimental Study of the
Ground Transportation System (GTS) Model in the NASA Ames 7- by 10-Ft Wind Tunnel,” NASA TM-2001-209621, February2001.
6Storms, B. L., Satran, D. R., Heineck, J. T., and Walker, S. M. "A Study of Reynolds Number Effects and Drag-ReductionConcepts on a Generic Tractor-Trailer," AIAA Paper 2004-2251, 24th AIAA Aerodynamic Measurement Technology andGround Testing, June 2004.
7McCallen, R. C., Browand, F., Rutledge, W., Ross, J. C., Leonard, A., A Multi-Year Program Plan for the AerodynamicDesign of Heavy Vehicles, Heavy Vehicle Aerodynamic Drag Project [online publications], URL:http://eed.llnl.gov/aerodrag/pdf/mypp.pdf [cited May 1998]
8Englar, R. J., “Advanced Aerodynamic Devices to Improve the Performance, Economics, Handling and Safety of HeavyVehicles,” SAE Paper No. 2001-01-2072, Washington, DC, May 14-16, 2001.
9Overflow Code, version 1.8s, NASA Ames Research Center.10Wong, C. C., Soetrisno, M., Blottner, F. G., Imlay, S. T., and Payne, J. L., “PINCA: A Scalable Parallel Program for
Compressible Gas Dynamics with Nonequilibrium Chemistry,” SAND 94-2436, Sandia National Laboratories, Albuquerque,NM, 1995.
11Roy, C. , D. Kuntz, M.A. McWherter-Payne, J.L. Payne, “RANS Simulations of a Simplified Tractor/Trailer Geometry,”The Aerodynamics of Heavy Vehicles: Trucks, Buses and Trains, edited by R. C. McCallen, F. Browand, and J. C. Ross, LectureNotes in Applied and Computational Mechanics, Vol. 19, Springer-Verlag, Heidelberg, to be published August 2004.
12Hammache, M., Browand, F., “On the Aerodynamics of Tractor-Trailers”, The Aerodynamics of Heavy Vehicles: Trucks,Buses and Trains, edited by R. C. McCallen, F. Browand, and J. C. Ross, Lecture Notes in Applied and ComputationalMechanics, Vol. 19, Springer-Verlag, Heidelberg, to be published August 2004.
13Star-CD, version 3.150A, CD-Adapco Group, Melville, NY.14D. Satran, “An Experimental Study of the Generic Conventional Model (GCM) in the NASA Ames 7-by-10-Foot Wind
Tunnel,” The Aerodynamics of Heavy Vehicles: Trucks, Buses and Trains, edited by R. C. McCallen, F. Browand, and J. C. Ross,Lecture Notes in Applied and Computational Mechanics, Vol. 19, Springer-Verlag, Heidelberg, to be published August 2004.
15Heineck, J. T., Walker, S., Satran, D., “The Measurement of Wake and Gap Flows of a 1/8th Scale Generic Truck UsingThree-Component Particle Image Velocimetry,” The Aerodynamics of Heavy Vehicles: Trucks, Buses and Trains, edited by R. C.McCallen, F. Browand, and J. C. Ross, Lecture Notes in Applied and Computational Mechanics, Vol. 19, Springer-Verlag,Heidelberg, to be published August 2004.
16G. Daeninck, G., Chatelain, P., Rubel, M., Winckelmans, G., A. Leonard, “Simulation of Vehicle Aerodynamics using aVortex Element Method,” The Aerodynamics of Heavy Vehicles: Trucks, Buses and Trains, edited by R. C. McCallen, F.Browand, and J. C. Ross, Lecture Notes in Applied and Computational Mechanics, Vol. 19, Springer-Verlag, Heidelberg, to bepublished August 2004.
17Kamenmoto, K., Ojima, A., “Applicability of the Vortex Methods for Aerodynamics of Heavy Vehicles,” TheAerodynamics of Heavy Vehicles: Trucks, Buses and Trains, edited by R. C. McCallen, F. Browand, and J. C. Ross, LectureNotes in Applied and Computational Mechanics, Vol. 19, Springer-Verlag, Heidelberg, to be published August 2004.
18Hsu, T.-Y., Browand, F., Hammache, M., “Base Flaps and Oscillatory Perturbations to Decrease Base Drag”, TheAerodynamics of Heavy Vehicles: Trucks, Buses and Trains, edited by R. C. McCallen, F. Browand, and J. C. Ross, LectureNotes in Applied and Computational Mechanics, Vol. 19, Springer-Verlag, Heidelberg, to be published August 2004.