Embed Size (px)
Citation preview

Does Business Strategy Impact a Firm’s Information Environment?
Kathleen A. Bentley a,
*, Thomas C. Omer b, Brady J. Twedt
c
a The University of New South Wales, Sydney, NSW 2052, Australia
b University of Nebraska-Lincoln, NE 68588, United States
cTexas A&M University, College Station TX 77843-4353,United States
May 2013
Acknowledgments: We are grateful to the University of New South Wales, Texas A&M University and
the Mr. and Mrs. James Whatley Chair in Business for financial support. We thank Phillip Brown,
Andrew Jackson, and Baljit Sidhu for helpful comments.
*Correspondence to: School of Accounting, Australian School of Business, 3058 Quadrangle Building,
The University of New South Wales, UNSW Sydney, NSW 2052 Australia.
Tel.: + 61 2 9385 6930.
Fax: + 61 2 9385 5925.
E-mail addresses: [email protected] (K. Bentley), [email protected] (T. Omer),
[email protected] (B. Twedt).

Does Business Strategy Impact a Firm’s Information Environment?
Abstract: Using organizational theory, our study examines whether a firm‘s business strategy impacts
their information environment. On the one hand, organizational theory suggests that firms following an
innovation-oriented Prospector strategy are more likely to have attributes typically associated with
information asymmetry (e.g., R&D and growth options) relative to industry peer firms following an
efficiency-oriented Defender strategy. However, Prospectors are also hypothesized to have greater
incentives to mitigate information asymmetry relative to Defenders, thus reflecting the complex
interrelationships that a firm‘s strategy may have on their overall information environment. We find that
Prospectors are associated with significantly lower levels of information asymmetry relative to
Defenders. We then examine several mechanisms that may explain why Prospector firms exhibit less
information asymmetry than Defender firms. We find that Prospectors are associated with higher levels
of analyst and business press coverage, and issue more frequent voluntary disclosures compared to
Defenders. We conclude that although Prospectors have inherent firm-level attributes associated with
information asymmetry (e.g., R&D and growth options), incentives and mechanisms exist that allow
firms following this strategy to mitigate this information asymmetry. Overall, our results suggest that
business strategy does impact firms‘ information environments.
Keywords: Business strategy; Information asymmetry; Information environment
JEL classification: D21, D80, L21, M41
Data availability: Data are obtained from public sources as indicated in the text.

1
Does Business Strategy Impact a Firm’s Information Environment?
1. Introduction
Beyer et al.‘s (2010) review of the information environment literature reveals that little is known
regarding the interrelationships among a firm‘s information environment, its voluntary disclosure
practices, and analyst forecasts. In this study, we address Beyer et al.‘s (2010) call for research in this
area by examining these interrelationships within the context of a fundamental element of a firm‘s
identity: namely, its business strategy. Using organizational theory, we posit that the type of business
strategy firms follow could have an important effect on their information environments, and we
investigate whether business strategy explains differences in information asymmetry among firms. We
also investigate whether mechanisms that mitigate or reduce information asymmetry (e.g., analyst and
press coverage, voluntary disclosures) differ across firm strategies.
This study is important because organizational theory represents an unexplored framework for
understanding why business strategy could be an underlying factor in firms‘ information environments.
Thus, we seek to provide a new basis for understanding the complex interrelationships that determine a
firm‘s overall information environment. In addition, our study attempts to address the ―identification of
the major sources or firm-specific drivers of information asymmetry‖, which Aboody and Lev (2000, p.
2748) identify as an important area of research with public policy implications. Because firms‘ business
strategies are chosen very early in a firm‘s history and remain relatively stable over time (Hambrick,
1983; Snow and Hambrick, 1980), business strategy is likely an underlying, firm-specific characteristic of
firms‘ information environments.
We rely on organizational theory and the Miles and Snow (1978, 2003) business strategy
typology to address our research questions.1 Similar to prior accounting research (e.g., Bentley et al.,
2012; Ittner et al., 1997; Simons, 1987), we focus our discussion on firms following Prospector and
Defender strategies, as these strategies are the endpoints of the Miles and Snow (1978, 2003) business
1 Refer to Bentley et al. (2012) for a discussion of how Miles and Snow‘s typology aligns with other types of
business strategy typologies (e.g., Porter, 1980).

2
strategy continuum and are most easily differentiated in terms of organizational characteristics (e.g., risk-
taking, managerial discretion). Firms following a Prospector strategy compete on the basis of innovation
for a diverse and rapidly changing set of products, while firms following a Defender strategy compete on
the basis of efficiency for a narrow and stable set of products.2
On the one hand, organizational theory suggests that Prospectors may have greater information
asymmetry relative to Defenders because the Prospector strategy is closely aligned with firm-specific
characteristics that prior research has associated with greater information asymmetry: R&D and growth
options (e.g., Aboody and Lev, 2000; Barth et al., 2001; Smith and Watts, 1992). However, prior research
also suggests that firms with these same characteristics attract greater analyst coverage due to the
potential gains from private information acquisitions (Barth et al., 2001; Lehavy et al., 2011). Greater
analyst coverage in turn is associated with reduced mispricing, uncertainty about firm value, and
information asymmetry (Barth et al., 2001; Brennan and Subramanyam, 1995; Thomas, 2002). Further,
Prospectors may be more likely to receive coverage in the business press relative to Defenders for many
of the same reasons that analysts choose to follow Prospectors, where prior research indicates that firms
with greater press coverage experience lower levels of information asymmetry (e.g., Bushee et al., 2010;
Soltes, 2010).
In addition, organizational theory suggests that relative to Defenders, Prospectors may have
greater strategic incentives to provide more frequent voluntary disclosures, thereby potentially decreasing
information asymmetry (e.g., Coller and Yohn, 1997; Frankel et al., 1995). For example, because
Prospectors rely more heavily on external sources for financing relative to Defenders (Bentley et al.,
2012; Hambrick, 1983; Ittner et al., 1997; Miles and Snow, 1978, 2003), Prospectors have greater
strategic incentives to reduce information asymmetry via voluntary disclosure with providers of capital—
2 Organizational theory indicates that both Prospector and Defender strategies coexist within industries where
―Prospectors succeed by moving fast, and Defenders by moving efficiently‖ (Miles and Snow, 1994, p. 13). For
example, Miles and Snow (1994, pp. 13-14) indicate that within the microprocessor industry, Intel is classified as a
Prospector and National Semiconductor is classified as a Defender where the former is a ―leader in product
innovation‖ while the latter is a company ―focusing narrowly on efficient chip production‖. Refer to Miles and
Snow (1994) for other strategy classification examples.

3
i.e., to lower their cost of capital. Because Prospectors use stock-based compensation plans more
extensively than Defenders (Rajagopalan, 1997; Rajagopalan and Finkelstein, 1992), managers of
Prospectors are more likely to provide voluntary disclosures (Aboody and Kasznik, 2000; Nagar et al.,
2003; Noe, 1999). Finally, because a successful Prospector strategy is highly dependent on extensive
marketing efforts (Miles and Snow, 1978, 2003), Prospectors may seek greater visibility through media
outlets (e.g., issuing more press releases) relative to Defenders. Because of the interrelationships a firm‘s
business strategy may have with other elements impacting the firm‘s information environment, it is
unclear whether Prospectors‘ voluntary disclosures, analyst following, and press coverage successfully
reduce their information asymmetry. Thus, the question of whether Prospectors or Defenders have more
or less information asymmetry is an empirical question that we address in this study.
We use an archival measure of Miles and Snow‘s (1978, 2003) business strategy typology
developed by Bentley et al. (2012) to investigate the relation between business strategy and proxies for
information asymmetry. Overall, we find evidence of significant differences in the information
environments of firms following these two business strategies. We find that Prospectors relative to
Defenders have smaller bid-ask spreads, lower analyst forecast dispersion, and higher analyst forecast
accuracy. Thus, our results suggest that Prospectors are associated with less information asymmetry when
compared to Defenders. We then analyze whether mechanisms that mitigate or reduce information
asymmetry (e.g., analyst and press coverage, voluntary disclosures) differ across these two business
strategies. We find that Prospectors attract greater analyst and business press coverage compared to
Defenders. We also find that Prospectors engage in greater and more frequent voluntary disclosures than
Defenders by issuing more frequent management earnings guidance and more press releases in general.
We conclude that although Prospectors have inherent firm-level attributes associated with greater
information asymmetry (e.g., R&D and growth options), Prospectors‘ ability to attract both greater
analyst and press coverage, combined with their incentives to issue voluntary disclosures more frequently,
successfully lowers Prospectors’ information asymmetry relative to Defenders. Altogether our results
suggest that firms‘ chosen business strategy does impact their information environments.

4
Our contributions are three-fold. First, by examining the interrelationships among a firm‘s
information environment, its voluntary disclosure practices, and analysts‘ forecasting behavior, we not
only address Beyer et al.‘s (2010) call for more research in this area but also extend the analysis of these
interrelationships to a fundamental element of a firm‘s identity: its business strategy. Second, by
examining voluntary disclosure practices in the context of business strategies, our study provides some
insights into a theoretical rationale for why firms select different levels of disclosure—i.e., firms‘
strategic objectives may either constrain or encourage these practices. Finally, by linking organizational
theory to accounting, we provide a theoretical framework for understanding why business strategy is an
underlying determinant of firms‘ information environments.
The rest of the paper is organized as follows. Section 2 provides the literature review and
hypotheses development. Section 3 presents our empirical models, and Section 4 describes our data.
Section 5 provides our main empirical results. Section 6 presents our additional analyses while Section 7
concludes.
2. Literature review and hypothesis development
Beyer et al.‘s (2010) review of the literature indicates that the ―corporate information
environment develops endogenously as a consequence of information asymmetries and agency problems
between investors, entrepreneurs, and managers‖ (p.296). Accounting information serves to decrease
information asymmetries between managers with private information and external capital providers
regarding the expected profitability of the firm‘s investment opportunities (e.g., the lemons problem in
Akerlof, 1970) and also mitigates agency costs that arise from the separation of a firm‘s ownership and
control (Beyer et al., 2010; Healy and Palepu, 2001). Prior research has focused on executive
compensation and identified a firm‘s business strategy as a source for agency problems (e.g.,
Rajagopalan, 1997; Rajagopalan and Finkelstein, 1992). We extend this work by investigating whether
firms‘ business strategies are an underlying source of differences in firms‘ information environments.

5
2.1 Business strategy, firm-specific characteristics, and information asymmetry
Firms with more research and development (R&D) expenditures have greater information
asymmetry because unlike tangible assets (e.g., Property, Plant and Equipment), there are no organized
markets for intangible assets from which to derive asset pricing information (Aboody and Lev, 2000).
Furthermore, because R&D is firm-specific, informational value cannot be obtained from observing other
firms (Aboody and Lev, 2000). Barth et al. (2001) indicate that for firms with substantial intangible
assets there is greater uncertainty about firm value and these firms are more likely to be perceived as
mispriced by outsiders (e.g., analysts). Similarly, Lev and Zarowin (1999) indicate that firms with
substantial intangible investments have lower earnings informativeness. Organizational theory predicts,
and empirical research confirms, that firms following a Prospector strategy invest more heavily in R&D
because their strategic objectives are focused on locating and exploiting new and continually changing
product-market opportunities (Hambrick, 1983; Miles and Snow, 1978, 2003). Conversely, firms
following a Defender strategy tend to minimize R&D expenditures for their narrowly defined product set,
investing instead in single-core technologies (e.g., Property, Plant and Equipment) to enable the
production of cost-efficient outputs on a continual and predictable basis (Hambrick ,1983; Miles and
Snow, 1978, 2003). Therefore, relative to Defenders, Prospectors may be inherently associated with
greater information asymmetry due to their substantial R&D investments.
Prior research also suggests that firms with more growth options have greater information
disparity between managers and outside investors because managers have better knowledge about the
expected future cash flows from their firm‘s investment opportunities (e.g., McLaughlin et al., 1998;
Smith and Watts, 1992). Organizational theory predicts that firms following a Prospector strategy are
associated with more growth options due to their focus on locating and exploiting new product-market
opportunities compared to firms following a Defender strategy (Miles and Snow, 1978, 2003). For
instance, Prospectors exhibit rapid and sporadic growth patterns as they continually pursue new product-
market opportunities, while Defenders grow gradually through market penetration of their existing
product lines (Miles and Snow, 1978, 2003). Prospectors are also associated with greater outcome

6
uncertainty because they pursue innovative products where new and innovative projects are riskier and
have a greater probability of failure (Rajagopalan, 1997; Rajagopalan and Finkelstein, 1992).3 In light of
their greater potential for growth options and their higher investment outcome uncertainty, Prospectors
may generate greater information asymmetry between managers and outside investors concerning the
expected future cash flows from their investment opportunities.
However, prior literature also suggests that firms that are growth-oriented and R&D intensive
attract greater analyst coverage because analysts perceive there to be more mispricing in these firms; thus,
analysts can potentially benefit more through private information acquisitions (Barth et al., 2001; Lehavy
et al., 2011). Barth et al. (2001) find that analyst coverage and effort are greater for firms with larger
R&D investments relative to their industry peers, while firms with more tangible assets (e.g., Property,
Plant and Equipment) provide fewer incentives for analysts to engage in private information acquisition.
Increases in analyst coverage in turn can then reduce mispricing, uncertainty about firm value, and
information asymmetry (Barth et al., 2001; Brennan and Subramanyam, 1995; Thomas, 2002). Based on
these results we expect that Prospectors will be more likely to attract analyst coverage due to their
inherent characteristics (e.g., growth-oriented, R&D intensive firms).
Prospectors may also be more likely to receive coverage in the business press relative to
Defenders for many of the same reasons that analysts choose to follow Prospectors, and firms with
greater press coverage also experience reductions in information asymmetry (e.g., Bushee et al., 2010;
Soltes, 2010). For instance, Bushee et al. (2010) find that the business press serves as an information
intermediary where the broad dissemination of information reduces information asymmetry (e.g., lower
3 Defender firms also have some outcome uncertainty which stems from their reliance on a narrow product-market
domain and their inability to adapt quickly to sudden market changes, leaving Defenders vulnerable to obsolescence
(Miles and Snow, 1978, 2003). However, because this type of uncertainty depends primarily on market-wide factors
(e.g., market demand, new technological developments), prior research assumes that managers and investors are
considered equally informed for this type of uncertainty (e.g., Dierkens, 1991; Krishnaswami et al., 1999). Thus,
only the firm-specific element of a firm‘s total uncertainty contributes to information asymmetry—i.e., where
managers have private information about the firm before the information reaches the market (e.g., Bhagat et al.,
1985; Blackwell et al., 1990; Dierkens, 1991; Krishnaswami et al., 1999). In addition, Miles and Snow (1978) find
that when firms are faced with greater environmental uncertainty they focus their efforts externally on marketing
and product development activities while firms faced with lower environmental uncertainty focus on internally-
oriented functions such as production efficiency. Therefore organizational theory implies that firms following a
Prospector relative to Defender strategy are associated with greater uncertainty.

7
bid-ask spreads) around earnings announcements. Thus, we expect that Prospectors are more visible in
the press compared to Defenders for several reasons. First, Prospectors’ success in implementing an
innovative first-mover strategy depends on extensive marketing efforts (Miles and Snow, 1978, 2003),
where marketing efforts (e.g., product advertising) include actions that potentially increase the firm‘s
visibility in the business press. Conversely, organizational theory predicts and research confirms
(Hambrick, 1983; Miles and Snow, 1978, 2003) that Defenders minimize marketing-related activities,
focusing instead on operational efficiency. Because continual change occurs more frequently in
Prospectors relative to Defenders not only in terms of product offerings but also regarding organizational
leadership and structure (e.g., Miles and Snow, 1978, 2003; Simons, 1987), Prospectors are more likely
to be covered in the business press. For example, publicly-traded firms are required to file a form 8-K
announcing significant events to shareholders such as changes in management or directorship control or
the completion of acquisitions (U.S. Securities and Exchange Commission, 2012), and Prospectors are
both more likely to have a ―transitive dominant coalition‖ (i.e., greater executive turnover) and are also
shown to engage in more mergers and acquisitions (Bentley et al., 2012; Miles and Snow, 1978, 2003;
Thomas and Ramaswamy, 1994, 1996).4
Altogether, we expect that while Prospectors likely embody firm-specific characteristics
associated with greater information asymmetry (i.e., R&D and growth options), Prospectors also likely
attract greater analyst and press coverage, thus perhaps reducing their overall information asymmetry.
Further complicating the relationship between a firm‘s business strategy and its overall information
environment are different strategic incentives that firms have for providing voluntary disclosures, which
we explore in the next section.
2.2 Business strategy, voluntary disclosure incentives, and information asymmetry
Prior literature suggests that reducing information asymmetry can potentially increase a firm‘s
stock liquidity and lower its cost of capital (e.g., Barry and Brown, 1984, 1985; Brown, 1979; Diamond
4 We note that these actions also imply that Prospector firms are more likely to be active in issuing press releases,
which we explore in greater detail in the next section covering voluntary disclosures.

8
and Verrecchia, 1991; Easley and O‘Hara, 2004; Kim and Verrecchia, 1994). Firms can reduce
information asymmetry by issuing more voluntary disclosures (Coller and Yohn, 1997), where greater
frequency of disclosure enables firms to gain access to capital markets more often (Frankel et al., 1995)
and reduce their cost of capital (see Beyer et al.‘s 2010 review).5 We posit that Prospectors have greater
strategic incentives to lower their cost of capital relative to Defenders. For example, although both types
of firms clearly benefit from lower costs of capital; organizational theory suggests that Defenders are
more capable of generating funds internally from operations while Prospectors rely heavily on external
sources for financing (Miles and Snow, 1978, 2003). Prior research confirms that relative to Defenders,
Prospectors are associated with lower levels of profitability and operating cash flows, greater levels of
financial distress, and have larger ex ante financing needs (Bentley et al., 2012; Hambrick, 1983; Ittner et
al., 1997). Prospectors’ tendencies toward lower profitability suggest that internally generated funds may
not be sufficient to fund their extensive R&D investments. Thus, Prospectors would benefit more relative
to Defenders by lowering information asymmetry via voluntary disclosures to decrease their cost of
capital when seeking external financing.
In addition, Prospectors may have other incentives to decrease information asymmetry through
voluntary disclosure because of their compensation structure. The executive compensation literature
suggests that agency costs are higher for firms following a Prospector strategy than firms following a
Defender strategy because of the additional discretion afforded managers in Prospector firms to pursue
innovative and risky projects.6 In order to better align the interests of managers with owners, management
compensation within Prospector firms is more closely linked to stock prices (e.g., stock options) than
compensation at Defender firms (Rajagopalan, 1997; Rajagopalan and Finkelstein, 1992; Singh and
5 For instance, Lang and Lundholm (2000) find that firms which maintain a consistent level of disclosure reduce the
information asymmetry inherent in equity offerings, while Easley and O‘Hara (2004) find that cost of capital can be
reduced through both the quantity and quality of accounting disclosures. 6 Significant managerial discretion within Prospector firms exacerbates control and motivation problems and results
in greater cause-effect ambiguity, enabling managers to engage in self-serving projects with a reduced fear of
discovery (Rajagopalan, 1997; Rajagopalan and Finkelstein, 1992). Conversely, cause-effect ambiguity is lower in
Defenders wherein the problem of controlling self-serving managerial behavior is less of a concern in light of
incentive mechanisms that are linked to more objective criteria (e.g., Ittner et al., 1997; Rajagopalan, 1997; Singh
and Agarwal, 2002).

9
Agarwal, 2002). Prior research finds that stock-based compensation plans induce greater levels of
voluntary disclosure, thereby decreasing information asymmetry (Aboody and Kasznik, 2000; Nagar et
al., 2003; Noe, 1999). For example, Aboody and Kasznik (2000) find that CEOs strategically time
voluntary disclosures to maximize stock option awards. Further, Beyer et al. (2010) note that management
may use voluntary disclosures to explain poor performances for career concern purposes because
executive turnover is associated with poor performance (e.g., Warner et al., 1988; Weisbach, 1988).
Because Prospectors have both lower profitability tendencies and also experience greater management
turnover (Miles and Snow, 1978, 2003), Prospector managers may have additional incentives to disclose
more frequently relative to managers of Defender firms. Prior research also indicates that highly litigious
firms voluntarily disclose more information (Field et al., 2005; Skinner, 1994). Bentley et al. (2012) find
that Prospectors experience greater occurrences of financial statement irregularities (including
shareholder lawsuits and SEC enforcement actions) relative to other firms, thus giving additional
incentives for Prospectors to provide voluntarily disclosures. Altogether, we suggest that Prospector
firms are likely to have greater incentives to reduce information asymmetry through voluntary
disclosures.
Finally, because Prospectors’ strategic objectives are geared towards marketing their new and
continually changing mix of products, these firms are likely to maximize product visibility by issuing
more press releases. Prospectors’ success in implementing an innovative first-mover strategy depends on
aggressive marketing efforts where budgets are oriented towards ―protecting‖ these activities (Miles and
Snow, 1978, 2003). Marketing activities play such a dominant role in Prospector firms that leadership in
these firms is often held by experts with marketing and R&D expertise whose credentials have been
confirmed by prior studies (e.g., Thomas and Ramaswamy 1994, 1996). Conversely, Defenders minimize
marketing-related activities, focusing instead on operational efficiency where budgets ―protect‖ activities
related to their core production and distribution operations (Hambrick, 1983; Miles and Snow, 1978,
2003). Thus, while the strategic objectives (and budgets) of Prospector firms may encourage the use of

10
voluntary press releases to promote product visibility, the strategic objectives (and budgets) of Defender
firms may actually constrain these practices.7
2.3 Hypotheses
In summary, we expect that firms following a Prospector strategy may have greater inherent
information asymmetry relative to Defenders because of their firm-specific characteristics (i.e., R&D and
growth options). However, we also expect that Prospectors may be more likely to attract greater analyst
and press coverage because of these same firm characteristics, hence reducing information asymmetry.
Furthermore, because Prospectors likely have more strategic incentives to voluntarily disclose
information compared to Defenders, they may also generate more voluntary disclosures. After
considering all these interrelationships, it is unclear whether the information environment for firms
following a Prospector strategy will be associated with higher, lower, or similar levels of information
asymmetry relative to firms following a Defender strategy; thus, we state our first hypothesis in the null
form:
H1: Firms‘ business strategies are not associated with information asymmetry.
Our next set of hypotheses is concerned with the relation between a firm‘s business strategy and
mechanisms that have been shown to reduce information asymmetry (e.g., analyst and press coverage,
voluntary disclosures). Because we are uncertain ex ante whether Prospectors and Defenders have
different information environments, we state each hypothesis in the null form:
H2a: Firms‘ business strategies are not associated with analyst coverage.
H2b: Firms‘ business strategies are not associated with business press coverage.
H2c: Firms‘ business strategies are not associated with management earnings guidance frequency.
H2d: Firms‘ business strategies are not associated with press release frequency.
7 We note that according to the Proprietary Cost Hypothesis (e.g., Verrecchia, 1983), firms with high proprietary
costs will withhold full disclosure and may be more likely to redact proprietary information. However, we are
unable to make a prediction concerning whether Prospectors or Defenders have greater incentives to withhold
proprietary information from competitors. For instance, Prospectors which benefit from a first-mover advantage
may be more selective about disclosing new product R&D activities, while Defenders which benefit from a cost-
saving advantage may be more selective regarding technological investments that aid in their operational efficiency.

11
3. Research design
3.1 Business strategy and information asymmetry models
To investigate the relationship between firms‘ business strategies and their information
environments (H1), we use a series of Ordinary Least Squares (OLS) regressions to examine whether
business strategy is associated with three frequently used proxies for information asymmetry: bid-ask
spreads (e.g., Bushee et al., 2010; Coller and Yohn, 1997), analyst forecast dispersion (e.g., Feng and
Koch, 2010; Zhang, 2006), and analyst forecast accuracy (e.g., Gebhardt et al., 2001; Lang et al., 2003).8
Specifically, we estimate the following pooled OLS cross-sectional regression with standard errors
clustered by firm for each measure of information asymmetry:9
INFO_ASYM_PROXY = α + β1STRATEGY + β2CF_VOL + β3LN_ASSETS + β4LOSS (1)
+ β5ROA + β6BTM + β7BIG_N + β8HORIZON + βiINDUSTRY_FE + βiYEAR_FE + ε.
Our first information asymmetry proxy is bid-ask spreads (SPREAD). Following Chung and
Zhang (2009), we define bid-ask spreads as the average daily spread during the fiscal year, where daily
spreads are calculated by subtracting the bid price from the ask price, dividing this by the mean of the
two, and multiplying by 100. The second and third measures of information asymmetry relate to the
earnings forecasts of financial analysts. DISPERSION is measured as the standard deviation of the
individual forecasts comprising the most recent analyst forecast of annual earnings occurring before the
end of the fiscal year. ACCURACY is defined as the absolute value of the difference between reported
annual earnings and the mean consensus analyst forecast prior to the end of the fiscal year, scaled by
stock price as of two days prior to the forecast and multiplied by -100.10
8 We perform a factor analysis to examine the extent to which these information asymmetry proxies relate to
similar/unique theoretical constructs. In untabulated analysis, we find that all three capture unique dimensions of
information asymmetry. However, our results are robust to using the factor score as an alternative dependent
variable. 9 Our results are robust to removing year fixed effects and double-clustering by both firm and year (e.g., Gow et al.,
2010). 10
We use analyst forecast data that is not split adjusted (Payne and Thomas, 2003). Therefore, we use CRSP share
split factors to ensure that actual earnings and analyst forecasts are based on the same number of shares. Our results
are robust to calculating our own consensus forecast from the I/B/E/S detail file (Diether et al., 2002) as well as
using the median consensus forecast instead of the mean.

12
The independent variable of interest in equation (1) is STRATEGY following Bentley et al.
(2012), where firms with higher (lower) STRATEGY scores represent Prospector (Defender) firms,
consistent with Miles and Snow‘s (1978, 2003) business strategy typology.11
Following Bentley et al.
(2012), we measure a firm‘s business strategy using six ratios, which capture different dimensions of
Miles and Snow‘s (1978, 2003) business strategy typology: (1) new product development (ratio of
research and development to sales), (2) marketing efforts (ratio of selling, general and administrative
expenses to sales), (3) growth patterns (annual percentage change in sales), (4) production efficiency
(ratio of employees to sales), (5) capital structure (ratio of property, plant and equipment to assets), and
(6) organizational stability (standard deviation of total number of employees). Consistent with prior
research (e.g., Bentley et al., 2012; Ittner et al., 1997) and organizational theory expectations, these
measures are computed over a rolling five year average and are ranked relative to other firms in the
industry such that firms with higher (lower) STRATEGY scores represent Prospector (Defender) firms.
For instance, firms with higher STRATEGY scores have more R&D, marketing and growth activities
relative to industry competitors (i.e., characteristics of Prospectors).12
Validation for STRATEGY has
been confirmed using both archival (Bentley et al., 2012) and survey methods (Bentley, 2013).13
A positive (negative) and significant β1 in the SPREAD/DISPERSION (ACCURACY) regression
indicates that Prospectors are associated with greater information asymmetry relative to Defenders.
Conversely, a negative (positive) and significant β1 in the SPREAD/DISPERSION (ACCURACY)
regression suggests that Prospectors have less information asymmetry than Defenders. Equation (1) also
includes several variables to control for other factors (e.g., size, performance, growth opportunities) that
11
Within the executive compensation literature, Ittner et al. (1997) use a similar archival measure of STRATEGY to
classify Prospector and Defender firms. 12
Refer to Appendix 3 in Bentley et al. (2012) for details of how STRATEGY aligns with firms following Prospector
or Defender strategies. 13
Using factor analysis, Bentley et al. (2012) find that all six raw STRATEGY components load on one factor, which
suggests that the six components are capturing one underlying construct. Bentley et al. (2012) also find evidence that
STRATEGY is a separate construct from traditional complexity and risk measures by using canonical correlation and
redundancy index tests. Additional component analyses suggest that the collective STRATEGY measure captures a
construct that is ―greater than the sum of its parts‖ (see Bentley et al., 2012, pp. 31-32). Finally, another study by
Bentley (2013) finds evidence that firms following a Prospector or Defender strategy are properly classified by
comparing survey responses from senior executives in management and marketing positions to the archival
STRATEGY measure.

13
may affect the relation between business strategy and information asymmetry. All variables are formally
defined in the appendix.
3.2 Business strategy and mechanisms for reducing information asymmetry models
To examine our second hypothesis regarding the relationship between a firm‘s business strategy
and mechanisms that have been shown to reduce information asymmetry (e.g., analyst and press
coverage, voluntary disclosures), we replace the dependent variable in equation (1) with proxies capturing
each of these different mechanisms (IA_MECHANISM_PROXY):14
IA_MECHANISM_PROXY = α + β1STRATEGY + β2CF_VOL + β3LN_ASSETS + β4LOSS (2)
+ β5ROA + β6BTM + β7BIG_N + β8HORIZON + βiINDUSTRY_FE + βiYEAR_FE + ε.
Our first IA_MECHANISM _PROXY is analyst following (ANALYST_FOLLOW) which is defined
as the number of analysts following the firm. Analyst data is obtained from the I/B/E/S database. We
estimate equation (2) using a negative binomial regression because ANALYST_FOLLOW is measured as a
count variable and untabulated analysis provides evidence of overdispersion. A positive (negative) and
significant β1 in the ANALYST_FOLLOW regression indicates that Prospectors (Defenders) are associated
with greater analyst following (H2a), after controlling for other determinants of analyst following such as
firm size.
Our second IA_MECHANISM_PROXY is business press coverage (PRESS_COVERAGE). Our
sample of business press articles comes from the Dow Jones (DJ) news archives, which consists of all DJ
Newswire and Wall Street Journal articles. Access to these articles is provided by RavenPack, a news
analytics firm which has a unique partnership with DJ. We define PRESS_COVERAGE as the number of
days during the fiscal year that the firm had at least one article written about it in the DJ news archives.15
14
We perform a factor analysis to examine the extent to which these proxies relate to similar/unique theoretical
constructs. In untabulated analysis, we find that all load on one factor suggesting that the four measures capture a
similar theoretical construct. However, we note that management forecast frequency exhibits a low factor loading
compared to the other three measures. Our results are robust to using the factor score as an alternative dependent
variable. 15
Measuring press coverage based on the number of days rather than the number of articles is important because
newswires often issue multiple updates of the same event within a short period of time (Soltes, 2010). This approach
is consistent with prior research (Barber and Odean, 2008; Chan, 2003). RavenPack also provides a relevance score
14
A positive (negative) and significant β1 in the PRESS_COVERAGE regression indicates that Prospectors
(Defenders) are associated with greater coverage in the business press (H2b).
Our third IA_MECHANISM_PROXY is management earnings guidance frequency
(MGMT_FREQ) which is measured as the number of unique annual forecasts issued by the firm during
the year.16
Management earnings guidance data is obtained from First Call‘s Company Issued Guidance
database. We include all management forecasts of annual earnings per share denoted in U.S. dollars
issued by our sample firms.17
A positive (negative) and significant β1 in the MGMT_FREQ regression
indicates that Prospectors (Defenders) are associated with more frequent management earnings guidance
(H2c).
Finally, we examine the relationship between business strategy and the number of press releases
issued by the firm during the year (PRESS_RELEASES) as an alternative measure of voluntary disclosure
(Badertscher et al., 2012; Shroff et al., 2012). Similar to the PRESS_COVERAGE variable, our sample of
press releases comes from the RavenPack database. A positive (negative) and significant β1 in the
PRESS_RELEASES regression indicates that Prospectors (Defenders) are associated with more press
releases (H2d).
4. Data
The sample selection is presented in Table 1. STRATEGY is constructed using all firms from the
Compustat Annual file for fiscal years between 1992 and 2009 with nonnegative sales and asset
observations, and non-missing historical SIC codes. We then delete utilities and financial industries (SIC
4900-4999 and 6000-6999) due to the regulated nature of these industries. All data used to construct
STRATEGY requires a five-year rolling average (e.g., Bentley et al., 2012; Ittner et al., 1997). After
(0 to 100) which indicates the relevance of the article to the company. Based on discussions with RavenPack
representatives, we require a relevance score of 90 or above when calculating PRESS_COVERAGE. We also remove
press releases, articles designated by RavenPack as ―Tabular Material‖, and any articles relating to equity market
trade imbalances. 16
We note this IA_MECHANISM_PROXY as well as the remaining proxies we test are also count variables where
untabulated analysis provides evidence of overdispersion, and as such, we continue to use negative binomial
regressions in analyzing these dependent variables. 17
We focus on annual forecasts rather than quarterly forecasts because STRATEGY is measured annually for each
firm. However, our results are robust to using all quarterly forecasts issued by the firm during the year.

15
imposing the five-year rolling average constraint, we are left with a sample of 44,754 firm-year
observations during our sample period of 1997 to 2009 with sufficient data to calculate STRATEGY.
[Insert Table 1 about here]
Because several of our tests rely on analyst forecast data, we require actual earnings and a
consensus analyst forecast issued within 90 days prior the end of the fiscal year from the I/B/E/S
database. We also require an analyst following of at least three in order to measure analyst forecast
dispersion. Next, we eliminate observations with missing stock price data from CRSP or a stock price
lower than $2.00 in order to mitigate the small denominator problem. Finally, because we use
management earnings guidance data in subsequent tests, we require analyst coverage on the First Call
Analyst Forecast Database to ensure that our sample firms are covered by First Call as well as I/B/E/S
(Ajinkya et al., 2005). The final sample consists of 15,532 firm-year observations from 1997 to 2009.18
5. Results
5.1 Descriptive statistics
Table 2 presents our descriptive statistics for the overall sample of observations (n=15,532) and
for firms following a Prospector (n=1,147) or Defender (n= 604) business strategy. Firm-level
characteristics for Prospectors and Defenders are consistent with prior research (e.g., Bentley et al., 2012;
Hambrick, 1983; Ittner et al., 1997; Miles and Snow, 1978, 2003) where Prospectors are smaller in size
(LN_ASSETS), less profitable (LOSS; ROA), and more growth-oriented (BTM) compared to Defenders. In
untabulated tests we confirm that Prospectors are associated with significantly greater (p<0.01) R&D
expenditures relative to Defenders, consistent with organizational theory expectations. Therefore, as
expected, Prospectors have firm-level attributes which prior research has shown are related to greater
information asymmetry which include not only greater growth and R&D–related activities but also
smaller firm size.19
18
In our models analyzing press coverage and releases, our sample is further reduced to 11,374 firm-years because
our sample of articles (as provided by RavenPack) begins in 2000. 19
Prior research associates smaller firms with greater information asymmetry because these firms tend to be less
liquid, attract fewer institutional investors, and have a larger percentage of insiders (e.g., Diamond and Verrecchia,

16
Univariate mean and median tests (t-tests and Wilcoxon tests, respectively) indicate that
Prospectors and Defenders have significantly different information environments. Specifically, we find
that Prospectors have significantly lower bid-ask spreads (SPREAD) and analyst forecast dispersion
(DISPERSION) compared to Defenders at p<0.01. Prospectors also have significantly greater analyst
forecast accuracy (ACCURACY) compared to Defenders (only median value is significant at p<0.01).
Therefore the univariate tests suggest that Prospectors are associated with less information asymmetry
compared to Defenders despite the fact that Prospectors have firm-level characteristics typically
associated with greater information asymmetry (e.g., R&D and growth options).
The univariate results concerning mechanisms for decreasing information asymmetry— e.g.,
analyst and press coverage, voluntary disclosures—appear to differ significantly across firm strategy.
Specifically, we find that Prospectors are followed by significantly more analysts and receive
significantly greater press coverage compared to Defenders at p<0.01. For instance, Prospectors are
followed by 9 analysts, on average, compared to Defenders which are being followed by 7 analysts.
Further, Prospectors issue significantly more frequent annual earnings management guidance and issue a
greater number of press releases than Defenders at p<0.01. On average, Prospectors issue annual earnings
management guidance 1.3 times a year and issue 74 press releases annually, while Defenders issue annual
earnings management guidance 1.1 times a year and issue 54 press releases annually. Therefore, the
univariate tests suggest that Prospectors have greater incentives to reduce information asymmetry when
compared to Defenders.
[Insert Table 2 about here]
1991; Vermaelen, 1981). Ex ante, we made no prediction regarding size differences between Prospectors and
Defenders because neither organizational theory nor prior empirical research provides consistent evidence regarding
this attribute. For example, while Smith et al. (1989) predict that Defenders have a tendency to be larger in size
relative to Prospectors in order to achieve efficiency through economies of scale, they find no significant size
distribution differences. Similarly, while Bentley et al. (2012) find some evidence that Defenders tend to be larger
than Prospectors in one of their subsamples, they find insignificant size differences in another subsample.

17
5.2 Univariate correlations
Table 3 presents Pearson and Spearman correlations among STRATEGY, information asymmetry
proxies, mechanisms for reducing information asymmetry, and control variables. STRATEGY is
negatively correlated with SPREAD and DISPERSION and positively correlated with ACCURACY. These
results suggest that firms following a Prospector strategy (i.e., firms with higher STRATEGY scores) are
associated with less information asymmetry. STRATEGY is positively correlated with
ANALYST_FOLLOW, MGMT_FREQ, and PRESS_RELEASES, all significant at the 5% level. These
results suggest that firms following a Prospector strategy are associated with greater analyst and press
coverage, and more frequent voluntary disclosures.
[Insert Table 3 about here]
5.3 Multivariate regressions: business strategy and information asymmetry
To test our first hypothesis, we regress proxies for information asymmetry (SPREAD,
DISPERSION and ACCURACY) on STRATEGY (equation 1). Table 4 presents the multivariate results.
We find that the coefficient on STRATEGY is negative and significant for both SPREAD and
DISPERSION, and positive and significant for ACCURACY, all at the .01 level.20
These results indicate
that firms following a Prospector strategy (i.e., firms with higher STRATEGY scores) are associated with
lower bid-ask spreads and analyst forecast dispersion, and higher analyst forecast accuracy relative to
firms following a Defender strategy (i.e., firms with lower STRATEGY scores).21
Thus, Prospectors are
associated with less information asymmetry relative to Defenders (rejecting H1.)
Overall, we conclude that business strategy does impact firms‘ information environments, after
controlling for other factors identified by prior research as being associated with information asymmetry.
We also note that the signs of the coefficients on the control variables are generally consistent with
expectations (i.e., high cash flow volatility, low profitability, and small firms are associated with higher
20
We confirm that our results are not driven by outliers using robust and median regressions. 21
In robustness tests we replace the discrete STRATEGY measure with Prospector and Defender indicator variables
following Bentley et al. (2012) and inferences remain unchanged. Untabulated F-tests confirm that Prospectors have
significantly lower levels of information asymmetry than Defenders (all p-values < 0.05).

18
levels of information asymmetry), and the models appear to fit well (adjusted R2s ranging from 18.2% to
59.1%).
[Insert Table 4 about here]
5.4 Multivariate regressions: business strategy and mechanisms for reducing information asymmetry
We next consider whether the results discussed above are the result of Prospectors‘ efforts at
reducing information asymmetry. In this section, we examine several mechanisms that may result in
Prospector firms being associated with reduced information asymmetry relative to Defender firms:
analyst and business press coverage, and the issuance of voluntary disclosures.
5.4.1 Analyst coverage
The first mechanism for reducing information asymmetry is analyst following. Analysts follow
firms where they believe they can provide incremental information and analysis to their clients and thus
gain a competitive advantage (Lehavy et al., 2011). Accordingly, Prospectors are likely to attract more
analysts than Defenders because prior research (e.g., Barth et al., 2001; Lehavy et al., 2011) finds that
more complex, growth-oriented, R&D intensive firms have greater analyst coverage where analysts
believe there is mispricing. The first column of Table 5 presents the results of regressing analyst
following on STRATEGY and our control variables. The coefficient on STRATEGY is positive and
significant (p<0.01) indicating that Prospectors have greater analyst following relative to Defenders
(rejecting H2a).
[Insert Table 5 about here]
5.4.2 Business press coverage
We hypothesize that Prospectors are more likely to receive coverage in the business press relative
to Defenders for many of the same reasons that analysts choose to follow Prospectors. We also expect
that Prospector firms are more likely to receive press coverage than Defender firms because of
Prospectors’ greater marketing efforts and continual organizational change—e.g., leadership and
structure (Hambrick, 1983; Miles and Snow, 1978, 2003; Simons, 1987). The results of estimating
equation (2) using PRESS_COVERAGE as the dependent variable are presented in the second column of

19
Table 5. The coefficient on STRATEGY is positive and significant indicating greater press coverage for
Prospector firms relative to Defender firms (p<0.05). Therefore, firms following a Prospector rather than
a Defender strategy are more likely to receive greater coverage in the business press (rejecting H2b), thus
contributing to their reduced information asymmetry (e.g., Bushee et al., 2010; Soltes, 2010).
5.4.3 Management guidance
Because prior research finds that firms are able to reduce information asymmetry with the
issuance of management forecasts (e.g., Coller and Yohn, 1997) where frequency in forecasting enables
firms to gain access to capital markets more often (Frankel et al., 1995), we examine the association
between STRATEGY and management guidance frequency. As shown in Table 5, column 3, we find that
the coefficient on STRATEGY is positive and significant (p<0.01) with MGMT_FREQ suggesting that
Prospector firms have more frequent management guidance when compared to Defender firms (rejecting
H2c).22
5.4.4 Press releases
Finally, we examine the relationship between business strategy and the number of press releases
issued by the firm during the year (PRESS_RELEASES) as an alternative measure of voluntary disclosure
(Badertscher et al., 2012; Shroff et al., 2012). We hypothesize that while the strategic objectives of a
Prospector firm may encourage the use of voluntary disclosures through press releases to promote
product visibility, the strategic objectives of a Defender firm may actually constrain the use of these
practices. The results of estimating equation (2) using PRESS_RELEASES as the dependent variable are
presented in the last column of Table 5. Table 5, column 4 indicates that the coefficient on STRATEGY is
positive and significant indicating more press releases for Prospectors relative to Defenders (p<0.01).
Therefore, firms following a Prospector rather than a Defender strategy are likely to issue more press
releases (rejecting H2d), thus contributing to their reduced information asymmetry (e.g., Bushee et al.
2010).
22
Untabulated tests reveal that Prospectors relative to Defenders issue slightly better quality management guidance.
Specifically, we find that Prospectors are associated with more specific guidance (i.e., point vs. range) compared to
Defenders (p<0.05).

20
Overall, we conclude that the mechanisms that reduce information asymmetry favor firms
following a Prospector relative to those following a Defender business strategy. Our results are consistent
with theoretical expectations that Prospectors likely have greater strategic incentives to reduce
information asymmetry when compared to Defenders. Specifically, we find that Prospectors are
associated with greater analyst following and business press coverage, as well as more voluntary
disclosures (e.g., more frequent management guidance and a greater number of press releases) compared
to Defenders. We also note that the signs of the coefficients on the control variables are generally
consistent with expectations (i.e., larger and more growth-oriented firms are associated with more
frequent voluntary disclosures and greater analyst following).
6. Additional analyses
6.1 Additional controls
6.1.1. Firm innovation
Prior research identifies that innovation-related proxies such as R&D intensity and growth are
associated with information environment variables (e.g., bid-ask spreads, analyst forecast properties,
media coverage). While both R&D and growth serve as inputs into the STRATEGY measure, we explicitly
test whether STRATEGY provides incremental contribution above these innovation-related proxies. In
untabulated tests, we add R&D intensity as an additional control to our base models (which already
control for firm size, profitability and growth) and find that our results are robust to this additional control
specification (except in the PRESS_COVERAGE model). Untabulated results suggest that STRATEGY
significantly contributes to the explanatory power in all models (p < 0.001). Further, semipartial
correlations reveal that STRAETGY provides relatively greater contribution relative to R&D intensity and
growth proxies in both the DISPERSION and MGMT_FREQ models.
6.1.2 External financing needs
Organizational theory suggests that Prospectors rely more heavily on external sources for
financing than do Defenders, and has been confirmed by prior empirical research (e.g., Bentley et al.
2012). In turn, we expect that Prospectors‘ need for external financing may partially influence managers‘

21
disclosure decisions. To ensure that our results are not being influenced by a potential correlated omitted
variable (i.e., financing), we control for ex ante financing needs and free cash flow following prior
research (e.g., Dechow, Sloan and Sweeney 1996; Erickson et al. 2006). Untabulated tests indicate that
our results are robust to these additional controls.
6.1.3 Institutional ownership
Prior research finds that institutions invest more heavily in R&D and growth firms (e.g., Wahal
and McConnell 2000) and that institutional ownership is associated with analyst following and other
disclosure mechanisms (e.g., O‘Brien and Bhushan 1990; Bushee and Noe 2000). Thus, as our results
could potentially reflect the investment preferences and information gathering activities of institutional
investors, rather than explicit link between strategy and manager‘s disclosure decisions, we control for
institutional ownership in our models. Untabulated tests revel that our results are robust to this additional
control specification.
6.1.4 Economic news
We consider that if Prospectors actively engage in more acquisitions and new ventures than
Defenders, then these activities also generate news. Hence, more news events likely leads to more analyst
and press coverage, press releases, and forecasts. To ensure that our results are not the result of the
amount of economic news about the firm during the period, we control for market-adjusted returns,
unexpected earnings and share turnover in untabulated tests. Our results across all models are robust to
these control specifications with the exception of our press coverage model where the STRATEGY
coefficient becomes insignificant.
6.2 Regulation Fair Disclosure (Reg. FD)
In an effort to ‗level the informational playing field‘, Regulation Fair Disclosure (Reg. FD) was
passed by Congress in 2000 to prohibit firms from disclosing material information to selective users—
e.g., certain analysts and institutional shareholders (see Beyer et al., 2010 for an overview—e.g., Bushee
et al., 2004; Heflin et al., 2003; Kothari et al., 2009; Wang, 2007). Because our sample period covers
periods both before and after the enactment of Reg. FD, we partition our sample into these two periods in

22
order to examine the effects of this mandatory disclosure requirement on our results. In untabulated
analysis, we continue to find that Prospectors are associated with significantly less information
asymmetry (i.e., lower bid-ask spreads, lower analyst dispersion, and greater analyst accuracy) relative to
Defenders both before and after the enactment of Reg. FD. Similarly, we find that Prospectors relative to
Defenders are associated with greater analyst following in both the pre- and post-Reg. FD periods.
However, we do find that the significant relationship between management annual earnings guidance
frequency and business strategy only exists in the post-Reg. FD period, thus suggesting that this
mandatory requirement impacted firms‘ voluntary disclosure practices differentially depending on their
business strategy. However, we are unable to rule out a potential alternative explanation: the lack of
significance between management guidance frequency and business strategy in the pre-Reg. FD period
may be due to power limitations (i.e., our analysis in the pre-Reg. FD period only covers years 1997-
1999).23
6.3 Strategy consistency
Organizational theory suggests that firms‘ business strategies are chosen very early in a firm‘s
history, initiated by management‘s commitment of resources towards pursuing certain product-market
domain(s), and remain relatively stable over time (Hambrick, 1983; Miles et al., 1978; Snow and
Hambrick, 1980).24
Companies are reluctant to change their chosen strategies due to the significant
resources ―required to develop the distinctive competences, technologies, structures, and management
processes needed to pursue a particular strategy….[therefore] when faced with external change or
pressure, [companies] tend to adjust rather than change their strategies‖ (Snow and Hambrick, 1980, p.
529). Using a strategic-choice perspective, Miles et al. (1978, 548), further elaborate upon this adaptive
cycle concept by explaining that organizational structure and process are determined by top management
choices and are only partially predetermined by environmental conditions. These management choices
23
We note that we are unable to test the effects of business press coverage and press releases on a firm‘s business
strategy in the pre-Reg. FD period because our sample for these tests begins in 2000. 24
The Miles and Snow typology is rooted in the strategic-choice view whereby ―[top managers] largely enact or
create the organization‘s relevant environment. That is, the organization responds largely to what its management
perceives‖ (Miles and Snow, 1978, p.20).

23
help solve three central functions of organizational adaption (entrepreneurial, engineering and
administrative), which within an organization must be addressed simultaneously for internal consistency
to be maintained.25
Thus, in order for a firm to have a successful business strategy, internal consistency
must be maintained across these three functions and aligned with their chosen strategy. Hence, ―over
time…organizations following these strategies develop certain internal consistencies and tend to
perpetuate the strategies‖ (Hambrick, 1983, p. 7). Consequently, inconsistency among a firm‘s ―strategy,
technology, structure, and process‖ results in ―strategic failure‖ and an unstable form of organization
(Miles et al. 1978, 550), referred to as ―Reactors‖ under the Miles and Snow typology.
Empirically, the Bentley et al. (2012) STRATEGY measure is relatively stable over time,
consistent with organizational theory expectations. For example, firms classified as Prospectors exhibit
consistently high STRATEGY scores year-to-year over the entire sample period while firms classified as
Defenders exhibit consistently low STRATEGY scores. While firm STRATEGY scores can range from 6 to
30, we find that less than 3 percent of firms change their STRATEGY score by more than 3 values year-to-
year and find no evidence of firms switching from a Defender to Prospector (or vice-versa) over the
sample period.
There are several implications for the consistency of a firm‘s strategy over time on our analysis.
First, because firms‘ business strategy is often set at the inception of the firm with little variability, this
implies that business strategy serves as one of the underlying, firm-specific characteristic that determines
their information environments.26
Second, because firms adjust rather than change their firms‘ strategies
over time (which we confirm empirically), and if business strategy serves as an underlying factor in
25
Miles and Snow (1978, 2003) contend that managers of Prospector and Defender firms would have different skills
and competencies. Hence, ―by contending that organizations pursing different strategies would be lead by managers
with different characteristics, Miles and Snow (1978) acknowledged the necessity of matching managers to
strategy‖-- i.e., matching the administrative function to strategy (Thomas and Ramaswamy, 1996, p.252).
Subsequent research by Thomas and Ramaswamy (1994, 1996) find empirical evidence to support the claim that
managerial traits differ amongst Prospectors and Defenders. Further, they find that firms where top management
characteristics aligned with the strategic objectives outperformed those firms where misalignment occurred. 26
In untabulated analyses, we test whether there is significant cross-sectional variation in firms‘ information
environments within strategy types. In general, we find little variability within Prospector and Defender firms
concerning their information environments. Therefore, because cross-sectional variation within strategy types is
generally small, this further supports the notion that strategy is an underlying factor of information environment
differences.

24
determining the firm‘s information environment, then this implies that the firm‘s information
environment, all else equal, can be expected to be generally constant over time. Thus, our study suggests
inherent difficulties firms may have in being able to change their information environments. Finally,
because a firm‘s business strategy is generally constant over time, identifying a firm‘s strategy may serve
as a useful context for understanding the numerous interdependencies related to a firm‘s information
environment that Beyer et al. (2010) discuss in their review. For instance, Beyer et al. (2010, p. 298) state
that ―as a result of the numerous interdependencies, one would not expect simple causal relationships to
hold…[r]ather, ―equilibrium‖ concepts for the market for information defy a simplified view of cause and
effect…[however,] our understanding of the interdependencies and interactions of the elements of the
information system is still limited‖. Thus, our study aims to give a context in which to view these
―equilibrium‖ concepts by considering the firm‘s fundamental identity: its business strategy.
7. Conclusion
Using organizational theory, we examine whether information environments vary between firms
following different business strategies. We also examine whether mechanisms that reduce information
asymmetry differ across firm strategies. Overall, our results suggest that business strategy does impact
firms‘ information environments. We find that firms following an innovation-oriented Prospector
strategy have lower bid-ask spreads and analyst forecast dispersion and greater analyst forecast accuracy
relative to firms following an efficiency-oriented Defender strategy, suggesting that Prospectors have
lower information asymmetry. Next, we find evidence that Prospector firms attract greater levels of
analyst and press coverage, engage in more frequent management earnings guidance and issue more press
releases compared to Defender firms. Altogether these findings suggest that Prospectors are more
successful in reducing information asymmetry through various strategic mechanisms (e.g., analyst and
business press coverage, voluntary disclosures).
In additional analyses we provide evidence that business strategy provides incremental
explanatory power over measures suggested by prior literatures proxy for firm-related innovation (e.g.,
R&D intensity, growth, financing needs). Generally, we also find that business strategy remains

25
significant both before and after the enactment of Regulation Fair Disclosure, providing additional
evidence that business strategy impacts a firm‘s information environment irrespective of regulatory
intervention. Finally, we find that a firm‘s business strategy is relatively stable over time, consistent with
organizational expectations.
Our research is subject to several caveats. While we rely on Miles and Snow‘s (1978, 2003)
strategy typology and prior empirical research to create our business strategy measure, our measure is still
assessed with noise. Hence, a limitation of our study is the extent that measurement error potentially leads
to misclassifying some firms‘ business strategies. Another limitation of our study is the inability to parse
out the firm‘s inherent information asymmetry from their mechanisms for reducing information
asymmetry. Consistent with Beyer et al. (2010), we take the ―equilibrium‖ position for the market of
information which due to the ―numerous interdependencies …defy a simplified view of cause and effect‖
(p.298). Because a firm‘s business strategy is generally constant over time, identifying a firm‘s strategy
may serve as a useful context for understanding the numerous interdependencies related to a firm‘s
information environment.
Our study makes several contributions. First, by examining the interrelationships among a firm‘s
information environment, its voluntary disclosure practices, and analyst forecasts, we not only address
Beyer et al.‘s (2010) call for more research in this area but extend the analysis of these interrelationships
to a fundamental element of a firm‘s identity: its business strategy. Second, by examining voluntary
disclosure practices in the context of a firm‘s strategy, our study provides some insights into a theoretical
rationale for why firms select different levels of disclosure—i.e., firms‘ strategic objectives may either
constrain or encourage these practices. Finally, by linking organizational theory to accounting, we provide
a theoretical framework for understanding why business strategy may be an underlying factor in firms‘
information environments.

26
References
Aboody, D., Kasznik, R., 2000. CEO stock option awards and the timing of corporate voluntary
disclosures. Journal of Accounting and Economics 29, 73-100.
Aboody, D., Lev, B., 2000. Information asymmetry, R&D, and insider gains. The Journal of Finance 55,
2747-2766.
Ajinkya, B., Bhojraj, S., Sengupta, P., 2005. The association between outside directors, institutional
investors and the properties of management earnings forecasts. Journal of Accounting Research
43, 343-376.
Akerlof, G.A., 1970. The market for ‗lemons‘: quality uncertainty and the market mechanism. The
Quarterly Journal of Economics 84, 488-500.
Badertscher, B., Shroff, N., White, H., 2012. Externalities of public firms‘ disclosures: evidence from
private firms‘ investment decision. Working paper, University of Notre Dame.
Barber, B., Odean, T., 2008. All that glitters: the effect of attention and news on the buying behavior of
individual and institutional investors. Review of Financial Studies 21, 785-818.
Barry, C.B., Brown, S.J., 1984. Differential information and the small firm effect. Journal of Financial
Economics 13, 283-294.
Barry, C.B., Brown, S.J., 1985. Differential information and security market equilibrium. The Journal of
Financial and Quantitative Analysis 20, 407-422.
Barth, M.E., Kasznik, R., McNichols, M.F., 2001. Analyst coverage and intangible assets. Journal of
Accounting Research 39, 1-34.
Bentley, K.A., 2013. Antecedents to financial statement misreporting: the influence of organizational
business strategy, ethical culture and climate. Working paper, The University of New South
Wales.
Bentley, K.A., Omer, T.C., Sharp, N.Y. 2012. Business strategy, financial reporting irregularities, and
audit effort. Contemporary Accounting Research. doi: 10.1111/j.1911-3846.2012.01174.x.

27
Beyer, A., Cohen, D.A., Lys, T.Z., Walther, B.R., 2010. The financial reporting environment: review of
the recent literature. Journal of Accounting and Economics 50, 296-343.
Bhagat, S., Marr, M.W., Thompson, G.R., 1985. The Rule 415 experiment: equity markets. The Journal
of Finance 40, 1385-1401.
Blackwell, D.W., Marr, M.W., Spivey, M.F., 1990. Shelf registration and the reduced due diligence
argument: implications of the underwriter certification and the implicit insurance hypotheses. The
Journal of Financial and Quantitative Analysis 25, 245-259.
Brennan, M.J., Subramanyam, A., 1995. Investment analysis and price formation in securities markets.
Journal of Financial Economics 38, 361-381.
Brown, S., 1979. The effect of estimation risk on capital market equilibrium. The Journal of Financial and
Quantitative Analysis 14, 215-220.
Bushee, B.J., Core, J., Guay W., Hamm, S., 2010. The role of the business press as an information
intermediary. Journal of Accounting Research 48, 1-19.
Bushee, B.J., Matsumoto, D.A., Miller, G.S. 2004. Managerial and investor responses to disclosure
regulation: the case of Reg FD and conference calls. The Accounting Review 79, 617-643.
Bushee, B.J., Noe, C.F. 2000. Corporate disclosure practices, institutional investors, and stock return
volatility. Journal of Accounting Research 38, 171-202.
Chan, W, 2003. Stock price reaction to news and no-news: drift and reversal after headlines. Journal of
Financial Economics 70, 223-260.
Chung, K., Zhang, H., 2009. A simple approximation of intraday spreads using daily data. Working
paper, State University of New York.
Coller, M., Yohn, T.L., 1997. Management forecasts and information asymmetry: an examination of bid-
ask spreads. Journal of Accounting Research 35, 181-191.
Diamond, D.W., Verrecchia, R.E., 1991. Disclosure, liquidity, and the cost of capital. The Journal of
Finance 46, 1325-1359.

28
Dierkens, N., 1991. Information asymmetry and equity issues. Journal of Financial and Quantitative
Analysis 26, 181-199.
Diether, K., Malloy, C., Scherbina, A., 2002. Difference of opinion and the cross section of stock returns.
The Journal of Finance 57, 2113-2141.
Easley, D., O‘Hara, M., 2004. Information and cost of capital. The Journal of Finance 59, 1553-1583.
Feng, M., Koch, A., 2010. Once bitten, twice shy: the relation between outcomes of earnings guidance
and management guidance strategy. The Accounting Review 85, 1951-1984.
Field, L., Lowry, M., Shu, S., 2005. Does disclosure deter or trigger litigation? Journal of Accounting and
Economics 39, 487-507.
Frankel, R., McNichols, M., Wilson, G.P., 1995. Discretionary disclosure and external financing. The
Accounting Review 70, 135-150.
Gebhardt, W., Lee, C., Swaminathan, B., 2001. Toward an implied cost of capital. Journal of Accounting
Research 39, 135-176.
Gow, I.D., Ormazabal, G., Taylor, D.J., 2010. Correcting for cross-sectional and time-series dependence
in accounting research. The Accounting Review 85, 483-512.
Hambrick, D.C., 1983. Some tests of the effectiveness and functional attributes of Miles and Snow‘s
strategic types. The Academy of Management Journal 26, 5-26.
Healy, P.M., Palepu, K.G., 2001. Information asymmetry, corporate disclosure, and the capital markets: a
review of the empirical disclosure literature. Journal of Accounting and Economics 31, 405-440.
Heflin, F., Subramanyam, K., Zhang, Y., 2003. Regulation FD and the financial information environment:
early evidence. The Accounting Review 78, 1-37.
Ittner, C.D., Larcker, D.F., Rajan, M.V., 1997. The choice of performance measures in annual bonus
contracts. The Accounting Review 72, 231-255.
Kim, O., Verrecchia, R.E., 1994. Market liquidity and volume around earnings announcements. Journal of
Accounting and Economics 17, 41-67.

29
Kothari, S.P., Shu, S., Wysocki, P., 2009. Do managers withhold bad news? Journal of Accounting
Research 45, 385-420.
Krishnaswami, S., Spindt, P.A., Subramanyam, V., 1999. Information asymmetry, monitoring, and the
placement structure of corporate debt. Journal of Financial Economics 51, 407-434.
Lang, M.H., Lins, K. V., Miller, D. P., 2003. ADRs, analysts, and accuracy: does cross listing in the
United States improve a firm‘s information environment and increase market value? Journal of
Accounting Research 41, 317-345.
Lang, M.H., Lundholm, R.J., 2000. Voluntary disclosure and equity offerings: reducing information
asymmetry or hyping the stock? Contemporary Accounting Research 17, 623-662.
Lehavy, R., Li, F., Merkley K., 2011. The effect of annual report readability on analyst following and the
properties of their earnings forecasts. The Accounting Review 86, 1087-1115.
Lev, B., Zarowin, P., 1999. The boundaries of financial reporting and how to extend them. Journal of
Accounting Research 37, 353-385.
McLaughlin, R., Safieddine, A., Vaudevan, G.K., 1998. The information content of corporate offerings of
seasoned securities: an empirical analysis. Financial Management 27, 31-45.
Miles, R.E., Snow, C.C., 1978. Organizational strategy, structure and process. McGraw-Hill, New York.
Miles, R.E., Snow, C.C., Meyer, A.D., Coleman, Jr., H.J. 1978. Organizational strategy, structure, and
process. The Academy of Management Review 3, 546-562.
Miles, R.E., Snow, C.C., 1994. Fit, failure, and the hall of fame: how companies succeed or fail. The Free
Press, New York.
Miles, R.E., Snow, C.C., 2003. Organizational strategy, structure, and process. Stanford University Press,
Stanford.
Nagar, V., Nanda, D., Wysocki, P., 2003. Discretionary disclosures and stock-based incentives. Journal of
Accounting and Economics 34, 283-309.
Noe, C.F., 1999. Voluntary disclosures and insider transactions. Journal of Accounting and Economics
27, 305-326.

30
O‘Brien, P.C., Bhushan, R. 1990. Analyst following and institutional ownership. Journal of Accounting
Research 28, 55-76.
Payne, J., Thomas, W., 2003. The implications of using stock-split adjusted I/B/E/S data in empirical
research. The Accounting Review 78, 1049-1067.
Petersen, M.A., 2009. Estimating standard errors in finance panel data sets: comparing approaches. The
Review of Financial Studies 22, 435-480.
Porter, M.E., 1980. Competitive strategy: techniques for analyzing industries and competitors. Free Press,
New York.
Rajagopalan, N., 1997. Strategic orientation, incentive plan adoptions, and firm performance: evidence
from electric utility firms. Strategic Management Journal 18, 761-785.
Rajagopalan, N., Finkelstein, S., 1992. Effects of strategic orientation and environmental change on
senior management reward systems. Strategic Management Journal 13, 127-142.
Shroff, N., Sun, A., White, H., Zhang, W., 2012. Economic consequences of voluntary disclosure before
seasoned equity offerings: the impact of the 2005 Securities Offering Reform. Working paper,
Massachusetts Institute of Technology.
Simons, R., 1987, Accounting control systems and business strategy: an empirical analysis. Accounting
Organizations and Society 12, 357-374.
Singh, P., Agarwal, N.C., 2002. The effects of firm strategy o the level and structure of executive
compensation. Canadian Journal of Administrative Sciences 19, 42-56.
Skinner, D.J., 1994. Why firms voluntarily disclose bad news. Journal of Accounting Research 32, 38-60.
Smith Jr., C.W., Watts, R.L., 1992. The investment opportunity set and corporate financing, dividend, and
compensation policies. Journal of Financial Economics 32, 263-292.
Smith, K.G., Guthrie, J.P., Chen, M.-J., 1989. Strategy, size and performance. Organization Studies 10,
63-81.
Snow, C.C., Hambrick, D.C., 1980. Measuring organizational strategies: some theoretical and
methodological problems. The Academy of Management Review 5, 527-538.

31
Soltes, E, 2010. Disseminating firm disclosures. Working paper, Harvard University.
Thomas, A.S., Ramaswamy, K. 1994. Matching managers to strategy: an investigation of performance
implications and boundary conditions. Australian Journal of Management 19, 73-93.
Thomas, A.S., Ramaswamy, K. 1996. Matching managers to strategy: further tests of the Miles and Snow
typology. British Journal of Management 7, 247-261.
Thomas, S., 2002. Firm diversification and asymmetric information: evidence form analysts‘ forecasts
and earnings announcements. Journal of Financial Economics 64, 373-396.
U.S. Securities and Exchange Commission, 2012. Form 8-K. <http://www.sec.gov/answers/form8k.htm>.
Vermaelen, T., 1981. Common stock repurchases and market signaling: an empirical study. Journal of
Financial Economics 9, 139-183.
Verrecchia, R.E., 1983. Discretionary disclosure. Journal of Accounting and Economics 5, 179-194.
Wahal, S., McConnell, J.J. 2000. Do institutional investors exacerbate managerial myopia? Journal of
Corporate Finance 6, 307-329.
Wang, I., 2007. Private earnings guidance and its implications for disclosure regulation. The Accounting
Review 82, 1299-1332.
Warner, J.B., Watts, R.L., Wruck, K.H. 1988. Stock prices and top management changes. Journal of
Financial Economics 20, 461-492.
Weisbach, M.S., 1988. Outside directors and CEO turnover. Journal of Financial Economics 20, 431-460.
White, H., 1980. A heteroskedasticity-consistent covariance matrix estimator and a direct test for
heteroskedasticity. Econometrica 48, 817-838.
Zhang, F., 2006. Information uncertainty and analyst forecast behavior. Contemporary Accounting
Research 23, 565-590.
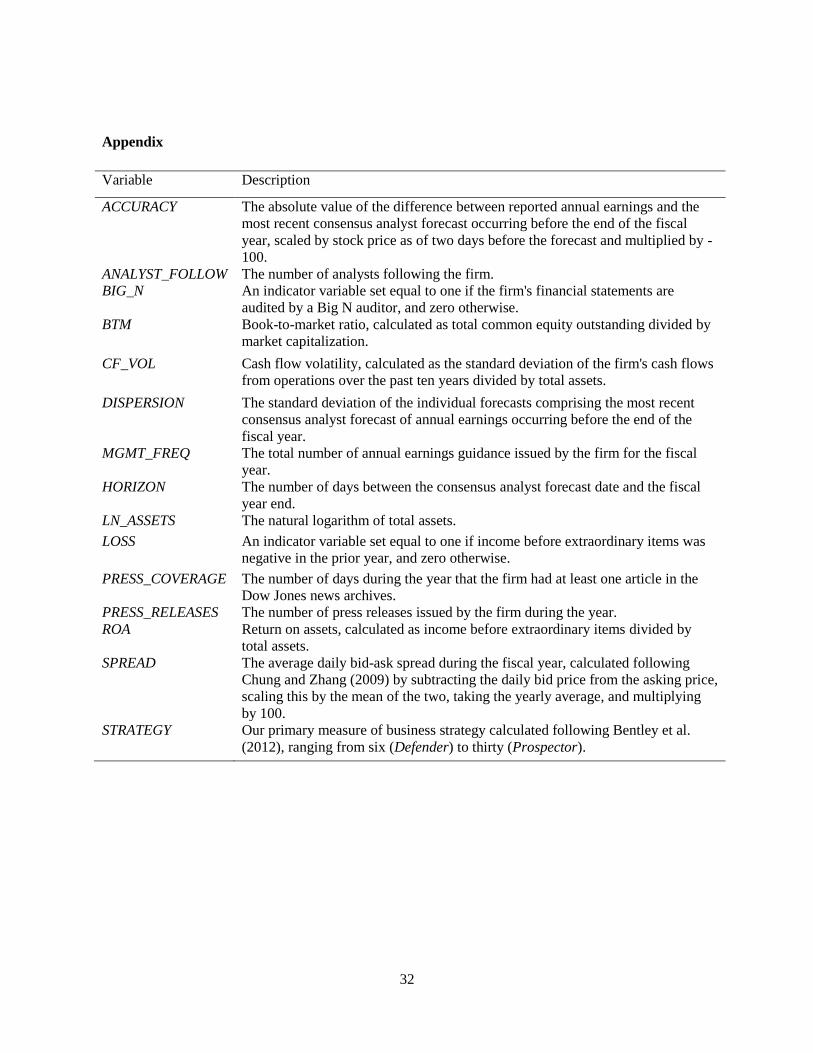
32
Appendix
Variable Description
ACCURACY The absolute value of the difference between reported annual earnings and the
most recent consensus analyst forecast occurring before the end of the fiscal
year, scaled by stock price as of two days before the forecast and multiplied by -
100.
ANALYST_FOLLOW
BIG_N
The number of analysts following the firm.
An indicator variable set equal to one if the firm's financial statements are
audited by a Big N auditor, and zero otherwise.
BTM Book-to-market ratio, calculated as total common equity outstanding divided by
market capitalization.
CF_VOL Cash flow volatility, calculated as the standard deviation of the firm's cash flows
from operations over the past ten years divided by total assets.
DISPERSION The standard deviation of the individual forecasts comprising the most recent
consensus analyst forecast of annual earnings occurring before the end of the
fiscal year.
MGMT_FREQ The total number of annual earnings guidance issued by the firm for the fiscal
year.
HORIZON The number of days between the consensus analyst forecast date and the fiscal
year end.
LN_ASSETS The natural logarithm of total assets.
LOSS An indicator variable set equal to one if income before extraordinary items was
negative in the prior year, and zero otherwise.
PRESS_COVERAGE
PRESS_RELEASES
ROA
The number of days during the year that the firm had at least one article in the
Dow Jones news archives.
The number of press releases issued by the firm during the year.
Return on assets, calculated as income before extraordinary items divided by
total assets.
SPREAD The average daily bid-ask spread during the fiscal year, calculated following
Chung and Zhang (2009) by subtracting the daily bid price from the asking price,
scaling this by the mean of the two, taking the yearly average, and multiplying
by 100.
STRATEGY Our primary measure of business strategy calculated following Bentley et al.
(2012), ranging from six (Defender) to thirty (Prospector).

33
Table 1
Sample selection.
Description Observations
Firm-years between 1997 and 2009 with sufficient Compustat data necessary
to calculate the STRATEGY measure
44,754
Less:
Firm-years without actual annual earnings available in I/B/E/S (9,445)
Firm-years without a consensus analyst forecast issued in the 90 day period
prior to the fiscal year end in I/B/E/S
(8,612)
Firm-years not followed by at least three analysts in I/B/E/S (8,170)
Firm-years with missing stock price data in CRSP (1,393)
Firm-years not found in First Call (1,602)
Final Sample 15,532

34
Table 2
Descriptive statistics and univariate tests.
Full Sample Prospectors Defenders
(N=15,532) (N=1,147) (N=604)
Variable Mean Median Std.
Dev.
First
Quartile
Third
Quartile Mean Med Mean Med
STRATEGY 18.471 18.000 3.418 16.000 21.000 25.121 25.000 11.127 11.000
SPREAD 0.723 0.297 0.921 0.126 0.982 0.678 0.295 0.984 0.394
DISPERSION 0.048 0.020 0.076 0.010 0.050 0.045 0.020 0.067 0.040
ACCURACY -0.572 -0.166 1.333 -0.468 -0.056 -0.661 -0.175 -0.751 -0.281
ANALYST_FOLLOW 9.750 8.000 6.636 5.000 13.000 9.486 7.000 7.005 6.000
PRESS_COVERAGE 45.486 36.000 38.744 20.000 60.000 44.538 35.000 40.347 33.000
MGMT_FREQ 1.527 0.000 2.282 0.000 3.000 1.330 0.000 1.066 0.000
PRESS_RELEASES 81.862 44.000 133.349 24.000 80.000 73.727 46.000 53.539 38.000
CF_VOL 0.048 0.039 0.035 0.026 0.057 0.054 0.039 0.051 0.041
LN_ASSETS 7.008 6.888 1.589 5.871 8.012 6.465 6.376 6.944 6.888
LOSS 0.335 0.000 0.472 0.000 1.000 0.572 1.000 0.354 0.000
ROA 0.037 0.052 0.108 0.013 0.090 -0.025 0.027 0.033 0.043
BTM 0.487 0.408 0.366 0.251 0.628 0.421 0.339 0.552 0.481
BIG_N 0.935 1.000 0.246 1.000 1.000 0.918 1.000 0.944 1.000
HORIZON 13.798 14.000 2.009 12.000 15.000 13.838 14.000 13.833 14.000
See the appendix for variable definitions. Means and medians presented in bold indicates a significant difference at the α = 0.01 level, using a
two-tailed t-test of means and Wilcoxon test of medians.

35
Table 3
Correlation matrix (Pearson-upper/ Spearman-lower).
Variable 1 2 3 4 5 6 7 8 9 10 11 12 13 14 15
1 STRATEGY -0.05 -0.10 0.01 0.08 0.00 0.03 0.02 0.03 -0.08 0.13 -0.14 -0.07 -0.02 -0.01
2 SPREAD -0.04 0.05 -0.17 -0.21 -0.24 -0.26 -0.16 -0.01 -0.25 0.08 -0.09 0.22 0.03 0.00
3 DISPERSION -0.13 0.05 -0.34 0.02 0.11 -0.16 0.02 -0.03 0.18 0.11 -0.14 0.14 0.03 0.00
4 ACCURACY 0.05 -0.19 -0.37 0.16 0.06 0.13 0.05 -0.11 0.11 -0.29 0.35 -0.24 0.03 -0.01
5 ANALYST_FOLLOW 0.09 -0.34 0.01 0.27 0.45 0.10 0.41 -0.10 0.61 -0.12 0.15 -0.22 0.16 0.02
6 PRESS_COVERAGE 0.00 -0.43 0.11 0.10 0.40 0.15 0.70 -0.10 0.54 -0.12 0.11 -0.15 0.09 0.02
7 MGMT_FREQ 0.03 -0.28 -0.21 0.22 0.12 0.14 0.13 -0.10 0.22 -0.20 0.14 -0.07 0.03 -0.02
8 PRESS_RELEASES 0.05 -0.40 0.06 0.05 0.39 0.71 0.13 -0.04 0.50 -0.03 0.05 -0.11 0.09 0.03
9 CF_VOL -0.01 -0.02 -0.08 -0.11 -0.08 -0.10 -0.09 -0.04 -0.33 0.22 -0.17 -0.10 -0.09 -0.01
10 LN_ASSETS -0.08 -0.35 0.19 0.18 0.62 0.48 0.19 0.50 -0.33 -0.17 0.13 -0.03 0.25 0.01
11 LOSS 0.12 0.13 0.10 -0.31 -0.13 -0.12 -0.21 0.03 0.16 -0.16 -0.55 0.16 -0.04 -0.01
12 ROA -0.07 -0.19 -0.18 0.36 0.17 0.13 0.15 -0.03 0.08 0.05 -0.59 -0.24 0.03 0.06
13 BTM -0.08 0.18 0.18 -0.30 -0.24 -0.17 -0.07 -0.11 -0.14 -0.03 0.12 -0.41 -0.03 -0.05
14 BIG_N -0.02 -0.02 0.03 0.07 0.18 0.08 0.03 0.10 -0.07 0.25 -0.04 0.02 -0.03 0.00
15 HORIZON -0.01 -0.09 0.01 -0.03 0.02 0.03 -0.02 0.07 -0.02 0.01 -0.01 0.05 -0.06 0.00
See the appendix for variable definitions. Correlations are presented in bold when they are statistically significant at
the α = .05 level using a two-tailed test.

36
Table 4
Regression results for firms' information environments and business strategies.
Variable SPREAD DISPERSION ACCURACY
(1) (2) (3)
STRATEGY -0.018*** -0.002*** 0.016***
(.001) (.001) (.001)
CF_VOL 0.822*** 0.082*** -2.283***
(.002) (.002) (.001)
LN_ASSETS -0.107*** 0.008*** 0.044***
(.001) (.001) (.001)
LOSS 0.081*** 0.012*** -0.377***
(.001) (.001) (.001)
ROA -0.369*** -0.081*** 2.894***
(.001) (.001) (.001)
BTM 0.463*** 0.016*** -0.549***
(.001) (.001) (.001)
BIG_N 0.012 0.003 -0.003
(.668) (.330) (.947)
HORIZON 0.000 -0.012**
(.317) (.023)
Intercept 2.372*** 0.007 -0.497***
(.001) (.490) (.001)
Industry Fixed Effects Included Included Included
Year Fixed Effects Included Included Included
Number of Observations 15,532 15,532 15,532
Adj. R2 59.1% 18.2% 18.2%
Type of Regression OLS OLS OLS
Table entries are estimates with two-tailed p-values in parentheses. *, **, *** indicate statistical
significance at the 0.10, 0.05, and 0.01 levels, respectively. All continuous variables are winsorized at
the first and 99th percentiles to alleviate the effects of outliers on the analysis. T-statistics are calculated
using White's (1980) heteroscedasticity robust standard errors clustered by firm to control for
dependency in the error terms (Gow et al., 2010; Petersen, 2009). Industry and year fixed effects are
also included in the model (coefficients not reported). See the appendix for variable definitions.

37
Table 5
Regression results for information asymmetry reduction mechanisms and business strategies.
Variable ANALYST_
FOLLOW
PRESS_
COVERAGE
MGMT_
FREQ
PRESS_
RELEASES
(1) (2) (3) (4)
STRATEGY 0.021*** 0.008** 0.019*** 0.016***
(.001) (.016) (.006) (.001)
CF_VOL 1.306*** 0.740** -3.004*** 3.422***
(.001) (.018) (.001) (.001)
LN_ASSETS 0.268*** 0.272*** 0.156*** 0.467***
(.001) (.001) (.001) (.001)
LOSS -0.023 -0.013 -0.404*** 0.185***
(.132) (.542) (.001) (.001)
ROA 0.334*** -0.079 1.422*** -0.513***
(.001) (.386) (.001) (.001)
BTM -0.307*** -0.352*** -0.123** -0.396***
(.001) (.001) (.036) (.001)
BIG_N 0.078*** -0.123*** 0.052 -0.203***
(.006) (.005) (.545) (.003)
Intercept 0.179*** 2.097*** -3.058*** 1.047***
(.006) (.001) (.001) (.001)
Industry Fixed Effects Included Included Included Included
Year Fixed Effects Included Included Included Included
Number of Observations 15,532 11,374 15,532 11,374
Type of Regression
Negative
Binomial
Negative
Binomial
Negative
Binomial
Negative
Binomial
Table entries are estimates with two-tailed p-values in parentheses. *, **, *** indicate statistical
significance at the 0.10, 0.05, and 0.01 levels, respectively. All continuous variables are winsorized at
the first and 99th percentiles to alleviate the effects of outliers on the analysis. T-statistics are
calculated using White's (1980) heteroscedasticity robust standard errors clustered by firm to control
for dependency in the error terms (Gow et al., 2010; Petersen, 2009). Industry and year fixed effects
are also included in the model (coefficients not reported). See the appendix for variable definitions.