Embed Size (px)
Citation preview

DOES BILINGUALISM IMPROVE ACADEMIC PERFORMANCE? ESTIMATING THE RELATIONSHIP BETWEEN FOREIGN LANGUAGES SPOKEN AT HOME AND STUDENT
TEST SCORES
A Thesis Submitted to the Faculty of the
Graduate School of Arts and Sciences of Georgetown University
in partial fulfillment of the requirements for the degree of
Master of Public Policy in Policy
By
Yessica Yang Choy, B.S.B.A.
Washington, DC April 15, 2016

ii
Copyright 2016 by Yessica Yang Choy All Rights Reserved

iii
DOES BILINGUALISM IMPROVE ACADEMIC PERFORMANCE? ESTIMATING THE RELATIONSHIP BETWEEN FOREIGN LANGUAGES SPOKEN AT HOME AND STUDENT
TEST SCORES
Yessica Yang Choy, B.S.B.A
Thesis Advisor: Thomas E. Wei, Ph.D.
ABSTRACT
During the 2013-14 school year, nearly 10 percent of students in U.S. public elementary
and secondary schools are English-learners. Limitation in the scope of previous research prevents
researchers from understanding whether a non-English language spoken at home has an effect on
student test scores. Using the Early Childhood Longitudinal Study, Kindergarten 1998-99, this
study examines the role of bilingualism – when a non-English language is spoken at home – plays
in students’ academic performance and their developmental trajectories in early school years.
Ordinary Least Square results show that despite starting with lower math and the reading scores in
kindergarten, bilingual students fully close the math gap by 1st grade and reading gap by 5th grade.
However, home and community factors, school factors, and student characteristics explain more
of these differences than bilingualism.

iv
ACKNOWLEDGEMENTS
I would like to give a special thanks to my advisor, Thomas Wei, for providing
enormous helpful feedback and guidance throughout this process. I also want to thank my
statistics professors at Georgetown, Carolyn Hill, James Habyarimana, and Adam Thomas, who
prepared me for this process. Finally, a special thanks to Eric Gardner for the valuable feedback
and all the help on acquiring, mining and handling the raw data.

v
TABLE OF CONTENTS
Introduction…………………………………………………………………………………….. 1
Literature Review………………………………………………………………………………. 3
Conceptual Model and Hypotheses…………………………………………………………….. 6
Empirical Strategy……………………………………………………………………………... 12
Data and Descriptive Statistics………………………………………………………………… 15
Results…………………………………………………………………………………………. 18
Discussion and Limitations……………………………………………………………………. 23
Conclusion……………………………………………………………………………………… 25
Appendix: Tables and Figures...……………………………………………………………….. 27
References…...….……………………………………………………………………………… 43

1
INTRODUCTION
Ever since the 1965 Immigration Reform Act and the new era of globalization, the
world’s demand is not only for technology, economic views or products integration, but also for
new strategy to cope the interface of international migrants and the native population. The U.S.
Census Bureau has estimated that immigrant population was about 13 percent whereas
immigrant’s children (born in the United States) were about 26 percent of the total U.S.
population in 2014 (Zong & Batalova, 2016). An essential component of movement is the
utilization of language or dialects when parents interact with their children (Paret, 2006). During
the 2013-14 school year, English-learners comprised more than 10 percent of enrollment in U.S.
public elementary schools and secondary schools (Mitchell, 2016). The shifting of the U.S.
population and predominance of foreign language use indicates that examining the educational
experiences of the immigrants’ children – those that speaks a non-English language at home – is
essential for education reform and to meet globalization demand (Paret, 2006).
A recent study of academic achievement reveals the importance of language-based skills
in early childhood (Kastner, May, & Hildman, 2001). The authors argue that mastery of
language-based skills correlates positively with later performance in school. However, because
language-minority students usually grow up learning a non-English language at home and
English at school, they must to distribute resources in acquiring and mastering two or more
languages. Therefore, their English proficiency might lag behind monolingual English speakers.
This early difference in oral English language skill constitutes a deficit for immigrant children
about to enter school in the United States (Hoff, 2013).
However, bilingualism appears to have benefits as well as liabilities. Bailystok and Craik
(2010) found that bilinguals have better performance in nonverbal tasks that involve conflict
2
resolution (e.g., Stroop and Simon tasks). However, the trade-off is that bilinguals may know
fewer words and are less capable than monolinguals in forming sentences or speech.
In the past decade, because of the cost and benefits associated with bilingualism,
bilingual education policy in the United States has been a subject of intense debate. Those who
disagree with bilingual education argue with data that there are negative consequences associated
with the use of non-English language when instructing or lecturing students (Wiley & Wright,
2004; Baker, 2011; and Mariam et al., 2013). Conversely, those who support bilingual education
cite evidence of students improving executive control in nonverbal tasks. Should we formally
promote bilingual education in the United States? Would just the oral form of bilingualism be
enough to promote academic achievement (as opposed to reading and writing as well)? To
answer these policy questions, we need to understand the costs and benefits associated with it.
One essential piece of information needed is the effect bilingualism has on student’s academic
performance and how does this effect evolve over time.
My study examines the relationship between bilingualism and academic achievement
both at kindergarten entry, during the years at primary school and the year at eight grades. Past
research has highlighted few reasons why early grades and progress through primary school are
particularly important for students. First, because of the cumulative curriculums, what students
learn in school in the early years act as building blocks to prepare them for later challenges;
though the early performances is critical to measure and to predict the overall academic
accomplishments and educational attainment (Ensminger & Slusarcock, 1992; Entwisle &
Alexander, 1993; and Farkas, 2003). Second, prior entering school, student knowledge is limited
to what they learnt at home, what they learn in the first few years in school are quantifiable
instantaneously. Sylva & Wiltshire (1997) found that the quality of preschool programs is highly

3
positive correlated with later academic achievements and success in the labor market. Third,
humans’ ability to learn language(s) diminishes with age. Specialists agree that there is a decline
in the ability to learn a second language after the age of six or seven (Asher & Garcia, 1969).
Though examining academic achievement in the early grades allow us to attribute the effect of
language in students’ performance more precisely.
Research Questions
My thesis attempts to answer two sets of questions regarding the academic achievement of
primary school students:
1. What is the relationship between non-English language spoken at home and academic
achievement at kindergarten entry and as student’s progress through primary school and
to eight grades?
2. How does academic trajectories differ between math and reading?
LITERATURE REVEW
Most of the research on bilingual student performance has been conducted on compound
bilinguals. This is when students acquired their second language through formal language classes
in school or language institutions. Studies of bilingual students’ performance, where student
acquired the second language via parents and the home environment are very limited. For those
limited studies that do, researchers tend to focus on a single ethnic minority group and/or a single
school grade. These studies compare the academic performance of ethnic minority students (i.e.,
Asian, Hispanic, etc.) who spoke a non-English language at home to English monolingual
students (EMS) who spoke English only at home (Funligni, 1997; Mouw, & Xie, 1999; and

4
Buriel & Cardoza, 1988). Because these studies are limited to one or two ethnic minorities, they
may not capture the overall average effect of non-English language spoken at home on student
achievement. For example, Buriel and Cardoza (1988) examined the relationship between
Spanish language background and achievement among high school Mexican-Americans. They
found that students’ aspirations showed the strongest positive relationship to achievement and
Spanish language background showed practically no relationship to achievement. Despite the
strong findings, the study only accounted for Mexican-American students from the U.S. Pacific
Region, which might not apply to ethnic minority students nationally. Furthermore, the study did
not include controls for home environment/socioeconomic characteristics (i.e., family income,
parent’s education), which raises concerns about whether the study captured the true effect of
language spoken at home on academic achievement, given that other research has pointed to the
importance of socioeconomic status for academic achievement (Sirin, 2005).
Another study (Mouw & Xie, 1999) included socioeconomic characteristics in the analysis,
and the results indicated little to no correlation that students who speak two or more languages
get higher test score than students who only speak one language. The results of this study
contradicts with the other researches, probably because this study only included a sample of just
832 Asian-American students in eighth grade, which is not necessarily representative of U.S.
non-native English speakers.
The first analysis to look more broadly at all ethnic minority students who spoke non-English
languages across the U.S. came in a Child Development Report (Fuligni, 1997). This study
examined students with Latino, East Asian, Filipino, and European backgrounds and their
academic achievements and behaviors. Results indicated that bilingual students scored higher in
math and reading tests than monolingual students, and a large portion of this effect correspond to

5
the value and motivation shared among group. However, despite including various ethnic groups,
this study is limited by the fact that participating students came from just two middle schools in
California.
Han (2012) brought new rigor to the analysis of non-English language spoken at home and
academic trajectories during early school years. Using panel data from the Early Childhood
Longitudinal Study’s Kindergarten Cohort (ECLS-K), he ran a three-level growth curve model
(level 1 as time, level 2 as individual and level 3 as schools). In comparing English
monolingual’s test scores to “mixed bilingual” (children who have good usage of non-English
language at home and English language in other settings), “non-English-dominant bilinguals”
(children who speak non-English and English language, but English language is not the dominant
language) and “non-English monolinguals” (children who speak non-English language only), the
author found that “mixed bilingual” is the only group that achieves comparable test scores to
“English monolingual”. Although this study employed a stronger empirical strategy, it suffered
from two important limitations: (1) the author restricted the analysis only to children from Latino
and Asian backgrounds; and (2) the author did not control for socioeconomic factors.
Though there has been extensive research on bilingual students’ academic achievement and
the relationship between language skills and academic performance, the effects of being a
bilingual on academic achievement have not been fully explored, and many of them are limited
in scope. For example, most existing studies did not use a nationally representative sample, and
most did not examined the effect of non-English language spoken at home on academic
achievement over time.
My thesis aims to fill this gap in the literature by expanding the scope of past research
(including all non-English minorities and adding more years) and adding new controls. I examine

6
the relationships between language spoken at home and academic achievement over time.
Focusing on the early academic experiences of language minority students and modeled after
Paret (2006) and Han (2012) papers; my research is meant to build off of it by using the same
data from a nationally representative sample of students who were enrolled in a public or private
kindergarten program in the 1998-99 school year (ECLS-K). Furthermore, I employ an improved
research design, which includes all controls variables that were used in quite more recent studies
and that showed statistical significant effect on predicting academic performance. These
variables include: language proficiency, race-ethnicity, socioeconomic status, school-level
factors, and students’ characteristics (Paret, 2006; and Han, 2012).
CONCEPTUAL MODEL AND HYPOTHESES
My study includes the factors that in recent studies have shown a statistically significant
effect on academic achievement. For purposes of discussion, these variables are grouped into
three major categories: (1) home and community environment, (2) quality of school climate and
curriculum, and (3) students’ characteristics. The only two variables that are not grouped into a
major category are non-English Language Spoken at Home and English Language Proficiency.
The conceptual model for examining the effects of these factors is presented in Figure 1 and
discussed in the following paragraphs.
The model posits that Home and Community Environment, Quality of School Climate
and Curriculum, Students’ Characteristics and English Language Proficiency have a direct effect
on Behaviors and Actions, which are related to academic achievement. In part, Language Spoken
at Home and Quality of School Climate and Curriculum affect students’ English Language
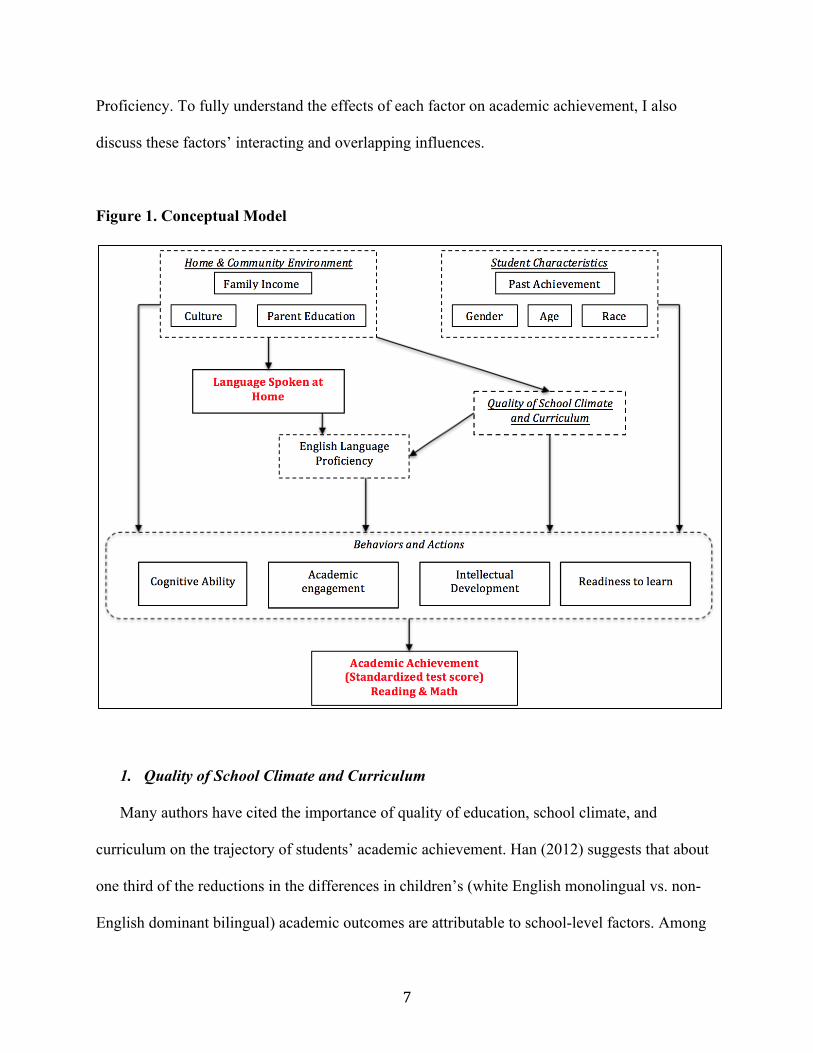
7
Proficiency. To fully understand the effects of each factor on academic achievement, I also
discuss these factors’ interacting and overlapping influences.
Figure 1. Conceptual Model
1. Quality of School Climate and Curriculum
Many authors have cited the importance of quality of education, school climate, and
curriculum on the trajectory of students’ academic achievement. Han (2012) suggests that about
one third of the reductions in the differences in children’s (white English monolingual vs. non-
English dominant bilingual) academic outcomes are attributable to school-level factors. Among

8
these factors, School Climate and Curriculum is especially important because it can promote
student engagement. For instance, we would expect that a classroom with resources (e.g.,
computers and projectors) would make classes more interactive, which enhances students’
learning experiences and increases their probability of succeeding in class. Indeed, Sbrocco
(2009) found that more engaged students are more likely to obtain higher average test scores.
2. Home & Community Environment
Culture, family income, and parents’ education are grouped under Home and Community
factors. Language spoken at home by students largely depends on the race and ethnicity of
parents since individuals who was born and/or grew up in a country where English is not the
official or primary language used, are more likely to use the foreign language at home (Paret,
2006). This is important because by the time children reach school age; the non-English
Language Spoken at Home factor will affect English acquisition (i.e., children who spoke a non-
English language at home would have to learn a new language – English – when they get to
school). From the sociocultural point of view, learning a non-English native language or dialect
is seen as a way to preserve and practice a culture (Paret, 2006).
Culture and language are inseparable. A survey designed by Jiang (1999) examined how
culture affects the choice of words and expression used by two different language groups
participant. Jiang (1999) noted that food words listed by most native Chinese speaker include:
‘steamed bread’, ‘noodle, meat’, ‘rice and dumpling’, which are typical foods among in Chinese
people; While words such as ‘hamburgers’, ‘ice-cream’, ‘pizza’, ‘and dessert’ are listed by the
native English speaker. Jiang (1999) results not only suggests the choice of word differs, but that
native Chinese speakers tend to express things in a more specific way, while native English
speaker tend to be more general. Culture includes, but is not limited to, beliefs, morals, law,

9
knowledge, practices, and parenting style. These factors influence student academic
performance, through theirs effects on cognitive ability, intellectual development and values
such as work ethic (Kao & Thompson, 2003).
The levels of parental and community resources may also influence students’ academic
achievement. Families with more resources (e.g., higher income) would have access to better
health services, nutrition, and better schools for their children. Previous studies have cited the
importance of nutrition to a child’s cognitive development. Conversely, poor nutrition in early
childhood could result to severe effect in the later stage of development. Children with poor
nutrition could experience delayed physical growth and motor development (World Bank, 2011),
which could impact their ability to learn, focus and in more extreme cases children could
experience hard time interacting with their peers. In contrast, high academic accomplishment is
in all likelihood when schools and teachers put students achievement in priority, and when home
and community put enough resources and supports for students to grow in healthy environment
(Bronfenbrenner, 1978).
Parents’ educational attainment is also important in determining their child’s academic
achievement. Parents with higher education are more likely to earn higher income and to
supervise their children on school assignments and in understanding course materials. Parenting
behavior is shaped by background factors and context (e.g., education) and as parents express
diverse values and opinions, children’s manners and inspirations are then influenced (Grolnick et
al., 2009). So when parents believe that academic accomplishment and intellectual capacity are
something that can be altered or work to achieve, children would be instilled with such
mentalities and so they will work hard in achieving high accomplishment (Dweck, 2010).
10
3. Student Characteristics
Student’s gender, past achievement, age, and race factors are included under Student
Characteristics, have a direct and indirect impact on academic achievement. Gender differences
in test scores are an international phenomenon that emerges in different institutional settings.
Researchers have cited biological, social, psychological, and institutional reasons to explain
gender disparities in academic achievement (Mickelson, 1989; Esptein, 1998; and Hyde & Kling,
2001). Previous scholastic achievement is highly correlated with present achievement, not only
because past performance indicates how well prepared students are for present or new materials,
but also because it affects students aspirations, expectations, and cognitive abilities (Lemons et
al. 2014). As the Lemons and his coauthors suggest, students’ aspiration, expectations, and
cognitive abilities are shaped by multiple variables, including: age, past performance, race,
culture, and many others. These factors hold a simultaneous relationship, which will affect
academic outcomes.
4. Language Spoken at Home and English Language Proficiency
Language proficiency has an indirect effect on academic achievement through a set of effects
on psychological, behavioral, and physical brain development. For a student to understand
school materials and succeed in the classroom, proficiency in the main language used in the
classroom is required. For instance, in schools where English is the main language, students with
high English proficiency will be able understand and interpret course materials effectively; but
students with limited English proficiency may experience communication difficulties (Warren,
1996; and Schmid, 2001). In addition, language spoken at home affects proficiency in English.
As discussed earlier, children who speak non-English languages at home have to learn a new
language – English – when they get to school. Moreover, these students have to allocate their

11
resources to learning/maintaining two languages.
In exploring the relationship between language spoken at home and English language
proficiency, researchers have come to different conclusions. Ben-Zeex (1977) suggests that
raising children to speak and understand more than one language is good for their cognitive
development. Students with higher cognitive ability are usually higher academic achievers
(Leeson et al., 2008). In other words, there could be a positive impact as bilingual students “have
the English-language skills to function effectively in school without abandoning their [native]
language and culture that enable them to maintain an identity and to function effectively in their
families and communities” (Rumberger & Larson, 1998). However, there could also be a
negative impact if the second language gradually replaces the first language. As explained by
Lambert and Taylor (1981): “the hyphenated American child, like the French-Canadian child,
may embark on a ‘subtractive’ bilingual route as soon as he/she enters a school where a high
prestige, socially powerful, dominant language like English is introduced as the exclusive
language of instruction” (p. 14).
5. Hypotheses
Based on the findings of previous studies, different factors influence the relationship of non-
English language spoken at home and academic achievement positively and negatively; though
the net effect is not clear. But in my opinion, I hypothesize that non-English language spoken at
home (bilingualism) will have a negative effect on academic achievement (in both math and
reading). I also hypothesize that all students’ that speak a non-English language – regardless of
their race – at home will score lower than native-English students in kindergarten and the first
few years in primary school. But because cognition increases with age, this gap will diminish as
students proceed to the last few years of primary school. Furthermore, the rate at which this gap

12
closes will be faster for math than reading; and even faster for bilingual students who are
proficient in English.
EMPIRICAL STRATEGY
In my study, the term monolingual refers to those students who speak only English at home;
while bilingual refers to those students who speak a non-English language at home (language
minorities). Model 1 is my base empirical Ordinary Least Square (OLS) model, derived from the
conceptual framework in Figure 1 and structured partially following the equation in Paret (2006).
Model 1 (Base): Regression Model Test Score (R-reading and M-math)
𝑇𝑆!,! =∝ +𝛽!𝐿𝑆𝐻 + 𝛽!ELP! + 𝛽!School Factors! + 𝛽!Home & Community Factors+ 𝛽!Student Factors!,!
∗ + 𝑢!,! s: subject g: grade LSH: Language spoken at home ELP: English language proficiency *: Only past achievement will vary by grade and subject
In this equation, my dependent variable is test scores (math and reading). Current year
test scores are a function of language spoken at home, English language proficiency, home and
community factors (race, family income, and parent education), school factors (school type), and
student factors (gender, age, and previous year test scores). I apply sampling weights to ensure
my results are nationally representative. I also conduct a secondary subgroup analysis by race.
This allows me to see if there are differences in the effect of languages across various racial
groups.
For robustness analyses, I employ five more regressions. In the first four of these regressions,
I omit a factor from the base model and in the fifth regression I omit all control variables/factors.
Model 2 omits the School Climate and Curriculum category; Model 3 omits Home and

13
Community category; Model 4 omits the Student Characteristics; Model 5 omits English
Language Proficiency; and Model 6 omits all control variables/factors.
1. Dependent Variables
My dependent variables are the student-level test scores for each subject and grade. The
reading assessments were designed to measure basic skills such as letter sounds and recognition,
vocabulary, and comprehension. The math assessments were designed to measure conceptual
knowledge, procedural knowledge, and problem solving. Direct assessments of reading and
mathematics competency were collected using an item response theory (IRT) approach. IRT
procedures yield an overall scale score of children’s knowledge and skills estimates at any given
Model 2: Regression Model 𝑇𝑆!,! =∝ +𝛽!𝐿𝑆𝐻 + 𝛽!ELP! + 𝛽!Home & Community Factors+ 𝛽!Student Factors!,!
∗
+ 𝑢!,! Model 3: Regression Model 𝑇𝑆!,! =∝ +𝛽!𝐿𝑆𝐻 + 𝛽!ELP! + 𝛽!School Factors! + 𝛽!Student Factors!,!
∗ + 𝑢!,!
Model 4: Regression Model 𝑇𝑆!,! =∝ +𝛽!𝐿𝑆𝐻 + 𝛽!ELP! + 𝛽!School Factors! + 𝛽!Home & Community Factors+ 𝑢!,!
Model 5: Regression Model 𝑇𝑆!,! =∝ +𝛽!𝐿𝑆𝐻 + 𝛽!School Factors! + 𝛽!Home & Community Factors
+ 𝛽!Student Factors!,!∗ + 𝑢!,!
Model 6: Regression Model 𝑇𝑆!,! =∝ +𝛽!𝐿𝑆𝐻 + 𝑢!,!
s: subject g: grade LSH: Language spoken at home ELP: English language proficiency *: Only past achievement will vary by grade and subject

14
point in time and can be used to look at knowledge and skill over time. My models include ten
continuous variables; five corresponding to reading test scores and five corresponding to math
test scores in kindergarten, and first, third, fifth and eighth grades.
2. Independent Variables of Interest – Language Spoken at Home
My main independent variable of interest is language spoken at home. The ECLS-K
measured this by asking parents what languages were spoken at home, and which of these
languages was primary and secondary in terms of use in the base year (Kindergarten). Based on
the responses students are organized into two categories: (1) English is the only language spoken
at home; (2) a non-English language is spoken at home.
3. Control Variables
My control variables account for other factors that influences test scores and may also be
related to whether a non-English language is spoken at home. The control variables include
English Language Proficiency and other variables that are grouped in three categories: home and
community factors (culture, family income, and parent educational attainment); school factors
(school type); and student factors (gender, race, and previous year test scores).
With respect to English Language Proficiency, the ECLS-K collected detailed information at
school entry. In the kindergarten and first-grade data collections, a brief language screener, the
Oral Language Development Scale (OLDS) was given to 15% of children who were identified
by teachers or school records as having a non-English language background, and those that did
not understood English well enough to receive the direct child assessment from the screener.
Whether a child achieved at least the cut-off score on the OLDS and was assessed in English can
be used as an indicator of the child’s Basic English proficiency. In kindergarten, about 1,400
children (9% of the overall sample) scored below the cut-off point, and by first grade the number
15
was down to 2% of the overall sample. The OLDS was not administered beyond first grade
because most children had passed the OLDS by the spring first-grade data collection.
Control variables under Home and Community Factors include culture, family income, and
parent educational attainment. ECLS-K does not have a direct assessment of culture, but the race
variable captures some cultural characteristics. Since race is also included as a student factor, I
use a student’s race recorded at the beginning of the ECLS-K study as control variable. Family
income is measured through parent interviews in each round. My study uses the average income
of each household over all the rounds I am studying. The ECLS-K also recorded parents’ highest
education level in the base year (kindergarten). The record shows nine levels of educational
attainment. I take this information and collapse it into four categories: some high school,
completed high school, completed college, and some master’s classes.
Student gender and race are composite variables that are measured at the beginning of the
study (kindergarten); I use these same variables as my controls. In addition, I include the scores
of the previous round as my past achievement measure. For instance, when predicting third grade
reading test scores, I include first grade reading test score as a control variable. Since
kindergarten is the base year, previous round test scores are not included in that case. Student age,
discussed in the conceptual model, will not be included in the regression model because students
are required to be in a certain age range to attend a grade (e.g., 6 or 7 years of age to attend first
grade). So age is already mostly captured in grade-level test scores.
DATA AND DESCRIPTIVE STATISTICS
The Early Childhood Longitudinal Study, Kindergarten Class of 1998-99 (ECLS-K)
program sponsored by the National Center for Education Statistics at the U.S Department of
16
Education, is a longitudinal study that examines child development, school readiness, and early
school experiences. To ensure that the sample is nationally representative, children in the study
were drawn randomly using a dual-frame, multi-stage sample design. The primary-sampling
units (PSUs) – counties and country groups – were selected from a national framework. After
obtaining the counties, researchers selected about 46 students from public and private schools
(23 students each) within each county. Through this process, a sample of 21,356 students from
1,280 schools was selected for the study in the fall of their kindergarten year. This sample
contained children from diverse socioeconomic and racial/ethnic backgrounds. Also participating
in the study were the children's parents, teachers, and schools. Students who were selected in the
study were followed longitudinally from kindergarten through eighth grade. Apart from being a
national representative sample, the ECLS-K also included detailed information on language
spoken at home upon school entry. This makes it the only dataset with the capacity to evaluate
the relationship between children’s language spoken at home and academic development
trajectories.
As for my research, I have collected student-level panel data and their parents’ responses
from the ECLS-K. These data include: reading test score, math test score, language spoken at
home, English language proficiency, parent’s education, family income, race, gender, and school
type attended (public, private or catholic). The students in my sample are a subsample of the
ECLS-K, entered kindergarten in spring 1999 and were present in the study up until 8th grade. By
using a consistent sample over time, more credible results are possible for comparisons across
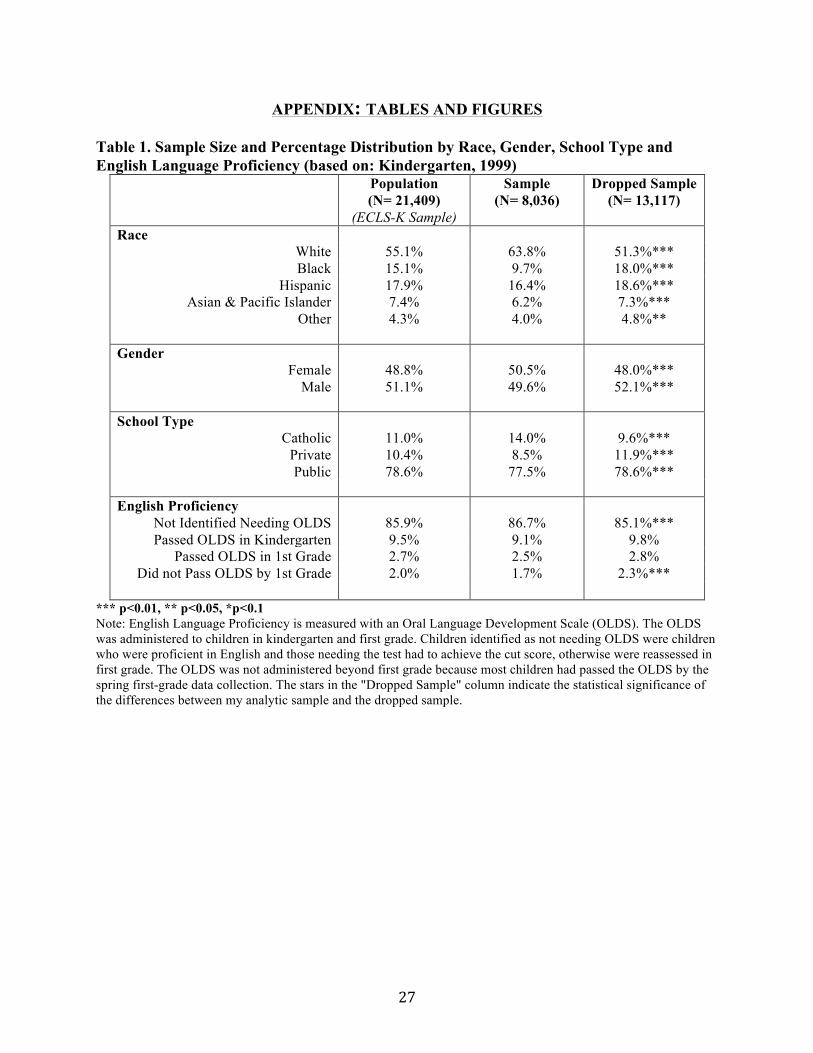
years. Appendix Table 1, compares the full sample, my analysis sample, and the dropped sample
(the share if the full population not used in my study) in term of sizes and means across the
various covariates in my analysis. My overall sample consists of 8,292 students. About 65% of

17
these students are White. The rest were distributed in the following manner: Black (10.1%),
Hispanic (17%), Asian & Pacific Islander (6.9%) and others races (4.1%). The proportion of
females and males in my sample is about the same. Most students were attending public schools.
Only 11% of my sample was administered the OLDS; and only 9.7% and 2.8% of the students
administered the OLDS passed the assessment in kindergarten and first grade.
Although my sample comprises about 40% of the national representative sample (ECLS-
K 1998-99 study), the students in my sample are statistically significantly different in many ways
from the remaining 60% that were not selected. Although attrition is very common in
longitudinal research, these differences do raise some concerns about attrition in my study. The
attrition problem in my sample poses two threats of bias, which will be discussed below in my
Discussion and Limitation section.
Appendix Table 2 shows a simple breakdown of the sample in my study by language
status. Monolinguals are those students who only spoke English at home, while Bilinguals are
student who spoke a non-English language at home. The percentages in Part I, shows that there
are more monolingual students than bilingual students, but I still have a good number of students
in each category. Before running OLS models and controlling for variables, it may be useful to
see how test score performance differs between monolinguals and bilinguals. Part II reports the
average standardized test scores based on the samples of children assessed in a given grade level.
The differences between monolingual and bilinguals are all statistically significant, but reading
test score differences are especially large when compared to math test scores. Difference in
reading test scores range from 0.45 to 1 standard deviation, while differences in math scores
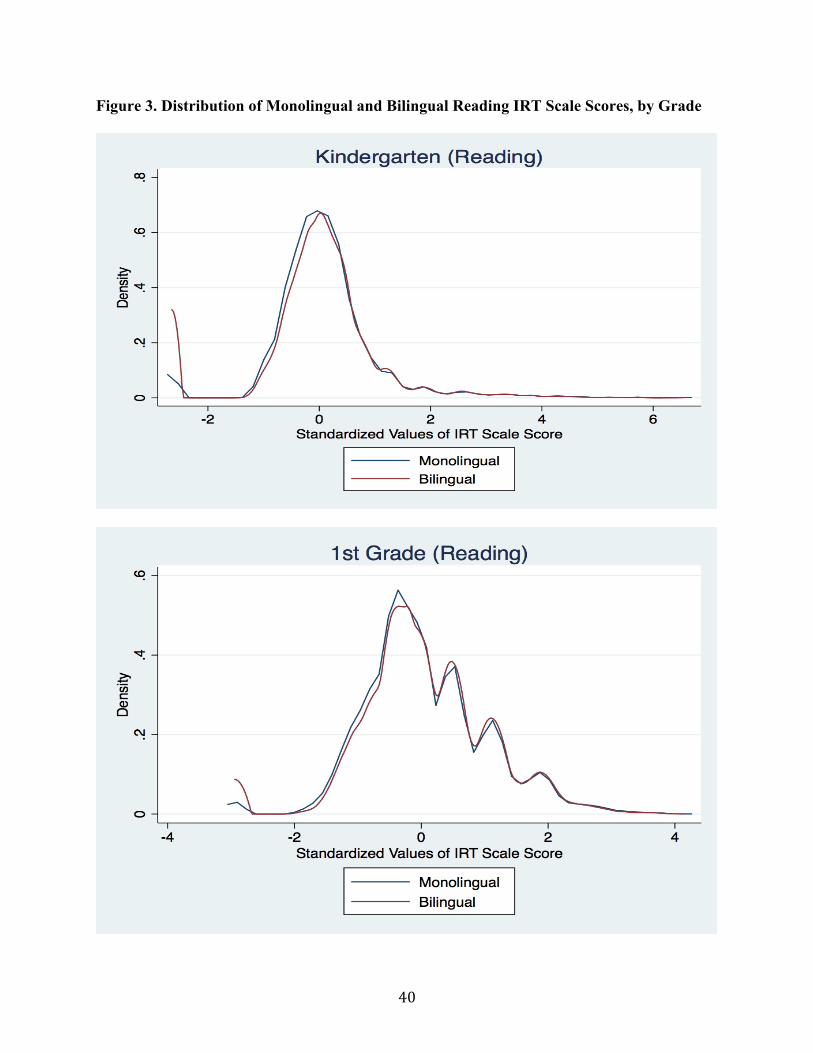
range from 0.3 to 0.66 standard deviation units. Since the test scores in Table 2 Part II are
computed as averages, it may also help to get a sense of the total distribution of test scores

18
between monolinguals and bilinguals. Appendix Figure 2 and Figure 3 display the distribution of
monolingual and bilingual student math IRT scale scores and reading IRT scale scores in
standardized value by grade. The graphs show that both monolingual and bilingual student
follow similar trajectories for Math and Reading. Student’s IRT scores in kindergarten are
skewed to the right, then cluster around the mean by 3rd grade, and end up skewing to the left by
8th grade.
RESULTS
The descriptive statistics show that monolingual and bilingual students vary in their
observable characteristics and that their baseline average standardized test scores are
significantly different (Table 2). After limiting my sample to students that were present
throughout the study (kindergarten to 8th grade), I estimated the six OLS models outlined in my
Empirical Strategy section (above). Appendix Tables 3 to 5 present the results. All regressions
took into account any missing independent variable observations using the dummy variable
adjustment. Less than three percent of observations were missing for the race control and the
parent education control.
1. Primary Results
Some variables of interest yielded statistically significant results, though this was not
consistent across all dependent variables and models. When results are significant, the
magnitudes are mostly small. Table 3 displays regression results in standardized deviation units
by subject and grade-level using the primary dependent variable of interest: test scores. The
language spoken at home variable has only modest statistical significant and small effect on math
test scores and almost no relationship to reading test scores. Four “Languages Spoken at Home”
19
coefficients are statistically significant in predicting academic performance. Three are for math
(kindergarten, 5th grade, and 8th grade), and one for reading (8th grade). For math test scores, the
gap between monolingual and bilingual students although is small, but it is statistically
significant (slightly less than 0.08 of a standard deviations).
The results suggest that bilingual students score lower than monolingual students at the
beginning (kindergarten), but this gap gets smaller and reverses direction through time:
bilinguals students eventually score higher than monolingual students on the math test. In 8th
grade, being bilingual appears to be beneficial for math and reading achievement; it is associated
with a 0.048 and 0.056 standard deviation increase in math and reading test scores respectively.
In the other grades, being bilingual seems to be good for math (except in kindergarten) and
neutral for reading. But overall, though statistically significant, the effect does not seem big –
less than 0.1 of a standard deviation in test scores. In contrast, the control coefficients give more
confidence that there are systematic and meaningful differences in math and reading test scores
between monolingual and bilinguals.
a. English Language Proficiency
Among all control variables, English Language Proficiency has the strongest predictive
power – in term of magnitude and statistical significance – for math and reading scores. The
variable for students who were administered the ODLS and did not pass in the kindergarten
round has a smaller impact in math and reading test scores when compared those that had to take
the assessment in first grade. Having to take the assessment again in the first grade round is a
future indication of lower English Language Proficiency. Students who passed in 1st grade round
had scored 2.6 standard deviations lower in kindergarten reading than children who did not have
to take the assessment. A similar story applies to those who did not pass OLDS at all.

20
b. Quality of School Climate and Curriculum
Most of the school coefficients are statically significant. Students in private and catholic
schools score higher in reading tests relative to students in public schools in all years; and lower
in 1st grade math. This finding is similar to Han (2012), who suggests that School-level factors
could explain about one third of the reductions in the differences in children’s academic
performance.
c. Home and Community
Overall, Home and Community Factors (family income and parents’ education) are
statistically significant in all grade level. The higher the parents’ educational attainment, the
higher students score in math and reading, except that little or no difference was found between
students whose parents’ have a college degree and those whose parents have a graduate degree.
Family income is also an important factor in student achievement. A dollar increase in family
income is associated with test score increases ranging from 0.2 to 1.5 standard deviations.
d. Student Characteristics
Many of my time fixed variables are statistically significant. The effect of gender, past
performance and race are smaller in magnitude and highly statically significant across all grades
and subjects. On average, male students are likely to score higher than female students in math
but lower in reading (kindergarten, 1st, 3rd and 5th grade). Past achievement is associated with a
0.7 to 0.8 standard deviation increase in both test scores. Race coefficients will require more
attention as more coefficient in involved. The result in my analysis suggests that, on average,
Whites score higher than other races in all grade level, except for Asian and Pacific Islander in
later grades (after 3rd grade); but these differences are less than 0.5 standard deviations.
21
2. Secondary Results (Subgroup Analysis)
As race captures many cultural differences such as parental values and parenting styles
and practices, which are very important in predicting academic achievement (Jiang, 1999), it is
interesting to see if the relationship between language spoken at home and achievement varies
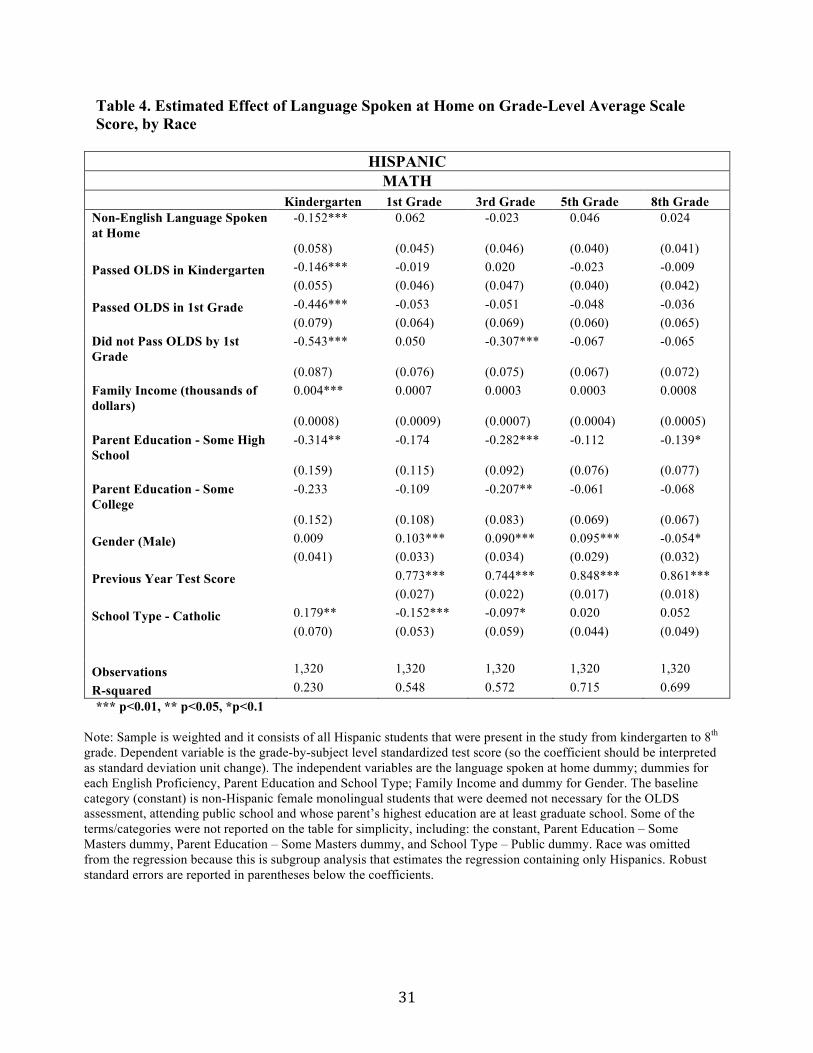
for different racial groups. I conduct this analysis only for Hispanic and Asian & Pacific Islander
subgroups since these groups have the most variation in whether a non-English language is
spoken at home. Table 4 displays the regression results by subject and grade-level for my
Hispanics and Asian & Pacific Islander subgroups. The results tell similar story as in Table 3 for
the relationship between non-English language spoken at home and student test scores. For
Hispanics, non-English language spoken at home does not seem to affect students’ test score
much, other than in kindergarten. In kindergarten, Hispanics who spoke a non-English language
at home scored 0.2 and 0.01 standard deviations lower on math and reading tests than those who
only spoke English at home. Students’ past performance, gender, and achieving the OLDS
minimum cut score had a stronger effect on test scores.
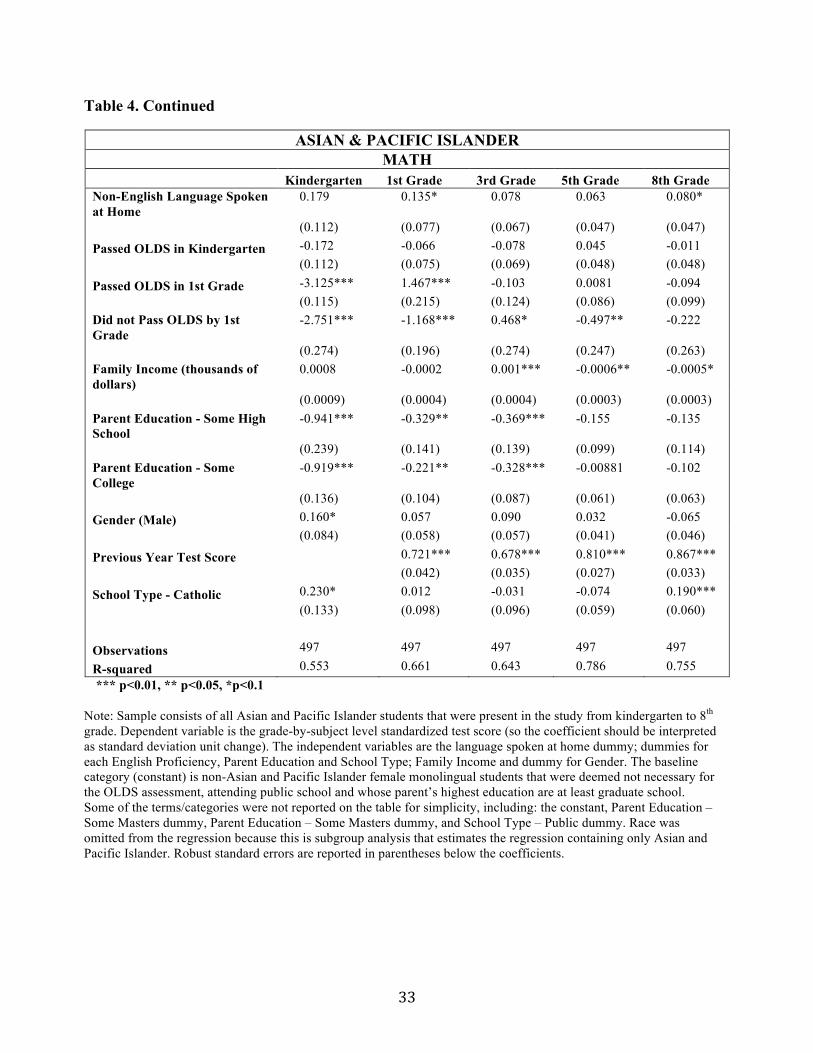
On the other hand, non-English language spoken at home only affects Asian & Pacific
Islander math and reading test scores in 8th grade. In this sub-group, overall, students achieving
the cut score of OLDS assessment by first grade, parent education, and student past achievement
seem to have a larger effect on test scores than whether a non-English language was spoken at
home.
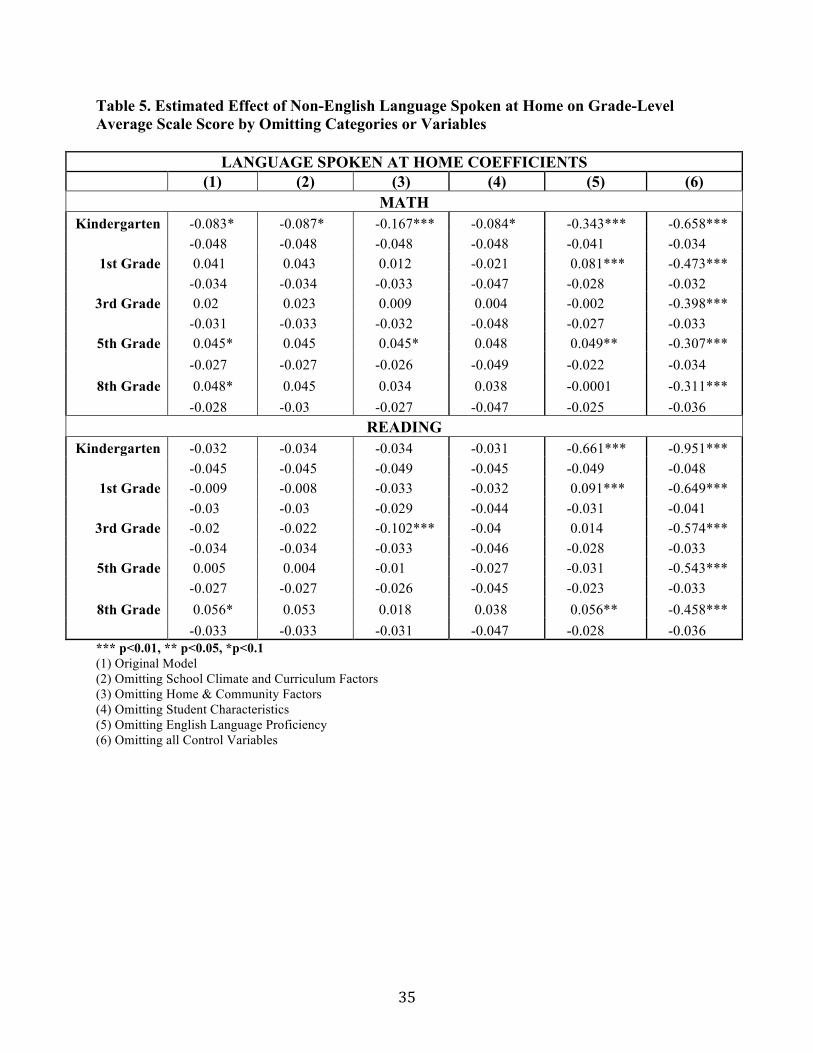
3. Robustness Check
To ensure that my results are not being driven by model assumptions, I estimated the same
regression, omitting different independent variables/factors. Table 5 displays language spoken at
home coefficients by subject, grade, and model. In general, results from the original/baseline

22
model and models omitting different variable(s) are similar with respect to statistical significance
and the direction of relationship. The first column shows the original regression with all the
control variables. The second to fifth columns show the original regression, but omitting school
climate and curriculum factors, home and community factors, student characteristics factors or
English language proficiency. Most of the OLS results are not sensitive to the elimination of
variables relative to my baseline model, except the model eliminating the English proficiency
variable (Table 5, column 5) and the model with no covariates (Table 5, column 6).
After eliminating the English proficiency variable (there is little sensitivity for 1st grade math)
the language spoken at home variable becomes statistical significant at the 0.01 level and
magnitudes increase in most of the grades for both subjects. The results on reading test scores are
predominantly significant at most grade levels. This supports my earlier suggestion that, adding
the English proficiency variable partially cancels out the effect of language spoken at home
because they are strongly correlated. Student who spoke English only at home are expected to be
proficient in English. On the other hand, student who spoke a non-English language at home are
expected to be less proficient in English because they have to allocate their resource to learning
two languages. English language proficiency is especially important for reading because it
requires intensive knowledge and proficiency in English. Eliminating all covariates (Table 5,
Column 6) from the original regression turns all language spoken at home coefficient to
statistically significant at the 0.01 level for all grades. Control variables were added at the
beginning because past studies had proved their effect on test scores. Removing them means
excluding all alternative explanation that could be affecting test score outcomes.Also,the
summarystatisticsinTable2showthatmonolingualandbilingualstudentsdiffer
significantlyonmanycontrolvariables.Thissuggeststhattheirvariablesaredifferentin

23
importantwaysthatmayaffectachievement.Therefore,notcontrollingforthemlikelywill
raiseomittedvariablebias.
DISCUSSION AND LIMITATIONS
Taken as a whole, my results indicate some relationship between language spoken at
home and student test scores. This outcome confirms the previous literature that has found mixed
differences between bilingual and monolingual student achievements trajectories. Though I was
able to collect test scores and other observable characteristics from a nationally representative
sample (original) of 21,409 students; to make comparable analysis, I restricted my sample to
only consist of students that were present through the whole study (from kindergarten to 8th
grade), so the sample in my test were restricted to only 40% of the original sample. The fact that
the largest proportion of the original sample that was not selected in a way that met the
requirements of my study poses threats to my conclusion because it differs on common baseline
characteristics when compared to my sample. As a result, the conclusion drawn in my study may
not be generalizable to the original population and is not nationally representative. Furthermore,
selection bias may negatively affect the internal validity of my study; correlation between
variables in my study could be different from the true correlations on the original sample.
Even in the case where attrition does not pose a threat in my study, the study has other
important limitations. First, exclusion of observable or unobservable factors that are related to
academic achievement and language spoken at home would lead me to overestimate the real
relationship. For instance, although I have controlled for many important variables – and these
controls might have explained a sizeable portion of the variation of test scores – I was not able to
control for some variables. The main problem in estimating the effect of non-English language

24
spoken at home on test score is unobservable factors. Bilingual student who speak a non-English
language at home may have different habits at home from monolingual students due to the
difference in culture. For instance, Asian culture puts more emphasizes on test scores and
mastering skills, while Western culture puts more emphasizes on extra curricular activities and
innovation. The degree to which Asians students focuses to achieve high test score largely
depends on their parents’ beliefs and values. As Paret (2006) indicates, these values and beliefs
are affected by religion, the time being in America, and immigration status. Asians parents
whose children are second-generation immigrants are less likely to urge their children to focus
on achieving high-test scores than first-generation immigrants. These unobservable are not fully
captured by race, which could bias my estimate of the true relationship.
Second, my outcome measures could be narrow in scope. My analysis can only make
limited inferences, that is, inferences to the national population of the United States, since
education systems and education policy vary from country to country. Bilingualism may exist in
many different forms (e.g., students who attend bilingual school; or cases where the
country/region official language consists of more than one language, as in Quebec, Canada).
However, the scenario being studied in my research is specific to settings where English is the
primary language used in school and where a non-English language is spoken at home.
Third, the other general limitation of my study is that even if my results had shown that
speaking a non-English language at home makes students score differently than those who only
speaks English at home, I can’t differentiate bilingual students who spoke Chinese, Arabic,
French, German or other non-English language at home, and to those who frequently spoke these
non-English language at home to those who do not. Appendix Table 6 shows a simple
distribution of the primary language spoken at home. As indicated in the table, ECLS-K only

25
released half of the parents’ responses and about 12,600 responses were suppressed. The
“Sample” column reports a hypothetical distribution of students that will fall into each language
category. Since I do not have a big enough sample, I cannot conduct further analysis of the type
of non-English language spoken at home. This missing information is very important since there
could be a relationship between the type of non-English language spoken at home and
achievement on test score. For instance, a bilingual student who spoke Chinese (a language
relatively different from English) could score at different level than a bilingual student who
spoke Spanish (a language relatively similar to English). Also the racialcategoriesdon't
necessarilyfullycapturethispotentialheterogeneitybasedonspecificlanguagespokenat
home.Understandingifthereareanydifferencesinacademicperformancesassociated
withbilingualismisimportant.Whilemystudyconfirmsthattherearesignificant
differences,itisnotenough.Thenextitemintheagendaistoexplorethepossibilityof
bilingualeducationprograminprimaryschool,andforsuchdecisiontobemade,policy
makers,educatorsandresearchersneedtoidentifythespecificinputsandchoicesthat
yieldbetteracademicperformanceandtomeetthedemandofglobalization.
CONCLUSION
My findings not only verify the crucial takeaway from the previous literature. To test the
previous findings, I expanded the time frame and scope of past studies to find evidence about the
relationship between non-English language spoken at home and academic achievement. My
results suggest that even though bilingual students start with a lower math and reading tests
scores, they fully close the math gap by 1st grade and the reading gap by 5th grade, which is
consistent with my hypothesis and the part of Han’s (2012) findings. Furthermore, non-English

26
language spoken at home has negative effect on academic performances in the first few years of
schools but this effect diminishes and eventually disappears. When students reach higher-grade
levels, non-English language spoken at home has a to positive effect on academic performance
(for both math and reading), which is a new finding; however, the effect is small in magnitude.
For policymakers, the lesson may be to look into incorporating bilingual education as early as in
primary school. It is possible that native-English students (who only speaks English at home) can
enjoy the benefit that bilingualism brings, later in this academic experience.
As my research suffers from limitations, it leaves the door open for further research.
Future researchers might consider using student-level panel data, like the data I have used here,
but using more advanced research techniques such as propensity-score matching or regression
discontinuity to draw more compelling conclusions. Researchers might also consider obtaining
information on the specific non-English language spoken at home.
27
APPENDIX: TABLES AND FIGURES Table 1. Sample Size and Percentage Distribution by Race, Gender, School Type and English Language Proficiency (based on: Kindergarten, 1999)
Population (N= 21,409)
(ECLS-K Sample)
Sample (N= 8,036)
Dropped Sample (N= 13,117)
Race White 55.1% 63.8% 51.3%*** Black 15.1% 9.7% 18.0%***
Hispanic 17.9% 16.4% 18.6%*** Asian & Pacific Islander 7.4% 6.2% 7.3%***
Other 4.3% 4.0% 4.8%** Gender
Female 48.8% 50.5% 48.0%*** Male 51.1% 49.6% 52.1%***
School Type
Catholic 11.0% 14.0% 9.6%*** Private 10.4% 8.5% 11.9%*** Public 78.6% 77.5% 78.6%***
English Proficiency
Not Identified Needing OLDS 85.9% 86.7% 85.1%*** Passed OLDS in Kindergarten 9.5% 9.1% 9.8%
Passed OLDS in 1st Grade 2.7% 2.5% 2.8% Did not Pass OLDS by 1st Grade 2.0% 1.7% 2.3%***
*** p<0.01, ** p<0.05, *p<0.1 Note: English Language Proficiency is measured with an Oral Language Development Scale (OLDS). The OLDS was administered to children in kindergarten and first grade. Children identified as not needing OLDS were children who were proficient in English and those needing the test had to achieve the cut score, otherwise were reassessed in first grade. The OLDS was not administered beyond first grade because most children had passed the OLDS by the spring first-grade data collection. The stars in the "Dropped Sample" column indicate the statistical significance of the differences between my analytic sample and the dropped sample.

28
Table 2. Distribution of Sampled Students by Language Status – Language Spoken at Home (N=8,036)
Monolingual (N=7017)
Bilingual (N=1019)
PART I Race
White 72.03% 6.97%*** Black 10.90% 1.08%***
Hispanic 9.18% 66.34%*** Asian & Pacific Islander 3.52% 24.53%***
Other 4.38% 1.08%*** Gender
Female 50.38% 51.23% Male 49.67% 48.97%
School Type Catholic 14.86% 8.24%***
Private 9.16% 4.22%*** Public 76.02% 87.73%***
English Proficiency Not Identified Needing OLDS 96.42% 20.12%*** Passed OLDS in Kindergarten 3.28% 49.26%***
Passed OLDS in 1st Grade 0.20% 18.45%*** Did not Pass OLDS by 1st Grade 0.14% 12.37%***
PART II Standardized Mean Test Score: Math
Kindergarten 0.27 -0.39*** 1st Grade 0.22 -0.25*** 3rd Grade 0.20 -0.20*** 5th Grade 0.16 -0.14*** 8th Grade 0.10 -0.22***
Standardized Mean Test Score: Reading
Kindergarten 0.23 -0.72*** 1st Grade 0.22 -0.43*** 3rd Grade 0.23 -0.35*** 5th Grade 0.21 -0.33*** 8th Grade 0.11 -0.34***
*** p<0.01, ** p<0.05, *p<0.1 Note: Monolinguals are those students who only spoke English language at home, while Bilinguals are student who spoke a non-English language at home. English Language Proficiency is measured with an Oral Language Development Scale (OLDS). The OLDS was administered to children in kindergarten and first grade. Children were identified not needing OLDS were children who were proficient in English and those needing the test has to achieved cut score, otherwise will have to be reassessed in first grade round. The OLDS were not administered beyond first grade because most children had passes the OLDS by the spring first-grade data collection. The stars in the "Bilingual" column indicate the statistical significance of the differences between the average standardized test score between monolingual and bilingual students.

29
Table 3. Estimated Effect of Language Spoken at Home on Grade-Level Average Scale Score
MATH Kindergarten 1st Grade 3rd Grade 5th Grade 8th Grade Non-English Language Spoken at Home
-0.083* 0.041 0.020 0.045* 0.048*
(0.048) (0.034) (0.033) (0.027) (0.028)
Passed OLDS in Kindergarten -0.124*** -0.004 0.027 0.030 -0.060**
(0.046) (0.034) (0.034) (0.027) (0.029)
Passed OLDS in 1st Grade -1.015*** 0.286*** -0.054 -0.002 -0.102**
(0.096) (0.072) (0.054) (0.046) (0.050)
Did not Pass OLDS by 1st Grade -0.757*** 0.017 -0.254*** -0.065 -0.144**
(0.088) (0.071) (0.064) (0.058) (0.063)
Hispanic -0.139*** -0.112*** -0.059** -0.027 -0.016
(0.034) (0.026) (0.025) (0.020) (0.022)
Asian & Pacific Islander -0.154*** -0.028 0.062* 0.073*** 0.025
(0.053) (0.036) (0.033) (0.024) (0.028) Family Income (thousands of dollars)
0.002*** 0.0003** 0.001*** 0.0003*** 0.0002*
(0.0003) (0.0002) (0.0001) (0.0001) (0.0001) Parent Education - Some High School
-0.720*** -0.242*** -0.380*** -0.185*** -0.175***
(0.052) (0.037) (0.036) (0.030) (0.033)
Parent Education - Some College -0.517*** -0.142*** -0.207*** -0.070*** -
0.020*** (0.037) (0.025) (0.023) (0.017) (0.017)
Gender (Male) 0.088*** 0.087*** 0.119*** 0.044*** -
0.060*** (0.020) (0.014) (0.013) (0.011) (0.012)
Previous Year Test Score 0.717*** 0.686*** 0.807*** 0.815***
(0.010) (0.008) (0.007) (0.008)
School Type - Catholic 0.153*** -0.071*** -0.117*** 0.010 0.098***
(0.030) (0.021) (0.020) (0.015) (0.016)
Observations 8,036 8,036 8,036 8,036 8,036
R-squared 0.209 0.585 0.619 0.754 0.720 *** p<0.01, ** p<0.05, *p<0.1
Note: Sample is weighted and it consists of all students that were present in the study from kindergarten to 8th grade. Dependent variable is the grade-by-subject level standardized test score (so the coefficient should be interpreted as standard deviation unit change). The independent variables are the language spoken at home dummy; dummies for each English Proficiency, Race, Parent Education and School Type; Family Income and dummy for Gender. The baseline category (constant) is white female monolingual students that were deemed not necessary for the OLDS assessment, attending public school and whose parent’s highest education are at least graduate school. Some of the terms/categories were not reported on the table for simplicity, including: the constant, Black dummy, Other Race dummy, Parent Education – Some Masters dummy, Parent Education – Some Masters dummy, and School Type – Public dummy. Robust standard errors are reported in parentheses below the coefficients.

30
Table 3. Continued
READING Kindergarten 1st Grade 3rd Grade 5th Grade 8th Grade
Non-English Language Spoken at Home
-0.032 -0.009 -0.020 0.005 0.056*
(0.045) (0.030) (0.034) (0.027) (0.033)
Passed OLDS in Kindergarten -0.064 -0.056* -0.0005 -0.002 0.070**
(0.047) (0.030) (0.033) (0.027) (0.033)
Passed OLDS in 1st Grade -2.596*** 1.594*** -0.196*** -0.145*** -0.099
(0.051) (0.066) (0.055) (0.047) (0.061)
Did not Pass OLDS by 1st Grade -2.469*** -0.742*** 0.805*** -0.156*** -0.109
(0.065) (0.046) (0.071) (0.059) (0.076)
Hispanic -0.060** -0.054** -0.122*** -0.017 -0.113***
(0.028) (0.023) (0.026) (0.020) (0.025)
Asian & Pacific Islander 0.233*** 0.037 -0.235*** -0.027 -0.004
(0.049) (0.032) (0.031) (0.027) (0.030) Family Income (thousands of dollars)
0.001*** 0.0006*** 0.0007*** 0.0002 0.0002
(0.0002) (0.0002) (0.0002) (0.0001) (0.0001) Parent Education - Some High School
-0.652*** -0.258*** -0.439*** -0.222*** -0.366***
(0.043) (0.034) (0.038) (0.032) (0.039)
Parent Education - Some College -0.439*** -0.130*** -0.239*** -0.109*** -0.169***
(0.035) (0.024) (0.024) (0.018) (0.019)
Gender (Male) -0.115*** -0.046*** -0.061*** 0.014 -0.093***
(0.017) (0.013) (0.014) (0.011) (0.013) Previous Year Test Score 0.772*** 0.668*** 0.778*** 0.708*** (0.012) (0.009) (0.007) (0.009)
School Type - Catholic 0.096*** 0.005 0.072*** 0.038** 0.096***
(0.026) (0.020) (0.021) (0.016) (0.018)
Observations 8,036 8,036 8,036 8,036 8,036 R-squared 0.404 0.654 0.572 0.721 0.630 *** p<0.01, ** p<0.05, *p<0.1
Note: Sample is weighted and it consists of all students that were present in the study from kindergarten to 8th grade. Dependent variable is the grade-by-subject level standardized test score (so the coefficient should be interpreted as standard deviation unit change). The independent variables are the language spoken at home dummy; dummies for each English Proficiency, Race, Parent Education and School Type; Family Income and dummy for Gender. The baseline category (constant) is white female monolingual students that were deemed not necessary for the OLDS assessment, attending public school and whose parent’s highest education are at least graduate school. Some of the terms/categories were not reported on the table for simplicity, including: the constant, Black dummy, Other Race dummy, Parent Education – Some Masters dummy, Parent Education – Some Masters dummy, and School Type – Public dummy. Robust standard errors are reported in parentheses below the coefficients.
31
Table 4. Estimated Effect of Language Spoken at Home on Grade-Level Average Scale Score, by Race
HISPANIC MATH
Kindergarten 1st Grade 3rd Grade 5th Grade 8th Grade Non-English Language Spoken at Home
-0.152*** 0.062 -0.023 0.046 0.024
(0.058) (0.045) (0.046) (0.040) (0.041)
Passed OLDS in Kindergarten -0.146*** -0.019 0.020 -0.023 -0.009
(0.055) (0.046) (0.047) (0.040) (0.042)
Passed OLDS in 1st Grade -0.446*** -0.053 -0.051 -0.048 -0.036
(0.079) (0.064) (0.069) (0.060) (0.065) Did not Pass OLDS by 1st Grade
-0.543*** 0.050 -0.307*** -0.067 -0.065
(0.087) (0.076) (0.075) (0.067) (0.072) Family Income (thousands of dollars)
0.004*** 0.0007 0.0003 0.0003 0.0008
(0.0008) (0.0009) (0.0007) (0.0004) (0.0005) Parent Education - Some High School
-0.314** -0.174 -0.282*** -0.112 -0.139*
(0.159) (0.115) (0.092) (0.076) (0.077) Parent Education - Some College
-0.233 -0.109 -0.207** -0.061 -0.068
(0.152) (0.108) (0.083) (0.069) (0.067)
Gender (Male) 0.009 0.103*** 0.090*** 0.095*** -0.054*
(0.041) (0.033) (0.034) (0.029) (0.032)
Previous Year Test Score 0.773*** 0.744*** 0.848*** 0.861***
(0.027) (0.022) (0.017) (0.018)
School Type - Catholic 0.179** -0.152*** -0.097* 0.020 0.052
(0.070) (0.053) (0.059) (0.044) (0.049)
Observations 1,320 1,320 1,320 1,320 1,320
R-squared 0.230 0.548 0.572 0.715 0.699 *** p<0.01, ** p<0.05, *p<0.1
Note: Sample is weighted and it consists of all Hispanic students that were present in the study from kindergarten to 8th grade. Dependent variable is the grade-by-subject level standardized test score (so the coefficient should be interpreted as standard deviation unit change). The independent variables are the language spoken at home dummy; dummies for each English Proficiency, Parent Education and School Type; Family Income and dummy for Gender. The baseline category (constant) is non-Hispanic female monolingual students that were deemed not necessary for the OLDS assessment, attending public school and whose parent’s highest education are at least graduate school. Some of the terms/categories were not reported on the table for simplicity, including: the constant, Parent Education – Some Masters dummy, Parent Education – Some Masters dummy, and School Type – Public dummy. Race was omitted from the regression because this is subgroup analysis that estimates the regression containing only Hispanics. Robust standard errors are reported in parentheses below the coefficients.

32
Table 4. Continued
HISPANIC READING
Kindergarten 1st Grade 3rd Grade 5th Grade 8th Grade Non-English Language Spoken at Home
-0.086* 0.036 -0.043 0.015 0.042
(0.049) (0.040) (0.047) (0.039) (0.051)
Passed OLDS in Kindergarten -0.110** -0.105*** 0.021 -0.015 0.113**
(0.049) (0.040) (0.048) (0.040) (0.051)
Passed OLDS in 1st Grade -2.522*** 1.740*** -0.111 -0.180*** -0.053
(0.050) (0.104) (0.071) (0.059) (0.080) Did not Pass OLDS by 1st Grade
-2.513*** -0.573*** 1.126*** -0.166** -0.037
(0.051) (0.088) (0.106) (0.070) (0.089) Family Income (thousands of dollars)
0.002*** 0.001** 0.001** 0.00056 0.0003
(0.0007) (0.0005) (0.0006) (0.0004) (0.0006) Parent Education - Some High School
-0.233 -0.008 -0.501*** -0.197*** -0.238***
(0.145) (0.090) (0.105) (0.069) (0.089) Parent Education - Some College
-0.124 0.0603 -0.375*** -0.118* -0.077
(0.141) (0.085) (0.097) (0.063) (0.076) Parent Education - Some Masters
-0.051 0.122 -0.252** -0.061 0.031
(0.137) (0.088) (0.102) (0.067) (0.080)
Gender (Male) -0.113*** -0.019 -0.121*** 0.049* -0.036
(0.031) (0.028) (0.035) (0.029) (0.037)
Previous Year Test Score 0.863*** 0.765*** 0.766*** 0.788***
(0.033) (0.025) (0.017) (0.022)
School Type - Private 0.121 0.184** -0.158** 0.074 0.111
(0.107) (0.085) (0.08) (0.079) (0.078)
School Type - Catholic 0.151** -0.012 0.096* 0.084* 0.069
(0.063) (0.048) (0.057) (0.044) (0.054)
Observations 1,320 1,320 1,320 1,320 1,320
R-squared 0.794 0.798 0.584 0.709 0.592 *** p<0.01, ** p<0.05, *p<0.1
Note: Sample is weighted and it consists of all Hispanic students that were present in the study from kindergarten to 8th grade. Dependent variable is the grade-by-subject level standardized test score (so the coefficient should be interpreted as standard deviation unit change). The independent variables are the language spoken at home dummy; dummies for each English Proficiency, Parent Education and School Type; Family Income and dummy for Gender. The baseline category (constant) is non-Hispanic female monolingual students that were deemed not necessary for the OLDS assessment, attending public school and whose parent’s highest education are at least graduate school. Some of the terms/categories were not reported on the table for simplicity, including: the constant, Parent Education – Some Masters dummy, Parent Education – Some Masters dummy, and School Type – Public dummy. Race was omitted from the regression because this is subgroup analysis that estimates the regression containing only Hispanics. Robust standard errors are reported in parentheses below the coefficients.
33
Table 4. Continued
ASIAN & PACIFIC ISLANDER MATH
Kindergarten 1st Grade 3rd Grade 5th Grade 8th Grade Non-English Language Spoken at Home
0.179 0.135* 0.078 0.063 0.080*
(0.112) (0.077) (0.067) (0.047) (0.047)
Passed OLDS in Kindergarten -0.172 -0.066 -0.078 0.045 -0.011
(0.112) (0.075) (0.069) (0.048) (0.048)
Passed OLDS in 1st Grade -3.125*** 1.467*** -0.103 0.0081 -0.094
(0.115) (0.215) (0.124) (0.086) (0.099) Did not Pass OLDS by 1st Grade
-2.751*** -1.168*** 0.468* -0.497** -0.222
(0.274) (0.196) (0.274) (0.247) (0.263) Family Income (thousands of dollars)
0.0008 -0.0002 0.001*** -0.0006** -0.0005*
(0.0009) (0.0004) (0.0004) (0.0003) (0.0003) Parent Education - Some High School
-0.941*** -0.329** -0.369*** -0.155 -0.135
(0.239) (0.141) (0.139) (0.099) (0.114) Parent Education - Some College
-0.919*** -0.221** -0.328*** -0.00881 -0.102
(0.136) (0.104) (0.087) (0.061) (0.063)
Gender (Male) 0.160* 0.057 0.090 0.032 -0.065
(0.084) (0.058) (0.057) (0.041) (0.046)
Previous Year Test Score 0.721*** 0.678*** 0.810*** 0.867***
(0.042) (0.035) (0.027) (0.033)
School Type - Catholic 0.230* 0.012 -0.031 -0.074 0.190***
(0.133) (0.098) (0.096) (0.059) (0.060)
Observations 497 497 497 497 497
R-squared 0.553 0.661 0.643 0.786 0.755 *** p<0.01, ** p<0.05, *p<0.1
Note: Sample consists of all Asian and Pacific Islander students that were present in the study from kindergarten to 8th grade. Dependent variable is the grade-by-subject level standardized test score (so the coefficient should be interpreted as standard deviation unit change). The independent variables are the language spoken at home dummy; dummies for each English Proficiency, Parent Education and School Type; Family Income and dummy for Gender. The baseline category (constant) is non-Asian and Pacific Islander female monolingual students that were deemed not necessary for the OLDS assessment, attending public school and whose parent’s highest education are at least graduate school. Some of the terms/categories were not reported on the table for simplicity, including: the constant, Parent Education – Some Masters dummy, Parent Education – Some Masters dummy, and School Type – Public dummy. Race was omitted from the regression because this is subgroup analysis that estimates the regression containing only Asian and Pacific Islander. Robust standard errors are reported in parentheses below the coefficients.

34
Table 4. Continued
ASIAN & PACIFIC ISLANDER READING
Kindergarten 1st Grade 3rd Grade 5th Grade 8th Grade Non-English Language Spoken at Home
0.186* 0.020 0.001 0.024 0.136**
(0.112) (0.065) (0.061) (0.057) (0.054)
Passed OLDS in Kindergarten -0.167 -0.104* -0.036 -0.024 0.049
(0.116) (0.062) (0.060) (0.059) (0.054)
Passed OLDS in 1st Grade -3.015*** 1.232*** -0.329*** -0.112 -0.033
(0.120) (0.175) (0.094) (0.110) (0.112) Did not Pass OLDS by 1st Grade
-2.758*** -1.200*** 0.373 -0.545*** 0.105
(0.284) (0.165) (0.234) (0.143) (0.323) Family Income (thousands of dollars)
-1.65e-05 0.0006* 0.0003 0.0002 -0.0005*
(0.001) (0.0003) (0.0003) (0.0004) (0.0003) Parent Education - Some High School
-1.084*** -0.511*** -0.410*** -0.222** -0.361***
(0.225) (0.132) (0.120) (0.109) (0.114) Parent Education - Some College
-1.003*** -0.439*** -0.284*** -0.137* -0.281***
(0.162) (0.096) (0.082) (0.075) (0.070)
Gender (Male) -0.184** -0.002 -0.055 -0.085* -0.021
(0.088) (0.056) (0.052) (0.048) (0.049)
Previous Year Test Score 0.624*** 0.605*** 0.789*** 0.732***
(0.028) (0.028) (0.031) (0.031)
School Type - Catholic 0.172 0.155* 0.097 0.030 0.035
(0.135) (0.088) (0.081) (0.064) (0.067)
Observations 497 497 497 497 497
R-squared 0.524 0.690 0.645 0.706 0.671 *** p<0.01, ** p<0.05, *p<0.1
Note: Sample consists of all Asian and Pacific Islander students that were present in the study from kindergarten to 8th grade. Dependent variable is the grade-by-subject level standardized test score (so the coefficient should be interpreted as standard deviation unit change). The independent variables are the language spoken at home dummy; dummies for each English Proficiency, Parent Education and School Type; Family Income and dummy for Gender. The baseline category (constant) is non-Asian and Pacific Islander female monolingual students that were deemed not necessary for the OLDS assessment, attending public school and whose parent’s highest education are at least graduate school. Some of the terms/categories were not reported on the table for simplicity, including: the constant, Parent Education – Some Masters dummy, Parent Education – Some Masters dummy, and School Type – Public dummy. Race was omitted from the regression because this is subgroup analysis that estimates the regression containing only Asian and Pacific Islander. Robust standard errors are reported in parentheses below the coefficients.
35
Table 5. Estimated Effect of Non-English Language Spoken at Home on Grade-Level Average Scale Score by Omitting Categories or Variables
LANGUAGE SPOKEN AT HOME COEFFICIENTS (1) (2) (3) (4) (5) (6)
MATH Kindergarten -0.083* -0.087* -0.167*** -0.084* -0.343*** -0.658***
-0.048 -0.048 -0.048 -0.048 -0.041 -0.034 1st Grade 0.041 0.043 0.012 -0.021 0.081*** -0.473***
-0.034 -0.034 -0.033 -0.047 -0.028 -0.032 3rd Grade 0.02 0.023 0.009 0.004 -0.002 -0.398***
-0.031 -0.033 -0.032 -0.048 -0.027 -0.033 5th Grade 0.045* 0.045 0.045* 0.048 0.049** -0.307***
-0.027 -0.027 -0.026 -0.049 -0.022 -0.034 8th Grade 0.048* 0.045 0.034 0.038 -0.0001 -0.311***
-0.028 -0.03 -0.027 -0.047 -0.025 -0.036
READING Kindergarten -0.032 -0.034 -0.034 -0.031 -0.661*** -0.951***
-0.045 -0.045 -0.049 -0.045 -0.049 -0.048 1st Grade -0.009 -0.008 -0.033 -0.032 0.091*** -0.649***
-0.03 -0.03 -0.029 -0.044 -0.031 -0.041 3rd Grade -0.02 -0.022 -0.102*** -0.04 0.014 -0.574***
-0.034 -0.034 -0.033 -0.046 -0.028 -0.033 5th Grade 0.005 0.004 -0.01 -0.027 -0.031 -0.543***
-0.027 -0.027 -0.026 -0.045 -0.023 -0.033 8th Grade 0.056* 0.053 0.018 0.038 0.056** -0.458***
-0.033 -0.033 -0.031 -0.047 -0.028 -0.036 *** p<0.01, ** p<0.05, *p<0.1 (1) Original Model (2) Omitting School Climate and Curriculum Factors (3) Omitting Home & Community Factors (4) Omitting Student Characteristics (5) Omitting English Language Proficiency (6) Omitting all Control Variables

36
Table 6. Distribution of Primary Languages Spoken at Home
PRIMARY LANGUAGE SPOKEN AT HOME
Total Population: 21,409
Suppressed: 12,600
ECLS-K (N=8,809)
Sample (N=7,508)
English 8.71% 8.18% Arabic 0.20% 0.17% Chinese 0.44% 0.47% Filipino 0.22% 0.19% French 0.02% 0.03% German 0.01% 0.01% Greek 0.01% 0.01% Italian 0.00% 0.00% Japanese 0.02% 0.00% Korean 0.07% 0.07% Polish 0.11% 0.13% Portuguese 0.06% 0.04% Spanish 6.63% 6.10% Vietnamese 0.19% 0.17% Other Languages 0.08% 0.08% African Languages 0.43% 0.43% Eastern European Languages 0.18% 0.08% Native American Languages 0.01% 0.01% Sign Languages 0.00% 0.00% Middle Eastern Languages 0.10% 0.11% Western European 0.01% 0.01% Indian Sub continental Languages 0.24% 0.24% South East Asian Languages 0.49% 0.43% Pacific Islander Languages 0.03% 0.03% Not Applicable / Missing 81.72% 83.02%
NOTE: Missing variable is more than 80%. Only 8,809 responses were available publicly, the other 12,000 were suppressed. The percentages reported in each column are based on the population/sample size indicated in parenthesis. The “Sample” column is to simply show a hypothetical distribution of primary language used at home if same restriction were applied in choosing my sample.

37
Figure 2. Distribution of Monolingual and Bilingual Math IRT Scale Scores, by Grade

38

39
40
Figure 3. Distribution of Monolingual and Bilingual Reading IRT Scale Scores, by Grade

41
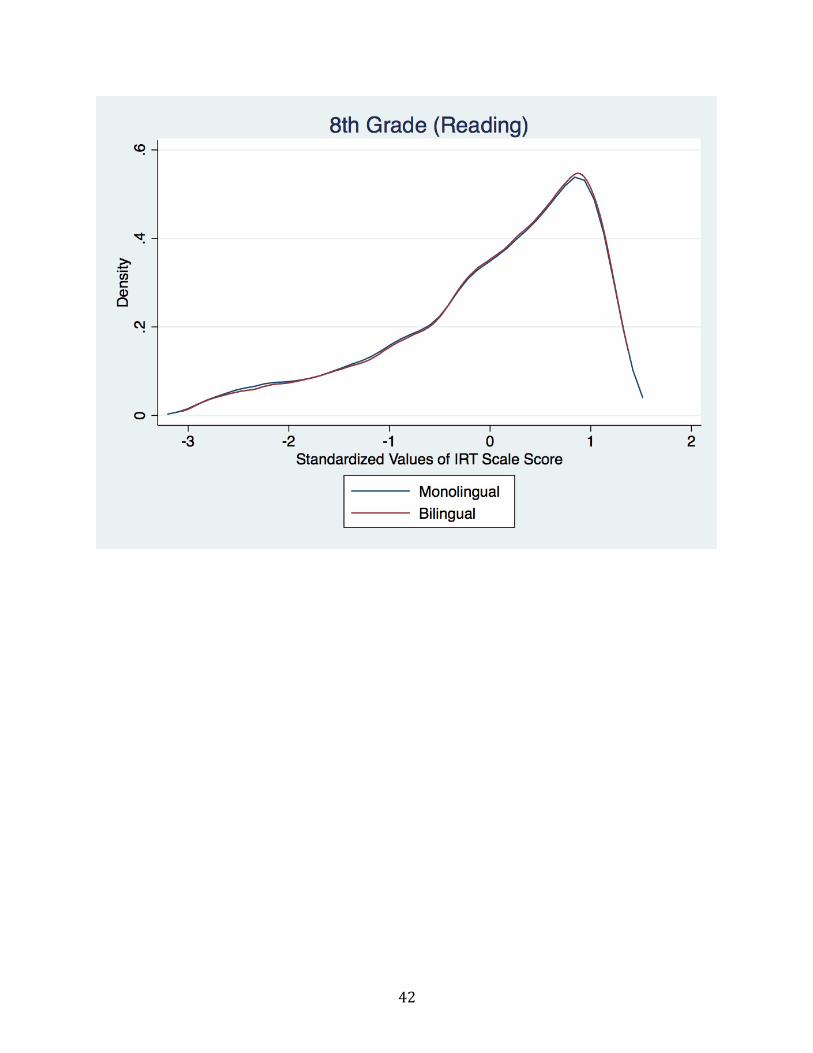
42

43
REFERENCES
Asher, J.J., & Garcia R. (1969). The Optimal Age to Learn a Foreign Language. The Modern Language Journal. Vol. 53, No. 5 (May, 1969), pp. 334-341. DOI: 10.2307/323026
Baker, C. (2011). Foundations of Bilingual Education and Bilingualism (5th ed.). Bristol, United Kingdom: Multilingual Matters.
Ben-Zcev, S. (1977). The influence of bilingualism on cognitive strategy and cognitive development. Child Development. Vol. 48, No. 3 (Sept., 1977), pp. 1009-1018
Buriel, R., & Cardoza, D. (1988). Sociocultural Correlates of Achievement Among Three Generations of Mexican American High School Seniors. American Educational Research Journal. Vol. 25, No. 2, pp. 177-192. DOI: 10.3102/00028312025002177
Bialystock, E. & Craik, F.I.M. (2010). Cognitive and Linguistic Processing in the Bilingual Mind. Ontario, Canada. Current Directions in Psychological Science. Vol. 19, No. 1, pp. 19-23. DOI: 10.1177/0963721409358571
Bronfenbrenner, U. (1978). “The Social Role of the Child in Ecological Perspective. Vol. 7, No. 1, pp. 4–20. Retrieved from: http://www.zfs-online.org/index.php/zfs/article/viewFile/2344/1881
Dweck, C.S. (2010). “Mindsets and Equitable Education”. Principal Leadership. Vol. 10, No. 5, pp. 26-29. Retrieved from: http://www.epiconline.org/mind-sets-and-equitable-education/
Ensminger, M. E., & Slusarcick, A. L. (1992). Paths to High-School Graduation or Dropout: a Longitudinal Study of a 1st-grade Cohort. Sociology of Education. Vol. 65, No. 2, pp. 95-113. DOI: 10.2307/2112677
Entwisle, D. R., & Alexander, K. L. (1993). Entry into School: The Beginning School Transition and Educational Stratification in the United States. Annual Review of Sociology. Vol. 19, pp. 401-423. DOI: 10.1146/annurev.so.19.080193.002153
Esptein D. (1998). Real boys don’t work: Underachievement, Masculinity, and the Harassment of the “Sissies”. In: Epstein D, Elwood J, Hey V, Maw J, editors. Failing Boys?: Issues in Gender and Achievement. Philadelphia: Open University, 1998. pp. 177–200.
Farkas, G. (2003). Racial disparities and discrimination in education: What do we know, how do we know it, and what do we need to know?. Teachers College Record. Vol. 105, No. 6 (Aug., 2003), pp. 1119-1146. DOI: 10.1111/1467-9620.00279
44
Fulgini, A.J. (1997). The Academic Achievement of Adolescents from Immigrant Families: The Roles of Family Background, Attitudes, and Behavior. Child Development.Vol. 68, No. 2, (Apr., 1998). pp. 351-363. DOI: 10.1111/j.1467-8624.1997.tb01944.x
Grolnick, W. S., Friendly, R. W., & Bellas, V. M. (2009). Parenting and Children’s Motivation
at School. In K. R. Wentzel & A. Wigfield (Eds.), Handbook of Motivation at School. pp. 279-300. New York & London: Routledge.
Han, W. (2012). Bilingualism and Academic Achievement. Child Development. Vol. 83, No. 1, pp. 300-321. DOI: 10.1111/j.1467-8624.2011.01686.x
Hoff, E. (2013). Interpreting the Early Language Trajectories of Children from Low-SES and Language Minority Homes: Implications of Closing Achievement Gaps. Dev Psychol. Vol 49. No. 1 (Jan., 2013), pp 4-14. DOI: 10.1037/a0027238
Hyde J.S., & Kling, K.C. (2001). Women, Motivation, and Achievement. Psychology of Women Quarterly. Vol. 25, No. 4 (Dec., 2001). pp. 364–378. DOI: 10.1111/1471-6402.00035
Jiang, Wenying (1999). The Relationship between Culture and Language. ELT Journal Vol. 54, No. 4 (2000), pp. 328-334. DOI: 10.1093/elt/54.4.328
Kao, G., & Thompson, J. S. (2003). Racial and Ethnic Stratification in Educational Achievement and Attainment. Annual Review of Sociology. Vol. 29 (June, 2003), pp. 417-442. DOI: 10.1146/annurev.soc.29.010202.100019
Kastner J.W., May, W. & Hildman L. (2001), Relationship Between Language Skills and Academic in First Grade. Perceptual and Motor Skills. Vol. 92, No. 2 (Apr. 2001), pp. 381-390. DOI: 10.2466/pms.2001.92.2.381
Lambert, W.E. & Taylor, D. M. (1981). Language in the Education of Ethnic Minority Immigrants: Issues, Problems and Methods. Paper presented at the conference on The Education of Ethnic Minority Immigrants. Miami, FL
Leeson, P., Ciarrochi, J. & Heave, P.C.L. (2008). Cognitive Ability, Personality and Academic Performance. Personality and Individual Differences. Vol. 45, Issue 7 (Nov., 2008), pp. 630-635. DOI: doi:10.1016/j.paid.2008.07.006
Lemons, G.C., Abad, F.J., Almeida, L.S., and Colom, R. (2014). Past and Future Academic
Experiences are Related with Present Scholastic Achievement when Intelligence is Controlled. Learning and Individual Differences. Vol. 32 (May, 2014), pp. 148–155. DOI:10.1016/j.lindif.2014.01.004
Mariam, V., Shook, A. & Schroeder, S.R. (2013). Bilingual Two-Way Immersion Programs Benefit Academic Achievement. Evanston, IL. Bilingual Research Journal. Vol. 36, pp.167–186. DOI: 10.1080/15235882.2013.818075

45
Mickelson R.A. (1989). Why Does Jane Read and Write so Well? The Anomaly of Women’s Achievement. Sociology of Education. Vol. 62, No. 1 (Jan., 1989), pp. 47-63. DOI: 10.2307/2112823
Mitchel, C. (2016, February). Spanish, Arabic, Chinese Are the Top Home Languages for ELL in U.S. Schools. Education Week. Retrieved from http://blogs.edweek.org/edweek/learning-the-language/2016/02/spanish_arabic_chinese_top_lis.html
Mouw, T., and Xie. Y. (1999). Bilingualism and the Academic Achievement of First- and Second-Generation Asian Americans: Accommodation with or Without Assimilation?. American Sociological Review. Vol. 64, No. 2 (May, 1999), pp. 232-252. DOI: 10.2307/2657529
National Center for Education Statistics. Early Childhood Longitudinal Program 1988-99 (ECLS-K 1988-99). U.S. Department of Education – Institute of Education Sciences, NCES. Retrieved from: https://nces.ed.gov/ecls/
Paret, M. (2006). Language Background and Early Academic Achievement: Disentangling Language-minority Status, Social Background and Academic Engagement. Center for Study of Evaluation. Technical Report 679. Retrieved from http://files.eric.ed.gov/fulltext/ED518684.pdf
Rumberger, R.W., & Larson, K.A. (1998). Toward Explaining Differences in Educational Achievement among Mexican American Language-minority Students. Sociology of Education. Vol. 71, No. 1 (Jan., 1998), pp. 68-92. DOI: 10.2307/2673222
Saville-Troke, M. (1984). What Really Matters in Second Language Learning for Academic Achievement?. Tesol Quarterly. Vol. 18, No. 2 (June, 1984), pp. 199-219. DOI: 10.2307/3586690
Sbrocco, R. (2009). Student Academic Engagement and the Academic Achievement Gap between Black and White Middle School Students: Does Engagement Increase Student Achievement?. Minneapolis, MN: University of Minnesta. Retrieved from http://conservancy.umn.edu/handle/11299//57326
Schmid, C. L. (2001). Educational Achievement, Language-minority Students, and the New Second Generation. Sociology of Education. Vol. 74, pp. 71-87. DOI: 10.2307/2673254
Sirin, S.R. (2005). Socioeconomic Status and Academic Achievement: A Meta-Analytic Review of Research. Review of Educational Research. Vol 75, No. 3, pp. 417-453. Retrieved from http://steinhardt.nyu.edu/scmsAdmin/media/users/lec321/Sirin_Articles/Sirin_2005.pdf

46
Sylva K. & Wiltshire, J. (1993). The Impact of Early Learning on Children's later Development a Review prepared for the RSA Inquiry ‘Start Right’. European Early Childhood Education Research Journal. Vol. 1, Issue 1, pp. 17-40. DOI: 10.1080/13502939385207331
The World Bank Group (2011). Nutrition. Early Child Development. The World Bank Group. Retrieved from http://web.worldbank.org/WBSITE/EXTERNAL/TOPICS/EXTCY/EXTECD/0,,contentMDK:20207804~menuPK:528430~pagePK:148956~piPK:216618~theSitePK:344939,00.html
Warren, J. R. (1996). Educational Inequality among White and Mexican-Origin Adolescents in the American southwest: 1990. Sociology of Education. Vol. 69, No. 2 (Apr. 1996), pp. 142-158
Wiley, T.G., & Wright, W.E. (2004). Against the Undertow: Language-minority Education Policy and Politics in the “Age of Accountability”. Educational Policy. Vol. 18, No. 1, pp. 142-168. DOI: 10.1177/0895904803260030
Zong, J., and Batalova J. (2016). Frequently Requested Statistics on Immigrants and Immigration in the United States. Migration Policy Institute. Retrieved from: http://www.migrationpolicy.org/article/frequently-requested-statistics-immigrants-and-immigration-united-states


![Bilingualism 2 [Kompatibilitetsläge] - Linköping University · Bilingualism & Bilingualism & diglossiadiglossia bilingualism: “The capacity to make alternate (and sometimes mixed)](https://img.dokumen.tips/doc/110x75/5e1d0074d0f1bf7f1d5d3695/bilingualism-2-kompatibilitetslge-linkping-university-bilingualism-.jpg)


![Bilingualism Updated]](https://img.dokumen.tips/doc/110x75/577d391b1a28ab3a6b99158d/bilingualism-updated.jpg)
