Embed Size (px)
Citation preview

Does “Being Chosen to Lead” Induce Non-Selfish Behavior? Experimental Evidence on Reciprocity*
Allan Drazen Erkut Y. Ozbay University of Maryland, University of Maryland NBER, CEPR
This draft: September 25, 2018
ABSTRACT: We present experimental evidence that policies chosen by leaders depend on whether they were elected or appointed, and that this difference stems from how they are chosen per se, rather than on other explanations given in empirical studies. We find that elected leaders are significantly more likely to choose a non-selfish policy than leaders who are appointed. Elected leaders who act non-selfishly will favor the voter over the losing candidate, while appointed leaders show no tendency to favor the voter over the losing candidate. Our results provide support for the view that non-selfish behavior of leaders reflects a reciprocity motive; candidates do not simply implement their own preferences once in office, as suggested by the basic citizen-candidate model. JEL classification: C91, D64, D72 Keywords: Leaders, Reciprocity, Citizen-Candidate
* We wish to thank Marina Agranov, Prateik Dalmia, Matthew Ellman, Tom Palfrey, Leeat Yariv, seminar participants at the European University Institute, the Collegio Carlo Alberto, the Vancouver School of Economics, University of Michigan, UT Dallas, the CalTech Conference on Experimental Political Economy, Barcelona GSE Summer Forum, and the University of Maryland for very useful comments. Danyan Zha, Ozlem Tonguc and Ian Chadd provided excellent research assistance. Previously circulated as “How Do Elected and Appointed Policymakers Act When in Office? Experimental Evidence on Citizens, Candidates, and Leaders.”

1
1. Introduction Individuals often act in “other-regarding” ways in choosing their actions, taking account
of the welfare of others, rather than simply their own welfare. This may be especially true when
individuals are put in positions where they are explicitly tasked with making decisions that affect
others. That is, knowing they have been chosen for a position where the welfare of other people
depends on their decisions may cause them to be more other-regarding. For example, a political
leader may feel responsible toward citizens simply because of her position, that is, independent
of any incentives or other reasons (such as ‘screening’ to weed out candidates who aren’t socially
minded) that would induce good behavior. In other words, the fact of holding a position of
responsibility may induce one to take account of others, akin to the argument that one chosen
as a fiduciary will act in the best interests of the beneficiary due to her position.
One may then ask whether the way in which a leader was chosen for her position may
affect her behavior towards those for whom she is responsible. More specifically, does a leader
who was elected by those for whom she makes decisions act more in their interest than one
who was appointed by others? Both election and appointment are commonly used not only in
politics and government, but also in many other organizations: student organizations, religious
hierarchies, businesses, academic departments, etc. Because our interest is in discovering
whether the way in which a leader is chosen may in itself affect a leader’s behavior, we design an
experiment to eliminate other explanations of why elected leaders may be more other-regarding
– which is what we find – such as re-election concerns, selection of different types of leaders
via election versus appointments, ‘messaging’ by or greater ‘legitimacy’ of elected leaders, etc.
There are a number of empirical studies on differences in outcomes when policy-makers
are elected versus appointed, but the results often do not shed light on whether it is the way
that policy-makers came to office per se that accounts for these differences as opposed to some
of the explanations given just above. Many studies suggest differences may be due to re-election
or re-appointment incentives, so that differences reflect how policy-makers are retained in office
rather than how they originally came to office. In the case of judges, Gordon and Huber (2007)
find that near elections, judges facing re-election give harsher sentences, which they argue
represents an obvious electoral motive. Lim (2013) presents evidence strongly supporting the
importance of such electoral incentives in explaining different outcomes for elected versus

2
appointed judges. In our experiment, however, there is only a single “term of office” so that re-
election or re-appointment concerns cannot play a role.
Second, there is evidence that differences in behavior may reflect selection effects, that
is, different characteristics of policy-makers due to the process by which they are chosen, rather
than effects of the choice process per se. In the case of judges, Lim (2013) argues that appointed
judges are of higher quality, as do Choi, Gulati, and Posner (2010) and Iaryczower, Lewis and
Shum (2013). Besley and Payne (2013) find that when judges are appointed, there are
significantly fewer anti-discrimination charges being filed, which they argue is due to elected
judges being more likely to rule in favor of plaintiffs in such cases. This is because elected judges
are more likely to have pro-employee preferences due to selection, as well as more likely to find
in favor of employees due to re-election incentives. Lim also finds that different ways of
choosing judges affects the homogeneity of their preferences as well as the apparent ability of
judges. Besley and Coate (2003) find that decisions of elected regulators are more likely to reflect
preferences of voters (as opposed to the regulated industry) than are decisions of appointed
regulators. As in the case of judges, the selection and incentives of the former type of regulators
are central to explaining different outcomes.1 Burden, et al. (2010) find that election officials
who are elected are more in favor of policies thought to promote voter turnout than those who
are appointed, as the latter are more insulated from voter preferences, while “elected officials
are more likely to express attitudes and generate outcomes that reflects their direct exposure to
the policy preferences of voters”. Their study does not address the question of whether this
reflects selection effects or attitudes generated by the method by which the officials came to
their job. 2 To summarize, existing empirical literature, while documenting differences in
outcomes under elected versus appointed policy-makers, gives little insight into the effect of the
method of coming to office in itself on their behavior. By eliminating other influences, our
1 They point out that electoral effects on appointed regulators are diffused in that while voters elect the politicians who appoint the regulators (so that there are disciplining and selection effects in theory), regulatory decisions are only one of many issues on which voters choose directly elected officials. 2 Baldwin and Mvukiyehe (2011) and Martinez-Bravo (2014) find that when elections are introduced in previously non-democratic settings, elected leaders choose more community-oriented policies. Grossman (2014) ran a field experiment in Uganda with the leaders of farmer associations and residents of the counties they cover, and found that elected leaders of farmer associations act more pro-socially than the appointed leaders to the residents who are members of the association, but both elected and appointed leaders act equally selfishly against a non-member resident.
3
experimental framework allows us to address this question.
In so doing, our framework allows us to focus on another explanation for greater other-
regarding behavior by elected than appointed leaders, namely reciprocity of an elected leader to
the voter who elected her. Reciprocity is known to be an important motivator of individual
behavior in general (see Rabin [1993], Dufwenberg and Kirchsteiger [2004], as well as Fehr and
Gächter [2000] for a survey on the relevance of reciprocity in economics). Although some might
argue that politicians are (by their nature?) purely self-interested, behavioral motives for leaders’
actions are certainly reasonable, but largely unexplored in the political economy literature. The
possibility of reciprocity by an elected leader to voters is certainly recognized in political
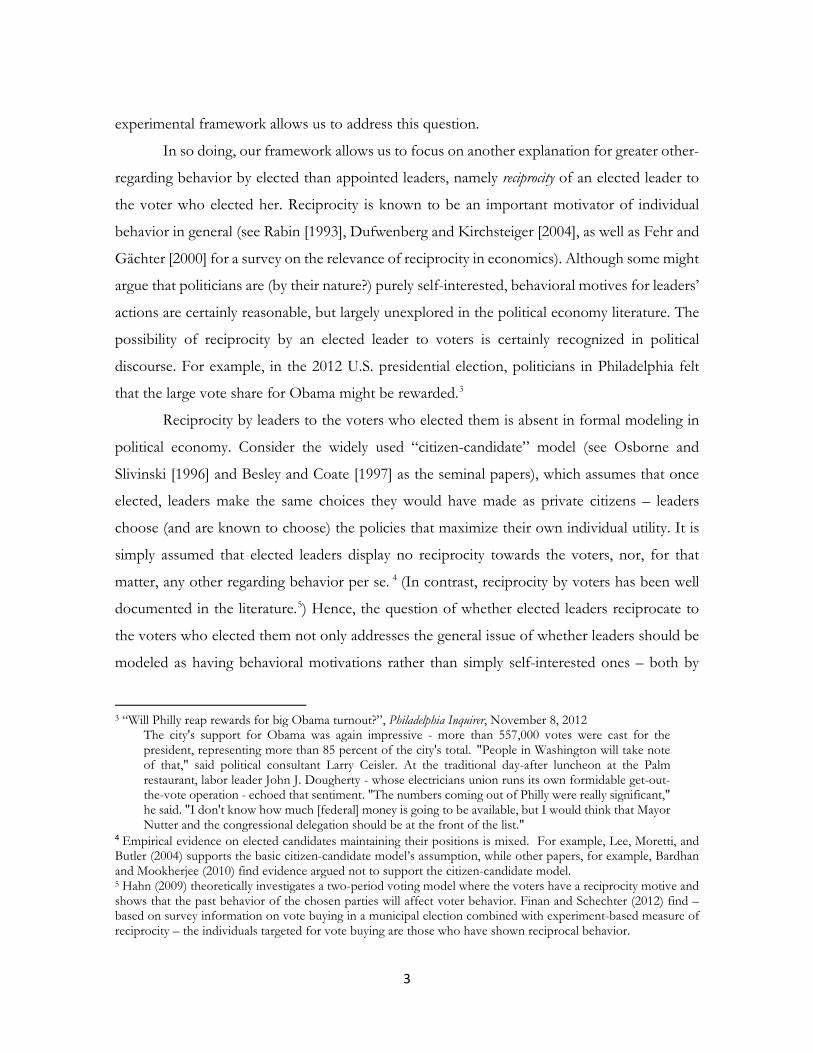
discourse. For example, in the 2012 U.S. presidential election, politicians in Philadelphia felt
that the large vote share for Obama might be rewarded.3
Reciprocity by leaders to the voters who elected them is absent in formal modeling in
political economy. Consider the widely used “citizen-candidate” model (see Osborne and
Slivinski [1996] and Besley and Coate [1997] as the seminal papers), which assumes that once
elected, leaders make the same choices they would have made as private citizens – leaders
choose (and are known to choose) the policies that maximize their own individual utility. It is
simply assumed that elected leaders display no reciprocity towards the voters, nor, for that
matter, any other regarding behavior per se. 4 (In contrast, reciprocity by voters has been well
documented in the literature.5) Hence, the question of whether elected leaders reciprocate to
the voters who elected them not only addresses the general issue of whether leaders should be
modeled as having behavioral motivations rather than simply self-interested ones – both by
3 “Will Philly reap rewards for big Obama turnout?”, Philadelphia Inquirer, November 8, 2012
The city's support for Obama was again impressive - more than 557,000 votes were cast for the president, representing more than 85 percent of the city's total. "People in Washington will take note of that," said political consultant Larry Ceisler. At the traditional day-after luncheon at the Palm restaurant, labor leader John J. Dougherty - whose electricians union runs its own formidable get-out-the-vote operation - echoed that sentiment. "The numbers coming out of Philly were really significant," he said. "I don't know how much [federal] money is going to be available, but I would think that Mayor Nutter and the congressional delegation should be at the front of the list."
4 Empirical evidence on elected candidates maintaining their positions is mixed. For example, Lee, Moretti, and Butler (2004) supports the basic citizen-candidate model’s assumption, while other papers, for example, Bardhan and Mookherjee (2010) find evidence argued not to support the citizen-candidate model. 5 Hahn (2009) theoretically investigates a two-period voting model where the voters have a reciprocity motive and shows that the past behavior of the chosen parties will affect voter behavior. Finan and Schechter (2012) find – based on survey information on vote buying in a municipal election combined with experiment-based measure of reciprocity – the individuals targeted for vote buying are those who have shown reciprocal behavior.

4
virtue of having been chosen to lead in itself, and also depending on how they were chosen. It
also induces us to rethink basic assumptions about existing political economy models of leader
behavior.
To study these issues, we focus on a two-stage citizen-candidate model with two citizens
who are candidates and one other “ordinary” citizen, who votes for one of the candidates in the
case of elections. All the individuals have single-peaked preferences on a (Downsian) line around
a most preferred point, the individual’s “type.” In the first stage the leader is determined by
either election or appointment; in the second stage, the leader chooses a policy position on the
line (which needn’t be her type) that yields a payoff to each of the three individuals negatively
proportional to the distance between the policy and the person’s type. We hypothesize several
possible sorts of leader behavior. A self-interested leader implements her type as the policy,
consistent with the standard citizen-candidate model. According to simple altruism, a leader
implements a policy different from her type, but with no difference across treatments. In
contrast, reciprocity means that an elected leader would choose policy favoring the voter –
who is known to be pivotal to the winning candidate’s election, whereas an appointed leader
would not favor the ordinary citizen over the losing candidate.
Our main results are as follows. Consistent with other experimental results on the
dictator game 6, we find that leaders (i.e., proposers) do not always implement their own
preferences once in office, as assumed by the standard citizen-candidate model. However, the
extent of non-selfish behavior depends on how the leader was chosen. Elected leaders are less
likely to choose policies to maximize their own material payoff than appointed leaders. The
direction of non-selfish behavior also differs between elected and appointed leaders. Consistent
with reciprocal behavior, elected leaders choose policies that favor the voter rather than the
losing candidate, while when a leader is appointed there is no statistically significant tendency
to favor the voter over the losing candidate. Hence, we can conclude that “being elected to lead”
is in itself sufficient to induce pro-social behavior, but not because elected leaders differ in their
underlying characteristics from appointed ones.
6 In a dictator game a “proposer” is given a sum of money that he can keep or share with a passive “receiver”, after which the game ends (for a survey see Camerer [2003], and for giving under uncertainty see Brock et al. [2013]).

5
In addition to our main question, our experimental design allows us to address a further
central issue in reciprocity, namely whether material sacrifice is required for an action to be
considered kind, and thus generate reciprocity. This is the case in the experimental literature.
For example, in a typical gift-exchange experiment, the employer’s wage offer increases the
payoff of the worker while it decreases her own payoff (see e.g. Fehr, Kirchsteiger and Riedl
[1993]). In our experiment, since voting is costless, voters make no material sacrifice in voting
for the leader (which increases the leader’s utility by allowing her to decide the policy).
Nonetheless, the elected leader reciprocates to the voter. It is also important to note that voting
for the candidate whose views are closest may simply reflect the voter’s self-interest, but a
winning candidate gets a higher payoff nonetheless. Therefore, any reciprocity by that candidate
– as is observed in our experiment – cannot be argued to be driven by the voter’s good
intentions (see e.g. Charness and Levine [2007], and Falk, Fehr and Fischbacher [2008]).
The rest of the paper is organized as follows. Section 2 reviews the related experimental
literature. In Section 3, we present our experimental design. In Section 4, we present our results.
In Section 5, we interpret our results, and Section 6 concludes. The instructions used in the
experiments can be found in Appendix.
2. Related Experimental Literature The second stage of our experiment resembles the standard dictator game. Although
the payoff of the dictator is maximized by acting selfishly in both the one-stage and in our two-
stage game, the effects of selfish and non-selfish behavior on other people are different. First,
in our set-up in which the leader chooses a point on the policy line rather than a transfer, even
acting selfishly would yield a positive payoff to others, and this amount varies depending on the
type of the others and the policy choice. When the type of one individual is the same as the
leader’s, it is even possible that person benefits more from the selfish behavior of the leader.
Secondly, by acting non-selfishly in our set-up, the leader may hurt someone as compared to
acting selfishly. For example, if the leader’s type is in between the types of the citizen and the
losing candidate, any policy toward one person’s type is worse for the other person than the
leader choosing her own type as the policy. Additionally, by acting non-selfishly, the leader may
unavoidably increase the payoff of one individual while trying to increase the payoff another

6
one (this occurs when two individuals are on the same side). There are a number of
experimental papers that use the dictator game to study the implications of delegating decisions
by election versus appointment. These papers may be characterized along two dimensions: the
delegation alternatives considered; and the mechanism through which an election is found to
produce better outcomes.
On the first, the closest papers to ours in comparing elected to randomly appointed
leaders are Brandts, Güth, and Stiehler (2006), Corazzini, et al. (2014), and Brandts, Cooper,
and Weber (2015). The first paper, like ours, considers a one-shot 3-person game where one
player chooses either of the other two to divide a pie, where the allocation is compared to the
one chosen by a randomly selected leader. Corazzini, et al. (2014) also compares division of a
pie by an elected versus a randomly selected leader, but where subjects are divided into groups
of seven, two candidates and five voters. Each voter gets an equal share of any allocation made
to voters as a group. Brandts, et al. (2015) are interested in “turnaround” of a firm due to
workers increasing their effort levels in a common production task. They consider a group of
five “employees” in a firm choosing effort levels in the first stages of a game, where
subsequently a leader (who may try to motivate them) is chosen by them either by election or
random appointment (or there is no leader chosen). There are also other papers that consider
the effect of delegation, but in different games (such as a public goods game with contributions)
and different set-ups (see e.g. Charness, et al. [2012]).
Perhaps more important than the form of the game per se is the difference between our
paper and others in the mechanism behind the effect of elections on voter welfare. There are
three general lines of argument on why elections produce better results: selection of leader types
seen as “better” ex ante by voters; leader actions once elected not clearly tied to leader
characteristics; and, voter behavior.
Selection, standard in analysis of elections, refers to the argument that elections lead to
choice of better leaders relative to random appointment, for example, leaders who are more
competent or who are more socially-minded. The latter possibility is important in Brandts,
Güth, and Stiehler (2006) and in Hamman, Weber and Woon (2011). In the former paper, all
three group members answer a personality questionnaire whose results are then distributed
before election of the leader, so that potential candidates can signal (falsely or not) their

7
benevolence. They find (as we do) that elected leaders give more of the pie than randomly
selected ones, with the selector (analogous to the voter in our model) being treated more
generously than the third player. The latter paper considers a public goods game played for a
number of periods with voluntary contributions. Participants were informed about the average
individual public good contributions of each group member in these rounds before voting on a
leader who then decides on the level of the public good.
In terms of leader actions, a key paper is Brandts, Cooper, and Weber (2015), where leaders
(elected or randomly selected) can send messages to group members. They find that elected
leaders are able to improve group member effort more than randomly selected ones because
they put more effort into messaging, sending more messages relevant to “employee” effort than
do randomly selected leaders. 7 Corazzini, et al. (2014) gives a different type of argument about
the effect of messages and leader behavior. Candidates make non-binding “campaign promises”
on the amount they would distribute if elected. The paper finds that such promises affect voting
and that promises, though non-binding, are partially fulfilled. Hence, the ability to send
messages before elections improves voter welfare relative to random selection and to elections
where no messages can be sent. It is argued that promises lead to higher payoffs to voters
because leaders have a cost of lying.
The argument that elections lead to better outcomes because of voter behavior concerns
the greater legitimacy conferred on leaders who are elected. This argument is explored by Dal
Bó, Foster and Putterman (2010) (and by Olken [2010] in a field experiment). Dal Bó, et al.
consider a game where participants vote whether to modify the payoffs of a Prisoners' Dilemma
game, after which a computer decides whether to consider the vote or not. (If the computer
decides not to consider, then Prisoner's Dilemma game or modified game are determined
randomly). Then, the subjects play the chosen game, where cooperative behavior is higher when
the payoff structure is decided by election. On the other hand, while Brandts, et al. (2015) discuss
legitimacy in motivating greater effort put into messaging by elected leaders, they reject the
hypothesis that such messages are more effective because receivers of messages respond
differently to elected versus appointed leaders.
7 “Leaders who see themselves as legitimately selected to improve their group’s outcome exert themselves more to exercise effective leadership (in the context of our experiment, working “harder” by sending more relevant messages).”

8
In our paper the voter has no information about the candidates other than their most
preferred positions, allowing us to rule out a selection effect reflecting intentions of leaders. (As
far as any selection in terms of choosing the closer candidate, we show that distance between
the chosen candidate and the voter has no significant effect on the leader’s behavior once one
controls for whether the leader was chosen by election or random appointment.) There is also
no response of voters to an elected leader’s actions. Hence, it is the second channel – leader
behavior – that would account for the election of leaders resulting in better outcomes for
followers than random selection. However, in our set-up leaders do not send messages (as in
Brandts, et al. [2015]) or feel the need to fulfill campaign promises (as in Corazzini, et al. [2014]);
instead they only make policy choices that uniquely determine the payoff of all the players. We
argue that it matters how the leader came to office because of reciprocity by an elected leader to
the voter who put her in office, an effect not present when the leader is randomly appointed.
3. Experimental Design The aim of our experiment is to investigate whether policy concerns change when one
is chosen to be leader. We implemented two treatments differing in the procedure for the
determination of the leader. In one, the leader was appointed [Appointment Treatment]; in the
other, the leader was elected [Election Treatment]. Instructions for each treatment are in the
appendix.
The experiment was run at the Experimental Economics Lab at the University of
Maryland. There were 120 participants, all undergraduate students at the University of Maryland.
We conducted four sessions for each treatment (15 participants per session, i.e. 60 participants
per treatment). No subject participated in more than one session. Participants were seated in
isolated booths. The experiment was programmed in z-Tree (Fischbacher [2007]).
At the beginning of each session, each subject was randomly assigned one of two roles:
“candidate” or “citizen.” There were twice as many candidates as citizens. The assigned roles
stayed fixed for all 20 rounds (until the end of the experiment). At the beginning of each of the
20 rounds in a session, all participants were randomly put into groups of 3 people. Hence, there
could be no “reputation” effects as the session proceeded. Each group consisted of two
candidates and one citizen. Independent from the assigned role (candidate and citizen), every

9
participant was randomly assigned a type in each round. A type was any integer number from 0
to 100 drawn from a uniform distribution, which is essentially the participant’s most preferred
policy. Unlike the fixed roles, assigned types changed from one round to the next. We balanced
the random draws by using the same sequence of random numbers for each treatment, so the
random value draws for each session in the Election Treatment are matched with the random
draws for the corresponding session of the Appointment Treatment.
After informed about the type of each candidate, in the Election Treatment, the citizen
chose one of the candidates. In the Appointment treatment, one of the candidates was randomly
appointed. The elected candidate in the Election Treatment, or the appointed candidate in the
Appointment Treatment was informed about the types of both the opponent candidate and the
citizen and was then given the authority to decide which policy would be implemented. A policy
was required to be an integer number from 0 and 100, where individuals learned the outcome
of each round before the next took place.
Earnings in each round depended on the distance between type and policy. Formally,
the earnings in a round were 100 - |TYPE – POLICY| Experimental Currency Units (ECU)
where 1 USD = 5 ECU. It is important to note that all participants, both citizens and candidates,
have their earnings computed in this fashion, and the policy choice of the winning candidate
affected the earnings of both opponent candidate and the citizen. Once all 20 rounds were
finished, one round out of the 20 was randomly picked, and the earnings in that round were the
final earnings of the experiment in addition to a $5 participation fee.
4. Experimental Results We analyze the behavior of the leaders. 2 treatments, 4 sessions per treatment, 20 rounds
per session, 5 groups per round, 1 leader per group yield a total of 800 observations. Out of
800 observations, we exclude 7 observations: there are 3 subjects (2 in Appointment and 1 in
Election)8 who apparently got confused in the early periods and set 100 as the policy although
their types were not 100. In our analysis, to measure the impact of independent variables, in all
our regression analysis, the standard errors are clustered at session level.
8 In Appointment Treatment, one subject made such a mistake four times once while the other subject made it only once. The confused subject in Election Treatment made this mistake twice.

10
4.1 Do leaders behave non-selfishly?
Our first question is: Do leaders act selfishly and pick their own type as policy? As
shown in Table 1, in the appointment treatment, 25.32% of policies are different from the
leader’s type (100 out of 395 cases). In the election treatment, this percentage is 39.70% (158
out of 398 cases).9 As in earlier studies of the dictator game, we reject universal selfish behavior
even in the appointment treatments (z=11.56, p=0.000)10, but note that non-selfish behavior is
significantly greater for elected than appointed leaders (z=2.80, p=0.005, see Table 1).
Table 1: Do Leaders Behave Non-Selfishly? Choosing Policies where Policy is not Leader’s Type
Fraction Average
Magnitude Election N=395
0.3970 (0.0576)
4.671 (0.6843)
Appointment N=398
0.2253 (0.0219)
2.253 (0.3890)
z= 2.80 p=0.005
z= 3.26 p= 0.001
Standard errors clustered at session level are in parentheses. z-values and p-values are based on the significance of the coefficient of the election dummy variable in logistic regression of the choosing the non-selfish behavior (column 1) and in GLS regression of the magnitude of non-selfish behavior (column 2) on constant and election dummy variable. We also note that the magnitude of the response of a non-selfish leader (the absolute
difference between the policy chosen by the leader and the leader’s own type) is significantly
higher for elected than appointed leaders.
9 A referee had the good suggestion of trying to put the quantitative differences between the policy choices of elected versus appointed leaders in the context of observed magnitudes of policy differences in the real world. This is difficult, not only because such policy differences are likely affected by a host of influences that we eliminate in our experiment (such as selection, policymaker characteristics, reelection incentives, etc.), but also because of the problem of quantifying such differences (such as harshness of sentences given by appointed versus elected judges) in terms of citizen utility. The only empirical magnitude we find at all comparable is in Besley and Coate (2003), who find that U.S. states that elect their public utility commissioners have 14.78 lower residential electricity prices than states where public utility commissioners are appointed (Table 2, p. 1196 0f their paper). 10 z-value and p-value are based on session level random-effects GLS regression of choosing a non selfish policy dummy on constant for appointment treatment.

11
Additionally, as shown in Tables 2a and 2b, session level random effects logistic and
GLS regressions confirm these results. Being elected continues to be the significant variable
both on choosing a non-selfish policy and on the magnitude of non-selfish behavior. Neither
the type (position on Downsian line) of the player nor the voter being closer to the elected
than the losing candidate are significant.
Table 2a: The Impact of Being Elected on Choosing a Non-Selfish Policy Dependent variable: Choosing non-selfish policy (i.e. a policy different than leader’s own type)
(1) (2) (3) (4) (5) Election 0.665*** 0.665*** 0.673*** 0.755*** 0.752*** (0.237) (0.236) (0.237) (0.248) (0.252) Leader’s type 0.000358 0.000971 0.000888 0.000952 (0.00282) (0.00288) (0.00287) (0.00290) Losing -0.00308 -0.00323 -0.00333 candidate’s type (0.00263) (0.00263) (0.00267) Citizen’s type -0.00208 -0.00211 -0.00158 (0.00284) (0.00283) (0.00286) Leader being -0.209 -0.173 the closest (0.183) (0.185) Period -0.0539*** (0.0137) Constant -1.091*** -1.109*** -0.887*** -0.777*** -0.274 (0.172) (0.224) (0.285) (0.300) (0.330) Observations 793 793 793 793 793 Log Likelihood -488.7 -488.6 -487.8 -487.2 -479.3
Standard errors (clustered at the session level) in parentheses. Leader being the closest is the dummy variable that indicates that the absolute difference between the leader’s type and the ordinary citizen’s type is less than the absolute difference between losing candidate’s type and the citizen’s type. * p<0.1, ** p<0.05, *** p<0.01

12
Table 2b: The Impact of Being Elected on Magnitude Dependent variable: Magnitude (i.e. absolute difference between the policy and leader’s own type)
(1) (2) (3) (4) (5) Election 2.418*** 2.397*** 2.412*** 2.822*** 2.730** (0.741) (0.709) (0.762) (0.933) (1.223) Leader’s type -0.0117 -0.0106 -0.0114 -0.0120 (0.0128) (0.0130) (0.0130) (0.0128) Losing candidate’s -0.00937 -0.0101 -0.00968 type (0.0119) (0.0119) (0.0117) Voter’s type -0.00404 -0.00429 -0.000165 (0.0129) (0.0128) (0.0127) Leader being -1.078 -0.891 the closest (0.820) (0.808) Period -0.314*** (0.0602) Constant 2.253*** 2.848*** 3.457*** 4.057*** 7.092*** (0.525) (0.822) (1.174) (1.294) (1.510) Observations 793 793 793 793 793
Standard errors (clustered at the session level) in parentheses. Leader being the closest is the dummy variable that indicates that the absolute difference between the leader’s type and the ordinary citizen’s type is less than the absolute difference between losing candidate’s type and the citizen’s type. * p<0.1, ** p<0.05, *** p<0.01
Additionally, a period variable that takes values 1 to 20 corresponding to the period of the experiment is significant and negative, suggesting that less non-selfish behavior is observed less in the later periods. Nevertheless, treatment effect is still significant. In order to investigate the impact of period, we divided data in two: early (periods 1-10) and late (periods 11-20). To investigate significance of learning, for each treatment separately, we run session level random effect logistic regressions by regressing the choosing non-selfish policy dummy on constant and early period dummy (as well as session level random effect GLS regressions by regressing the magnitude on constant and early period dummy). z-values and p-values of the coefficients of the early period dummies are reported in Table 3. Additionally, we repeated the similar analyses where dependent variable is the election treatment dummy (z-values and p-values of the coefficients of the election dummies are also reported in Table 3). As reported in Table 3, the behavior in the early periods is more non-selfish than the late periods but even in the late periods both the fraction and the magnitude of the non-selfish behavior are significantly higher than zero as well as they are more pronounced in the Election treatment.

13
Table 3: The Impact of Early vs Late Periods on Choosing a Non-Selfish Policy
Fraction
Early Late Election
0.449 (0.0480)
0.345 (0.0714)
z=-2.18 p=0.030
Appointment
0.312 (0.0418)
0.195 (0.045)
z=-2.67 p=0.008
z=2.45 p=0.014
z=2.04 p=0.041
Standard errors clustered at session level are in parentheses.
Average Magnitude
Early Late Election
6.162 (0.9733)
3.195 (0.8338)
z=-2.55 p=0.011
Appointment
3.513 (0.8058)
1.025 (0.2301)
z=-3.24 p=0.001
z=2.15 p= 0.032
z=2.51 p= 0.012
Standard errors clustered at session level are in parentheses
As previously mentioned, one rather peculiar finding is that in the early periods, in the
appointment treatment, the magnitude of non-selfish behavior is high. Nevertheless, the
magnitude of non-selfish behavior in the election treatment is significantly higher than that in
the appointment treatment in the early periods (z=2.15, p=0.032 see Table 3).
A question that may arise is whether the difference in outcomes across treatments may
reflect “selection” in the election treatment. Though voters have no information on candidates
other than their most preferred position, in the election treatment chosen leaders are on average
closer to the citizen. Interpreting candidate position as “type” in terms of behavior, a selection
effect would be present only to the extent that leader behavior towards the voter depended on
the distance from leader to voter. First, as a robustness check, we also looked at the set of
observations restricted to chosen leaders who are closer to the citizen in both treatments. The

14
result in the Table 1 is robust: even in this restricted sample, the fraction of leaders choosing a
policy different from her own type is 0.3882 in the election treatment and 0.2353 in the
appointment treatment (z=2.80, p=0.005 based on regressing the choosing non-selfish policy
on a constant for each treatment separately). Second, as can be seen in Table 4, neither the types
of the candidates and the citizen, nor the voter being closer to the winning than the losing
candidate are significant on choosing non-selfish policies.
Table 4: The Impact of Distance between Leader’s and Citizen’s Types on Choosing a Non-Selfish Policy
Dependent variable: Choosing non-selfish policy (i.e. a policy different than leader’s own type)
(1) (2) (3) Distance 0.00232 0.00297 0.00626 (0.00354) (0.00354) (0.00506) Election 0.689*** 0.877*** (0.239) (0.319) Distance * Election -0.00639 (0.00708) Constant -0.824*** -1.189*** -1.300*** (0.197) (0.208) (0.245) Observations 793 793 793 Log Likelihood -491.2 -488.3 -487.9
Standard errors (clustered at the session level) in parentheses. Distance is the absolute difference between leader’s type and citizen’s type. * p<0.1, ** p<0.05, *** p<0.01
To further consider this question, in Table 4 above we show the results of session level
random-effects logistic regressions of the distance between the types of the citizen and the
leader on the likelihood of reciprocity. The results indicate that this distance has no statistically
significant effect on the likelihood of reciprocity. Moreover, in contrast to the implication of a
selection bias argument, note that this correlation is positive – the closer is the winning candidate
to the voter, the less by which she reciprocates.11 Hence, there is no evidence of any “selection”
effect in elections.
11 The correlation between the distance and magnitude is 0.233 in the election treatment and 0.197 in the appointment treatment. These correlations are not significantly different (using a Fisher transformation, z = -0.289, p = 0.773).

15
Figure 1: Cumulative Distribution Functions of Fraction of Observations in which Policy is Different than the Leader’s Type
In order to investigate heterogeneity in individual leaders’ behavior, we classify each
subject into one of three categories based on their choice of a policy: (i) always choosing her
own type, (ii) sometimes choosing her own type, sometimes not, and (iii) never choosing her
own type. Clearly, the ones in first category are selfish and the ones in the third category are
fully non-selfish individuals. The ones in the second category exhibit some level of non-selfish
behavior. In the appointment treatment, 42.5% of the subjects are identified to be selfish, and
5% were identified to be fully non-selfish. In the election treatment, 32.5% of the subjects are
identified to be selfish, and 10% were identified to be fully non-selfish. Also, for each leader,
we calculated the fraction of cases in which the leader chooses a policy different than the leader’s
own type (e.g. 0 corresponds to always selfish behavior and 1 corresponds to always non-selfish
behavior); each fraction can be thought of as a measure of how non-selfish the leader is. Figure
1 provides the cumulative distribution functions of the non-selfishness. As it can be seen in
Figure 1, there is a first-order stochastic dominance, and two-tailed Kolmogorov-Smirnov test
yields a significant difference between the distributions (p=0.017). Hence, more non-selfish
behavior is observed in the election treatment.
.2.4
.6.8
1
0 .2 .4 .6 .8 1Fraction different than leader's type
Appointment Election
CDF: Fraction of Policies different from Leader's Type
16
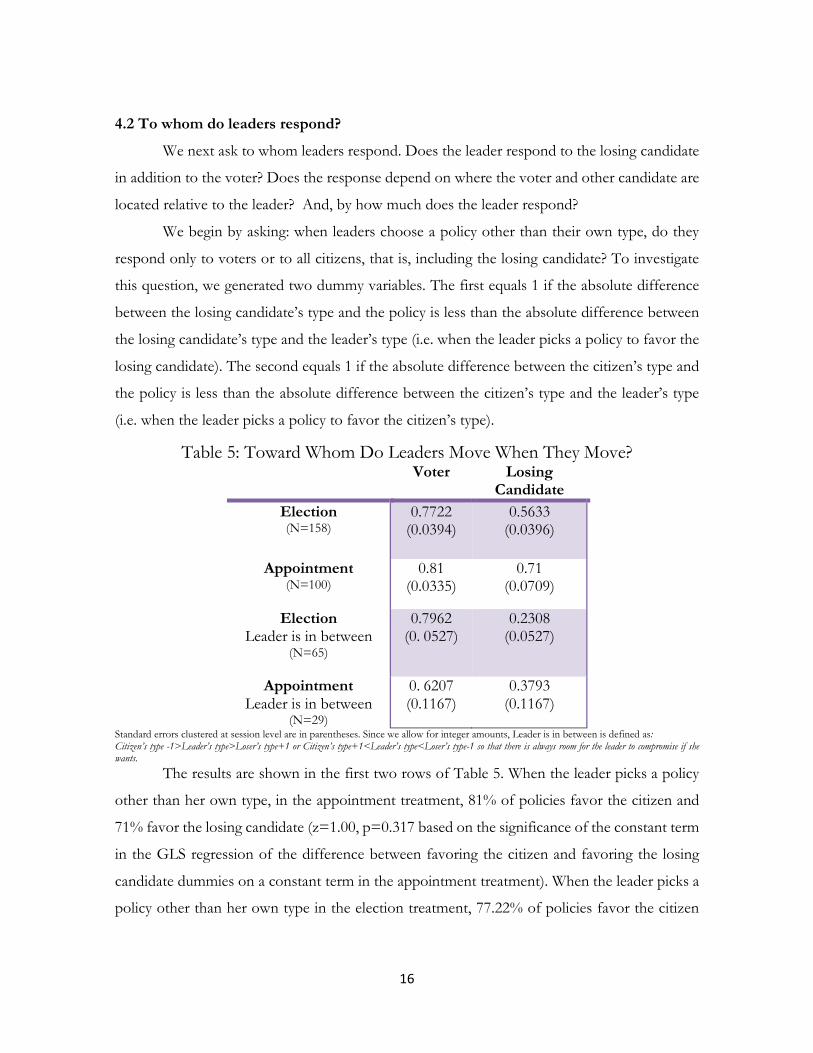
4.2 To whom do leaders respond?
We next ask to whom leaders respond. Does the leader respond to the losing candidate
in addition to the voter? Does the response depend on where the voter and other candidate are
located relative to the leader? And, by how much does the leader respond?
We begin by asking: when leaders choose a policy other than their own type, do they
respond only to voters or to all citizens, that is, including the losing candidate? To investigate
this question, we generated two dummy variables. The first equals 1 if the absolute difference
between the losing candidate’s type and the policy is less than the absolute difference between
the losing candidate’s type and the leader’s type (i.e. when the leader picks a policy to favor the
losing candidate). The second equals 1 if the absolute difference between the citizen’s type and
the policy is less than the absolute difference between the citizen’s type and the leader’s type
(i.e. when the leader picks a policy to favor the citizen’s type).
Table 5: Toward Whom Do Leaders Move When They Move? Voter Losing
Candidate Election (N=158)
0.7722 (0.0394)
0.5633 (0.0396)
Appointment (N=100)
0.81 (0.0335)
0.71 (0.0709)
Election Leader is in between
(N=65)
0.7962 (0. 0527)
0.2308 (0.0527)
Appointment Leader is in between
(N=29)
0. 6207 (0.1167)
0.3793 (0.1167)
Standard errors clustered at session level are in parentheses. Since we allow for integer amounts, Leader is in between is defined as: Citizen’s type -1>Leader’s type>Loser’s type+1 or Citizen’s type+1<Leader’s type<Loser’s type-1 so that there is always room for the leader to compromise if she wants.
The results are shown in the first two rows of Table 5. When the leader picks a policy
other than her own type, in the appointment treatment, 81% of policies favor the citizen and
71% favor the losing candidate (z=1.00, p=0.317 based on the significance of the constant term
in the GLS regression of the difference between favoring the citizen and favoring the losing
candidate dummies on a constant term in the appointment treatment). When the leader picks a
policy other than her own type in the election treatment, 77.22% of policies favor the citizen

17
and 56.33% favor the losing candidate (z=3.87, p=0.000 based on the significance of the
constant term in the GLS regression of the difference between favoring the citizen and favoring
the losing candidate dummies on a constant term in the election treatment). In other words, in
the appointment treatment the policy favors losing candidate and the citizen equally, while in
the election treatment the chosen policy favors the voter. The difference in behavior looks
especially clear when we restrict attention to cases where the leader chooses a policy other than
her type, and her type is between the losing candidate and the ordinary citizen (voter). If the policy
she chooses is closer to the losing candidate’s type, then we can say that she favors the losing
candidate, while if it is closer to the voter’s type we can say that she favors the ordinary citizen.
The appointed leader favors the citizen 62.07% of the time and the losing candidate 37.93% of
the time (z=0.91, p=0.363 based on the significance of the constant term in the GLS regression
of the difference between favoring the citizen and favoring the losing candidate dummies on a
constant term in the appointment treatment conditional on the leader is in between). In contrast,
the elected leader favors the citizen 79.62% of the time and the losing candidate 23.08% of the
time (z=5.11, p=0.000 based on the significance of the constant term in the GLS regression of
the difference between favoring the citizen and favoring the losing candidate dummies on a
constant term in the election treatment conditional on the leader is in between).12 These results
are summarized in the last two rows of Table 5. It is also illuminating to consider how the likelihood that the leader moves towards the
ordinary citizen (i.e., the voter) depends on the position of the voter relative to the leader.
(Remember that in the appointment treatment, the leader is chosen at random from the two
candidates.) We know from Table 1 that taken over all cases, a policy other than the leader’s
type is chosen 38.70% of the time if the leader was elected and 22.53% of the time in the leader
was appointed. When the voter is between the two candidates, he usually votes for the closer
candidate – the closer candidate is elected in 110 cases but the further candidate is chosen in 19
cases (representing 15 subjects).13 . In the latter scenario when the voter chooses the further
candidate, we see in Table 6 that a much larger proportion of elected leaders chose a policy
12 It is also worth mentioning that when the leader’s type is in between the losing candidate’s type and the citizen’s type, in the appointment treatment, 24.58% of the leaders pick a policy other than their own type; and in the election treatment, this percentage is 35.38%. These percentages are in line with the percentages derived from Table 1. 13 Excluding leaders with type 0 and 100 to avoid any movement as if to favor moving toward the citizen.
18
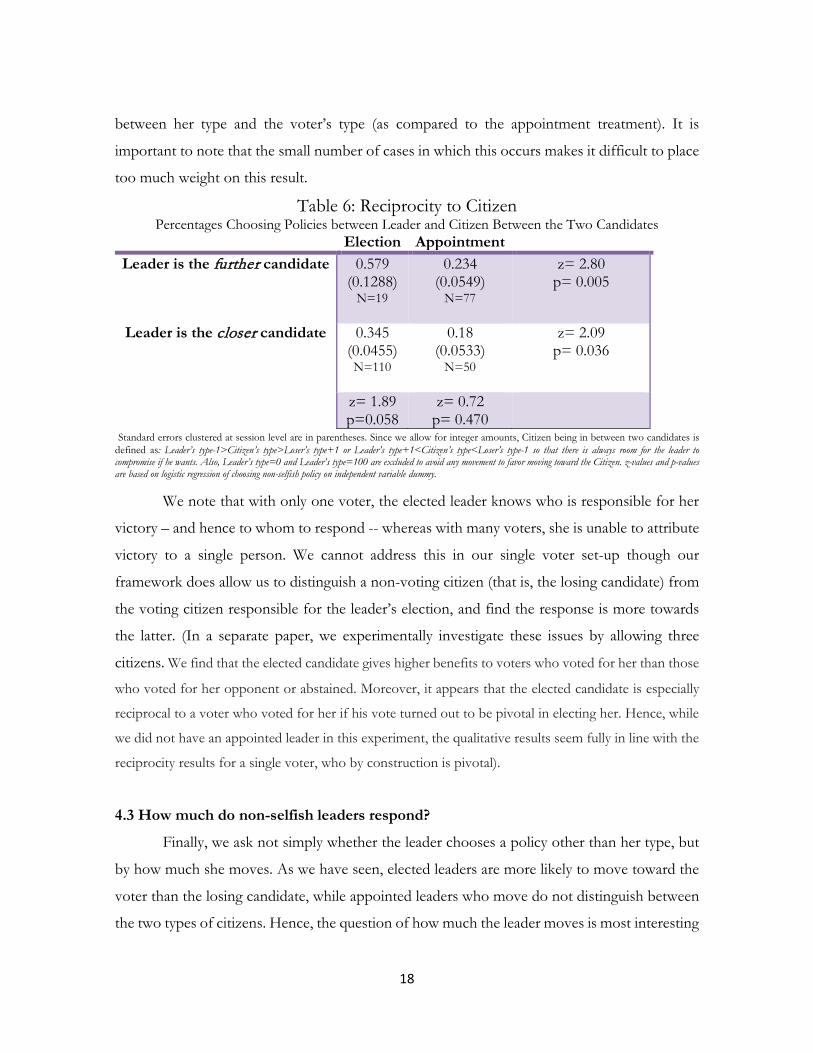
between her type and the voter’s type (as compared to the appointment treatment). It is
important to note that the small number of cases in which this occurs makes it difficult to place
too much weight on this result. Table 6: Reciprocity to Citizen
Percentages Choosing Policies between Leader and Citizen Between the Two Candidates Election Appointment
Leader is the further candidate
0.579 (0.1288)
N=19
0.234 (0.0549)
N=77
z= 2.80 p= 0.005
Leader is the closer candidate
0.345 (0.0455) N=110
0.18 (0.0533)
N=50
z= 2.09 p= 0.036
z= 1.89 p=0.058
z= 0.72 p= 0.470
Standard errors clustered at session level are in parentheses. Since we allow for integer amounts, Citizen being in between two candidates is defined as: Leader’s type-1>Citizen’s type>Loser’s type+1 or Leader’s type+1<Citizen’s type<Loser’s type-1 so that there is always room for the leader to compromise if he wants. Also, Leader’s type=0 and Leader’s type=100 are excluded to avoid any movement to favor moving toward the Citizen. z-values and p-values are based on logistic regression of choosing non-selfish policy on independent variable dummy.
We note that with only one voter, the elected leader knows who is responsible for her
victory – and hence to whom to respond -- whereas with many voters, she is unable to attribute
victory to a single person. We cannot address this in our single voter set-up though our
framework does allow us to distinguish a non-voting citizen (that is, the losing candidate) from
the voting citizen responsible for the leader’s election, and find the response is more towards
the latter. (In a separate paper, we experimentally investigate these issues by allowing three
citizens. We find that the elected candidate gives higher benefits to voters who voted for her than those
who voted for her opponent or abstained. Moreover, it appears that the elected candidate is especially
reciprocal to a voter who voted for her if his vote turned out to be pivotal in electing her. Hence, while
we did not have an appointed leader in this experiment, the qualitative results seem fully in line with the
reciprocity results for a single voter, who by construction is pivotal).
4.3 How much do non-selfish leaders respond?
Finally, we ask not simply whether the leader chooses a policy other than her type, but
by how much she moves. As we have seen, elected leaders are more likely to move toward the
voter than the losing candidate, while appointed leaders who move do not distinguish between
the two types of citizens. Hence, the question of how much the leader moves is most interesting

19
when we consider not any movement but movement in the direction of the voter. In considering
the amount by which a leader moves, the absolute amount of movement is not really a good
indicator of whether the leader moves “a little or a lot” when comparing the appointment and
election treatments. To take an example, suppose the ordinary citizen’s type is 18, and the
elected leader with a type of 20 picks 18 but the appointed leader with type of 60 implements
57. We would not then conclude based on the size of the movement that the appointed leader
favors the ordinary citizen more than the elected leader.
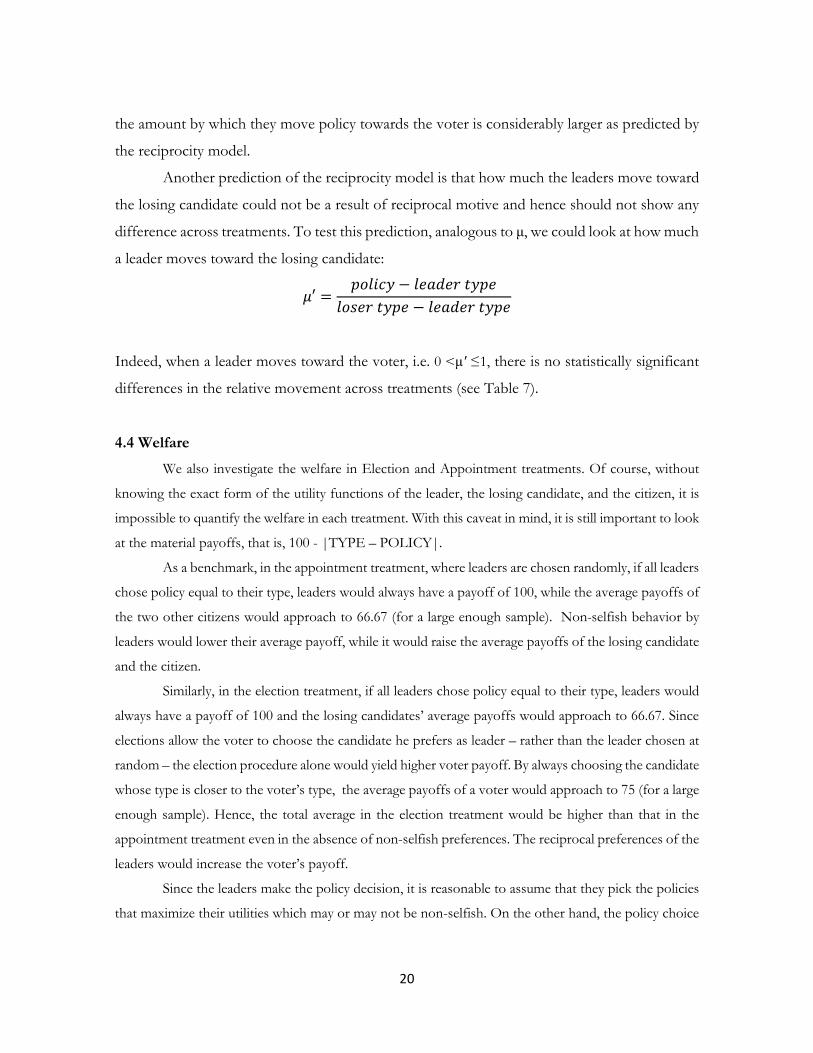
This issue, without excluding any data, can be handled by defining the measure of
relative movement:
𝜇𝜇 =𝑝𝑝𝑝𝑝𝑝𝑝𝑝𝑝𝑝𝑝𝑝𝑝 − 𝑝𝑝𝑙𝑙𝑙𝑙𝑙𝑙𝑙𝑙𝑙𝑙 𝑡𝑡𝑝𝑝𝑝𝑝𝑙𝑙
𝑣𝑣𝑝𝑝𝑡𝑡𝑙𝑙𝑙𝑙 𝑡𝑡𝑝𝑝𝑝𝑝𝑙𝑙 − 𝑝𝑝𝑙𝑙𝑙𝑙𝑙𝑙𝑙𝑙𝑙𝑙 𝑡𝑡𝑝𝑝𝑝𝑝𝑙𝑙
The ratio μ must be between 0 and 1 if the leader picks a policy toward (but not on the other
side of) the voter. It is greater than 0 (if the leader chooses her own type as the policy), but no
greater than 1 (if the leader chooses voter’s type as the policy), monotonically rising the more
the leader moves toward the voter relative to the difference in types.
Table 7: How Much Do Leaders Move towards Voters (𝜇𝜇) and towards Losing Candidate (𝜇𝜇′)?
Average Movement Relative to Initial Distance Election
Appointment
𝝁𝝁 0.381 (0.0379) N=114
0.266 (0.0266) N=77
z=2.73 p=0.006
𝝁𝝁′ 0.221 (0.0250) N=87
0.245 (0.0244) N=68
z=-0.68 p=0.496
Standard errors clustered at session level are in parentheses. These values are conditional on moving toward the citizen (0<μ≤1 and 0< μ'≤1). z-values and p-values are based on the significance of the coefficient of the election dummy variable in GLS regression on constant and election dummy variable.
When a leader moves toward the citizen, i.e. 0<μ≤1, the size of the movement relative
to the difference between the leader’s and the citizen’s type is significantly larger in the election
than in the appointment treatment (see Table 7). Hence, not only are leaders chosen by election
much more likely to move policy toward the voter than leaders chosen by appointment, but also
20
the amount by which they move policy towards the voter is considerably larger as predicted by
the reciprocity model.
Another prediction of the reciprocity model is that how much the leaders move toward
the losing candidate could not be a result of reciprocal motive and hence should not show any
difference across treatments. To test this prediction, analogous to μ, we could look at how much
a leader moves toward the losing candidate:
𝜇𝜇′ =𝑝𝑝𝑝𝑝𝑝𝑝𝑝𝑝𝑝𝑝𝑝𝑝 − 𝑝𝑝𝑙𝑙𝑙𝑙𝑙𝑙𝑙𝑙𝑙𝑙 𝑡𝑡𝑝𝑝𝑝𝑝𝑙𝑙
𝑝𝑝𝑝𝑝𝑙𝑙𝑙𝑙𝑙𝑙 𝑡𝑡𝑝𝑝𝑝𝑝𝑙𝑙 − 𝑝𝑝𝑙𝑙𝑙𝑙𝑙𝑙𝑙𝑙𝑙𝑙 𝑡𝑡𝑝𝑝𝑝𝑝𝑙𝑙
Indeed, when a leader moves toward the voter, i.e. 0 <μ' ≤1, there is no statistically significant
differences in the relative movement across treatments (see Table 7).
4.4 Welfare
We also investigate the welfare in Election and Appointment treatments. Of course, without
knowing the exact form of the utility functions of the leader, the losing candidate, and the citizen, it is
impossible to quantify the welfare in each treatment. With this caveat in mind, it is still important to look
at the material payoffs, that is, 100 - |TYPE – POLICY|.
As a benchmark, in the appointment treatment, where leaders are chosen randomly, if all leaders
chose policy equal to their type, leaders would always have a payoff of 100, while the average payoffs of
the two other citizens would approach to 66.67 (for a large enough sample). Non-selfish behavior by
leaders would lower their average payoff, while it would raise the average payoffs of the losing candidate
and the citizen.
Similarly, in the election treatment, if all leaders chose policy equal to their type, leaders would
always have a payoff of 100 and the losing candidates’ average payoffs would approach to 66.67. Since
elections allow the voter to choose the candidate he prefers as leader – rather than the leader chosen at
random – the election procedure alone would yield higher voter payoff. By always choosing the candidate
whose type is closer to the voter’s type, the average payoffs of a voter would approach to 75 (for a large
enough sample). Hence, the total average in the election treatment would be higher than that in the
appointment treatment even in the absence of non-selfish preferences. The reciprocal preferences of the
leaders would increase the voter’s payoff.
Since the leaders make the policy decision, it is reasonable to assume that they pick the policies
that maximize their utilities which may or may not be non-selfish. On the other hand, the policy choice

21
may increase or decrease the utilities of the losing candidate and the citizen. We calculated average payoff
of each player under the different treatments, as reported in Table 8.
Table 8: Payoffs
Election Appointment Leader 95.329
(0.6843)
97.747 (0.3889)
z=-3.26 p=0.001
Losing Candidate
68.497 (1.1423)
69.104 (1.1744)
z=-0.37 p=0.711
Citizen 76.922 (1.0700)
68.772 (1.1292)
z=5.24 p=0.000
Total 240.749 (1.6296)
235.622 (1.7283)
z=2.16 p=0.031
Standard errors clustered at session level are in parentheses. z-values and p-values are based on the significance of the coefficient of the election dummy variable in GLS regression of payoff on constant and election dummy variable.
In the appointment treatment, leader payoff falls relative to the case of selfish behavior, while
voter and losing candidate payoff rise. The leaders earn even less in the election treatment. Voters receive
significantly higher payoffs under election than under appointment of a leader, while average losing
candidate payoff is identical. The total payoff is also significantly higher in the election treatment.
5. Interpreting the Results We believe that our results shed light not only on the general question of the behavior
of individuals who are chosen to make decisions for others, but also on the citizen-candidate
approach itself. Two (related) results stand out on the general question. First, the procedure
by which a decision-maker is chosen has a significant effect on her behavior as leader, with
elected leaders being significantly more likely than appointed leaders to act non-selfishly.
Second, that elected leaders, in their non-selfish behavior, favor the voter (that is, the one
who determined they would be leader) over non-voting losing candidates. In contrast, non-
selfish appointed leaders show no statistically significant difference in favoring voters versus
non-voters.

22
Neither result should be surprising, though they should be distinguished. Let’s begin
with the second result. When a leader is chosen by random appointment, there should be no
difference for her between the ordinary citizen and the “losing” candidate. It should
therefore not be surprising that the leader treats them symmetrically. In contrast, when the
leader is elected, the role of the other two players is crucially different in the leader’s eyes.
The winning candidate is leader because the voter chose her.
If leaders who did not implement their type as policy were simply acting altruistically
or in a fiduciary manner, neither result should hold: there should be no difference between
leaders who owe their position to election versus appointment, nor any difference in whom
they favor. The fact that more leaders act non-selfishly in the election treatment – where the
experiment was designed to try to control for other explanations -- suggests that reciprocity
is likely driving non-selfish behavior. Elected leaders owe their position to the voter. They
direct their non-selfish behavior much more towards voters than the other citizen; and, they
respond much more to voters than appointed leaders do. This suggests that an elected leader
should be especially likely to move towards the voter who elected her if she was the candidate
farther from the voter. While such an observation would strengthen the conclusion of
reciprocity when leaders are elected, it arises in too small a number of cases to be statistically
significant.
Additionally, our results indicate that material sacrifice is not necessary to be
considered kind; if one’s action is improving the well-being of the other he may be still
considered kind. Particularly, in the election treatment, although the elected leader does not
observe a material sacrifice by the voters, she acts non-selfishly.
The first result – that elected leaders are more likely to be non-selfish than appointed
ones – may then be better interpreted in light of the above discussion. As already indicated,
simple altruism does not in itself explain why elected leaders display more other-regarding
behavior. In contrast, reciprocity can explain not only the direction of kind behavior, but
also the difference across treatments. The fact that both appointed and elected leaders display
other-regarding behavior, but the latter do so more, suggests a mixture of altruism and
reciprocity.
23
We believe that our results may be especially relevant to the citizen-candidate model
in which elected candidates have the same preferences in office that they had as private
citizens, these preferences determining policy choices. What our results indicate is that once
chosen to be leaders, citizens do not always simply carry over the preferences held as citizens
in making policy. The policy carried out is no longer their selfish optimum for a significant
number of chosen leaders. This behavior of a leader – both elected and appointed -- is
consistent with the “fiduciary” model discussed above, where the fact of holding office may
affect a leader’s behavior. While this is true of leaders in general in our results, it is even truer
of elected leaders. Election having an even greater effect on leaders not choosing their selfish
optimum casts further doubt on the underlying premise of the citizen-candidate model as a
general description of the behavior of elected candidates.
The fact that elected leaders do not automatically carry over their preferences as
citizens to their choices as leaders does not mean however that these preferences are
irrelevant for predicting what a candidate will do once in office. Leaders do not pick policies
very different than their type. But, it is clear they often do not simply play their candidate
type. They consider citizen preferences in making their choices, even when there is no re-
election motive. Hence, voters face the task of predicting what a candidate will do once in
office, where her known preferences before being elected are not a perfect indicator. In
short, our results suggest modifying the citizen-candidate approach to include the possibility
that behavior once in office is a mix of ex ante individual preferences and effects of having
been chosen to lead, where the latter effect includes the response of successful candidates to
citizens who elected them.
6. Conclusions In this paper we have considered a simple model in which a leader makes choices for
citizens, and the effect on those choices of leaders being elected by voters versus appointed
randomly. We found that elected leaders display greater other-regarding behavior than
appointed leaders, and, by designing an experiment to eliminate some common explanations
for the behavior of elected leaders, we aimed to isolate the effect of the method of coming

24
to office. By so doing, we argued that the observed difference in behavior of elected and
appointed leaders likely reflects reciprocity by the former to the voters who elected them.
Focusing on the importance of the procedure by which a policymaker is chosen
sheds light on a number of other issues as well. First, of course, is that the procedure by
which one has been chosen for office affects behavior once in office. Perhaps this is
unsurprising, but we are unaware of other experimental work that addresses this point and
that comes to such a clear conclusion. As discussed in the previous section, our results
suggest that the simple model of citizen-candidates is incomplete. Models of the behavior of
elected leaders should take into account that being a leader in itself may affect behavior. In
models of political economy, leaders are not just social-welfare-maximizers, but are political
agents with preferences. But what these preferences are and how leaders behave appears
more complicated than simply self-interest which is easy to predict. Models of leaders need
to be more developed.
We view this study as only the first step in investigating the question of how leaders
act, especially elected leaders. One potential direction for future research is further
experimental work, distinguishing perhaps voting and non-voting citizens, or leaders who
can and cannot be re-elected. This should be complemented by looking at data on the policies
chosen by leaders and whether they favor the voters who voted for them, `even when they
are term-limited. Our results suggest that further experimental and empirical study of leader
responsiveness to citizens and how this is affected by the procedure through which they
came to office should yield rich insights.

25
REFERENCES Baldwin, K. and E. Mvukiyehe (2011), “The Effects of Participatory Processes for Selecting Leaders:
Evidence from Changes to Traditional Institutions in Liberia,” working paper. Bardhan, P. and D. Mookherjee (2010), “Determinants of Redistributive Politics: An Empirical Analysis
of Land Reforms in West Bengal, India,” American Economic Review, 100, 1572-60. Besley, T. and S. Coate (1997), “An Economic Model of Representative Democracy,” Quarterly Journal of
Economics, 112, 85-114. Besley, T. and S. Coate (2003), “Elected Versus Appointed Regulators: Theory and Evidence,” Journal of
the European Economic Association, 1, 1176–1206. Besley, T. and A. Payne (2013), “Implementation of Anti-Discrimination Policy: Does Judicial Selection
Matter?,” American Law and Economics Review, 15 (1), 212-251. Brandts, J., D. J. Cooper, and R. A. Weber (2015), “Legitimacy, Communication, and Leadership in the
Turnaround Game,” Management Science, 61(11), 2627-2645. Brandts, J., W. Güth, and A Steihler (2006), “I Want YOU!: An Experiment Studying the Selection Effect
when Assigning Distributive Power,” Labor Economics, 13, 1-17. Brock, J. M., A. Lange and E. Y. Ozbay (2013), “Dictating Risks - Experimental Evidence on Giving in
Risky Environments,” American Economic Review, 103(1), 415-437. Burden, B., D. Canon, S. Lavertu, K. Mayer, and D. Moynihan (2010), “Comparing Elected and
Appointed Election Officials: The Impact of Selection Method on Policy Preferences and Administrative Outcomes,” working paper.
Camerer, C. (2003), Behavioral Game Theory: Experiments on Strategic Interaction. Princeton, NJ: Princeton University Press.
Charness, G. and D. I. Levine (2007), “Intention and Stochastic Outcomes: An Experimental Study,” Economic Journal, 117(522), 1051-1072.
Charness, G., R. Cobo-Reyes, N. Jimenez, J. A. Lacomba, and F. Lagos (2012), “The Hidden Advantage of Delegation: Pareto Improvements in a Gift Exchange Game,” American Economic Review, 102(5), 2358-2379.
Choi, S. J., G. M. Gulati, and E. A. Posner (2010), “Professionals or Politicians: The Uncertain Empirical Case for an Elected Rather than Appointed Judiciary," Journal of Law, Economics, and Organization, 26(2), 290-336.
Corazzini, L., S. Kube, M. A. Maréchal, and A. Nicolò (2014), “Elections and Deceptions: An Experimental Study on the Behavioral Effects of Democracy,” American Journal of Political Science, 58(3), 579–592.
Dal Bó, P., A. Foster and L. Putterman (2010), “Institutions and Behavior: Experimental Evidence on the Effects of Democracy,” American Economic Review, 100, 2205–2229.
Dufwenberg, M. and G. Kirchsteiger (2004), “A Theory of Sequential Reciprocity,” Games and Economic Behavior, 47, 268–298.
Falk, A., E. Fehr and U. Fischbacher (2008), “Testing Theories of Fairness – Intentions Matter,” Games and Economic Behavior, 62(1), 287–303.
Fehr, E. and Gächter, S. (2000), "Fairness and Retaliation: The Economics of Reciprocity," Journal of Economic Perspectives, 14(3), 159-181.
Fehr, E., G. Kirchsteiger and A. Riedl (1993), “Does Fairness Prevent Market Clearing? An Experimental Investigation,” Quarterly Journal of Economics, 108, 437-459.
26
Finan, F. and L. A. Schechter (2012), “Vote-Buying and Reciprocity,” Econometrica, 80(2), 863-881. Fischbacher, U. (2007), “z-Tree: Zurich Toolbox for Ready-made Economic Experiments,” Experimental
Economics, 10(2), 171-178. Gordon, S., and G. Huber (2007), “The Effect of Electoral Competitiveness on Incumbent Behavior,"
Quarterly Journal of Political Science, 2, 107-138. Grossman, G. (2014), “Do Selection Rules Affect Leader Responsiveness? Evidence from Rural
Uganda,” Quarterly Journal of Political Science, 9(1), 1-44. Hahn, V. (2009). “Reciprocity and Voting,” Games and Economic Behavior, 67(2), 467-480. Hamman, J. R., R. Weber and J. Woon (2011), “An Experimental Investigation of Electoral Delegation
and the Provision of Public Goods,” American Journal of Political Science, 55(4), 738–752. Iaryczower, M., G. Lewis, and M. Shum (2013), “To Elect or to Appoint? Bias, Information, and
Responsiveness of Bureaucrats and Politicians,” Journal of Public Economics, 97, 230-244. Lee, D.S., E. Moretti, and M.J. Butler (2004), “Do Voters Affect Or Elect Policies? Evidence From the
U. S. House,” Quarterly Journal of Economics, 119, 807-859. Lim, C. S H. (2013), “Preferences and Incentives of Appointed and Elected Public Officials: Evidence
from State Trial Court Judges,” American Economic Review, 103(4), 1360-1397. Martinez-Bravo, M. (2014), “The Role of Local Officials in New Democracies: Evidence from
Indonesia,” American Economic Review, 104 (4), 1244–1287. Osborne, M.J. and A. Slivinski (1996), “A Model of Political Competition with Citizen-Candidates,”
Quarterly Journal of Economics, 111, 65-96. Olken, B.A. (2010), “Direct Democracy and Local Public Goods: Evidence from a Field Experiment in
Indonesia,” American Political Science Review, 104(2), 243–267. Philadelphia Inquirer, November 8, 2012, (“Will Philly reap rewards for big Obama turnout?,”
http://articles.philly.com/2012-11-08/news/34995270_1_president-obama-obama-administration-mayor-nutter.
Rabin, M. (1993), "Incorporating Fairness into Game Theory and Economics," American Economic Review, 83, 1281-1302.

27
Appendix A Instructions: [Election Treatment]
General This is an experiment in decision-making. If you follow the instructions and make good decisions, you can earn a significant amount of money, which will be paid to you at the end of the session. The currency in this experiment is called tokens (5 tokens = 1USD). The experiment consists of 20 identical decision rounds. During the experiment it is important not to talk to any other subjects. Please turn your cell phones off and remember that if you have any questions, just raise your hand.
Roles Before the beginning of the experiment you will be randomly assigned a role. The two possible roles you can be assigned are `Citizen’ and `Candidate’. There will be twice as many candidates as citizens. Your assigned roles will stay fixed for all 20 rounds until the end of the experiment. That is, if at the beginning of the experiment you were assigned the role of a candidate (citizen) you will keep this role for the entire experiment.
In the beginning of each round, all participants will be randomly grouped into groups of 3 people each. Each group will consist of two candidates and one citizen. Since you are most likely to be matched with different participants for each round, it will be impossible to track candidates and citizens between rounds. However, there will always be two candidates and one citizen in every group.
Candidate Names Those who get the role of candidates will also be assigned a name in each round. In each group, names are assigned randomly with each candidate having the same chance to be named `A’ or `B’. Notice that if you are a candidate, your name could potentially change from one round to another.
Types Independently from the role and name that he/she is assigned, in each round every participant (candidates and citizens) will be assigned a Type randomly. Types can be any integer number from 0 to 100 and will be drawn from a uniform distribution. That means that each participant’s type can take any of those integer values with equal probability. Unlike the fixed roles, types assigned will change from one round to another.
Policies A policy is what the winning candidate gets to decide once elected. An admissible policy is any integer number from 0 to 100. The interplay between the value of your type and the policy actually implemented is what determines your earnings.
Development of each round For each group, each of the 20 rounds consists of an independent election process with the following sequence of events:

28
1. Candidates are informed about their names and types for the current round. Citizens are informed about their types as well.
2. In each group, the citizen is informed about both candidates’ types and must decide his/her vote.
3. Once citizen submits his/her vote, a winner is proclaimed and everyone is informed about who is elected candidate.
4. The elected candidate is informed about the types of both the opponent candidate and the citizen and is then given the authority to decide which policy will be implemented.
5. Everybody learns the policy implemented and his/her own earnings for the round. Earnings are computed by the following rule:
a. Everybody starts each round with 100 tokens. b. Discount (D) for each participant is computed as, the absolute value of the difference
between type and policy, i.e. D = |TYPE – POLICY|. c. Final earnings of the round are computed as 100 initial tokens minus the corresponding
discount, that is, 100 – D tokens. Notice that all participants, either citizens or candidates get their earnings computed in this fashion.
Final earnings Once all 20 rounds are finished, the computer will pick one round out of the 20 randomly. The earnings you made on that round will be your final earnings of the experiment. We will convert tokens you earned in this round into US dollars by dividing them by 5. In addition, you will receive a participation fee of $5.
Are there any questions?
29
[Appointment Treatment]
General This is an experiment in decision-making. If you follow the instructions and make good decisions, you can earn a significant amount of money, which will be paid to you at the end of the session. The currency in this experiment is called tokens (5 tokens = 1USD). The experiment consists of 20 identical decision rounds. During the experiment it is important not to talk to any other subjects. Please turn your cell phones off and remember that if you have any questions, just raise your hand.
Roles Before the beginning of the experiment you will be randomly assigned a role. The two possible roles you can be assigned are `Citizen’ and `Candidate’. There will be twice as many candidates as citizens. Your assigned roles will stay fixed for all 20 rounds until the end of the experiment. That is, if at the beginning of the experiment you were assigned the role of a candidate (citizen) you will keep this role for the entire experiment.
In the beginning of each round, all participants will be randomly divided into groups of 3 people each. Each group will consist of two candidates and one citizen. Since you are most likely to be matched with different participants for each round, it will be impossible to track candidates and citizens between rounds. However, there will always be two candidates and one citizen in every group.
Candidate Names Those who get the role of candidates will also be assigned a name in each round. In each group names are assigned randomly with each candidate having the same chance to be named `A’ or `B’. Notice that if you are a candidate, your name could potentially change from one round to another.
Types Independently from the role and name that he/she is assigned, in each round every participant (candidates and citizens) will be assigned a Type randomly. Types can be any integer number from 0 to 100 and will be drawn from a uniform distribution. That means that each participant’s type can take any of those integer values with equal probability. Unlike the fixed roles, types assigned will change from one round to another.
Policies A policy is what the leader gets to decide once appointed. An admissible policy is any integer number from 0 to 100. The interplay between the value of your type and the policy actually implemented is what determines your earnings.
30
Development of each round For each group, each of the 20 rounds consists of an independent appointment process with the following sequence of events:
1. Candidates are informed about their names and types for the current round. 2. Each citizen is informed about his/her type. 3. A citizen has no say in leader appointment. Whether candidate A or B is appointed is determined
randomly by the computer with both candidates having the same chance to be appointed. That is, each candidate of a group has 50% percent of probability to win the office.
4. The appointed candidate is informed about the types of both the opponent candidate and the citizen. He/she is then is given the authority to decide which policy will be implemented.
5. Everybody learns the policy implemented and his/her own earnings for the round. Earnings are computed by the following rule:
a. Everybody starts each round with 100 tokens. b. Discount (D) for each participant is computed as, the absolute value of the difference
between type and policy, i.e. D = |TYPE – POLICY|. c. Final earnings of the round are computed as 100 initial tokens minus the corresponding
discount, that is, 100 – D tokens. Notice that all participants, either citizens or candidates get their earnings computed in this fashion.
Final earnings Once all 20 rounds are finished, the computer will pick one round out of the 20 randomly. The earnings you made on that round will be your final earnings of the experiment. We will convert tokens you earned in this round into US dollars by dividing them by 5. In addition, you will receive a participation fee of $5.
Are there any questions?