Embed Size (px)
Citation preview
DOCUMMIT RESUHE
ID 134 319 PS 009 044
AUTHOR Goodrich, Nancy; And OthersTITLE National Home Start Evaluation Interim Report'Vt.
PrOgram Analysis.INSTITUTION Abt Associates, Inc. Cambridge, sass.; High/Scope
Educational Research Foundation, Ypsilanti, Mich.SPONS AGENCY Office of Child Development (DHEW), Washington, D.C.;
Office of Human Development (MEW), Washington,D. C.
PUB DATE 1S Oct 74CONTEACT HEW-OS-72-127NOTE 166p.; For other reports in this study, see ED 069
439-441, ED 077 583, ED 085 398, ED 091 074, ED 091G81, BD 092 225-229, ED 107 3791380 and PS 009039-047
2DRS PRICE HF-80.83 HC-S8.69 Plus PostagepDESCRIPTORS Cost Effectiveness; Demonstration Programs; *Early
Childhood Education; Ethnic Groups; EvaluationHethods; Fasily-Characteristics; Family Role; *HomeProgram; *Home-Visits; Interaction; Interventiong-Observation; Parent-Child Relationship; *ParentEducation; Program Descriptions; *Program Evaluation;Readiness; Social Services; Staff Role; Tables(Data)
IDENTIFIERS *Project Home Start
ABSTRACTThis program analysis is part of the interim report
on the National Home Start Evaluation. Home Start, a federally-funded3-year (1972-1975) home-based demonstration program for low-incomefamilies with 3- to 5-year-old children was designed to enhance aaother's skills in dealing with her own children and to providecomprehensive social-emotional, health and uutritional services. Onefocus of the report is the examination of selected program-wideimplementation features that seem especially important for future usein planning ana operating home-based altevnatives to Head Start. Thefirst chapter of the report serves as an executive:summary of the-lost important findings of the-report. Other chapters includeinformation on methodology; data collection and analysis and on thethree.major Hose Start program dimensions: Home:Start families andstaff: the program, and services to fasilies. (Author/ES)
***********************************************************************Documents acquired by ERIC include many informal-unpublished
* materials not available'from othir sourcs. ERIC makes every effort ** to obtain the bst copy available. Nevertheless, items of marginal ** reproducibility are often encountered and this affects the quality ** of the microfiche and hardcopy reproductions ERIC makes available ** via the ERIC Document Reproduction Service (EDRS). EDRS' is not* responsible for the quality of the original document. Reproductions ** supplied by EDRS are the best that can be made from the original. ************************************************************************

This Report was Prepared fors
The Department of Health, Education, and WelfareOffice of Child Development
Early Childhoc.1 Research and Evaluation BranchUnder HEW Contract No. HEW-OS-72-127
U.E.DEPARTMENT OP NIALTN.EDUCATSONEwELPARENATIONAL INSTITUTE OP
00CATION
THIS DOCUMENT HAS NUN REPRO-MICELI ExACTI.V A. SUMMED PRO*THE PERSON OR OROANI7ATIONOR4GIN-Amo $T POINTS Of vIEW OR OPINIONSSTATED 00 NOT NEcESSAMILY REPRE.LENT opp$C$AL NATIONAL $NsTaUTE OPEouCAT,ON POSITION oR pOuCT,
Esther Kresh, Project Officer
NATIONAL HOME START EVALUATION
Interim Report V:
Program Analysis
October 15, 1974
? Co
Nancy Goodrich, Coordinator,Program Analysis Volume
Principal Authors
Nancy GoodrichMarrit NautaAnn Rubin
Contributors
Robin BogarTom Cerva
.1114Ilona FerraroRichard Ruopp
Editor
Jean Layzer
(7)
4::)Richard Ruopp, Director, Formative EvaluationNancy Goodrich, Deputy Director, Formative Analysis
4111:)
Marrit Nauta, Deputy Director, Field OperationsIlona Ferraro, Manager, Report Production
Abt Associates Inc.
$11455 Wheeler Street
Cambridge, Massachusetts02138
2
U4.4cAl ici . dA c-t.,_Contract Manager
--,.....,ity Control Reviewer Management Reviewer
*c_47
;

oh.
Table of Contents
FOREWORDPurpose and OrganizationBackground
I. EXECUTIVE SUMMARYIntroduction 1
Home S.art Families and Staff 1
Major Findings 1
The Program 3
Future Issues 4
Services to Families 5
Future Issues 6
II. METHODOLOGY: BATA COLLECTION AND ANALYSIS . . . 7Data Collection Instruments 7
Site Visit Staff 10Training 10Data Reduction and Analysis 11Terminology 11
III. HOME START FAMILIES AND STAFF 12Introduction 12Data Sources 13Home Start Profile 13
Project Enrollment 15Program Stability 17Family Turnover 17Staff Terminations 18
Focal Parent and Home Visitor Characteristics. 18Focal Parent 19The Home Visitor 19Home Visitor/Focal Parent Education 22
Home Visitor/Focal Parent Match 22Ethnicity 22
Summary of Findings 27Future Issues . . . . 28
IV. THE PROGRAM 29Introduction 29.
Staff Time Use: Preliminaries ... 29Director Time Use: Overall Profile 30Specialist Time Use: Overall Profile 30Director Time Use Variations Across Sites . . 32Specialist Time Use: Variations Across Sites . 34
3

V.
Table of '-ontents (Cont'd.)
Monitoring of Home Visits .
Home Visitor Time Use Profile .
Variations Among Sites . . . .
Summary of Findings . . . . .
Future Issues .
3638434344
SERVICES TO FAMILIESIntroduction . 45 ;
Data Sources . 45The Home Visit. 46
Preliminary Concepts 46The Typical Visit 49Interaction Patterns SOContent of the Home Visit 53Home Visit Activities 53Tone of the Home Visit 58The Overall Visit 59Focus on the Parent 59Focus on the Child 61Variations in Pattern 64
Special Services 65Referral Content Areas 65Referral Recipients 66
Summary of Findings 69Future Issues 72
TABLES 73
APPENDIX ASpring Data Collection and Instruments
APPENDIX BHome Visit Observation
InstrumentReliability
4

CHAPTER II:
II-1
CHAPTER III:
III-1111-2111-3111-4III-5111-6
111-7
CHAPTER IV:
^
LIST OF FIGURES AND TABLES
METHODOLOGY: DATA COLLECTION AND ANALYSIS
Spring 1974 Data Collection Instruments 9
HOME START FAMILIES AND STAFF
Home Start Profile At-A-GlanceFamily and Focal Child EnrollmentHome Visitor ProfileHome Visitor/Parent Education_ProfileEthnicity Focal Children/StaffStaff/Focal Children Ethnic Match:
Summative vs. Non-Summative SitesHome Visitors/Focal Children Ethnic MarchSix Summative Sites
THE PROGRAM
1416202123
24
26-
IV-1 Time-Use/Directors and Specialists 31IV-2 Percent of Time Spent on Amdinistration
and Family Support 33IV-3 Presence and Types of Specialists by Site 35IV-4 Specialist Time Use - Meekly Basis
"Direct Family Service Time" 37IV-5 Monitoring of Rome Visitors 39IV-6 Home Visitor Time Use 41IV-7 Family Support Services 42
CHAPTER V:
V-1
V-2V-3V-4aV-4bV-5
V-6
V-7V-8V-9
V-10V-11
V-12V-13
SERVICES TO FAMILIES
Home Visit Content AreasAverage for Six Summative Sites
Primary InteractionsDominance PatternsHome Visit Content Areas by SiteHome Visit Content Areas by SiteSite Comparison-Percent Time Spent on
Child Content AreasSite Comparison-Percent Time Spent on
Parent Content AreasActivity Modes for Home Visit ParticipantsHome Visitor/Focal Parent InteractionsFocal Parent/Focal Child InteractionsHome Visitor/Focal Child InteractionsSubject Areas of Successful Referralsby Site
Referral Recipien4 by Type of ReferralAverage Number of Aeferrals per Family
5
4751525455
56
5758606263
676870
mt;

TABLES
CHAPTER III:
111-6
LIST OF FIGURES AND.TABLES (CONT'D)
HOME START FAMILIES AND STAFF
At-A-Glance, 6 Summative SitesAt-A-Glance, 10 Non-Summative SitesAverage Quarterly Family TurnoverStaff Turnover by SiteEducation MatchFocal Parents/
Home VisitorsStaff/Focal Child Ethnic Match by Site
CHAPTER IV: THE PROGRAM
IV-1 Director Time Use-Weekly BasisIV-2 Specialist Time Use-Weekly BasisIV-3 Director/Specialist Staff Hours Per WeekIV-4 Home Visitor Time UseIV-5 Average Number of Hours Spent In Home
Visits with Families
CHAPTER V: SERVICES TO FAMILIESV-1 Site Comparison-Percent Time Spent on
Various Activity Modes DominantV-2 Site Comparison-Percent Time Spent on
Various Activity Modes Non-Dominant17-3 Site Comparison-Percent Time Spent on
Various Activity Modes Non-Dominant andDominant Combined 89
V-4 Time Spent on Activities for Dominant Mode 90V-5 Time Spent on Activities for Non-
Dominant ModeV-6 Home Visitor Dominant Interacting with
Focal ParentV-7 Home Visitor Dominant Interacting with
Focal ChildV-8 Focal Child Dominant Interacting with
Home VisitorV-9 Focal Child Dominant Interacting with
Focal ParentV-10 Focal Parent Dominant Interacting with
Home Visitor 96
V-11 Focal Parent Dominant Interacting withFocal Child
V-12 Summary - DomInant Patterns by SiteV-13 Dominant Patterns - AlabamaV-14 Dominant Patterns - ArkansasV-15 Dominant Patterns - KansasV-16 Dominant Patterns - OhioV-17 Dominant Patterns - Texas-HV-18 Dominant PaLterns - West Virginia
74757677
7879
8283848586
87
88
91
92
93
94
95
9798og
100101102103104

FOREWORD
Purpose and Organization
The purpose of the National Home Start Evaluation is toassess the impact of the program on enrolled parents and child-ren. The data presented in this volume were collected duringthe spring of 1974 to describe services being provide& tofamilies and to determine the extent to which projects aremeeting the Naticnal Home Start Guidelines.. In addition, thedata were used for a preliminary cost-effectiveness analysispresented in a separate volume.
One focus of the report is the examination of selectedprogram-wide implementation features that seem especiallyimportant for future use in planning and operating home-basedalternatives to Head Start. This analysis is presented pri-marily to assist Head Start projects in their efforts toimplement home-based options as part of the Innovation andImprovement Program.
The Program Analysis volume is divided into five chapters.The first chapter serves as an executive summary of the-mostimportant findings of the report. The second, Methodology:Data Collection and Analysis, discusses the spring datacollection effort in detail. The last three chapters con-centrate on the three major Hoie Start program dimensions:
Home Start Families and Staff, which presentsgeneriT7Ni005Rriaa ET-EHe projects, suchas the stability of both staff and families,population characteristics and staff/familymatch in terms of ethnicity, age and education-al background.
The Program, which describes both Home Start staffEIffie use and home visitor supervision.
Services to Families, which examines the actualEZETTailt azia-EWfWiral services provided forparticipant families.
While each chapter emphasizes the findings and issues presentedin the Executive Summary, details also are given on the ration-ale for addressing these areas, the methodologies for collectingdata and other related findings which give a more completepicture of the Home Start Program.
7

Background
In the Spring of 1972 fifteen Home Start projects beganoperation, and a sixteenth project began a year later. Theprimary focus of Home Start, as stated in the Home Start Guide-lines, has been to "enhance the quality of children's lives bybuilding upon existing family strengths and utilize parents asthe major educators of their own children." To accomplishthese goals, each project has been funded for about $100,000per year to provide Head Start type comprehensive services toapproximately eighty families with at least one child between.the ages of three and five.
In the most recent quarter Home Start served 1150 familiesand 1443 focal children. The average focal parent is 31 yearsold, has four children, nas not graduated from high school,and does not work outside the home. A total of 179 staffmembers, of which 114 are home visitors, serve the 1150 families.The average project employs a director, seven or eight homevisitors, and one to three specialists who assist home visitorsin familiarizing participant parents with available communityresources. A home visitor usually is older than the mothersshe serves, is a mother herself, and has completed high schooland some college. She is from the same community as the familiessh( lerves and is of the same ethnic background. Once a weeksh( ,isits each of her families for nearly an hour and a half.The content of the visit is primarily child-oriented and includesboth school readiness for the child and educating the parentabout the child.
Previous Reports
From March 1972 to March 1973 projects were involved pri-marily in making the program operational; documentation of theinitial planning and implementation stages is found in descrip-tive case studies written about each of the local projects(Interim Report I). The first Program Analysis volume (InterimReport II) showed that most projects had reached a satisfactoryoperational level. At that time, there was some concern thatthe number of tasks that the home visitors were expected toperform was not commensurate with their low salaries and limitedtraining. It was also suggested that more systematic and con-centrated approaches to soliciting community involvement beinitiatbd.
During the second year, data collection and analysisfocused on two implementation issues: the actual dynamics ofthe home visit and the spending patterns of projects. Theanalysis of home visits pointed out strengths in the childtreatment and in the social atmosphere which was created. How-ever, there was concern about the adequacy of the parent tteat-ment. A major recommendation of Interim Report III was that

;ray
^
the national office seek to strengthen the home visit's focuson the parent as the primary educator of the child by provid-ing technical assistance in training and supervision.
In Interim Report Iv a marked increase was noted in theamount of parent involvement. The home visit was found to beadequate, provided that sone Home Start activities were main-tained by the parent between weekly visits.
This report continues to examine services to familiesas specified in the Home Start Guidelines. In addition project 41
stability and success in matching staff with family are pre- 1
sented, as are staff time-use and home visitor supervision.The results of the summative evaluation and the cost-eifective-ness analysis are reported in separate volumes.
9
iii

EXECUTIVE SUMMARY
Int?:oduction
Major findings about Home Start-family and staff charac-teristics, the Home Start program and services to families arepresented here for easy access by national program administra-tors. Following the finding in each section is a list ofFuture Issues which should be addressed in the next phase ofthe Home Start evaluations. The sections also include a re-view of the data sources which support the listed findings.
In order to provide a framework for reviewing the fin-dings listed below, the relevant sections of the NationalHome Start Program Objectives are included here: They are:
To involve parents directly in the educationaldevelopment of their children;
To help streAgthen in pare-,ts their capacityfor facilitating the general development oftheir own children;
To demonstrate methods of delivering compre-hensive Head Start type services to childrenand parents ... for whom a center-based opera-tion is nct feasible.
Home Start Families and Staff
Data used in identifying the following findings and fu-ture issues came from the Home Start Information System, theHome Visitor Background Questionnaire and the Parent Inter-view, which is a part of the Summative Measurement Battery.Information about programs was collected from all sixteensites; the one-to-one home visitor/parent match data wereobtained from the six summative sites only.
Major Findings
Length of Program. At present Home Start is aprogram serving families for a one- rather thana two-year period. Over 60% of Home Startfamilies left the program during the second
10
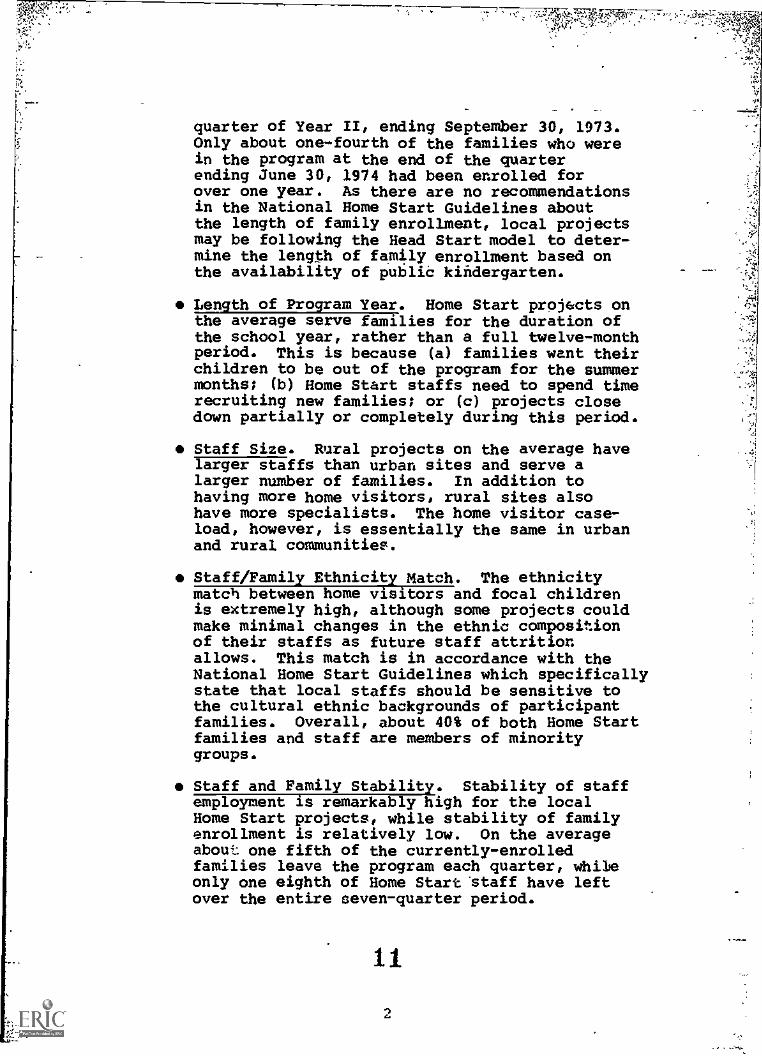
quarter of Year II, ending September 30, 1973.Only about one-fourth of the families who werein the program at the end of the quarterending June 30, 1974 had been enrolled forover one year. As there are no recommendationsin the National Home Start Guidelines aboutthe length of family enrollment, local projectsmay be following the Head Start model to deter-mine the length of family enrollment based onthe availability of public kindergarten.
Length of Program Year. Home Start projects onthe average serve families for the duration ofthe school year, rather than a full twelve-monthperiod. This is because (a) families want theirchildren to be out of the program for the summermonths; (b) Home Start staffs need to spend timerecruiting new families; or (c) projects closedown partially or completely during this period.
Staff Size. Rural projects on the average havelarger staffs than urban sites and serve alarger number of families. In addition tohaving more home visitors, rural sites alsohave more specialists. The home visitor case-load, however, is essentially the same in urbanand rural communities.
Staff/Family Ethnicity Match. The ethnicitymatch between home visitors and focal childrenis extremely high, although some projects couldmake minimal changes in the ethnic compositionof their staffs as future staff attritionallows. This match is in accordance with theNational Home Start Guidelines which specificallystate that local staffs should be sensitive tothe cultural ethnic backgrounds of participantfamilies. Overall, about 40% of both Home Startfamilies and staff are members of minoritygroups.
Staff and Family Stability. Stability of staffemployment is remarkably high for the localHome Start projects, while stability of familyenrollment is relatively low. On the averageabout: one fifth of the currently-enrolledfamilies leave the program each quarter, whileonly one eighth of Home Start 'staff have leftover the entire seven-quarter period.
11
4
. .44fri
r
Future Issues
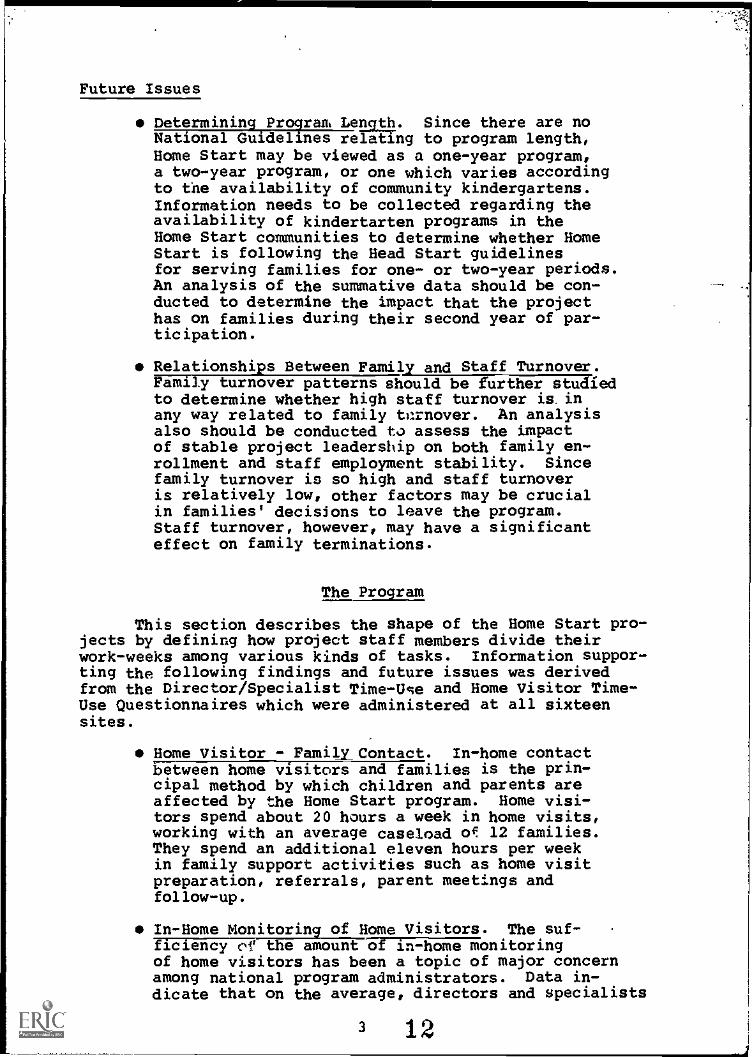
Determining Program Length. Since there are noNational Guidelines relating to program length,Home Start may be viewed as a one-year program,a two-year program, or one which varies accordingto the availability of community kindergartens.Information needs to be collected regarding theavailability of kindertarten programs in theHome Start communities to determine whether HomeStart is following the Head Start guidelinesfor serving families for one- or two-year periods.An analysis of the summative data should be con-ducted to determine the impact that the projecthas on families during their second year of par-ticipation.
Relationships Between Family and Staff Turnover.Family turnover patterns should be further studiedto determine whether high staff turnover is inany way related to family thrnover. An analysisalso should be conducted to assess the impactof stable project leadership on both family en-rollment and staff employment stability. Sincefamily turnover is so high and staff turnoveris relatively low, other factors may be crucialin families' decisions to leave the program.Staff turnover, however, may have a significanteffect on family terminations.
The Program
This section describes the shape of the Home Start pro-jects by defining how project staff members divide theirwork-weeks among various kinds of tasks. Information suppor-ting the following findings and future issues was derivedfrom the Director/Specialist Time-Ule and Home Visitor Time-Use Questionnaires which were administered at all sixteensites.
Hon o_Iisa_yrilContact. In-home contactbetween home visitors and families is the prin-cipal method by which children and parents areaffected by the Home Start program. Home visi-tors spend about 20 hours a week in home visits,working with an average caseload of 12 families.They spend an additional eleven hours per weekin family support activities such as home visitpreparation, referrals, parent meetings andfollow-up.
In-Home Monitoring of Home Visitors. The suf-ficiency of the amount of in-home monitoringof home visitors has been a topic of major concernamong national program administrators. Data in-dicate that on the average, directors and specialists
3 12

accompany each home visitor on a family visitonce a month. In projects where in-homemonitoring is less frequent* either becauseof small staff or an administrative decision,staff members spend more time helping homevisitors prepare for their home visits_eitherby discussing individual families or providingmaterials and ideas for the home visit.
Training/In-Home Time Tradeoff. An increasein the amount of in-service training a homevisitor receives results in a decrease in theamount of time spent in the home with families.It appears that the home visitor has a rela-r-tively fixed amount of time to spend on familycontact and training and an increase in onetakes time from the other.
Specialist Time-Use. Because a specialist'sjob is less rigidly defined than that of adirector or home visitor, there is interestin determining how specialists spend theirtime in general, and what effect their pres-ence has on Home Start families in the project.On the average* specialists spend more timewith families and less time on administrationthan do directors. However, because theirjobs are so individual, there is wide varia-tion in how much time specialists actuallyspend with families. Specialists in non-summative sites reported spending a higher_proportion of their time in direct contactwith families tban those in summative sites.
Future Issues
Types of Supervision. In response to generalconcerns about in-home monitoring of homevisitors, an analysis of the various kinds ofsupervision staff members give home visitorsshould be performed. One alternative to in-home monitoring is having administrative staffprovide extensive aid and discussion outsidethe home* as well as actual materials and cur-ricula for the visit. Since this model isalready used in some sites, it should be studiedcarefully.
Impact of Less Training. Because of the trade-off discusseu above between home visitor trainingand in-home contact time with families, the
134

,, AC
impact of lesd training on the quality of thehome visit and summative outcome data needs tobe.investigated. It may be possible to deter-mine a range of time within the week in whichtraining is most effective.
Services to Families
The following conclusions were obtained primarily fromthe Home Visit Observation instrument, which was completedin the summative sites for over a hundred home visits. TheHome Start Information System, and the Record of Home VisitActivities are additional sources of information._
Major Findings
Reinforcement of Hone Start Activities. In interimReport IV, May 1974, it was reported that theChild Treatment was adequate "if one presumes thatsome of these activities recur in the hOme betweenweekly visits.* Data collected this spring duringhome visit observations indicate that an effortis being made to encourage the parent to reinforcethe home visit. During most home visits observed,there was some discussion of Home Start activitiesperformed since the last visit and to be addressedbefore the next one.
Home Visit Content. The content of home visitsemphasizes the educational nature of the HomeStart program. Although the home visit is pri-marily child-oriented, two of the most commoncontent areas address the child's educationfrom different points of view: school readi-ness for the child and educating the parent aboutthe child.
Home Visit Interactions. The two major interac-tions during a home visit are between the homevisitor and focal parent and between the homevisitor and the focal child. Each type of inter-action takes place for about one-third of thevisit. Concern has been voiced in earlier re-ports that home visits were too child-orientedand were not sufficiently involving the parent.The current findings, however, indicate that thehome visitor interacts with the parent as muchas with the child. In addition, the parent,child and home visitor are involved in three-way interactions for a significant portion ofthe time. When the home visitor and child are
145

interacting, the parent frequently observes theactivity, a mode whioh is quite conducive tolearning about the needs of the child.
Nutrition. There is little emphasis on nutritionaTIFIETTEe home visit. Only a very small portionof home visietime is devoted to discussing eitherparent or child nutrition.
Future Issues
Effect of Home Visitor Background. Home visitorbackgronnd has been analyzed to 'describe.the over-all profile of the home visitors and to providehome visitor/parent match data. This informationshould also be studied to find out if the backgroundof the home visitor has any effect-on the contentemphasis or activity modes of the home visit.
Effect of Family Time in Home-Start. It is pos-sible that the shape of the home visit changes asa family spends more time in the Home Start pro-gram. _Family enrollment data should be combinedwith home viz..t observation data to determine whatimpact the length of time a family has been in theprogram has on the shape of the home visit. A simi-lar study should be made of the length of time thehome visitor has been with the family.
Nutrition Education. As mentioned above, therat iscurrently little emphasis during the home visiton nutrition issues. A more'complete study shouldbe done to discover how home visitors are attemptingto help parents provide better nutrition for theirfamiPes, what the successes and failings of thesemeth)ds are and what alternative means might beprovided to accomplish the goal of improvingthe nutrition practices of Home Start families.
15
6

II
METHODOLOGY: DATA COLLECTION AND ANALYSIS
In the spring of 1974 a major effort was undertaken toobtain the data needed for this volume. Included inthis effort were the design ol, data collection instruments,the training of persons for site viaits and Instrument.administration, the collection of data from sixteen HomeStart projects, data reduction and a computerized analisisof the data using both statistical packages'and custotr-written programs. The major objectives of the datacollection effort were:
To obtain information about project chan es inorder to update the project case studies, withparticular emphasis tn project succetses.withfamilies and Problems the projects encounteredduring the past year. ease studies can beVfound in a separate volume of this report.
To study selected Erogram-wide implementationissues, such as project stability, family:enroll-ment, staff organization, utilization of time byhome visitors and other staff,-supervision of homevisitors, home visitor background and characteris-tics and match data about home visitor and focalparent age, educational background and ethnicity.
To assess the adequacy of the Parent/Child treat-menE7S6Eh7ffaring the homeViiit, in terms FEcontent, interactions and activities and betweenhome visits, in terms of continued parental supportof activities and utilization of community resources.
o To collect information about actual projectexpenditures for the past eigHtEFEths Wcgtoberthrough May), considering both U. s. Office ofChild Development.grants and levered resources.Information regarding costs aro reported in theCost Effectiveness Analysis volume.
Data Collection Instruments
Information for this volume was obtained primarily fromfour data collection instruments: the.Home Visit
16
7

Observation Instrument, the Record of Home Visit Activities,the Home Visitor Background Questionnaire, and the StaffTime-Use Questionnaire. To coliect information-about thedynamics of the-home visit, on-site personnel accompaniedeadh home visitor in the six summative sites on visits with ,
up 'to three randomly selected-families. .The observersrecorded major characteristics of the visit, such aa the person ..t.the home visitor interacted with most often, the activities 't
conducted, the materials ueed, the content of activities andthe duration of the visit. Information also was collected to ,-;..,s;
determine whether parents conduct activities suggested by thehome visitor with their children between home visits-. Pre-vious program analysis,reports stated that the home visittreatment wras adequate'provided that.tha focal parent rein-forced the Home Start activities between home visits. -Toverify the relative accuracy of the Home Visit ObserVationData, home visitors were asked to keep records of home visitactivities on three home visits to each family involved in thesummative evaluation.
,
0...111rws.1611.
In the six summative sites, data on home visitoreffectiveness also were collected to determine whether perceivedeffectiveness by supervisors had an effect on parent and child H..?
outcomes or changed the nature of the parent/child treatmentin the home visit. An attempt also was made to link perceivedeffectiveness to such home visitor background characteristicsas previous employment experience or educational background.Since no relationships were found among perceived effective-ness, home visitor background, parent and child outcomes orparent/child treatment, no data will be presented on thistopic in the report.
In addition to the information collected during the sitevisits, data from the Home Start Information System also wereused to describe changes in the overall program staff, familiesand services over cumulative three-month intervals. Th3 Infor-mation System contains data on both summative and non-summativesites on a project level..
Figure II-1 shows the instruments that were used duringthe spring date collection effort. It states the general pur-pose of each instrument and indicates the sites in which theinstrument was administered: summat0e, non-summative andHead Start. Copies of the instruments can be found in thevolume entitled Program Analysis: Instruments. A briefdiscussion of data quality and problem areas with each of theinstruments used during the spring is in Appendix A of thisreport.
178

Purpose
MOMS 11111 SliaNd 1914 DaTh tOLLIMION iNfateninia
ject update
11600ter Interview
ISEMIVisiterfollowuplasevlems it) -
Parent tale*. Intereieve
aftMoil emmeadituree andligemblikensm
irmulat1. Naas Visitors
2. Simostore and Specialists
1H. Sims Vlei;or effectiveness
S. Smterview(e) with none
1Italie, Sogervisor
istar:d
. pact et nom* Visit Activillesiseltadministered)
it aservsti
Secretive Information regarding project changes, 'exeltiagg project @temente endsnorts that are making difference mere amain**, lacing theee-instrumata. theDirector also identified and discussed two faeily success stories. Sons Visitorsthen were asked to describe the sucrose story. Saralee almoner, interviewedalma their invelvemist in acme Start and thoscoleat's *wet.
S eamen meet to vpdata the project cam studies.
Inetrumenta tete designed to collect information regarding levered personnel andnea-peeiroOl resources, payroll dots (iecludieg triage benefits and travelelltramico) and fentrectoriconeultent service. tor the eightmsonth paint Oct.threagh May.
SOU were collected in order to damning cost per focal child, focal parent.rhildron (0-2 yrs.) aad family for the entire program on the heels of OOD dollarsanddollers levered in the community. The data oleo were need la an analysis Of
line-itet and functional budget tor the program. Specific peyroll Womackebteined-were used to dotemine the costa grovidirg certain types ot "orrice*to families.
TAM qnfatlennalroal sera used to Astoria** borDame Visitors, giro:toes andepecleileta upset their time dUrtng the last week (Or paled) and low they egadtheir time oath* average.
Beta were tonitelatermlne the moppet of time vent in direct services to familiesand la other indirott service area..
laad Start projects were interviewed regarding the projects: model budget,mailer of full- and pert-time staff, number ot thildres enrolled, overage dillyectodena, end other specific Information regarding center operative*. netamere MOO tO deterldite the per-Child COSS in seed Start.
The Instrumento': designed to obtain $ renting of Some Visitors la terms of theirffectiveness la eight different areas. the data were eeelysed to determine itperrived effective:noshed any iepect on child and parent outcomes.
Some Visitors provided information regarding their age, weber and ow' ofchildren, educational background, previous job experiences, 110010.**OnaMaleindex, length of thee with the project, and =lbw of families served.
Date were used in the demographics section of the report In anolytiog Moms
Visitor effectiveness, differences in family tombola petterns, variationsis salaries and todetarmins the mita between Home Visitor and tsmilysge.
ethnicity, and education.
Record* of nom visit activities mere completed on three visits to each ofthe Some start test families. On the tecori, none visitors indicate the
amount ot time spent during the visit on five typesOf child ectivitios ande lm parent activities. moms Visitote also recorded information recordingreferrals, amount of preparation tine tor the visit, the extent of focalparent involvement, location of the visit, and it anyone accompanied theaces Visitor and tor whet purpose.
The Sword was designed to obtain informatio regarding the tine -use petternfor Woe Visitors while they are in the home. These tinmuss data supplementNoo Visit observation Date end were mod to study Variations in featly treat-ment, to detetnine the cost of delivering specific services, and to link fa*hoes tine-use patterns to child and foully outcomes.
Amnions of amp* famiiies pet none Visitor vere randomly selected to beobserved on a tarsier home visit. The instrument vas designed to determine
major 1 aaaaa ctitm pottery*, the amount ot time spent on venous child andparent activities, and to produce evidence at home visit continuity. tpi
instrument also provides data on the 100.400ot the visit, behavior pitternsof the three major participant* in the visit, planned activities and materiels
used. The data wore used in enaiyeos of tiermse Radon., variations intreatment, cost of delivering specific orvices end to again link in-home
tineuse patterns to child and family oetcomea, uch the owe es the Record
of twos Visit Activities.
18
9

'C
Site Visit Staff
Much of the data presented in this volume were collectedduring site visits to all sixteen Home Start projects. In-cluded was information about:
case studies
actual project expenditures and levered resources
staff time use
Head Start
home visitor effectiveness
home visitor background
The site visits were conducted by twelve experienced field 11staff members, most of whom had previously visited Home
i IStart projects. Nine were Abt Associates employees1, and
2s
three were from the High/Scope Educational Research Foundation. ti1Field visits to summative sites lasted approximately 4-1/2 days!
while the non-summative site visits took only 3-1/2 days.
Training
Field staff were trained in the administration of thesite visit instruments in a two-day training session whichwas held in Cambridge, Massachusetts. No training was providedfor the Home Visitor Background Questionnaire and the Recordof Home Visit Activities since both instruments were self-administered by home visitors. To ensure that the Record ofHome Visit Activities was completed systematically in all sixsummative sites, Home Start Project Directors were asked totrain their staffs, using materials prepared by Abt Associates,Inc.
Field staff also were not trained in the Home VisitObservation Instrument since the data were obtained by on-sitecommunity interviewers responsible for summative data collection.Home Visit,Observation Instrument training was an integral partof a six-day training session for on-site community interviewerswhich was held in Clinton, Michigan. Approximately two days oftraining were devoted to the Instrument. Training techniquesused included observation and scoring of video-taped homevisits and rehearsed scenarios.
1David Bullis, Robert Fein, Peter Fellenz, Ezra Gottheil, CarolHaflinger-Harris, Kathy Kearins-Hewett, Marrit Nauta, WesleyProfit, Lorrie Stuart
2Dennis Deloria, Leigh Goedinghaus, John Love
10 19

.1
Data Reduction andlaglaiii
Because of the magnitude of the-data which were collectedand the complexity of the computations which were madet_theanalysis required for this report could.not-have been performedwithout substantial-computer support. Therefore, data fromthe instruments were,coded at Abt Associates and-were:trans-lated to a machine-readable format-through keypunching.Both processes werer carefully monitored to reduce.the amountof error. Coding was Spot-checked for accuracy.throughOut and -
all keypunching was verified. TV° computer facilities wereused to perform analysis: the CDC-6400 at the SmithsohianAstrophysical Observatory (SAO) in Cambridge, Massachusetts,and the IBM 360/67 at the University of Michigan. TO'Computethe relative amounts of time spent from information recordedin the Home Visit Observation and Staff Time-Use Instruments,special programs were written using Fortkan TV. In addition,many crosstabs, frequency counts and regressions were runusing either the Statistical Package for the Social Sciences(SPSS) at SAO, or the Michigan Interactive Data AnalYsis System(JUDAS) at the University of Michigan. It should.be noted,however, that even though the analyses are htmericallyaccurate, the-varied processes which are reported in thisvolume cannot be easily quantified. Hence, the figures whichare presented should be interpreted as giving only a generaldescription of the Home Start program, and not as a statistic-ally accurate statement.
Terminology
In this report, project refers to the individual sites,while program refers to the National Home Start Program. -Focalparent and focal child are those members of the enrolled fiiIIFwho participate in the home visit. Most often the focal parentis the mother who is at home and not working. While the familymay contain several children, there is always one child-who isthe focus of the treatment and who is'therefore considered thefocal child. At times in this volume we have omitted the termIcTaT. and used just parent or child.
For referencing purposes, figure applies to those chartswhich are located within the body of the chapter; a figureusually appears directly after the page on which it is firstmentioned. Tables are in a separate section located at the endof the volume.
20
11
-11
3..
.M.4
III
HOME START FAMILIES AND STAFF
Introduction
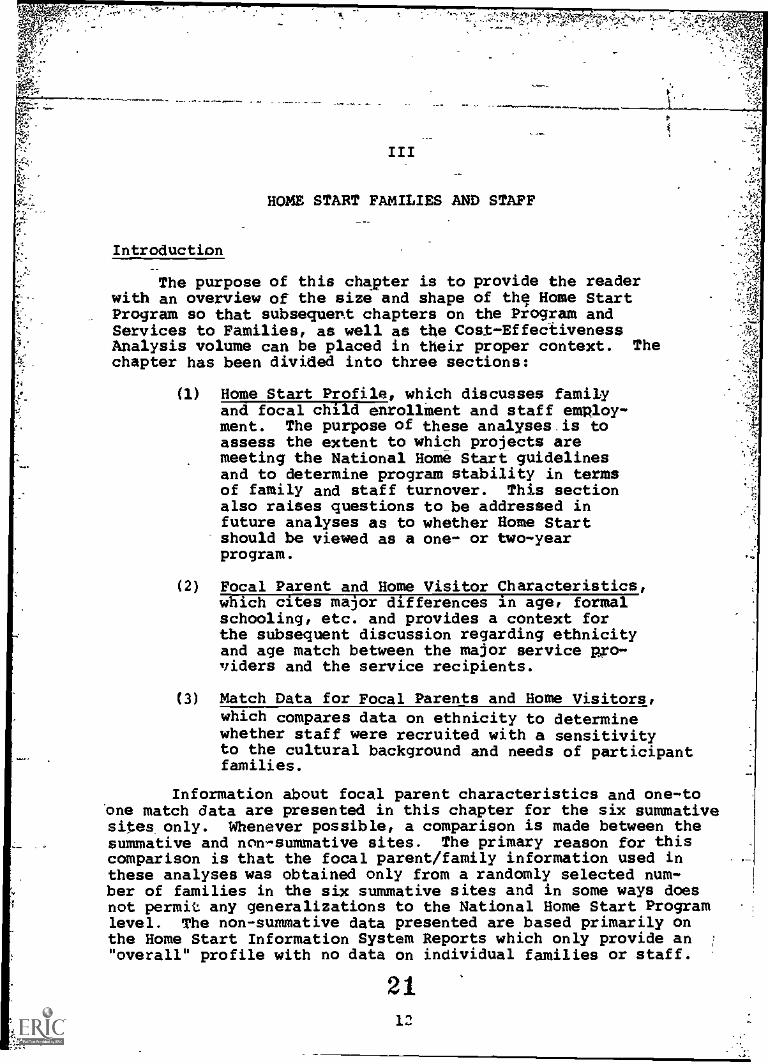
The purpose of this chapter is to provide the readerwith an overview of the size and shape of the Home StartProgram so that subsequept chapters on the Program andServices to Families, as well as the Cost-EffectivenessAnalysis volume can be placed in their proper context. Thechapter has been divided into three sections:
(1) Home Start Profiler which discusses famiZyand focal child enrollment and staff emRloy-ment. The purpose of these analyses is toassess the extent to which projects aremeeting the National Home Start guidelinesand to determine program stability in termsof family and staff turnover. This sectionalso raises questions to be addressed infuture analyses as to whether Home Startshould be viewed as a one- or two-yearprogram.
(2) Focal Parent and Home Visitor Characteristics,which cites major differences in age, formalschooling, etc. and provides a context forthe subsequent discussion regarding ethnicityand age match between the major service pro-viders and the service recipients.
(3) Match Data for Focal Parents and Home Visitors,which compares data on ethnicity to determinewhether staff were recruited with a sensitivityto the cultural background and needs of participantfamilies.
Information about focal parent characteristics and one-toone match data are presented in this chapter for the six summativesites only. Whenever possible, a comparison is made between thesummative and non-summative sites. The primary reason for thiscomparison is that the focal parent/family information used inthese analyses was obtained only from a randomly selected num-ber of families in the six summative sites and in some ways doesnot permit any generalizations to the National Home Start Programlevel. The non-summative data presented are based primarily onthe Home Start Information System Reports which only provide an"overall" profile with no data on individual families or staff.
21

11.
Data Sources
Information about home visitors and staff was obtainedfrom the Quarterly Home Start Information System Report and fromthe Home Visitor Background Questionnaire which was completed byall home visitors. Focal parent data were obtained from theQuaiterly Information System Report and the Parent Interviewwhich is part of the Summative Measurement Battery.
Home Start Profile
Figure III-1, the "Home Start Profile At a Glance,"-pre-sents information about the major participants for the entireHome Start Program: staff, home visitors, families and children.In the table, data from the most recent Hone Start InformationSystem reporting period (quarter ending June 30, 1974) are com-pared with data from the four previous quarters.
There is a high degree of stability in the sixteen pro-grams. For all participants, the maximum difference in totals andaverages is 23%. These differences can be attributed to,an in-crease in family and focal child enrollment during the last tworeporting periods of Year II (quarters ending 12/31/74 and 3/31/74.The maximum difference in the six summative sites was 25% and innon-summative projects 20%. Overall, the average number, of focalchildren is higher for the six summative sites than for non-sum-mative sites (93 vs. 77). 1
On the average, rural projects2
serve a higher number offamilies (66 vs. 69) than-urban projects and have larger staffs(13 vs. 9). The difference in staff size is primarily the resultof the overall lower wages which are paid to home visitors inrural areas, enabling projects in these areas to hire additionalspecialist or administrative staff.3 It is interesting to notethat although rural projects employ a slightly higher number of%home visitors, the home visitor family caseload is essentially thesame for urban and rural projects.
1
2
In the determination of the average number of focal children inthe six summative sites, West Virginia data was excluded becauseof the unusually high number of focal,children the project enrollswith support from a supplemental grant. At-A-Glance Pfofiles arepresented for both Summative and Non-Summative sites in Tables
and 111-2.
In the analysis of regional variation, the following projectclusters were used. Urban: California, Kansas, and-Ohio. Rural:Alabama, Arkansas, North Carolina, Tennessee, Texas-TMC, Utah andWest Virginia. The remaining six projects cannot be consideredtruly urban or rural because they serve both urban and ruralfamilies or because they are atypical projects in other ways.
3See Figure IV-3 for the number and types of director/specialistsemployed by each of the projects.
13
22_
.f
I.

HOME START PROFILE Most Macent
AIP:A-:GLANCE
SPRING 1974
16 SITES
2Year III
Quarter /(6/30/74)
# of Total Staff 179
Average 11.2
Range 7-15
# of Home Visitors 114
Average 7.3
2-14_Range
# of Families 1,150
Average 72
Range 38-135
# of Families/ 10.1Home Visitor
Range 6-20
# of Focal Children 1043
Average 90
Rdage 51-206,
# of children (0-5) 2,220---.
?..: r.i-..,. 139
60-206
10 of children (0-18)
I2.veraqe
R-1..ac
3,381
211
131-585
1 _+No uata reported for this Quarterfrom Texas -TMC and Arizona; data
from pravious.Quarter use:1.th avoid
Figure III-I
Previous Quarters_Year IIQuarter IV(3/31/74) I
Narter /I/0 431/73)
Quartor IT(9/3C/73)
Qurtar IIa
(6/10/74)
:pift-arenee .1
189 I 189 185 176 -- 7
11.8-,
8-17
j 11.8
9-16
11.6
8-18
12.6
6-17
11
114 1 116 111 104 10
7.3
4-11
7.3
4-11
6.9
3-10
7.4 7,
4-10-
--
1,274 1,232 1,106 1,042 18
80 77 69 74.1.
11
..0..
..:
. 4...58-143 51-149 26-157
, .. .47- 98
11.2
8-15
10.6
7-15
10.0
6-16
10.0
8-16 I
1
!,
i
!
!
11
,
.
23
19
1,639
A
.1
"-t
r
i
.1,502 1,330 1,265.,
90
48-143
102
62-256
2,452
94
53-234
2,366
83
27-222
18
14_ _ .
18
2,099 2 008
153
92256
148
83-234
131
51-222
ti 143
06-167
2,9523,599
.3,473 3,077
225 217 1 192 211 14:
1143-731 146-651 1138-411 160-429
2 No data reported for this Quarter from Texos-TRC;data from previous Quarter used to avoid serious distortion.
osvateimia--nnt- included-in this. Quarter._
24
*;

r.;
. Project._ .Enrollmentl
Figure 111-2 presents the enrollment of both families andfocal children for the sixteen Rome Start programs. Four projectshad reached or exceeded the enrollment requirement of 80 familiesat the end of the last quarterly reporting period. Five.sites hadan'enrollment ranging from 66 to 77 families, while Nevada andHouston, Texas show the lowest enrollment figures with less than 50
families. Massachusetts, North Carolina and Alaska previouslyreceived special permission to serve fewer than 80 families. Oneproject, Alaska, doubled enrollment since the last report.
There was a 12% decrease in the number of families en-rolled in the program since the last quarterly reporting period.The major reason for this drop in family enrollment was that alarge percentage of focal children left the Home Start programat the end of May or in early June prior to entering kinder-garten or first grade in September, 1974. This suggests tfiat theHome Start program year ie parallel to the regular school yearand serves, families for lass than twelve months. Many projectsuse the summer months for recruiting new families, while a fewcurtail program operations or close down completey during thisperiod.
As indicated above, one of the major reasons for familiesleaving the-project was that the focal child reached kindergartenor first grade age. This was especially true in Houston, Texaswith almost half of the families leaving for this reason and inNevada which reported that 18t of the focal children were readyfor kindergarten or first grade. A substantial increase in familyenrollment is expected during the quiRWriENIE4 September 30,1974, unless projects are planning to serve fewer families inanticipation of the conclusion of the Home Start DemonstrationProgram in June of 1975.
As Table III-3 (second column from the right) shows,family turnover is highest during the second quarter of the HomeStart program year (July 1 through September 30). During thisperiod, 65% of the families enrolled in urban projects and 60%.of the rural families left the program. In only three projects,family turnover totaled less than 50%4 three had'a turnover of.from_SO to.59110ceven from 60 pp 69%; and twoprOjects'from 70 to82*. This suggests_ihat Some Siert is ,
families for_a one- rather than a twvaYear period.- The findingis supported by data reported in the Information 'System whidh show -*
that about one fourth of the fathilies enrolled at the end of thequarter ending Jane 30, 1974 had been program participants-forover one year'. The range among prolecta is between-94- and 55%It should be noted, however, that of all families who left the
_
4'44
'Arizona and Texas-TMC are not included in this discussion becauseof insufficient data.
2515

.4t
N."
4 A
4
Alabama
Arkansa
Kansas
Ohio
Texas-H
West Va
Alaska
Arizonal
FIGURE I11-2
rAmIur AND FOCAL CHILD ENROLLMENT
Quarter Ending June 'A, 1974= Focal *Children
Family Enrollment
4* Ale al* 40 ..... via MO de* 83. . 135
am am 0 el
ea ass a IFInclSIO dEP ° 6 74 * 91
all OW OF MO Oft....... 4m0 MP
96 I
ft,
'44,e
1383.
.53.
California
Mass.
Nevada
New York
No.Carolina
Tenn.
Texas-TMC 1
Utah
67 84 I
89
52.51
48511
dm, 80
ay 53 f
..... ...77
41.0 . vinOnv
war .16 'dm. 4mo
891
991
102 TM,
I I II 1 I i 1 1 -4
0 10 20 30 40 SO 60 70 80 90 100 110 120 130 *140 1504
1 Figures presented here were reported for previous quarter.
2616

,tfil ...e........
project during the quarter ending June 30 (182)1, 39% had beenenrolled in the project from 1: Aonths to 2 years.
An exami.nation of the National Home Start Guidelines showsthat the National Office did not specify to local projects whetherfamilies were to be served for a one- or two year period. Those tenprojects which were not involved in the summative evaluation arepresumed to have followed the Head Start model for family enr...111-ment.2 Head Start projects serve families for either a one- ora two-year period depending on the presence (and availability)of public kindergarten projects in those communities. Althoughno information is presently available on the presence of publickindergarten projects in the sixteen Home Start locations, thisissue will be studied further in subsequent reports to determinewhether projects located in communities with no kindergarten tenW-1to serve families for longer periods of time.
Program Stability
As Figure III-1 shows, the overall program profilehas remained relatively stable over the last five quarters.Stability of family enrollment and staff employment variedconsiderably, however, from project to project. The followingdiscussion focuses on these two issues in more detail.
Family,Turnover
An analysis of previous information system reports forQuarter III of Year I through Quarter I of Year III,,coveringthe period 12/31/72 through 6/30/74, shows that an average of13 families or 18% of the total number of families served, leaveeach of the projects every quarter.3
Although the quarterly turnover rate is the same for ruraland urban projects (12), urban projects terminate a higher gercentage of their families (19% vs. 15% in rural sites). This isthe result of an overall higher average enrollment in rural sites.Family turnover in summative and non-sumnative sites differs onlyslightly (let vs. 190. An analysis also will be conducted todetermine the impact the program has on summative families duringthe second year as compared with the first year they were programparticipants.
1Arizona and Texas-TmC data were not included here since noquarterly rePorts were received on time for these two projects.
2The six summative projects were not able to follow these re-cruiting guidelines because of the evaluation design whichspecified the amount of time families had tO be enrolled in theproject.
3The number of families that left the Texas-TMC project were notincluded in this analysis because of insufficient data.
17 27

-Major reasons why families leave the project as reportedin the quarterly Information System reports are: (1) childentering kindergarten or first grade (31%), (2) moving fromservice area (25%), and (3) other (23%). Other reasons notedwere: parent was dissatisfied with the project or disinterested(11%); parent became employed or increased'income above HomeStart guidelines-(8I); and family illness (1%). The percentdistributions for the.termination categories are approximatelythe same for urban and rural projects.
Family turnover i4 each of the Home-Start projects ispresented in Table 111-3, which shows the average number of fart-ilies that left the program each quarter and the peiCent of familiesthat left the program calculated from total family enrollment.Also shown is an adjusted turnover figure which averages familyturnover for all quarters except the second quarter of year 11,in which most of the turnover_occurs. The adjusted turnoverfigures indicate what happens in an average quarter during thesChool year. The last two columns on the right hand side of thepage present the turnover figures for Quarter 11, Year I/ and theadjusted quarterly range.
Staff Terminations
In contrast with the findings presented in the previoussection, Hame Start projects are remarkably stable in terms ofstaff employment, with overall staff turnover for fifteen projects1
totaling only 12%, or an average of 9 for each project over theseven-quarter period. Rural sites show a slightly higher staffturnover than urban sites (13% as compared with 12%), and on theaverage, terminate more staff members since the staff is larger.Staff turnover for each of the Home Start projects is presentedin Table 111-4.
Focal Parent and Home Visitor Characteristics
Presented here are brief profiles of the proglam recipients,the focal parents, and the major service providers, the homevisitors. The profile data are followed by a discussion about theeducational background of focal parents and home visitors. Theinformation is presented to provide a context for subsequent dis-cussions regarding ethnicity.
1No information included for Texas-TMC because of insufficientdata.
2Data was obtained from the High/Scope Educational ResearchFoundation Parent Interview collected in the Spring of 1974.
283,8

Focal Parent
In the spring of 1974: 192 focal parents were interviewedat the six summative sites. It was. determined that the averagefocal parent is 31 years old: has four children: and has completed ,
tenth grade. ,Only one quarter of the parents had completed highschool, 1% had completed'exactly one year in-college and 2% hadcompleted two or more years in college. About one of every fivefocal parents were working at the time they_were interyiewed. .
No important differences in family characteristics were foundbetween urban and rural sites or between'summative and non-summative projects.
The Lome Visitor1
The "average" home visitor is a 34 year"old female andhas been with the Home Start project for,17 months. She servesan average of 12 families who are misited once a week. Thehome visitor caseloads range from 8 in West Virginia to 15 inArizona.
Two thirds of the home visitors-were employed prior tojoining the Home Start project: primarily holding.jobs in someway related to their work as hone visitors. Although.only 12%had a positiori working with children before they becaee home
80% have a family of their own. About one,fourth of Akthe home visitors have children between the ages of,s0 and 5;As is shown in Figure 111-3, ihe Nome Visitor Frofile: -6% of thehome visitors worked with parentswParent-Coordinat=e-for-such programs as Head Start/ or as Welfare dr Social:ServiceAides. Another 15% worked in positions related'tcrhailth andnutrition.
The average home visitor had completed high school andspnt some time in college. Only 14% did, not completeshigh
.school; 6% are college graduates; and another 6% hold'graduatedegrees. At the time of the interview almost half of -the homevisitors were continuing their education by attending-classes-or-courses which were not part of the Home Start in-service trainingprogram. This is in response to the National Home.Start Made-lines which encourage local projects to provide career develop-ment opportunities for staff in terms of training and upwardmobility.
r---A total of 111 home visitors completed the Backgroune guestio4-naire4 or 97% of the total number of home visitors emgloyed inthe program on June 30, 1974.
29
19
6,
31
. ='..?1,?,

pm 4 ar most VISrloto6!--.XILIEri2P, 1.111.11111E.11
PERMINVERIUM119111
.. _
6 7 7 7 S S 6 MI5= I"Amersre /smut Ram 27c . vieitftrs 2-3
41 39 ' 40( 6.- 7 30-53 (2146
34aa-at
42044
31a- ,
-294.. 7_ Willirgnrilli.
1427.4
4 :: Yore riellore66.74
... with Children1004 1004_ 66.74 - I604 03.14 1004 71.4%6-- 100* 1004 1004 61.34 =WEI - 40, .604
IINOtale e t4ce sis:tor.a'own =Ares 2
.3 Ell754 304 a
3
174a
4.5 4 - I_
104 o 434
S a 5 2 3 MILIZMIE4 o4 Wamo Visitors sAth
544Madsen 0.3 years 0 29% 404' 0 674 lit
.. -
3,44 .2-04- 27%
Anwr4g* loAtth of Time 17 or*.
.- with the 7ro eet 07..
11 nos. aa woo. aa roe..-3 oa-so
14 woo.7
21 eon. 23 nos. 1460.1 - 6 02-30 oo.a
09100.06 9
15 wog..
24604.8
12nos1. 7
11304. 17 800.,l.f
19 3001as
' 19'wos 1790s.04
;Aymara of (ours Worked 41Last Woe% 40.44
'40 420-e3.
11 .. 16 10011-171 I5.20) (01-11 )
40
12711-45s
40 MR%13 - --9
(09-16) toz-us
15 40--
46 . .30L!..r.i
'40 1119 ...,-t-:
. el3 -
literals of Vanities in a3nams %leiter Caseload (06.49)
a31
1209- 3
4(10.12)
'15.
114461. 1.1 10-109a121* . 07512
. 10,.3*6.12
. .. 0
, (0442).12Mal
;hoover* 0 of tmo Visite 13
La week 06.1836 6 V)3-09 04-19 07.12
11
10-110 7 9
40. a os-u11- 2
11 10 16
(
' 46' ' . .14
, 4le
. 06-13- p.
.
:a.,.
'171.CCASthai. secZMOND
..
.
-
.
. .
2
A a Ur* Visitors lathsone Witt S4hcol 0 0 1 0 1 1 0 2 0 2 1 0 4
-...41
12.4 (13.94)
4 of tore Visitors whoCcrr:red Rirh School 1 0 1 2 7 2 1 3 - 3 1 6 34.4 (34.61
4 of tare visitors withSono Zotleoe 4 1 1 7 3 a a 4 a o 1 4 1 ' S 4 4 44.6 (40!2t)
.4 of iftervisitors with
Colleae Verve* 0 2--
o o o o . o 0 6.4 0.64)
s of Voce Visitors withPratt 0104usto Dom* o o o 1 o 3 o o o o a a o 1 1 6.1 (5.5%)
4 of Ramo Visitors TakingCOutikle 6 3 2 a o 30.3 (45.44)
(WWIteS Dtricvnerr
4 of Par* Vlsiture who war*Pr eviously freloved
3 3 IIM S ME 74.4 (67.44)
4 of ltr.o Visitors who were 0Teathere
o 3 1 0 1 0 o o o o 0 o 0 s (4,500
4 of E1141 visIsars who markee
C a 1loath hildren s Aides,9 *a( tors
0 o a 0 0 o 2 1 o 1 3 11.5 (12,2s)
4 of Woos 4141tors who Worked-.-- .-vith Parents 40 Social
Sorric* ALAN. ParentCoereir tore. te. o
.
IMIIIIIIUIIF o o 1 o 1 ME 6., (6.1011....to. oho Worked. Wealth ?Wel 0 o
1
o
Milla
o 1 IIII 01 0 o
0
a o 5.7 (5.24)s of Hope V141:ore uho Worked
of Waco ViSlto'S who Workod ,.in Another Job *elated to vKW. Start
o a 1 o o o o a ..
4.2 (3.34)
% of Koo Visitors who Wakedlo a 4ch Qualatod to i
1,444 Start
a 1 o 1 o 3 1 4 1 2 3I 2 1 1 4 ago) mast
Itost of tho gereentages do not ouo to 1004 for such eatogorise ea educatiocul bac/woad aM provioua weplersent.this I. the result of a high locidanco of nieeing data tor eons of the04 categorios.

34:1'4 ttif
_ ..,
1,4.,
;;0. -
,
'
t . 1...-.....1., ..... .. p1. n wse40.1....M....ere,,,,tRilt %. . ,,e-2 ,r4.^Ar,,...-- ^- - - - ......*-................1.4.a....* 6.4.4.......... r ...4.1cso., .. .. . . .
,
FIGURE III-4
HONE VISITOR/PARENT EDUCATION PROFILE.
,!.6 Summative Sites Spring 1974
?se:
.
% of Families Served by Home Visitor with:
Sites,
Higher EducationSame EducationBackground lower Education
Alabama 12%' 88%
Arkansas Oit 97% 3%
, . ...... ..._
Kansas 7% 78% 15%
io 19% 65% 154
Texas-Houston 19% 62% 19%
W. Virginia 21% 71% 8%
TOTAL: 13% 77% 10%
3 221
.0;
'51t4*,r,45L,-
S
4,t-4=y-
Ir.../.01
.:731
7t.ig
z
,

N:
Home Visitor/Focal Parent Education
Figure 111-4 shows that, as anticipated, most homevisitors received more educational training than focal parents.While a number of home visitors have backgrounds similar tothose of the families they serve, overall they received moretraining than focal parents, both in terms of formal schoolingand courses provided as part of the pre- and in-service trainingand career.development programs. 77% of the families are servedby home visitors who have received more educaticin than the focalparent while only 10% of the families are served by less-educated home visitors. Table III-5,which shows an overalleducation profile for the entire program,supports the findingsthat home visitors are generally more educated than the familiesthey serve.
Home Visitor/Focal Parent Match
Ethnicity.
The National Home Start Guidelines specifically state thatlocal staffs should be,sensitive to the cultural background and .
needs of paLticipant families. To determine the extent to whichlocal projects are trying to achieve a cultural/ethnic match be-tween home-visitors and families, three types of ethnic match - ---data are presented here. Figure 111-5 shows the ethnicity pro-file of focal children and staff (including both home visitorsand other staff) for the entire.Home Start program. This isfollowed by a discussion of match data on a project-by-projectbasis using family-staff ratio figures regarding ethnicity. Theinformation presented in Figure 111-6 is based on the Home StartInformation System report for the quarter ending June 30, 1974.To confirm the project by project ethnic match findings, one-to-one match data are presented for home visitors and families whowere involved in the summative evaluation. The one-to-one matchdata provide only limited information about the six summativeprojects.1 The figures presented in this section are based on theethnicity of focal children, which is assumed to be the same asthe focal parent.
Figure 111-5 shows the ethnicity of focal children andstaff for the entire Home Start program. 41% of the focal child-ren and 37% of the staff are members of minority groups.2
1Ethnic data was obtained only for families involved in the
summative evaluation. A random sample of families were selectedfor participation, excluding most Spanish surname families whodid not speak sufficient English to participate in the summative
evaluation.
2Ethnic data presented here includes data from previous quarterlyInformation System reports for Arizona and Texas-TMC.
3322
st.
At'
4% Other
FIGURE 111-5
ETHNICITY FOCAL CHILDREN -STAFF
ALL SIXTEEN PROJECT
6/30 1974
t-t441,,
2% Other
7% American Indian
t;_tztt
Fool Child
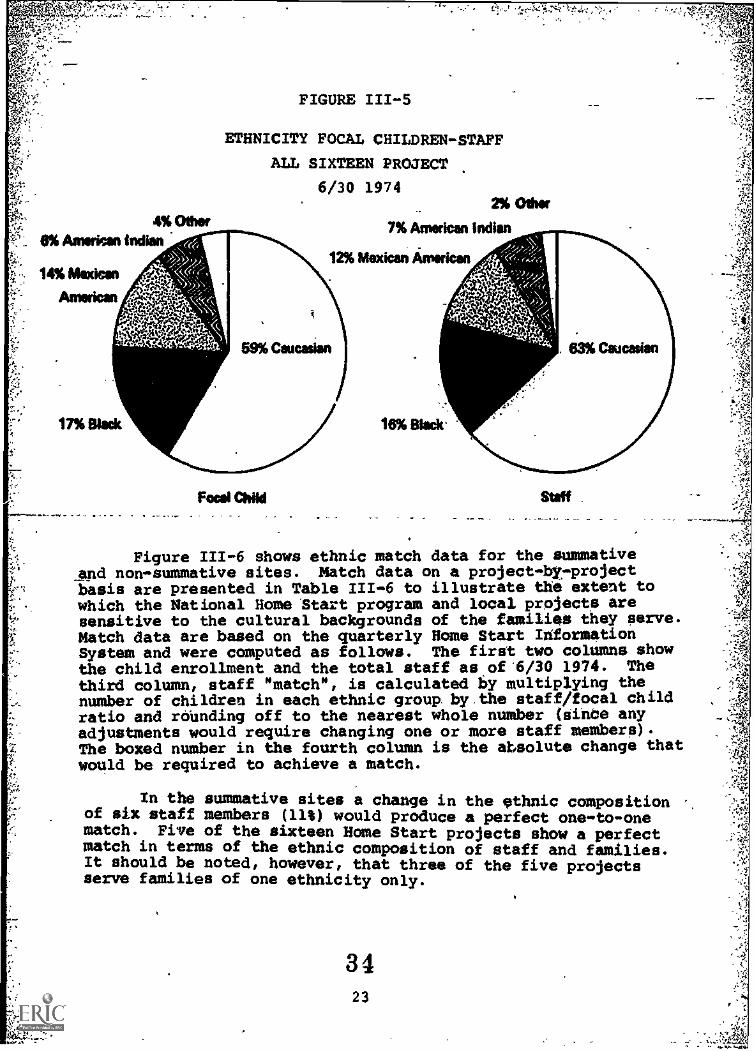
Figure 111-6 shows ethnic match data for the summative_and non-summative sites. Match data on a project-by.-projectbasis are presented in Table 111-6 to illustrate the extent towhich the National Home Start program and local projects aresensitive to the cultural backgrounds of the families they serve.Match data are based on the quarterly Home Start InformationSystem and were computed as follows. The first two columns showthe child enrollment and the total staff as of 6/30 1974. Thethird column, staff "match", is calculated 6y multiplying thenumber of children in each ethnic group by the staff/focal childratio and rdunding off to the nearest whole number (sinCe anyadjustments would require changing one or more staff members).The boxed number in the fourth column is the absolute change thatwould be required to achieve a match.
In the summative sites a change in the ethnic compositionof six staff nembers (11%) would produce a perfect one-to-onematch. Five of the sixteen Home Start projects show a perfectMatch in terms of the ethnic composition of staff and families.It should be noted, however, that three of the five projectsserve families of one ethnicity only.
3423
.40
;J

FIGURE 111-6
STAFF/FOCAL CHILD ETHNIC MATCH:
SUMMATIVE VS. NON-SUMMATIVE SITES
6/30 1974
StaffFocal Staff Chang
Children Current "Match" to Matdhl
Six Summative Sites
Subtotal:Cauc. 410 40Black 201 23Mex-Amer. 43 5PuertoRican 17 1
Amer. Ind. 1 0Other 1 0
yMM.
1
39 +121 +27 -2'
2 -10 -10 0 ';
69 '6 ,Iri
,;,2.
Ten Non-Summative.Sites
673 69
Subtotal:Cauc. 443 72Black 40 5Alaskan 20 2Amer. Ind. 88 12Mex-Amer. 152 16Polynesian 9 1Oriental 7 2Other 11 0
770 110
Total:Cauc. 853 112Black 241 28Mex-Amer. 195 21Amer. Ind. 89 12Alaskan 20 2PuertoRican 17 1
Polynesian 9 1Oriental 7 2Other 12 -0
1,443
401.4011.1.11
179
3524.
6843
1220111
1 0
+4+1-1-10
-4 .1-1-1
110 12
107 +525 +327 -612 03 -1
2 -11 01 -11 -1
.1111111111.1m.
179 18

"While project directors might consider changing tl,e
overall ethnic composition of their staffs when replacing cur-rent staff or hiring additional staff, there are several fac-tors which constrain projects from achieving a perfect ethnicmatch between staff and families based on family-staff ratios.
(1) The primary reason for an imbalance in ethniCmatch is that home visitors are assigned toserve enrolled families in a certain geographicarea. Since families are recruited on the basisof need, rather than ethnicity, an ethnic im-balance is likely to occur unless home visitorsstart serving-families scattered throughout thearea. This would be impractical because of thetransportation costs involved and the increasedtime required for transportation. The amount ofdirect services to families then would be de-creased and meaningful parent involvement inthe project would be more difficult. ,
(2) The relatively high turnover of families ineach of the local Home Start projects shouldalso be considered. A perfect match during onequarter may challp completely as new familiesare recruited.
Since the Information System data present only a partiallyaccurate picture of ethnic match, information will be collec-ted during subsequent site visits about the ethnicity of allfamilies in each home visitor caseload.
,
"41
-:4.
This information will be used to determine whether thehome visitor has the same ethnic background as the majority ofthe families she serves. This is suggested as an appropriateguideline for staff/family ethnic match.
Figure 111-7 presents the one-to-one xiatch between homevisitors and focal children in the six summative sites. Alsoshown is the percentage of Caucasian families served by a mi-nority home visitor and the percentage of minority focal childrenwho are visited by a Caucasian or other minority home visitor.On the right-hand side of the graph, an ethnicity profile forthe six sites is presented for home visitors and focal childrenwho were involved in the summative:evaluation only.
There is a high ethnic match (65%) between home visitorsand summative focal children in the six summative projects, rang-ing from 61% to 100%. Kansas shows the lowest one-to-one match ofall six projects, although the overall ethnic: profile of allfocal parents and home visitors is fairly balanced. The primaryreasons for this match imbalance were pointed out in previousdiscussions.
3825

"41
Figure III-7
HOME VISITORS/FOCAL CHILDREN *TM= MATCH
6 Summative Sites Spring 1976
44st,
........4.-..
. . .
4
-k--1--
Caucaeian Minority Minority - nem 'min s4 -.1.4Families Families Families
. .
.
'
---?Al
s Served by Served bli Served byOne-to-One, Minority Caucasiar Other Minority Caucasian Black Meddcan America Other
Site Match H.V. H.V. H.V. Oe. Child. ME.V1 Foe. Chia.' ILV: ci H.V 71.1MIT"FrFli,. H.V..w41'
i A.. .......Alabama 75% 3% 22%
-- SO% 69% SO% 31%.... -- d3.,
.
Arkansas 90% 10% -- -- 97% 137% 3% 13% ..... ... .:4;31-.,
Kansas 61% 25t 14% -- SO% 39% 46%
54: Ill
Ohio 97% .... --3% 25% 25% 69% 72% 3%
Texas- SS% -- .... 15% -- --.56% 70% 30%
Houston
V. Virginia 100%-- ow. I 100% 100%
.... 44.1%
1111111ft
est , 6% 6% 3% St% St% 36% 38%74 111111
it--
AverageL
1The ethnic profile pruented here for focal children is not representative of all the chidren served by these projects. This is primarilycaused by the elimination of Spanish-surname families who do not speak sufficient tnglish to enable them to participate in the summativeevaluation.
37 39

;.,
/./41't. ", ,*' Y:1
In general the ethnic match is extremely good for homevisitors and focal children throughout the Home Start program.In fact, Home Start shows as much or more sensitivity to thecultural/ethnic backgrounds and need* of families as otherhuman service programs in the country.
Summary of Findings
A summary of the major findings and issues for futurestudy that have been identified in this chapter are presented hestes'
Only one-fourth of the Home-Stari prOjects are-meetin the enrollment re uirement of SO-families.
18 sprir y t e resu t o a arge.)ft
families leaving the program during the quartetending'June 30 because the focal child walkenter-ing kindergarten or first grade in the fall. Anincrease in family enrollment is expected duringsubsequent quarters.
Home Start projects on the average serve fam-ilies for the duration of the school_year,rather than a full twelve-month peri. Thisis because (a) families want their children tobe out of the program for the summer-months;(h) Home Start staffs need to spend tilerecruiting new families; or (c) projects closedown partially or completely during this period.
Data show that Home Start is a _program servingfamilies for a one- rather than a two-yearperiod. Only about one-fourth of the families whowho left the program during the quarter endingJune 30 had been in the program for over a year.This may be the result of local projects fol-lowing the Head Start model for determining thelength of family enrollment based on the avail-ability of public kindergarten in those com-munities.
Stability of stafflamployment is remarkablyhigh for the local Home Start projects, whilestability of family enrollment Is low.
3927

Rural projects on the average have larger staffsthan those in urban sites and serve a larger numberof families. The home visitor caseload, however,Is essentially the same in urban and rural com-munities.
The ethnicity match between home visitors andfocal children is extremely high, although someprograms could make slight changes in the ethniccomposition of their staffs as future staffattrition allowed.
The educational profile of home visitors andfocal parents shows that home visitors receivedmore training - only a small percent of thefamilies are served by home visitors with lesseducation than the focal parent.
Future Issues
Information.needs to be collected regardingthe availability of kindergarten programs inthe Home Start communities to determine whetherHome Start is following the Head Start guide-lines for serving families for one- or two-yearperiods. An analysis of the summative dataalso should be conducted to determine the im-pact that the project has on families duringtheir second year of participation.
Family turnover patterns should be studiedfurther to determine whether high staff turn-over is in any way related to family turnover.Ananalysis also should be conducted to assessthe impact of stableproject leadership on bothfamily enrollment and staff employment stability.
Additional data regarding the ethnic match ofhome visitors and families in their caseload needto be collected to determine the extent to whichprojects are achieving ethnic match.
An analysis should be conducted to determinewhether younger home visitors have a differentimpact on families than those who are older orthe same age as focal parents.
4 0
28
%.}

THE PROGRAM
Introduction
This'chapter iS concerned primarily with the average weeklytime use reported by the project direCtor, specialists and-homevisitors. In each case, a general picture of how the staff mem-bers spend their time is presented, followed by a discussion ofvariations at the site or individual level. The discussion willfocus on the following aspects of staff time use: 2
i4.4:
Who takes the major responsibility for admin-istration of the project?
What effect does the number of staff membershave on time-use patterns?
What is the impact of specialists on the directservices provided to families?
What is the impact of specialists on the homevisits in their projects?
How much in-home monitoring of home visitorsare staff mempers providing and are othertypes of home visitor supervision being sub-stituted?
What is the effect of increased home visitortraining on the amount of time home visitorsspend with families?
Staff Time Use: Preliainaries
Before presenting the findings of the time use data analy-sis, it is important to point out certain probl3ms which existwith the data collection.
Staff members were asked to record the number of hoursin their average work week, as well as the number of hours they'spent per week on various tasks such as financial planning,parent meetings, etc. The sum of the time spent on tasks seldomequalled the number of hours in an average work week. One rea-son for this discrepancy is the difficulty inherent in self-esti-mates of time spent on job tasks - especialll when no week isreally "typical." Another reason for the discrepancy is that some
29
41

tasks occur not weekly, but monthly, or even during_one concen-trated period during the year (such.as recruitment). rn order to; .1k=Obtain a OOMprote picture-of how-stan-members-spend-theix-tithe hours spent on these tasks was divided by the appropriatenumber of weeks and considered on-a,weekly basis.
.
The figures presented in this section include both thenumber of hours in an average-work-week and the total of all .
time 3pent on job tasks. Percentages were calculated on the ba0i-of the total task time, rather than the work-week time.
Project staff have been divided, into three main groups 7airectors, specialists, and home viSitors. The director gi45,170"also includes assistant directors; specialists include nutri!,.:.tionists, nurses, and other health workers, education speciaristshome visitor supervisors, psychdlogists and social servicecoordinatoks.
Director Tiii-Use: Overall. Profile
The function of the director as administrator becomes-clear when director time-use is viewed at the Home Start levei.Directors on the average spend close to half their time onadministrative duties, which include financial planning, enrollingfamilies, public relations, obtaining donated resources, etc. Inaddition, there are two categories, family support and stafftraining, on which each of the directors spends close to 20% ofthe time. Training staff includes both preparation for and atten-dance at staff training sessions; family support includes aidinghome visitors in planning home visits, referrals, parent meetingsand driving time to meetings and referrals. About half of thetime spent in family support is uerwl to help home visitors pre-pare home visits. In-home contact and staff supervision eachaccount for only about 5% of the directors' time.
Table IV-1 (page 85) shows the average percentage dis-tribution of time across these five categories for all 16 sites,including separate averages for summative and non-summative sites,as well as overall averages. Also included are hours worked perweek aS reported in the Time-Use Questionnaire and hours per weekas calculated by summing the five time-use categories. Figure IV-1shows graphically the average time percentage distribution con-tained in the last line of Table IV-1.
Specialist Time-Use: Overall Profile
The overall profile of a specialist's week differs fromthat of a director primarily in two of the five time-use cate-gories. In-home contact takes up considerably more time, account-ing for 16% of a specialist's time, on the average. The extratime spent working directly with families comes primarily fromthe administrative category, which decreases from about half for
230

FIGORg 117.4
ma-USE/DIRECTORS AHD
,
DIRECTORTIME-USE
8.7 hoursStaff 'Minis, 1K-21; L4 hOurs
lorhosne Guinn
22.9% 10.S bowsFamily Support
5.1% em 2.4 homyStaff Supervision
SPECIALISTTIME-USE
36.3% 1113.6 hoursAdministrative andOther
21.6% se ILO hoursStaff Training
16.3% in 6.0 hoursWhom, Contact
44% em 1.6 hoursStaff Supervision 21A% em 7.9 hours
Family Support
DEFINITION OF CATEGORIES
Administration and Other:
In-hoone Contact:Family Support:
Staff Supsovision:Staff Traininv:
.1
Enrollment finance, public relations, obtaining levered reAunespreparing evaluations, planning and attending conferencesDirect novices to familiaMph* horns visitors papers visits, Murals, meetings with parentsdriving families to Wands or meeting(Accompanying home visitors on visits to supervisePreparing and attending staff training sessions
433 1
.,
1,4
"
directors to just over a third for specialiats. .Thie heavieremphasis on direct service to families itraXpectedlimmspecialists, who_have_specific_skillsLand,JoustiedgeLin_azeitS.such as health, nutrition and education wilibh,cau be.directlyimparted to the participant families-. -Although_the.percentageof time spent on family support (referrale'vrersmAymietings,helping home visitors prepare visitt) 'by directois, and spec7ialists is comparable, specialist* spend-fewerhourg workingwith hone visitors tor prepare tome ilsits and'Imore onreferrals and-parent-meetings.
N; ;
Table TV-2 shows specialists*. time-kuse across sites in,thesame format as Table TV-1 for digeotors. Figure TI7'-i containspie-charts of both director and specialist tilmeuse ormarall.illustrates the similarities and differences in how theseclasses of staff use their time.
While approximately six hours mer week arsspeht in .directfamily contact, many specialists spend a larger portion of:their,time performing tasks which sake tbi home :visttOsinoie effectivein their contact with families. This int:andel snot' jobs asresearching, ordering and organizing materials for home visitorsto take with them, maintaining resource files, developingeducational curricula and preparing materials for staff training .0
meetings. In addition, specialists often spend a considerablee-munt of time making referrals and keeping and reviewing recordsof the Home Start families and children.
Director Time-use: variations Across Sites
There is a wide range among sites in percentage of timespent in two categories: administration and family support;all other categories are fairly constant across sites.The percentage of directors' time spent in administration ishighest in Alabama (over 60%) and lowest in Kansas (25%),Family support occupies almost no time in Texas-Houston buttakes up over half of the directoes time in Kansas. Figurewhich lists the sites in descending order according to time spenton administration and ascending order according to time spent onfamily support, suggests that a decrease in administrative timeusually corresponds to an increase in family support time, Inall sites above the horizontal line, directors spend more thanhalf their time on administration and less than one quarter oftheir time on family support. Below the line the situationis reversed. The number of directors per site also is includedin the table.
Some of these variations can be accounted for by thenumber of staff members employed at each site, In both Texas-THC and Kansas, where administrative time is lowest and family
4432
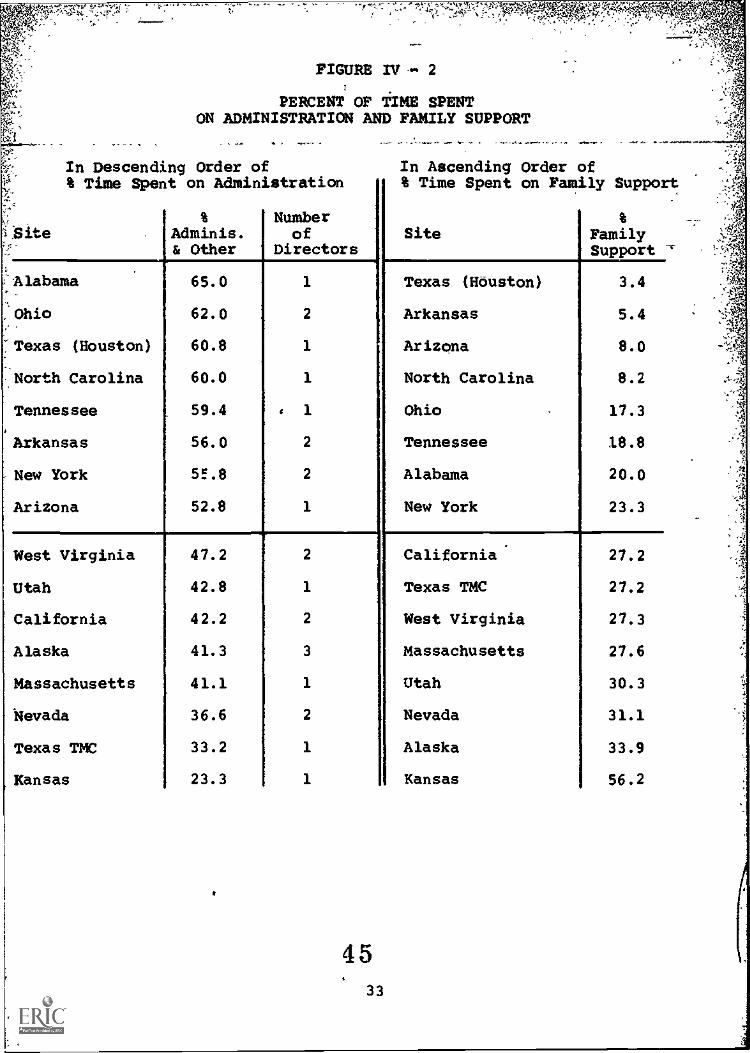
FIGURE rv-- 2
PERCENT OF l'IME SPENTON ADMINISTRATION AND FAMILY SUPPORT
In Descending Order of% Time Spent on Administration
Alabama
Ohio
'Texas (Houston)
North Carolina
Tennessee
Arkansas
-New York
Arizona
West Virginia
Utah
California
Alaska
Massachusetts
evada
Texas TMC
Kansas
In Ascending Order of% Time Spent on Family Support
Adminis.& Other
Numberof
DirectorsSite
k
FamilySupport -r
65.0 1 Texas (Houston) 3.4
62.0 2 Arkansas 5.4
60.8 1 Arizona 8.0
60.0 1 North Carolina 8.2
59.4 1 Ohio 17.3
56.0 2 Tennessee 18.8
5!.8 2 Alabama 20.0
52.8 1 New York 23.3
47.2 2 California. 27.2
42.8 1 Texas TMC 27.2
42.2 2 West Virginia 27.3
41.3 3 Massachusetts 27.6
41.1 1 Utah 30.3
36.6 2 Nevada 31.1
33.2 1 Alaska 33.9
23.3 1 Kansas 56.2
4 5
33
,

." z`111:7`117:*
support time comparatively high (especially Kansas, where it isover 50%), there is only one staff member -- a director -- whomust-perform all the administrative duties. In both sites, thedirector apparently decides to spend less time in administrationand more in more family-oriented activities -- family support orin-home contact.
Specialist Time-Use: Variations Across Sites
Twelve of the sixteen sites have at least one staff memberwho is a specialist in some field Such as nutrition# healtkoreducation. The number of specialists per site ranges.from none'(4 sites) to 6 (Arkansas). The most common typo of specialistis a medical person, usually a nurse; 8 dr the 16'sites'employsuch a specialist. Seven sites have either an educationalspecialist or educational aide, while three have nutritionists.Figure rv-3 shows the presence of different types of specialistsby site.
Note that of the three urban sites -- California, Kansas,and Ohio -- only California has a specialist. Except forTexas-TMC and West Virginia, rural sites have two or morespecialists -- ranging as high as five in Utah and six inArkansas.
Some of the specialists did not spend a full work,week onHome Start, and nany were Oared with Head Start. Table IV-3lists the number of hours each specialist reported working perweek, as well as a site total of "specialist hours" and a sitetotal of "director and specialist hours," Arkansas# as well aShaving the highest number of specialists, has the greatestnumber of specialist hours -- 146 per week,-- and the largestnumber of director and specialist hours -- 221 per week. Thelowest number of director/specialist staff hours is in Kansas,with 40 per week; the effect of this on the director's time-usewas discussed above.
There is more variability in the specialists' time-usethan in that of the directors. Time spent on in-home contact,for example, varied from almost none in Arkansas (alsothe site with the most specialists) to one-third in NorthCarolina; percentage of time spent on administration ranged fromhalf in Arkansas to under a fifth in Alaska. These variationsdo not seem to be correlated with the number of specialists, thenumber of specialist hours or the total number of staff hours.
The presence or absence of particular specialists seems tohave no impact on the content of the home visit, as reportedin the Record of Home Visit Activitieir. For example, of thesix summative sites, Kansas is highest in percentage of timespent on health and nutrition (both parent and child) and hasno specialists at all. Alabama and Arkansas, which followclosely behind, both employ nutritionists and Arkansas also has
4 634
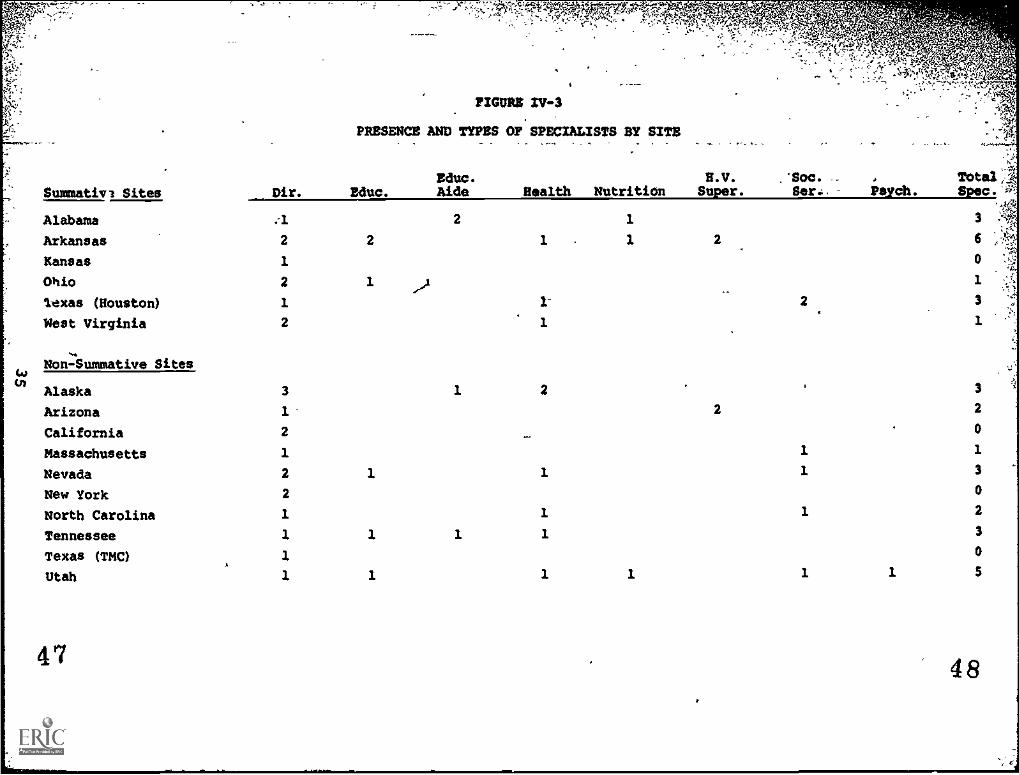
FIGURE IV-3
PRESENCE AND TYPES OP'SPECIALISTS SY SITE
Alabama
Arkansas
Kansas
Ohio
Texas (Houston)
West Virginia
North Carolina
Tennessee
Texas (Tw)
mah

a health specialist. Educational specialists similarly appearto have no consistent impact on time spent on educational areassuch as school readiness and teaching the parent to educatethe child.
There is a significant difference in specialist time-usebetween summative and non-sumnative sites. In an effort toascertain how much specialists were actually providing familieswith concrete information and aid, tine spent on in,hoMe contact,naking referrals and driving families to referral appointmentswere combined. This category showed much heavier use in now.
.
summative sites than in summative sites: in nonTsummative sites,specialists spent about a third of their time on the average onfamily service compared to half that (about 1/6) in summative -
sites. Some of this extra time apparently came from staffsupervision, which was generally lower in nom-summative sites.Figure rv-4 shows direct family service time for specialistsin all sites.
Of all Home Start jobs, the position of specialist ismost individual, since each.specialist has different responsi-bilities. For example, one educational specialist spends notime in direct contact with families and almost none withhome visitors. Her tine is spent primarily in curriculumdesign. On the other hand, one health specialist spends overhalf her time in direct contact with families and another sixthmaking referrais; an educational aide spends htlf her time workingdirectly with families. Still other specialists especiallyhome visitor supervisors -- reach families by helping homevisitors prepare their home visits for over a quarter of theirtime. BecauSe of these wide variations, no generalizationsabout specialists can be made even at the site level.
Monitoring of Home Visits
An issue which has been of special concern to the nationalprogram director in the Office of Child Development has been lackof evidence that regular supervision in the home is being providedfor home visitors. The Director/SpeciiIiiE filiW Use Questionnaireprovided specific self-report information regarding: (1) theamount of time per week directors or specialists normally spendaccompanying home visitors to the home for purposes of supervision,and (2) the number of home visitors that were supervised each week.In both summative and non-summative projects, Directors/Specialistsreport that the average home visitor is supervised once a month.These figures are based on the total number of Home Visitors thatare supervised weekly. No information was obtained to determinewhether the amount of supervision provided differed significantlyfrom home visitor to home visitor. It might, for example, bepossible that home visitors who recently joined the Homo Startproject staff receive more frequent supervision than others whohave been with the project for longer periods of time.
4936
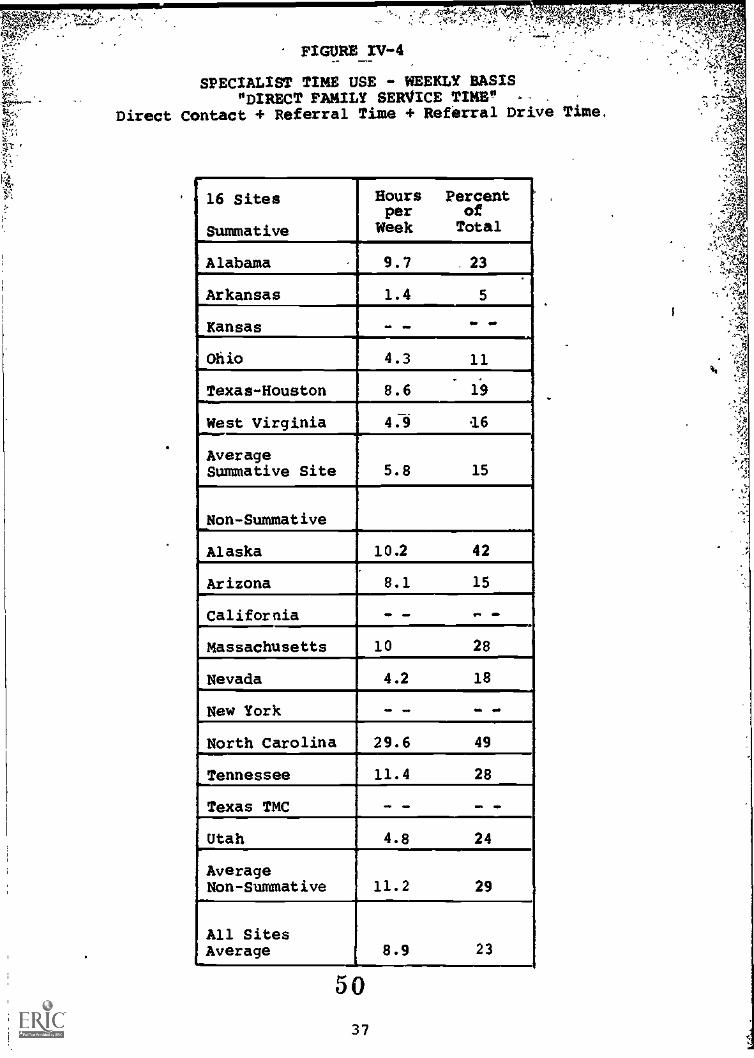
P-1'?",
.r
FIGURE TV-4
SPECIALIST TIME USE - WEEKLY BASIS"DIRECT FAMILY SERVICE TIME"
Direct Contact + Referral Time + Referral Drive Time,
16 Sites
Summative
HoursperWeek
PercentOfTotal
Alabama 9.7 23
Arkansas 1.4 5
,-Kansas - -
Ohio 4.3
.
11
Texas-Houston;.,..
8.6 19
West Virginia 4:9 6AverageSummative Site 5.8 15
Non-Summative
Alaska 10.2
.......,
42
Arizona 8.1 15
Cal ifor nia - - .. -
Massachusetts 10 28
Nevada 4.2 18
New York - - - -
North Carolina 29.6 49
Tennessee 11.4 28
Texas TMC - - - -
Utah 4.8 24
AverageNon-Summative
A
11.2 29
All SitesAverage 8.9 23
5037

There is wide variation in the komunt af supervision praiwladed at each of the fifteen projects.' Figure IV-5 shOws thefrequency of supervision of each home visitor reported bythefifteen projects. The column on the fai right of the figureshows a wide v-riation in the total amount of:timi:that isspent weekly by all stakf on supervision.
Data obtained from the.gecord of Rome Visit Activities,which was completed by'home visitors following.visits tofamilies involved in the summatiire-evaluation'it ind*cateoverall agreement with .these.findinga."- In factriatfive'ofthe projects'home visitors report they are-accompanied more...-frequently on home visits than Director/Specia/istijAdiOateNo accurate information is available,:from,the Ilec0011:11410ive*, '-to show how frequently home visitors wire accoimanied on.the--home visit for supervision purposes. Role visitor# in RoustoniTexas reported that they had not 'been accompaitieT:4 all on .a.hyof the visits (68) on which Records of. RomirMisWActivities.,were completed, while Director/SpeCialists indiCeteCthatsupervision is being provided once a month. This.dficrepancy.,.is easily explained by the fact that Rome Visit Aotivity Recordewere only obtained for a sample of home visits,'and:the date4.therefore, may give a slightly, distorted picture of the situaiion
;!Nif the home visits recorded were atypical.
In-hone monitoring of home visits is only one way in whichstaff can supervise home visitors. Another is to help themprepare materials for their home visits or discuss the familysituation. In Kansas, where home visitors are accompanied onhone visits for supervision purposes only once a year', thedirector spends over half of her time providing such aid tohone visitors. In Arkansas, Arizona and Tennessee, on the otherhand, where in-hame monitoring is most frequent, relativelylittle time is spent helping home visitors prepare visits -- lessthan three hours a wiek per project staff member. Futureanalysis will consider further the various modes of supervision.
Home Visitor Time Use Profile
The home visitors in each of the sixteen projects are themajor providers of services to families, with the home visitbeing the primary service delivery mechanism. In addition toproviding in-home services, home visitors are a major linkbetween the family and agencies in the community which providea variety of family services. Other services which the homevisitor provides include transportation for families to andfrom both parent meetings and appointments.
1Alaska data were not included in this analysis because it was
not clear from staff responses whether or not they accompaniedhome visitors for supervision purposes.
513 8

P o ect
rFIGURE XT.", 5
MONITORING OF HOME:VISITORS1
Reported.4 of Rours4r week spentl;
on supervision
s(:u
ALABAMA
ARKANSAS
KANSAS2
X
X
_2
24
-
OHIO K 7
TEXAS-HOUSTON X 10
WEST VIRGINIA X 3
ARIZONA X 16
CALIFORNIA X 0.25
MASSACHUSETTS X 1
NEVADA X 2
NEW YORK X 1
NORTH CAROLINA3 X 2
TENNESSEE X 11
TEXAS-TMC X 4
UTAH X 2
TOTAL PROGRAM 3 3 4 2 2 1 8
A number of the Directors and Specialists interviewed indicated thatthey would like to increase the amount of Home Visitor supervision.No data is included here for Alaska because it was not clear fromstaff responses whether or not they accompanied the home visitorsfor supervision purposes.2Home Visitors in Kansas are supervised on a yearly basis. The lowamount of supervision provided is primarily the result of a recentchange in directorship and the total lack of other administrative orspecialist staff associated with the program. Texas-TMC is the onlyother project with only one administrative staff member.3This number is based only on tine data from the director. TWio
specialists on the project also report spending large amounts of timeaccompanying bome visitors, but it is not clear if this is for super-vision or not, so the times are not included. If, in fact, thespecialists are monitoring home visitors, the supervision rate would betwice a week.
5239
'4*
1

Presented in this section is a general profile of howhome visitors spend their time. For analysis purposes, thehome visitor week is divided into five major task areas:travel, in-home, family support, training and other activities.In addition to showing the time distributions for those majortask areas, some findings are reported here on specific homevisitor activities.
Since so much of the home visitor's time is spent inthe home with families (41%), a. more detailed profile of in-home time is presented in Chapter V: The Home Visit, wnichshOws how the home visitor allocates her time among a numberof specific parent and child content areas.
The Time Use data show that home visitors report thattheir work week averages 45 hours, ranging from 35 hours inAlaska to 56 hours in Tennessee. The average time per weekworked as reported in the Home Visitor Background Question-naire is slightly lower (by 4 hours) t1 .-1 that reported inthe Time Use data. In the six summat . sites for wpich TineUse Data is available on all home visl;ors, the differenceamounts to only one hour.
The pie graph in Figure 1V-6 shows how Home Visitorson the average spend their time in the five major task areas.Home Visitor Time Use profiles for each of the sixteen pro-jects are presented in Table IV-4.
F
53
40

FIGURE IV-6
HOME VISITOR TIME USE
9% OtherActivities
7% Travelto Families
41%
In Home
25%Familysupport
Time spent with Familiesin the home 41% 19 hours
Time spent in Family SupportServices, such as home visitpreparation time, time spenton referrals, follow-up,parent meetings, and drivingfamilieA to meetings andreferrals 25% 11 hours
Time spent in Training, includ-ing driving time to and fromtraining conferences 18% 8 hours
Time spent on Other Activi-ties, including the recruit-ment of families, public rela-tions, volunteer recruitmentand training, and time spentobtaining in-kind or leveredresources for the project 9% 4 hours
Time spent on Travel to andfrom the homes of families
5441
7%
100%
3 hours
45 hours

Hone Visitors report that their caseload consists of12 families and that they make an average of 11 home visitsper week, ildicating that each week one family per home visitorwas not visited. In fieneral when a home visit was missedthefamily was not at home or had other commitments at the timethe home visit was scheduled.
An average of 19 hours is spent weekly by each homevisitor on home visits, or 1.6 hours per family. Table IV-5shows the average hours spent per velek in the home and theaverage number of hours apent per family for each of the six-teen projects. An additional 11 hours per week is spent provid-ing support serv.ces to all of the families. Time spent onspecific family suppct activities is presented in Figure ry-7.
FIGURE IV-7
FAMILY SUPPORT SERVICES
Home visit preparation time consists primarily of plan-ning activities and obtaining or preparing materials for thehome visit. Included in the category "Parent Meetings" is alltime spent by home visitors arranging and/or attending parentmeetings and time spent providing transportation for familiesto facilitate their attendance. Follow-up time with familiesconsists of time spent in between visits to remind the familyabout meetings and/or appointments or to check back withfamilies regarding specific items introduced during the homevisit. Referral time includes the time spent making arrange-ments with service agencies and providing transportation toand from appointments.
5 5
42
4.,4*.`"...1$
Variations Among Sites
The overall profile of the hone visitor's week does notdiffer for urban and rural sites. The time use,profile is thesame for all five task areas, including travel..L In the sixsummative sites, home visitors on the average spend slightlymore tine with families than in non-summative sites although thedifference is not significant.
There is a strong relationship between the percentage oftime spent on in-home family services and the percentage of
time spent on staff training. As the in-home services timeincreases, the time spent on staff training decreases propor-tionately. In subsequent Evaluation Reports, an attempt willbe made to determine whether a decrease in the amount of staff,training provided has an impact on the quality of the homevisit and whether it affects summative evaluation child andparent outcomes.
Summary of Findings
This chapter has presented both overall profiles andindividual variations in time-use for directors, specialistsand home visitors. The following emerge as important points:
Home visitors spend about 20 hours a weekworking with an average caseload of 12 families._ _
They spend an additional eleven hours per week infamily support activities such as home visit pre-paration, refe.:rals, parent meetings and follow-up.
4 An increase in tine amount of in-servicetraining a hone visitor receives results in adecrease in amount of time spent in the honewith families. :t appears the home visitorhas a relatively fixed amount of time tospend on family contact and training and anincrease in one takes time from the other.
Directors c-ad specialists accompany homevisitors on family visits for supervision once amonth, on the average. In projects where in-home monitoring is less frequent, either becauseof small staff or administrator's decision,staff members spend more time helping homevisitors prepare for their home visits eitherby liscussimg individual families or providingmaterials and ideas for the home visit. -
lIt had been anticipated that home visitors in rural projectswould spend a greater portion of their time on travel thanthose in urban projects.
564 3
'
rf*i'1'41
tA=A
:::45.11

Although directors are the prime administra-tors of Home Start programs, specialists alsotake on a large administrative load.
The administrative staff have at least minimal-- and in many cases considerable -- directcontact with families. When-only one director/specialist staff member is present in an entireproject, she/he assumes greater responsibilityfor family support activities, thus decreasingthe percentage of time spent on administration.
On the average, specialists spe-d more time withfamilies than do directors.. However, becausethe jobs are so.individual, there is wide varia-tion in how much time 'specialists actually spendwith families.
Specialists in non-summative sites reported spend-ing a higher proportion of their time in directcontact with families than those in summative sites.
Rural sites employ more specialists and adminis-- trative staff, on the average, than urban sites.
The presence of specialists appears to have noeffect on the content of home visits in theproject.
Future Issues
Specialist Time Use Data need to be reconsideredto determine if specialists are performingadministrative tasks which could better be doneby directors, leaving them free to spend more .
time on issues related directly to their specialty.
An analysis should be conducted of the variousways in which staff members supervise homevisitors to determine the effects of differentcombinations of in-home monitoring and aid inpreparing home visits.
The impact of less training on the quality of thehome visit and summative outcome data needs to beinvestigated to determine a range of time per weekin which training is most effective.
44
57

4 Y.
V
SERVICES TO FAMILIES
Introduction
The Home Start program is designed to demonstrate alter-native ways of providing Head Start type comprehensive ser-vices to families that either cannot or do not want a centerbased pre-school program. The primary objective of Home Startis to involve parents directly in the educational and general
, development of their children through the home visit, a regu-larly scheduled period during which a trained home visitormeets in the hone with both the focal parent and the focalchild. By meeting with the family on a regular basis, thehome visitor is able not only to help the parent in becominga better educator of and provider for the child, but also toidentify those community resources which the family might uti-lize and to assist the family in obtaining the requisite ser-vices.
This section of the report examines the home visit inorder to answer two basic questions:
What happens during the average home visitin terms of
- Interactions between the home visitor,the focal parent, and the focal child
- Parent and child content areas which areemphasized during the visit (schoolreadiness, health and nutrition, etc.)
- Activity modes which take place (tells,does, listens, ignores, etc.)
- Tone of the home visit (alert, confident,defensive, etc.)
What services are provided to families as arbsult of the home visit?
A detailed analysis of the home visit process is presentedfirst. Information about special services which are providedoutside the home visit then is reported. Finally, some generalconclusions about Home Start program support of services aremade.
Data Sources
Data on home visit interactions, activities, and contentwere obtained from the Home Visit Observation Instrument, which
M
5845

was recorded for 110 families in the six summative sites by
trained observers who accompanied home visitors on visits with
those families. The reliability of the observers had beentested during the course of data collection (see Appendix B),
and the observers had previously visited the families to become
generally acquainted. When the home visitor was asked "Do you
think my being along on this visit affected the way you, the
parent, or the child behaved?",elt responded "no". In addition,
estimates of time spent in nine primary child and parent con-
tent areas were made in the Record of Home Visit Activities byhome visitors following three successive visits with each
summative family. Figure V-1 illustrates the coriespondenceof results from both data sources; the primary difference be-
tween the two instruments is that observers reported a greater
emphasis on s1hool readiness and less emphasis on health andnutrition than did home visitors.k The overall patterns, how-ever, are quite similar and suggest that both methods of datacollection are accurate for the purposes of describing themajor "shape" and content of a home visit.
It should be noted that the description of the home visitwhich was presented in Interim Report IV was based on the fre-
quency of interaction pitterns, content areas and activitymodes. For this report observers'noted the length of eachactivity recorded during the home visit. This tine then was
assigned to the interaction patterns, modes and contents of
activities, thus giving a more accurate picture of the dynamics
of the home visit.
Information on referrals which were initiated during the
home visit was reported for the six summative sites in boththe Record of Home Visit Activities and the Home Visit Obser-vation Instrument; data on referrals initiated and accomplished
at all 16 sites were obtained-from the Home Start InformationSystem. Additional information about project support ofreferral service delivery is available from the Home Visitorand Director/Specialist Time Use Questionnaires, which recordthe typical weekly schedule of each staff member, includingtime spent both on referrals and on in-home services.
The Home Visit
Preiiminary Concepts
The following description of the home visit reports gen-eral findings at the Home Start national program level and atthe local site level for each of the six summative sites.Basic interaction patterns, content areas and activity modesare described first and are followed by a description of par-ticipant attitudes and behavior. The data then are examined
1It is reasonable to suggest that because the home visitobservers are also summative testers, home visitors probably dospend more time on school readiness when observed.
46
59

:.
FIGURE V-1
HOME VISIT CONTENT AREAS(Average for Six Summetive Sites)
29
..# % Greater on Home Visit Observation
% Greater on Record of Home Visit
6 0
4 7
r:1
,

:
to determine the overall dynamics of the home visit; who isdoing what, with whom, and why. In addition, to preserve therichness of variation between home visitors, major findingsabout interaction patterns and content of home visits are in-cluded for each home visitor in Tables V-12 to V-18.
During the home visit numerous combinations of activity,content and participants are possible. To simplify the descrip-tion of a home visit, four child and five parent content areashave been identified:
Child Content
- School readiness, including basic concepts,language, music, knowledge about the environ-ment, and same fine motcik skills
- Physical development, including gross motorand fine motor skills
- Health and nutrition
- Social-emotional development
Parent Content
- Educating the parent about the needs of thechild
- Health and nutrition
- General parent education
- Social services, including employment, legalservices and welfare
- Parental concerns, including socializing andinterpersonal problems
In addition, four interaction patterns and five activity modesare reported:
Interactions
- Home visitor with focal child
- Home visitor with focal parent
- Focal parent with focal child
- Home visitor with focal parent andfocal child
6148

Activities
'1i;*144J4
- Involved activities (telling, explaining,showing, doing, praising, blaming)
- School-oriented activities (reading,singing)
41
- Inquisitive activities (asking?'
- Passive activities (listens, watches)
- Uninvolved activities (ignoring)
An example of the Home Visit Observation Instrument, fromwhich these data were obtained, is shown in the volume ProgramAnalysis: Instruments (page 126).
The Typical Visit
Most home visits occur once a week and last nearly an hourand a half. During this time observers recorded nearly tenactivities which, on the average, lasted for seven minutes.The discrepancy between the visit length,as reported by homevisitors both in the Record of Home Visit Activity (83 min.)and to the observer (87 min.) and the total length of observedactivity time (67 min.) suggests that nearly 20 minutes arespent arriving for and departing from the visit.
Befqre arriving at the home, the home visitor usually hadspent nearly half an hour preparing for the visit, and in overthree quarters of the activities which took place during,thevisit, the home visitor had brought child activity materialswith her. In over half the visits the hame visitor recordedthat the parent participated all of the time while in the re-maining visits the parent participated half or some of thetime. When asked why various content areas weke being pre-sented during the visit, the home visitor indicated primarilytwo reasons for addressing child content areas:
- the child likes to do it; e.g., he wantsto learn his colors
- the child needs to do it; e.g., he hastrouble.with his colors and needs tolearn these things for school,
62
49
sar45.-
The parent content areas, however, were not addressed forany special reason. In order to estimate the extent to whichparents continue to educate the child between home visits, theobservers recorded any mention of activities done since the lastvisit and of activities to be undertaken before the next visit.The-results su.-est that home visitors em hasize continuinome v s t act v t es. In 'k 0 e v s ts o serv ere
was reference to things the mother had done since the last -
visit, and in nearly 90% of the visits there was a discussionof things to be done before the next visit.
Interaction Patterns
The interaction patterns which occur between home visitparticipants can be viewed in two ways:
Person-to-person (home visitor withfocal parents, etc.)
Dominant/non-dominant (home visitorin charge, etc.)
Figure V-2 illustrates the four primary person-to4personinteractions which were observed between home visit participantsin the six summative sites. The home visitor-focal parent-andhome visitor-focal child interactions each occurred for aboutone-third of the home visit time, and the focal parent-focalchild interaction occurred less than 20% of the time. Thepattern differs only in Texas-Houston, where the focal parent-focal child interaction took place far more often than the homevisitor-focal parent interaction. The fact that the home Visitordivides her time equally between the focal parent and the focalchild replicates the results reported in Interim Report IV, whichnoted that home visitor-focal parent and home visitor-focal childinteractions occurred with the same frequency.. This suggeststhat, as recommended in the Home Start Guidelines, home visitorscontinue to focus on the parent as well as on the chiia.
Figure V-3 shows dominance patterns for each of thesummative sites. In four of the sites--Alabama, Arkansas,Ohio and West Virginia-- the home visitor is dominant morethan half the time. In Kansas, however, all three participantsare equally dominant , and in Texas-Houston the focal child isdominant more than any other person. The fact that the focalparent is less likely to be dominant does not imply that sheis less involved in the home visit, but rather that she is lessapt to take charge of an activity during the visit.
63
5 0

gtik
38%
Alse Visitor- Focal Parent
40% 51% 37%
S.>s.+ <. N .0e4..41
, , . ,
FIGURE V-2
12% 29%
100
90
80
70
60
50
40
30
20
10
0
Home Visitor - Focal Child
28% 33% 25% 32%
tiNP
,.111I
42%
eo 3
:tor4;.4.
00 Focal Parent- Focal ChiLd 100 Home Visitor-Focal Parent - Focal Child
90 90
SO 80
"70 70
SO 60
'SO 50
-40 40
30
.2 20
10
11% 15% 20 35% 5 0 13% 7 10% 10% llt.
6451
g/t
211 .
g 1.4
>3
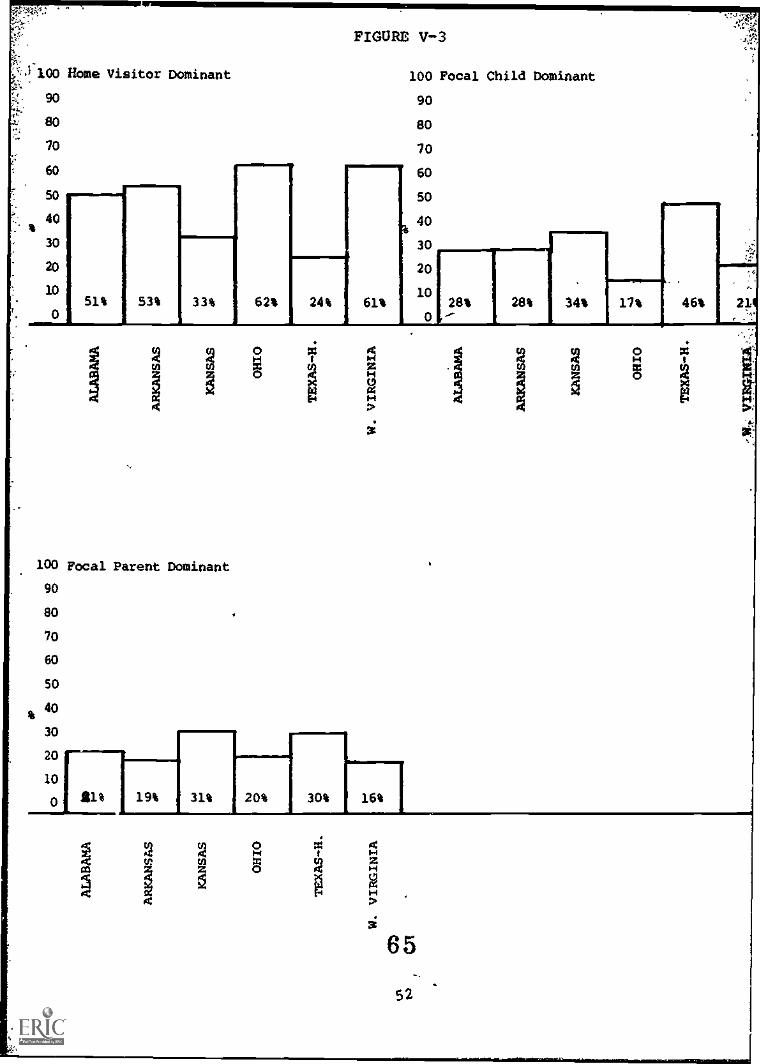
100 Home
90
80
70
60
SO
40
30
20
10
0
Visitor Dominant
51% 53% 33% 62%
FIGURE V-3
24% 61%
100 Focal Child
90
80
70
60
SO
40
30
20
10
028%
Dominant
28% 34% 17%
100 Focal Parent Dominant
90
80
70
60
50
40
30
20
10
0 1111% 19% 31% 20% 30% 16%
0
30
46% 21
65
52

a "ii,Ate .
Content of the Home Visit
Both the home visitor and the observer recorded informa-tion about time spent in various content areas in the sixsummative sites. Figure V-4 presents the results from thetwo instruments on a siteby site basis. An analysis of theinformation in the table indicates that Home Start is a pro-gram which emphasizes both'educating the child and edwcliiiith
ie parent about the child. Across all sites the most ominant
child content areas airiEhool readiness and physical develop-ment, which consists primarily of fine motor skills such ascutting and pasting, and the most frequently cited parent con-tent area is educating the parent about the child. An examin-ation of the data for each of the six sites shows that theschool-oriented child content areas are consistently emphasizedin Arkansas, Kansas and Texas, while in Alabama, Ohio, andWest Virginia more time is spent on parental concerns than oneducating the parent about the child. Although health andnutrition are second for time spent in Alabama and WestVirginia and third in the remaining sites, it should be notedthat teaching the parent about nutrition, an area which isemphasized in the Guidelines, is addlessed only of the timeacross all sites.
Figure V-5 and V-6 presents the actual percentages of timespent in child and parent content.areas as recorded on the HomeVisit Observation Instrument. Averaged across all sites,more than half of the 1:ecorded activities emphasized child con-tent, while one third were parent-oriented. Child contentranged from 51% in Arkansas and Kansas to 90% in Texas-Houston.It is interesting to note that the Texas site, which has thehighest proportion of child content areas, is typified by homevisits in which the child is the dominant person, and most ofthe interactions between participants include the child.
Home Itisit Activities
Various activity modes which were recorded by the obser-ver for the three participants in the home visit are illus-trated in Figure V-7. It is evident that the home visitor andthe focal child are more actively involved than is the focalparent. The focal child, however, is far more likely to ig-nore or be uninvolved in the activity and is less likely toask than are the adult participants. On the other hand, thefocal child tells, w.tplains, does, etc. more than either thehome visitor or the focal parent -- not an unexpected findingfor a pre-schooler. The most frequent activity mode for thefocal parent is listening or watching. It is evident that theparent is a less active participant in the home visit, but shemay be learning by observing the activities of the home visitorand child and by listening to the home visitor.
6 653

ALABAMA
p2
FIGURE 11,-4 a
HOME VISIT CONTENT AREAS
ARKANSAS
KANSAS
22
17 1716
ai16
10
1 1 ..1
ii h 11 IIChild Content
21 j 8
jig ii II li IiC
Parent Content
I1I 11 II 1 11 1 1Child Content
,
ri 1 1 .lie i'z lri l111B
Parent Content
% Greater on Home Visit Observation
III% Greater on Record of Home Visit
6754
..44,4..
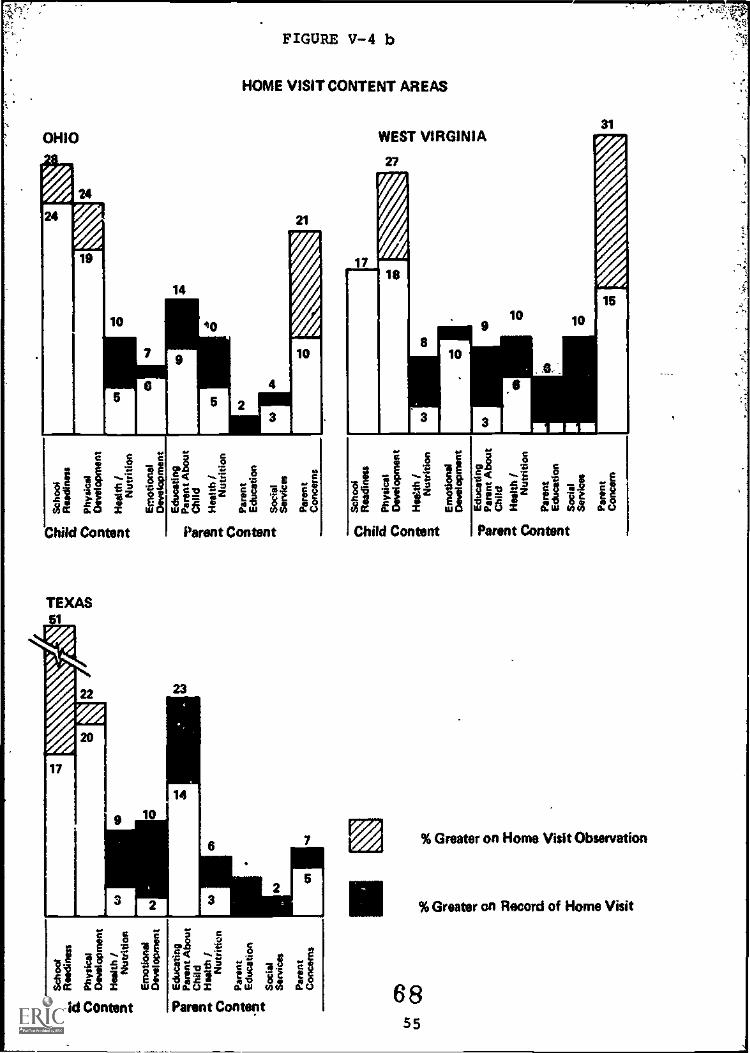
OHIO
FIGURE V-4 b
HOME VISIT CONTENT AREAS
WEST VIRGINIA
27
21
17
14
10 10 10
E g
Child Content
TEXAS
g
JIwif 11Parent Content
10
14
11Child Content
1 11E jg e
if 11Chad Content Parent Contm,t
g11.31 ti if 11 itwZi5 I ZuS Z8
Parent Content
% Greater on Home Visit Observation
%Greater on Record of Home Visit
6855
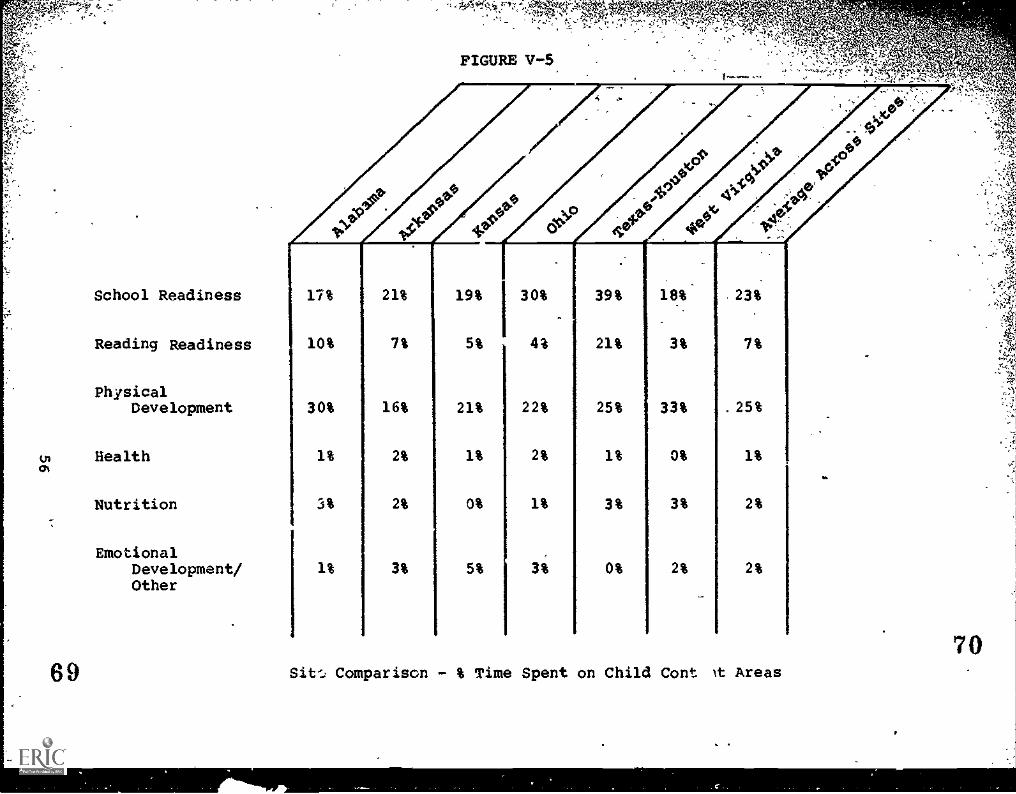
tr%
69
4--4
School Readiness
Reading Readiness
PhysicalDevelopment
Health
Nutrition
EmotionalDevelopment/Other
ri ,OkS".
,
FIGURE V-5,
4 Alal4P.
. -
..: 0.
oe4.,O 'IP1.". 4009
.0, evVP'4(' .
42*
..
Sit'.; Comparison - % Time Spent on Child Cont It Areas
40:
17% 21% 19% 30% 39% 18% .23%
10% 7% 5% 4% 21% 3% 7%
30% 16% 21% 22% 25% 33% .25%
1% 2% 1% 2% 1% 0% 1%
3% 2% 0% 1% 3% 3% 2%
1% 3% 5% 3% 0% 2% 2%
4,4
.
70

Educating ParentAbout Child
Health
Nutrition
Parent Education
Social Services
Parental Concerns
Other
- 7 1
. , . . ,
6% 22% 17% 8% 5% 2% 10%
5% 5% 4% 5% 2% 2% 1%
10% 7% 4% 0% 0% 3% 4%
0% 0% 1% Olt 0% 0% 0%
0% 1% 5% 0% 0% 0% 1%
10% 5% 7% 10% 0% 24% 12%
5% 3% 2% 10% 0% 3% 3%
Site Comparison - % Time Spent on Parent Content Areas
4
7 2

FIGURE V-7
ActivityHome VisitorTime(min.) %
Focal ChildTime(min.)
Focal Parent'Time(rin.) %
Tell/Explain 32 51% 32.6 56% 22.1 36%
Read/Sing 3 4% .9 2% 1.6 3%
Ask 11 17% 1.8 3% 6.2 10%
Listen/Watch 17 27% 12.5 21% 27.8 45%
Ignore/Uninvolved 1 1% 10.4 18% 4.5 7%
Total Time 63.2 58.3 62.2
Tables V-I to V-5 present activity data for each of the sixsummative sites by dominance or non-dominance of the participantsas -tecorded by an observer. Tables V-I to V-3 sum timeacross participants, while Tables V-4 and V-5 report dominant/non-dominant time for each participant. For all six sites,the primary mode is active and the secondary mode is passive.The ranges within each mode are remarkably stable, suggestingthat the mix of activities is fairly constant from site to site.It is also apparent from the tables that, as one might expect,the dominant person was active. It is interesting to note thoughthat the person who was perceived as non-dominant was activelyinvolved over 40% of the time.
Tone of the Home Visit
After a home visit had been observed, the behavior andattitudes of the home visitor, the focal parent and the focalchild were ranked on a continuum from one to seven. In general,the home visitor was observed to be more sociable, more confidentand more involved than the focal parent, but ene two wereequally casual and agreeable. The focal child was as involvedas the focal parent but was somewhat more active. For the mostpart, the only neutral behaviors noted were those of the focalchild, who was neither calm nor excited and neither quiet nortalkative. It is evident that home visitors have a clearer
7358

perception of their role and are more likely to behave in adecisive, positive manner, but that both the focal parent andthe focal child respond to the visit with generally positiveattitudes and behavior.
The Overall Visit
In order to construct a coherent picture of the homevisit, the above three descriptors -- activities, interactionpatterns and content areas -- must be examined together. Inaddition, it is necessary to look at a description of theactivities of the three participants in a home visit. Theanswers to questions such as, "What is the parent doing whilethe child is asking questions?" form an important basis forthe following description.
The data reveal a marked split in the pattern of homevisits. One part of the home visit focuses primarily on theparent and is composed of focal parent-home visitor interactions.The other distinct portion of the home visit involves thechild, who is interacting with either the home visitor or thefocal parent. The two portions of the home visit differ incontent and activity, as the following discussion makes clear.
Focus on the Parent
Home utsitor-focal parent interactions compriseapproximately one-thild 0F the visit.1 As Figure V-8 shows,the home visitor spends over two-thirds of this time tellingor explaining and the parent spends equal amounts of timetelling/explaining and listening/watching, as well as a smallerportion asking questions. 2 The child is not very involvedin this portion of the home visit. Almost half of the timethe child ignores or is uninvolved; another quarter of thetime (s)he listens or watches.
1In this section, three-way interactions are considered underboth dominant interaction pairs; home visitor to focal childand focal parent is considered as both home visitor to focalchild and home visitor to focal parent.
2 Figures V-8 through V-lO are not comparable to similarcharts in the Interim Report IV. The tables there were based onfrequency of occurrence of various activities; the presenttables report the length of each activity, and percentages arebased on the total time reported for the home visit.
74
59

FIGURE V-8
HOME VISITOR FOCAL PARENT INTERACTIONS
The Home Visitor....
Tells / Explains
69%
Listens /Watches21%
Total: 24 minutes"
Asks 4%
And the Content
And The Child....
While the Parent...
-Listens / Watches
47%
112C Tells I Explains45%
Total: 24 minutes"
Ignores / Uninvolved46%
L istens /Watches25%
Tatal: 20 minutes"
Tells /Explains25%
Child Parent
School Readiness 9% Educating Parent About Child 18%Physical Development 10% Health and Nutrition 16%
Health and Nutrition 2% Parent Education 1%
Emotional Development 6% Employment 4%Subtotal 27% Parental Concerns 35%
Subtotal 74%
TOTAL: 26 minutes"DItalOoncin duo to inconvigoto reportirg on Home Visit Obrion instruMent
60
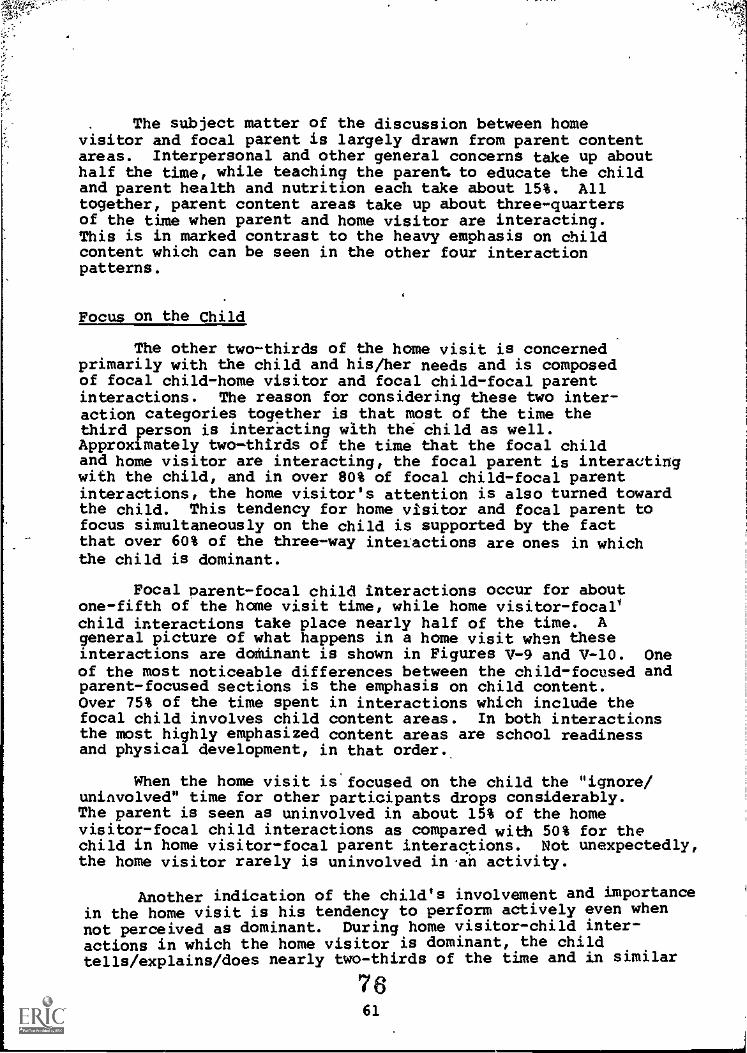
*fie,
The subject matter of the discussion between homevisitor and focal parent is largely drawn from parent contentareas. Interpersonal and other general concerns take up abouthalf the time, while teaching the parent. to educate the childand parent health and nutrition each take about 15%. Alltogether, parent content areas take up about three-quartersof the tine when parent and home visitor are interacting.This is in marked contrast to the heavy emphasis on childcontent which can be seen in the other four interactionpatterns.
Focus on the Child
The other two-thirds of the home visit is concernedprimarily with the child and his/her needs and is composedof focal child-home visitor and focal child-focal parentinteractions. The reason for considering these two inter-action categories together is that most of the time thethird person is interacting with the child as well.Approximately two-thirds of the time that the focal childand home visitor are interacting, the focal parent is interactingwith the child, and in over 80% of focal child-focal parentinteractions, the home visitor's attention is also turned towardthe child. This tendency for home visitor and focal parent tofocus simultaneously on the child is supported by the factthat over 60% of the three-way interactions are ones in whichthe child is dominant.
Focal parent-focal child interactions occur for aboutone-fifth of the home visit time, while home visitor-focallchild interactions take place nearly half of the time. Ageneral picture of what happens in a home visit when theseinteractions are doMinant is shown in Figures AT-9 and AT-10. Oneof the most noticeable differences between the child-focused andparent-focused sections is the emphasis on child content.Over 75% of the time spent in interactions which include thefocal child involves child content areas. In both interactionsthe most highly emphasized content areas are school readinessand physical development, in that order.
When the home visit is'focused on the child the "ignore/uninvolved" time for other participants drops considerably.The parent is seen as uninvolved in about 15% of the homevisitor-focal child interactions as compared with 50% for thechild in home visitor-focal parent interactions. Not unexpectedly,the home visitor rarely is uninvolved in .airt activity.
Another indication of the child's involvement and importancein the home visit is his tendency to perform actively even when
not perceived as dominant. During home visitor-child inter-actions in which the home visitor is dominant, the childtells/explains/does nearly two-thirds of the time and in similar
7661

FIGURE V-9
FOCAL PARENT FOCAL CHILD INTERACTIONS
The Parent....
Total: 15 minutes
\Ignores / Uninvolved 1%
While the Child....
Total: 15 minutes
And the Home Visitor....
Listens /Watches59%
Tells / Explains23%
Ignores / Uninvolv3%
Reads / Sings2%
Total: 15 minutes
And the Content Is....
Asks13%
Ignores / Uninvolved 1%
Child Parent
School Readiness 42% Educating the Parent About Child 11%Physical Development 26% Health and Nutrition 4%
Health and Nutrition 5% Parent Education 0%Emotional Development Employment 1%
Subtotal 77% Parent Concerns 7%Subtotal 23%
TOTAL: 15 minutes
7762

FIGURE V-10
HOME VISITOR FOCAL CHILD INTERACTIONS
The Home Visitor....
Reads /Sings 6%
Total: 35 minutes*
And the Parent...
While the Child....
Total; 30 minutes*
Listens / Watches55%
Tells / Explains25%
Ignores / Uninvolved 14%
Total: 29 minutes*
And the Content....
Asks 2%Reads /
Sings 2%
Ignores/Uninvolved
4%
Child
School Readiness 36%Physical Development 30%Health and Nutrition 5%Emotional Development 896
Subtotal 78%
TOTAL: 31 minutes*78
Parent
Educating the Parent About Child 6%Health and Nutrition 3%
Parent Education 0%Employment 1%
Parental Concerns 11%
Subtotal 21%
DISCOPOicion Otto tO incOogolOtO topOrttott on Homo Visit Obsetvotion instrument
63
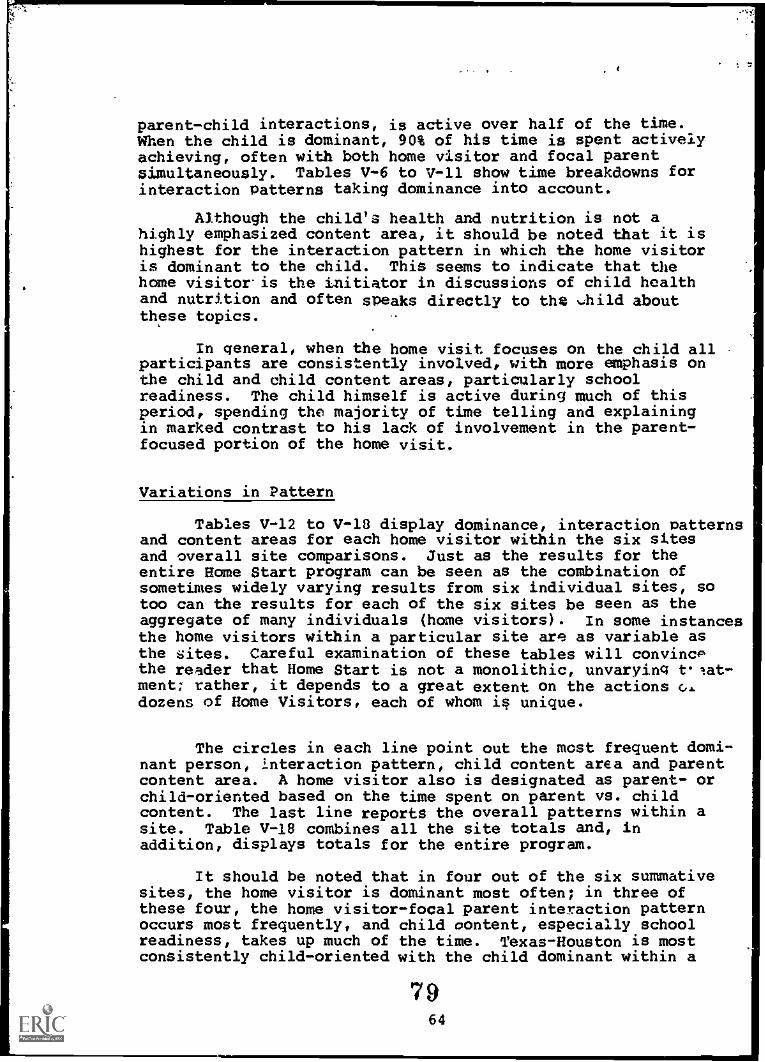
parent-child interactions, is active over half of the time.When the child is dominant, 90% of his time is spent activelyachieving, often with both home visitor and focal parentsimultaneously. Tables V-6 to V-11 show time breakdowns forinteraction Patterns taking dominance into account.
Although the child's health and nutrition is not ahighly emphasized content area, it should be noted that it ishighest for the interaction pattern in which the home visitoris dominant to the child. This seems to indicate that thehome visitovis the initiator in discussions of child healthand nutrition and often speaks directly to the vhild aboutthese topics.
In general, when the home visit focuses on the child all .
participants are consistently involved, with more emphasis onthe child and child content areas, particularly schoolreadiness. The child himself is active during much of thisperiod, spending the majority of time telling and explainingin marked contrast to his lack of involvement in the parent-focused portion of the home visit.
Variations in Pattern
Tables V-12 to V-10 display dominance, interaction Patternsand content areas for each home visitor within the six sitesand overall site comparisons. Just as the results for theentire Home Start program can be seen as the combination ofsometimes widely varying results from six individual sites, sotoo can the results for each of the six sites be seen as theaggregate of many individuals (home visitors). In some instancesthe home visitors within a particular site are as variable asthe sites. Careful examination of these tables will convincPthe reader that Home Start is not a monolithic, unvarying tlat-ment; rather, it depends to a great extent on the actions C.J.dozens of Home Visitors, each of whom is unique.
The circles in each line point out the most frequent domi-nant person, interaction pattern, child content area and parentcontent area. A home visitor also is designated as parent- orchild-oriented based on the time spent on parent vs. childcontent. The last line reports the overall patterns within asite. Table V-18 combines all the site totals and, inaddition, displays totals for the entire program.
It should be noted that in four out of the six summativesites, the home visitor is dominant most often; in three ofthese four, the home visitor-focal parent interaction patternoccurs most frequently, and child content, especially schoolreadiness, takes up much of the time. Texas-Houston is mostconsistently child-oriented with the child dominant within a
7964

home visitor-focal child interaction. Child content consumesover three-quarters of the time, a figure considerably higherthan the other sites. Kansas shows very closely distributeddominance times, but, although the child is dominant slightlymore often, the rest of the pattern indicates heavy emphasison the parent ane especially on parent content areas.
Special Services
In addition to the direct services which are providedduring the home visit, other special services may be initiatedby the Home Visitor as a result of the home visit. Theseservices consist primarily of referrals to locally availableagencies for varying kinds of public assistance such asMedicaid or family counseling and the use of in-home specialistswho are available through the Home Start program. This sectionwill examine special services to determine:
the primary areas in which referrals are made;
the recipients of referrals;
program success in accomplishing referrals;
the extent to which program specialists provideservices directly to families;
the extent to which home visitors support referralsoutside the home visit.
The prtmary source for data about the number, types andrecipients of referrals is the Information System', whichrecords all referrals made and received for bothtsummative andnon-summative sites. The figures presented in this report arefor the last quarter, April 1 to June 30, 1974. Additionalinformation about referrals initiated during the home visit isavailable in the Record of Home Visit Activity and in the HomeVisit Observation Instrument. Reports from the InformationSystem and Staff Time Use Questionnaires are used to indicatethe extent to which programs support referral services andprovide specialists for in-home services. Program results arereported for all sixteen sites, on a summative/non-summativebasis.
Referral
Insources,
Content Areas
order to compare types of referrals across all datathree primary content areas have been identified:
8065

Health and Nutrition;
Education;
Psychological/Social services.
Figure V-11indicates subject areas of referrals made andreceived as reported through the Information System. Averagedacross all sites, 58% of the referrals made were for healthand nutrition, while 37% concerned psychological/social Services
There are interesting differences, however, between summativand non-summative sites: in the summative sites, for example,37% of all referrals made are for psychological/social servicesversus 21% in the non-summative sites, and in the non-summativesites 25% of the referrals are for educational purposes,primarily for the focal parent, versus 5% in the summative sites.When averages for the six summative sites are compared with thefigures for the 42 referrals which were initiated while thehome visit was being observed, the referral pattern remainsquite stable: '57% of the observed referrals concerned healthand nutrition, 29% concerned psychological/social services, and14% were for educational needs. Similarly, 49% of the 111referrals recorded in the Record of Home Visit Activity werefor health and nutrition, 14% were for education, and 38% werefor psychological/social needs. This suggests that bothinstruments recorded referrals fairly reliably.
Referral Recipients
Figure V-12 provides information about referral recipientsby types of referral made and service received as recorded bythe Information System. The data indicate that more than halfof all referrals (57%) are made for the focal child, over athird (35%) are for the focal parent, and only 8% are forother family members. Figures for referrals received, however,show that the focal child is the recipient of 624 of thereferrals. The focal parent receives 4% fewer referrals, andother family members receive 1% less when compared with referralsmade. A comparison of the figures for summative and non-summativesites indicates that a higher percentage of referrals is made forthe focal child in the summative sites (62% vs. 514) and for thefocal parent in non-summative sites (42% vs. 30%).
Examination of the data for referral recipient by type ofreferral shows that focal child referrals are primarily forhealth and nutrition (77%), while for the focal parent the mostfrequent type of referral concerned psychological/social needs.For the summative sites 96% of the referrals made were received,compared with 71% in the non-summative sites.
6 6
81
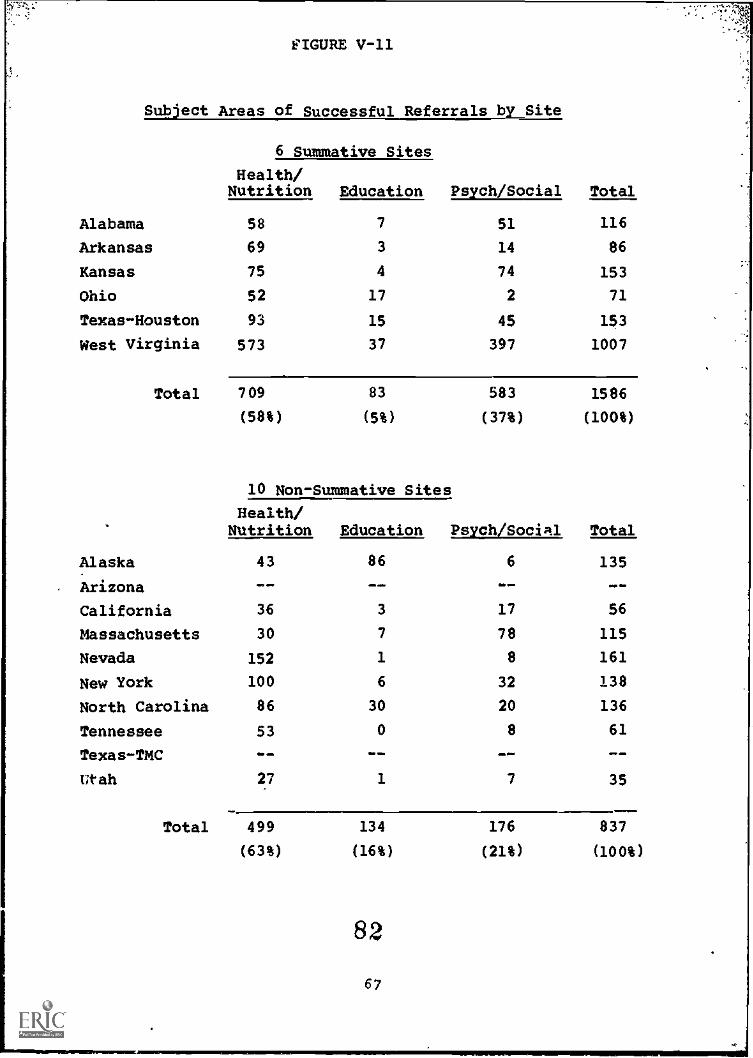
.
FIGURE V-11
Subject Areas of Successful Referrals by Site
6 Summative Sites
Health/Nutrition Education Psych/Social Total
Alabama 58 7 51 116
Arkansas 69 3 14 86
Kansas 75 4 74 153
Ohio 52 17 2 71
Texas-Houston 93 15 45 153
West Virginia 573 37 397 1007
Total 709 83 583 1586
(58%) (5%) (37%) (100%)
10 Non-Summative Sites
Health/Nutrition Education Psych/SociAl Total
Alaska 43 86 6 135
Arizona -- -- -- - -
California 36 3 17 56
Massachusetts 30 7 78 115
Nevada 152 1 8 161
New York 100 6 32 138
North Carolina 86 30 20 136
Tennessee 53 0 8 61
Texas-TMC -- -- -- --
Utah 27 1 7 35
=f1Total 499 134 176 837
(63%) (16%) (21%) (100%)
82
67
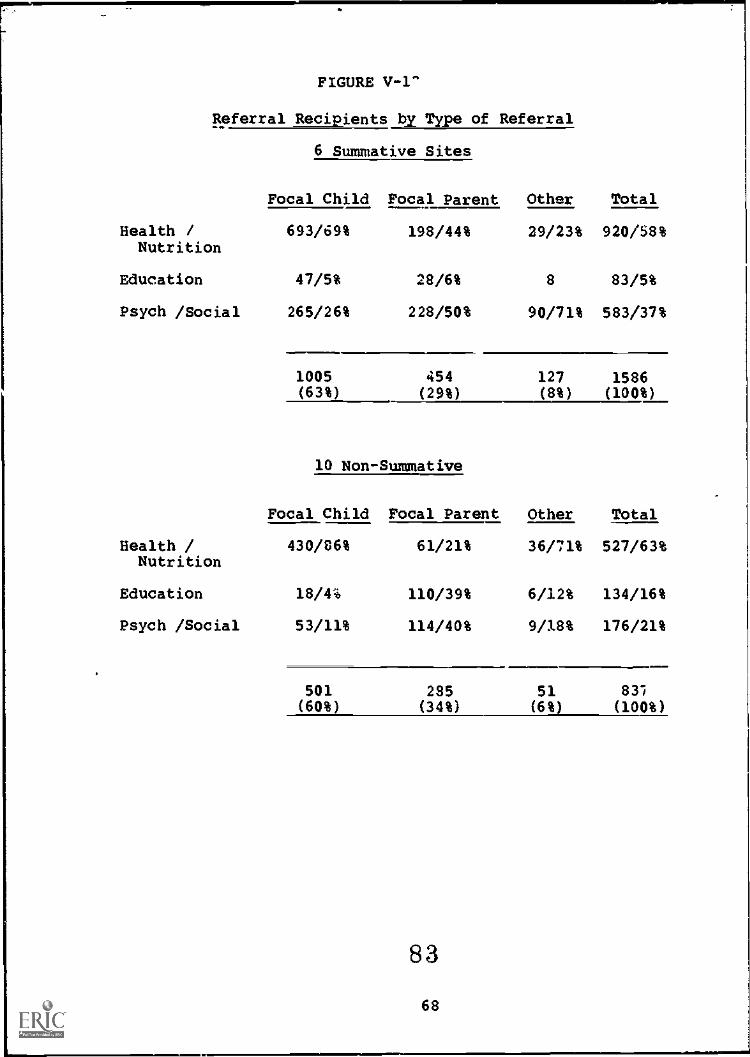
FIGURE V-1"
Referral Recipients by Type of Referral
6 Summative Sites
Focal Child Focal Parent Other Total
Health / 693/69% 198/44% 29/23% 920/58%Nutrition
Education 47/5% 28/6% 8 83/5%
Psych /Social 265/26% 228/50% 90/71% 583/37%
1005 454 127 1586(63%) (29%) (8%) (100%)
10 Non-Summative
Focal Child Focal Parent Other Total
Health / 430/86% 61/21% 36/71% 527/63%Nutrition
Education 18/4% 110/39% 6/12% 134/16%
Psych /Social 53/11% 114/40% 9/18% 176/21%
501 285 51 831(60%) (34%) (6%) (100%)

kr
The summative sites show a remarkably consistent trade-offpattern between referrals made and received (a result of thehigh percentage of campletion), while in the non-summativesites referrals are more likely to be received for healthand nutrition than for educatio:1 and by the focal child thanby the focal parent.
The Information System also provides data on the numberof referrals made and received per family. These figures, to-gether with the ratio of referrals received to referrals made,are displayed for each site in Figure V-13. The average ntimberof referrals received per family is slightly higher among thesix summative sites (2.8 vs. 2.2), and the overall 96% referralcompletion rate for summative sites is consistent with thelicher completion ratio Ler family which is shown for the
.summative sites. The '*.5.tio of referrals received toreferrals made per family ranges from 1.00 in Ohio and Cali-fornia to .37 in North Carolina. It should be noted that fourof the non-summative site (North Carolina, Utah, Massachusettsand Nevada) have ratios which are significantly lower than theratios reported for the summative sites.
Data from th- Home Visitor Time Use Questionnaire indicatethe extent to whicl, home visitors follow-up on and supportreferral services. This support is rendered primarily in twoways: making appointments for families and driving familiesto the appointments. In both summative and non-summative siteshome visitors spent approximately 2.3 hours per week (5.5%) inthese two referral support categories. The Director/SpecialistTime Use Data show that, across all sites, specialists spent2.7 hours per week (30.5%) on referral services outsideof thehome. if such services as giving information and materials tofamilies and screening for child disabilities are included,specialists spend an average of 9 hours per week on specialservices.
Summary of Findings
Although the home vIsit is a unique and varying experience,certain patterns emerge in an overall analysis. Among themost important findings are that:
The content of the home visit is primarilychild-oriented, but includes both school readi-ness for the child and educating the parent abrutthe child.
There is little emphasis on nutrition during thehome visit.
84
69

FIGURE V-13
Average Number of Referrals
Fourth Quarter 1974
6 Summative Sites
Made Received Ratio
Alabama 1.5 1.4 .90
Arkansas 1.3 1.1 .83Kansas 2.6 2.3 .89
Ohio 2.0 2.0 1.00Texas-Houston 4.4 4.0 .92West Virginia 7.5 7.5 .1.00
Avg. 3.1 2.9
10 Non-Summative Sites
Made Received Ratio
Alaska 2.9 2.5 .88Arizona _- -- --
California .8 .8 1.00Massachusetts 2.8 2.2 .78Nevada 4.2 3.3 .80
New York 1.8 1.7 .96Nc,rth Carolina 6.9 2.6 .37Tennessee 4.4 4.0 .92
Texas-TMC -_. - - - -
Utah .6 .5 .76
Avg. 3.0 2.2
85
70
,

The two major interactions are between thehome visitor and focal parent and the homevisitor and focal child. Each interactionconsumes about one-third of the visit.
The focal parent is rarely uninvolved in thehome visit, but she frequently listens toor watches the home visitor and the focalchild, a mode which is quite conducive tolearning.
The focal child is usually actively involved,but when the home visitor and focal parent areinteracting, the focal child is uninvolved halfthe time.
The focal child is the primary recipient ofreferral services.
More referrals are made for health than for anyother area.
These findings suggest that the Home Start Program'sObjectives, which are
To involve parents directly in the educationaldevelopment of their children;
To help strengthen in parents their capacityfor facilitating the general development oftheir own children;
To demonstrate methods of delivering comprehensiveHead Start type services to children and parents. . .for whom a center-based option is not feasible
are, for the most part, being met.
It is not possible at this time to specify or describean "ideal" home visit, or even to make recommendations forchanging it. Though the home visit still focuses on the child,it is not clear that more active parent involvement would in factproduce more positive results. Since child nutrition remains animportant objective, it would appear that more time should bespent on it, but it is difficult to say how much more and atthe expense of what. Since the home visit does indeed meat theProgram Objectives, it must be viewed as more than adequate as itexists.
88
71
j

Future Issues
Does the background of the home visitor affectt. e content emphasis of the home visit?
What impact does the length of time the familyhas been in the program have on the home visit?
Does the length of time the home visitor hasbeen with the family affect the home visit?
How are home visitors helping parents toprovide better nutrition for their families?
8772

ODGO r-
ai mew wpm Ina se um smONIER. Oa NM NO SIB MB

47.
89
AT-A-GLANCE6-Summative Sites
6/30/74
Must_ Pecer.t
Year Irr
--------------
Quarter I
1)1
(6/30/74)
i? of T)tal Staff
Average
R a ?jet
A of lie,m0 Visi ors
;0/e4age
Ra_nge
4 of Families
Average
RAn
69
I.11.5
8-14
49
8.1
6-14
477
80
38-135
# of Families/Hilme Visitor
Range
9.7
6-14
# of Focal Children
Average
Range
673
112
60-206
4 o: Chtidrun (0.5) 937
Avetage
Range f 86-275
156
# of Cnildrun (0-18) 1,828
Average 305
Range 131-585
TABLE III-1
Proviout: Quarters
IYear IIQuartet IV(3/31/74)
Year IIQuarter In(12/31/73)
Year 1.7
Quarter II(/30/73)
,
Year 112)3)Quarter 1
(6/30/73)
MaximumDifference
%
711
70 69 1 67 6
11.8
I- 9-14
12
9-14
11.5 11.2 7
9-14 6-13.
45 45I
46 44 10
7.5
6-10
7.5
6-10
7.7
6-10 4-10
543 537 500 457 16
91
74-143
90
68-149
11.9
10-15
83 76 16
5_8137
11
8-16
47- 98
10.4 20 112.1
11-14 9-14
---1
800 721 642 597
133
93-256
120
83-234
107 100 25
-I
78-2221
66-143I
1 137 1 092
-,..
1,011
168
121-322 Ii
900 21
150 i 21
97- 2051
190
141-364
182
128-338
2,1332,218 2,029 1,818
I370
246-731
355
209-651
338 303 1 188
f208-411
1
189-429
1) No data reported for this Quarter 2) Nt: data rtpor-(.d i.;.r this Quarrel :rm texan-TMC;from Arizona and Texas-TMC: datafrom previous Quarter used to avoid 3) Data for California not included in this Quarterserious distortion.
data fvom pr-viouP Qudrter uqed to avoid serious distortion.
0
MI IND SIP WM MI INS MO ernSe MI MI INS OM ON 11111

91
AT-A-GLANCEMost Recent
10 Non-SummativeSites
6/3 0/74
Year II/1)
Quarter I(6/30/74)
of Total Staff 110
Average 11
Range 7-15
of Home Visitors 65
Average 6.5
Range 2-11
of Families 673
Average 67
Range 48-102
# of Families/ 10.3
Home Visitor
Range 8-20
of Focal Children 770
Average 77
Range 51-115
# o': Children (0-5) 1,283
Average 128
65-186tRange
# of Children (0-18) 2,444
Average 244
Range 136-452
1) No data reported for this Quarterfrom Arizona and Texas-TMC; data:from previous Quarter used to avoid
serious distortion.
TABLE I I I-2
Previous Quarters
Year I/
Quarter IV(3/31/74)
Year IIQuarter III(12/31/73)
Year IIQuarter II(9/30/73)
2)Year II 3)
Quarter I(6/30/73)
BaxiMum :
Differenceit
118 119 116 109
11.8 12 11.6 12.1 4
8-17 9-16 8-18 10-17
69 71 65 60 1
7.0
4-11
7.1
4-11
6.5
3-10
6.7
5-9
8
731 695 606 585 20
73
58-102
70
51-102
61
26- 79
65
47- 79
16
10.6
-
8-15
9.8 9 9.8 15
7-15 6-15 6-16
839 781 688 668 20
84 78 69 74 18
62-115 53-110 27- 87 48-101
1,315 1,274 1,088 1,108 17
1132 127 109 123 17
17
i
92-186 84-187 51-165 100-167
2,462 2,381 2,066 2,052
246 238
143-452 146-446
207
138-362 1
228
160-333
10
j.
2) No data reported for this Quarter from Texas-TMC;data from previous Quarter used to avoid serious distortion.
3) Data for California not included in this Quarter92

TABLE III-3: AVERAGE QUARTERLY FAMILY TURNOVER
(Quarters III - Year I through Quarter I - Year III)
Site
AverageQuarterly
Turnover
% TurnoverBased On
Family Enrollment
%1
AdjustedTurnover
% Turnover
DuringQtr.I1 - yr.II
AdjustedQuarterly
Range
ALABAMA 10 11.7% 5.3% 51.2% 0% - 8.2%.
ALASKA 12 24.8% 16.9% 72.3% 6.7% - 33.3%
ARIZONA 7 9.7% 5.5% 31.8% 1.4% - 9.7%
ARKANSAS 11 14.0% 5.6% 66.2% 0% - 12.4%
CALIFORNIA 9 19.8% 13.1% 100.0% 0% - 22.2%
KANSAS 14 19.0% 15.3% 40.0%2
8.3% - 34.0%
MASSACHUSETTS 10 16.7% 9.0% 61.7% 0% - 19.7%
NEVADA 20 31.8% 28.9% 50.0% 14.7% - 43.8%
NEW YORK 16 22.7% 12.6% 81.1% 1.3% - 43.8%
NORTH CAROLINA 11 17.8% 9.7% 65.5% 0% - 30.0%
OHIO 1Z 18.7% 11.0% 62.3% 0% - 32.0%
TENNESSEE 12 15e0% 7.1% 60.8% 5.1% - 9.2%
TEXAS - HOUSTON 19 26.6% 19.1% 66.3% 5.0% - 56.6%
TEXAS - TMC3
-- -- -- -- ---
UTAH 9 12.8% 5.6% 60.6% 1.3% - 17.3%
WEST VIRGINIA 24 18.1% 14.0% 53.1% 6.4% - 18.3%
TOTAL PROGRAM 13 18.2% . 11.5% 59.0% ---
1The figures presented in this column exclude the seasonal high termination period (Summer) toshow a more accurate Picture of average quarterly attrition.
2The figure reported here is for the 1st Quarter of year II since terminations took place in anearlier quarter in Kansas than elsewhere.
3No information is reported for Texas-TMC because of insufficient data.
94
11
TABLE I1I-4: STAFF TURNOVER BY SITE
(Quarters rxx - Year I tbrough Quarter I - Year xxx)
SitesTotal Staff Turnoverfor 7 Quarter Period Staff Turnover
QuarterlyRange
ALABAMA 9 10.8% 0% - 18.2%
ALASKA 13 17.8% 0% - 41.7%
ARIZONA 5 6.8% 0% - 20.0%
ARKANSAS 4 4.3% 0% - 7.7%
CALIFORNIA 2 4.3% 0% - 11.1%
KANSAS a 12.7% 0% - 40.0%
MMSSACHUSETTS 4 6.2% 0% - 12.5%
NEVADA 21 20.4% 0% - 43.8%
NEW YORK 16 21.9% 0% - 41.7%
NORrH CAROLINA 12 15.0% 0% - 43.8%
CEMO 5 6.3% 0% - 18.1*
TENNESSEE 6 7.9% 0% - 36.4%
TEXAS - HOUSTON 15 17.9% 0% - 40.0%
TEXAS - TMC -- -- ---
UTAH 12 9.9% 0% - 17.6%
mr, VIRGINIA 7 9.1% 0% - 23.1%
TOTAL PROGRAM 139111.8%
1Total terminations for 7-quarter period or an average of 9.3 per project.
9577

96
. 1
TABLE III-5t EDUCATION MATCH - FOCAL PARENTS/HOME VISITORS
June 30, 1974
Alabama
Alaska
Arizona
Arkansas
California
Kansas
Massachusetts
Nevada
New York
North Carolina
Ohio
Tem ssee
Texas-Houston
Texas-TM
Utah
W. Virginia
Grades 0-12 High SchoolGraduate
Some College(Incl. Assoc. Degree)
Collge Graduate
PP H.V. FP H.V. FP H.V. FP H.V.
67.3%
37.0
81.9
74.7
58.0
34.6
44.9
81.2
77.4
85.2
87.4
71.1
41.104.
44.3
99.3
-- %
50.0
12.5
+for
20.0
14.3
14.3
.11 OR
40.0
33.3
11.1
26.7
26.0%
46.3
16.0
15.7
24.6
50.0
34.7
18.8
15.1
13.6
11.1
13.2
MI
32.9
0.7
16.7%
25.0
75.0
12.5
20.0
50.0
28.6
28.6
100.0
40.0
20.0
50.0
33.3
14.3
33.3
4.8%
13.0
6.0
14.5
15.4
20.4
7.5
1,1
0.7
5.3
101141
16.5
6.11.
66.7%
25.0
12.5
87.5
50.0
60.0
MP Ir.
57.1
28.6
rb
20.0
80.0
16.7
55.6
57.1
26.7
!POO % 16.7%
3.6 50.0
rbm eamb
50.0
/".
.11 28.6
OP re
411. rm.
MM Mr
MM Mr
MM MM
OrdOrmIrrm rm.
6.3 28.6
6.7
rrorm
4
.c
t if
97

TABLE
STAFP/FOCAL CHILD ETHNIC MATCH BY SITE.
6/30 1974
Staff
Focal Staff ChangeSix Summative Sites Children Current "Match" to Matdh
Alabama Cauc.Black
60 6
75 556
-1+1.
135 11 11 2
Arkansas Cauc. 91 13 14 -1Black 3 1 0 -1
*-1
Mex-Amer. 1 0 0 0
Amer. Ind. 1 0 0 0
94 14 14 2
Kansas Cauc. 41 4 4 0
Black 38 3 4 +1Mex-Amer. 6 1 0 -1
85 8 8 2
2 -1-42-3Black 61 7 7 0
PuertoRican 17 1 2 +1
Other 1 0 0 0
91 2
Texas-H Black 24 7 4 -3Mex-Amer. 36 4 7 +3
..m1111=10
60 11 11 6
West Va. Cauc. 206 14 14 0
9879
........w..a.~1~weNerrargralf~04

Ten Non-Fummative.Sitep
Alasic. Cauc.BlackAlaskanOther
trizona Am. Ind.
Calif. Cauc.BlackMex-Amer.Am, Ind.PolynesianOrientalOther
MASS. Cauc.
Nevada Cauc.BlackMex-Amer.Am. Ind.PolynesianOrientalOther
New York Cauc.BlackOtherAm, Ind.
.
No. CarolinaCauc.Am, Ind.
StaffFocal
Children Current "Match"Staff Change
to Match
31 4 4 0
4 1 0 +120 2 3. -11 0 0 0
56 7 7 2
80 12 12 0
24 3
24 123 2
1 0
9 16 2
2 0
89 9
57 9
35 7
5 3
4 02 0
0 0
0 0
5 0
51 10
3 0
2 -12 0
0 0
1 0
1 +10 0
9 2
9 0
7 0
1 +21 -10 0
0 0
0 0
1 -1
10,- - 4
92 11 113 0 0
3 0 0
1 , 0 0
99 11 11
51 11 112 0 0
53 11 11
9 980
00
00
0
0
0.
0
imr1011

FocalChildren
Staff
Current "Match"Staff Change
to Match
Tenn. Cauc. 85 11 10 +1Black 4 0 1 -1
89 11 11 2
Texas/TMC Cauc. 1 1 0 +1Mex-Amer. 114 14 15 -1
115 15 15 2
Utah Cauc. 67 15 13 +2Amer. Ind. 2 0 0 0
Oriental 1 0 0 0
Mex-Amer. 11 0 2 -2
81 15 15 -2
100
81

TABLE IV-1
DIRECTOR TIME USE - WEEKLY BASIS
16 Sites
Summative
Work-weekHours
Job TaskHours
%
In-HomeContact
%
FamilySupport
%
StaffSuper.
%
StaffTraining
_.
%
Admin.and Ot
Alabama 40 40.1 4 20 5 6 65
Arkansas 25.5 24.7 6 5 18 14 56'
Kansas 40 55.1 5 56 0 15 POhio 48 45.5 4 17 2 14 62
Texas-Houston 40 44.0 8 3 4 24 61
West Va. 47.5 59 7 27 7 12 il
,
Average4
Summative 40.2 44.7 6 21 6 14 52Sites
Now.Summative .
Alaska 27 20.8 3 34 2 20 41
Arizona 55 100.1 1 8 8 30 ' 53
California 46.7 51.29 0 27 2 28 40
Mass. 39 35.3 6 28 3 23 41
Nevada 32.5 30.5 18 31 0 14 37
New York 37 44.2 4 23 31 16 56
No.Carolina 47 54.9 6 8 9 18 60
Tennessee 45.5 69.0 0 19 5 15 59
Texas-TMC 60 55.1 10 27 7 22 33
Utah 29 21.8 1 30 1 25 43
AverageNon- 41.9 48.2 5 24 4 21 47
Summative
All SitesAverage 41.2 46.9 5 23 5 18 49
10 1
82

TABLE IV-2
SPECIALIST TIME USE-WEEKLY BASIS
16 Sites
Summative
Work-Week
HoursJob TaskHours
In-HomeContact
FamilySupport
StaffSuper.
StaffTraining
I Ad:in.and Other'
Alabama 40 42.9 23 31 0 6 41 .
Arkansas 24.4 26.5 2 20 .9 21 48 ,
Kansas NO SPECIALISTS
,Ohio 40 40.6 9 27 12 34 18
Texas- 40 46.5 13 17 6 32 42Houston
West Va. 38.5 30.0 . 10 16 7 23
Average 1
Summative .
Sites 36.6 37.3 11 22 7 23 37
Non-Summative
Alaska 32.7 24.3 32 18 0 34 16
Arizona 43 55.2 10 25 et 18 40
California NO S'PECIALISTS
Mass. 40 35.5 6 25 0 24 46
Nevada 22.5 23.6 15 23 2 11 48
New York NO SPECIALISTS
NO.Cerolina 34 60.5 32 28 2 9 29
Tennessee 34.7 40.5 27 s 6 16 46
Texas-TMC NO MCIALISTS
Utah 20.6 19.7 18 23 2 29 28
Averagel 32.5 37,0 20 21 3 29 28
Non-Summative
All Sites 34.2 37.1 16 21 5 21 36Average'.
lAverages taken only across sites which have at least one specialist.
102
83

A
TABLE IV-3
DIRECTOR/SPECIAL/ST STAFF HOURS PER WEEK
Summative Sites Dir. Jar.H.V. H.V.
Dir. Super SuPerEduc. Bduc.Aide Aide Health_tkeith
Soc. Soc.NUtr. Psych. Ser. Ser.
Dir.,Educ. Educ. Spec. Spec.Spec. Spec. Total Tote
Alabama 40 40 40 40 120 160
Arkansas 33 18 25 21 27 14 35 24 146 221
Kansas 40 0 40
Ohio 41 55 40 40 136
Texas-.Houston 40 40 40 40 120 160
West Virginia 50 45 38 38 133
Non-Summative Sites
Alaska 48 13 20 41 16 40 97 178
Arizona 55 42 44 86 141
California 47 46 0 93
Massachusetts 39 40 40 79
Nevada 45 20 27 .24 16 67 132
New Itt 37 37 0 74
North .rolina 47 28 40 68 115
Tennessee 45 40 40 24 104 149
Texas- TMC 60 0 60
Utah 29 24 14 9 31 25 103 132
103 104

105
TABLE rv-4
HOME VISITOR TIME WE -81DRING 1974
AverageHours
WorkedPer Week/
t
Time
in
Home
t
Time
in
niftily Support
ATime onTravel
to Fam4lies2
1t t
Time TimeOA on
Training Other
t
Timeon
Total Travel
-,
Alabama 51.9 (43.2) 50% 21A 7% 5% 7% 12%
Alaska 35.3 (37.4) 54 19 9 10 8 IS
Arizona 52.9 (51.0) 35 27 9 23 7 17
Arkansas 35.1 (41.0) 43 25 - 8 12 12. 18
, California 50.8 (47.3) 35. 25 5 26 9 JO
Kansas 43.3 (41.0) 40 25 8 20: 8 .17
Mass. 51.8 (44.5) 41 30 7 17 5 14
Nevada 48.7 (43.8) 39 28 6 20 8: 12
Nem York 41.5 (36.0) 45 17 5 21 13 8
N. Carolina 46.0 (40.0) 43 22 8 23 4 12
Ohio 37.0 (32.1) 40 22 6 18 15 14
Tennessee 55.7 (41.3) 42 19 '6 18 15 5
Tx.-. Houston 40.6 (40.0) 39 22 6 25 IQ 13
Texas - TMC. 40.1 ( ".8) 38 23 7 23. IQ 4 13
Utah 38.7 (47.4) 28 39 7 20 6 . 2
W. Virginia 50.0 (40.8) 38 31 6 15 9 21
AVERAGE 45.0 (42.0) 41% 25%
-71) 18% 91) 12%
1Reported in this column are both the total hours home visitors accounted for in the time
categories and the total hours the home visitors said they worked last week (presented in parentheses).
2Travel to and from the home for home visit purposes only. 106
:11
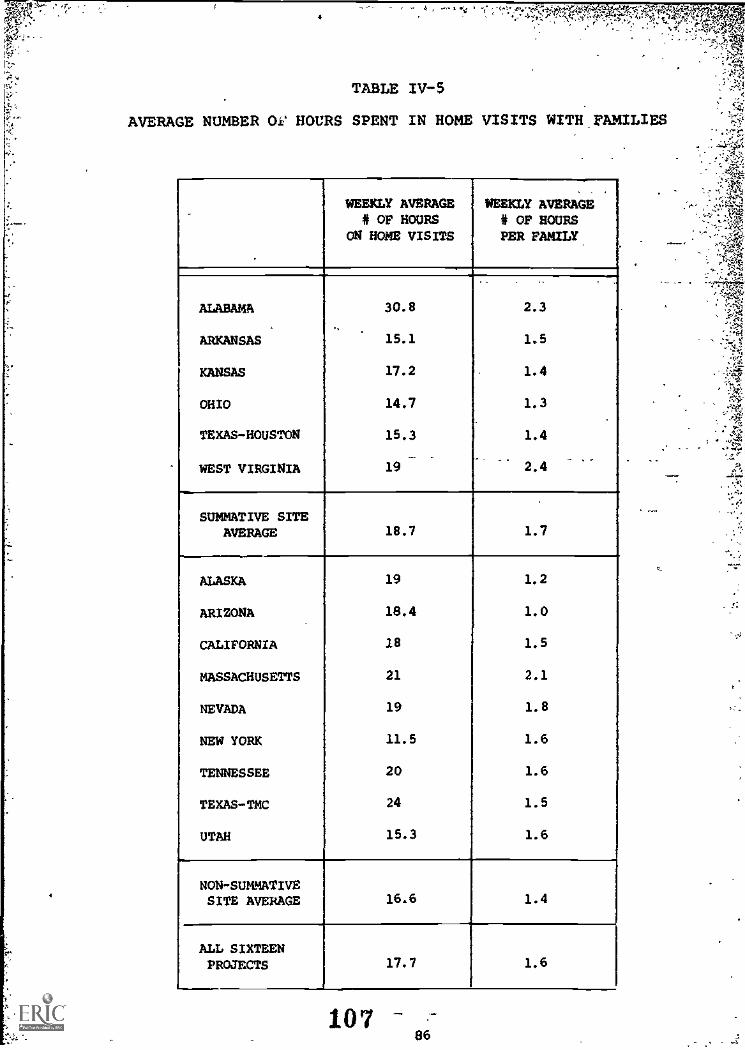
,
TABLE IV-5
AVERAGE NUMBER OV HOURS SPENT IN HOME VISITS WITH.PAMILIES
WEEKLY AVERAGE# OP HOURS
ON HOME VISITS
WEEKLY AVERAGE# OP HOURSPER FAMILY
.
ALABAMA 30.8 2.3
..
ARKANSAS 15.1 1.5
KANSAS 17.2 1.4
OHIO 14.7 1.3
TEXAS-HOUSTON 15.3 1.4
WEST VIRGINIA 19 2.4
SUMMATIVE SITEAVERAGE 18.7 1.7
ALASKA 19 1.2
ARIZONA 18.4 1.0
CALIFORNIA 18 1.5
MASSACHUSETTS 21 2.1
NEVADA 19 1.8
NEW YORK 11.5 1.6
TENNESSEE 20 1.6
TEXAS-TMC 24 1.5
UTAH 15.3 1.6
NON-SUMMATIVESITE AVERAGE 16.6 1.4
ALL SIXTEENPROJECTS 17.7 1.6
10786
I

TABLE V-1
;Site Comparison - % Time'Spent on Various Activity Modes
Dominant
Tell/Explain/Do
Read/Sing
Ask
Listen/Watch
Ignore/Uninvolved
Other
108
' z ....i'
..
74% 77% 75% 80% 69% 73% 75%
10% 12% 7% 3% 10% 3% 7%
12% 6% 10% 14% 18% 16% 13%
3% 4% 8% 3% 2% 8% 5%
0% 1% 0% 0% 0% 1% 0%
0% 0% 0% 0% 0% 0% 0%
,
1
109

Igo
Tell/Explain/Do
Read/Sing
Ask
Listen/Watch
Ignore/Uninvolved
Other
TABLE V-2Site Comparison - % Time Spent on Various Activity Modes
Non-Dominant.
>vtgz71.2
32% 27% 40% 31% 34% 35% 33%
1% 1% 2% 0% 0% 0% 1%
10% 4% 8% 7% 20% 7% 9%
45% 57% 32% 56% 39% 42% 44%
12% 11% 17% 7% 7% 16% 12%
0% 0% 0% 0% 0% 0% 0%
111

Tell/Explain/Do
P,ad/Sing
Ask
Listen/Watch
Ignore/Uninvolved
Other
. n.'14.'0,c.
t A'. ,,".
. . 1:0156431.4- V '- " :Tigat.,1-3
-
Site Comparison -, IV, Time Spent on_ Vnrious, Activity MCde's
Non -Domin-ani -and-finixinint Coliibinea.-7777 ;44.,.4-
' 4
46% 44% 52% 47% 46% 48% 47%
4% 5% 4% 1% 3% 1% 3%
11% 5% 9% 9% 19% 10% 10%
31% 39% 24% 38% 27% 30% 31%
8% 8% 11% 5% 5% 11% 8%
0% 0% 0% 0% 0% 0% 0%
I
113
ot

114
TAIVLE V-4
.
Home Visitor Child Parent Nome Visitor Child. .......
Parentbali=santDominant Dominant Dominant Dominant Dominant
ALABAKA ARKANSAS
Time Percent Time PerCent Time Percent Time Percent Time percent 1.... Perceft,
Tell/Explain/Do 15.02 29.8% 13.11 26 I 9.45 18.74 23.24 40% 14.09 24.2% 7.54 13%
Read/Sing 4.25 8.4% .33 .7% 0.67 1.3% 4.84 8.2% 0.0 0% 1.87 3.2%
Ask 5.34 10.6% 0.0 1.8% 0.58 0% 1.98 3.5% 0.0 OS 1.62 2.8%
Listen/Watch 0.83 1.7% 0.89 0% 0.0 0% 0.38 .6% 1.71 3% 0.17 .3%
Ignore/Uninvolved 0.0 0% 0.0 0% 0.0 0% 0.25 .4% 0.44 .8% 0.0 0%
KANSAS OHIO
Tell/Explain/Do 18.49 28.8% 16.58 25.8% 13.22 20.6% 25.8 51.6% 8.10 16.4% 6.05 12.3%
Read/Sing 0.84 1.3% 3.22 5 I 0.42 .6% 0.0 0% 0.0 0% 1.29 26 I .
Ask 1.66 2.6% 0.83 1.3% 3.81 5.9% 4.86 9.8% 0.0 0% 2.14 4.3%
.Listen/Watch 0.0 0% 1.33 2.14 3.83 e I 0.52 1.1% 0.48 1 I 0.48 1 I
.
ignore/Uninvolved 0.0 0% 0.0 0% 0.0 0 I 0.0 0% 0.0 0% 0.0 0%
TEXAS-HOUSTON WEST VIRGINIA
Tell/Explain/Do 6.5 14 % 20.11 43.35 5.47 11.8% 41.50 39.8% 20.87 19.9% 13.97 13.4%
Read/Sing 1.78 3.8% 0.50 1.1% 2.42 5.2% 1.30 1.2% 0.19 .2% 1.38 1.3%
Ask 2.81 6 % 0.28 .6% 5.45 11.7% 14.84 14.3% 0.94 .9% 0.43 .4%
Listen/Watch 0.0 0% 0.75 1.6% 0.33 .7% 6.58 6.3%. 0.0 0% 1.58 1.5%
Ignore/Uninvolved 0.0 0% 0.0 0% 0.0 0% 0.25 .2% 0.56 .5% 0.0 0%
TUX SPENT OR ACTIVITIES FOR DOMRLART NODE
;"*.
115

Time Percent Time Percent Time Percent Time Percent .....* . r;---7,40
6.08 6.3% 13.33 13.7% 11.33 11.6% 10.89 9.6% 10.94 9.8% 8.37 7.4.741
0.33 .3% 0.67 .7% 0 0% 0.42 .4% 0.13 .1% 1.01 .9%A4.
4.86 5.0% 1100 1.1% 4.09 4.2% 1.67 1.4% 0.92 .8% 1.63 1.4%
12.75 13.1% 10.03 10.3% 20.78 21.4% 14.50 12.8% 14.94 13.2% 34.69 30.6%-..;
0.92 .9% 8.11 8.4% 2.72 2.8% 0.21 ..21t 12.10 10.7% 0.67
KANSAS OHIO
23.92 19.5% 10.36 8.5% 14.95 12.2% 4.34 4.5% 17.09 17.5% 8.95 9.2% ::;;7'
2.81 2.3% 0.0 0% 0.0 0% 0.0 0% 0.0 0% 0.0 0% _1$, it
2.75 2.3% 5.50 4.5% 1.95 1.6% 4.52 4.6% 0.0 0% 1.86 1. 9%
13.94 11.4% 4.50 3.7% 20.84 17.0% 9.66 10.0% 16.61 17.1 28.00 28. 8%
.17 .1% 14.72 12.0% 5.39 4.4% 0.0 0% 5.33 5.4% 1.00 1.0%
TEXAS-HOUSTON WEST VIRGINIA
6.00 6.6% 15.78 17.2% 9.22 10.1% 12.76 6.2% 35.00 17.0% 23.83 11.6%
0.0 0% 0.11 .1% 0.0 0% 0.0 0% 0.10 .1% 0.69 .3%
8.47 9.3% 0.0 0% 9.86 10.9% 9.49 4.6%. 0.69 .3% 4.16 2.04
21.95 24.0% 4.33 4.7% 9.11 10.0% 20.44 10.0% 19.13 9.3% 46.95 22.8%
0.0 0% 4.28 .4.7% 2.28 2.5% 1.06 .5% 16.55 8.1% 14.72 7.2%
--TINE SPENT ON ACTXVITIES POR NONDOMiNANT MODE

Home Visitor Dominant /nteracting With Focal Parent
Activities Home Visitor Activity Focal Parent Activity Focal Child Activity
Toll/Explain/Do 84% 29% 28%
Read/Sing 5% 0% 0%
Ask 7% 6% 2%
Listen/Whtch 4% 65% 27%
Ignore/Uninvolved 0% 0% 4%
Total time = 16 mins. Total time = 16 mins.
Content Areas
TOtal time = 14 mins.*
Child Content Parent Content
School Readiness 9% Educating the Parent About the Child 20%
Physical Development 12% Health and NUtrition 16%
Health and Nutrition 2% Parent Education 1%
Emotional Development 6% Social Services 3%
Parental Concerns 32%
Subtotal 29% Subtotal 72 %
Total time = 16 mins.
*Discrepancy due to incomplete reporting on Home Visit Observation Instrument.
118 119
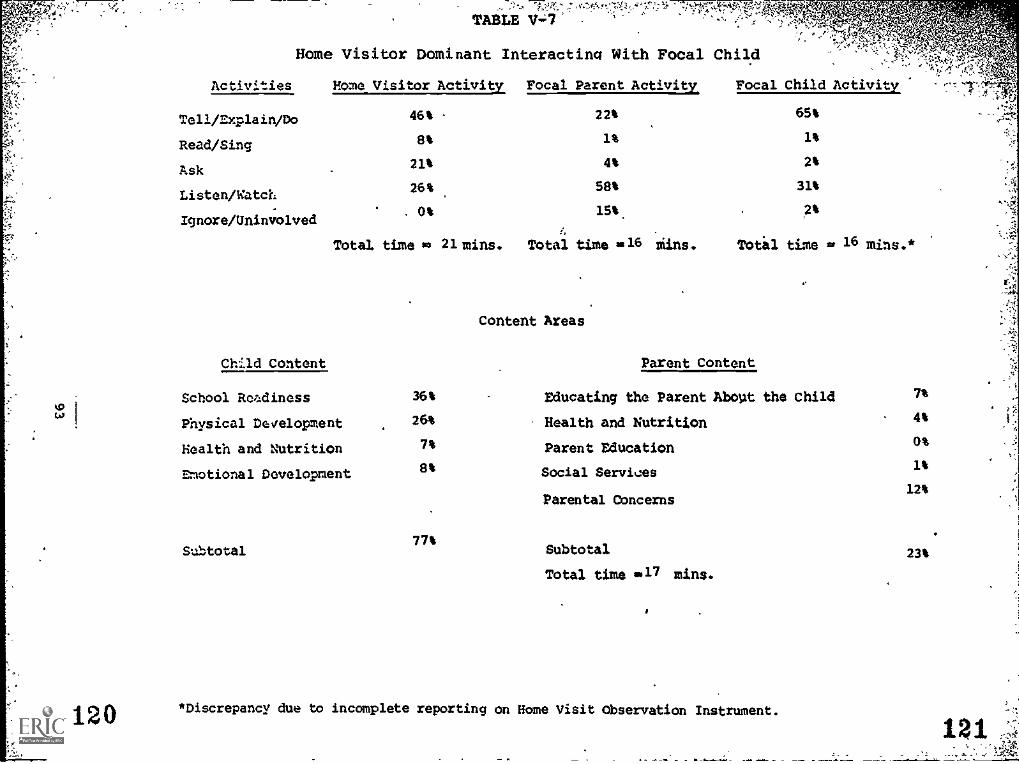
TABLE
Home Visitor Dominant Interacting With Focal Child
Activities Home Visitor Activity Focal Parent Activity Focal Child Activity
Tell/Explain/Do
Read/Sing
Ask
Listen/Watch
Ignore/Uninvolved
46%
8%
21%
26%
. 0%
4
22%
Alt
Sft
15%
65%
31%
?%
120
Total time m 23. mins. Total time 2,16 tans. Totil time st 16 mins.*
ChUd Content
Content Areas
Parent Content
School Readiness 36% Educating the Parent About the Child 7s
Physical Development 26% Health and NUtrition Alt
Health and Nutrition 7% Parent Education Os
Emotional Development 8% Social Services1%
12%Parental Concerns
77%Subtotal Subtotal 23%
Total time m17 mins.
*Discrepancy due to incomplete reporting on Rome Visit Observation Instrument.

tu.
TABLE V -R
Focal Child Daminant Interacting with Home Visitor
Activities Home Visitor Activity Focal Parent-Activity Focal Child Activitv
41:T.
Tell/Explain/Do
Read/Sing
Ask
Listen/Watch
Ignore/Uninvolved
43%
8%
28%
25%
0%
28%
0%
8%
50%
13%
88%
4%
2%
5%
1%
Total time in 13 mins. Total time 1513 kns. .Totil time m14 mins.*
Child Content
Content Areas
Parent Content
11
School Readiness 35% Educating the Parent About the Child 4%
Physical Development 35% Health and Nutrition 3%
Health and NUtrition 3% Parent Education 0%
Emotional Development 9% Social Services 1%
Parental Concerns 10%
Subtotal 82% Subtotal 18%
Total time ig 3.4mins.
*Discrepancy due to incomplete reporting on Home Visit Observation /nstrument.

se.
4v
1.24
. . ...i.e. wa.:, t 1$4 ."1"tai- ,j, .4.: ,......."..104...q+.: *,,o4.:Nrfil ea 3., -e-i--
TABLE V-9 -.
..
v..41": - <
Focal Child Dominant Interacting with Focal Parent 4 ' ,... .. <1,..:0,4*.N1
Activities Home Visitor Activity Focal Parent Activi_ty
Tell/Explain/Do 26% 49%.
Read/Sing 1%
Ask 16% 25%
Listen/Watch 51% 24%
Ignore/Uninvolved1%.
Total time imk_9
Child Content
School Readiness
Physical Development
Health and Nutrition
Emotional DevelOpment
Subtotal
37%
33%
5%
5%
. _ . 1. it:V.*,
Focal Child Activity'. --
mins. Total time 9 Sans. Totil time i 9 mins.*
Content Areas
Parent Content
Educating the Parent About the Child
Health and Nutrition
Parent Education,:
Social Services
Parental Concerns
79% Subtotal
Total time * mins.
*Discrepancy due to incomplete reporting on Home Visit Observation Instrument.
21%
125- .

1Focal
;;4 .VrTikAnk16
TABLE.V-1.0,
Parent Dominant Interacting with Rome. VisitOk
,
Activitles Home Visitor Activity
Tell/Explain/Do
Read/Sin0
Ask
Yiisten/Watch
/gnore/Uninvolved
Focal Parent Activity Focal Child Act'xity.
39% 76% 16%
Ot 0% 0%
7% 15% 11%
54% 10% 21%
0% 0% 524
8 mins. Total time st 8 siins.' Totil;time = 8mins.*Total time
Content Areas
Child Content Pirent Content
School Roadiness 10% Educating the Parent About the Child 15%
Physical Development 6% Health and Nutrition 16%
gealth and Nutrition 2% Parent Edudation2%
Emotional.ftvelopment 5% Social SerVices5%
Parental Concerns40%
77%Subtotal 23% Sdbtotal
Total time = 8 mins..
*Discrepancy due to incomplete reporting on Home Visit Observation Xnstrument.
,.
.* ," ;',ff.
1
:,

,
eat 1111.
A
kri; pis
14V4,
1 4.3
128
Focal
:!tetivities
Tell/Explain/Do
Read/Sing
Ask
Listen/Watch
Ignore/Uninvolved
Child Content
tar,: sr," & AZ " er.'t.1.^12"., ,orv,
. s"/F., .4".
:V. . : ; 5 ,,Parent Dominan' Interacting litith. t "*rg**X'W "ioe 11.4.1
".1;',";,"::'. ik:-;
dome visitor Attivi.../ -Poctit ;., v, o*.o. ,5 -t A.041 stv..1--v, - t* 't '44 k k*:Lt1P.k: #44**'. ""'"*;'"*Cr *. *le71kkit4.'
k . .
**. "** **' 11 '141 '11 .*
.3/,INOMM,
. - .4 ,:. ''.;gt 5 4 0-,-5.184 .: , , 2?.,- ,
Oft,=
..4*". V. V "". l'sr-f2.v_ o "8/ A ; .1., er 1;11°X'.
2211: - r`i*,1*- ;7 ct v"-': ,1 14 -,4,"14:. ,"ei, 4',44.1";:z4g;4%.,':vii4.:
" etaatif 4.44 tsVt 41'17' ;" : ir.. -sire$:<;'7 .:-0:: ,:.' j,. .;.... . -....,_.41-,.,.- ,..4"..."; ' .1:: .1",-, ...-1,'-c-; ', , + .i '-. .. inil,,)NN;;.. -,..."..4,
472% '- -
., St -f.4'e . ,A6.....,-
_
. ., .1..-... 1....- - ',.. ', -("."' 1-:-...4. ''..0 :.. * - .1*.i. .
. . As-s' - .-";,-, , .- - :41-- -_,,.. , ,:; 11%.....,.... 7 , ss -" . .. ..-.. , ,,,....,;., .. .0,- - --- , , . , "I' A.r.-,./, .°..4k..,-'
5% - ;2041-- * , r2, .e o'-7 $rI 5:4'. 4.'
_ '; 4-1211::-e
Total tills -Ng 6 mins.' Total *tinte:1"--6('. . ' ,
School Readiness
Physical Development
Health and Nutrition
Emotional.Development
_ Subtotal
49%
16%
St
3%
74%
!, *z-' .fr..,.= , : _..r.,=-:. ' .: .'*
:,. , .,_ - *I /7.$' s,..3-._ e ','1'%.4"e:.r.."
: ''''...- 'Content.Areas . --- ,-- - -'' "'.. "''
;-. :..:-,:
'...-;-:',:."-14,,,
, . -. .. 2 ,,,--., -4,.
. , - .; ..., ., -., -. 4.,.... e.? ,..., . .... .1.,!...-....' .' 1
' . r. 4 "-...1: ." 4 :- -. : t "IL. ** 4-' .." ..i"."''. ;5- .2,;-,:il :. .*..-, . ..1.. -;",..I. .,_' sl' .....^ 0, o ° ''"'' .A....:'. :1 .....o,. 44; ,' ' '.. . . . 4.
',',.':,-;:.:.arent, contenv,...s....i,..,-...
.. ,...- ......ic- . ..,.' -, I.' '. '. " . '''' "' 4 ","''' .. ''. s" .4. 15% ---
'-'.-;:',4',0
- '1,_ -. -'...----...."°.,,i. ,-1..A-tA:.....thili ' Child
. , .- -, .
" , _ ,.:, .
,iducatin#1:,,th, Ph.' too.- ...--- -, . - . ., . . :-., : ... _. 6 ". . ,,:k ' 1I .0' 3% -Health andNi.itk.ition.-.,. -_--'1";
Parent Educalt4o,n:,:::: -...."
Social -Serliicest -'
Parental Concerns
Subtotal _
Total time a 7 mins.
*Discrepancy due to incomplete reporting on Home Visit Observation Instrument.
.
. t.
26%
. -,5

4;,
DO
MIN
AN
T
INT
ER
AC
TO
RT
AB
LE
V-12
SUM
MA
RY
- DO
MIN
AN
TPA
TT
ER
NS B
Y SIT
E
TO
TA
L SIX
SUM
MA
RT
IVE
SITE
S
1130
424.11111.11P
4.0.4.1111.
131:.
TIW
AL
MO
MSIX
sngsea O
N N
O40 -
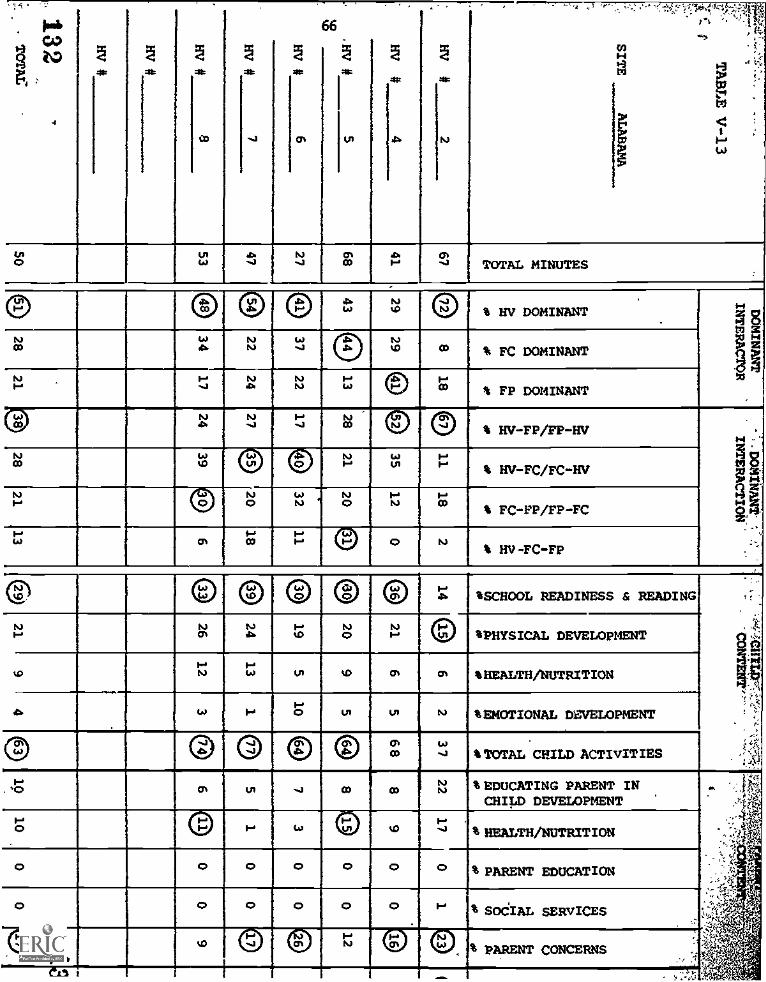
rIZ...
v.:.).%
-!:7"'
i,,*T
AB
LE
V-1 3
SITE
AL
AB
N4A
DO
MIN
AN
T
INT
ER
AC
TO
R'
DO
MIN
AN
T' ^.
INT
ER
AC
TIO
N'
. N-4C
1ITIre7.. " ' - -
'A;°;-,:,.....1:,r,a.,
:7,!'
..1.,-.-z-4,3,;4.
...-
.e-,,.
s .
.0,z, -
-T
oz,-,:-..v&Iv-.?_--),
''
1%;;;4'1-0
1-1Z1-1
8.0
Z1-e
80
Iga,rk,O
P
Iiy4
ur id,IP.
LI
giaI112
piA4
OP
gi:
CI
gia
40
z1-1
ca
2I0FIi
Z121
i'lgvI0
t1cmQgir.4CI
.
iatOP
setiri>111
Eli
4SilOP
aINE.
g 9.
OP
IP
1
.
OP
HV
#2
678
180I
1118
214
©6
23 7
2217
01
i,
H V
#4
41.,
2929
©©
135
P
120
021
65
6 88
90
.
00
. HV
#5
68430
13
,28
12120
CI
209
588
_
00
12g)
HV
#6
27e
3722
17C
I32
110
195
10C
I7
30
0®
HV
#7
478
2224
2710,
2018
CI
2413
1
4 a5
1
..
00
10
HV
#8
53SO
3417
24
l_
39
1
CI
6C
I26
1238
6C
D0
09
HV
#
-
,
HV
#
-
132,.
-T
OT
AL
'
,
5028
21828
2113
2421
940
1910
0
IA
0 10,

=1.
:1-
SITE
AR
KA
NSA
S
XV
#1
72
HV
I#2
61
HV
#
HV
#
363
442
HV
#5
63
HV
#6
29
Hy #
763
1.341v*
71
DO
MIN
AN
TIN
TE
RA
CT
OR1
DO
MIN
AN
TIN
TE
RA
CT
ION
art4
4215
2/
2526
13
1316
6
1242 9 6
12
2816
3815
1335
8 12, 38
24 9 1214
1624
1$ID
a1620 ID
42
3
` ,., va t
_-,..' ' -,i*- ,' ?... '''':Jr -
....
,.,
4 , .,
CH
ILD
CO
NT
EN
T
'"*.Vit'17..
''' 'le'
\_^,-4!,."7.'s''''
Ify.,,, ,i,,,.,,,,i, rp&.-
,,,,,e\ V-;,_
r io'
'-
'Ajit int 4
,..41,.
'-:,,',>
;:-.1:'..:
.,
0zmIcil
ti) C/1
414I0
81?iimE
RO
lidid..d,
-1Q*I1gCO
oHdt4
g
1gtg
0Pr z
1mH
2:0
40
atilmH6 9
dila
aH5
011Ng
dila
co0N.
0
coI6t0
coHHhit4
.
4A
C.)
2210
5C
O80
0
.
08
2 7
Cos
24
,
21
00
130
013
43 -
0-
187
100@
81
0' 6
25
010
13
2 9
, 151.7
.1
7G
I)
G8
76
'00-
9
-
00
1046
©-2
0
-
31 5
4 a17
1.
-,14
22-
00
251
13
,010
20
5
p.28
85
73
z
2 512
0
-
15
i,

4.e.:rt- ,
,....,.=
ei.....
..;
'.
--All ea gla
'
TA
BL
E V
-15
SITE
KA
NSA
S
..2
54
,
HV
#3
95
I-.0I-.
55
HV
#6
53
760
869
HV
#
HV
,
.
138TO
TA
L.
1 6 4

!. 4i.'" c,2-.1F11p,
7DOtgilITERACTOW
. ... ; '-. : ...
12
8 2 7
34
9
e 2 3
1 2 6
C) 14 3
49 -24
.1, OM MS 111111

4-4 ' - . . INV.-64V,' '1) ' V 11,4 r . .447.,..,_;!".;)-"-%i.4. ait.l.' , 4 ' 4 t"*. .. - 4.4--1.:. ,,
r: , bi ..,.- /401410'..'d. 44'../..1',..',A. ,,,t A. 1.P% A;,s iuterznagW1.;211f ,4:k.44 ,\''11,1 qtkitatilitt;( '1;40, '''"IOR, \ , ..-- - -, .,-.L.,-,,,e r.....k , i...,-., sv,:wit....; ' ...V.4 ' .- - , :r7-;.'', ......0.411r4roie ; ,. : 4.1,4
-.. :- r . .- ''. .4. ' '12'1" .:`.'"1/44. . , 415,i;441. ....\. 4...eI'e.i.c.,,f..C.-i ..--4,.; ,-. , N. tr,A,,,,-..
. 6 'tet,-,....,,,,,:' .. Li.:-.....2 *-e..t.''' AN' - ''4 ,. ,4 T -. - .,, 4 ;. ' .4, 4.:.. ,.. IY,.,? :ki,;y --- ,-a-.< . ...t,:t.. AN- T . . : 4-- -,-. , ,, ,
--. ,e. -....-1. ,. - '4s. .- .
- .: 4 1:x....
,- .1:, , , ,a :x Z..-
'4%. je. ., . ,. ,
.-..
,' : ;" . ) .A '
-. ili --4
t.. . a., ' *
. ...
1 ,A
. .
.;:' ..r,;" .;*3 % w :; ':
' ,..? : :,:i2*.,$5i -,,, V i -f-.-*.. . ..
18 ZS 47 0-....,-.-...:.-.-4-. - .,-1,-.'-: . z:. .,,..t7.
- -SO '. -, i '' ' ' -Z 1 ''.".' ' .1:''
12 21 .2 8. : 23- Id "'I-V-
3 o'%.milim 743
9 0 14 36 0 16. 0-
1 23 15 13 33' 7 I 54, 0
39 3 0 2 11111 E
36 10 36 14O.II 4k
- -24-- -..

?* *."
440,-t
%
' A;
110; sIR
A* roe.N
r40.- Tat4E
lci'^
^'
- '414, .40:,
1
.`; 4
*.q-
"
--3-.4
4.
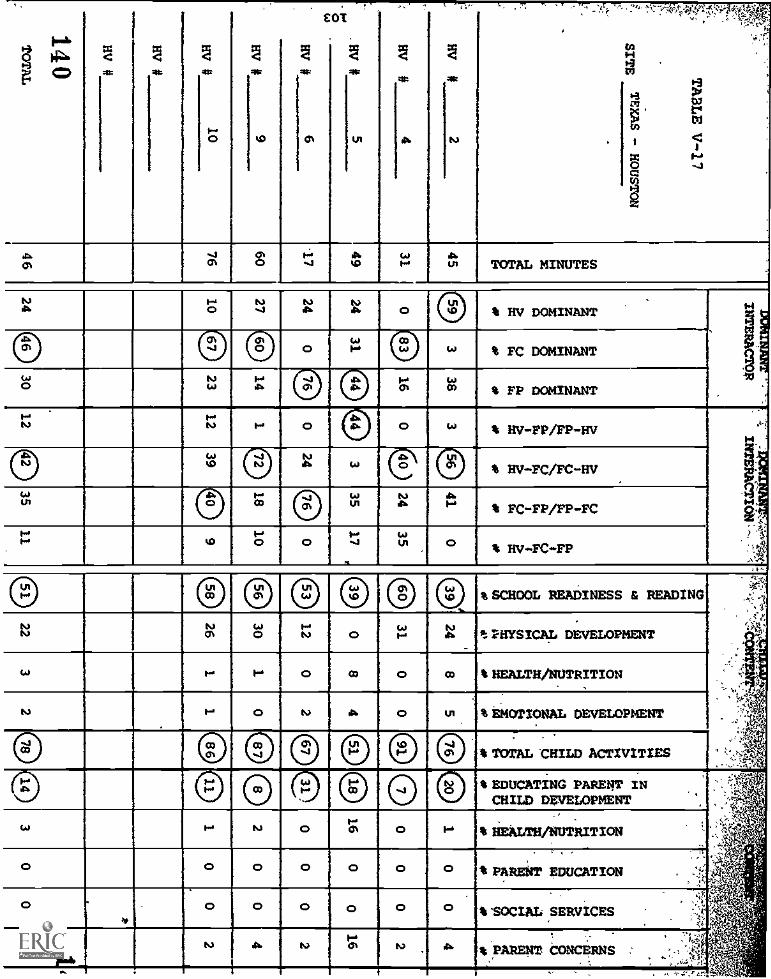
-
1.
TA
BL
E V
-17
sITE
XA
SH
OU
ST
OU
HV
#2
HV
#4
. HV
HV
#
56
HV
MVI
HV
#
Hy #
140T
OT
AL
9
10
5
31
49
-17
60764 6
171411WIN
TIN
TE
RA
CT
QR
INT
ER
AC
TIO
N
El
!X
1
ZZ
Isf
t.t.
s4s4
AI
....a$a.
ata$
IliI
f1
0C
Ug
g0
0444
Is.
00
*411
338
341
016
040
2435
2431 0
335
240 0 0
24 027
141
18
1023
1239
1710
2430
1235
11
v.
248
C) 31
0
I.41.
4 -a0
1'0
to)
4
00
2
e 04 ®
0 120
2 0 e0 30
e 26
160
016
000
02
04
00
2
2214
5

0 oe
e000
0ene
0 0
00
-0
e 00
0Q e
eee
eeee
0-
0 0
p0
99
00
0u
414
.
A 0
9-
*eta
e9e
ittea
mv
1
41,
.4.
a+4
i.-

!tree 4.
4,:s.:', 4
0: .
rt..
X.:
f*.°
,
6,
APPENDIX A
SPRING DATA COLLECTION AND INSTRUMENTS
DATA QUALITY AND PROBLEMS
F.
143
;col
111"1.1:
tC.

4
rntroduction
A discussion of data quality and problem areas with each
of the spring data collection instruments is presented here to
highlight factors which limited the scope of the data analyses
to sone extent.
Incidence of Missing Data
There was a high incidence of missing data for each of
the instruments. Although data were obtained for all projects
regarding cost, background, and time use for all appropriate
staff, there were a number of items on which no response was
solicited or recorded. On the Hone Visit Observation Instru-
ment, data were collected on only 82.3% of the families-that
were randomly selected for observation purposes. The main
reasons for the missing observation were the termination of
one home visitor from the program and the family being out of
the service area for a temporary period of time. Records of
Hone Visit Activities alsO were not obtained from the total
sample of families. In West Virginia, more than 50% of the
Records were not obtained for data analysis.
The incidence of missing data limited the scope of several
data analyses.
Problem Areas
Following is a discussion of major problem areas with
some of the data collection instruments.
144
..o,'.4d

40.-0.11 WM.
-Costs
A. Actual Expenditures and Levered Resources
One of the major problems with the cost instruments
was the lack of clarity regarding what constitutes a
"levered resource," resulting in inconsistencies in
the data oo:1ected.- Some projects, for example, re-
ported the provision of Food Stamps to families as a
levered resource, while others did not. The confusion
regarding levered resources made it difficult, if not
impossible, for projects to keep complete and accurate
levered resources records. As a result, most of the
cost data collected are 'based on estimates rather than
documented levered resources.
Cost data collected at the four Head Start Projects
were at best sketchy, primarily because of the size of
the projects that are involved in the evaluation.
Cost data collected by field staff were frequently
incomplete and required follow-up telephone calls to
most of the projects.
More refined decision rules regarding cost data and
more detailed collection procedures need to be de-
veloped and shared with both field staff and Projects
during the fall.
145
9-4
4

B. Time Use Instruments
An effort was made during the spring to determine both
how much time each staff member'spent,during the last,
work period and how much timelle/she normally spends
on various tasks. The format oithe queStionnaire
was complicated both for field stiff administering
it and for project staff. Rather than asking _t1-e
staff to specify whether the time, spent last 'period
was more or less than usual, and,how much more or
less, it would have been better to ask how much time
the staff member normally spends on the various tasks.
In the majority of sites, staff under or osier estimated
the.time they spent on the various tasks. Considering
how difficult this estimating task is, the total time
for all tasks combined came relatively close to the
actual hours the staff reported they worked: The
following is an example of how the actual hours worked
and the total of all time on the various tasks combined
compared with some of the projects for tiO;Me Wilaitors,
Total HoursReportedWorking
.
51.9 35.3 52.9 35.1 50.8 43.3
Total HoursWorked 43.2 37.4
L _
51.0 41.0 47.3
.
41.0
146

71.Home Visitor Back round
Generally, the Home Visitor Background questionnaire yielded
useful data. Not all home Visitors completed the question- 31
naire consistently, however. One specific problem with the
Questionnaire was the categories used to determine the home
JA4
visitor's educational background. While the categories
used in the Questionnaire were consistent with
the Hame Start information System, they were different
from those used in the Parent interview.
Record of Home Visit Activities
One of the major problems with this self-administered in
strument was that the time spent on various activities was
recorded in terms of a "range" of minutes, rather than actual
time. This presented problems in the analysis of the data.
Although it is difficult for home 'visitors to estimate the
exact amount of time spent on specific child and parent
activities following the home visit, an attempt will be
made during the fall to obtain more precise information.
Home Visit Observation instrument
Because of the complex nature of the Home Visit Observation
instrument* some community interviewers failed to note the
time started and stopped for certain activities or did not
indicate a major mode of interaction or major content area
of the activity. This resulted in considerable loss of data.
in analyzing the Home Visit Observation data* several of the
interaction and content categories were combined. To simplify
Home Visit Observations both for collection and analysis pur-
poses* the instrument underwent major revisions for the fall
data collection effort, hopefully resulting in better quality
data. Data quality of the Home Visit Observation instrument
is reported in Appendix B.
147

APPENDIX B: HOME VISIT OBSERVATION
INSTRUMENT
RELIABILITY
148

Introduction
The purpose of this section is to determine inter-judge
reliability of the various observers on the Home Visit Observation
Instrument. Since no reliability data were collected prior to
the spring of 1974 field effort, no comparisons will be made here.
In March of 1974, an Advisory Panel to the Home Start,
Evaluation staff discussed the necessity of collecting inter-judge
reliability data on the Home Visit Observation Instrument.
Several methods of reliability data collection yere considered
including: (a) having two observers accompany the home visitor on
a home visit; (b) preparing video-taped home visits and havini:
observers in all sites record their observations; and (C) dOeloi-
ing home visit scenarios to be role-played, obserVea.and'riCCrded. . .
by observers. The latter method was selected because method (a)
could double observer effects on the home visit 1 and-Vethod(b)
was not feasible because of time and cost constraints. A total
of five how, visit scenarios.viere developed -- one to be scored
at the training conference fOr community interviewers and the
other four to be observed at periodic intervals during the course
of the data collection effort:
The home visit "scenarios" presented a number of problems
for observers. Fisst, the home visit scenario had an element of
unreality since all roles (home visitor, focal parent and focal
child) were role-played by adults. Second, the home visit scen-
ario was considerably different from site to site in terms of
the length of time that was spent on various content areas and
activities. Overall, the total length of the home visit scenarios
-d'1
-41I
was considerably shorter than the avera_s home visit observed in
1To insure that the observed home visit is as natural as possible,observers are,required to have made at least one or two visitsto the family prior to observing a visit. Since orly one personis responsible for summative data collection for a specificfamily, it would not be possible for the second observer to getacquainted with the family prior to the observed hOme visit.
149
:1

ev.ch of the sites. Some of the activites were so short (one
minute) to make it difficult to record.
Although all of the home visit scenarios were analyzed,
this section will report only the results of one randomly
selected home visit (Scenario III).
Total N-me Visit Scenario Time
There was some variation in the total tine reported for the
home visit scenario within sites. 86% of the observers recorded 7
the same amount of time for the scenario (plus or minus one minute);..,
3% varied by 2 minutes; and 11% varied by more than 3 minutes.
The only explanation that can be given is that some of the ob-
servers started to record the first activity sooner than others
or took longer to complete the last activity.
Dominant Home Visit Patterns
On the Home Visit Observation Instrument, observers record
all interaction patterns that occurred during the activity and
the content of the activity. At the conclusion of the activity,
observers indicate the person who was most dominant during the
activity, the most dominant interaction pattern, and the major
focus of the activity. To d,termine inter-judge reliability
with and across projects regarCng dominant interaction patterns,
a model was developed showing what the home visit looked like.
For example, the major interaction patterns were rated. If ob-
servers were in agreement with the model, each observer was
given one point. If the ranking of interaction patterns was re-
versed, observers were accorded one half point. No points were
given if the obsarver showed a totally different ranking of inter-
action patterns. Site points were totalled and divided by the
perfect ranking in order to obtain a percent of site inter-judge
reliability.
150

Table I shows an overall inter-judge reliability of 76%.
The category accounting for the lowest amount of reliability
is the Dominant Interactor. Observers were most reliable on
the Dominant Interaction Pattern (89% agreement). Observers
in Alabama and Ohio showed the lowest percent of agreement
on dominant home visit patterns.
Although the inter-judge reliability on the dominant home
visit patterns is relatively high, it is important to explain
some of the variation in observations since it highlights some
basic problems with the Home Visit Observation InstrUment.
(1) Major Interactor: It is frequently very difficult
to determine the person who did most of the inter-
acting during the course of the home visit. For
example, if the home visitor and focal parent are
both actively doing things with the child, either
the home visitor or focal parent could be shown as
the most dominant interactr. This is the primary
reason for the low inter-judge reliability in this
area. As is shown in the table, the reliability
increases >hen the interaction patterns are com-
binec. (for example, home visitor to focal parent
and focal parent to home visitor), disregarding the
dominant intoractor.
(2) Visit Orientation (Child or Parent): The variation
in how visit orientation is observed and recorded
can bes,% be illustrated by the following example:
- The home visitor -haws the mother how to do anactivity with the child and explains the purposeof the activity. The focal parent then does theactivity with the child. Although it could besaid that the parent was learning throughout theactivity how to educate her child, only the timehome visitor and parent spent discussing theactivity and its purpose should be recorded as aparent activity. The time the parent did theactivity with the child should be recorded aschild activity time. If the content of the activ-ity is not properly noted, a variation in visitorientaticn among observer results.
151

TABLE I: Inter-Judge Reliability -- Dominant Home Vlsit Patterns
ALA% INTER-JUDGE
ARK KAN OHIO TEX W.VA RELIABILITY
TOTAL (1 OF OBSERVERS 3 5 3 2 3 3 19%
FOCAL PARENTDOMINANT INTERACTOR
2 2 2 2 2 1 58%
HV-FP/FP-HVDOMINANT INTERACTION
2 5 3 2 3 2 89%
VISIT ORIENTATION(PARENT/CHILD)
3 4 1 2 1 3 74%
SCHOOL READINESS 2 4 3 1 2 3 79%
PHYS. DEVELOPMENT 2 4 3 1 2 2 74%
INTERPERSONALPROJILEMS
2 5 2 1 3 3 84%
NUTRITION 2 4 2 1 3 3 79%
SITE INTER-JUDGERELIABILITY
71% 80% 76% 71% 76% 76% 76%
153

,
. -r T.c",,t'f#4747-:i
(3) Major Content Area: Many of the activities in a,home-
visit have more than one focus. For example, aline
motor activity of cutting and pasting shapes and then
choosing and idebtifying shapei and coXiort.couid be
classified as both a fine motor (recoded.for inalysis
purposes as physical developmhnt, combining both. fine
and gross motor) and a basic concepts (recOded as school
readiness) activity. It is frequently eitremely dif-.
ficult to decide which of the two content areas is
major. The example used in (2)*Visit Orientation",
accounts for most of the discreioancies in inter-judge
reliability.
A major difficulty with the Rome Visit Observation In-
strument is the definition of what constitutes an act-
ivity. In the scenario presented here, observers fre-
quently recognized a different number of activities
which decreased inter-judge reliability. For example,
if two observers regard the first two minutes of the
visit as one activity and consider the major content
to be Emotional Development, and the third observer
records the first five minutes as one activity, with
Emotional Development and Fine Motor content noted,
the third observer may not have indicated that a sub-
stantial amount of time was spent on Emotional Develop-
ment.
154

-*
Time Spent on Various Home Vlsit Patterns
Table 2 presents a more detailed profile of the visit,
showing that reliability decreases'slightly when inter-judge
reliability is determined on the baiis of the gloUnt of time
that was spent on various content areas and the:interaction
patterns. A mean time for each category was used for comput-
ing the percent of site inter-judge reliability. if an obierVer!
recorded the amount of timeVus or minus 2% of the mean, she..:.
would be given one point. A two-minute range was consideted as
acceptable on categories with a mean of 10 minutes or less.
Sixty-five percent of the observers are,in agreemeilt
regarding the amount of time spent On the dominant interaction. .7:g
patterns and child and parent activities. The lowest agreement
was reached on the amount of time spent on dominant interaction
mode (42%). It is interesting to note that this category was*
most reliable (89%) when looking at whether or not there is
agreement regarding the dominant interaction itself. Kansas
shows the lowest inter-judge reliability in time reported at
all six sites. This is primarily because one observer recorded
the visit as being 40% shorter than the other two observers.
Although inter-judge reliability for the scenario is
acceptable, an analysis was conducted of all Scenario data in
order to determine whether there were patterns of discrepancies
for the various observers. For example, if one observer con-
tinuously showed a heavier emphasis on the child in all of the
scenarios, the Home Visit Observation data could be adjusted
for observer bias. This analysis did not show any consistent
discrepancy patterns, however.
155

;.!,=4;.111WrittiozTABLE 2: Inter-Judge Reliability in the Amount of Time Spent on HomeNisX:
-
ALA ARK KAN OHIO TEXAS W.VA
TOTAL # OF OBSERVERS 3 5 3 2 3 3 19
FP DOMINANT 2 2 1 1 2 2 53%
HV FP/FP HVDOR. I NTERACT I ON
1 2 1 2 1 1 42%
VISIT ORIENTATION 1 5 1 2 3 3 79%
SCHOOL READINESS 3 2 2 2 2 2 68%
PftYS. DEVELOPMENT 3 3 3 2 3 1 79%
INTERPERSONALPROBLEMS 2,.. 5 0 0 3 1 58%
NUTRITION 3 5 1 0 3 2 74%
SITE INTER-JUDGERELIABILITY 71% 69% 43% 64% 81% 57% 65%
157

Home Visit Observation and Record of Home Visit Profile Comparison
The Home Visit Observation data and the Record of Home Visit, .
Activities (completed by home visitors) were compared to determine
whether the two data sources showed major variations in the ei-
phasis of the home, visit. As is shown in Chapter III: The HoMe
Visit, Home Visit Observation data and Record of Home Visit Act-
ivities data show only a minimal difference in the amount of time
spent on the various activity content areas.
Conclusions
The findings reported in Chapter III and the inter-judge
reliability of observers discussed in this section indicate that
the Home Visit Observation data present a relatively accurate
picture of home visit interaction patterns and focus. Inter-
judge reliability is, however, not high enough for the data to
be used in an effort to describe and explain variations in child
and parent outcomes. It should be regarded primarily as des-
criptive data on the home visits.
158

SCENARIO pRgyiur TNTERIggw,
'; 1. WHEN DID YOU START WORKING WITH THIS FAMILY?
2. HOW FREQUENTLY DO YOU VISIT THF FAMILY?
3. HOW LONG IS A USUAL VISIT WITH THIS FAMILY?
4. WHAT ARE YOU GOING TO DO DURING YOUR VISITTODAY?
5. WHY DID YOU CHOOSE THESE ACTIVITIES?
In August last year
Once a week
It usually lasts one hour
We are going to play two gamer.,one identifying different foodnand colors, and the othor oneis a game where Randy canpractice counting and identill41 :
colors.
Randy isn't eating very well,so we will.talk about differentkinds of foods and he reallyneeds to practice on colors andcounting.
6. DID ANYONE HELP YOU PLAN THESE ACTIVITIES? No
7. HAVE YOU BROUGHT ANYTHING WITH YOU TO TAKETO THE HOME? Yes - a picture game, stringine
beads and cards and a puzzle.
159
-:t'

Mome Visitor se Ms. Seal
Focal Parent Mrs. Warner
Focal Child = Randy
-4 , ;# , ; Ne, -,;.; ,..''',-",tie",44t .AV Of..k.:Aoy.
Materials needed: String, beads, .
cards with picturesdenoting amounts of food
Home Visitor: (knocks at front door. Mrs. Warner answers)
Mts. Warner: Hi, Mrs. Seal. How are you?
Home Visitor: Pretty good. How about you? (They walk into living room)
Mts. Wainer: Just fine.
HOMe Visitor: And Randy?
Mrs. Warner: He's been playing with the boy next door, and should be right
back since I told the boys' mother what time you'd be here.
Home Visitor: How's his ear? Last time I was here it was hurting him.
Mrs. Warner: Oh, it's just fine. I wanted to tell you about the recipe you
gave me. Let's go into the kitchen. (They sit at kitchen table).
%Mat a great cake -- and so easy. Randy even ate it - and he
doesn't like to eat much of anything.
Home Visitor: I'm glad you liked it. We're trying to put together a book of
recipes from all the Home Start mothers. Do you have any you'd
like to put in?
Mrs. Warner: Yes - a good one for inexpensive meatloaf. When are you doing
this? (Randy enters) Oh, here's Randy.
Randy: Hi!
Home Visitor: Hi, Randy. How's your friend next door?
Randy: Fine. I wanted to stay playing with him. I like him.
Home Visitor: Well, I'm'glad you came home. I have some special things to
share with you. (To Mrs. warner) -- Hy the way, we'll be trying
to collect recipes from Mothers during the next month. If you
wouldn't mind sharing it I'd love to include your meatloaf recipe
and any others you would like to have in the book.
Mrs. warner: Good. I'll be thinking of some others. Will we he able to get
a copy of the book?
Home Visitor: Sure. we'll talk more about it next week when You've had a
chanac to check over your recipes.
160

Home Visitor(to Handy) How's your new bike?
-Bandy: Gteat. Winne see it? It's in the backyard.
Mae Visitor: Sure - if it's okay with you.
Mrs. Warner: Elne.
(Randy, Home Visitor and Mother go outside)
Randy: Here it is. It's blue.
Hose Visitor: Do you know how many wheels it has, Randy?
Bandy: Four, I mean three. And you know what those things are in
between the wheels?
Mae Visitor: I'm not really sure what they're called. What are they?
Bandy: They're spokes. my Man told me that.
HOW Visitor: Now / remember. Can you show us how you ride?
Bandy: Sure. Watch. (Randy rides up the driveway).
(Pause - watch Randy ride)
Mrs. Warner: (to home visitor) .. Do you know anyone I can talk to about
fixing more foods that Randy will eat. He hardly likes anything
- and I'm afraid he'll get sick. He just refuses vegetables,
and cheese and eggs. He'll eat some kinds of meat - my meatloaf,
for instance, but not many that's for sure. He's sure a good brty
otherwise, though.
Home Visitor: I think the next Home Start meeting is supposed to deal with
meal planning. You know, though, it would be good for you to
talk to a nutritionist. She may be at the meeting, which is
Thursday night at 7:30. I'll check and call you tomorrow.
By the way, / thought we'd play some games with pictures of food
today.
Mrs. Warners
Randy:
Hare Visitor:
Great. It may be good for him to talk about it.
(Randy returns)-
How'd you like my riding?
You're good, especially for a new bike rider.
161

0 .4 : 'a'
Mrs. Warner: He had help from his older sister Anne. Didn't you, Randy.
Randy: Yes, but I learned most by myself.
Home Visitor: (to Randy) I've got a game for you to play. Letts go back inside.
Randy% Okay, bUt later can I come back and ride my bike.
Mrs. Warner: We'll see how late it is.
(all three go back inside to living room)
Home Visitor: Randy, where should we sit.
Randy: Here on the floor. (All 3 sit)
Home Visitor: Randy, here are some pictures and each one has another one that looks
just like it. Can you find two pictures that are the same?
Hmmm. (picks 2 pictures) Yea, here's two pictures of bananas.
I don't like bananas very much.
Randy:
Mrs. Warner: Randy, yoU like them sometimes, don't you?
Randy: Well, I guesa - sometimes.
Home Visitor: That was a good retch. Can you find two more pictures that match?
Randy:. Hey, here's 2 that are the same. Hamburgers (points to 2 pictures)
Home Visitor: Good.
Randy: And two glasses of (pause) - yuk - milk.
Home Visitor: Don't you like milk?
Randy: No!
Mrs. Warner: He sure doesn't. Not even with peanut butter sandwiches.
Home Visitor: Oh, I like it. It's pretty good.
Randy: Well, then you keep it. Here's one - no - two breade. And two
oranges. That was a good game. Any more?
Home Visitor: Well, I thought maybe yoU could tell me about the colors of all the
pictures. How about this one? (points to cicanges)
Randy: Easy. They're orange.
Home Visitor; Right: How about the hamburgers? (points to hamburgers)
162
0.;

7.,./etto
3,42antly I
kAt
Sorts brown. And bananas red - (He points to bananas) no -
green, I know my colors.
.;:itome Visitor: Are you sure the bananas are green? (Home visitor points to
bananas)
'Randy:
.Mrs. Warner:
Randy:
Mrs. Warner:
Randy:
AGMS Visitor:
Randy:
Nome Visitor:
Randy:
Home Visitor:
Mrs. Warner:
Home Visitor:
Randy:
Yes..
Randy, what's the color of your shirt (points to Randy's yellow
shirt)
My own special yellow shirt.
Aren't the bananas the same color-
Yes. I guess. Yellow for bananas.
Good. How about milk. What color is that?
White.
Randy, I brought another game. Look (shows Randy & Mother the game).
Its stringing beads. Have you ever done that?
No. We don't have beads here.
(to Mrs. Warner) - Mrs. Warner, have you ever worked with beads?
No, I don't think so. How does this gave go?
(to Mrs. Warner) - Okay. Here are small cards of foods of different
colors and amounts, some string, and a box of beads. Have Randy
put on the string a picture and follow with the number of beads
represented by the number of pictures and the same color. ?or
example, here, lets string a picture of 3 bananas. Randy, what
color is this (points to banana)
I know that. It's the same color as my favorite shirt. Yellow.
Home Visitor: Good! Yellow. And its 3 bananas. (To Mother) So Randy strings
behind the picture the yellow bananas 3 yellow beads. Want to
try, Mrs. Warner? (Home visitor removes picture from string).
Mxs. Warner: Sure. .col Randy) Randy. Here's some beads of a lot of different
colors; and here's a picture of some bananas. String the banana
picture (waits for Randy to do it)
163
x.,,t1/4
4
1
s4.-
'1'44

Randy: (Randy strings picture and shows it to his Mother) Is that okay?
Mrs. Warner: Fine. Now count the bananas.
Randy: Three
Mrs. Warner: What color are they.
Randy: Yellow.
Mrs. Warner: Okay. Find the yellow beads and string 3 of them behind the picture
of the 3 bananas.
Randy: (Randy begins counting out yellow beads) one, two, three. (He
strings )eads) How's this?
grs. Warner: Good. Okay, pick another card (RaL3y cLooses another)
Randy: It's apples. Red apples
Mrs. Warner: How many?
Randy: (counts roftly to self) Six I think.
Mrs. Warner: Good. What are you going to do?
Randy: String it cald find red beads.
Home Visitor: That's good Randy.
Mrs. Warner: Here are some more cards. I want to talk to Mrs. Seal now so we'll
be back in a minute. Is that all right with you?
Randy: I want to ride my bike now.
Mrs. Warner: First, string 2 more cards and the beads that go with them, /-hen you
can bike.
Randy: C'ay.
Mrs. Warner: (to home visitor) Let's get a CUP of ccffee in the kitchen.
Home Visitor: "ine. (both home visitorand mrs. Warner go into kitchen)
Mrs. Warner: to stove, turns on stove) I just remembered that i'd been
Ang all week to ask you about this. (gets out 2 cups, some
instant coffee and spoons). You take yours black, don't you.
(Puts coffee in cup)
Home Visitor: How Wd you remember?
Mrs. Warner: I don't know, but somehow : just did. Anyway, I almost forgot to
164

tell you dbout Brad, you know, my husband. He's staying out.late
at night with the guys and when I ask him where hes been, he
just snaps at me. I know he doesn't like his job anymore, but we
need the money so bad. If he didn't have that job, we'd starve.
He just won't ta-k to me anymore, not just about his job problems,
or being out late, but anything. Just a bit ago we were talking
about everything together - we've only been married 4 years.
Then I try to get him to help me with Randy's eating problem and he
says that's my problem - and that's not true. And Randy doesn't
help 'cause he doesn't get along well with his Father. I just
don't know what to do. /'m really at a loss. Oh, the wateros
ready (pours it into cups). Any sugar?
Home Visitor: No, while I was listening to you talk about your husband, I was
thinking about a friend of mine who had a problem that was almost
the same. 'he talked to some people at the Family Counseling
Service. They asked her if both she and her husband could come
in together. She at first had trodble talking her hugband into
it, but finally convinced him and they talked to a fellow, I
can't think of his name right off the top of my head. Things
seem much better now. The place doesn't promise miracles, but
just having a third party to talk to may be a big help. Hmmm -
good coffee (drinking coffee)
Mrs. Warner: Soundalike a good place, but I'd be pretty surprised if Brad agreed
to go. He's awfully stubt-lrn.
Home Visiter: You can talk to him and see how he feels about it. It may take
a bit of time to talk him into it. Having the clinic so close is
a help. At best he can't say it's too far to go. Let me talk to
my friend and see if she can remember the man's name she talked
b), or if she knows anyone else there who is especially helpful.
Let me make a note of that (she pulls a pad of paper out of her
purse, and a pen, and writes a note to herself). I'll call you,
let me see, on Saturday, if I find out his 'lam by then. That
way, when you talk to Brad, you'll have a name to give him.
165

Mrs. Warner: Okay, I'll give it a try. I don't think he'll agree. He'll
probably say there's no problem and that I'm making up stories
in my head. But I have to do something about this, so I'll ask.
(Randy runs in carrying string of beads)
Randy: (to mother and home visitor) - Look I strung a picture of bananas,
apples, cars, houses and cats - and / strung the beads too. /t was
fun. Did I do it right?
Mrs. Warner: Let's see (checks over string). Sure looks good to me. Mrs. Seai?
(hands them to home visito".)
Home Visitor: (Looking over them) Very good, Randy. No mistakes!
Randy: Thanks. (Looks at Mother) Can I bike now?
J.Irs. Warner: Sure.
Home Visitor: Oh, Randy, I almost forgot. I brought you a puzzle that you can
use during the week. Here it is (She pulls it out of her bag and
hands it to Randy).
Randy: Oh Boyl A puzzles Can I really use it?
Home Visitor: Sure. Till next time I come. Just take care of it.
Randy: Okay.
Home Visitor: I'll walk outsidn with you, Randy. I should go to visit another
family now.
Mrs. Walker: I'll walk outside too. It's so nice I can't stand to stay inside.
Home Visitor: That's for sure. (All 3 walk to door and go outside.)
Home Visitor: Bye, see you Thursday. Hopefully talk to you on Saturday.
Randy: Bye.
Mrs. Warner: Yes, talk to 1,..ns on.Saturday.
166


![DOCUMENT RESUhE AUTHOR TITLE ERE Duni kiting]. SffV …theory. The paper also describes a set of experiments conducted by Marshall Scott Poole that demonstrated the complex and perhaps](https://img.dokumen.tips/doc/110x75/5e9e8e5b9e9bb87f3d1488f4/document-resuhe-author-title-ere-duni-kiting-sffv-theory-the-paper-also-describes.jpg)