Embed Size (px)
Citation preview

PUBLIC
iQ-X USER MANUAL
Version 2.2.0 PUB INT EN – 006R
Copyright ® 2003-2013 IMAGE Information Systems Ltd. Release date: 2013-10-09
iQ-X 2 2 0 User Manual PUB INT EN – 006R 2
TABLE OF CONTENTS
0 CE CONFORMANCE STATEMENT ............................................................................................................................... 4
1 INTRODUCTION ........................................................................................................................................................... 5 1.1 System requirements .................................................................................................................................................. 6
1.1.1 Minimum system requirements ......................................................................................................................... 6 1.1.2 Recommended system requirements ............................................................................................................. 7 1.1.3 Specific system requirements for Unicode languages ................................................................................ 7
2 INSTALLATION AND LICENSING ................................................................................................................................. 9
3 CONFIGURATION ...................................................................................................................................................... 10
4 USE OF THE SOFTWARE APPLICATION ...................................................................................................................... 11 4.1 Access to the user manual ..................................................................................................................................... 11 4.2 Loading studies into the viewer ............................................................................................................................. 11 4.3 Closing the viewer .................................................................................................................................................... 12 4.4 Viewer ........................................................................................................................................................................ 13
4.4.1 The upper toolbar ............................................................................................................................................. 13 4.4.1.1 The study/series selection ......................................................................................................................... 13 4.4.1.2 Fast selection of next series ...................................................................................................................... 14 4.4.1.3 Downloading compressed images ........................................................................................................ 14 4.4.1.4 Refresh and download uncompressed images ................................................................................... 14 4.4.1.5 Using compare and tile mode ................................................................................................................ 15 4.4.1.6 Status indicator and progress bar .......................................................................................................... 15
4.4.2 The series preview bar ...................................................................................................................................... 16 4.4.2.1 Information in the series preview bar ..................................................................................................... 16 4.4.2.2 Function of the series preview bar .......................................................................................................... 16
4.4.3 The study tabs .................................................................................................................................................... 17 4.4.4 The image processing area ............................................................................................................................ 17
4.4.4.1 Ruler and orientation indicators .............................................................................................................. 17 4.4.4.2 Screen tiling options .................................................................................................................................. 18
4.4.5 The bottom toolbar .......................................................................................................................................... 19 4.4.6 Treatment of single-frame and multi-frame images................................................................................... 19 4.4.7 Synchronization of series .................................................................................................................................. 19 4.4.8 Orientation tools – the “scoutlines” mode ................................................................................................... 20 4.4.9 Presentation states in iQ-X ............................................................................................................................... 21 4.4.10 Overlays and look-up tables........................................................................................................................... 22
4.4.10.1 Text overlay ................................................................................................................................................. 22 4.4.10.2 Display of lossy image compression ....................................................................................................... 22 4.4.10.3 Bitmap overlay ........................................................................................................................................... 23 4.4.10.4 Look-up tables ............................................................................................................................................ 23 4.4.10.5 DICOM-embedded shutters .................................................................................................................... 23
4.4.11 Cine and stack mode ...................................................................................................................................... 23 4.4.11.1 Stack mode ................................................................................................................................................ 23 4.4.11.2 Cine mode .................................................................................................................................................. 24
4.4.12 Windowing tools ................................................................................................................................................ 24

iQ-X 2 2 0 User Manual PUB INT EN – 006R 3
4.4.12.1 Static windowing ....................................................................................................................................... 25 4.4.12.2 Using window presets ................................................................................................................................ 25
4.4.13 Color remapping .............................................................................................................................................. 26 4.4.14 Measurement and annotation tools ............................................................................................................. 26
4.4.14.1 Distance measurements ........................................................................................................................... 27 4.4.14.2 Angle measurements ................................................................................................................................ 27 4.4.14.3 Square ROI measurements ...................................................................................................................... 27 4.4.14.4 Circular ROI measurements ..................................................................................................................... 27 4.4.14.5 Shutters ........................................................................................................................................................ 27 4.4.14.6 Annotations................................................................................................................................................. 28 4.4.14.7 Overlapping of measurement values .................................................................................................... 29 4.4.14.8 Calibration of measurements (scaling oversize) .................................................................................. 29 4.4.14.9 Erasing measurements and annotations ............................................................................................... 30 4.4.14.10 Modifying measurements and annotations ......................................................................................... 30
4.4.15 Magnifying tools ................................................................................................................................................ 31 4.4.16 Zooming and panning tools ........................................................................................................................... 31
4.4.16.1 Zoom/pan handling with presentation states ...................................................................................... 31 4.4.16.2 The zoom/pan function ............................................................................................................................ 31
4.4.17 Flipping and rotation tools .............................................................................................................................. 32 4.4.18 Resetting changes in images ......................................................................................................................... 33 4.4.19 Reporting tools .................................................................................................................................................. 33
4.4.19.1 Structured reporting .................................................................................................................................. 33 4.4.19.1.1 The structured reporting window ...................................................................................................... 34 4.4.19.1.2 Function buttons .................................................................................................................................. 36 4.4.19.1.3 Manually creating a structured report ............................................................................................. 37 4.4.19.1.4 Managing and using templates........................................................................................................ 38 4.4.19.1.5 Storing reports ....................................................................................................................................... 39
4.4.19.2 Using “NCH Express Dictate” for dictation ............................................................................................ 40 4.4.20 Configuration options ...................................................................................................................................... 41
5 LIST OF ABBREVIATIONS ........................................................................................................................................... 42
6 LIST OF SHORTCUTS ................................................................................................................................................... 43
7 INDEX ........................................................................................................................................................................ 44

iQ-X 2 2 0 User Manual PUB INT EN – 006R 4
0 CE CONFORMANCE STATEMENT IMAGE Information Systems Ltd. does not accept liability for the illegal or improper use of the described software (see the End User License Agreement). iQ-X is an optional add-on component for iQ-WEB, the PACS server software manufactured by IMAGE Information Systems Ltd. It cannot work as a stand-alone but can only be used in combination with iQ-WEB. The iQ-X viewer is certified as a medical device for image processing and diagnosis according to Council Directive 93/42/EEC concerning medical devices and according to FDA 510(k). Nevertheless, diagnosis can only be made using special high-resolution displays.
Copyright © 2003-2013 IMAGE Information Systems Ltd. All rights reserved.
All patient names used in this manual are completely fictitious. The contents of this manual are the property of IMAGE Information Systems Ltd. and may not be reproduced by any method, electronic or photographic, without the express written permission of the copyright holder. Throughout this manual trademark names are used. Rather than put in a trademark symbol at every occurrence of the trademark name, we state that we are using the names only in an editorial fashion and to the benefit of the trademark owner with no intention of infringing upon the trademark. We assume no responsibility for inaccurate information or descriptions of third-party products. We are dedicated to improving and enhancing the software of our medical imaging and communication system. Consequently, the information in this manual is subject to change without notice. Current information about product improvements can be found on the iQ-WEBX homepage: http://www.image-systems.biz/en/products/iq-system-pacs/server-software/iq-webx.html or IMAGE Information Systems Home Page www.image-systems.biz. Further inquiries can be addressed to: [email protected]. Andreas Knopke, MD Arpad Bischof, MD Mike Thomas Jensen, MA October 2013

iQ-X 2 2 0 User Manual PUB INT EN – 006R 5
1 INTRODUCTION As an optional add-on component for iQ-WEB, the iQ-X 2.2.0 DICOM viewer module can only be used in combination with the following iQ-WEB software versions: iQ-WEB 6.2.3f iQ-WEB 6.3.x Developed as ActiveX control iQ-X is used to provide DICOM image viewing and processing capabilities in a web-based user interface. The add-on provides a number of image processing tools known to the user from regular diagnostic workstations, but does not intent to provide all features. It is meant as a lightweight version of the more complex diagnostic workstation iQ-VIEW, also offered by IMAGE Information Systems Ltd. The iQ-X add-on is provided in a basic and an extended version. The extended version includes all features of the basic version and, additionally, allows the creation and storage of basic DICOM Structured Reports. The following list shortly summarizes the major product features of iQ-X: DICOM image viewer with diagnostic quality (when adhering to legal requirements and using appropriate
DICOM data) for all common modalities, including multi-frame DICOM objects, JPEG and JPEG 2000 compressed images and structured reports (SR)
Image processing functions, including: - Stack mode and cine mode - Comparison mode for comparing different series/studies - Support of different tilings - Windowing and window presets - Zoom and pan - Flipping and rotation - Measurements (e.g. distance, angle, ROI density)
Overlay text support and options for overlay configuration Display of scoutlines (reference lines) for easier orientation within multi-slice studies (e.g. CT, MR) Synchronized browsing through series Background preloading of images/series/studies Integrated interface to NCH Express Dictate dictation software Structured reporting dialog for the creation of structured reports (extended version only)
WARNING 1: When receiving medical image data, it is important to know whether compression has been used. If images
were lossy compressed an appropriate information will be shown in the text overlay of the image when displayed in the viewer. The DICOM header data also indicates the form and rate of compression. Such lossy
compressed images may no longer have diagnostic quality!
WARNING 2: Please note that iQ-X is a 32 bit application and can only be run in the 32 bit version of the Internet Explorer. It
can therefore not allocate more than 2 GB RAM to process DICOM images. This may lead to limitations in processing huge multi-frame objects. The following effects are possible:
– It might become impossible to correctly decompress images that are transferred in compressed form from iQ-WEB to the iQ-X viewer. This will result in failures to view these images in the viewer.
iQ-X 2 2 0 User Manual PUB INT EN – 006R 6
– Uncompressed objects transferred to iQ-X might still be too big for the viewer to handle this data successfully. This will result in a corrupted image display and issues while trying to process this data (e.g. browsing through
the series, zooming, windowing, etc.).
To keep the effects on iQ-X and on the opportunity to read these objects as low as possible, we recommend the following actions:
– If it is possible that you need to transfer such huge multi-frame data volumes, please use a 64 bit Windows 7 operating system and more than 4 GB RAM.
– Be sure to limit the number of other processes and applications running at the same time as iQ-X, so that the full 2 GB RAM can really be allocated to the processing of these objects.
– If a study contains several such huge multi-frame objects in different series, you may load them individually (one after the other) into the viewer. This will keep the required RAM at a limit.
iQ-X is only permitted for diagnostic use if all applicable legal requirements in your country are met. Please consult your authorized local distributor before using the application for diagnostic purposes.
1.1 SYSTEM REQUIREMENTS iQ-X is an ActiveX control which requires a Windows-based operating system and the Microsoft Internet Explorer. 1.1.1 MINIMUM SYSTEM REQUIREMENTS For the iQ-WEBX server-side minimum system requirements refer to the system requirements of the main application iQ-WEB. For further details regarding the specifications, please refer to the iQ-WEB user documentation of the respective software version. For the iQ-X client minimal system requirements are: CPU Intel® Dual Core 2 GB main memory 80 GB HDD (with sufficient free disk space for storing the iQ-X installation files and for temporary
storing all downloaded image files) Network connection of at least 128 Kbit/s for clinical reference and of at least 1 Mbit/s for diagnostic
purposes Graphics card, resolution of ≥ 1024x768, True Color mode (24 bit) or at least 8 bit gray output, any nVidia or
ATI graphics card with ≥ 256 MB RAM Analog color or grayscale monitor, ≥ 17” for demonstration, high-resolution displays for diagnostic purposes One of the following operating systems:
- Windows XP Professional, SP3, 32 bit
- Windows 7 Professional (or higher edition), SP1, 32 or 64 bit
- Windows 8 Professional (or higher edition), 32 or 64 bit

iQ-X 2 2 0 User Manual PUB INT EN – 006R 7
Internet Explorer ≥ version 8, 32 bit only (Internet Explorer 10 or 11 in the “Windows 8 Modern UI”, formerly called “Metro” design, is NOT supported)
Adobe Acrobat Reader, min. version 9.2.0 with updates (for opening the user documentation)
NOTE: The use of low bandwidth and/or instable network or internet connections will lead to longer waiting times when loading DICOM images into the iQ-X viewer. It is recommended to use image compression to help
increase the transfer speed of the images from the iQ-WEBX server to the iQ-X client. Also refer to the manufacturer’s Data Compression Guide for details on compression methods and ratios.
1.1.2 RECOMMENDED SYSTEM REQUIREMENTS For the iQ-WEBX server-side recommended system requirements refer to the system requirements of the main application iQ-WEB. For further details regarding the specifications, please refer to the iQ-WEB user documentation of the respective software version. For the iQ-X client recommended system requirements are: CPU Intel® Core™ i5 4 GB main memory 250 GB HDD (with sufficient free disk space for storing the iQ-X installation files and for temporary
storing all downloaded image files) Network connection of at least 100 Mbit/s Graphics card, resolution of 1280x1024 or more, True Color mode (24 bit) or at least 8 bit gray output, any
nVidia or ATI graphics card with ≥ 1 GB RAM (e.g. iQ-GRAFIX) Digital color or grayscale display, ≥ 19” for demonstration, high-resolution displays for diagnostic purposes Scroll mouse Windows 7 Professional, SP1, 64 bit Internet Explorer, version 9, 32 bit only Adobe Acrobat Reader, latest version (for opening the user documentation) 1.1.3 SPECIFIC SYSTEM REQUIREMENTS FOR UNICODE LANGUAGES Specific system requirements for use with Unicode languages (Japanese, Russian, etc.) are: Min. Windows® 7 Professional operating system, 32 bit, in native language Internet Explorer in native language For a correct display of patient and study information (information on DICOM level) in the text overlay, the
original DICOM data has to be correctly encoded with the appropriate DICOM character set (e.g. for Japanese DICOM sets encoding in the DICOM character sets ISO 2022 IR 13, ISO 2022 IR 87 and/or ISO 2022 IR 159).
NOTE: iQ-X does not yet fully support specific character sets. Therefore, patient and study data might not be
displayed correctly in all parts of the application. The creation of structured reports in the extended version of iQ-X is only possible as ISO_IR 100 (i.e. Latin-1 characters).

iQ-X 2 2 0 User Manual PUB INT EN – 006R 8
If using third-party applications, higher system requirements may apply. We recommend consulting the system requirement documents of all modules and select the highest level. It is also possible that certain third-party applications do not support specific operating systems. In such a case, please use an operating system that is referenced for all applications you wish to install. Furthermore, we recommend the use of up-to-date anti-virus software on the client computer on which iQ-X is run. The virus definitions must be updated regularly (they should not be older than 2 weeks).
NOTE: Due to known issues / incompatibilities (e.g. regarding the blocking of system files and ports), we do not
recommend using the software AntiVir as an anti-virus software.
To keep constant power supply voltage we strongly recommend the use of an uninterruptible power supply (UPS) on the iQ-WEBX server. The interposition of such a device prevents data losses and data inconsistencies that can be produced at the occurrence of fluctuations in the power supply voltage.

iQ-X 2 2 0 User Manual PUB INT EN – 006R 9
2 INSTALLATION AND LICENSING For detailed information regarding the installation, licensing and activation of the software please refer to the iQ-X Administration Guide. The guide can be accessed by: Opening Windows Explorer, navigating the iQ-WEBX installation directory to the subfolder
“…\[InstallDir]\PACS\doc” and opening the iQ-X Administration Guide with a PDF reader Downloading the document from the manufacturer’s website at http://www.image-
systems.biz/en/service-support/download-center.html Please note that Adobe Acrobat Reader or another PDF reader must be installed on the system.
WARNING: No special training is necessary to be able to install iQ-X, although general computer literacy is required. The
configuration settings of the Internet Explorer and iQ-X itself, however, should be made by a system administrator with technical know-how and experience concerning in-house procedures and processes for
the organization.

iQ-X 2 2 0 User Manual PUB INT EN – 006R 10
3 CONFIGURATION For instructions concerning the configuration and set-up of the application as well as hints regarding trouble-shooting problems, please refer to the iQ-X Administration Guide. The guide can be accessed by: Opening Windows Explorer, navigating the iQ-WEBX installation directory to the subfolder
“…\[InstallDir]\PACS\doc” and opening the iQ-X Administration Guide with a PDF reader Downloading the document from the manufacturer’s website at http://www.image-
systems.biz/en/service-support/download-center.html Please note that Adobe Acrobat Reader or another PDF reader must be installed on the system. The Administration Guide covers the following topics, among others: Initial configuration (Opening the viewer in a new browser window) Providing and using compressed image data for iQ-X Loading of compressed and uncompressed image data into iQ-X Configuration of local iQ-X viewer settings Changing and amending overlay information of images Availability and retrieval of log information

iQ-X 2 2 0 User Manual PUB INT EN – 006R 11
4 USE OF THE SOFTWARE APPLICATION 4.1 ACCESS TO THE USER MANUAL The iQ-X user manual can be accessed from every client computer directly from the iQ-WEBX menu bar. To access the user manual, open the iQ-X viewer and click the appropriate help/user manual link in the menu bar. Please note that Adobe Acrobat Reader or another PDF reader must be installed on the system.
NOTE: The link to the user manual may look different depending on the iQ-WEB software version you have installed. It might also be possible to access the iQ-X Administration Guide from the menu bar. Otherwise you can find it
on the server or can download the document on the manufacturer’s website at http://www.image-systems.biz/en/service-support/download-center.html
4.2 LOADING STUDIES INTO THE VIEWER The steps below describe how to load DICOM images into the iQ-X viewer: First, open the Internet Explorer. Enter the IP address or hostname of iQ-WEBX as internet address. Log into iQ-WEBX with your user login data and navigate to the “EasyWEB” page. Select an individual study by clicking the icon. Alternatively, select the checkbox in front of the study
and then click the button at the top of the page. Multiple studies can be selected by marking the checkbox in front of each study. Afterwards click the
button at the top of the page. The iQ-X viewer opens and downloads the requested images. They will be displayed in the viewer as they
become available. You can open DICOM images in iQ-X also from all other iQ-WEB pages presenting patient, study, series or
image data. In all cases, simply mark the checkbox(es) and then hit the button at the top (and sometimes also bottom) of the page.
NOTE: The icon and button will only be available when the Internet Explorer is used and when a valid iQ-
X license is running. Other web browsers, such as Mozilla Firefox, Google Chrome, Safari, etc., are not supported.

iQ-X 2 2 0 User Manual PUB INT EN – 006R 12
Using the icon to load one study into iQ-X
Using the button to load multiple studies into iQ-X
4.3 CLOSING THE VIEWER The iQ-X viewer is closed by returning to one of the other pages of the iQ-WEB web interface, e.g. the “EasyWEB” page. By returning to the patient, study, series and/or image lists you can select new data to be opened in iQ-X.

iQ-X 2 2 0 User Manual PUB INT EN – 006R 13
4.4 VIEWER The iQ-X viewer is embedded into the web interface of iQ-WEB, so you will still be able to see the menu bar of iQ-WEB and can navigate all available pages.
iQ-X viewer window
4.4.1 THE UPPER TOOLBAR
4.4.1.1 THE STUDY/SERIES SELECTION In the iQ-X viewer you may select individual studies or series via dropdown boxes in the study/series selection bar. If more than one study was previously selected (in iQ-WEBX), you can switch between studies by changing the study selection drop-down box, located on the left side of the upper toolbar. The drop-down box to the right can be used for series selection. It shows all series belonging to the active study. The items of these boxes will contain the study or series descriptions. If no description is available, items will be called “study[Number]” or “series[Number]” respectively.
iQ-X 2 2 0 User Manual PUB INT EN – 006R 14
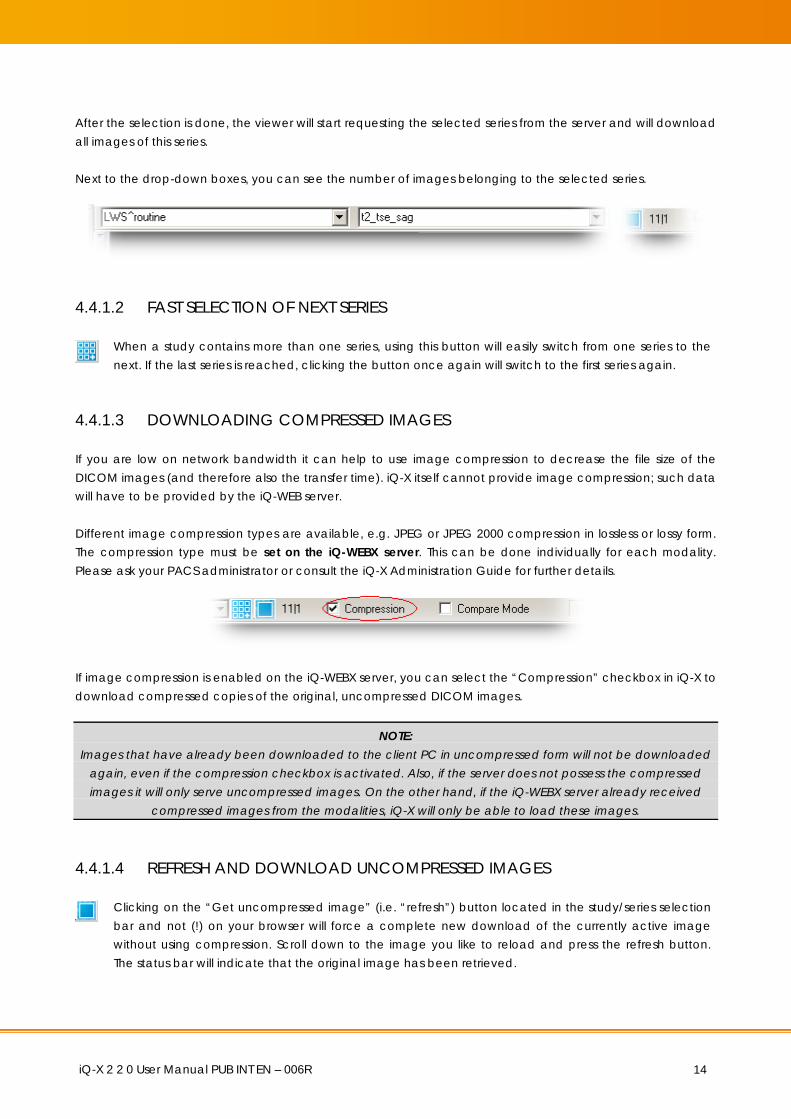
After the selection is done, the viewer will start requesting the selected series from the server and will download all images of this series. Next to the drop-down boxes, you can see the number of images belonging to the selected series.
4.4.1.2 FAST SELECTION OF NEXT SERIES
When a study contains more than one series, using this button will easily switch from one series to the next. If the last series is reached, clicking the button once again will switch to the first series again.
4.4.1.3 DOWNLOADING COMPRESSED IMAGES If you are low on network bandwidth it can help to use image compression to decrease the file size of the DICOM images (and therefore also the transfer time). iQ-X itself cannot provide image compression; such data will have to be provided by the iQ-WEB server. Different image compression types are available, e.g. JPEG or JPEG 2000 compression in lossless or lossy form. The compression type must be set on the iQ-WEBX server. This can be done individually for each modality. Please ask your PACS administrator or consult the iQ-X Administration Guide for further details.
If image compression is enabled on the iQ-WEBX server, you can select the “Compression” checkbox in iQ-X to download compressed copies of the original, uncompressed DICOM images.
NOTE: Images that have already been downloaded to the client PC in uncompressed form will not be downloaded
again, even if the compression checkbox is activated. Also, if the server does not possess the compressed images it will only serve uncompressed images. On the other hand, if the iQ-WEBX server already received
compressed images from the modalities, iQ-X will only be able to load these images.
4.4.1.4 REFRESH AND DOWNLOAD UNCOMPRESSED IMAGES
Clicking on the “Get uncompressed image” (i.e. “refresh”) button located in the study/series selection bar and not (!) on your browser will force a complete new download of the currently active image without using compression. Scroll down to the image you like to reload and press the refresh button. The status bar will indicate that the original image has been retrieved.

iQ-X 2 2 0 User Manual PUB INT EN – 006R 15
To reload the entire study or all studies currently loaded into the iQ-X viewer to see the original (uncompressed) images instead, deactivate the “Compression” checkbox and, if necessary, clear the viewer cache (“Settings” button in bottom toolbar “Clear Cache” “Now”). This will then load the original images of the requested study/studies. The loading times can increase when doing so. 4.4.1.5 USING COMPARE AND TILE MODE In iQ-X it is possible to switch between the default tile mode, where the images of the currently active series are displayed in the image processing area, and the compare mode, where it is possible to compare series of the same or different studies in an appropriate tiling.
Compare mode: As an example, to compare two studies in a 2x1 mode, first mark the “Compare Mode” checkbox to change from default tile mode to the compare mode. Then click the “Tiling” button in the bottom toolbar and select the option 2x1. The left view will display the first study, the right view will, at first, show nothing. To add the second study to the right view, select that view by clicking into it and select the appropriate study and series in the study and/or series drop-down box of the upper toolbar. The images will be loaded into the selected view. Tile mode: To leave the compare mode and display the images again in the default tile mode, simply unmark the “Compare Mode” checkbox. This will automatically fill all visible views. Now, if you scroll down, all views will be updated accordingly with the images of the selected series. Also see section 4.4.4.2. 4.4.1.6 STATUS INDICATOR AND PROGRESS BAR Status indicator: Several messages shown in the status indicator provide an overview about active tasks: “Status: idle” – The system is idle; the download of the active series is finished. If “preloading on idle” is
activated, this state will change to “Status: processing tasks” after a few seconds. “Status: requesting…” – The system requests a new series download. “Status: downloading…” – This status indicates an image download of the active series. It will change to
“Status: idle” once all images have finished downloading. “Status: jobs waiting…” – This status indicates that preloading of images is activated and will be processed
once the active series has finished downloading. “Status: preloading series [completed series]/[max series]” – “Preloading on idle” is activated. The system
will download series in the background, depending on your settings. “Status: all jobs processed” – This status indicates that all series have finished downloading, depending on
your settings. “Status: retrieving original image” – This information appears after clicking the refresh button, indicating
parallel download of an uncompressed image (only active image). “Status: SESSION TIMED OUT” – This status indicates that the iQ-WEBX session timed out for this user due to
inactivity. This is a security feature. You need to log in again to restart working with the viewer. To do this, just click on the back button of the Internet Explorer.

iQ-X 2 2 0 User Manual PUB INT EN – 006R 16
NOTE: Time-outs can be configured or deactivated. Please consult the iQ-WEB user documentation of your
respective software version for further instructions.
“Status: Connection lost” – If the client loses connection to the server, this message will be shown in red. Progress bars: The progress of the image download is indicated by two progress bars on the right side. The upper bar shows image download progress while the lower bar indicates the series download progress.
4.4.2 THE SERIES PREVIEW BAR The series preview bar can be used to get an overview over the studies loaded into the viewer. It gives information about the series of the loaded studies and allows the navigation between studies.
=
You can easily hide or show the series preview bar by using the switch on the left side of the series preview bar. Hiding the series preview bar will increase the size of the image processing area.
4.4.2.1 INFORMATION IN THE SERIES PREVIEW BAR The viewer will display a series preview bar. If several studies are loaded into the viewer, the series preview bar will open with the series information of the first study, the information of the other studies remains unseen.
In the series preview bar, all available series of a study are displayed with one thumbnail representing each series. The series currently active in the image processing area will be shown with a yellow frame in the series preview bar for easier orientation.
Each series thumbnail displays a number that corresponds with the number of images included in the series. In case of multi-frame images, the number of available frames will be displayed. 4.4.2.2 FUNCTION OF THE SERIES PREVIEW BAR The series thumbnails in the preview bar can be used to populate the views in the image processing area by: Dragging a series from the preview bar to an available view of your choice Double-clicking a series thumbnail to load it into the currently active view (blue frame); this can only be
done if the “Compare Mode” checkbox is active.

iQ-X 2 2 0 User Manual PUB INT EN – 006R 17
4.4.3 THE STUDY TABS Between the series preview bar and the image processing area a tab bar is displayed that contains a study tab for each study currently loaded into the viewer.
Each tab states the study description to easily identify a study. The tab of the currently active study in the image processing area is on top. Clicking another study tab will load the study into the image processing area. If all study tabs do not fit on the screen, use the arrow buttons on the right-hand side to navigate ( ). 4.4.4 THE IMAGE PROCESSING AREA The image processing area is the main work area of the viewer window in which the loaded images are displayed and processed. Changes (e.g. windowing, zooming/panning, flipping/rotating, etc.) and additions (e.g. measurements and annotations) to images are made in the image processing area. 4.4.4.1 RULER AND ORIENTATION INDICATORS
The ruler on the right side of each view indicates the size of the displayed image. The measurement is given in centimeters (cm), each segment comprising 1 cm; the total length being 4 cm. The ruler is not shown if the “Pixel Spacing” attribute or Ultrasound region calibration information is missing in the DICOM header of the image.
Image with orientation indicators

iQ-X 2 2 0 User Manual PUB INT EN – 006R 18
The yellow markers in the images are orientation indicators. These indicators help to determine the orientation of an image, e.g. right or left, top or bottom. The indicators will remain in the correct position even if an image is flipped or rotated. Indicators will be denoted as follows: R = right L = left H = head F = foot A = anterior P = posterior Combinations of these indicators are also possible. 4.4.4.2 SCREEN TILING OPTIONS When a series contains more than one image, it can be helpful to divide the image processing areas into several views. Therefore, it is possible to see several series at once or to compare series with each other. A blue frame is displayed around the currently active view.
Screen tiling with images of one series
iQ-X will display the images in the default tile mode as long as the “Compare Mode” checkbox is deactivated. When loading a study into the viewer, iQ-X will automatically select an appropriate tiling and fill all visible views with the images of the first series. Dragging another series into the image processing area will display the images of that series in the views. In “Compare Mode”, the screen tiling can be used to load series of the same or different studies for comparison. See also section 4.4.1.5. The available screen tiling options are accessible by using the screen tiling button in the bottom toolbar.
The screen-tiling function allows splitting the image processing area. On the series level, the image processing area will be divided into the selected number of views. On the image level, the active view itself will be divided into segments.

iQ-X 2 2 0 User Manual PUB INT EN – 006R 19
The following tiling options are available: 1x1 2x1 3x1
1x2 2x2 3x2
1x3 2x3 3x3
4.4.5 THE BOTTOM TOOLBAR The bottom toolbar offers the opportunity to easily access the most important image processing functions with just one click.
iQ-X bottom toolbar
Moving the mouse to the bottom of the screen will display the bottom toolbar. The individual functions of the buttons are described in the respective sections of this user manual. Some buttons have settings that are accessible by right-clicking the button. When a tool is selected a yellow frame appears around the button to show that it is currently active. In some cases the yellow frame can also indicate that an image was modified using a particular function: A yellow frame around “Color scheme” means that color scheme changes were made to an image (e.g.
inverted). A yellow frame around “Flip/Rotate” indicates that an image has been rotated or flipped. Additional
indicators will be added to the text overlay of the affected image(s) denoting the modification. A yellow frame around “Text overlay” is visible when the text overlay is active. This setting is on by default
when a study is loaded into the viewer. 4.4.6 TREATMENT OF SINGLE-FRAME AND MULTI-FRAME IMAGES Multi-frame and single-frame DICOM images are treated equally. The stack and cine mode functions work for both; series of both can be shown in a sequence. Thus, it is also possible to display the individual frames of a multi-frame image (sequence) in different views. 4.4.7 SYNCHRONIZATION OF SERIES To be able to synchronize different views to compare the series placed within, the “Compare Mode” must be activated at first. See section 4.4.1.5 for details.
Secondly, you must ensure that the synchronization option is enabled. This function can be activated and deactivated by clicking the “Settings” button in the bottom toolbar and marking or unmarking the “Synchronize Views” menu entry.

iQ-X 2 2 0 User Manual PUB INT EN – 006R 20
This will start the synchronization of series either in automatic or in manual mode, depending on the option you set in the menu item “Synchronize Mode”. If possible all active series will be synchronized. You can exclude single series by clicking on the icon. A yellow chain stands for an incompletely downloaded series. It will turn blue if the download is finished. In combination with the option “Synchronize Views”, it is possible to select the “Synchronization Mode”. You can change the mode by clicking the “Settings” button in the bottom toolbar, going to the menu item “Synchronize Mode” and selecting the respective mode you wish to use.
Two ways are possible: “Automatic” mode: The automatic mode finds the adequate images in the other series automatically, if
they were acquired by the same modality. If not, the icon turns red and automatic synchronization is not possible. You may then switch to the manual mode to perform series synchronization.
“Manual” mode: The manual mode can be used if the automatic mode is unable to synchronize the
views. For a correct synchronization you will have to arrange the images manually before starting the synchronization (scrolling the series to the correct starting position). This arrangement will be taken as reference.
NOTE: Note that the manual mode only works for series with nearly the same orientation. If the orientations differ
significantly, the icon turns red and synchronization is not possible in manual mode.
4.4.8 ORIENTATION TOOLS – THE “SCOUTLINES” MODE Especially in multi-slice studies, such as CT or MRI exams orientation within the different section planes can be difficult. This is where orientation tools such as scoutpilots and lines displays can be helpful. iQ-X offers a scoutlines mode to aid the users. The “Scoutlines” mode in iQ-X is essentially a scoutpilot function that simplifies the orientation in a study by displaying the position of the current slice (active frame) within the other series and section planes. It is particularly helpful in multi-slice studies taken from different section planes.

iQ-X 2 2 0 User Manual PUB INT EN – 006R 21
The “Scoutlines” mode is enabled by default. It can be activated and deactivated by clicking the “Settings” button in the bottom toolbar, going to “Display” and marking or unmarking the “Scoutlines” menu entry.
NOTE: To see the scoutlines you need to enable the “Compare Mode” and drag several series into a tiled view. See
section 4.4.1.5 for details on the compare mode.
Lines display
4.4.9 PRESENTATION STATES IN iQ-X Normally, presentation states (PR) are independent DICOM SOP instances containing information on how a particular image should be displayed. The presentation state may contain, for instance, windowing, zooming and panning values, information about rotation or flipping and other visual display elements defined in the DICOM standard. What presentation states do not contain is pixel data. Therefore, PR can only be used in combination with an existing DICOM image. When a presentation state is applied to an image, the image is then displayed with all the visual specifications defined in that presentation state. The advantage of using presentation states is that it is always possible to

iQ-X 2 2 0 User Manual PUB INT EN – 006R 22
revert back to the original image since the underlying pixel data of the image is not modified, but rather displayed differently. It is important to note that iQ-X does not support the SOP class of presentation states. While images transferred from other DICOM stations to iQ-WEBX may already contain presentation states, iQ-X will not be able to make use of these presentation states. On the other hand, in iQ-X, modifications made to an image (e.g. window level changes, zooming/panning, flipping/ rotating and adding of measurements and annotations) will be treated as a presentation state in the background. They will, however, only be cached for the current viewer session and are deleted when the viewer is closed. The next time the images are loaded, they will be displayed again with their original pixel data.
NOTE: Due to the use of presentation states in iQ-X the handling of some image processing features, such as zooming and panning, have slightly changed in comparison to earlier iQ-X versions. These adaptations were necessary
to adhere to the specifications laid down in the DICOM standard.
4.4.10 OVERLAYS AND LOOK-UP TABLES 4.4.10.1 TEXT OVERLAY The text overlay provides patient, study and series information necessary to identify images displayed in the image processing area. It is activated by default when images are loaded into the viewer. This is done to insure that important information, such as lossy image compression, is always recognized by the user. The text overlay can be activated and deactivated from the button in the bottom toolbar.
“Text overlay”: Is used to hide the text overlay information that is activated by default. Clicking this button will toggle between activating and deactivating the text overlay.
NOTE: It is possible to configure which information shall be displayed in the text overlay of the DICOM images. This can also be done in dependence of the modality. The configuration has to be done on the iQ-WEBX server and will then be available to all iQ-X clients. For further details, please consult the iQ-X Administration Guide.
4.4.10.2 DISPLAY OF LOSSY IMAGE COMPRESSION If an image displayed in the image processing area has been lossy compressed, this information will be shown in the text overlay, provided that the necessary details were correctly stored in the image information. Compression information will only display if the text overlay is activated.

iQ-X 2 2 0 User Manual PUB INT EN – 006R 23
Complete compression information of an image is shown in the DICOM header dump. The iQ-WEB web interface provides views of the DICOM dumps of each image. Refer to the iQ-WEB user documentation of the respective software version.
WARNING: Lossy compressed images may have no diagnostic quality.
4.4.10.3 BITMAP OVERLAY If images contain so-called bitmap overlays – text or image information burned into the DICOM image – iQ-X will display these by default. It is not possible to deactivate the display of such overlay information in iQ-X. 4.4.10.4 LOOK-UP TABLES iQ-X does not support the interpretation of look-up tables (LUT) as they might be embedded in DICOM images in order to display a DICOM image the way it is displayed on the source machine (another form of center/window information). Instead, iQ-X will either use the Center/Window values that might additionally be encoded in the images or perform an automatic contrast. Therefore, the display of such images in iQ-X may differ from that of other workstations. For support of look-up tables, please refer to the full radiological reading station iQ-VIEW (http://www.image-systems.biz/products/iq-system-pacs/iq-view.html). 4.4.10.5 DICOM-EMBEDDED SHUTTERS Sometimes images can contain shutters that are embedded within the DICOM header of an image. iQ-X is able to interpret potentially embedded shutter sequences in order to hide a specific part of a DICOM image. However, iQ-X will not be able to ignore the shutter information integrated into the image to make the entire image visible again. 4.4.11 CINE AND STACK MODE Stack and cine mode make it possible to manually or automatically browse through all images of a series. Both the stack and the cine modes are available by using the toolbar button in the bottom toolbar. 4.4.11.1 STACK MODE
The stack mode is always activated by default and can be used even if other processing functions are activated. Browsing through images with the stack mode is possible in different ways.

iQ-X 2 2 0 User Manual PUB INT EN – 006R 24
Use the mouse scroll-wheel to move through a series. Use the up and down arrow keys on the keyboard to scroll to the next or previous images. Select the “Cine mode (stack)” button in the tool bar or the “Stack mode” function in the “Tools” menu.
Then move the mouse up and down while keeping the left mouse button pressed to browse through a series.
Use the scrollbar to the right of the viewer window to scroll through a series of images by pulling the controller up and down.
4.4.11.2 CINE MODE
With DICOM multi-frame images (e.g. angiographic or ultrasound images) as well as single-frame images (e.g. CT, MR), the series can be run automatically as a sequence. Right-click the “Cine mode” button in the bottom toolbar to access the cine mode sub-menu:
“Start autoplay”: Cine mode will begin playing automatically.
“Stop autoplay”: The stop button stops the cine play.
NOTE: iQ-X can display up to 32 frames per second. The actual speed that can be reached when displaying images
in a cine loop depends on the system resources. It might be that the requested speed cannot be reached due to system limitations. In such cases the loop will simply run slower.
Further settings: “Direction”: The cine can either be played “Forwards”, “Backwards” or in an “Alternating” mode, where
the series is played in a loop forwards and then backwards again when the last image is reached. Select the respective entry from the sub-menu.
“Frame rate”: Using the entry in the cine mode sub-menu several pre-defined frame rates can be selected for the cine run (6, 12, 24, 32 fps = frames per second).
4.4.12 WINDOWING TOOLS In many cases, the brightness and contrast for the DICOM images are already well-set when the images are created at the modalities. Sometimes, however, it might be necessary to change the window level of images, e.g. when the series is too dark or the contrast is not good enough to see specific tissues. iQ-X offers two ways of changing the center/window level of DICOM images: Static windowing The use of window presets

iQ-X 2 2 0 User Manual PUB INT EN – 006R 25
4.4.12.1 STATIC WINDOWING Static windowing is the default form of window leveling in iQ-X. With static windowing, the center/window values set in one image are set exactly the same in all other images of the same series. Example: One image has original W/C values of 700/300 and a second has original values of 730/310. If the window value of the first image is increased by 15 and the center value is decreased by 15 (new: 715/285), the values of the second image will also be 715/285, independent of their original center/window values.
NOTE: Be careful as this may reduce the viewing quality of an image for which the center/window values of another image may not be advantageous. For dynamic windowing, where the center/window values are calculated
for each image based on the original center/ window values as they are stated in the DICOM information, please use the radiological reading station iQ-VIEW instead. This might particularly helpful with MR imaging
where it most often occurs that all images of a particular series have different center/window values.
In iQ-X static windowing is active by default as soon as images are loaded into the viewer. The function can easily be accessed in different ways: While pointing to an image, click the center mouse-button (scroll-wheel) and move the mouse
up/down and left/right. This option is also available if other tools are currently selected. Select the “Windowing” button in the bottom toolbar. While pointing to the image, click the
left mouse button and move the mouse up/down and left/right. When the windowing function is activated using the toolbar button, the shape of the mouse pointer will change to indicate the use of windowing. 4.4.12.2 USING WINDOW PRESETS The second possible form of applying center/window changes to images is to use pre-defined window presets. The iQ-X viewer comes with a number of window presets and, furthermore, includes an auto-contrast function. The window presets pop-up menu can be accessed by right-clicking the “Windowing” button on the bottom toolbar:

iQ-X 2 2 0 User Manual PUB INT EN – 006R 26
Several standard window settings (presets) may be selected: Abdomen Bones
Brain – base Brain
Lung Mediastinum
Skull
“Auto contrast”: Auto contrast applies an auto-contrast to the whole series only. The other series remain unaffected. 4.4.13 COLOR REMAPPING Color remapping assigns a color to each gray tone of an image, therefore rendering any grayscale image (MONOCHROME1 and MONOCHROME2) in color. Using colors, areas with low contrast can be better displayed. Color remapping options can be accessed by clicking the “Color scheme” button in the bottom toolbar with the left mouse-button.
“Color scheme” offers several options: normal grayscale output (“B/w”), inverted grayscale output (“B/w negative”), color remapping (“Color remap”) and inverted color remapping (“Negative color remap”).
4.4.14 MEASUREMENT AND ANNOTATION TOOLS iQ-X offers a variety of measurement and annotation tools that make it possible to easily add markings to images (distances, angles, ROI, etc.). These tools can be accessed by selecting the “Measurement tools” button on the bottom toolbar. Clicking the button (with left or right mouse-button) opens a sub-menu where all measurement and annotation functions can be found. Select the tool you wish to use.

iQ-X 2 2 0 User Manual PUB INT EN – 006R 27
4.4.14.1 DISTANCE MEASUREMENTS
“Distance”: The distance tool is used to measure a distance. To use the tool, point to the position where the measurement should begin and hold the left mouse button down while dragging the mouse to the end point. Releasing the mouse button will show the results in millimeters.
NOTE: If the result is not given in millimeters but in pixels (pxl), the pixel spacing is missing in the affected image (or US Region Calibration for ultrasound images). The pixel spacing or region calibration values are needed by iQ-X
to know how big a pixel is in the image. This information is needed to calculate distance.
4.4.14.2 ANGLE MEASUREMENTS
“Angle”: The angle tool is used to measure an angle. To measure angles, draw the first line as if drawing a distance measuring line. The second line does not necessarily have to intersect the first line. The resulting measurement values represent the acute and obtuse angle.
4.4.14.3 SQUARE ROI MEASUREMENTS
“Square ROI”: With the square ROI tool it is possible to measure the density in a selected rectangular area (ROI). To use this tool, place the mouse at the upper left corner of the area to measure; hold the left mouse button down; and drag diagonally until the appropriate area is selected. When the mouse button is released, a rectangle will be drawn over the specified area and the mean, maximum and minimum density values will be given. For CT images the results are displayed in Hounsfield Units (HU). In addition, the results will state the standard deviation.
4.4.14.4 CIRCULAR ROI MEASUREMENTS
“Circular ROI”: Measuring density in a selected elliptical/circular area (ROI) is possible using the circular ROI tool. To use this tool, place the mouse in the center of the area to be selected; hold the left mouse button down; and drag the mouse outward from the center to create an ellipse/circle around the desired area. When the mouse button is released, the mean, maximum and minimum density values will be given. For CT images the results are automatically displayed in Hounsfield Units (HU). In addition, the results will state the standard deviation.
NOTE: A perfect circle (not an ellipse) can be achieved by holding the [SHIFT] key while drawing the ROI area with
the mouse.
4.4.14.5 SHUTTERS
“Shutter”: The shutter tool makes it possible to select a specific rectangular area of an image while blackening out the rest of the image. The blackened-out areas are not deleted from the image. They are only hidden. To use this tool, place the mouse at the upper left corner of the area to

iQ-X 2 2 0 User Manual PUB INT EN – 006R 28
view; hold the left mouse button down; and drag diagonally until the appropriate area is selected. When the mouse button is released, only the selected area will be visible.
4.4.14.6 ANNOTATIONS
“Annotation”: The annotation tool allows the user to make annotations on images. To use this tool, point the mouse at the area where the annotation should begin. (Longer annotations should start farther to the left.) While holding the left mouse button down, drag the mouse to draw a line on the image to the area to be annotated. When the mouse button is released, an arrow will be displayed and the annotation dialog will open.
Annotation dialog
Enter text and click “OK”. Annotations are displayed only to the border of the image. The longer the annotation, the farther the arrow should start on the left side. The annotation text will begin at the starting point of the arrow.
Example of an annotation
iQ-X 2 2 0 User Manual PUB INT EN – 006R 29
NOTE: If no text is entered on the annotation screen, the arrow will remain anyway. This is implemented by design to
allow for adding arrows that denote specific areas in the image.
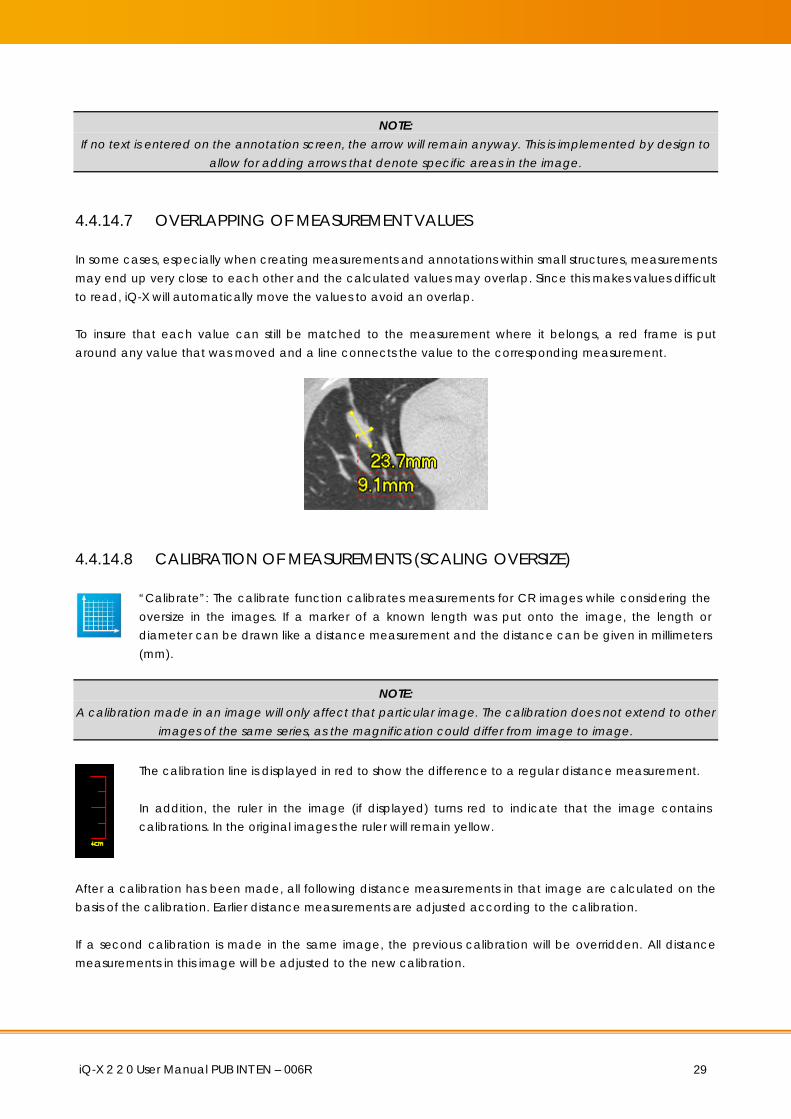
4.4.14.7 OVERLAPPING OF MEASUREMENT VALUES In some cases, especially when creating measurements and annotations within small structures, measurements may end up very close to each other and the calculated values may overlap. Since this makes values difficult to read, iQ-X will automatically move the values to avoid an overlap. To insure that each value can still be matched to the measurement where it belongs, a red frame is put around any value that was moved and a line connects the value to the corresponding measurement.
4.4.14.8 CALIBRATION OF MEASUREMENTS (SCALING OVERSIZE)
“Calibrate”: The calibrate function calibrates measurements for CR images while considering the oversize in the images. If a marker of a known length was put onto the image, the length or diameter can be drawn like a distance measurement and the distance can be given in millimeters (mm).
NOTE: A calibration made in an image will only affect that particular image. The calibration does not extend to other
images of the same series, as the magnification could differ from image to image.
The calibration line is displayed in red to show the difference to a regular distance measurement. In addition, the ruler in the image (if displayed) turns red to indicate that the image contains calibrations. In the original images the ruler will remain yellow.
After a calibration has been made, all following distance measurements in that image are calculated on the basis of the calibration. Earlier distance measurements are adjusted according to the calibration. If a second calibration is made in the same image, the previous calibration will be overridden. All distance measurements in this image will be adjusted to the new calibration.

iQ-X 2 2 0 User Manual PUB INT EN – 006R 30
A calibration can be deleted using the “Clear” function of the measurement tool. The image will return to its original scaling. All distance measurements are adjusted accordingly. Modifying a calibration line, however, is not possible. If you need to change the calibration, simply draw a new line. The old one will be overwritten automatically and removed.
NOTE: A calibration is only possible in the currently active view (displayed with a blue frame). If “Calibrate” is
selected, but an inactive frame is used, then only a regular distance measurement will be drawn. Therefore, first activate the correct view and then select the “Calibrate” function.
4.4.14.9 ERASING MEASUREMENTS AND ANNOTATIONS
“Clear”: The clear tool can be used to erase individual measurements or annotations made in an image. To use this tool, select the “Clear” function, then click the measurement or annotation to be erased. After it turns red, click again the item to remove the measurement or annotation.
NOTE: All measurements and annotations made in a series (one view) can be deleted by using the “Reset” button.
However, this will reset ALL changes in the active series, not only the measurements and annotations.
4.4.14.10 MODIFYING MEASUREMENTS AND ANNOTATIONS
“Modify”: The modify tool allows current measurements and annotations to be modified. To use this tool, select the measurement or annotation to be modified. The markers displayed on each measurement or annotation can then be used to drag and drop the measurement/ annotation into the correct position.
The “Modify” function works as follows: Distance measurements: Grab the center marker with the mouse to move the whole line into a new
position or use the start and end markers of the line to change the length and position of the starting and ending points.
Angle measurements: Grab the center marker to change the position of where the two lines cross or use the start and end markers of each line to move the lines into the correct position.
Square and circular ROI: Grab the center marker to move the whole area (rectangular or elliptical/circular) or use the line markers to change the size of the area.
Shutter: Grab the center marker to move the whole shutter or use the markers in the upper left and lower right corners to change the shutter’s size.
Annotations: Grab the center marker to move the annotation and arrow to a new location or use the marker at the arrow tip to change the length and tip position. The annotation text field will open after each move to allow the text to be changed.

iQ-X 2 2 0 User Manual PUB INT EN – 006R 31
4.4.15 MAGNIFYING TOOLS The regular magnifier function available in iQ-X can be accessed by clicking the “Magnifier” button in the bottom toolbar.
“Magnifier”: After selecting the magnifying function, the mouse pointer turns into a magnifying glass. By holding down the left mouse button while moving over an image, the image area is magnified at twice its current size at the position of the mouse.
NOTE: Measurements and annotations made in an image are still visible using the magnifier.
4.4.16 ZOOMING AND PANNING TOOLS Sometimes individual images or entire series need to be enlarged to improve the visibility of diagnostically relevant tissues and structures. Moving images around in their views (panning) may also be necessary – for example, to adjust them for easier comparison to another series. 4.4.16.1 ZOOM/PAN HANDLING WITH PRESENTATION STATES It is important to note that the zoom and pan features in iQ-X have changed in comparison to earlier software versions. Due to the presentation states (PR) now used in the background to display and cache changes in DICOM images, the zoom/pan feature has been modified to adhere to the specifications established in the DICOM standard. Therefore, zoom out will only scale down to a “fit-in” size and not smaller since this is not defined in the DICOM standard. It is, however, possible to view an image smaller than its “fit-in” size by applying a 1:1 zoom. Panning images can still be done even if the images are not zoomed but are scaled to fit the screen. This allows for the adjusting of images to the same height in case one is displayed lower than the other. 4.4.16.2 THE ZOOM/PAN FUNCTION To zoom (adjust the size) or pan (move) images, click the “Zoom/Pan” button on the bottom toolbar.
“Zoom/Pan”: When activated, the zoom/pan function can be used to dynamically zoom and pan images using the mouse. The middle area of the image acts as the “pan zone”. The mouse pointer turns into a hand icon when pointing there. By clicking in the middle of the image and moving the mouse up/down or right/left, the image will be moved. The periphery of the image acts as the “zoom zone”. The mouse pointer turns into a magnifier icon when pointing there. By clicking on the periphery and moving the mouse up and down, the image can be easily zoomed.

iQ-X 2 2 0 User Manual PUB INT EN – 006R 32
In addition, a sub-menu is available with different zooming presets. The sub-menu is accessed by right-clicking the “Zoom/Pan” toolbar button:
“Fit in”: This is the default setting. Images are scaled to fit into the available view. The higher the tiling, the
smaller the images will be displayed. “1x (original)”: The images are displayed in their original size. “1.5x”: The images will be zoomed to one and a half times their size. “2x”: The images will be zoomed to two times their size. “2.5x”: The images will be zoomed to two and a half times their size. “3x”: The images will be zoomed to three times their size. 4.4.17 FLIPPING AND ROTATION TOOLS Images loaded into the viewer can be flipped, rotated or both. The flipping and rotation options are accessible by clicking the “Flip/Rotate” button in the bottom toolbar.
“Flip/rotate”: Activating the Flip/Rotate function opens a sub-menu containing all flipping and rotation options: “Flip vertically”: Flips the image vertically. A specific marker is added to the text overlay to
indicate the flipping. * “Flip horizontally”: Flips the image horizontally. A specific marker is added to the text overlay to
indicate the flipping. “90° rotation clockwise”: Rotates the image in a 90 degree angle to the right. “180° rotation clockwise”: Rotates the image in a 180 degree angle. “270° rotation clockwise”: Rotates the image in a 90 degree angle to the left.
*NOTE: To correctly read the markers given in the overlay, it is important to understand that for presentation states only
horizontal flipping is defined. Therefore, when using vertical flipping (as the option is called in iQ-X for better
iQ-X 2 2 0 User Manual PUB INT EN – 006R 33
understanding), the marker stated in the text overlay will include a horizontal flip and a 180° rotation, which is exactly the same as a vertical flip. The marker states: “Flipped hor. Rotation: 180°”.
Click “Reset current view” from the sub-menu to reset the flipping and rotation changes. The images will return to their original position. Alternatively, the general “Reset” button on the bottom toolbar can be used to reset the modifications. Note, however, that the latter options also remove all other modifications made to the image(s).
NOTE: When rotating or flipping zoomed images, any zoom or pan changes will be reset. This also applies to the
“Reset current view” function within the flip/rotate context menu. However, it is possible to re-apply the zoom after the image has been rotated.
4.4.18 RESETTING CHANGES IN IMAGES If modifications made in an image are no longer needed or need to be changed, it is possible to reset the changes and start anew. The reset function is available in the bottom toolbar (“Reset” button).
“Reset”: Selecting the reset function removes all changes made to an image and restores the original image (e.g. if the image was windowed, zoomed, rotated). In addition, all measurements, annotations and shutters are removed.
4.4.19 REPORTING TOOLS When patient studies are evaluated in iQ-X for diagnostic purposes, the results of that evaluation are usually recorded both to be sent to the referring physician and for documentation and accounting purposes. For this reason, the application offers a structured reporting module where the radiologist orthopedist, cardiologist, etc. can type in or use speech recognition software to enter their findings. For different workflow scenarios where the doctor may record the findings to be transcribed later by a medical data assistant or a special transcription service, iQ-X also provides a direct interface to the NCH Express Dictate software. 4.4.19.1 STRUCTURED REPORTING The structured reporting window can be opened using the “Structured reporting” button in the bottom toolbar. If necessary, make a right-click on the button to access the sub-menu. Here, select the item “Structured Report”:

iQ-X 2 2 0 User Manual PUB INT EN – 006R 34
“Structured Report”: When selecting the structured reporting function, a report window is opened that contains different text fields and text configuration options. The structured reporting window offers you the possibility to create structured reports, to store draft versions in a special database, as well as to create, delete or edit templates that help you save time when inserting often-used phrases or report fragments. The final report will be created on the iQ-WEB server as a DICOM Structured Report (SR) and can then be sent to other workstations that support reading of structured reports (e.g. iQ-VIEW).
NOTE: Only users with the permission to create reports in iQ-X will have access to this window. Please consult the iQ-
WEB user documentation for the respective software version for details regarding user management and permission handling. Additionally, an iQ-X license including structured reporting is needed to create structured
reports with iQ-X.
When creating a structured report for a study, select a view displaying a series of the study. An empty view cannot be selected.
NOTE: Please remember that the creation of structured reports is only possible as ISO_IR 100 (i.e. Latin-1 characters).
4.4.19.1.1 THE STRUCTURED REPORTING WINDOW
Structured reporting window

iQ-X 2 2 0 User Manual PUB INT EN – 006R 35
The structured reporting window consists of three parts: the report list the report editing section the template list In addition, you will find a toolbar containing all necessary tools at the top of the structured reporting window. Information about the creator of the report as well as the completion and verification status can be set at the bottom of the window. 1. The report list
The report list on the left side shows all (draft) reports that belong to this study. Click an entry to load this report into the report editing section to the right. Right-click an entry to open the sub-menu: “New report”: Allows you to add another (new) report. A new
entry is added and the report editing section shows a blank report form. Alternatively, you can do so by clicking the “+” button.
“Delete report”: Removes the selected report from the list and also deletes it from the database. Alternatively, you can do so by clicking the “–” button.
See also section 4.4.19.1.2 for details on the “+” and “–” buttons. 2. The report editing section
The report editing section consists of six parts – a report description field at the top and five text fields that let you describe different parts of the report (History, Request, Findings, Impression and Recommendation). To store a draft version in the report storage database you only need to fill in a descriptive name in order to easily find your report for later editing. For text formatting you can use the different function buttons provided above the report editing section. See also section 4.4.19.1.2 for details on the formatting options.
See also section 4.4.19.1.3 for details on how to create reports.
iQ-X 2 2 0 User Manual PUB INT EN – 006R 36
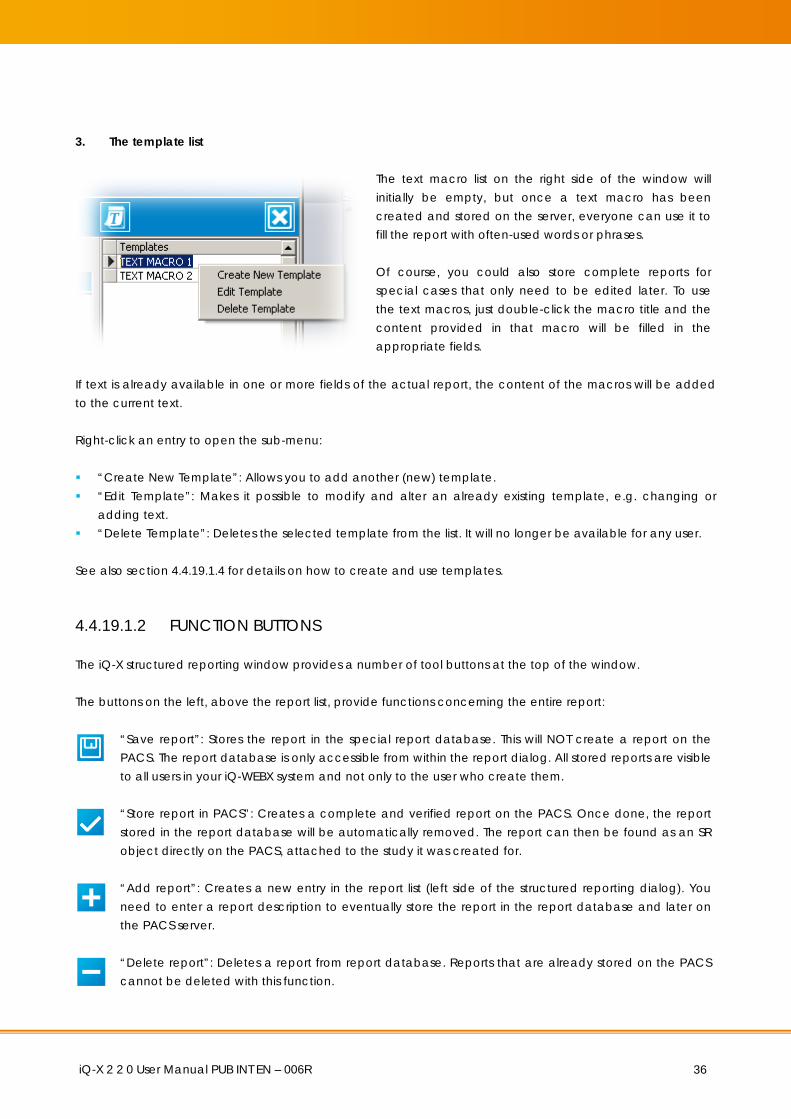
3. The template list
The text macro list on the right side of the window will initially be empty, but once a text macro has been created and stored on the server, everyone can use it to fill the report with often-used words or phrases. Of course, you could also store complete reports for special cases that only need to be edited later. To use the text macros, just double-click the macro title and the content provided in that macro will be filled in the appropriate fields.
If text is already available in one or more fields of the actual report, the content of the macros will be added to the current text. Right-click an entry to open the sub-menu: “Create New Template”: Allows you to add another (new) template. “Edit Template”: Makes it possible to modify and alter an already existing template, e.g. changing or
adding text. “Delete Template”: Deletes the selected template from the list. It will no longer be available for any user. See also section 4.4.19.1.4 for details on how to create and use templates. 4.4.19.1.2 FUNCTION BUTTONS The iQ-X structured reporting window provides a number of tool buttons at the top of the window. The buttons on the left, above the report list, provide functions concerning the entire report:
“Save report”: Stores the report in the special report database. This will NOT create a report on the PACS. The report database is only accessible from within the report dialog. All stored reports are visible to all users in your iQ-WEBX system and not only to the user who create them.
“Store report in PACS”: Creates a complete and verified report on the PACS. Once done, the report stored in the report database will be automatically removed. The report can then be found as an SR object directly on the PACS, attached to the study it was created for.
“Add report”: Creates a new entry in the report list (left side of the structured reporting dialog). You need to enter a report description to eventually store the report in the report database and later on the PACS server.
“Delete report”: Deletes a report from report database. Reports that are already stored on the PACS cannot be deleted with this function.

iQ-X 2 2 0 User Manual PUB INT EN – 006R 37
The buttons in the middle of the toolbar, right above the report editing area, provide options to format the text in the different text sections of the report:
“Left align”: Aligns the entered/marked text to the left of the text field.
“Center”: Aligns the entered/marked text in the center of the text field.
“Right align”: Aligns the entered/marked text to the left of the text field.
“Bold”: Changes the font of the entered/marked text to bold.
“Italic”: Changes the font of the entered/marked text to italic.
“Underline”: Underlines the entered/marked text.
NOTE: The text formatting does only enhance the report writing and editing. It will not be used in the created
structured report file since the layout and structure of that file is defined by the DICOM standard.
On the right side of the toolbar, two more buttons are found:
“New Template”: Opens the template dialog for the creation of a new template.
“Close”: Closes the structured reporting window.
4.4.19.1.3 MANUALLY CREATING A STRUCTURED REPORT To manually create a structured report, open the structured reporting window via the toolbar button, enter a report description to create a new report and then type the patient’s history, technical information, any diagnostic findings and all other pertinent information into the appropriate text fields. Click into the individual text fields to easily jump from one text field to the next.
NOTE: It is also possible to use the structured reporting form in combination with speech recognition software installed
on the system. In this case, the text would not have to be entered manually but could be dictated into the fields. Be sure to select the appropriate fields before speaking the text.

iQ-X 2 2 0 User Manual PUB INT EN – 006R 38
To reopen a report previously created with iQ-X but not yet stored on the PACS, open the structured reporting window and select the desired report from the report list. The report editing section will be updated accordingly and you can continue preparing your report. If you want to add a second report to a study, you can do so by opening the structured reporting window and click the “+” button to create a new report form. Alternatively, right-click into the report list and select “New report”. Start by entering a report description.
NOTE: Only structured reports that were created with iQ-X can be edited. Structured reports coming from other
stations can only be viewed (read-only) within the iQ-X viewer.
4.4.19.1.4 MANAGING AND USING TEMPLATES The template function in the iQ-X structured reporting window can be used: To store specific phrases and text components that will frequently be used in reports To store entire reports for specific cases that only need to be edited later
Click the “New Template” button or right-click into the template list and select the entry “New Template”. This will open template dialog for the creation of a new template. As many templates as are needed can be configured.
First enter the title of the template description into the field on top. As only the description will later be seen in the template list, make sure that the title clearly references the text. You have different options then: You can fill in all text fields with appropriate information to create a full report template. You can fill in only one or a few text fields with appropriate information to be used as text macros. Also the text formatting options (i.e. bold, italic, underlined; left-, center-, right-aligned) are available in the template dialog. Note, that the text formatting will only be used within the structured reporting window but not within the final SR objects.
“Save Template”: Click the save button to add the newly created template to the list of available templates.
To use a template for your current report, just double-click on the template name in the template list. All content provided in that respective template (an entire report or only text parts) will be copied to the appropriate fields of the actual report. You can then adapt this text or use further templates/macros to add further text to the current report. Keep in mind that with each double-click onto a template, all content of that template will be added. That way text macros can be added to whole templates or a report can be constructed out of different text macros.

iQ-X 2 2 0 User Manual PUB INT EN – 006R 39
Existing templates can also be edited or deleted. Right-click onto the entry of that particular template you wish to modify or delete and select from the sub-menu: “Edit Template” to re-open the template dialog and modify the text and/or template title. Save the
changes by clicking the “Save Template” button. “Delete Template” to delete the selected template from the structured reporting window. The template
will immediately be removed from the template list. 4.4.19.1.5 STORING REPORTS There are two fundamentally different ways to store a report: storing the report in the special report database and storing the report directly on the PACS. 1. Saving unfinished reports The first option is usually used for unfinished draft versions of reports that need further editing or verification.
As long as you have not finished your report and only want to save your work on the report, you can do so by clicking the “Save Report” button in the toolbar of the structured reporting window.
iQ-X will save the report in a special report database separate from the patient studies stored on the PACS. Therefore, the report can only be opened again by loading the study it belongs to into the iQ-X viewer and accessing the structured reporting window. You will then find that report in the report list. It can be accessed and edited on any other iQ-X client PC. 2. Storing finished reports in the PACS The second option is used to store a completed and verified report in the PACS. During this process a DICOM SR object is created out of the report and sent to the PACS. Any draft of this report will now also be deleted automatically from the report database.
After you have finished your report you can send it as a complete and verified report to the PACS. If the status of the report is not yet set to “COMPLETE” and “VERIFIED”, this status will be set when clicking the “Store report in PACS” button.
Before you try to send your report to the PACS, you should check the information at the bottom of the structured reporting window. Several fields there are mandatory and have to be filled in to store the report on the PACS. They will be marked red in case the information is missing:
Add the “Reporting phys” (i.e. reporting physician). By default your login name will be displayed here automatically. If necessary, you can change the name in the text field.
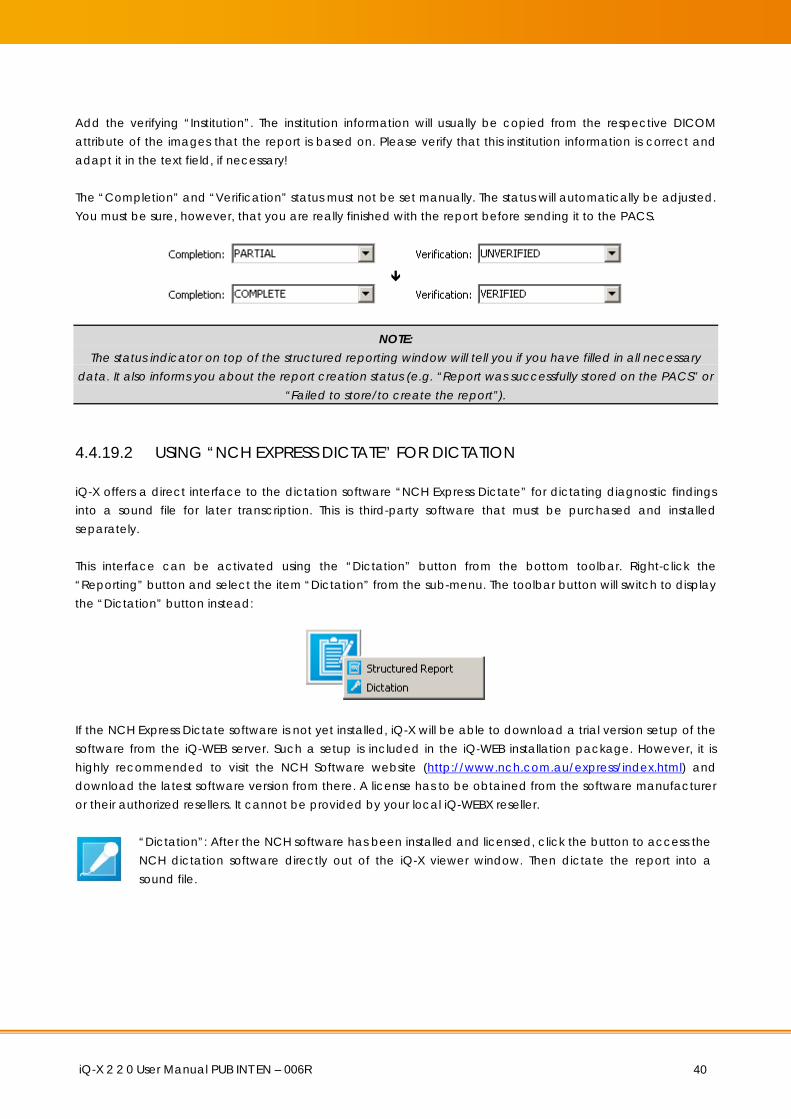
iQ-X 2 2 0 User Manual PUB INT EN – 006R 40
Add the verifying “Institution”. The institution information will usually be copied from the respective DICOM attribute of the images that the report is based on. Please verify that this institution information is correct and adapt it in the text field, if necessary! The “Completion” and “Verification” status must not be set manually. The status will automatically be adjusted. You must be sure, however, that you are really finished with the report before sending it to the PACS.
NOTE: The status indicator on top of the structured reporting window will tell you if you have filled in all necessary
data. It also informs you about the report creation status (e.g. “Report was successfully stored on the PACS” or “Failed to store/to create the report”).
4.4.19.2 USING “NCH EXPRESS DICTATE” FOR DICTATION iQ-X offers a direct interface to the dictation software “NCH Express Dictate” for dictating diagnostic findings into a sound file for later transcription. This is third-party software that must be purchased and installed separately. This interface can be activated using the “Dictation” button from the bottom toolbar. Right-click the “Reporting” button and select the item “Dictation” from the sub-menu. The toolbar button will switch to display the “Dictation” button instead:
If the NCH Express Dictate software is not yet installed, iQ-X will be able to download a trial version setup of the software from the iQ-WEB server. Such a setup is included in the iQ-WEB installation package. However, it is highly recommended to visit the NCH Software website (http://www.nch.com.au/express/index.html) and download the latest software version from there. A license has to be obtained from the software manufacturer or their authorized resellers. It cannot be provided by your local iQ-WEBX reseller.
“Dictation”: After the NCH software has been installed and licensed, click the button to access the NCH dictation software directly out of the iQ-X viewer window. Then dictate the report into a sound file.

iQ-X 2 2 0 User Manual PUB INT EN – 006R 41
4.4.20 CONFIGURATION OPTIONS
The “Settings” button in the bottom toolbar of iQ-X offers several options to configure your local iQ-X client. Left-click the “Settings” button to display the available options.
The viewer configuration options are listed and described in the iQ-X Administration Guide. Please refer to this document for further information. Please note that Adobe Acrobat Reader or another PDF reader must be installed on the system to open this document.

iQ-X 2 2 0 User Manual PUB INT EN – 006R 42
5 LIST OF ABBREVIATIONS
ABBREVIATION DESCRIPTION
b/w black/white
cm Centimeter
CPU Central Processor Unit
CR Computed Radiography
CT Computed Tomography
DICOM Digital Imaging and Communications in Medicine
EEC European Economic Community
FDA Food and Drug Administration
GB Gigabyte
HDD Hard Disk Drive
HU Hounsfield Unit
IE Internet Explorer
IP Internet Protocol
JPEG Joint Photographic Expert Group
LUT Look-up Table
MD Medical Doctor
MG Mammography
mm Millimeter
MR Magnetic Resonance Imaging
PACS Picture Archive and Communication System
PC Personal Computer
PDF Portable Document Format
PR Presentation State
RAM Random Access Memory
ROI Region of Interest
SOP Service-Object-Pair
SP Service Pack (for an Operating System)
SR Structured Report
UI User Interface
UPS Uninterruptible Power Supply
US Ultrasound

iQ-X 2 2 0 User Manual PUB INT EN – 006R 43
6 LIST OF SHORTCUTS No keyboard shortcuts are currently available for the use of iQ-X viewer functions.

iQ-X 2 2 0 User Manual PUB INT EN – 006R 44
7 INDEX
A
Annotation tool ..................................................... 26, 28 Annotation tool (erasing annotations) .................... 30 Annotation tool (modifying annotations) ............... 30 Antivirus software........................................................... 8
B
Bitmap overlays (display of) ...................................... 23 Bottom toolbar ............................................................. 19
C
Calibration of measurements ................................... 29 Cine mode ................................................................... 23 Cine mode (playing of series) ................................... 24 Cine mode (setting direction) .................................. 24 Cine mode (setting frame rate) ............................... 24 Cine mode (stack) ...................................................... 24 Cine mode (starting autoplay) ................................. 24 Cine mode (stopping autoplay) .............................. 24 Color remapping ......................................................... 26 Color remapping (grayscale output) ...................... 26 Color remapping (inverted grayscale output) ...... 26 Color remapping (inverted) ...................................... 26 Color schemes ............................................................. 26 Comparison of studies ................................................ 15 Configuration of iQ-X .................................................. 10 Configuration options ................................................. 41
D
DICOM multi-frame images ....................................... 24 Dictation software (interface to) .............................. 40
F
Flipping images ............................................................ 32
H
High-resolution displays ................................................ 4
I
Image processing area .............................................. 17 Installation of software ................................................. 9
L
Licensing of software .................................................... 9 Loading studies into viewer ....................................... 11 Look-up tables (support of) ....................................... 22
Look-up tables (use of) ............................................... 23
M
Magnifier ....................................................................... 31 Magnifying tools .......................................................... 31 Measurement tools ..................................................... 26 Measurement tools (angles)...................................... 27 Measurement tools (calibration of measurements)
.................................................................................... 29 Measurement tools (circular ROI) ............................. 27 Measurement tools (distances) ................................ 27 Measurement tools (erasing measurements) ......... 30 Measurement tools (modifying measurements) .... 30 Measurement tools (overlapping values) ............... 29 Measurement tools (shutters) .................................... 27 Measurement tools (square ROI) .............................. 27 Multi-frame images (treatment of)........................... 19
O
Orientation indicators .......................................... 17, 18 Orientation tools .......................................................... 20 Orientation tools (scoutlines mode) ......................... 20 Overlays (support of) .................................................. 22
P
Pan (handling with presentation states) ................. 31 Pan options ................................................................... 31 Pan zone ....................................................................... 31 Panning images ........................................................... 31 Presentation states (description) .............................. 21 Presentation states (support of) ................................ 21
R
Reporting tools ............................................................. 33 Reporting tools (NCH Express Dictate) .................... 40 Reporting tools (structured reporting) ..................... 33 Resetting changes in images .................................... 33 Rotating images .......................................................... 32 Ruler (pixel-spacing) ................................................... 17 Ruler display ................................................................. 17
S
Sample formatting ...................................................... 11 Scaling oversize (for distance measurements) ...... 29 Scoutlines function ...................................................... 20 Screen tiling (on image level) ...................... 18, 19, 21 Screen tiling (on series level) ........................ 18, 19, 21
iQ-X 2 2 0 User Manual PUB INT EN – 006R 45
Screen tiling options .................................................... 18 Series preview bar ....................................................... 16 Series preview bar (function of) ................................ 16 Series preview bar (information in) .......................... 16 Series synchronization ................................................. 19 Settings (viewer) .......................................................... 41 Shortcuts (availability of) ............................................ 43 Shutter function ........................................................... 27 Shutters (embedded) ................................................. 23 Single-frame images (treatment of) ........................ 19 Software installation ...................................................... 9 Software licensing ......................................................... 9 Stack mode .................................................................. 23 Stack mode (browsing through series) .................... 23 Structured reporting .................................................... 33 Structured reporting (function buttons) .................. 36 Structured reporting (managing templates) .......... 38 Structured reporting (report creation) ..................... 37 Structured reporting (report editing section) ......... 35 Structured reporting (report list) ................................ 35 Structured reporting (saving unfinished reports) ... 39 Structured reporting (storing finished reports) ........ 39 Structured reporting (storing in PACS) ..................... 39 Structured reporting (template list) .......................... 36 Structured reporting window .................................... 34 Study tabs ..................................................................... 17 Study/series selection bar .......................................... 13 Synchronization of series ............................................ 19 System requirements ..................................................... 6 System requirements (minimum) ................................ 6 System requirements (recommended) ..................... 7 System requirements (specific for Unicode
languages) ................................................................. 7
T
Text overlay .................................................................. 22
Text overlay (activation of) ........................................ 22 Text overlay (deactivation of) ................................... 22 Text overlay (display of lossy image compression)22 Tile-Screen ..................................................................... 15
U
Uninterruptible power supply (UPS) ............................ 8 Upper toolbar ............................................................... 13 Upper toolbar (compare mode) .............................. 15 Upper toolbar (downloading compressed images)
.................................................................................... 14 Upper toolbar (downloading uncompressed
images) ...................................................................... 14 Upper toolbar (fast selection of next series) ........... 14 Upper toolbar (progress bar) .................................... 15 Upper toolbar (status indicator) ............................... 15 Upper toolbar (study/series selection) ..................... 13 Upper toolbar (tile mode) .......................................... 15 User manual (access to) ............................................ 11
V
Viewer............................................................................ 13 Viewer (loading studies) ............................................. 11 Viewer (settings) .......................................................... 41
W
Windowing (auto-contrast) ....................................... 26 Windowing (static) ............................................... 24, 25 Windowing (using window presets) ......................... 25 Windowing tools .......................................................... 24
Z
Zoom (handling with presentation states) .............. 31 Zoom options................................................................ 31 Zoom zone .................................................................... 31 Zooming images .......................................................... 31

iQ-X 2 2 0 User Manual PUB INT EN – 006R 46
IMAGE INFORMATION SYSTEMS LTD.
3RD FLOOR | 207 REGENT STREET | LONDON W1B 3HH | UNITED KINGDOM
TEL. UK: +44 207 193 06 20 | TEL. GER: +49 381 496 58 20 | TEL. US: +1 704 323 66 63
FAX UK: +44 207 976 48 97 | FAX GER: +49 381 496 5 82 99 | FAX US: +1 704 945 71 01
WWW.IMAGE-SYSTEMS.BIZ | [email protected]