Embed Size (px)
Citation preview

DOCUMENT RESUME
ED 079 330 TM 002 928
AUTHOR Parsons, Jane S.TITLE Assessment of Anxiety About Teaching Using the
Teaching Anxiety Scale: Manual and ResearchReport.
INSTITUTION Texas Univ., Austin. Research and Development Centerfor Teacher Education.
SPONS AGENCY Office of Education (DREW), Washington, D.C. Researchand Development Centers Branca.
PUB DATE 73CONTRACT OEC-6-10-108NOTE 61p.; Paper presented at Annual Meeting of American
Educational Research Association (New Orleans,Louisiana, February 25-March 1, 1973)
EDRS PRICE MF-$0.65 HC-$3.29DESCRIPTORS *Anxiety; *Measurement Instruments; Psychometrics;
*Rating Scales; Speeches; Statistical Data; *StudentTeachers; Teacher Behavior; *Teacher Evaluation; TestReliability; Test Results; Test Validity
IDENTIFIERS TCHAS; *Teaching Anxiety Scale
ABSTRACTThe Teaching Anxiety Scale (TCHAS) is an easily
administered, machine storable, self-report instrument designed tomeasure situation specific (teaching) anxiety. The single factorstructure, high stability (.95) and internal consistency (.87-.94),and manner used for controlling acquiescent set are discussed. TheTCHAS correlates significantly and positively with other measures ofanxiety, but .76-.86 of what it measures reliably is unique. TCHASscores discriminated significantly between groups of preserviceteachers rated most and least anxious about teaching. TCHAS scoresdecreased significantly over two to four months of professionalpreservice education, though MAS scores obtained concurrentlyremained unchanged. (For related documents, see TM 002 929, 930.)(Author)

a
Y-1
ttre,.P-- *
;N,
ASSESSMENT OFANXIETY ABOUT TEACHING
USING THE TEACHINGANXIETY SCALE:
MANUAL AND RESEARCHREPORT
Jane S. Parsons
Research and Development Center for Teacher Education
The University of Texas at Austin
1973
Paper Presented at [-he 1973 Annual Meetings of theAmerican Educational Research Association: The re-sePrch djscussed herein was supported in pert by theU. S. Office of Education Contract OE 6-10-108 andthe Research and Development Center. For TeaciwrEducation, R. F. Peck and 0. U. hewn, Co-Directors.
FILMED FROM BEST AVAILABLE COPY

This manual for the Teaching Anxiety Scalesupersedes all previous incomplete versionsthat may be in existence.
JSPFeb. 1973

ACKNOWLEDGMENTS
The author wishes to extend special tank:; to Steven J. Bush,
Carol S. Case, Robert F. Peck, Lester R. Steig, Donald B. Witzke,
and Mary Jane Woods for their assistance in collectig and pro-
cessing the data presented for the first time in this manual. The.
following investigators are gratefully acknowledged for their
contributions to the research reported here: Gary D. Aorich, Gail
G. Brown, James A. Dunn, Frances F. Fuller, Ernest R. Hilgard,
Fred J. McDonald. Joan Seiber Suppes, and Donald J, Veldman.
The author is indebted to the hundreds of preservice and inservice
teacher subjects and to the 1965-66 and 1966-67 doctoral student
teaching supervisors in the Stanford University intern teacher
program for their generous cooperation in this endeavor. She wishes
also to express appreciation to Edmund T. Emmer for permission to
print his unpublished Teaching Anxiety Scale distribution statistics
in this manual.

i
TABLE OF CONTENTS
LIST OF TABLESLIST OF APPENDICES
LIST OF ILLUSTRATIONS
SECTIONS
Pageii
ii-i
iv
I. DESCRIPTION OF THE TEACHING ANXIETY SCALE (TCHAS) 1
II. TEACHING ANXIETY SCALE DISTRIBUTION' STATISTICS 3
III. TEACHING ANXIETY SCALE SCORING PROCEDURES 6
IV. RESPONSE BIAS AND THE TEACHING ANXIETY SCALE 7
V. TEACHING ANXIETY SCALE RELIABILITY 9
Internal Consistency 9
Stability 11
VI. TEACHING ANXIETY SCALE VALIDITY 13
Component Analysis 13
Subcomponents within the Shared Component
(validity coefficient) 14
Unique Components . is
Group Differences 15
Internal Structure 16
Change Over Time 17
VII. SUGGESTED USES OF THE TEACHING ANXIETY SCALE 19
Formal Use of the TCHAS 19
Informal Use of the TCHAS 20
VIII. SUMMARY 21
APPENDICES .,22
BIBLIOGRAPHY 53

...
...
LIST OF TABLES
Table
I. Teaching Anxiety Scale (TCHAS) Distribution Statistics
for Preservice Teachers
Page
3
II. Teaching Anxiety Scale (TCHAS) Distribution Statistics
for Inservice Teachers 4
III. Coefficients of Internal Consistency (Alphas) for theTeaching Anxiety Scale (TCHAS) 11
IV. Teaching Anxiety Scale (TCHAS) Test-Retest Information 10
V. Correlations between the Teaching Anxiety Scale (TCHAS)and other Self Report Anxiety Scales 14
VI. Difference in Teaching Anxiety (TCHAS(1)-25) for GroupsRated "Most Anxious" and "Least Anxious About Teaching" ...
VII. Change (Decrease) Over Time on Teaching Anxiety Scale
Mean Scores
17
1.6
VIII. Correlations Between the TCHAS(1,2)-25 and SocialDesirability 22
IX. Multitrait (T,G) - 'ultimethod (1,2) Matrix for theStudy of the Teaching Anxiety Scale (TCHAS) Validity
X. Anxiety Self-Report (ASR) Distribution Statistics
XI. Anxiety Self-Report (ASR) Inter-item Correlation Matrixfor July 1966
37
45
46
XII. Anxiety Self-Report (ASR) Inter-item Correlation Matrixfor Augv:,t 1966 46
XIII. Anxiety Self-Report (ASR) Five Week Test-Retest Item
Reliabilities 47
XIV. Correlations Between the ASR and other Self Report AnxietyScales (the Teaching Anxiety Scale and the Manifest
Anxiety Scale) 48
XV. Multitrait (T,G) - Multimethod (1,2) Matrix for the Study
of the Anxiety Self Report Validity 49
il

LIST OF APPENDICES
Page1. Single Versus Equivalent Forms of the Teaching Anxiety scale .. 22
TI. Teaching Anxiety Scale Definitions 24
III. Teaching Anxiety Scale (1)-29 26
IV. T(aching Anxiety Scale (2)-25 28
V. Teaching Anxiety Seale (TCHAS(1,2)-25) Item-Pair Directcry al
VI. Social Desirability and the Teaching Anxiety Scale 32
A. Social Desirability Criteria 32
B. The Relationship of Social Desirability to theTeaching Anxiety Scale 32
VII. Validity Data on Twelve Items Appearing in the TeachingAnxiety Scale
VIII. Subcomponents Within the Validity Component
IX. Unique Non-Error Component of the Teaching Anxiet:r S.:ale
X. The Anxiety Self - Report (ASR)
33
35
38
40
XI. Information About the Anxiety Self Report (ASR) 44
A. Development of the Anxiety Self Report (ASR) 44
B. Description of the Anxiety Self Report (ASR) 44
C. Response Bias and the Anxiety Self Report (ASR) 44
D. Anxiety Self Report (ASR) Distribution Statistics 45
E. Anxiety Self Report (ASR) Scoring Procedures 45
F. Anxiety Self Report (ASR) Reliability 45
G. Anxiety Self Report (ASR) Validity 47
XII. Interrelationships Among the Various Teaching AnxietyScales Based on TCHAS(1)-29 51
XIII. Descriptions of Samples 52

Figure I
Figure 2
1.
..,
LIST OF ILLUSTRATIONS
Non-Error Component Unique(with respect to the MAS)
Non-Error Component Unique(with respect to the -MS) 39
to the TCHAS(1)-25
to the TCHAS(1)-25
Page
38
iv

I
I. DESCRIPTION OF THE TEACHING ANXIETY SCALE ("TCHAS)
Considerable evidence exists that anxiety can impair performance in a
variety of tasks. It is suspected that this evidence extends to impairment
of teaching performance as well. Several studies indicite that situation-
specific measures of anxiety may be better predictors of specific behaviors
than are general anxiety measures (2, 18, 22, 27, 31). On the basis of this
information, the Teaching Anxiety Scale (TCHAS) was designed to provide a
tool for measuring anxiety specific to the task of teaching.
The Teaching Anxiety Scale (TCHAS) was developed initially at Stanford
University in two equivalent forms (TCHAS(1)-25 and TCHAS(2)-25) for use
with preservice, intern teachers. This work was financed in part by the
Stanford Center for Research and Development in Teaching under U.S. Office
of Education (Contract No. 6-18-078). More recently, several slightly altered
versions of the TCHAS (TCHAS(1)-24, TCHAS(1)-28, and TCHAS(1)-29) were made
available for use with inservice teachers. The development of these was
financed in part by The University of Texas Research and Development Center
for Teacher Education, under U.S. Office of Education Contract Mo. 6-10-108.
In the following pages the Teaching Anxiety Scale will be described in
detail and will be discussed in terms of distribution statistics, scoring
procedures, susceptibility to response bias, reliability, validity, and
suggested use.
The TCHAS contains a variety of self-report statements about teacher
reactions to teaching. These reactions are of two general kinds: first,
emotional responses to a variety of different situations related to teaching,
and, second, attitudes toward teaching as a profession. All the statements
are presented with a 1-5 choice option format, from low agreement with the
item (1 = "never") to high agreement with the item (5 = "always"). Other
middle-range options are "infrequently," "occasionally," and "frequently,"
2-4, respectively.
Approximately half of the items are phrased negatively (in terms of
admission of anxiety); for example: "I'm worried whether I can be a good
teacher." A high degree of agreement with this negatively phrased item is
scored "high-anxious." The other items are positively phrased, for example,
"I feel sure I can be a good teacher." A high degree of agreement with
positively phrased items is scored "low-anxious."

4
Initially the TCHAS appeared in two equivalent forms (Tt.HAS(1)-25 and
TCHAS(2)-25) which were developed for use in the study of pre-service
teachers (15). A discussion of the benefits derived from using equivalent
forms of the TCHAS can be found in Appendix I. Each of the items in the
TCHAS(1)-25 corresponds to a specific item in the TCEAS(2)-25. If the item
is phrased positively in one form, it is phrased negatively in the other
form and vice versa. See the previous paragraph for an illustration. The
ordering of the items in the two forms (TCHAS(1)-25 and TCHPS(2)-25) is not
the same. Appendix V shows the location of item pairs in then; two forms.
An attempt to increase the appropriateness 4)f the TCHAS cLntent for
the study of inservice teachers resulted in the addition of three slightly
altered versions: TCHAS(1)-24, which is TCHAS(1)-25 minus item 16;
TCHAS(1)-28, which is TCHAS(1)-24 plus four item; and TCHAS(1)-29, which
is a composite of all items in TCHAS(1)-25 and TCHAS(1)-28. A more detailed
description of the several TCHAS forms can be found in Appendi:I. II. The author
presently uses only the TCHAS(1)-29, since it has :! advantage of being
scored in a number of ways, depending upon the kind o; t.:a,:hers being
studied. The correlations among the four scorings for the TCHAS(1)-29
for preservice teachers ranged from .998 to .98 for one group of 30 student
teachers and from .98 to .996 for a second group of 36 preservice teachers.
See Appendix XII for greater detail. These correlations indicate that, for
the study of preservice teachers, it makes little difference which form of
the TCHAS is used.
Lack of data prohibits the making of an analogous statement about inser-
vice teachers.
It is important to note here that the use of the Teaching Anxiety Scale
should be restricted to research questions at this stage in its development.
It would be inappropriately used as a basis for selection, diagnosis or
evaluation of individual teachers.

3
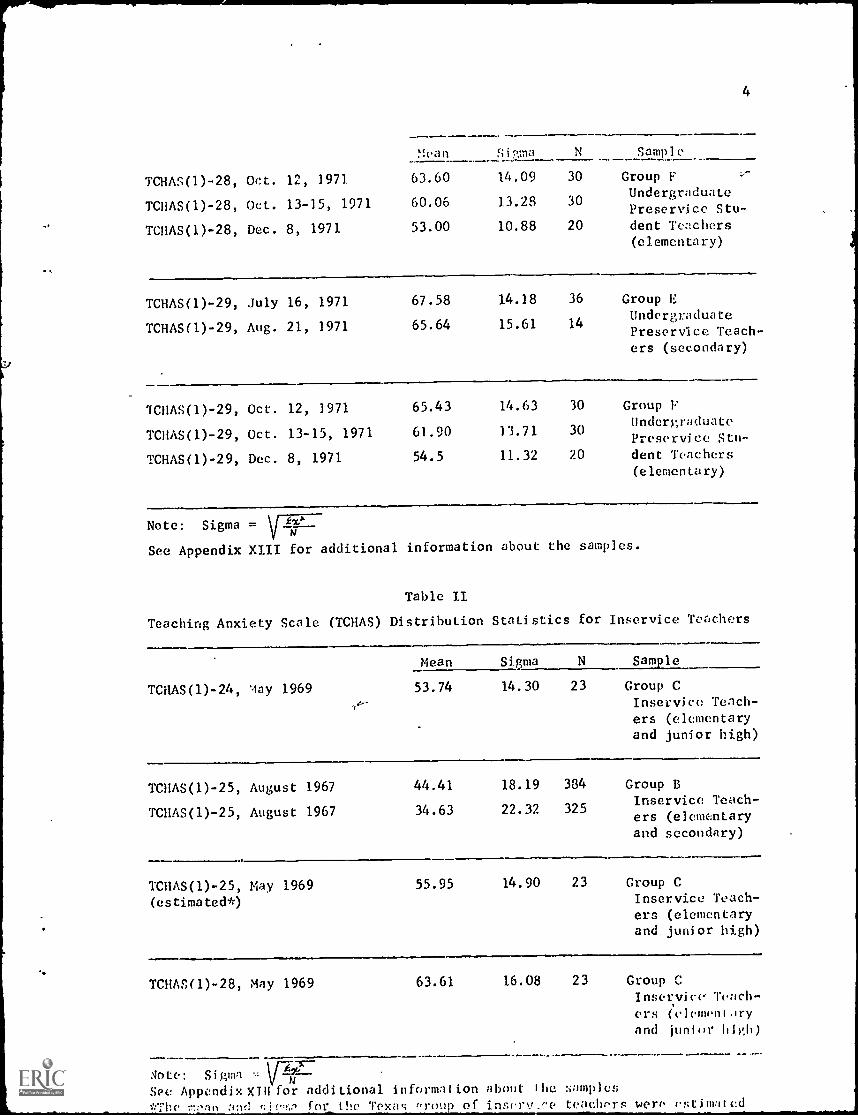
II. TEACHING ANXIETY SCALE DISTRMT1ON STATISTICS
The TCHAS distribution statistics are presented in two tables. Table 1
contains the information for preserviee teachers; Table II contains analogous
information for inservice teachers.
Table
Teaching Anxiety Scale (TCHAS) Distribution Statistics for Preservice Teachers
TCHAS(1)-25, June 1966
TCHAS(2)-25, June 1966
TCHAS(1)-25, August 1966
TCHAS(2)-25, August 1966
Mean Sigma Samiale
62.62
60.20
56.78
54.74
13.42
13.46
12.26
12.77
55
55
55
55
Group AGraduate Preser-vice InternTeachers (secon-dary)
TCHAS(1)-25, February 1970
TCHAS(1)-25, May 1970
63.38
58.14
12.01
12.32
71
64
Group DUndergraduatePreservice Teach-ers (secondary)
TCHAS(1)-25, July 16, 1971
TCHAS(1)-25, Aug. 21, 1971
56.00
55.28
12.66
13.84
36
14
Group EUndergraduatePreset-vice Teach-
ers (secondary)
TCHAS(1)-25, Oct. 12, 1971
TCHAS(1)-25, Oct. 13-15, 1971
TCHAS(1)-25, Dec. 8, 1971
55.46
52.20
46.40
12.74
11.80
10.14
30
30
20
Group F
UndergraduatePreserviceStudent Teachers(elementary)
TCHAS(1)-24, July 16, 1971
TCHAS(1)-24, Aug. 21, 1971
TCHAS(1)-24, Oct.12, 1971
TC1iAS(1)-24, Oct. 13-15, 1971
TCHAS(1)-24, Dec. 8, 1971
TCHAS(1)-28, July 16, 1971
TCHAS(1)-28, Aug. 21, 1971
53.61
52.64
53.63
50.36
44.90
65.19
63.00
11.78
13.62
12.19
11.36
9.74
13.32
15.38
36
14
30
30
20
36
14
Group EUndergraduatePreservice Teach-ers (secondary)
Group FUndergraduatePreservice Stu-dent Teachers(elementary)
Group EUndergraduatePreservice Teach-
ers (secondary)
4
Mean Sigma N Sample
TCHAS(1)-28, Oct. 12, 1971 63.60 14.09 30 Group F :,-
TCHAS(1)-28, Oct. 13-15, 1971 60.06 13.28 30UndergraduatePreservice Stu-
TCHAS(1)-28, Dec. 8, 1971 53.00 10.88 20 dent Teachers(elementary)
TCHAS(1)-29, July 16, 1971 67.58 14.18 36 Group E
TCHAS(1)-29, Aug. 21, 1971 65.64 15.61 14UndergraduatePreservice Teach-ers (secondary)
TCHAS(1)-29, Oct. 12, 1971 65.43 14.63 30 Group F
TCHAS(1)-29, Oct. 13-15, 1971 61.90 13.71 30UndergraduatePreservice Stu-
TCHAS(1)-29, Dec. 8, 1971 54.5 11.32 20 dent Teachers(elementary)
Note: Sigma =
See Appendix XIII for additional information about the samples.
Table II
Teaching Anxiety Scale ('CHAS) Distribution Statistics for Inservice Teachers
TCIIAS(1) -24, ay 1969
Mean Sigma N Sample
53.74 14.30 23 Croup CInservice Teach-ers (elementaryand junior high)
TCHAS(1)-25, August 1967
TCIIAS(1) -25, August 1967
44.41
34.63
18.19
22.32
384
325
Group BInservice Teach-ers (elementaryand secondary)
TCHAS(1)-25, May 1969(estimated*)
55.95 14.90 23 Group CInservice Teach-ers (elementaryand junior high)
TC11AS(1)-28, May 1969 63.61 16.08 23 Group CInservice Teach-
ers (elemenldryand junior high)
.rNote: Sigma -=
Sec! Appendix Mil for add i tiona 1 inform:I t ion about Ihe samples
mrsrm and sifa", for the Texas .Protip of inscrv.e teachors wen, osiimatod

5
TCHAS(1)-28, Oct. 12, 1971
TCHAS(1)-28, Oct. 13-15, 1971
TCHAS(1)-28, Dec. 8, 1971
Mean Si ma N Sample
63.60
60006
53.00
14.09
13.28
10.88
30
30
20
Group FUndergraduatePreservice Stu-dent Teachers
(elementary)
TCIIAS(1) -29, July 16, 1971
TCHAS(1)-29, Aug. 21, 1971
67.58
65.64
14.18
15.61
36
14
Group E
UndergraduateP-P,'ervice Teach -
;secondary)
TCHAS(1)-29, Oct. 12, 1971
TCHAS(1)-29, Oct. 13-15, 1971
TCHAS(1)-29, Dec. 8, 1971
65.43
61.90
54.50
14.63
13.71
11.32
30
30
20
Group FUndergraduatePreservice Stu-dent Teachers(elementary)
Note: Sigma = Ftt2--
See Appendix XHI tor additional information about the samples.
,
..
6
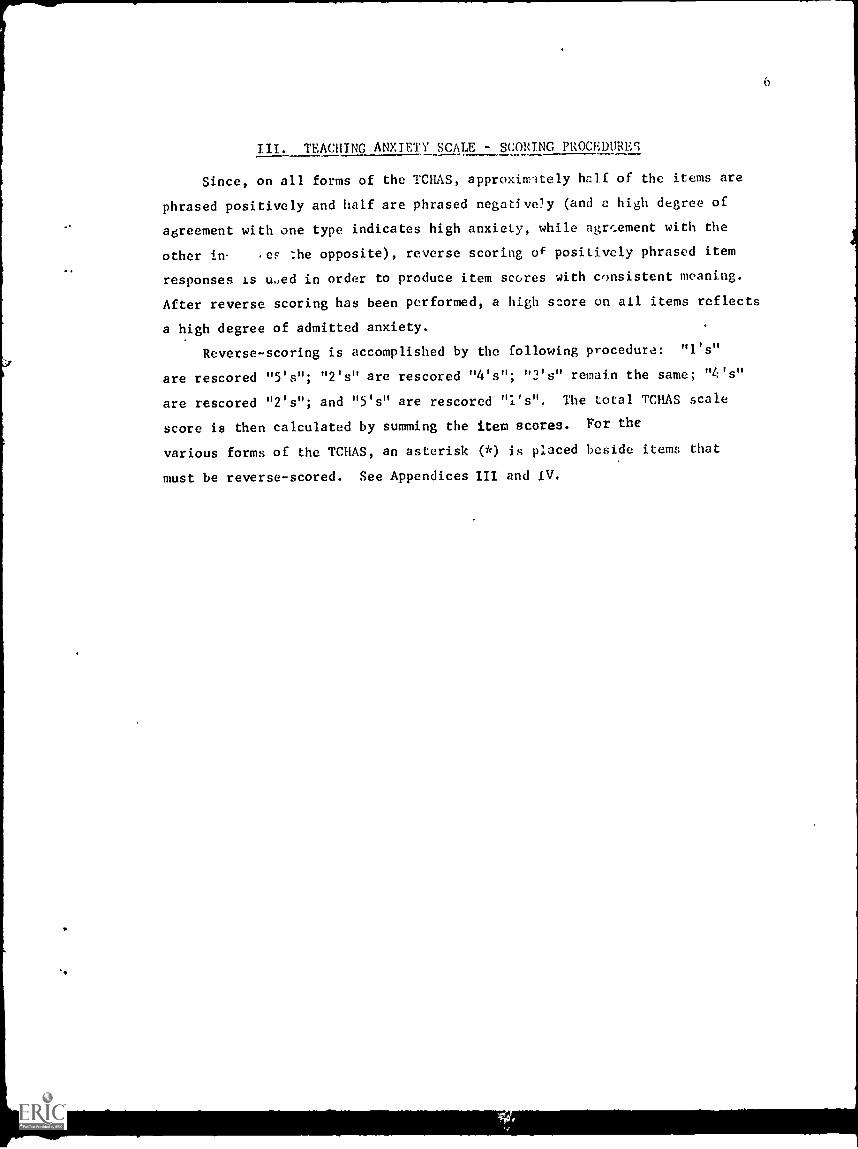
III. TEACHING ANXIETY SCALE - SCORING P1tOCEDURE9
Since, on all forms of the TCHAS, approximately half of the items are
phrased positively and half are phrased negatively (and a high degree of
agreement with one type indicates high anxiety, while agreement with the
other in. es :he opposite), reverse scoring of positively phrased item
responses is u.ed in order to produce item scores with consistent meaning.
After reverse scoring has been performed, a high store on all items reflects
a high degree of admitted anxiety.
Reverse-scoring is accomplished by the following procedure: "l's"
are rescored "5's"; "2's" are rescored "4's"; "3's" remain the same; "4's"
are rescored "2's"; and "5's" are rescored "i's". The total TCHAS scale
score is then calculated by summing the item scores. For the
various forms of the TCHAS, an asterisk (*) is placed beside items that
must be reverse-scored. See Appendices III and IV.

7
IV. RESPONSE BIAS AND THE TEACHING ANXIETY SCALE
The fact that a great many personality instruments correlate highly (11)1
though they purport to measure different personality attributes, has lead .
numerous psychologists to study possible artifacts which might spuriously
inflate these inter-measure correlations. Their investigations have centered
attention upon previously unsuspected similarities among subjects, similarities
among measures, and some combination of these two. Such similarities have been
referred to as "response bias." One source of response bias that has been hy-
pothesized and studied is "acquiescent set" (17). Acquiescent set refers to
the tendency of subjects to agree to the same degree with all statements on
self-report measures, regardless of item content. One way to overcome the
possible effects of acquiescent set is to reverse score approximately half of
the items on a given measure, so that the same degree of agreement or dis-
agreement, per se, does not systematically influence personality attribute
scores. As already discussed, in all forms of the TCHAS, approximately half
the items are worded so that they require reverse-scoring. Thus, any system-
atic response bias due to the tendency to agree or disagree will tend to be
cancelled out in the total TCHAS score.
A second source of response bias which has been hypothesized and studied
by psychologists is "social desirability"(11). Social desirability, or SD,
refers to the tendency on the part of subjects to characterize themselves
consistently in socially desirable or socially undesirable terms.
The presence of acquiescent set and social desirability have very different
implications for the TCHAS. It is desirable to eliminate the effects of
acquiescent set on the TCHAS because there appears to be no logical connection
between acquiescent set and anxiety. That is, being high or low in anxiety
does not imply anything about the degree to which a person responds acqui-
escenly,and vice versa. On the contrary, characterizing oneself as high in
anxiety or low in anxiety does imply something about the characterization of
oneself in socially desirable or undesirable terms. American culture views
anxiety as a negative attribute. Thus, a scale purporting to measure anxiety
which is entirely free of social desirability is probably not measuring; anxiety
as it is commonly understood, Therefore, instead of trying to construct a
teaching anxiety measure that is free from social desirability, the TCHAS was

8
simply studied in relation to social desirability. In order to do
this, social desirability scores were obtained for all subjects following
the procedure explained in Appendix VI. These scores were usedynot to
determine whether the TCHAS was influenced by social desirability, but rather
to determine the extent to which the TCHAS was influenced.
As was expected, the twelve correlations between the TCHAS(l,2)-25 and
social desirability, ranging from -.17 to -.47, were consistently negative.
However, the fact that only two correlations reached statistical significance
indicates that the degree of SD in the TCHAS(1,2) -25 is probably as low
as can be expected. A complete table of these correlations is presented
in Appendix VI.
1

9
V. TEACHING ANXIETY SCALE RELIABILITY
Internal Consistency
The alpha coefficients of internal consistency for the TCHAS, which can
be thought of as the average of all possible split half reliabilities (6)
are found in Table III. All coefficients indicate that the internal consis-
tency of the TCHAS is high.
Table III
Coefficients of Internal Consistency (Alphas) for the Teaching Anxiety Scale
(TCHAS)
TCHAS Version Admin. Date Al h Sample
TCHAS(1)-25,
TCHAS(1)-25,
July 16, 1971
August 21, 1971
.90
.94
36
14
Group EUndergraduate Preser-vice Teachers (secondary)
TCHAS(1)-25,
TCHAS(1)-25,
TCHAS(1)-25,
October 12, 1971
October 13-15, 1971
December 8, 1971
.92
.92
.91
30
30
20
Group FUndergraduate Preser-vice Student Teache.is(elementary)
TCHAS(1)-24,
TCHAS(1)-24,
July 16, 1971
August 21, 1971
.90
.94
36
14
Group EUndergraduate Preser-vice Teachers (secondary)
TCHAS(1)-24,
TCHAS(1)-24,
TCHAS(]) -24,
October 12, 1971
October 13-15, 1971
December 8, 1971
.91
.91
.91
30
30
20
Group FUndergraduate Preser-vice Student Teachers(elementary)
TCHAS(1)-25,
TCHAS(1)-25,
TCHAS(1)-25,
TCHAS(1)-25,
June 1966
August 1966
June 1966
Auglist 1966
.92
.92
.92
.93
55
55
55
55
Group AGraduate PreserviceIntern Teachers (secon-dary)
TCHAS (1)-25,
TCHAS(2)-25,
August 1967
August 1967
.87
.87
279
279
Group BInservice Teachers(elementary and secondary)

10
TCHAS Version Admin. Date Alpha h Sample
TCHAS(1)-25, Fall, 1969 .88 79 Group DUndergraduate Preser-vice Teachers (secon-dary)
TCHAS(1)-28, 1969 .93 23 Group CInservice Teachers(elementary and junior
high)
TCHAS(1)-28, July 16, 1971 .90 36 Group ErUndergraduate Prese-
TCHAS(1)-28, August 21, 1971 .94 14 vice Teachers (secon-dary)
TCHAS(1)-28, October 12, 1971 .91 30 Group F
TCHAS(1)-28, October 13-15, 1971 .92 30Undergraduate Preser-vice Teachers (elemen-
TCHAS(1)-28, December 8, 1971 .90 20 Lary)
TCHAS(1)-29, July 16, 1971 .90 36 Croup E
TCHAS(1)-29, August 21, 1971 .94 14Undergraduate Preser-vice Teachers (secon-dary)
TCHAS(1)-29, July 16, 1971 .92 30 Group F
TCHAS(1)-29, October 13-15, 1971 .92 30Undergraduate Preser-vice Student Teachers
TCHAS(1)-29, December 8, 1971 .90 20 (elementary)
Note: See Appendix Xiii for additional sample information.

11
Stability
The stability of a measure is generally represented by a Pearson Product
Moment test-retest correlation. The assumption underlying this interpreta-
tion is that nothing is expected to occur in the lives of the subjects be-
tween the two testings that would change their attitudes toward teaching
and, thus, that the attribute being measured by the TCHAS will remain rela-
tively stable. Most of the subjects in Table IV do not meet this criterion.
Even a brief period in the life of a preservice teacher who is undergoing
initial teaching experiences might be expected to result in idiosyncratic
change in his feelings about, and attitudes toward, teaching. Since the
assumption underlying the interpretation of test-retest correlations as
stability coefficients cannot be met when as much as several weeks intervene
in the life of a preservice teacher between testings, most of the correla-
tions in Table IV do not qualify as stability coefficients. For one group,
however, the assumption is met. This group of 30 University of Texas under-
graduate female students was administered the TCHAS(1)-29 in their super-
visory seminars. A second copy in a stamped and addressed envelope was given
to each student teacher with the instruction to fill it out the next day and
mail it to the researcher. The time of the second administration varied
between one and three days after the initial administration. As can be seen
in Table IV, the test-retest stability coefficients (all .95) for this
group are very high, despite the fact that the two administrations occurred
under different conditions.

1?
Table IV
Teaching Anxiety Scale (TCHAS) Test-Retest Information
TCHAS Version Time between Test-Retest N Sample
Administrations Correlations*
TCHAS(1)-24 1-3 days .95 30 F
TCHAS(1)-25 1-3 days .95 30 F
TCHAS(1)-28 1-3 days .95 30 F
TCHAS(1)-29 1-3 days .95 30 F
TCHAS(1)-24 1 month .87 14 R
TCHAS(1)-25. 1. month .87 14 E
TCHAS(1)-28 1 month .81 14 E
TCHAS(1)-29 1 month .83 14 E
TCHAS(1)-24 2 months .83 14 F
TCHAS(1)-25 2 months .84 14 F
TCHAS(1)-28 2 months .83 14 F
TCHAS(1)-29 2 months .84 14 F
TCHAS(1)-25 2 months .61 55 A
TCHAS(2)-25 2 months .60 55 A
TCHAS(1)-25 4 months .73 59 1)
Note
le
t
See Appendix XIII for additional sample information
Pearson Product Moment

p
13
Vt. VALiDLTY
Validation of the TCHAS falls under the rubric "construct validation."
Construct validation is a measurement strategy which correlates an hypothe-
sized psychological construct (trait) to related constructs (traits) in an
attempt to discover the common and unique components among them. Four
assumptions underlie construct validation:
a. The construct does exist.
b. At least some aspect of the construct is measurable.
c. The instrument being used does, in fact, measure some aspectof that construct.
d. The construct as measured by the instrument is related f-o other
variables.
Confirmation of an hypothesized construct lends support to each those
underlying assumptions. Lack of confirmation, however, is much c 're eiffi-
cult to interpret. The researcher himself is faced with deciding
which, if any, of the assumptions have not been met.
The objective in applying the construct validation strategy to teaching
anxiety, as measured by the MIAS, is to build a nomological network (8) of hypo-
theses about the relationship of teaching anxiety to a variety of other obser-
vable behaviors. The evidence for the construct validity of the TCHAS dis-
cussed below is organized into the following categories: component analysis,
group differences, internal structure, and change over time.
Component Analysis
Perhaps the most obvious expectation about teaching anxiety is that it
should be related to other kinds of anxiety, i.e., both to situation-specific
anxiety and to general anxiety. To test this hypothesis, the TCHAS was cor-
related with two other paper-and-pencil, self-report measures of anxiety.
These measures were the Taylor Manifest Anxiety Scale (36) and the Test Anxiety
Scale(28). As can be seen in Table V, the TCHAS(1,2)-25 and HAS (administered
concurrently) were correlated between .30 and .45 (p.4.05). The TCHAS(1,2)-25
and the TAS, administered one month apart, were also moderately correlated.
These consistently positive and predominantly significant correlations indi-
cate that the TCHAS shares common variance with both the HAS and the TAS.

Table V
Correlations between the Teachiu-4 Anxiet; Scaleand other Self-Report Anxiety Scales
MAS MAS TAc:
June
1966
Aug.
1966
July
1966
TCHAS(1)-25, June 1966 .40* .30* .25
TCHAS(2)-25, June 1966 .45* .31* .28*
TCHAS(1)-25, August 1966 .33* .31* Al*
TCHAS(2)-25, August 1966 .31* .50* .34*
* p < .05. N = 55 (Group A)
It was also hypothesized that anxiety about teaching can be detected by
an external human observer. To test this hypothesis, 25 doctoral candidate
teaching supervisors completed 19 TCHAS items about each of their gradu-
ate student preservice intern teachers. Analogously, ea:h preservice intern
teacher completed these items about himself. For example, the teaching super-
visors responded to the item: "This intern feels uncomfortable when he
speaks before a group,' and the preservice intern teacher responded to the
item: "I feel uncomfortable when I speak before a group." Elevea of the
19 resulting validity coefficients, which ranged from .24 to .54, were signi-
ficant (p<.05). (See AppendixVIffor greate: detail.) This evidence suggests
that, to 'at least some degree, the teaching anxiety reported on the Teaching
Anxiety Scale by these preservice teachers corresponds to what the teaching
supervisors perceived to be teaching anxiety in their preservice intern
teachers.
Component validation appears in forms more complex than those discussed
above. Interest in two lines of research has increased during the past two
decades. The first deals with the study of subcomponents within the component
shared by two constructs. The second deals with the component of a construct
which is unique with respect to other measured constructs.
Subcomponents within the shared component. Campbell and Fiske (4)
suggest a technique that permits the researcher to determine whether his
validity coefficients (the correlations between a single trait measured by
two or moredifferent methods) are unduly influenced by such peripheral varies
ables as 1) the ability to understand and respond accurately to certain

15
types of measurement instruments and 2) the tendency to respond to all mea-
sures in a socially desirable manner. The presence of the first kind of
peripheral variable is indicated in the correlation between two or more
different (and preferably unrelated) traits measuced by a single method,
referred to here as heterotrait-monomethod coefficients. The presence of
the second kind of peripheral variable is indicated in the correlation
between different traits measured by different methods, ceferted to as
heterotrait-heteromethod coefficients.
The Campbell-Fiske technique requires that the validity coefficient
(the monotrait-heteromethod correlation) be higher than either the heterotrait-
monomethod coefficients or the heterotrait-heteromethod coefficients. In
relationship to the TCHAS(1) 25, this means that the correlation between
teaching anxiety measured by the TCHAS(1)-25 and teaching anxiety measured
by the ASR (.62) be higher than either the correlatioa between teaching
anxiety measured by the TCHAS(1)-25 and general anxiety as measured by the
Taylor Manifet Anxiety Scale (.38) or the correlation bLtween teaching
anxiety measured by the TCHAS(1)-25 and general anxiety measured by the
ASR (.31). As can be seen, the validity of the TCHAS(1)-25 meets the cri.-
teriasuggested by Campbell and Fiske. A complete description of this pro-
cedure as applied to the TCUAS(1) -25 can be found in Appendix VII. (See
Appendix X for a copy of the Anxiety Self Report (ASR).)
Unique Components. Cronbach suggests a procedure (7) for determining
the size of the component of a measured construct which is unique from other
measured constructs. The size of the unique component (which includes both
method and trait similarities between a set of two measures) must be high
enough to support the existence of a separate trait. As can be seen by the
detailed description in Appendix IX, 76% and 86% of what the TCHAS(1)-25
measures is reliable (error-free) and independent of what is measured by the
MAS and the TAS, respectively. It is within this unique component that the
construct teaching anxiety appears to reside. See, also, page 16 for further
information relevant to the component unique to teaching anxiety as measured
by the TCHAS(1)-25.
Group Differences. In an earlier study by Parsons (25) "most anxious"
and "least anxious" groups of graduate-student, preservice, intern teachers
were selected upon the basis of teaching supervisor opinion. Each of 25
supervisors was asked to list the five or fewer preservice teaching interns
in the entire program (N = 120) who appeared to be "most anxious about teaching"
itt

16
and those iive or fewer who appeared to be "least anxious about teaching."
As hypothesized, the "most anxious" group had a significantly higher TCHAS
mean score (77.1) than did the "least anxious" group (62.1). This analysis
adds another increment of support to the validity of the TCHAS as a measure
of anxiety about teaching.
Table VI
Difference in Teaching Anxiety*for Groups Rated "Most Anxious" and"Least Anxious" about Teaching
Groupings According toSupervisor Ratings N Mean Sigma
"High Anxious" 31 77.1 17.8
"Low Anxious" 49 62.1 17.0
Difference 15.0
Note: t = 3.8
DF = 78p.005
*This 29 item TCHAS version contains only negatively phrased items, 19of which presently appear in either TCHAS(1)-25 or TCHAS(2)-25, but not
in both.
Internal Structure
In studying the initial TCHAS item pool, it appeared that anxiety about
teaching might comprise several elements, such a anxiety about being
evaluated, anxiety about maintaining discipline, and anxiety about being able
to teach effectively. However, the alpha coefficients of internal consistency
are high (.87-.93), suggesting that teaching anxiety, as measured by the
TCHAS, is a unitary variable. See Table IV.
In order to check further on the internal consistency of the Teaching
Anxiety Scale, two factor analyses were run. If the TCHAS is a unitary scale,1
as the high alphas indicate, then most of the items should load most heavily
upon a single factor. When the TCHAS(1)-25 for 503 preservice and inservice
teachers (Groups A, D, E, and F) was factor analyzed, 22 of the 25 items
loaded most heavily on Factor 1 as was expected. The other three (items 3, 17,
and 22) loaded separately most heavily upon three other factors.

Two possible explanations for why th(sc three it,m1s evoked responses
dissimilar Jrom those evoked by the other 22 items were considered. The
first, that preservicc teachers might respond to certain items differently
(with respect to the majority of items) from the wry in which inservice
teachers respond to them, was investigated by comparing the TCHAS(1)-25 item-- -
total correlations for preservicc teachers (Croups A,D,E,F) with those for
inservice teachers (Croup 13). Significantly diff'_trent item-total correlations
for the two groups would provide support ior, this explanation. Only the item
22--TCHAS(1)-25 total correlation supported the suggestion that preservice
teachers view this item differently from the way in which inservice teachers
view it. The item-total correlation for preservice teachers (N = 199) was .43;
the analogous correlation for inservice teachers (N = 383)was .27. The test
that these two correlations (based upon independent samples) are the same
produced a z score of 2.08, indicating that the two cor-elations are signi-
ficantly different from each other (p-1(.05, too-tailed test).
The second possible explanation, that item phrasing may be confusing to
subjects refers only to item 22 and can be evaluated by the individual re'ear-
cher who is interested in using the Teaching Anxiey Scale.
In order to investigate the relationship of items 26-29 toactor 1,
a second factor analysis was performed for all subjects (N = 65 preservice
teachers) who had taken the TCHAS(1)-29. Since the N is vevi small for a valid
factor analytic study, the results provide only tentative evidence. Each
of these four items load most heavily upon factors other than Facto: 1. The
only pattern, however, is that items 27 and 28 load on a single "other"
factor.
In summary, it is suggested that the researcher who is interested in a
pure single factor scale of teaching anxiety use a "new" scale--the TCHAS(1)-22,
defined as the TCHAS(1)-25 minus items 3, 17, and 22.
Change over Time
Several studies support the hypothesis that, as measured by both the
TCHAS(1,2)-25 and the TCHAS(1)-29, anxiety about teaching consistently de-
creases over the passage of time for preservice teachers. Parsons (25)
found that for a group of 17 male and 38 female graduate-student preservice
intern teachers (Group A) undergoing their initial summer of teacher prepara-
tion (which involved icro-teaching), the mean TCHAS score decreased signifi-
cantly over a two-month period. Emmer (12) noted significant mean TCHAS
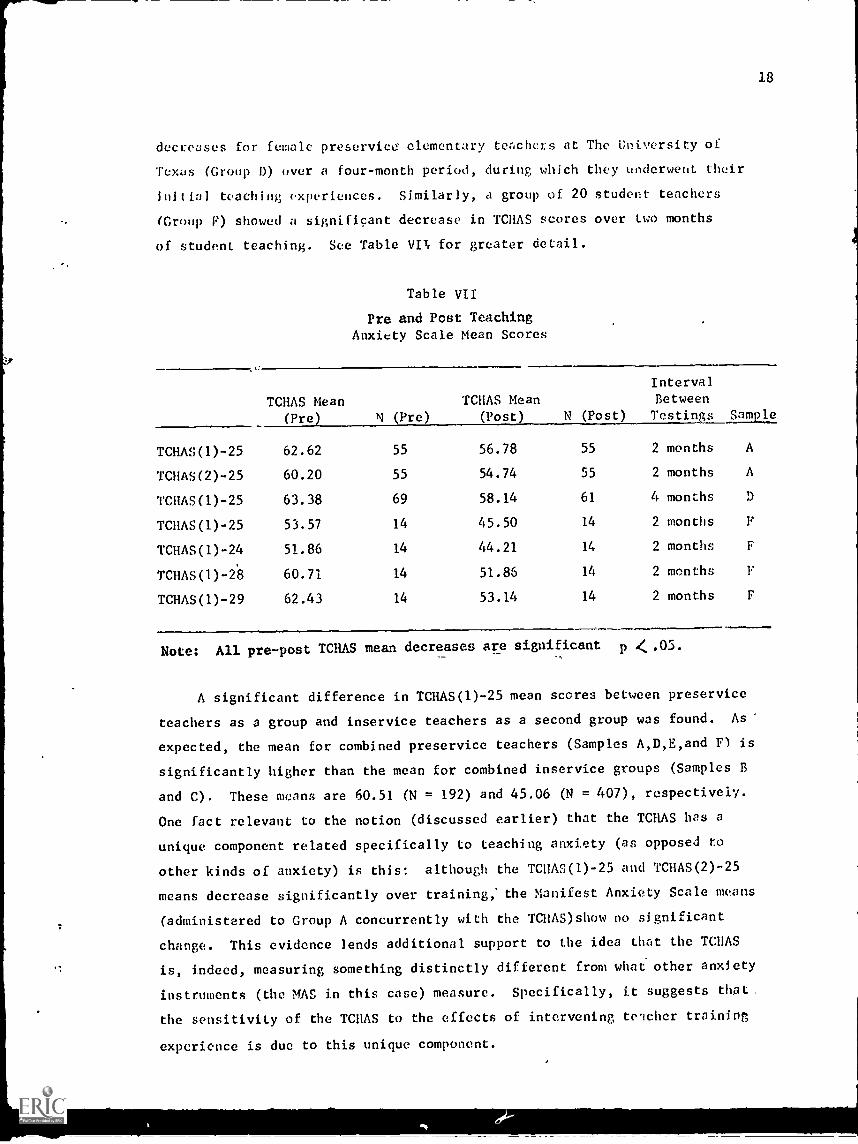
18
decreases for female preservice elementary te;',chers at The University of
Texas (Group D) over a four-month period, during which they underwent their
Initial teaching experiences. Similarly, a group of 20 student teachers
(Group F) showed a significant decrease in TCHAS scores over two months
of student. teaching. See Table VITr for greater detail.
Table VII
Pre and Post TeachingAnxiety Scale Mean Scores
TCHAS Mean(Pre) N (Pre)
TCHAS Mean(Post) N (Post)
IntervalBetweenTestings Sample
TCHAS(1)-25 62.62 55 56.78 55 2 months A
TCHAS(2)-25 60.20 55 54.74 55 2 months A
TCHAS(1)-25 63.38 69 58.14 61 4 months D
TCHAS(1)-25 53.57 14 45.50 14 2 months F
TCHAS(1)-24 51.86 14 44.21 14 2 months F
TCHAS(1) -28 60.71 14 51.85 14 2 months F
TCHAS(1)-29 62.43 14 53.14 14 2 months F
Note: All pre-post TCHAS mean decreases are significant p
A significant difference in TCHAS(1)-25 mean scores between preservice
teachers as a group and inservice teachers as a second group was found. As
expected, the mean for combined preservice teachers (Samples A,D,E,and Fl is
significantly higher than the mean for combined inservice groups (Samples B
and C). These means are 60.51 (N = 192) and 45.06 (N = 407), respectively.
One fact relevant to the notion (discussed earlier) that the TCHAS has a
unique component related specifically to teaching anxiety (as opposed to
other kinds of anxiety) is this: although the TCHAS(1)-25 and TCHAS(2)-25
means decrease significantly over training; the Manifest Anxiety Scale means
(administered to Group A concurrently with the TCHAS)show no significant
change. This evidence lends additional support to the idea that the TCHAS
is, indeed, measuring something distinctly different from what other anxiety
instruments (the MAS in this case) measure. Specifically, it suggests that.
the sensitivity of the TCHAS to the effects of intervening teeher training
experience is due to this unique component.

19
VII. SUGGESTED USES Of THE TEACHING ANXIETY SCALE
Formal Use of the TCHAS------
Formal use of the Teaching Anxiety Scale should be restricted to research
questions at this stage in its development and should not be used as a basis
for selection, diagnosis or evaluation of individual teachers. It is suggested
that several clusters of research questions appear to be appropriate areas
in which to use the TCHAS.
1. The first cluster deals with the relationship of anxiety to the
acquisition of skills related to teaching.
a. Is there a significant relationship between anxiety about
teaching and the acquisition of skills related to teaching?
b. If such a relationship is found to exist, is it linear or
curvilinear in nature?
2. The second cluster deals with the possible patterns of item change
over time (during teacher training). Even though the TCHAS internal consis-
tency is high, it is still possible that, over subjects, responses to some
items may change to a greater degree than do responses to other items.
Suppose, for example, (1) that in their initial teaching experiences, most
preservice teachers feel anxious about certain types of situations; and (2)
that, with experience these anxieties decrease markedly. If this were the
case, preservice teacher initiates could be told with assurance that in
view of the fact that most preservice teachers studied felt that way at
first, they should not be overly worried over concern about these types
of situations. Further, they could be reassured that experience in teaching
would probably decrease these worries a great deal just as it did for most
of the other preservice teachers studied.
3. The third cluster of research questions centers around deliberate
acts of intervention for the purpose of changing the subject in a specific
way. Two kinds of criteria for change can be considered. The first kind,
in which the effectiveness of the intervention--be it group or individual
therapy, desentization, help in the acquisition of teaching-related skills
or other-is evaluated on the basis of the pre-post changes (decreases) in
measured anxiety. In the second kind, the success of intervention is evalu-
ated not upon changes in anxiety, but upon differential changes in skills.
It is predicted by Sieber and others that anxiety level is related to skill
acquisition (29,30). For Sieber)the aim of intervention is not to decrease

anxiety per se (though this may occur), but, rather, to enhance the coping
skills of all subjects. She has found that greater gains in certain kinds
of skill acquisition resulting from intervention will be made by high-
anxious than by low-anxious subjects.
Informal Use of the TCHAS
Several informal uses of the TCHAS that are appropriate in its present
state of development arc suggested below:
l. The study of item frequency distributions from anonymous preierviceTCHAS protocols by preservice teachers, instructors and othersinvolved in training teachers.
2. The use of completed or blank TCHAS protocols by preserviceteachers and professional staff members working together to pinpointindividual preservice teacher strengths and weaknesses.
3. The use by preservice teachers of TCHAS item score changes as indi-cations of landmarks passed on the road to becoming a teacher.
20

21
VIII. SUMI.LAItY
To date, the nomological network of confirmed hypothes,_s surrounding
the teaching anxiety construct, as measured by the TCHAS, is limited, but
what is there appears to be logically consistent. Briefly, what is known
about the TCHAS as a measure of teaching anxiety follows. It has been
shown (1) that the TCHAS is a measure of anxiety; (2) that the TCHAS measures
reliably some quality distinct from what either the MAS or TAS measures;
(3) that the TCHAS is stable (.95) over short periods of time; (4) that the
validity of the TCHAS is not merely an artifact of similarities in method
measurement; (5) that preservice teacher responses to the TCHAS are related
significantly to the behaviors of these preservice teachers as observed and
interpreted by their teaching supervisors; (6) that teaching anxiety as
measured by the TCHAS is a unitary variable; and (7) that over several
studies, anxiety measured.by the TCHAS consistently decreases as experi-
ence in teaching increases.

22
APPENDIX I
SINGLE VERSUS EQUIVALENT FORMS OF THE TEACHING ANXIETY SCALE
This appendix deals with the question "Are equivalent forms of the TCHAS
necessary or even desirable?" Equivalent forms of a single measure are two
or more instruments for which the raw scores haw.. the same meaning. Equiva-
lent forms (of a single measure) are useful when aa investigator wishes to
blot out the effects of memory of the pre -test experience on retest perfor-
mance. Several kinds of learning experiences might distort retest scores by
increasing speed and accuracy. These include (1) general familiarity with
item format; (2) recall of information in specific passages;* and (3) use o;
specific techniques, i.e., reading the questions prior to reading the passage
about which they are asked, not pausing long in answering questions that seem
difficult, guessing. Basically, two types of measures are affected by these
practice effects: (1) timed measures; and (2) measures which require answers
about specific passages, such as achievement or intelligence tests.
It is suggested here that alternate forms of the TCHAS are neither
necessary nor desirable. There is no reason to believe that prz,ctice effects
and recall of specific content affect TCHAS retest scores in any way
that is relevant to the construct being measured. Specifically, increase in
speed of responding due to practice should have no effect upon the TCHAS
scores because the TCIIAS is not a timed measure. Since the format in both
forms (rCHAS(1)-25 and TCHAS(2)-25) is identical, increases in speed and
accuracy due to familiarity with the question format should be equal, no
matter which form was administered first. Similarly, specific item recall
does not seem to be an issue, since the two forms cuntain very similar
content. Although subjects do recall item content, the differences in phras-
ing (which is the primary difference between the two forms) appear to go
unnoticed, even when the two forms are administered with little time interven-
ing between them. This notion is supported by one study (26) in which subjects
who were asked to complete TCHAS(1)-25 and TCHAS(2)-25 three hours apart
expressed annoyance at being asked to complete the "same" questionnaire
twice.
In addition to arguments presented In the previous paragraph, there is
another reason for caution in using both TCHAS forms in preference to repeat-
ing a single form. Tt is not clear that the two forms are "equivalent" in
the strict sense of the word (correlation at or near 1.0) . Analysis of one

ADDEZUg Fo 1973 AERk PAPER, p. 2
"K.01;3=T OF AUJEfY A.30UT VAC:11'1G U:.;1 11G THE TEAC:J.:G AU1ETY 3CALT.3:
UEUAL I'21OT" by Jane Parsons
Addition:: (continued)
Additional Tg:A3(1)-25 Distribution Inforion: Froquoncy Polygon for Group
16
15
14
13
12
11
10
9
8
oiU e t) 7 I' t
, tCr %
Cl) ork U
%.
11- or %
%
I/.%
5 /.
.
F
4
//4
3 //I
,
.2It
1
0
26-34 35-42 43-50 51-58 59-66 67-74 75-82 83-87
TCUS(1)-25 Scores
Juno 1966
N = 55 Rano r: 26-87
From Roforcnce (25), Fig. 1, p. 22
August 3.966 =
73777773
A

11 A=;111,31:T OF Z.:X1.7,1.Y. nAC71.:%; T."LC:11':G J'27.P;TY SCAL:
auto i'1 by J. Persons
Corrections
ELL' '11
11, line 6
20, line 3
32, Table VIII
351
Chaqm
"criterion" should road "ae:umption"
"will he" should. read "are"
"Test. Aridity Qeeetionneire" and "TAB;" shouldread "Test Anni.et,;,- Sea] a" and "TO"
It // .05" should read "p < ,05"
lines 2 and 23 Reference "(2)" should reed "(4)"
38, lAne 1 Reference "(4)" should reed "(7)"
Additicns
See Reference (25) for the following further information )1.)oet the TeachingAir iety Scale for Group A, 13..55.
1. TCHAS(1,2)-25 total score distribution% (p, 23)
2. TCHAS(1,2)-25 item-total correlat:Ione (pp. 2425)
3. TCNAS(1,2)-25 ite.1 !eeans and standarj deviation5 (pp, 19-20)
4. TCHLS(112)-25 item tomonth test -''1' teet correlations (p. 26)
During the last two Years this researcher has become inemes:in(51y invo:Iveduith the work pioneered by Frances F. Fuller on the conce:; of teachers(see references 3, 15, and 16). It is suggested here that future users ofthe Teaching Anxiety Scale might wish to add some items relevant to thethree categories (believed to be stages) of concern that have been identi-
fied: concerns about self, task, and pupils. The following items have
been constructed by Fuller, Parsons and Watkins. These ite]s can be scored
using the same response categories as do the anx:I.ety items. However, the
:waning of those scores must, of course, be dotermined in the context ofthe concerns research cited.
Items 1,4, and 6 represent concerns about !,elf ; items 3,5, and 9 represent
concerns about task; and items 2,7, aLd. 8 represent concerns about pupils.
1. I am concerned about2. I am concerned about
students,
3, I am concerned about4. I any concerned about5. I am concerned about6. I am concerned about7. I am concerned about8, I am concerned about.
9. I am concerned about
standards and regulations set for teachers.adapting myself to the needs of different
mot students to s Ludy.
maintaining the eppropriete degree of class control.Anstil]ing worthAile concepts and. values.feeling more adequate as a teacher.inecaeing students' feelings of accomplishment.slow progress o C certain pui:Als,
selecting and tebig content well.

23
study of preservicc teaching interns produced a correlation of .93
(N = 134) between the two forms administered 30 minutes apart. However,
!or a second study, using 297 inservice teachers, a correlation of
only .85 was found between the two forms administered three hours apart.

24
APPENDIX II
TEACHING ANXIETY SCALE DESCRIPTIONS
TCIIAS DEFINITION
TCHAS(1)-29 Appendix III
TCHAS(1) -28
TCHAS(1)-25
TCHAS(2)-25
TCHAS(1)-29 (Appendix III) with.item#16 omitted (but questions 17-29 re-tain the same numbers in AppendixVII).
Items 1-25 of TCHAS(1)-29 (Appendis III)
Appendix IV

APPENDIX III
THE TEACHING ANXlETY 6C4LE(TCHAS(11-2"1
Form I
(Prospective) Teacher Questionnaire Name
Date
Your answers will be kept strictly confidential. Your professors and teaching
supervisors will not have access to this information.
Instruct' as: Please read each question carefully.Answer every question, even if it seems vague to you or
difficult to answer.Mark an "x" in only one box for each question. Be sure
the "x" falls well within the box and does not extend
into another box.
Use the following scale for all questions:
Never Infrequently Occasionally Frequently
I feel calm and collected when I think
about holding parent-teacher conferences.
2. If I have trouble answering a student'squestion I (will find) find it difficultto concentrate on questions that follow.
3. I feel uncomfortable when I speak before
a group.
*4. I (would feel) feel calm (if I were) whenI am preparing lessons.
5. I'm worried whether I can be a goodteacher.
*6. I feel sure I will find teaching asatisfying profession.
eq. I would feel calm and collected if astudent's parent observed in myclassroom.
t8. I feel inferior to other preserviceteachers in my teacher preparation program.
Always
1-4
C t3
tl'0
0(7) (3)
1.

1-
Form I
*9. I feel that students will follow my
instructions.
*10. I feel secure with regard to my abilityto keep a class under control.
11. I'm less happy teaching than I thought
I'd be.
12. I feel nervous when I am being observedby my college supervisor.
*13. I feel confident about my abilityto improvise in the classroom.
*14. I feel other teachers (will think)think I'm very competent.
15. I (would feel) feel panicky when astudent asks me a question I (couldn't)can't answer.
16. I feel anxious because 1 don't knowyet whether I really want to be ateacher.
t *17. I feel better prepared for teaching thanother preservice teachers in my teacherpreparation program.
18. Lack of rapport with my students (willbe) is one of my biggest worries.
19. I would feel anxious if the principalinformed me he was coming to my classto observe.
*20. I (would find) find it easy to speak upin the staff room.
Name
Date
26
>t >%
4-1 1.1 >%c
2v ,
1.4 i0 ,T)., ,
U
Mer
,t1 A.,;..
C 1.4
:2 , <5' 44 7C
(1) (2) (3) (4) (5)
Li
I 1
. . . 1 . .. ,
. I
I I
I
n
[71
L1
f 1
]

Form I.
21. I worry about being able to keep thestudents interested in what I (will
teach) teach them.
*22. I (would find) find it easy to admitto the class that I don't know theanswer to a question a student asks.
23. Deciding how to present informationin the classroom (would make) makes
me feel uncertain.
*24. I feel I will have good recall of thethings I know when I am in front of
the class.
t*25. I feel I (will be) am as competent inthe classroom as other preserviceteachers in my teacher preparation program.
26. I'm concerned about how to use my testingof students as a useful indication ofhow effectively I'm teaching them.
27. I'm worried that differences in back-ground between my students and me
(will prevent) prevent me from teach-
ing effectively.
*28. I am certain that my own personal
"hang-ups" (will not) do not hindermy teaching effectiveness.
29. I'm uncertain whether I (will be able to)can tell the difference between reallyseriously disturbed students and thosewho are merely "goofing off" in class.
27
Name
Date
>1 >14-4 4-41.) 4-4 >1C CU .-4W C I.)3 0 CCr -I 41) U)
P el to c .a) P cu cr co> LH C.) a)a) C U .4 -4z 1-1 0 ts4 <(1) (2) (3) (4) (5)
71
I
TI 1
1 L]
I I I LI
I_J 1 H
Eli I i
Note: The following information is for the researcher and is not part of the
Teaching Anxiety Scale when it is administered to teachers;*Items that must be reverse scoredltems that require wording changes when administered to inservice
teachers: "preservice teachers in my teacher preparation program"
should be changed to "teachers in my school."

APPENDIX IV
THE TEACHING ANXITf* SCALE (TCHIS(2)-25)
Form Tl
(Prospective) Teacher Questionnaire Name
Late
28
Your answers will be kept strictly confidential. ;our professors and teachingsupervisors will not have access to this information.
Instructions: Please read each question carefully.Answer every question, even if it seems vague ,o you ordifficult to answer.Aark an "x" in only one box fot each question. Be surethe "x" falls well within the box and does not extendinto another box.
Use the following scale for all questions:
Never Infrequently Occasionally Frequent]/ Always
1. I feel uncertain about my abilityto improvise in the classroom.
*2. Even if I have trouble answering astudent's question, 1 (would find)find it easy to concentrate on questionsthat follow.
3. I (would feel) feel anxious (if I were)when I am preparing lessons.
4. I'm afraid students won't follow myinstructions.
*5. I would feel calm if the principalinformed me he was coming to my classto observe.
6. I'm afraid other teachers (will think)think I'm incompetent.
7. I feel anxious about my ability to keepa class under control.
*8. I'm happier teaching than I thought
I'd be.
> .
4.4
....c PN
C to ..14) C 4.4
0 0 CCr .44 a) m
W (1) W :..0 W 0 Q. 0
444 U WO 0 U 14
I-1 0 It.
(1) (2) (3) (4) (5)
111A
LiLi IT Li
ri1 1 LJ
LJ

Form II
t9. I feel I (will be) am less competentin tne classroom than other preserviceteachers in my teacher preparation program.
10. I (would be) am afraid to speak up in
the staff room.
ll. The thought of holding parent-teacherconferences makes me feel panicky.
*12. I feel certain I really want to be a
teacher.
*13. I feel certain about my ability tokeep the class interested in what I(will teach) teach them.
14. I (would find) find it difficult to admitthat I don't know the answer to a questiona student asks.
15. I'm worried whether I will find teaching
a satisfying profession.
t*16. I feel that I am as good as otherpreservice teachers in my teacher
preparation program.
*17. I feel at ease when I am being observedby my college supervisor.
18. I'm afraid I will forget everythingI know when I get in front of a class.
*19. I feel comfortable when I speak ber.:ea group.
*20. I (would feel) feel calm and collectedeven when a student asks me a questionI (couldn't) can't answer.
Na:ne
Date
29
....N J14-4 I1J 4'..: CI .-4C) C 4-)
U C0' ,-I c) In
14 CD V.
a.) s, co 04 cs
> 44-4 0 C) :::a) C c) s., .- -)z I) 0 r <
(1) (2) (3) (4) (5)
it
1 E
I I
I I
Ella.1110 / IN 0,
=.11.fl
ELi El

Form II Name
f21. I feel less well prepared for teachingthan other preservice-teachers in my .
teacher preparation program.
*22. I (would be) am able to decide how topresent information in the classroomwithout a feeling of uncertainty.
23. I would feel edgy and nervous if astudent's parent observed in my classroom.
*24. I feel sure I can be a good teacher.
*25. Good rapport with my students (will be)is one of my strong points.
Date
30
Wa>w
>NI-IWCW
WWw
t,i4
c
"I-Ir-IMC044Wmuu
::,'Nr.-1WCW
crww
M;'ta3
,--.1
44
(1) (2) (3) (4) (5)
I-1 Li l_i
4110,............
Ll LI EEll Li Li
I 1
F-1
1 1
Note: The following information is for the researcher and is not part ofthe Teaching Anxiety Scale when it is administered to teachers:
*Items that must be reverse scored-Items that require wording changes when administered to inservice
teachers: "preservice teachers in my teacher preparation program"should be changed to "teachers in my school."
7

31
V. TEACHING ANXIETY SCALE (TCNAS(1,2)-25)ITEM-PAIR DIRECTORY
Item No. inTCHAS(1)-25
CorrelationBetween
item No. in
TCHAS(2)-25
1 .61 11
2 .61 2
3 .40 19
4 .61 3
5 .65 24
6 .69 15
7 .83 23
8 .61 16
9 .52 4
10 .78 7
11 .39 8
12 .71 17
13 .72 1
14 .42 6
15 .61 20
16 .73 ?2
17 .44 21
18 .66 25
19 .64 5
20 .73 10
21 .57 13
22 .31. 14
23 .43 22
24 .61 18
25 .64 9
Total .95 Total
Note: N = 55 (Group A)

VI. SOCIAL 1,l's1RABILli
Social Desirabilityti:ria
Social desirability as relate-! Lo the was studied through the use
of alternatc scoring procedures fo: the Anxiety Scale (HAS) and the
Test Anxiety Scale (TAS). Severa: :ages vol.+. involved in determining the
social desirability ;coring criteria. From an examination of the frequency
distribution for each item, it possible to tell in what direction the
majority of subjects responded. That direrLion was considered the direction
of social desirability.
In the case of the TAS, which \,: +s scored along a continuum of 1 to 8,
it was decided to dichovomize scores by al:bit .1rily grouping together scoring
categories 1-4 and 5 8. The MAS s initially scored dichotomously. A
response to an item in the socially desirable direction (for both the MAS and
the TAS) was rescored "2" and a rcJTonse in thc non-socially desirable direc-
tion was rescored "1." The overall social dc..:irability (SD) scores (two for
each subject) were computed by sumling, sep,tately, SD scores based on MAS
items and TAS items.
LNG Ai ETI SCALE
32
The Relationship of Social Desirability to tb., Teaching Anxiety Scale
Of the twelve correlations ber;:een the TOAS(1,2)-25 and SD in Table VIII,
only two reached significance: -.47 and -.46. It therefore appears that
whatever is substantive about social desirabilitythat is, a component shared
in different scales--is usually not a significant determiner of the TCHAS
score.
Table VIII
Correlations Between the TCHAS(1,2)-25 and Social Desirability
MAS-SDJune 1966
MAS-SDAugust ]966
TAQ-SDJuly 1966
TCHASFormI, June 1966 -.23 -.25 -.21
TCHASForm II, June 1966 -.25 -.26 -.21
TCHASForm I, August 1966 -.20 -.47* -.21
TCHASForm II, August 196 -.17 -.46* -.21
Note: N = 55, Group A HAS = nanitest Anxiety ScaleT.0 - "' i "OviPk n.--,ti:mnaire
PtaraL

33
VII. VALIDITY DATA ON TWELVE ITEMS APPEARING IN TILE
VAGUING ANXIETY SCALE
The correlations given in this appendix express the degree of agreement
between the way 25 teaching supervisors filled out these teaching anxiety
items about their preservice teacher supervisees and the way in which the
preservice teachers filled out the items about themselves. The phrasing used
here is like that responded to by the teaching supervisors, with the preser-
vice phrasing indicated in parentheses, where it differs. In each case, the
significance level and the N are given. The N's vary as a result of missing
data. The graduate student preservice intern teachers to 4hom this instrument
was administered were referred to as "interns."
Location of Item
InN1
r-1%.,W.P1
0HH
LrlN1
C4s..."MMC.)
WN1
r-1s....
Mg0H
ON 1N1
r-1s...,Mg0H
11 8 11 11
23* 22 23* 23*
18 25* 18 18
5 24*
19 5* 19 19
21 13* 21 21
3 19*
23 22* 23 23
Item Correlation _S! N
This intern is (I am) less
happy teaching than he thought
. he'd be(I thought I would be). .54 .01 62
This intern feels (I feel) anxiousabout his ability (my ability) tokeep a class under control. .47 .01 93
Lack of rapport with his (my)students is one of this intern's(my) biggest worries. .45 .01 90
This intern is (I am) worriedwhether he (I) can be a goodteacher. .45 .01 85
This intern (I) would feel anxiousif the principal informed him (me)that he was coming to his (my) classto observe. .40 .01 . 75
This intern worries (I worry) aboutbeing able to keep the studentsinterested in what he teaches (Iteach) them. .39 .01 91
This intern feels (I feel) uncom-fortable when he speaks (I speak)before a group. .34 .01 64
This intern feels (I feel) uncer-tain about how to presentinformation in the classroom. .32 .01 94

r
Location of Item
15*
13*
ul ODO.1 0.7
1 1
oi .^4... ...
crs
g M0 c...)
H H H Item
20 15* 15* This inters, feels (I feel)
panicky when a student asks aquestion he (I) cannot answer.
1* 13 13* This intern worries (I worry)about having to improvise inthe classroom.
Correlation
.30
.26
2* 2 2 When this intern has (I have)trouble answering a student'squestion he finds (I find) itdifficult to concentrate onthe questions that follow. .24
Note: Starred locations refer to the positively phrased "equivalent"
of that item. The degree of equivalence can be assessed using
the correlations in Appendix V.
34
0 N
.01
.......
81
.02 84
.03 85

35
VIII. SUBCOMPONENTS WITHIN THE VALIDITY COMPONENT
The multitrait-multimethod validation strategy suggesited by Campbell and
Fiske (2) provides information about two kinds of validation: convergent and
discriminant. Evidence for convergent validation is provided by correlations
between two (or more) methods measuring a single trait. Evidence for discrim-
inant validity comes from two kinds of sources: correlations between different
traits measured by similar methods and correlations between different traits
measured by different methods.
Four measures were used in applying the Campbell and Fiske multitrait-
multimethod validation strategy to the TCHAS. The two measures of anxiety
specific to teaching are designated by the letter T; the two measures of
general anxiety are designated by the letter G. The TCHAS is referenced by
T1; ASR(2), an anxiety item specific to teaching,is referenced by T2. ASR
items can be found in Appendix X. The relationship between T1and T
2is
called the "monotrait-heteromethod" correlation. That is, T1 and T2 measure
the same trait but by different methods. The Manifest Anxiety Scale is refer-
enced by Gl; and ASR(4), a general anxiety item, is referenced by G2. The
relationship between GI and G2 is also called a monotrait-heteromethod cor-
relation. See Table IX. The convergent and discriminant validation analyses
are performed upon the resulting correlations among these four measures by
attempting to satisfy sequentially these three criteria.
Criterion one is that the coefficients found in the validity diagonal
(the monotrait-heteromethod correlations) should be statistically significant
and "sufficiently large to encourage further examination of validity" (2).
This criterion refers specifically to the correlation between T1and T
2which
is .62 (p4(.001). Therefore, this data satisfies criterion one, the convergent
validation criterion. Without the assurance that the convergent validity
values are adequate, there is no point in proceeding further.
Criterion two, one of the two discriminant validity criteria, is that
the monotrait-heteromethod validity coefficient should be larger than correla-
tions between measures which share neither trait nor method (heterotrait-
heteromethod correlations). Specifically, criterion two requires that the
T1-T
2monotrait-heteromethod correlation coefficient (.62) be larger than the
T1-G
2heterotrait-heteromethod correlation coefficient (.31). Criterion two
has been satisfied.

36
Criterion three, the second discriminant validity criterion, is that the
T1-T
2monotrait-heteromethod correlation coefficient (.62) should be larger
than the T1-G
1heterotrait- monomethod correlation coefficient (.38). The
criterion has been satisfied.
In summary, this technique of multitrait-multimethod matrix analysis pro-
vides information about two kinds of validation; convergent and discriminant.
The convergent validity of the TCHAS(1)-25 has been demonstrated by satisfying
criterion one. The discriminant validity of the TCHAS(1)-25 has been shown
by satisfying both criteria two and three.

37
Table 1X
Multitrait (T,G) - Multimethod (1,2) Matrix for the Study of the TeachingAnxiety Scale (TCHAS) Validity
Method 1
Method 2
T1
Cl
T2
G2
Method 1 Method 2
TT1
G1
T2 G2
(.93)
.38* ( .79)
.62 .30+ (.72)
.31+ .53 .42* (.43)
Note: ( ) = Monomethod-monotrait correlations. Reliabilities T and G1-1
are alpha coefficients of internal consistency;T2 and G
2are 5-week test-retest correlations.
Monotrait-heteromethod: interpreted as convergent validity
due predominantly to trait similarity
* = Heterotrait-monomethod: convergent validity due predominantly
to method similarity
+ = Heterotrait-heteromethod
T = Teaching Specific Anxiety Trait
G = General Anxiety Trait
Method 1 = Self-report questionnaire in which agreement or disagreement
with items is recorded by placing a mark in one of several
labelled boxes (MAS; TCHAS)
Method 2 = Self-report questionnaire in which agreement or disagreement
with items is recorded by placing a vertical mark along ahorizontal line, the extremes and midpoint of which are
labelled ASR(2), ASR(4).
N = 54 (Group A)

IX. UNIQUE NON-ERROR COMPONENT OF THE TEACIUNG ANXIETY SCALE
A technique suggested by Conbach (4) provides for an examination of
the TCHAS(1)-25 component which is not common to certain other measures of
anxiety (the MAS and the TAS). The total variance accounted for by the
TCHAS is divided into the following components: (l) the error variance
due to unreliability of the TQIAS; (2) the non-error variance that over-
laps with the MAS; and (3) the non-error variance that is unique from
what is measured by the MAS. The error variance iF calculated by subtrac-
ting the reliability coefficient (the alpha coefficient of internal consis-
tency in the case of the MAS) from 1.00: 1.00 - .92 = .08. The size of
the non-error variance that overlaps with the MAS is calculated by squaring
the correlation coefficient between the two measures (the TCHAS and MAS):
(.40)2
.= .16. The non-errorvariance that is unique to the TCHAS (in terms
of the MAS) is calculated by subtracting the overlap variance from the
total non-error variance: .92 - .16 = .76. From this procedure it can be
seen that .76 of what the TCHM measures is measured reliably and is inde-
pendent of what is being measured by the MAS. See Figure 1 for a pictorial
representation of this.
Figure 1
Non-error Component Unique to the TCHAS(1)-25
(with respect to the MAS)
Portion of TCHAS (1)-25variance that overlapswith the MAS variance
TCHAS (1)-25 Unreli-ability (error)
Non-error varianceunique from what ismeasured by the MAS
38

An analogous pictorial representation for the relationship between the
TCHAS(1)-25 and the TAS is presented
the TCHAS(1)-25 and the TAS is .25.
viously, it can be shown that 86% of
ably measured quality independent of
and anxiety as measured by the TAS.
in Figure 2. The correlation between
Following the procedure outlined pre-
the TCHAS variance is due to some reli-
both TCHAS(1)-25 unreliability (error)
Figure 2
Non-error Component Unique to the TCHAS(1)-25(with respect to the MAS)
Portion of TCHAS (1)-25variance that overlapswith the TAS variance
TCHAS (1)-25 unreli-ability (error)
Non-error varianceunique from what ismeasured by the TAS
39

CNJ
tsr\
CT` X. ANXIETY SELF REFORT (ASR (122 3 4))
Prospective Teacher Questionnaire
G.7.)
U.J Your answers on this questionnaire will be
kept strictly confidential. No professorName
or supervisor will know how you, as anindividual, answered these questions. Date
Indicate your answers to the following questions by marking a vertical line
through the horizontal line at the appropriate point.
Example:
I'm glad I'm in a teacher training program.
never occasionally
1. 1 feel anxious'about some aspect of teaching
always
always occasionally never

ASR(2)
2. My anxiety about teaching is
Name
Date
41
extreme moderate insignificant

i
ASR(3) Name
Date
42
The next two questions refer to anxiety in a more general sense--that is,
anxiety other than anxiety about teaching.
3. I an anxious
always occasionally never
i

ASR(4)
4. My anxiety (general) is
Name
Da to
43
insignificant moderate extreme

/44
XI. INFORMATfON ABOUT THE ANXIETY SUF Ruony (AS )
Development of the Anxiety Self Revert (ASR)
The development of the Anxiety Self Report was financed in part by the
Stanford Center ror Research and Development in Teaching under U.S. Office
of Education contract No. OE 6-10-078. The purpose in constructing this
abbreviated scale was to obtain a measure of anxiety about teaching that was
more expeditious to administer and, necessarily, less complex than the TCRAS,
with which to compare the TCUAS(1) -25 and TCHAS(2)-25. If the validity and
reliability data for the ASR were similar to those for the TCHAS(1,2)-45,
doubt would be raised regarding the value in administering the longer, more
complex and time-consuming TCHAS would have been brought into question.
Description of the Anxiety Self-Report (ASRl
The ASR, a copy of which is found in Appendix X, is composed of four
items. Subject response to two items WR(1) and ASR(3)) is registered in
terms of the frequency of anxiety experienced, and, for the other two
(ASR(2) and ASR(4)), the subject responds in terms of the intensity of
anxiety felt. The first and second items (ASR(1) and ASR(2)) inquire about
teaching-specific anxiety: the third and fourth (ASR(3) and ASR(4)),about
general anxiety. The subject responds to each item by placing a vertical
mark along a seven inch horizontal line. The extremes of the line for the
frequency items are labeled "always" and "never," with "occasionally" as a
midpoint. The extremes of the line on which intensity responses are recorded
are labeled "extreme" and "insignificant," with "moderate" as a midpoint.
Response Bias and the Anxiety Self Report (ASR)
Two procedures were used to decrease the possible effects of response bias:
first, the alternation of the high anxiety end of the line from left to right;
and, second, the presentation of each item on a separate page.

45
Table X
Anxiety Self Report (ASR) Distribution Statistics
Items About Teaching Anxiety Items About General Anxiety
ASR(1) ASR(2) ASR(3) ASR(4)
Mean Sigma N Mean Sigma N Mean Sigma N Mean Sigma N
'July 1966 4.92 1.73 48 4.25 1.48 48 3.81 1.44 48 3.51 1.41 47
August 1966 4.70 1.43 54 3.93 1.33 %.94 1.50 54 3.46 1.42 54
Note: N's vary as a result of missing data. The subjects are from the sample
of 55 graduate student secondary preservice intern teachers upon which
the TCHAS(1,2) analagous distribution information is calculated.
(Group A)
Sigma =
Anxiety Self Report (ASR) Scoring Procedures
To score the individual items, divide each lire into eight equal segments
and number them 1 through 8, with "1" being at the low-anxious end and "8"
at the high-anxious end. For ASR(1,2,3), the "8" is at the left side of the
paper and the "1" at the right side. For ASR(4) the rLverse is true. No
attempt has yet been made to calculate an ASR total score. IL is suggested
that the sum of ASR(1) and ASR(2) might be useful as a measure of teaching
anxiety, one that includes both frequency and intenF;,y aspects of anxiety and
one which is more stable than either item ASR(1) or eASR(2) alone. ASR(3) and
ASR(4) might be summed for the same reasons.
Anxiety Self Report (ASR Reliability
Internal consistency. It can be noted in Tables XI and XII that the cor-
relations between ASR(1) and ASR(2), both teaching-Fpeeific items, and between
ASR(1) and ASR(4), both general items, are higher than the correlations of
ASR(1) or ASR(2) with either ASR(3) or ASR(4). This pattern makes logical
sense.

4 6
Table XI
Anxiety Self Report (ASR) Inter-item CorrelationMatrix for July 196b
ASR(2) ASR(3) ASR(4)
ASR(1) .70 (N=48) .42 (N =48) .39 (N=47)
ASR(2) .37 (N=48) .36 (N=47)
ASR(3) .63 (N=47)
Note: N's vary as a result of missing data. The subjects are
from the sample of 55 graduate student secondary pre-service intern teachers upon which the TCIILS(1,2) analo-
gous distribution information is calculated (Group A).
Table XII
Anxiety Self Report (ASR) Inter-item Correlation
Matrix for August 1966
ASR(2) ASR(3 ASR (4)
ASR(1) .76 .43 .34
ASR(2) .44 .46
ASR(3) .75
Note: N = 54 of the 55 graduate student secondary education
preservice intern teachers upon which the TCHAS(1,2)
analogous distribution information is calculated (Group A).
Stability. As can be seen in Table XIII, the five-week ASI:(1,2) test-
retest reliabilities are roughly comparable to the TCUAS(1,2) eight-week
test-retest reliabilities (.60, .61). This information is not, however, cor-
rectly interpreted as stability information, for the same reasons mentioned
in Section V in the manual.

47
Table XIII
Anxiety Self Report (ASR) Five-Week Test-RetestReliabilities
ASR(1)
ASR(2)0.~..............11
..............
ASR(3)
ASR(4)
Test-RetestCorrelation N
.58 48
.72 48
.37 48
.43 47
Note: N's vary as a result of missing data. The subjects are
from the sample of 55 graduate student secondary preservice
intern teachers upon which the TCHAS(1,2) analogous dis-
tribution information is calculated (Group A).
Anxiety Self Report (ASR) Validity
Validation of the ASR falls under the rubric construct validation for
the same reasons as does the TCHAS(see manual text, Section VI). Evidence
for the construct validation of the ASR will be presented under the following
topics: component validation, internal structure and change over time.
Component Validation. Table XIV gives the correlations between the ASR
and other self-report scales of anxiety (the MAS and the TCHAS). The fact
that these correlations are both consistently positive and predominantly
statistically significant supports the contention that the ASR is measuring
some component common, to these other measures. The assumption here is that
this common component is anxiety.
The approaches of Campbell and Fiske (4) and of Cronbach (7), used
earlier to study more precisely what the TCHAS measures, are also appropriate
for the ASR.

48
Table XIV
Correlations Between the ASR and Other Self-report Anxiety Scales
(the Teaching Anxiety Scale and the Manifest Anxiety Scale)
TCHAS(l) -25 MAS
TCHASJune '66
.53
TCHASAug. '66
.50
MASJune '66
.36
MASAug. '66
.33ASR(1)
Aug1966
ASR(2)
Aug.1966 .61 .62 .26 .33
ASR(3)Aug.1966 .35 .46 .45 .57
ASR(4)
Aug.1966 .28 .42 .48 .56
Note: N = 54 (Group A)
Subcomponents within the Shared Component. In fact, the ASR is even
more appropriate for analysis by the Campbell and Fiske technique than is the
TCHAS, because each of the. Anxiety Self Report teaching-specific items has an
Anxiety Self Report general anxiety item with which it shares identical method
of measurement. Specifically, ASR(1) and ASR(3) are measured by a single
method, as are ASR(2) and ASR(4). In the case of the TCHAS and the MAS, the
analogous measurement methods were similar but not identical.

49
Table XV
Multitrait (T,G) - Multimethod (l,2) Matrix for the Study of the Anxiety
Self Report Validity
Method 1T
1
G1
Method 2T2
02
Method 1
T1
G1
Method 2
T2
G2
(.72)
.46* (.43)
Note: ( ) = Monomethod-monotrait correlniions. These reliabilities
are all 5-week test-retest correlations.
= Monotrait - heteromethod correlations, interpreted ns
convergent due to trait similarity.
* = Heterotrait - monomethod correlations, interpreted asconvergence due to method siwilarity.
+ = Heterotrait - heteromethod correlations
T = Teaching-specific Anxiety Trait (T1=ASR(l); T2=ASR(2))
G = General Anxiety Trait (G1=ASR(3); G7= ASR(4))
Method 1 = Method used to measure ASR(1) and ASR(3)
Method 2 = Method used to measure ASR(2) and ASR(4)
N = 54 (Group A)
The ASR(1) ASR(2) monotrait-heteromethod correlation (.76) is greater
than either the ASR(1) - ASR(3) or the ASR(2) ASR(4) heterotrait-monomethod
correlations, .43 and .46,respectively. In addition, the monotrait-hcteromethod
correlation (.76) is larger than either heterotrait-heteromethod correlation
(.34, .44). Therefore, the three criteria suggebted by Campbell and Fiske
(see Appendix VIII for detail) have been satisiied.
Unique Components. Using the Cronhach technique explained in Appendix IX,
it can be shown that. the ASR(1) measures reliably some quality that is 47%
free of that is measured by the MAS, 39% free of what is measured by the ASR(3),

50
and 46% different from what in measured by the ASR('). The ASR(2) measures
reliably some quality that is 61% different from what is measured by the
MAS, 53% different from what is measured by the ASR(3), and 59% different
from what is measured by the ASR(4). The percentage of variance unique
to the ASR(1) and ASR(2), with regard to the measures of genera] anxiety
(MAS, ASR(3) and ASR(4)), is small in comparison with the percentages ob-
tained for the TCHAS(1)-25 (Appendix IX). These differences in percent of
variance accounted for are due, in large part, to the following reason.
The error estimate used for the TCHAS(1)-25 was based upon the alpha coef-
ficient of internal consistency, while those used for the ASR(1) and ASR(2)
were based upon five-week test-retest correlation coefficients. The alpha
for the TCHAS(1)-25 is a great deal higher than the ASR(1) and ASR(2) five-
week test-retest reliability. The size of these differences in percent
of variance accounted for can be reduced greatly, either (1) by recalcu-
lating the TCHAS(1)-25 percentages using the test-retest correlations
(rather than the alphas) as the bases upon which the percentages of error
are calculated, or (2) by considering the ASR(1) and ASR(2) as two halves
of a single measure of anxiety about teaching, thus permitting the use
of the correlation between them as the estimate of ASR(1,2) split-half
reliability (one kind of internal consistency). In doing either of these,
the magnitude of the advantage of the TCHAS(1)-25 over the ASR(1,2)
decreases, though it does not disappear.
It is important at this point to recall that reliability increases as
the length of an instrument increases, so it is not surprising that the
TCHAS(1)-25, which is 121/2 times as long as the combined ASR(1,2), is more
reliable than the ASR(1,2).

51
X11. PRE-TEST NTERREIdalONAIPS A'f0';::; THE VARIOUS SCORINGS
FOR THE TCHAS(0-29
TCHAS(1)-25 TMS(1)- 8 TCHAS(1)-29
TCHAS(1)-24 .996 (.998) .98 (.99) .98 (.985)
TCHAS(1)-25 .98 (.98) .99 (.99)
TCHAS(1)-28 .996 (.998)
Note: The correlations in parentheses are for Group (N = 30).
The correlations not in parentheses are for Croup E (N = 36).

52
XIII. DESCRIPT30%; OF SAMPLES
CODE DESCRIPTION
A
B
C
D
E
55 Stanford University graduate student intern secondary
teachers, 1/3 male and 2/3 female, ranging in age from 23
to 47 years, 1966-67. Data collected by the author during
an introductory educational psychology class through the
courtesy of Dr. Fred J. McDonald, their professor.
384 San Francisco Unified School District newly hired ele-
memtary and secondary teachers, 1/3 male and 2/3 female, 1967.
Data collected by Dr. Lester. R. Steig, Assistant Superinten-
dent of Schools, during orientation sessions.
23 Austin, Texas, inservice public school elementary and junior
high school teachers, 1/4 male and 3/4 female, participating in
a University of Texas Research and Development Center, "Indi-
vidualized Teaching for Effective Coping Projec "(ITEC), 1969.
The TCHAS(1)-28 was sent out by mail in a packet containing
ITEC measures to be filled out and returned by mail to the
investigator. Data collection made possible Dr. Robert F.
Peck, head investigator
79 University of Texas undergraduate secondary preservice
teachers enrolled in an introductory educational psychology
course, 1969. Data obtained through the courtesy of Dr. Edmund
Emmer, their professor.
36 University of Texas undergraduate and graduate students,
(elementary and secondary), 1/4 male and 3/4 female, seeking
certification, 1971. Data obtained through the courtesy of
Ted Eckman, their instructor.
F 30 University of Texas elementary student: teachers (all female)
teaching in the Austin Public Schools, 1971.

53
Bibliography
1. Acker, M. & McReynolds, P. On the assessment of anxiety: III. Byself-ratings. Psycholop-ical Reports, 1 %G, 19, 251-254.
2. Alpert, R. & Haber, R. Anxiety in academic achievement situations.Journal of Abnormal and Social Psychology, 1960, 61(2), 207-215.
3. Brown, G. G., Fuller, F. F., & Parsons, J. S. Preliminary systemfor categorizing the concerns of teachers. Report Series 73.Austin: The Research and Development Center for Teacher.Education, The University of Texas at Austin, 1972.
4. Campbell, D. T. & Fiske, D. W. Convergent and discriminant validationby the multitrait-multimethod matrix. Psychological Bulletin,1959, 56, 81-105.
5. Costello, C. G. & Comrey, A. L. Scales for measuring depressions and
anxiety. Journal of Psychology, 1967,'66, 303-313.
6. Cronbach, L. J. Coefficient alpha and the internal structure oftests. Psychometrika, 1951, 16(3), 297-334.
7. Cronbach, L. J. Essentials of psychological testing (2nd ed.).New York: Harper and Row, 1960.
8. Cronbach, L. J. & Meehl, P. E. Construct validity in psychologicaltests. Psychological Bulletin, 1955, 52(4), 281-302.
9. Dunn, J. A. Factor structure of the test anxiety scale for children.Journal of Pscyhology, 1964, 29, 92.
10. Eckman, T. Personal communication, 1971.
11. Edwards, A. L. The social desirability variable in personalityassessment and research. New York: Dryden Press, 1957.
12. Emmer, E. T. Personal communication, 1970.
13. Endler, N. S. & Hunt, J. McV. Generalizability of contributions fromsources of variance in the s-r inventories of anxiousness.Journal of Personality, 1969, 37, 1-24.
14. Endler, N. S., Hunt, J. McV., &'Rosenstein, A. J. An s-r inventoryof anxiousness. Psychological. Monographs, 1962, 76(17, Whole
No. 536), 1-33.
15. Fuller, F. F. Concerns of teachers: a developmental conceptualization.American Educational Research Journal, 1969, 6, 207-226.

16. hiller, F. F. , Parsons, J. S., & Watkins, J. E. Concerns of teachers:Research and reoonceptualization. Austin: The Research andDevelopment Center for Teacher. Education, The University ofTexas at Austin, 1973.
17. Jackson, D. N. & Messick, S. Acquiescence and desirability asresponse determinants on the MN. Ldueational and Psycho-logical Measurement, 1961, 21, 771-790.
18. Handler, G. & Cowen, J. Test anxiety questionnaires. Journal ofConsulting Psyc1-212a, 1958, 22, 228.229.
19. Mandler, G. & Sarason, S. B. A study of anxiety and learning.Journal of Abnormal and Social Psychology, 1952, 47, 166-173.
20. McNemar, Q. Psychological statistics (3ru ed.). New York: John
Wiley and Sons, Inc., 1962.
21. McReynolds, P. On the assessment of anxiety: I. By a behavior
checklist. Psychological Report, 1965, 16, 805-808.
22. McReynolds, P. The assessment of anxiety: A survey of available
techniques. In P. McReynolds (Ed.), Advances in PsychologicalAssessment. Palo Alto: Science and Behavior Books, Inc., 1968.
23. McReynolds, P. & Acker, M. On the assessment of anxiety: II. By
a self-report inventory. Psychological Reports, 3966, 39,
231-237.
24. Mischel, W. Personality and assessment. New York: John Wiley and
Sons, Inc., 1968.
25. Parsons, J. S. Anxiety and teaching competence, Unpublisheddoctoral dissertation, Stanford University, 1970.
26. Parsons, J. S. & Steig, L. R. Unpublished study, 1967.
27. Raphelson, A. C. The relationship among imaginative direct verbaland physiological measures of anxiety in an acl'ievement situation.Journal of Abnormal and Social Psychology, 1957, 54, 13-18.
28. Sarason, I. Test anxiety, general anxiety, and intellectual perfor-
mance. Journal of' Consulting Psychology, 1957, 221, 485-490.
29. Sieber, J. E. A paradigm for experimental modification of theeffects of test anxiety on cognitive processes. AmericanEducational Research Journal, 1969, 6(1), 43-61.
30. Sieber, J. E., Kameya, L. I., & Paulson, F. L. Effect of memorysupport on the problem-solving ability of test-anxious children.
Journal of Educational Psychology, 1970, 61(2), 159-168.

31. Spence, J. T. & Spence, K. The motivational components or manifestanxiety: Drive and drive stimulus. In C. D. Spiel erger (Dd.),Anxiety and behavior. New York:. Academic Press, 1966, 291-326.
32. Spielberger, C. D. (Ed.) Anxiety and Behavior. New York: Academic
Press, 1966.
33. Spielberger, C. D. (Ed.) Anxiety: Current trends in theory andresearch, vol. I. New York: Academic Press, 1972.
34. Spielberger, C. C. (Ed.) Anxiety: Current trends in theory andresearch, vol. II. New York: Academic Press, 1972.
35. Spielberger, C. D. Conceptual and methodological issues in anxietyresearch. In C. D. Spielberger (Ed.), Anxiety: Current trends
in theory and research. New York: Academic Press, 1972, 481-
493.
36. Taylor, J. A. A personality scale of manifest anxiety. Journalof Abnormal and Social Psychology, 1953, 48, 285-290.
37. Technical recommendations for psychological tests and diagnostictechniques. Psychological_ Bulletin, 1954 Supplement, AmericanPsychological Association, Washington, D. C.
38. Zuckerma.1, M. The development of an affect adjective check list forthe measurement of anxiety. journal of Crunsuirisw Psqoholooy,
1960, 24(5), 457-462.


![1385 peck[1]](https://img.dokumen.tips/doc/110x75/558cccb4d8b42a02638b4684/1385-peck1.jpg)