Embed Size (px)
Citation preview
ED 469 987
AUTHOR
TITLE
INSTITUTION
REPORT. NO
PUB DATENOTE
AVAILABLE FROM
PUB TYPE
EDRS PRICEDESCRIPTORS
DOCUMENT RESUME
HE 035 420
Sikora, Anna C.
A Profile of Participation in Distance Education: 1999-2000.Postsecondary Education Descriptive Analysis Reports.National Center for Education Statistics (ED), Washington,DC.; MPR Associates, Berkeley, CA.NCES-2003-1542002-11-00
66p.; Project Officer, C. Dennis Carroll.ED Pubs, P.O. Box 1398, Jessup, MD 20794-1398. Tel: 877 -433-7827 (Toll Free); Fax: 301-47071244; e-mail:[email protected] Research (143)
EDRS Price MF01/PC03 Plus Postage.
*College Students; *Distance Education; *Enrollment;Enrollment Trends; *Higher Education; Profiles; *StudentParticipation
ABSTRACT
This study examined the participation of undergraduate andgraduate students in distance education. Students responding to the 1999-2000National Postsecondary Student Aid Study who reported taking distanceeducation courses for credit were asked about their experiments. Eightpercent of undergraduates and 10% of graduate and first professional studentsreported taking distance education courses. Findings suggest that even thoughdistance education participation rates were relatively low in 1999-2000,clear patterns of participation emerged for both undergraduates andgraduate/first professional students. Students who reported participatingtended to be those with family responsibilities and limited time. They weremore likely to be enrolled in school part time and to be working full timewhile enrolled. Females were more likely than males to participate, andundergraduates majoring in education participated in distance education at ahigher rate than did those Majoring in most other fieldsof study. Similarpatterns of. participation emerged among graduate and first-professionalstudents. Both .graduate and undergraduate students were more likely to takedistance education courses over the Internet than via live or prerecordedtelevision or audio. About one half of respondents reported being assatisfied with their distance education courses as their regular classroomcourses. In addition to the description of overall participation in distanceeducation, the report includes a multivariate analysis that shows theresidual relationship of various student characteristics to distanceeducation participation. Appendixes contain a glossary and technical notes.(Contains 8 figures, 15 tables, and 5 references.) (SLD)
Reproductions supplied by EDRS are the best that can be madefrom the original document.

"NCESNational Center forEducation Statistics
U.S. Department of EducationOffice of EducationalResearch and ImprovementNCES 2003-154
U.S. DEPARTMENT OF EDUCATIONOffice of Educational Research and Improvement
EDUCATIONAL RESOURCES INFORMATIONCENTER (ERIC)
.phis document has been reproduced asreceived from the person or organizationoriginating it.
LI Minor changes have been made toimprove reproduction quality.
Points of view or opinions stated in thisdocument do not necessarily representofficial OERI position or policy.
siEsitoPYAVAILABLE
2
A Profile ofParticipation inDistance Education:1999-2000
Postsecondary EducationDescriptive Analysis Reports
(
BESTCOPYAVAILABLE

eal:11
National Center fearEducation Statistics
U.S. Department of EducationOffice of EducationalResearch and ImprovementNCES 2003-154
A Profile ofParticipation inDistance Education:1999-2000
Postsecondary EducationDescriptive Analysis Reports
November 2002
Anna C. SikoraMPR Associates, Inc.
C. Dennis CarrollProject OfficerNational Center forEducation Statistics
3
U.S. Department of EducationRod PaigeSecretary
Office of Educational Research and ImprovementGrover J. WhitehurstAssistant Secretary
National Center for Education StatisticsGary W. PhillipsDeputy Commissioner
The National Center for Education Statistics (NCES) is the primary federal entity for collecting, analyzing, andreporting data related to education in the United States and other nations. It fulfills a congressional mandateto collect, collate, analyze, and report full and complete statistics on the condition of education in the UnitedStates; conduct and publish reports and specialized analyses of the meaning and significance of suchstatistics; assist state and local education agencies in improving their statistical systems; and review and reporton education activities in foreign countries.
NCES activities are designed to address high priority education data needs; provide consistent, reliable,complete, and accurate indicators of education status and trends; and report timely, useful, and high qualitydata to the U.S. Department of Education, the Congress, the states, other education policymakers,practitioners, data users, and the general public.
We strive to make our products available in a variety of formats and in language that is appropriate to avariety of audiences. You, as our customer, are the best judge of our success in communicating informationeffectively. If you have any comments or suggestions about this or any other NCES product or report, we wouldlike to hear from you. Please direct your comments to:
National Center for Education StatisticsOffice of Educational Research and ImprovementU.S. Department of Education1990 K Street NWWashington, DC 20006-5651
November 2002
The NCES World Wide Web Home Page is: http://nces.ed.govThe NCES World Wide Web Electronic Catalog is: http://nces.ed.gov/pubsearch
Suggested Citation
U.S. Department of Education, National Center for Education Statistics. A Profile of Participation in DistanceEducation, NCES 2003-154, by Anna C. Sikora. Project Officer: C. Dennis Carroll. Washington, DC: 2002.
For ordering information on this report, write:
U.S. Department of EducationED PubsP.O. Box 1398Jessup, MD 20794-1398
or call toll free 1-877-4ED-PUBS
Contact Contact:Aurora D'Amico(202) 502-7334Aurora.D'[email protected]
4
Executive Summary
During the 1990s, distance educationavailability, course offerings, and enrollmentsincreased rapidly. The percentage of 2- and 4-yeardegree-granting institutions offering distanceeducation courses rose from 33 to 44 percentbetween 1995 and 1997, and the number of suchcourses nearly doubled. In 1997, one-fifth of thenation's 2- and 4-year degree-granting institutionsalso planned to start offering distance educationcourses in the next 3 years (Lewis et al. 1999).While previous reports have studied institutional(Lewis et al. 1999) and faculty (Bradburn 2002)participation in distance education, this reportfocuses on student participation. This reportexamines the participation of undergraduate andgraduate students in distance education.
Students responding to the 1999-2000 NationalPostsecondary Student Aid Study (NPSAS:2000)were asked, "During the 1999-2000 school year,did you take any courses for credit that weredistance education courses? By distanceeducation, I mean courses delivered off campususing live, interactive TV or audio; prerecordedTV or audio; CD-ROM; or a computer-basedsystem such as the Internet, e-mail, or chatrooms." Students who reported taking distanceeducation courses were asked about theirexperiences with distance education.
This report uses data from NPSAS:2000 toaddress several research questions:
Which students participated in distanceeducation in 1999-2000? Were any studentcharacteristics related to participation indistance education?
Which types of technology did students useto take their distance education courses?
How satisfied were students with theirdistance education courses?
Students' overall participation, as well as theirparticipation by type of distance educationtechnology, is examined in terms of numerousstudent characteristics, including demographics(such as gender, race/ethnicity, and age);indicators of socioeconomic status (such asparents' highest level of education and students'family income); family status (marital status andwhether students had dependent children);institution and academic characteristics (such asinstitution type, and students' class level, degreeprogram, and field of study); and employmentcharacteristics. This report also includes amultivariate analysis that shows how variousstudent characteristics were related toparticipation in distance education aftercontrolling for the covariation of related variables.
Student Participation in DistanceEducation
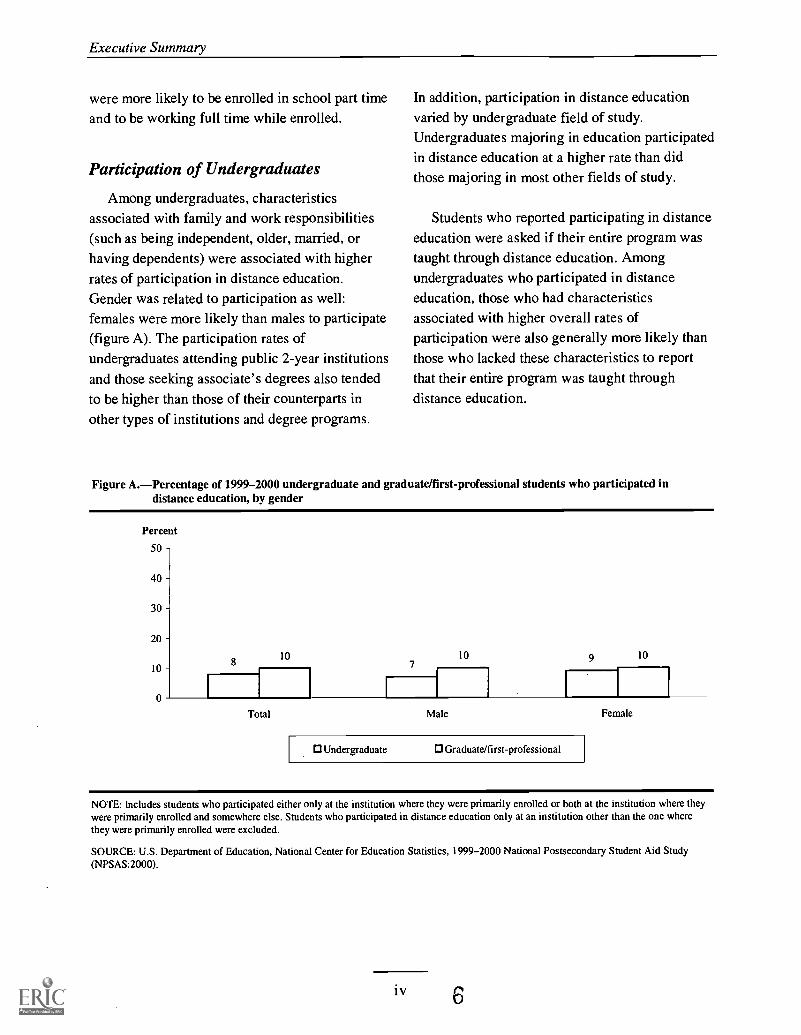
The findings of this study suggest that eventhough distance education participation rates wererelatively low in 1999-2000 (8 percent ofundergraduates and 10 percent of graduate andfirst-professional students reported taking distanceeducation courses), clear patterns of participationemerged for both undergraduates andgraduate/first professional students. Students whoreported participating tended to be those withfamily responsibilities and limited time. They
iii 5
Executive Summary
were more likely to be enrolled in school part timeand to be working full time while enrolled.
Participation of Undergraduates
Among undergraduates, characteristicsassociated with family and work responsibilities(such as being independent, older, married, orhaving dependents) were associated with higherrates of participation in distance education.Gender was related to participation as well:females were more likely than males to participate(figure A). The participation rates ofundergraduates attending public 2-year institutionsand those seeking associate's degrees also tendedto be higher than those of their counterparts inother types of institutions and degree programs.
In addition, participation in distance educationvaried by undergraduate field of study.Undergraduates majoring in education participatedin distance education at a higher rate than didthose majoring in most other fields of study.
Students who reported participating in distanceeducation were asked if their entire program wastaught through distance education. Amongundergraduates who participated in distanceeducation, those who had characteristicsassociated with higher overall rates ofparticipation were also generally more likely thanthose who lacked these characteristics to reportthat their entire program was taught throughdistance education.
Figure A.Percentage of 1999-2000 undergraduate and graduate/first-professional students who participated indistance education, by gender
Percent
50
40 -
30 -
20
108
107
10 9 10
Total Male
0 Undergraduate 0 Graduate/first-professional
Female
NOTE: Includes students who participated either only at the institution where they were primarily enrolled or both at the institution where theywere primarily enrolled and somewhere else. Students who participated in distance education only at an institution other than the one wherethey were primarily enrolled were excluded.
SOURCE: U.S. Department of Education, National Center for Education Statistics, 1999-2000 National Postsecondary Student Aid Study(NPSAS:2000).
iv
Executive Summary
Participation of Graduate and First-Professional Students
Similar patterns of participation emergedamong graduate and first-professional students.While a gender difference was not detected,married students and those with dependentchildren were more likely than their counterpartsto participate in distance education. Greater workintensity also appeared to contribute to higherparticipation. Due to low incidence and resultingsmall sample sizes, it was not possible to conductsubgroup comparisons of the availability of
graduate and first-professional students' entireprograms via distance education.
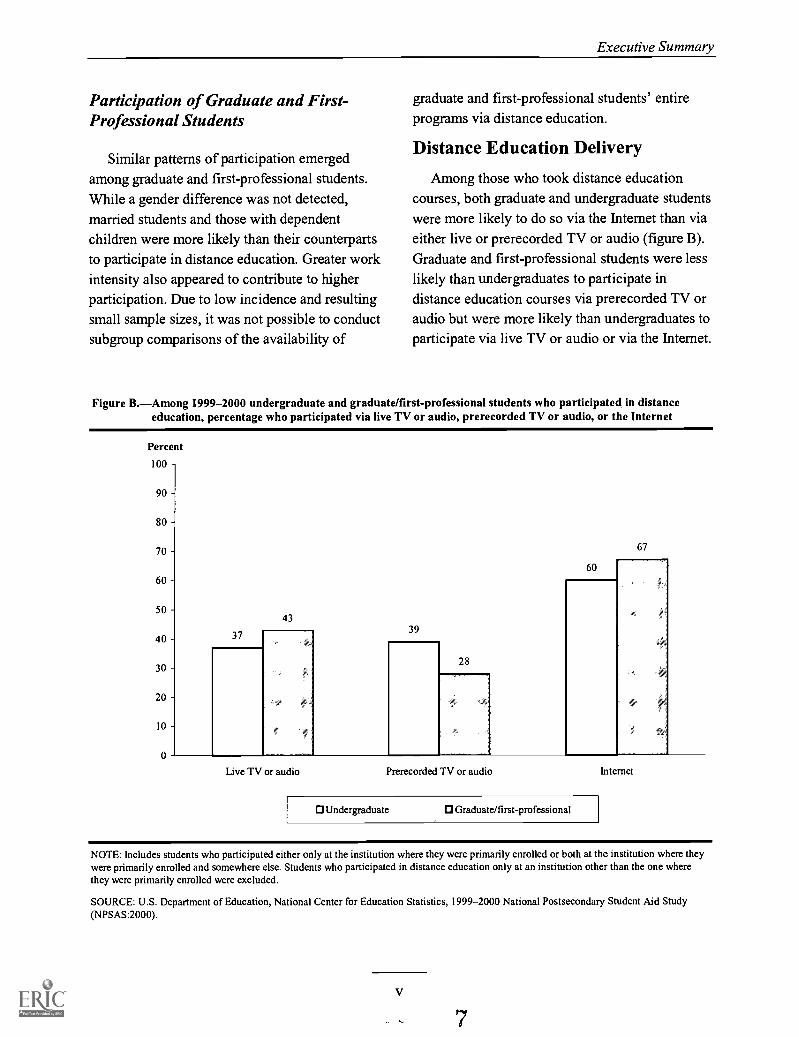
Distance Education Delivery
Among those who took distance educationcourses, both graduate and undergraduate studentswere more likely to do so via the Internet than viaeither live or prerecorded TV or audio (figure B).Graduate and first-professional students were lesslikely than undergraduates to participate indistance education courses via prerecorded TV oraudio but were more likely than undergraduates toparticipate via live TV or audio or via the Internet.
Figure B.Among 1999-2000 undergraduate and graduate/first-professional students who participated in distanceeducation, percentage who participated via live TV or audio, prerecorded TV or audio, or the Internet
Percent
100
90
80 -
70 67
6060 -
50 -43
40 3739
4ii
3028
20
10-
0
Live TV or audio Prerecorded TV or audio Internet
0 Undergraduate 0 Graduate/first-professional
NOTE: Includes students who participated either only at the institution where they were primarily enrolled or both at the institution where theywere primarily enrolled and somewhere else. Students who participated in distance education only at an institution other than the one wherethey were primarily enrolled were excluded.
SOURCE: U.S. Department of Education, National Center for Education Statistics, 1999-2000 National Postsecondary Student Aid Study(NPSAS:2000).
V
7
Executive Summary
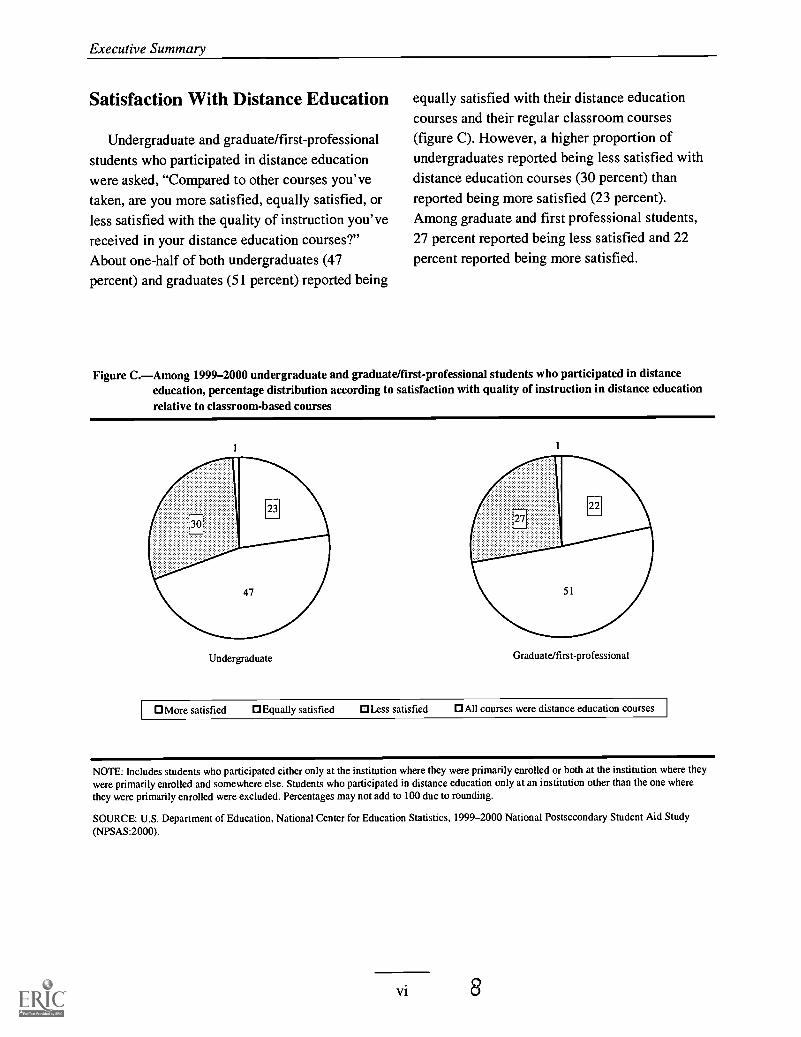
Satisfaction With Distance Education
Undergraduate and graduate/first-professionalstudents who participated in distance educationwere asked, "Compared to other courses you'vetaken, are you more satisfied, equally satisfied, orless satisfied with the quality of instruction you'vereceived in your distance education courses?"About one-half of both undergraduates (47percent) and graduates (51 percent) reported being
equally satisfied with their distance educationcourses and their regular classroom courses(figure C). However, a higher proportion ofundergraduates reported being less satisfied withdistance education courses (30 percent) thanreported being more satisfied (23 percent).Among graduate and first professional students,27 percent reported being less satisfied and 22percent reported being more satisfied.
Figure C.Among 1999-2000 undergraduate and graduate/first-professional students who participated in distanceeducation, percentage distribution according to satisfaction with quality of instruction in distance educationrelative to classroom-based courses
Undergraduate Graduate/first-professional
0 More satisfied O Equally satisfied 0 Less satisfied 0 All courses were distance education courses
NOTE: Includes students who participated either only at the institution where they were primarily enrolled or both at the institution where theywere primarily enrolled and somewhere else. Students who participated in distance education only at an institution other than the one wherethey were primarily enrolled were excluded. Percentages may not add to 100 due to rounding.
SOURCE: U.S. Department of Education, National Center for Education Statistics, 1999-2000 National Postsecondary Student Aid Study(NPSAS:2000).
Foreword
This report profiles the extent to which undergraduate and graduate and first-professional
students who were enrolled in U.S. postsecondary institutions in the 1999-2000 academic year
participated in distance education. It is based on data from the 1999-2000 NationalPostsecondary Student Aid Study (NPSAS:2000), the fifth in a series of surveys conducted by the
U.S. Department of Education. Each NPSAS survey is a comprehensive nationwide study to
determine how students and their families pay for postsecondary education.
The report describes overall participation in distance education courses, the distance
education technology used by students, and students' satisfaction with distance education
courses. The report also includes a multivariate analysis that shows the residual relationship of
various student characteristics to distance education participation.
The estimates presented in the report were produced using the NCES Data Analysis System
(DAS), a microcomputer application that allows users to specify and generate tables for the
NPSAS:2000 undergraduate and graduate surveys. The DAS produces the design-adjusted
standard errors necessary for testing the statistical significance of differences in the estimates.
For more information on the DAS, consult appendix B of this report.
vii

Acknowledgments
The authors appreciate the contributions of staff members at MPR Associates, NCES and
other U.S. Department of Education offices, and nongovernmental agencies for their
contributions to the production of this report. At MPR Associates, Laura Horn contributed to the
development of the report with both detailed comments on drafts and a helpful broader
perspective on the direction of the report. Francesca Tussing, Patti Gildersleeve, and Barbara
Kridl supplied expert assistance in the production of the report. Andrea Livingston and Ellen
Bradburn provided helpful editorial and substantive reviews.
Outside of MPR Associates, C. Dennis Carroll at NCES oversaw the production and
development of the report through all stages, providing feedback on all drafts. Paula Knepper
was the senior technical advisor for the report, and Bruce Taylor at NCES adjudicated the report.
Other reviewers included Maria Ferrier from the Office of English Language Acquisition
(OELA), Alan Ginsburg from the Office of the Undersecretary for Policy Evaluation Services
(PES), Kay Gilcher from the Office of Postsecondary Education (OPE), Carolyn S. Lee from the
Office of Vocational and Adult Education (OVAE), Kent Phillipe from the American
Association of Community Colleges (AACC), and Bernard Greene and Ilona Berkovits from
NCES.
viii I.0

Table of Contents
Page
Executive Summary iii
Foreword vii
Acknowledgments viii
List of Tables
List of Figures xii
Introduction 1
Data 3
Organization of This Report 4
Overall Participation in Distance Education 5
Differences Among Undergraduates 5
Differences Among Graduate and First-Professional Students 13
Summary of Participation 17
Availability of Entire Program Through Distance Education 19
Distance Education Delivery Methods 21
Satisfaction With Distance Education Classes 23
Multivariate Analysis 27
Differences Among Undergraduates 27
Differences Among Graduate and First-Professional Students 31
Conclusion 35
References 37
Appendix AGlossary 39
Appendix BTechnical Notes and Methodology 49
ix 11
List of Tables
Table Page
1 Percentage of 1999-2000 undergraduate students who participated in distanceeducation, and of those, the percentage whose entire program was taught throughdistance education, by student characteristics 6
2 Percentage of 1999-2000 undergraduate students who participated in distanceeducation, and of those, the percentage whose entire program was taught throughdistance education, by students' family background characteristics 7
3 Percentage of 1999-2000 undergraduate students who participated in distanceeducation, and of those, the percentage whose entire program was taught throughdistance education, by institutional characteristics 8
4 Percentage of 1999-2000 undergraduate students who participated in distanceeducation, and of those, the percentage whose entire program was taught throughdistance education, by type and level of students' academic program 9
5 Percentage of 1999-2000 undergraduate students who participated in distanceeducation, and of those, the percentage whose entire program was taught throughdistance education, by students' academic performance and attendance pattern 11
6 Percentage of 1999-2000 undergraduate students who participated in distanceeducation, and of those, the percentage whose entire program was taught throughdistance education, by employment characteristics 12
7 Percentage of 1999-2000 graduate and first-professional students who participated indistance education, and of those, the percentage whose entire program was taughtthrough distance education, by student characteristics 14
8 Percentage of 1999-2000 graduate and first-professional students who participated indistance education, and of those, the percentage whose entire program was taughtthrough distance education, by students' family background characteristics 15
9 Percentage of 1999-2000 graduate and first-professional students who participated indistance education, and of those, the percentage whose entire program was taughtthrough distance education, by degree and program characteristics 16
x 12
List of Tables
Table Page
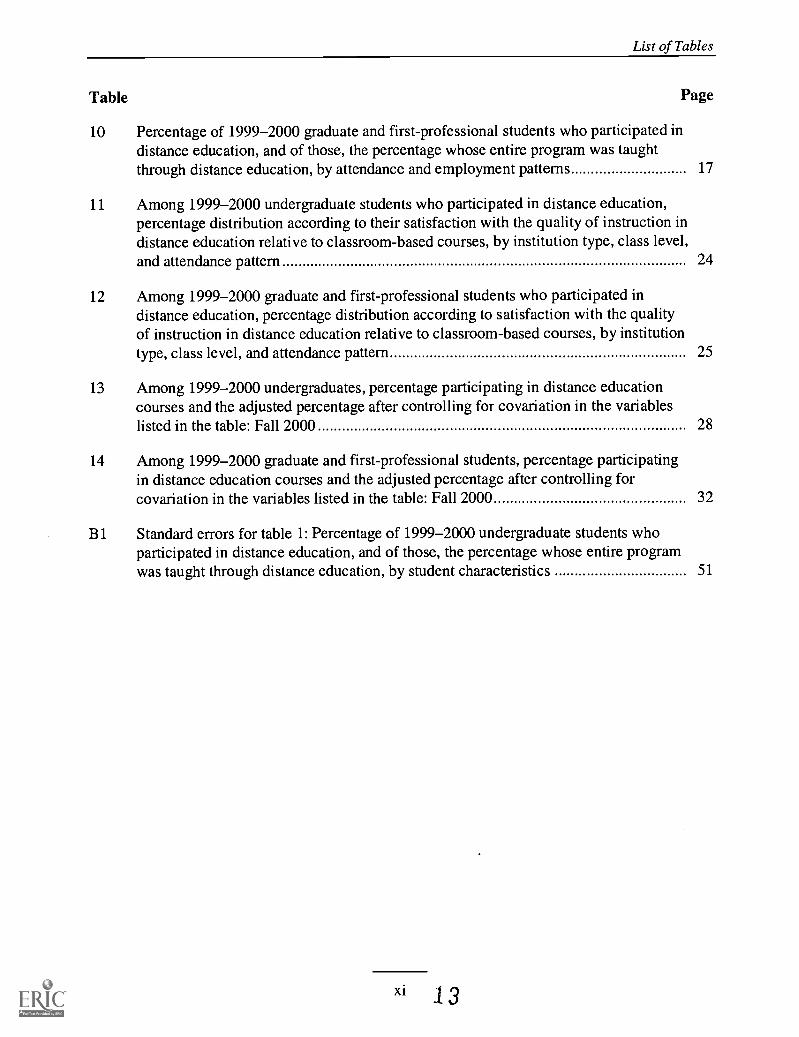
10 Percentage of 1999-2000 graduate and first-professional students who participated indistance education, and of those, the percentage whose entire program was taughtthrough distance education, by attendance and employment patterns 17
11 Among 1999-2000 undergraduate students who participated in distance education,percentage distribution according to their satisfaction with the quality of instruction indistance education relative to classroom-based courses, by institution type, class level,and attendance pattern 24
12 Among 1999-2000 graduate and first-professional students who participated indistance education, percentage distribution according to satisfaction with the qualityof instruction in distance education relative to classroom-based courses, by institutiontype, class level, and attendance pattern 25
13 Among 1999-2000 undergraduates, percentage participating in distance educationcourses and the adjusted percentage after controlling for covariation in the variableslisted in the table: Fall 2000 28
14 Among 1999-2000 graduate and first-professional students, percentage participatingin distance education courses and the adjusted percentage after controlling forcovariation in the variables listed in the table: Fall 2000 32
B1 Standard errors for table 1: Percentage of 1999-2000 undergraduate students whoparticipated in distance education, and of those, the percentage whose entire programwas taught through distance education, by student characteristics 51
xi 3
List of Figures
Figure Page
Executive Summary
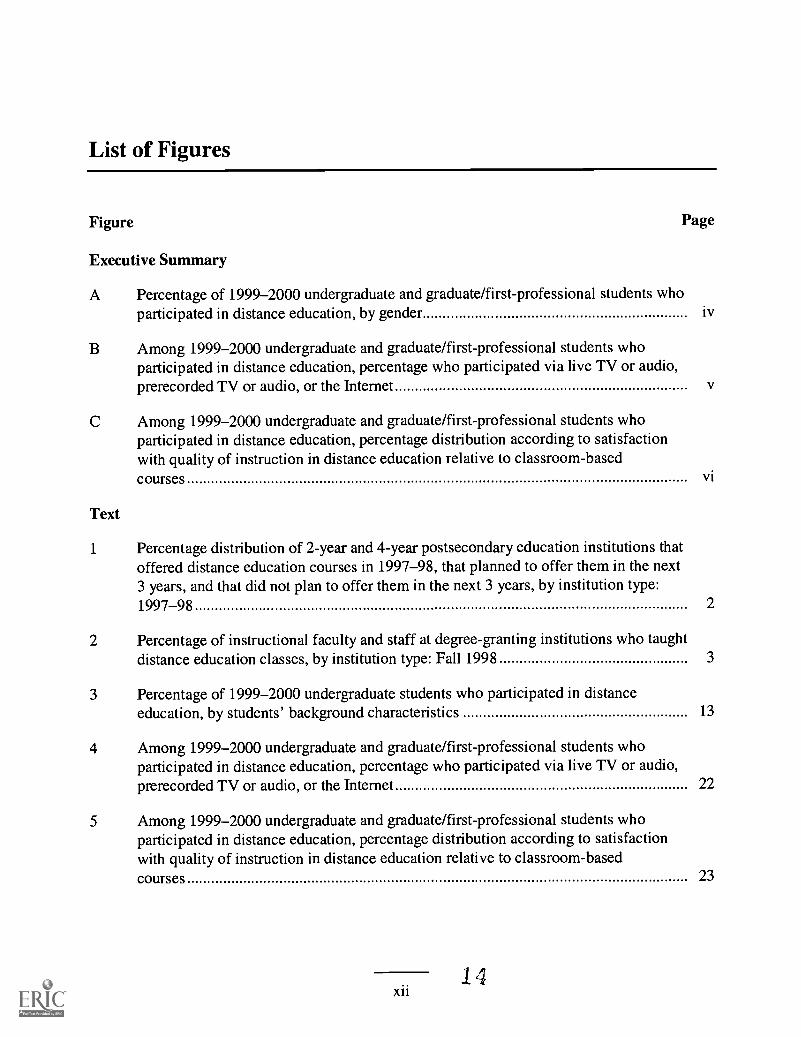
A Percentage of 1999-2000 undergraduate and graduate/first-professional students whoparticipated in distance education, by gender iv
B Among 1999-2000 undergraduate and graduate/first-professional students whoparticipated in distance education, percentage who participated via live TV or audio,prerecorded TV or audio, or the Internet v
C Among 1999-2000 undergraduate and graduate/first-professional students whoparticipated in distance education, percentage distribution according to satisfactionwith quality of instruction in distance education relative to classroom-basedcourses vi
Text
1 Percentage distribution of 2-year and 4-year postsecondary education institutions thatoffered distance education courses in 1997-98, that planned to offer them in the next3 years, and that did not plan to offer them in the next 3 years, by institution type:1997-98 2
2 Percentage of instructional faculty and staff at degree-granting institutions who taughtdistance education classes, by institution type: Fall 1998 3
3 Percentage of 1999-2000 undergraduate students who participated in distanceeducation, by students' background characteristics 13
4 Among 1999-2000 undergraduate and graduate/first-professional students whoparticipated in distance education, percentage who participated via live TV or audio,prerecorded TV or audio, or the Internet 22
5 Among 1999-2000 undergraduate and graduate/first-professional students whoparticipated in distance education, percentage distribution according to satisfactionwith quality of instruction in distance education relative to classroom-basedcourses 23
xii14
Introduction
The National Center for Education Statistics report Distance Education at Postsecondary
Institutions: 1997-98 states that about one-third of the nation's colleges and universities offereddistance education courses during the 1997-98 academic year and another fifth planned to do so
in the near future' (figure 1) (Lewis et al. 1999). To meet their distance education goals,
institutions plan to commit considerable amounts of public and private resources to install,
improve, and maintain their technological infrastructures (Oblinger, Barone, and Hawkins 2001).
Given the potential costs and widespread distribution of distance education programs, it is
important to know just how many students currently participate in distance education and who
they are.
Although past reports have shown that institutional participation in distance education has
grown rapidly (Lewis et al. 1999), in 1999-2000 the proportions of graduate and undergraduate
students who reported participating in distance education through the institutions in which they
were primarily enrolled were relatively small: 8 percent of all undergraduates and 10 percent of
all graduate students reported doing so.2 This study offers an overview of distance education
participation with respect to student demographic and academic characteristics and institutional
types. In addition, it explores how their distance education courses were deliveredwhether via
live or interactive TV or audio, the Internet, or prerecorded TV or audiofrom a question that
participants were asked in the 1999-2000 National Postsecondary Student Aid Study
(NPSAS:2000).
While students did not report their reasons for taking distance education courses in NPSAS,
the current study explores why certain students might participate. For example, students who are
pressured for time, such as those who are parents or who work full time, might be more likely
1It is worth noting that while public 4-year institutions were more likely than public 2-year institutions to have offered distanceeducation classes in 1997-98, a higher proportion of students at public 2-year institutions participated in distance educationclasses in 1999-2000.2To enable comparisons according to institutional characteristics, the base for all NPSAS analyses in this report are students whoparticipated in distance education at either the institution at which they were primarily enrolled or at both the institution at whichthey were primarily enrolled and somewhere else. Students who participated in distance education classes entirely at institutionsother than the one at which they were primarily enrolled were excluded. Of all 1999-2000 undergraduates, 0.50 percentparticipated in distance education entirely at an institution other than the one at which they were primarily enrolled. Of allgraduate and first-professional students, roughly 1 percent participated in distance education entirely at an institution other thanthe one at which they were primarily enrolled. Of students who attended more than one institution, 12 percent participated indistance education compared to 8 percent of students who attended one institution.
1 15 BEST COPY MARIO

Introduction
Figure 1.Percentage distribution of 2-year and 4-year postsecondary education institutions that offereddistance education courses in 1997-98, that planned to offer them in the next 3 years, and thatdid not plan to offer them in the next 3 years, by institution type: 1997-98
Percent100
75
50
25
0
18
r20
62
A5
78
All Public Private Public Privateinstitutions 2-year 2-year 4-year 4-year
(5,010) (1,230) (1,120) (610) (2,050)
0 Did not offer in 1997-98 and didnot plan to offer in next 3 years
Planned to offer distanceeducation in next 3 years
0 Offered distance education in1997-98
NOTE: Percentages are based on the estimated 5,010 2-year and 4-year postsecondary education institutions in the nation.Percentages may not add to 100 due to rounding.
SOURCE: Taken from table 2, Lewis, L., Snow, K., Farris, E., and Levin, D. (1999). Distance Education at PostsecondaryEducation Institutions: 1997-1998 (NCES 2000-013). U.S. Department of Education, National Center for EducationStatistics. Washington, DC: U.S. Government Printing Office.
than other students to participate more often (Gladieux and Swail 1999). Or perhaps students
with disabilities who have trouble attending classes might participate at a higher rate than their
peers without disabilities. Also, students who have trouble scheduling their classes due to family
or employment obligations or have to commute long distances might find distance education
more convenient. Finally, younger students, who are more familiar with Internet technology,
might be more likely to participate than their older peers (Gladieux and Swail 1999). Studies
have also shown that faculty at public 2-year institutions are more likely than faculty at private
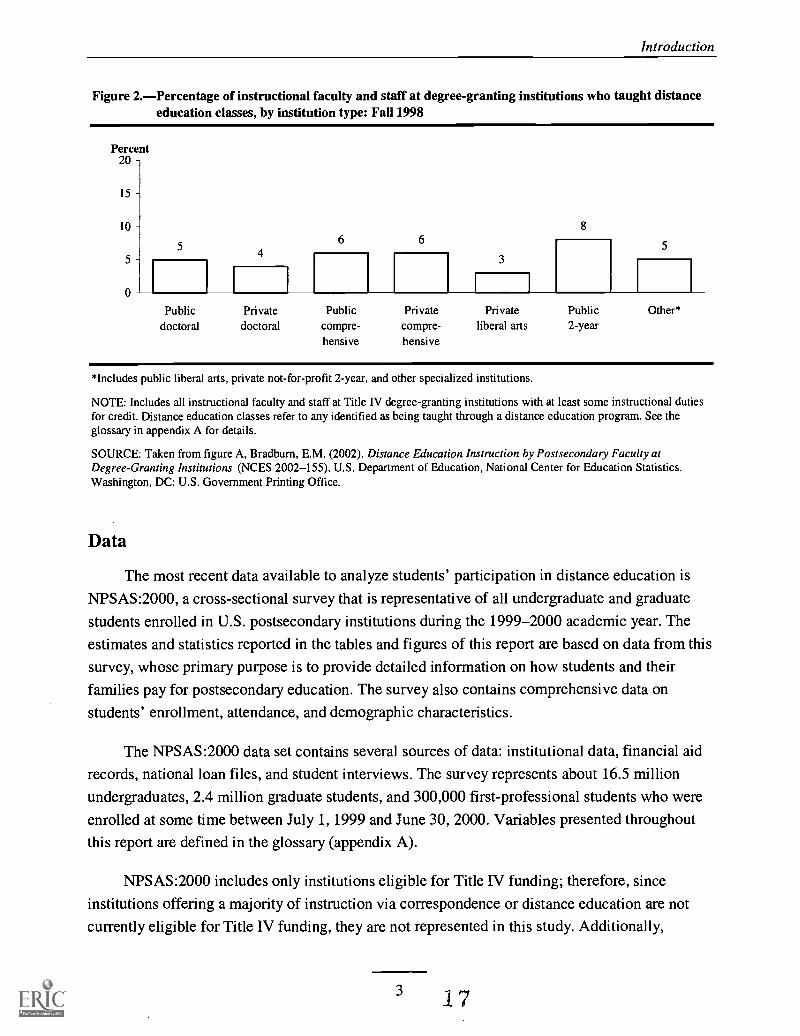
doctoral or liberal arts institutions to teach distance education courses (figure 2) (Bradburn
2002). Based on this finding, one might expect students at public 2-year institutions to participate
more often than their counterparts at 4-year institutions. This analysis will explore these and
other possible reasons why students participate in distance education.
2 16
Introduction
Figure 2.Percentage of instructional faculty and staff at degree-granting institutions who taught distanceeducation classes, by institution type: Fall 1998
Percent20
15
10-5
46 6
3
8
5
Publicdoctoral
Privatedoctoral
Publiccompre-hensive
Private Privatecompre- liberal artshensive
Public2-year
Other*
*Includes public liberal arts, private not-for-profit 2-year, and other specialized institutions.
NOTE: Includes all instructional faculty and staff at Title IV degree-granting institutions with at least some instructional dutiesfor credit. Distance education classes refer to any identified as being taught through a distance education program. See theglossary in appendix A for details.
SOURCE: Taken from figure A, Bradbum, E.M. (2002). Distance Education Instruction by Postsecondary Faculty atDegree-Granting Institutions (NCES 2002-155). U.S. Department of Education, National Center for Education Statistics.Washington, DC: U.S. Government Printing Office.
Data
The most recent data available to analyze students' participation in distance education is
NPSAS:2000, a cross-sectional survey that is representative of all undergraduate and graduate
students enrolled in U.S. postsecondary institutions during the 1999-2000 academic year. The
estimates and statistics reported in the tables and figures of this report are based on data from this
survey, whose primary purpose is to provide detailed information on how students and their
families pay for postsecondary education. The survey also contains comprehensive data on
students' enrollment, attendance, and demographic characteristics.
The NPSAS:2000 data set contains several sources of data: institutional data, financial aid
records, national loan files, and student interviews. The survey represents about 16.5 million
undergraduates, 2.4 million graduate students, and 300,000 first-professional students who were
enrolled at some time between July 1, 1999 and June 30, 2000. Variables presented throughout
this report are defined in the glossary (appendix A).
NPSAS:2000 includes only institutions eligible for Title IV funding; therefore, since
institutions offering a majority of instruction via correspondence or distance education are not
currently eligible for Title IV funding, they are not represented in this study. Additionally,
3 17

Introduction
NPSAS:2000 includes only students enrolled for credit at Title IV-eligible institutions. Thus,
students enrolled only in non-credit courses (many of which could be distance education courses)
are not included in this sample.
Organization of This Report
This report describes students' overall participation in distance education courses, the
distance education technology that they used, and the extent to which they were satisfied with
distance education courses. The report also includes a multivariate analysis that shows the
residual relationship of various student characteristics to distance education participation.
4 18

Overall Participation in Distance Education
Differences Among Undergraduates
In 1999-2000, undergraduates who were surveyed in NPSAS were asked, "During the
1999-2000 school year, did you take any courses for credit that were distance education
courses?" The survey interviewer then clarified the question by stating, "By distance education, I
mean courses delivered off campus using live, interactive TV or audio, prerecorded TV or audio,
CD-ROM, or a computer-based system such as the Internet, e-mail, or chat rooms."3 This study
examines students' responses by their demographic, family background, institution, andacademic characteristics. Among undergraduates, there were many differences in the extent to
which students participated in distance education, including differences by gender, age, and
language spoken in the home. For example, females were more likely than males to take distance
education courses (9 versus 7 percent) (table 1). Students whose primary language in the home
was English were more likely to participate in distance education than students whose primary
language was not English (8 versus 6 percent), although there were no differences among
racial/ethnic groups. Additionally, undergraduates age 24 and over were more likely than
students under 24 to participate (10 versus 6 percent).
The fact that older, working undergraduates participate in distance education at higher rates
than their counterparts offers an initial indication that distance education might be especially
attractive to students with family and work responsibilities. One might expect, then, that other
characteristics such as marital status and parenthood would be related to greater levels of
participation as well. As shown in table 2, married students were more likely than those who
were unmarried to participate (11 versus 7 percent). In addition, those with dependent children
(11 versus 7 percent) and those who were single parents (10 versus 7 percent) were more likely to
take distance education classes. Also, independent students were more likely than dependent
students to participate.4 These patterns of participation show that distance education might be a
more attractive option for older students with greater family responsibilities than for their peers.
Distance education rates varied by other family background characteristics as well. Among
independent students, those who earned $50,000 or more were more likely to take distance
3Distance education does not include programs entirely offered through correspondence courses.4lndependent students are 24 or older who, according to financial aid eligibility criteria, are not financially dependent on theirparents, are married, or have dependents.
5 19

Overall Participation in Distance Education
Table 1.-Percentage of 1999-2000 undergraduate students who participated in distance education, and ofthose, the percentage whose entire program was taught through distance education, by studentcharacteristics
Total
Entire programtaught through
distance education
Total 7.6 29.0
GenderMale 6.5 26.2Female 8.5 30.6
Race/ethnicity*White, non-Hispanic 8.0 27.9Black, non-Hispanic 7.9 30.2Hispanic 6.2 33.5Asian 5.8 35.5American Indian/Alaska Native 11.0Pacific Islander/Native Hawaiian 8.5 (#)Other 4.3 (#)
Primary languageEnglish 7.8 28.2Other 6.3 36.1
AgeUnder 24 6.0 23.924 and over 9.9 33.1
Disability statusDisability reported 8.8 31.1No disability reported 7.5 28.7
#Too small to report.*Following the Census 2000 model, NPSAS respondents were given the option of choosing more than one race. Those whochose more than one race were then asked: For historical purposes, could you please identify which single race best describesyou? Priority was given to Hispanic/Latino regardless of race. Since so few students participate in distance education overall, thehistorical version of this variable (rather than the census version) was used to maximize the data by coding students who chosemultiple races into the racial category they would pick if they could only choose one. See the RACE1 variable definition in theGlossary for further discussion.
NOTE: Includes students who participated either only at the institution where they were primarily enrolled or both at theinstitution where they were primarily enrolled and somewhere else. Students who participated in distance education only at aninstitution other than the one where they were primarily enrolled were excluded.
SOURCE: U.S. Department of Education, National Center for Education Statistics, 1999-2000 National Postsecondary StudentAid Study (NPSAS:2000).
education classes than those who earned less than $50,000 (11 versus 9 percent) (table 2). In
contrast, no difference in participation rates was detected between dependent students whose
parents earned $50,000 or more and those whose parents earned less than $50,000 (6 percent
6 0

Overall Participation in Distance Education
Table 2.-Percentage of 1999-2000 undergraduate students who participated in distance education, and ofthose, the percentage whose entire program was taught through distance education, by students'family background characteristics
Total
Entire programtaught through
distance education
Total 7.6 29.0
Dependency statusDependent 5.8 22.5Independent 9.6 33.1
Parents' highest level of educationLess than a bachelor's degree 8.3 31.2Bachelor's degree or higher 6.7 25.8
Family income (dependent students)Less than $50,000 5.7 23.8$50,000 or more 5.9 21.6
Personal income (independent students)Less than $50,000 9.1 31.3$50,000 or more 11.0 37.5
Marital statusMarried 10.9 34.9Not married 6.7 26.2
Dependent childrenOne or more 10.9 33.0None 6.5 26.7
Single parent statusSingle parent 9.8 33.3Not a single parent 7.4 28.3
NOTE: Includes students who participated either only at the institution where they were primarily enrolled or both at theinstitution where they were primarily enrolled and somewhere else. Students who participated in distance education only at aninstitution other than the one where they were primarily enrolled were excluded.
SOURCE: U.S. Department of Education, National Center for Education Statistics, 1999-2000 National Postsecondary StudentAid Study (NPSAS: 2000).
each). Additionally, undergraduates whose parents' highest level of education was less than a
bachelor's degree were more likely to participate in distance education than students whose
parents had earned a bachelor's degree or higher (8 versus 7 percent).
This study and prior institutional studies (Lewis et al. 1999) show that institutions offering
associate's degrees are more likely than other types of institutions to offer distance education. Of
7
2
Overall Participation in Distance Education
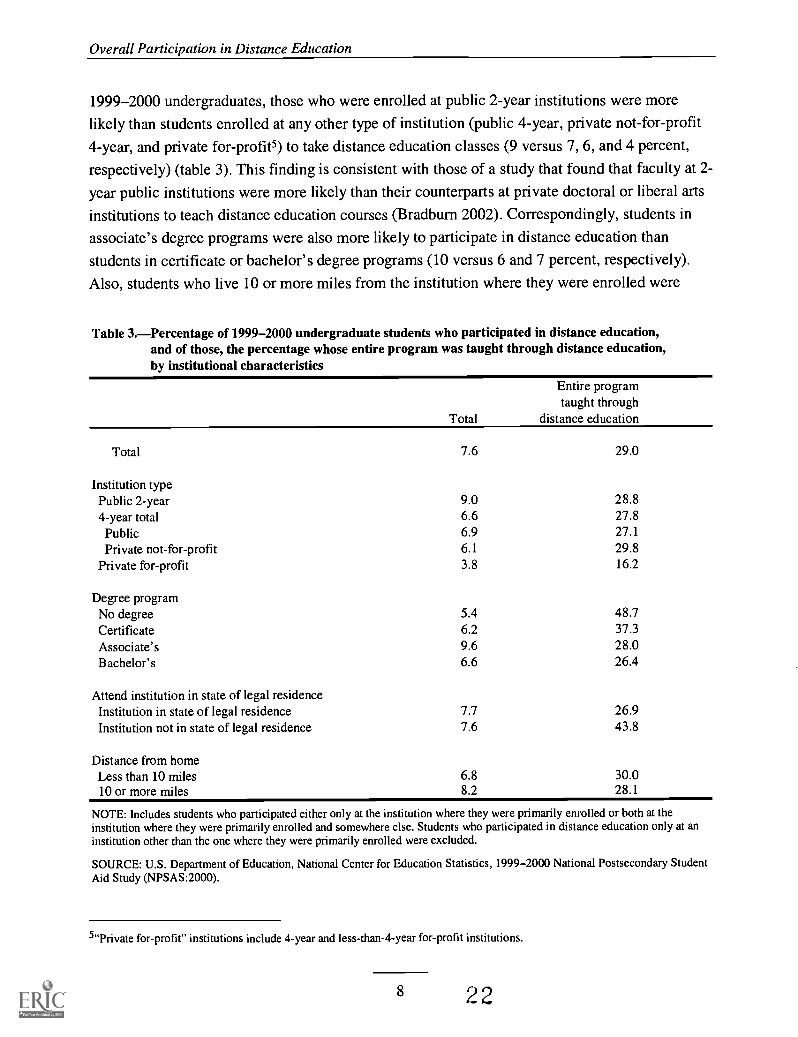
1999-2000 undergraduates, those who were enrolled at public 2-year institutions were more
likely than students enrolled at any other type of institution (public 4-year, private not-for-profit
4-year, and private for profits) to take distance education classes (9 versus 7, 6, and 4 percent,
respectively) (table 3). This finding is consistent with those of a study that found that faculty at 2-
year public institutions were more likely than their counterparts at private doctoral or liberal arts
institutions to teach distance education courses (Bradburn 2002). Correspondingly, students in
associate's degree programs were also more likely to participate in distance education than
students in certificate or bachelor's degree programs (10 versus 6 and 7 percent, respectively).
Also, students who live 10 or more miles from the institution where they were enrolled were
Table 3.-Percentage of 1999-2000 undergraduate students who participated in distance education,and of those, the percentage whose entire program was taught through distance education,by institutional characteristics
Total
Entire programtaught through
distance education
Total 7.6 29.0
Institution typePublic 2-year 9.0 28.84-year total 6.6 27.8
Public 6.9 27.1
Private not-for-profit 6.1 29.8Private for-profit 3.8 16.2
Degree programNo degree 5.4 48.7Certificate 6.2 37.3
Associate's 9.6 28.0Bachelor's 6.6 26.4
Attend institution in state of legal residenceInstitution in state of legal residence 7.7 26.9Institution not in state of legal residence 7.6 43.8
Distance from homeLess than 10 miles 6.8 30.010 or more miles 8.2 28.1
NOTE: Includes students who participated either only at the institution where they were primarily enrolled or both at theinstitution where they were primarily enrolled and somewhere else. Students who participated in distance education only at aninstitution other than the one where they were primarily enrolled were excluded.
SOURCE: U.S. Department of Education, National Center for Education Statistics, 1999-2000 National Postsecondary StudentAid Study (NPSAS:2000).
5"Private for-profit" institutions include 4-year and less-than-4-year for-profit institutions.
8 22
Overall Participation in Distance Education
more likely to participate in distance education than students who live closer to the institution (8
versus 7 percent), but no difference was detected in the participation rates of students who were
enrolled in an institution in their state of legal residence and those who were enrolled out of state.
These findings are consistent with the notion that nontraditional students tend to participate in
distance education at greater rates than traditional students. Nontraditional students (those who
are older, married, parents, and who have greater financial responsibilities) tend to enroll in 2-
year institutions and seek associate's degrees at greater rates than do their more traditional peers.
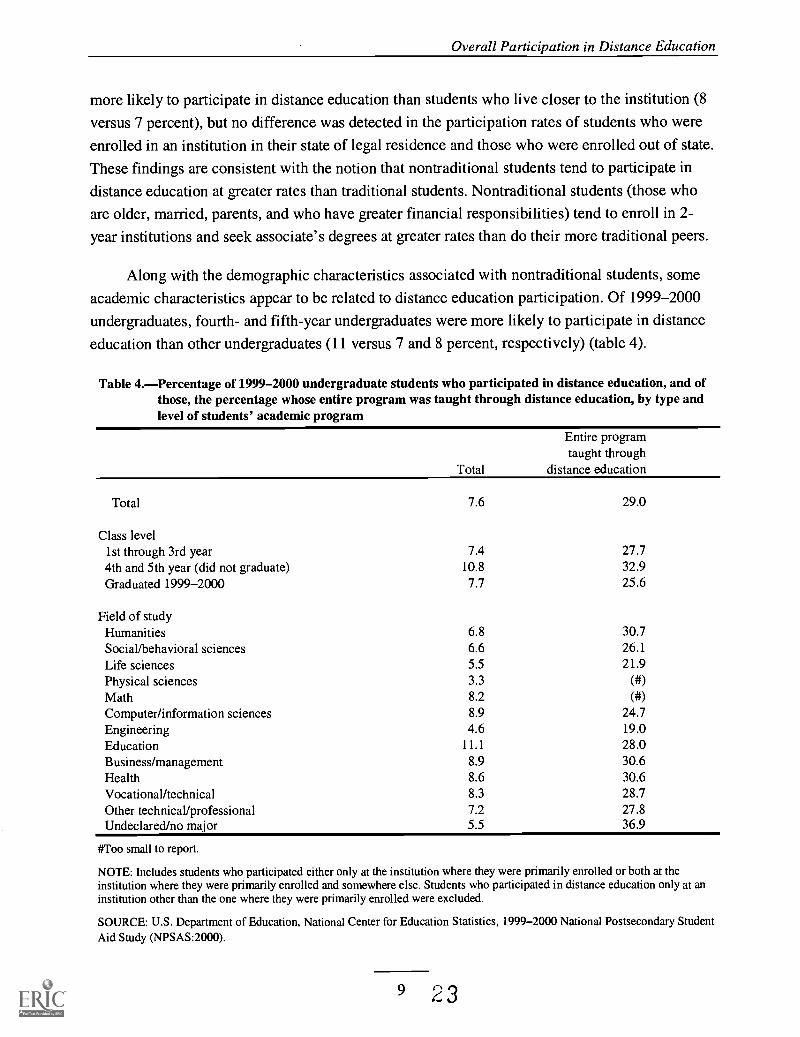
Along with the demographic characteristics associated with nontraditional students, some
academic characteristics appear to be related to distance education participation. Of 1999-2000
undergraduates, fourth- and fifth-year undergraduates were more likely to participate in distance
education than other undergraduates (11 versus 7 and 8 percent, respectively) (table 4).
Table 4.-Percentage of 1999-2000 undergraduate students who participated in distance education, and ofthose, the percentage whose entire program was taught through distance education, by type andlevel of students' academic program
Total
Entire programtaught through
distance education
Total 7.6 29.0
Class level1st through 3rd year 7.4 27.74th and 5th year (did not graduate) 10.8 32.9Graduated 1999-2000 7.7 25.6
Field of studyHumanities 6.8 30.7Social/behavioral sciences 6.6 26.1
Life sciences 5.5 21.9Physical sciences 3.3 (#)Math 8.2 (#)Computer/information sciences 8.9 24.7Engineering 4.6 19.0
Education 11.1 28.0Business/management 8.9 30.6Health 8.6 30.6Vocational/technical 8.3 28.7Other technical/professional 7.2 27.8Undeclared/no major 5.5 36.9
#Too small to report.
NOTE: Includes students who participated either only at the institution where they were primarily enrolled or both at theinstitution where they were primarily enrolled and somewhere else. Students who participated in distance education only at aninstitution other than the one where they were primarily enrolled were excluded.
SOURCE: U.S. Department of Education, National Center for Education Statistics, 1999-2000 National Postsecondary StudentAid Study (NPSAS: 2000).
Overall Participation in Distance Education
Additionally, education majors were more likely to take distance education classes (11 percent)
than students in majors such as: undeclared students (6 percent) and students in the humanities
and social sciences (7 percent each), life sciences and engineering (5 percent each), physical
sciences (3 percent), and other technical fields (7 percent). However, no differences were
detected between the participation rates of students in education and those in mathematics and
vocational studies (8 percent each) and computer sciences, business, and health studies (9 percent
each). These results vary from institutional findings that showed that of the institutions that
offered distance education courses in the 1997-98 academic year, 70 percent offered college-
level, undergraduate distance education courses in English, the humanities, or the social and
behavioral sciences, 55 percent offered such courses in business and management, and 29 percent
offered them in education (Lewis et al. 1999).
In addition to major field of study, other academic characteristics seem to be related to
1999-2000 undergraduates' participation in distance education. For example, consistent with the
finding that older students are more likely to participate, students who delayed entry into
postsecondary education more than 2 years were more likely to participate in distance education
than those who did not delay (10 versus 7 percent) (table 5). Students who attended part time, full
year were more likely to participate in distance education classes than those with other
attendance patterns, including those who attended full time, full year (10 versus 7 percent), full
time, part year (5 percent), and part time, part year (7 percent). Additionally, students with two or
more persistence risk factors6 were more likely than those with zero or one risk factor to
participate (9 versus 5 and 6 percent, respectively), as were students who took remedial courses
as an undergraduate compared with those without remedial courses (9 versus 7 percent).
However, there was no difference in the participation rates of students whose cumulative college
grade-point average (GPA) was 2.99 or lower and those with a cumulative GPA of 3.00 or higher
(7 and 8 percent, respectively). Taken together, most of these findings suggest that students who
might be hindered in their ability to complete collegesuch as those who have taken remedialcourses and those who are more likely to be at risk of not completing postsecondary educationparticipate in distance education at greater rates than their peers with fewer persistence risk
factors or who need less remediation upon postsecondary enrollment.
Family responsibilities are not the only pull on students' time that might motivate them to
try distance education courses. Undergraduates with greater employment responsibilities also
tend to participate in distance education at greater rates than those of their peers with fewer work
6lndex of risk represents an index of risk from 0-7 that is related to seven characteristics known to adversely affect persistenceand attainment. These characteristics include delayed enrollment, no high school diploma (including GED recipients), part-timeenrollment, financial independence, having dependents other than spouse, single-parent status, and working full time whileenrolled.

Overall Participation in Distance Education
Table 5.-Percentage of 1999-2000 undergraduate students who participated in distance education, and ofthose, the percentage whose entire program was taught through distance education, by students'academic performance and attendance pattern
Total
Entire programtaught through
distance education
Total 7.6 29.0
High school degreeHigh school diploma 7.6 29.1
GED, certificate, or foreign student 8.6 25.5No high school diploma 3.1 (#)
Delayed enrollment into postsecondary educationDid not delay 7.0 28.2Delayed 1 to 2 years 8.2 29.3Delayed more than 2 years 9.7 30.2
Attendance patternFull-time, full-year 7.2 21.0Full-time, part-year 5.3 34.6Part-time, full-year 10.2 25.8Part-time, part-year 7.4 44.5
Risk index*Zero 5.3 20.6One 6.2 22.1Two or more 9.3 32.8
College cumulative grade-point averageLess than 3.00 7.3 27.83.00 and higher 8.0 29.4
Took any remedial coursesOne or more 8.9 27.8None 7.1 29.7
#Too small to report.*Represents an index of risk from 0-7 characteristics negatively associated with persistence and attainment. Characteristicsinclude delayed enrollment, no high school diploma (including GED recipients), part-time enrollment, financial independence,having dependents other than spouse, single-parent status, and working full time while enrolled.
NOTE: Includes students who participated either only at the institution where they were primarily enrolled or both at theinstitution where they were primarily enrolled and somewhere else. Students who participated in distance education only at aninstitution other than the one where they were primarily enrolled were excluded.
SOURCE: U.S. Department of Education, National Center for Education Statistics, 1999-2000 National Postsecondary StudentAid Study (NPSAS:2000).
obligations. Students who worked full time were more likely than those who worked part time or
did not work at all to participate in distance education classes (9 versus 7 and 6 percent,

Overall Participation in Distance Education
respectively) (table 6). Also, students who considered themselves employees who study were
more likely to participate than students who considered themselves students who work or who
did not work (10 versus 7 and 6 percent, respectively). Students who worked were also more
likely than those who did not work to take distance education classes (7 versus 6 percent).?
Table 6.Percentage of 1999-2000 undergraduate students who participated in distance education,and of those, the percentage whose entire program was taught through distance education,by employment characteristics
Total
Entire programtaught through
distance education
Total 7.6 29.0
Primary roleEmployee who studies 9.5 39.1
Student who works 7.3 22.4Student who does not work 5.8 24.0
Work intensity while enrolledFull-time 9.1 34.9Part-time 7.2 24.0Did not work 5.8 24.0
NOTE: Includes students who participated either only at the institution where they were primarily enrolled or both at theinstitution where they were primarily enrolled and somewhere else. Students who participated in distance education only at aninstitution other than the one where they were primarily enrolled were excluded.
SOURCE: U.S. Department of Education, National Center for Education Statistics, 1999-2000 National Postsecondary StudentAid Study (NPSAS:2000).
Finally, though a difference was not detected, the relationship between students' disability
status and participation in distance education was examined. Nine percent of students who
reported having any disability and 8 percent of students who did not report any disability
participated in distance education (table 1).
Overall, the results of this study show that among 1999-2000 undergraduates, several
groups of students tended to participate in distance education at higher rates than others. These
undergraduates were those with greater family and work responsibilities such as those who were
older, were married, or had dependent children (figure 3).
?Students who worked while enrolled were asked, "While you were enrolled and working, would you say you were primarily astudent working to meet expenses or an employee who decided to enroll in school?" Students were then categorized as"employees who study," "a student who works," or "a student who does not work."
1226

Overall Participation in Distance Education
Figure 3.Percentage of 1999-2000 undergraduate students who participated in distance education, bystudents' background characteristics
Percent20
15
10
5
6
10
A
7
0Dependent Independent Not married
Dependency status
11
AMarried
Marital status
7
11
None One or more
Dependent children
NOTE: Includes students who participated either only at the institution where they were primarily enrolled or both at theinstitution where they were primarily enrolled and somewhere else. Students who participated in distance education only at aninstitution other than the one where they were primarily enrolled were excluded.
SOURCE: U.S. Department of Education, National Center for Education Statistics, 1999-2000 National Postsecondary StudentAid Study (NPSAS: 2000).
Differences Among Graduate and First-Professional Students
In many ways, the patterns of participation in distance education among 1999-2000
graduate and first-professional students parallel those of undergraduates: those with more family
and employment responsibilities tended to participate in distance education classes at higher rates
than did their counterparts. Of graduate and first-professional students, 10 percent took distance
education classes in 1999-2000.
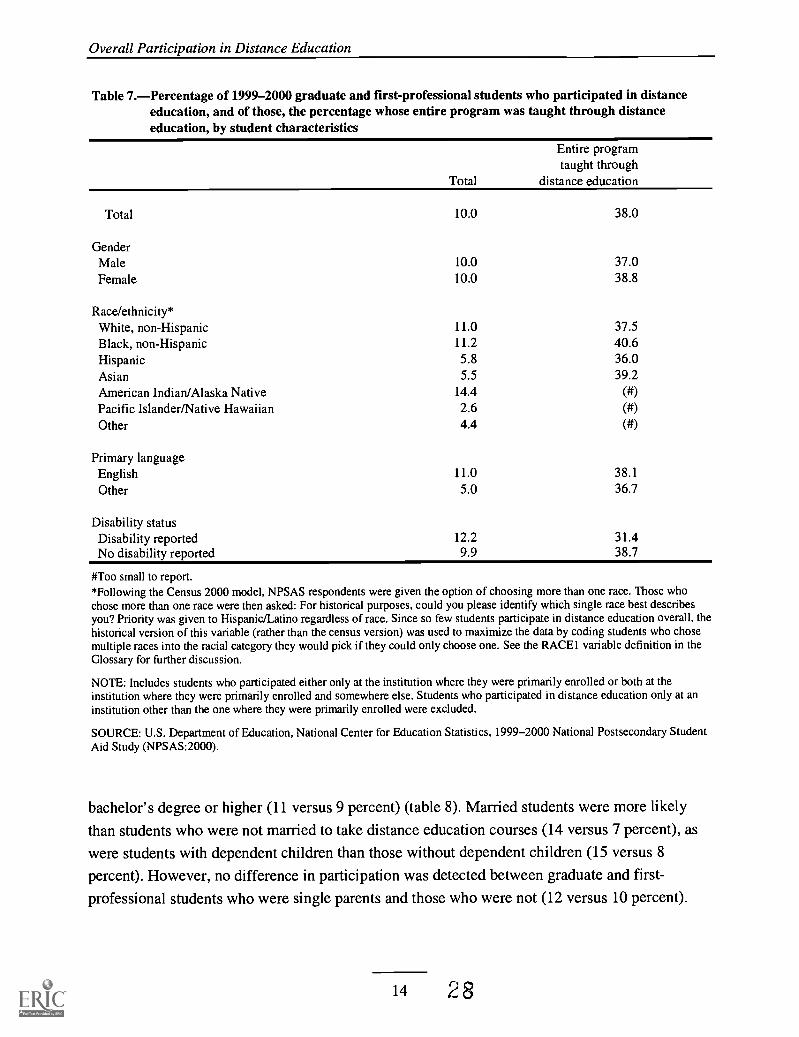
However, unlike undergraduates, no gender differences were detected among graduate
students, but there were racial/ethnic group differences. White graduate and first-professional
students were more likely than Hispanic and Asian students to take such classes, but no
differences were found between White students and either Black or American Indian students
(table 7). Students whose primary language was English were more likely than those who were
not primarily English language speakers to participate in distance education classes (11 versus 5
percent). Similar to undergraduates, no difference was detected in the rates of participation
between graduate students who reported having any disabilities and those who did not.
Graduate and first-professional students whose parents' highest level of education was less
than a bachelor's degree were more likely to participate than students whose parents had a
13 2 7
Overall Participation in Distance Education
Table 7.Percentage of 1999-2000 graduate and first-professional students who participated in distanceeducation, and of those, the percentage whose entire program was taught through distanceeducation, by student characteristics
Total
Entire programtaught through
distance education
Total 10.0 38.0
GenderMale 10.0 37.0Female 10.0 38.8
Race/ethnicity*White, non-Hispanic 11.0 37.5Black, non-Hispanic 11.2 40.6Hispanic 5.8 36.0Asian 5.5 39.2American Indian/Alaska Native 14.4 (#)Pacific Islander/Native Hawaiian 2.6 ( #)
Other 4.4 ( #)
Primary languageEnglish 11.0 38.1
Other 5.0 36.7
Disability statusDisability reported 12.2 31.4No disability reported 9.9 38.7
#Too small to report.*Following the Census 2000 model, NPSAS respondents were given the option of choosing more than one race. Those whochose more than one race were then asked: For historical purposes, could you please identify which single race best describesyou? Priority was given to Hispanic/Latino regardless of race. Since so few students participate in distance education overall, thehistorical version of this variable (rather than the census version) was used to maximize the data by coding students who chosemultiple races into the racial category they would pick if they could only choose one. See the RACE1 variable definition in theGlossary for further discussion.
NOTE: Includes students who participated either only at the institution where they were primarily enrolled or both at theinstitution where they were primarily enrolled and somewhere else. Students who participated in distance education only at aninstitution other than the one where they were primarily enrolled were excluded.
SOURCE: U.S. Department of Education, National Center for Education Statistics, 1999-2000 National Postsecondary StudentAid Study (NPSAS:2000).
bachelor's degree or higher (11 versus 9 percent) (table 8). Married students were more likely
than students who were not married to take distance education courses (14 versus 7 percent), as
were students with dependent children than those without dependent children (15 versus 8
percent). However, no difference in participation was detected between graduate and first-
professional students who were single parents and those who were not (12 versus 10 percent).
14 2
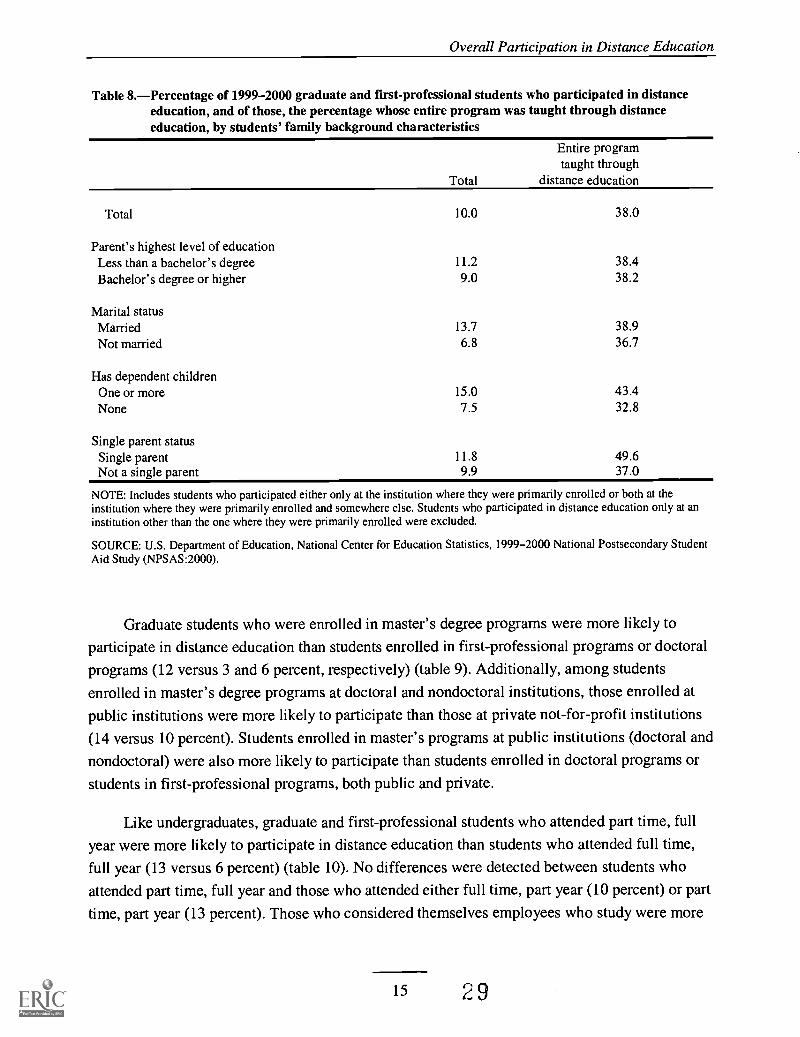
Overall Participation in Distance Education
Table 8.Percentage of 1999-2000 graduate and first-professional students who participated in distanceeducation, and of those, the percentage whose entire program was taught through distanceeducation, by students' family background characteristics
Total
Entire programtaught through
distance education
Total 10.0 38.0
Parent's highest level of educationLess than a bachelor's degree 11.2 38.4Bachelor's degree or higher 9.0 38.2
Marital statusMarried 13.7 38.9Not married 6.8 36.7
Has dependent childrenOne or more 15.0 43.4None 7.5 32.8
Single parent statusSingle parent 11.8 49.6Not a single parent 9.9 37.0
NOTE: Includes students who participated either only at the institution where they were primarily enrolled or both at theinstitution where they were primarily enrolled and somewhere else. Students who participated in distance education only at aninstitution other than the one where they were primarily enrolled were excluded.
SOURCE: U.S. Department of Education, National Center for Education Statistics, 1999-2000 National Postsecondary StudentAid Study (NPSAS:2000).
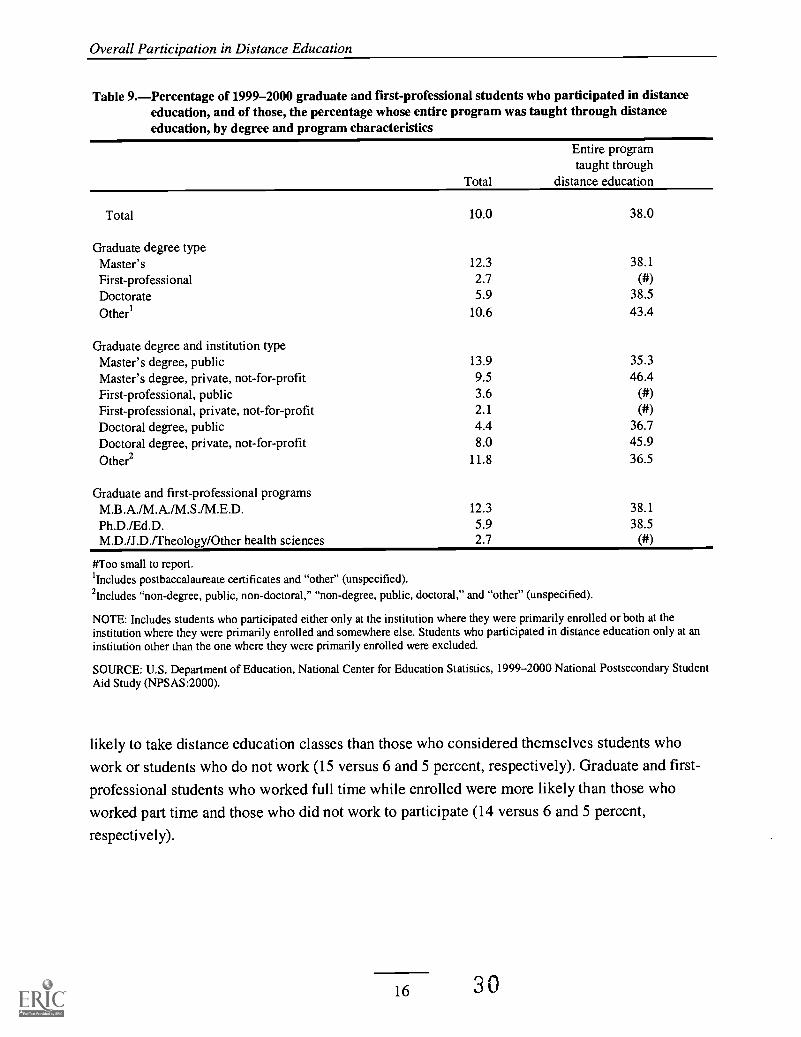
Graduate students who were enrolled in master's degree programs were more likely to
participate in distance education than students enrolled in first-professional programs or doctoral
programs (12 versus 3 and 6 percent, respectively) (table 9). Additionally, among students
enrolled in master's degree programs at doctoral and nondoctoral institutions, those enrolled at
public institutions were more likely to participate than those at private not-for-profit institutions
(14 versus 10 percent). Students enrolled in master's programs at public institutions (doctoral and
nondoctoral) were also more likely to participate than students enrolled in doctoral programs or
students in first-professional programs, both public and private.
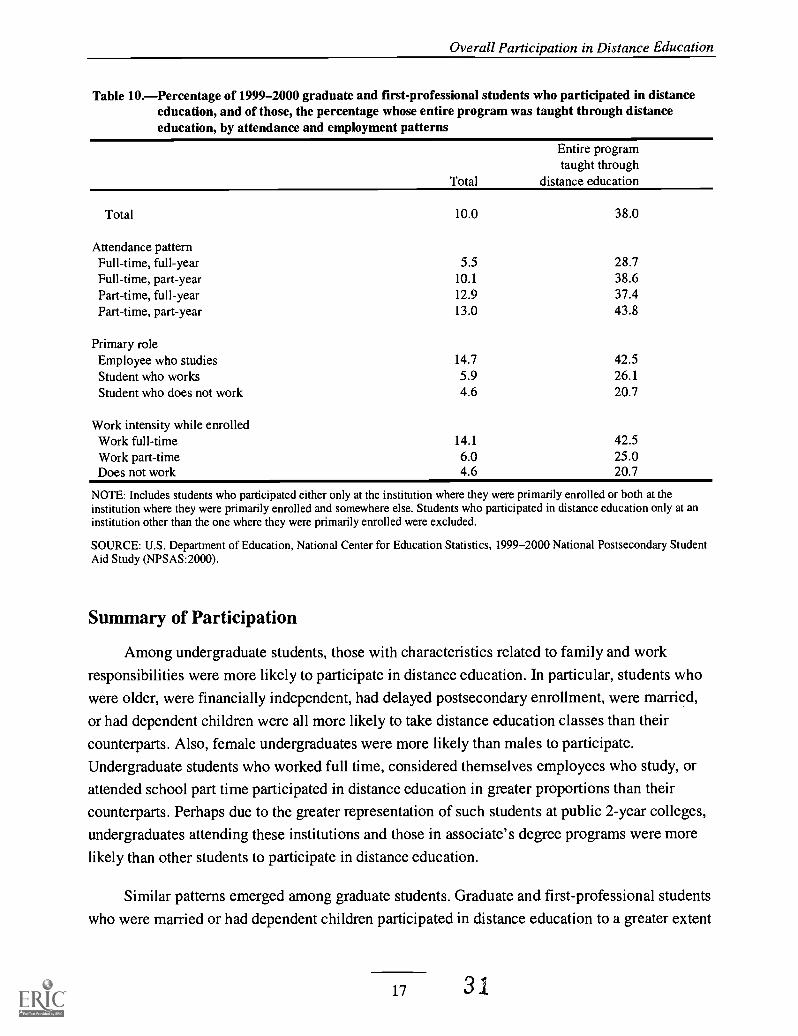
Like undergraduates, graduate and first-professional students who attended part time, full
year were more likely to participate in distance education than students who attended full time,
full year (13 versus 6 percent) (table 10). No differences were detected between students who
attended part time, full year and those who attended either full time, part year (10 percent) or part
time, part year (13 percent). Those who considered themselves employees who study were more
15 29
Overall Participation in Distance Education
Table 9.Percentage of 1999-2000 graduate and first-professional students who participated in distanceeducation, and of those, the percentage whose entire program was taught through distanceeducation, by degree and program characteristics
Total
Entire programtaught through
distance education
Total 10.0 38.0
Graduate degree typeMaster's 12.3 38.1
First-professional 2.7 (#)Doctorate 5.9 38.5
Others 10.6 43.4
Graduate degree and institution typeMaster's degree, public 13.9 35.3
Master's degree, private, not-for-profit 9.5 46.4First-professional, public 3.6 (#)First-professional, private, not-for-profit 2.1 (#)Doctoral degree, public 4.4 36.7Doctoral degree, private, not-for-profit 8.0 45.9
Other2 11.8 36.5
Graduate and first-professional programsM.B.A./M.A./M.S./M.E.D. 12.3 38.1
Ph.D./Ed.D. 5.9 38.5M.D./J.D./Theology/Other health sciences 2.7 ( #)
#Too small to report.'Includes postbaccalaureate certificates and "other" (unspecified).2 Includes "non-degree, public, non-doctoral," "non-degree, public, doctoral," and "other" (unspecified).
NOTE: Includes students who participated either only at the institution where they were primarily enrolled or both at theinstitution where they were primarily enrolled and somewhere else. Students who participated in distance education only at aninstitution other than the one where they were primarily enrolled were excluded.
SOURCE: U.S. Department of Education, National Center for Education Statistics, 1999-2000 National Postsecondary StudentAid Study (NPSAS:2000).
likely to take distance education classes than those who considered themselves students who
work or students who do not work (15 versus 6 and 5 percent, respectively). Graduate and first-
professional students who worked full time while enrolled were more likely than those who
worked part time and those who did not work to participate (14 versus 6 and 5 percent,
respectively).
16 30
Overall Participation in Distance Education
Table 10.Percentage of 1999-2000 graduate and first-professional students who participated in distanceeducation, and of those, the percentage whose entire program was taught through distanceeducation, by attendance and employment patterns
Total
Entire programtaught through
distance education
Total 10.0 38.0
Attendance patternFull-time, full-year 5.5 28.7Full-time, part-year 10.1 38.6Part-time, full-year 12.9 37.4Part-time, part-year 13.0 43.8
Primary roleEmployee who studies 14.7 42.5Student who works 5.9 26.1Student who does not work 4.6 20.7
Work intensity while enrolledWork full-time 14.1 42.5Work part-time 6.0 25.0Does not work 4.6 20.7
NOTE: Includes students who participated either only at the institution where they were primarily enrolled or both at theinstitution where they were primarily enrolled and somewhere else. Students who participated in distance education only at aninstitution other than the one where they were primarily enrolled were excluded.
SOURCE: U.S. Department of Education, National Center for Education Statistics, 1999-2000 National Postsecondary StudentAid Study (NPSAS:2000).
Summary of Participation
Among undergraduate students, those with characteristics related to family and work
responsibilities were more likely to participate in distance education. In particular, students who
were older, were financially independent, had delayed postsecondary enrollment, were married,
or had dependent children were all more likely to take distance education classes than their
counterparts. Also, female undergraduates were more likely than males to participate.
Undergraduate students who worked full time, considered themselves employees who study, or
attended school part time participated in distance education in greater proportions than their
counterparts. Perhaps due to the greater representation of such students at public 2-year colleges,
undergraduates attending these institutions and those in associate's degree programs were more
likely than other students to participate in distance education.
Similar patterns emerged among graduate students. Graduate and first-professional students
who were married or had dependent children participated in distance education to a greater extent
Overall Participation in Distance Education
than their counterparts. Those with greater employment responsibilities were also more likely
than graduates with fewer responsibilities to take distance education courses. Master's degree
students were more likely to participate in distance education than students in other graduate
degree programs, with those attending public institutions participating in higher proportions than
those at private not-for-profit institutions.
18 32
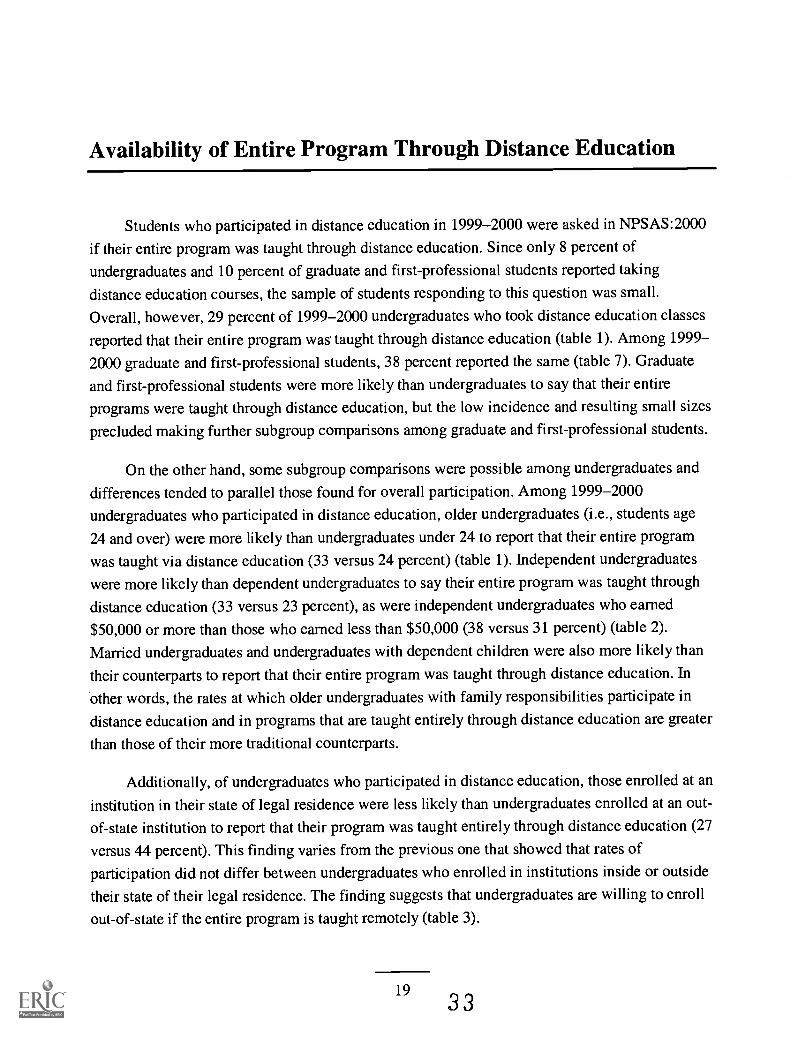
Availability of Entire Program Through Distance Education
Students who participated in distance education in 1999-2000 were asked in NPSAS:2000
if their entire program was taught through distance education. Since only 8 percent of
undergraduates and 10 percent of graduate and first-professional students reported taking
distance education courses, the sample of students responding to this question was small.
Overall, however, 29 percent of 1999-2000 undergraduates who took distance education classes
reported that their entire program was taught through distance education (table 1). Among 1999-
2000 graduate and first-professional students, 38 percent reported the same (table 7). Graduate
and first-professional students were more likely than undergraduates to say that their entire
programs were taught through distance education, but the low incidence and resulting small sizes
precluded making further subgroup comparisons among graduate and first-professional students.
On the other hand, some subgroup comparisons were possible among undergraduates and
differences tended to parallel those found for overall participation. Among 1999-2000undergraduates who participated in distance education, older undergraduates (i.e., students age
24 and over) were more likely than undergraduates under 24 to report that their entire program
was taught via distance education (33 versus 24 percent) (table 1). Independent undergraduates
were more likely than dependent undergraduates to say their entire program was taught through
distance education (33 versus 23 percent), as were independent undergraduates who earned
$50,000 or more than those who earned less than $50,000 (38 versus 31 percent) (table 2).
Married undergraduates and undergraduates with dependent children were also more likely than
their counterparts to report that their entire program was taught through distance education. In
other words, the rates at which older undergraduates with family responsibilities participate in
distance education and in programs that are taught entirely through distance education are greater
than those of their more traditional counterparts.
Additionally, of undergraduates who participated in distance education, those enrolled at an
institution in their state of legal residence were less likely than undergraduates enrolled at an out-
of-state institution to report that their program was taught entirely through distance education (27
versus 44 percent). This finding varies from the previous one that showed that rates of
participation did not differ between undergraduates who enrolled in institutions inside or outside
their state of their legal residence. The finding suggests that undergraduates are willing to enroll
out-of-state if the entire program is taught remotely (table 3).
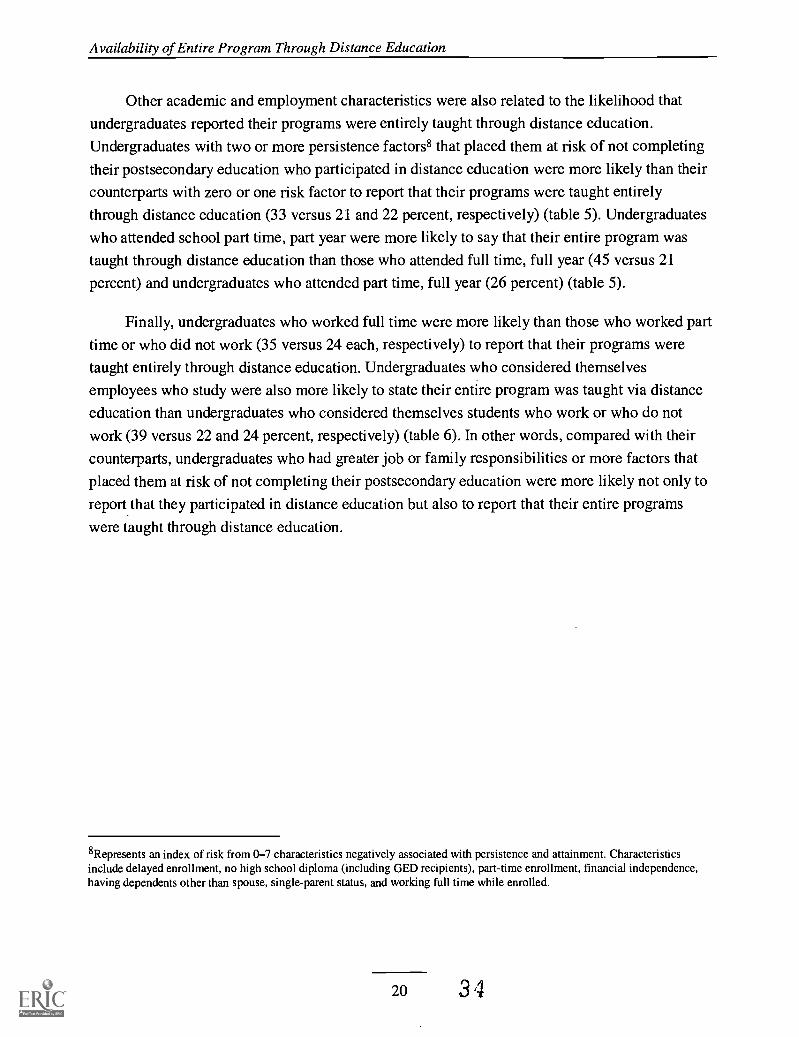
Availability of Entire Program Through Distance Education
Other academic and employment characteristics were also related to the likelihood that
undergraduates reported their programs were entirely taught through distance education.
Undergraduates with two or more persistence factors8 that placed them at risk of not completing
their postsecondary education who participated in distance education were more likely than their
counterparts with zero or one risk factor to report that their programs were taught entirely
through distance education (33 versus 21 and 22 percent, respectively) (table 5). Undergraduates
who attended school part time, part year were more likely to say that their entire program was
taught through distance education than those who attended full time, full year (45 versus 21
percent) and undergraduates who attended part time, full year (26 percent) (table 5).
Finally, undergraduates who worked full time were more likely than those who worked part
time or who did not work (35 versus 24 each, respectively) to report that their programs were
taught entirely through distance education. Undergraduates who considered themselves
employees who study were also more likely to state their entire program was taught via distance
education than undergraduates who considered themselves students who work or who do not
work (39 versus 22 and 24 percent, respectively) (table 6). In other words, compared with their
counterparts, undergraduates who had greater job or family responsibilities or more factors that
placed them at risk of not completing their postsecondary education were more likely not only to
report that they participated in distance education but also to report that their entire programs
were taught through distance education.
8Represents an index of risk from 0-7 characteristics negatively associated with persistence and attainment. Characteristicsinclude delayed enrollment, no high school diploma (including GED recipients), part-time enrollment, financial independence,having dependents other than spouse, single-parent status, and working full time while enrolled.
20 3 4
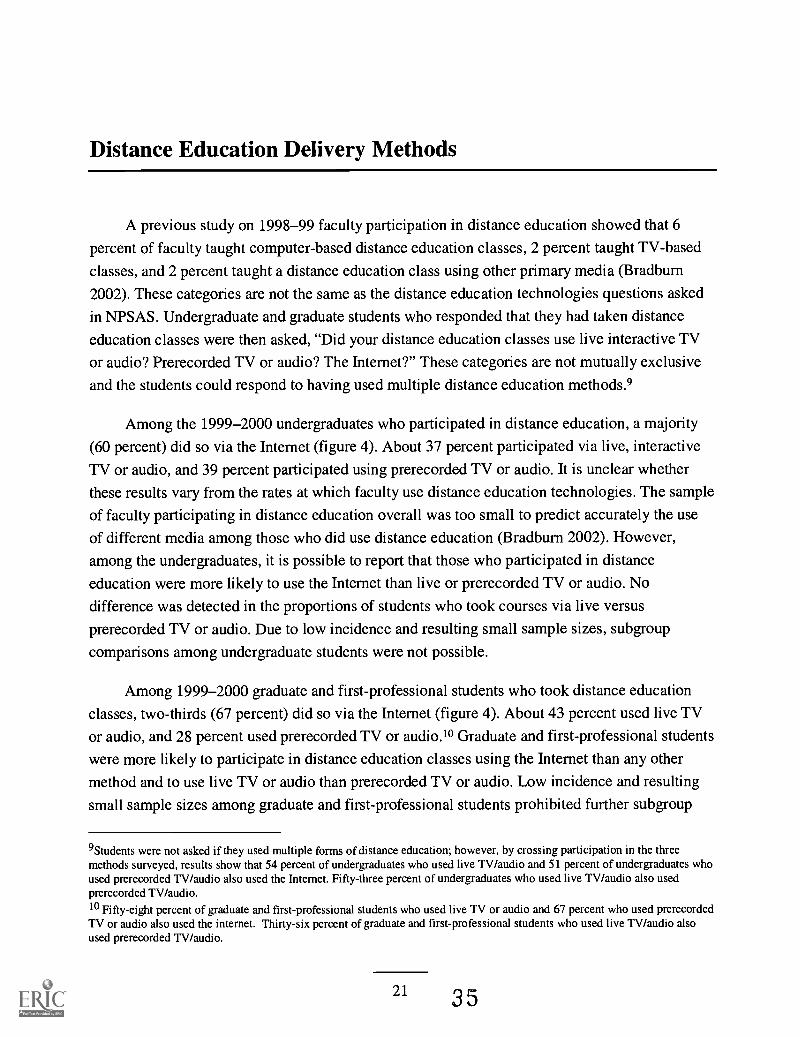
Distance Education Delivery Methods
A previous study on 1998-99 faculty participation in distance education showed that 6
percent of faculty taught computer-based distance education classes, 2 percent taught TV-based
classes, and 2 percent taught a distance education class using other primary media (Bradburn
2002). These categories are not the same as the distance education technologies questions asked
in NPSAS. Undergraduate and graduate students who responded that they had taken distance
education classes were then asked, "Did your distance education classes use live interactive TV
or audio? Prerecorded TV or audio? The Internet?" These categories are not mutually exclusive
and the students could respond to having used multiple distance education methods.9
Among the 1999-2000 undergraduates who participated in distance education, a majority
(60 percent) did so via the Internet (figure 4). About 37 percent participated via live, interactive
TV or audio, and 39 percent participated using prerecorded TV or audio. It is unclear whether
these results vary from the rates at which faculty use distance education technologies. The sample
of faculty participating in distance education overall was too small to predict accurately the use
of different media among those who did use distance education (Bradburn 2002). However,
among the undergraduates, it is possible to report that those who participated in distance
education were more likely to use the Internet than live or prerecorded TV or audio. No
difference was detected in the proportions of students who took courses via live versus
prerecorded TV or audio. Due to low incidence and resulting small sample sizes, subgroup
comparisons among undergraduate students were not possible.
Among 1999-2000 graduate and first-professional students who took distance education
classes, two-thirds (67 percent) did so via the Internet (figure 4). About 43 percent used live TV
or audio, and 28 percent used prerecorded TV or audio.10 Graduate and first-professional students
were more likely to participate in distance education classes using the Internet than any other
method and to use live TV or audio than prerecorded TV or audio. Low incidence and resulting
small sample sizes among graduate and first-professional students prohibited further subgroup
9Students were not asked if they used multiple forms of distance education; however, by crossing participation in the threemethods surveyed, results show that 54 percent of undergraduates who used live TV/audio and 51 percent of undergraduates whoused prerecorded TV/audio also used the Internet. Fifty-three percent of undergraduates who used live TV/audio also usedprerecorded TV/audio.10 Fifty-eight percent of graduate and first-professional students who used live TV or audio and 67 percent who used prerecordedTV or audio also used the internet. Thirty-six percent of graduate and first-professional students who used live TV/audio alsoused prerecorded TV/audio.
21 3 5

Distance Education Delivery Methods
comparisons. Overall, among students who participated in distance education, graduate and first-
professional students were less likely than undergraduates to use prerecorded TV or audio. But
graduate students were more likely than undergraduates to participate in distance education
courses via live TV or audio or the Internet.
Figure 4.Among 1999-2000 undergraduate and graduate/first-professional students who participated indistance education, percentage who participated via live TV or audio, prerecorded TV or audio,or the Internet
Percent100
90
80
70
60
50
40
30
20
10-
0
67
Live TV or audio Prerecorded TV or audio Internet
0 Undergraduate 0 Graduate/first-professional
NOTE: Includes students who participated either only at the institution where they were primarily enrolled or both at theinstitution where they were primarily enrolled and somewhere else. Students who participated in distance education only at aninstitution other than the one where they were primarily enrolled were excluded.
SOURCE: U.S. Department of Education, National Center for Education Statistics, 1999-2000 National Postsecondary StudentAid Study (NPSAS:2000).
22 36

Satisfaction With Distance Education Classes
Undergraduate and graduate students who participated in distance education were asked,
"Compared to other courses you've taken, are you more satisfied, equally satisfied, or less
satisfied with the quality of instruction you've received in your distance education courses?"
While this question did not apply to 7 percent of both undergraduates and graduate students who
could not compare their satisfaction with distance education classes to regular classes because
they had taken all of their courses through distance education, a majority of both graduate and
undergraduate students who had participated in distance education were at least as satisfied or
more satisfied with the quality of teaching in their distance education classes compared with their
regular classes (figure 5). Among 1999-2000 undergraduates who participated in distance
Figure 5.Among 1999-2000 undergraduate and graduate/first-professional students who participated indistance education, percentage distribution according to satisfaction with quality of instructionin distance education relative to classroom-based courses
1
Undergraduate Graduate/first-professional
More satisfied 0 Equally satisfied 0 Less satisfied 0 All courses were distance education courses
NOTE: Includes students who participated either only at the institution where they were primarily enrolled or both at theinstitution where they were primarily enrolled and somewhere else. Students who participated in distance education only at aninstitution other than the one where they were primarily enrolled were excluded. Percentages may not add to 100 due torounding.
SOURCE: U.S. Department of Education, National Center for Education Statistics, 1999-2000 National Postsecondary StudentAid Study (NPSAS:2000).
23 3 7
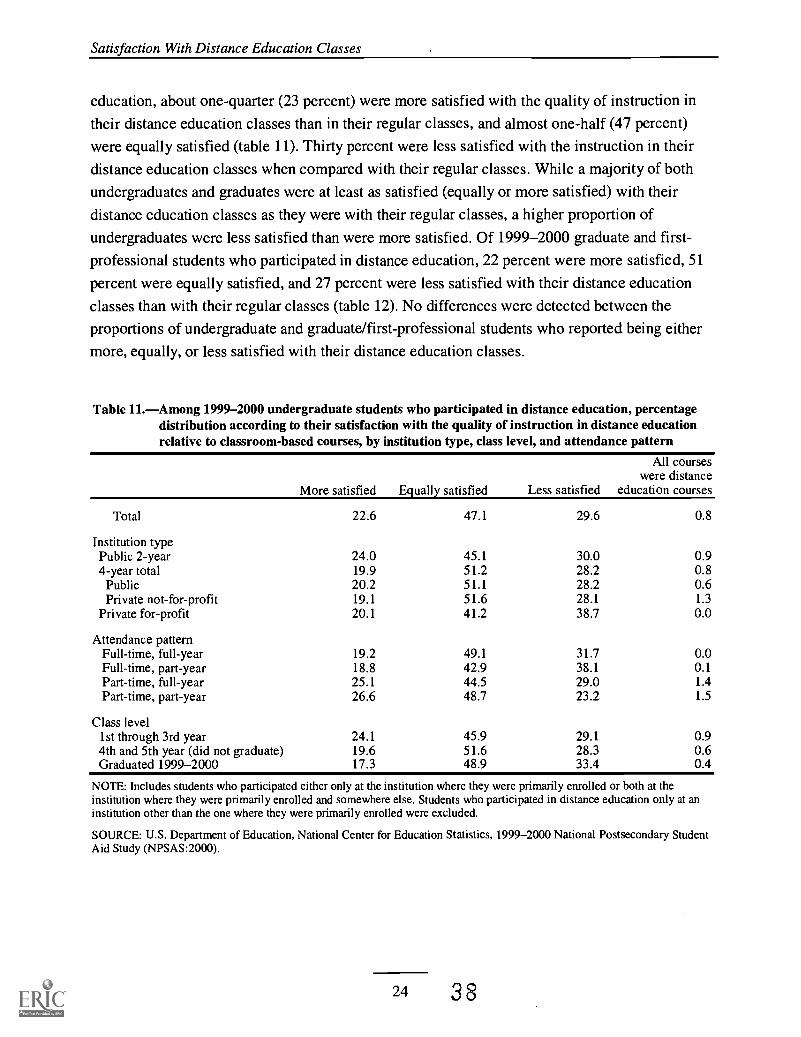
Satisfaction With Distance Education Classes
education, about one-quarter (23 percent) were more satisfied with the quality of instruction in
their distance education classes than in their regular classes, and almost one-half (47 percent)
were equally satisfied (table 11). Thirty percent were less satisfied with the instruction in their
distance education classes when compared with their regular classes. While a majority of both
undergraduates and graduates were at least as satisfied (equally or more satisfied) with their
distance education classes as they were with their regular classes, a higher proportion of
undergraduates were less satisfied than were more satisfied. Of 1999-2000 graduate and first-
professional students who participated in distance education, 22 percent were more satisfied, 51
percent were equally satisfied, and 27 percent were less satisfied with their distance education
classes than with their regular classes (table 12). No differences were detected between the
proportions of undergraduate and graduate/first-professional students who reported being either
more, equally, or less satisfied with their distance education classes.
Table 11.-Among 1999-2000 undergraduate students who participated in distance education, percentagedistribution according to their satisfaction with the quality of instruction in distance educationrelative to classroom-based courses, by institution type, class level, and attendance pattern
More satisfied Equally satisfied Less satisfied
All courseswere distance
education courses
Total 22.6 47.1 29.6 0.8
Institution typePublic 2-year 24.0 45.1 30.0 0.94-year total 19.9 51.2 28.2 0.8
Public 20.2 51.1 28.2 0.6Private not-for-profit 19.1 51.6 28.1 1.3
Private for-profit 20.1 41.2 38.7 0.0
Attendance patternFull-time, full-year 19.2 49.1 31.7 0.0Full-time, part-year 18.8 42.9 38.1 0.1Part-time, full-year 25.1 44.5 29.0 1.4Part-time, part-year 26.6 48.7 23.2 1.5
Class level1st through 3rd year 24.1 45.9 29.1 0.94th and 5th year (did not graduate) 19.6 51.6 28.3 0.6Graduated 1999-2000 17.3 48.9 33.4 0.4
NOTE: Includes students who participated either only at the institution where they were primarily enrolled or both at theinstitution where they were primarily enrolled and somewhere else. Students who participated in distance education only at aninstitution other than the one where they were primarily enrolled were excluded.
SOURCE: U.S. Department of Education, National Center for Education Statistics, 1999-2000 National Postsecondary StudentAid Study (NPSAS:2000).
24 38

Satisfaction With Distance Education Classes
Table 12.-Among 1999-2000 graduate and first-professional students who participated in distanceeducation, percentage distribution according to satisfaction with the quality of instruction indistance education relative to classroom-based courses, by institution type, class level, andattendance pattern
More satisfied Equally satisfied Less satisfied
All courseswere distance
education courses
Total 21.8 51.1 26.7 0.5
Graduate degree typeMaster's or first-professional 21.5 50.7 27.3 0.5Doctorate 22.8 38.7 38.5 0.0Other 22.9 60.7 15.3 1.1
Attendance patternFull-time, full-year 21.7 41.5 36.6 0.2Full-time, part-year 27.8 50.7 21.6 0.0Part-time, full-year 21.9 52.6 24.6 0.9Part-time, part-year 20.1 55.3 24.2 0.4
NOTE: Includes students who participated either only at the institution where they were primarily enrolled or both at theinstitution where they were primarily enrolled and somewhere else. Students who participated in distance education only at aninstitution other than the one where they were primarily enrolled were excluded.
SOURCE: U.S. Department of Education, National Center for Education Statistics, 1999-2000 National Postsecondary StudentAid Study (NPSAS:2000).
25 39

Multivariate Analysis
The results of the tabular analysis indicate that rates of participation in distance education
tend to vary by the student characteristics associated with greater family and work
responsibilities. That is, older and independent undergraduates and those with dependents and
who worked full time tended to participate in greater proportions than their more traditional
counterparts. These characteristics might be related to other factors associated with participation
in distance education. Because many characteristics are interrelated, it is necessary to conduct a
multivariate analysis that takes this covariation into account. See appendix B for a description of
the multivariate procedure used here.
Tables 13 (undergraduates) and 14 (graduate and first-professional students) offer two
estimates of the percentage of students who participated in distance education. The first column
shows the unadjusted percentages participating for each characteristic, while the second column
shows adjusted percentages after taking into account the covariation among all the independent
variables in the table.
Differences Among Undergraduates
To identify how particular undergraduate student characteristics relate to participation in
distance education, the multivariate analysis took the following independent variables into
consideration: gender, race/ethnicity, age, primary language, parents' highest level of education,
distance from home, risk index, marital status, single parent status, whether one has dependents,
work intensity, delayed enrollment, remedial coursetaking, institution type, attendance pattern,
degree program, and field of study (table 13). These variables were chosen because significant
differences in rates of participation were found in the tabular analysis.
After controlling for the covariation of these variables, most of the characteristics found to
be associated with higher levels of participation in distance education in the tabular analysis
continued to be so in the multivariate analysis. Among 1999-2000 undergraduates, females were
more likely than males to participate in distance education, as were students age 24 and over than
their younger counterparts. Students who had one or two or more risk factors, married students,
and students with dependent children also participated at higher rates than their peers. However,
while the unadjusted percentages of students who primarily spoke any language other than
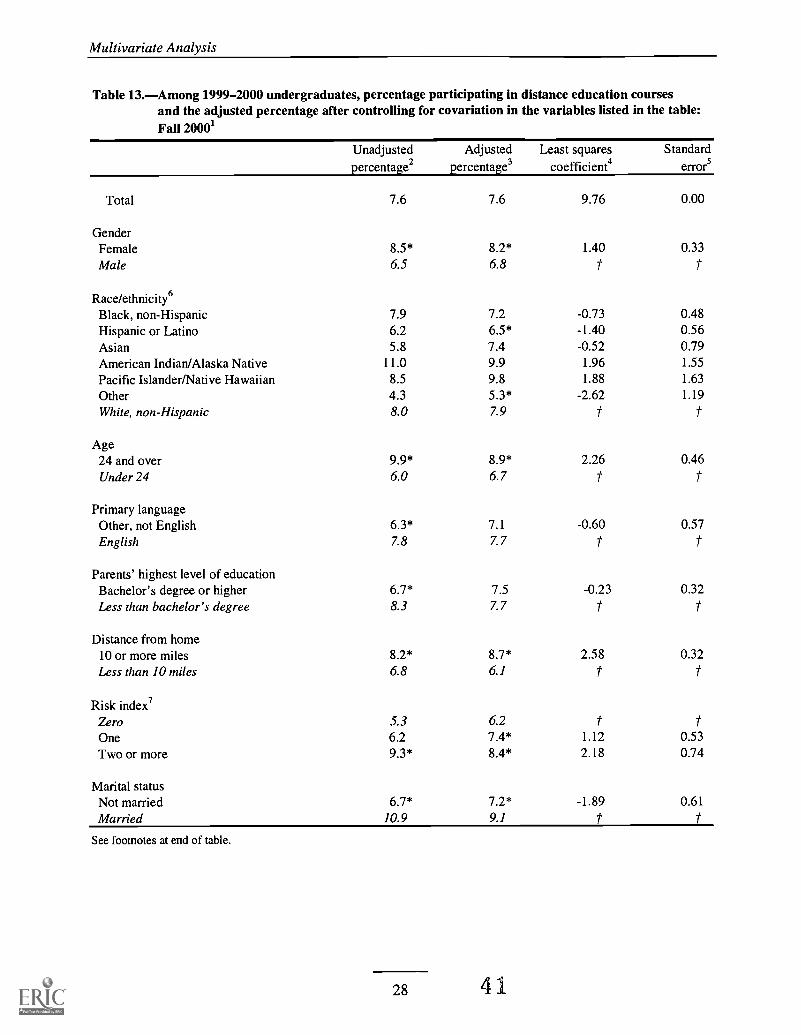
Multivariate Analysis
Table 13.-Among 1999-2000 undergraduates, percentage participating in distance education coursesand the adjusted percentage after controlling for covariation in the variables listed in the table:Fall 20001
Unadjustedpercentage2
Adjustedpercentage3
Least squarescoefficient4
Standarderror5
Total 7.6 7.6 9.76 0.00
GenderFemale 8.5* 8.2* 1.40 0.33Male 6.5 6.8
Race/ethnicity6Black, non-Hispanic 7.9 7.2 -0.73 0.48Hispanic or Latino 6.2 6.5* -1.40 0.56Asian 5.8 7.4 -0.52 0.79American Indian/Alaska Native 11.0 9.9 1.96 1.55
Pacific Islander/Native Hawaiian 8.5 9.8 1.88 1.63
Other 4.3 5.3* -2.62 1.19
White, non-Hispanic 8.0 7.9 t t
Age24 and over 9.9* 8.9* 2.26 0.46Under 24 6.0 6.7
Primary languageOther, not English 6.3* 7.1 -0.60 0.57English 7.8 7.7
Parents' highest level of educationBachelor's degree or higher 6.7* 7.5 -0.23 0.32Less than bachelor's degree 8.3 7.7
Distance from home10 or more miles 8.2* 8.7* 2.58 0.32Less than 10 miles 6.8 6.1 t t
Risk index7Zero 5.3 6.2 t tOne 6.2 7.4* 1.12 0.53Two or more 9.3* 8.4* 2.18 0.74
Marital statusNot married 6.7* 7.2* -1.89 0.61Married 10.9 9.1
See footnotes at end of table.
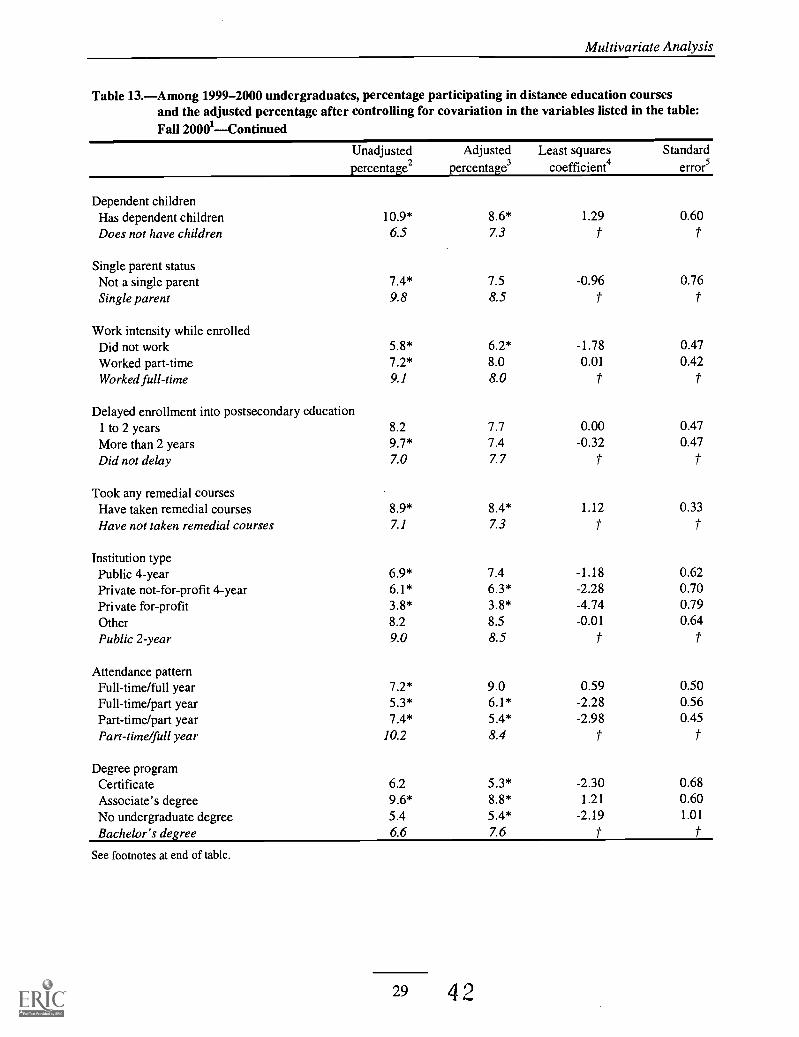
Multivariate Analysis
Table 13.-Among 1999-2000 undergraduates, percentage participating in distance education coursesand the adjusted percentage after controlling for covariation in the variables listed in the table:Fall 20001-Continued
Unadjustedpercentage2
Adjustedpercentage3
Least squarescoefficient4
Standarderror5
Dependent childrenHas dependent childrenDoes not have children
10.9*6.5
8.6*7.3
1.29 0.60
Single parent statusNot a single parent 7.4* 7.5 -0.96 0.76
Single parent 9.8 8.5 t t
Work intensity while enrolledDid not work 5.8* 6.2* -1.78 0.47
Worked part-time 7.2* 8.0 0.01 0.42
Worked full-time 9.1 8.0 t t
Delayed enrollment into postsecondary education1 to 2 years 8.2 7.7 0.00 0.47
More than 2 years 9.7* 7.4 -0.32 0.47
Did not delay 7.0 7.7 t t
Took any remedial coursesHave taken remedial courses 8.9* 8.4* 1.12 0.33
Have not taken remedial courses 7.1 7.3 t i.
Institution typePublic 4-year 6.9* 7.4 -1.18 0.62Private not-for-profit 4-year 6.1* 6.3* -2.28 0.70Private for-profit 3.8* 3.8* -4.74 0.79
Other 8.2 8.5 -0.01 0.64
Public 2-year 9.0 8.5 t t
Attendance patternFull-time/full year 7.2* 9.0 0.59 0.50
Full-time/part year 5.3* 6.1* -2.28 0.56Part-time/part year 7.4* 5.4* -2.98 0.45
Part-time/full year 10.2 8.4 t t
Degree programCertificate 6.2 5.3* -2.30 0.68
Associate's degree 9.6* 8.8* 1.21 0.60No undergraduate degree 5.4 5.4* -2.19 1.01
Bachelor's degree 6.6 7.6 t tSee footnotes at end of table.
29 4
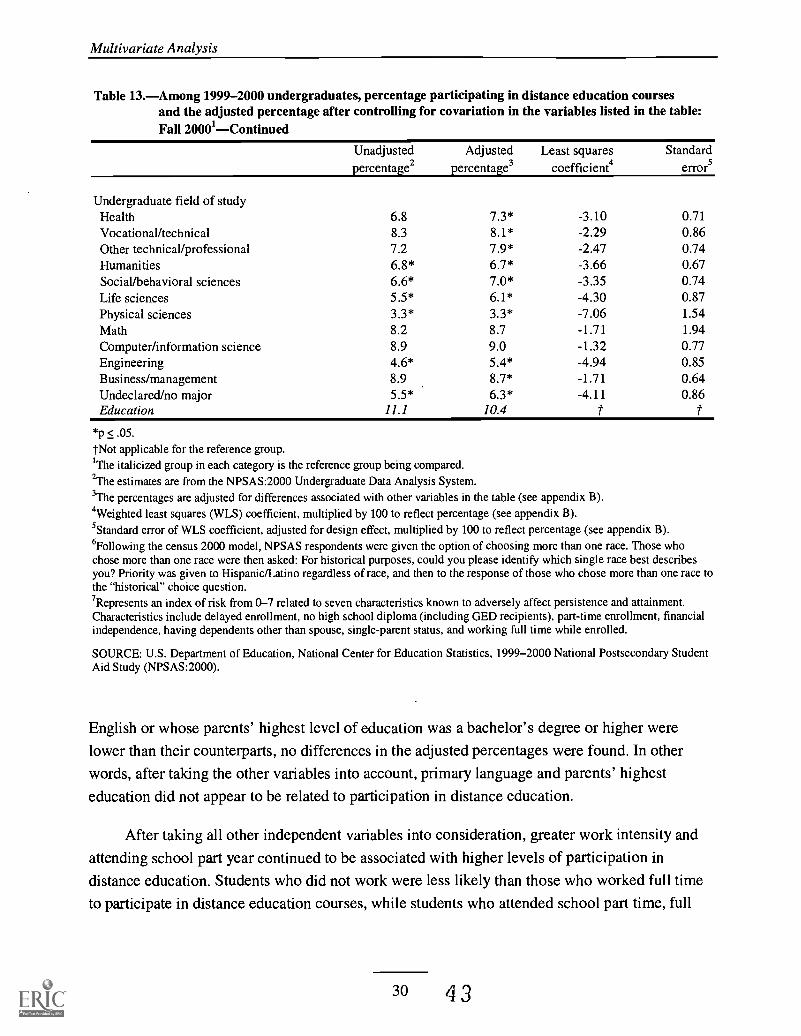
Multivariate Analysis
Table 13.-Among 1999-2000 undergraduates, percentage participating in distance education coursesand the adjusted percentage after controlling for covariation in the variables listed in the table:Fall 20001-Continued
Unadjustedpercentage2
Adjustedpercentage3
Least squarescoefficient4
Standarderror5
Undergraduate field of studyHealth 6.8 7.3* -3.10 0.71VocationaUtechnical 8.3 8.1* -2.29 0.86Other technical/professional 7.2 7.9* -2.47 0.74Humanities 6.8* 6.7* -3.66 0.67Social/behavioral sciences 6.6* 7.0* -3.35 0.74Life sciences 5.5* 6.1* -4.30 0.87Physical sciences 3.3* 3.3* -7.06 1.54Math 8.2 8.7 -1.71 1.94Computer/information science 8.9 9.0 -1.32 0.77Engineering 4.6* 5.4* -4.94 0.85Business/management 8.9 8.7* -1.71 0.64Undeclared/no major 5.5* 6.3* -4.11 0.86Education 11.1 10.4 t t
*p < .05.
tNot applicable for the reference group.'The italicized group in each category is the reference group being compared.2The estimates are from the NPSAS:2000 Undergraduate Data Analysis System.3The percentages are adjusted for differences associated with other variables in the table (see appendix B).4Weighted least squares (WLS) coefficient, multiplied by 100 to reflect percentage (see appendix B).5Standard error of WLS coefficient, adjusted for design effect, multiplied by 100 to reflect percentage (see appendix B).6Following the census 2000 model, NPSAS respondents were given the option of choosing more than one race. Those whochose more than one race were then asked: For historical purposes, could you please identify which single race best describesyou? Priority was given to Hispanic/Latino regardless of race, and then to the response of those who chose more than one race tothe "historical" choice question.7Represents an index of risk from 0-7 related to seven characteristics known to adversely affect persistence and attainment.Characteristics include delayed enrollment, no high school diploma (including GED recipients), part-time enrollment, financialindependence, having dependents other than spouse, single-parent status, and working full time while enrolled.
SOURCE: U.S. Department of Education, National Center for Education Statistics, 1999-2000 National Postsecondary StudentAid Study (NPSAS:2000).
English or whose parents' highest level of education was a bachelor's degree or higher were
lower than their counterparts, no differences in the adjusted percentages were found. In other
words, after taking the other variables into account, primary language and parents' highest
education did not appear to be related to participation in distance education.
After taking all other independent variables into consideration, greater work intensity and
attending school part year continued to be associated with higher levels of participation in
distance education. Students who did not work were less likely than those who worked full time
to participate in distance education courses, while students who attended school part time, full
30 4 3
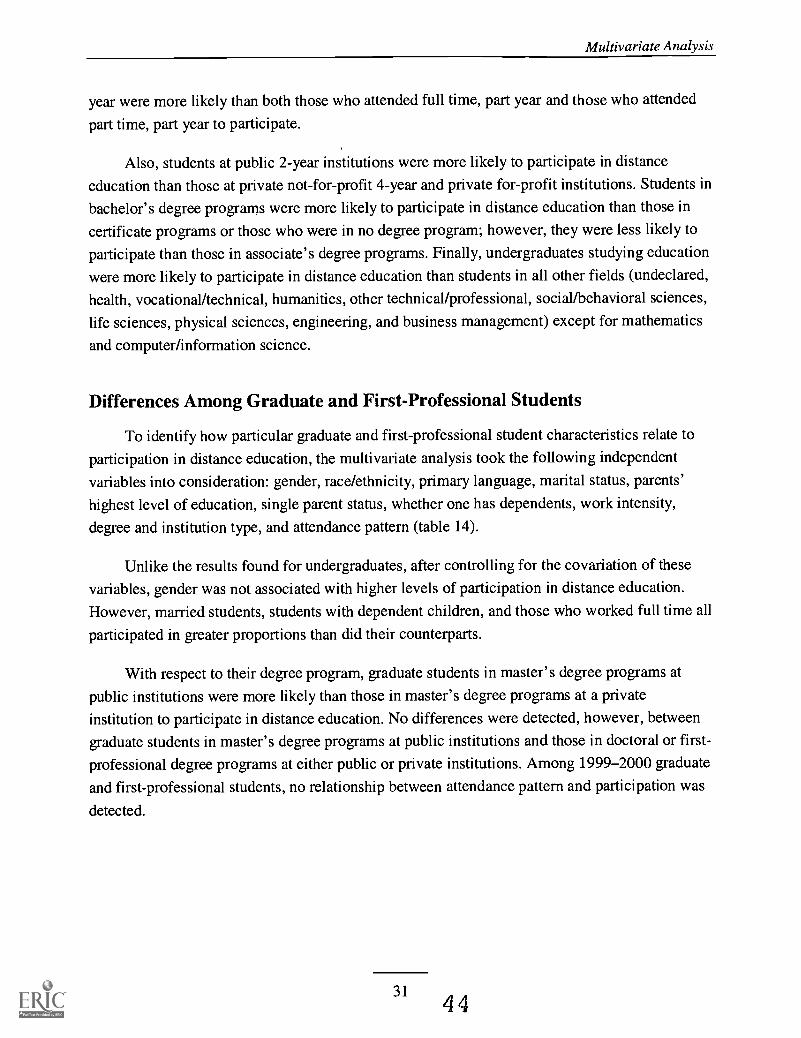
Multivariate Analysis
year were more likely than both those who attended full time, part year and those who attended
part time, part year to participate.
Also, students at public 2-year institutions were more likely to participate in distance
education than those at private not-for-profit 4-year and private for-profit institutions. Students in
bachelor's degree programs were more likely to participate in distance education than those in
certificate programs or those who were in no degree program; however, they were less likely to
participate than those in associate's degree programs. Finally, undergraduates studying education
were more likely to participate in distance education than students in all other fields (undeclared,
health, vocational/technical, humanities, other technical/professional, social/behavioral sciences,
life sciences, physical sciences, engineering, and business management) except for mathematics
and computer/information science.
Differences Among Graduate and First-Professional Students
To identify how particular graduate and first-professional student characteristics relate to
participation in distance education, the multivariate analysis took the following independent
variables into consideration: gender, race/ethnicity, primary language, marital status, parents'
highest level of education, single parent status, whether one has dependents, work intensity,
degree and institution type, and attendance pattern (table 14).
Unlike the results found for undergraduates, after controlling for the covariation of these
variables, gender was not associated with higher levels of participation in distance education.However, married students, students with dependent children, and those who worked full time all
participated in greater proportions than did their counterparts.
With respect to their degree program, graduate students in master's degree programs at
public institutions were more likely than those in master's degree programs at a private
institution to participate in distance education. No differences were detected, however, betweengraduate students in master's degree programs at public institutions and those in doctoral or first-
professional degree programs at either public or private institutions. Among 1999-2000 graduate
and first-professional students, no relationship between attendance pattern and participation was
detected.
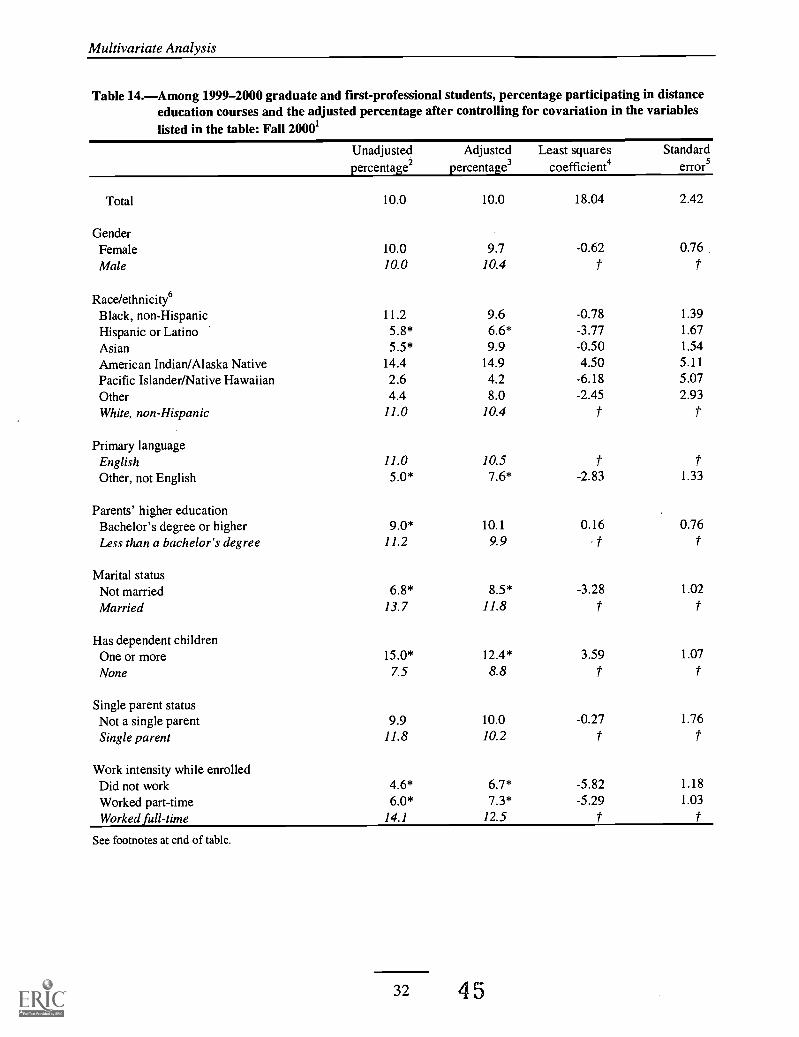
Multivariate Analysis
Table 14.-Among 1999-2000 graduate and first-professional students, percentage participating in distanceeducation courses and the adjusted percentage after controlling for covariation in the variableslisted in the table: Fall 20001
Unadjustedpercentage2
Adjustedpercentage3
Least squarescoefficient's
Standarderror5
Total 10.0 10.0 18.04 2.42
GenderFemale 10.0 9.7 -0.62 0.76.
Male 10.0 10.4
Race/ethnicity6Black, non-Hispanic 11.2 9.6 -0.78 1.39
Hispanic or Latino 5.8* 6.6* -3.77 1.67
Asian 5.5* 9.9 -0.50 1.54
American Indian/Alaska Native 14.4 14.9 4.50 5.11
Pacific Islander/Native Hawaiian 2.6 4.2 -6.18 5.07
Other 4.4 8.0 -2.45 2.93
White, non-Hispanic 11.0 10.4 t t
Primary languageEnglish 11.0 10.5 t tOther, not English 5.0* 7.6* -2.83 1.33
Parents' higher educationBachelor's degree or higher 9.0* 10.1 0.16 0.76Less than a bachelor's degree 11.2 9.9 t t
Marital statusNot married 6.8* 8.5* -3.28 1.02
Married 13.7 11.8
Has dependent childrenOne or more 15.0* 12.4* 3.59 1.07
None 7.5 8.8
Single parent statusNot a single parent 9.9 10.0 -0.27 1.76
Single parent 11.8 10.2 t
Work intensity while enrolledDid not work 4.6* 6.7* -5.82 1.18
Worked part-time 6.0* 7.3* -5.29 1.03
Worked full-time 14.1 12.5
See footnotes at end of table.
32 45

Multivariate Analysis
Table 14.-Among 1999-2000 graduate and first-professional students, percentage participating in distanceeducation courses and the adjusted percentage after controlling for covariation in the variableslisted in the table: Fall 2000'- Continued
Unadjustedpercentage2
Adjustedpercentage3
Least squarescoefficient4
Standarderror5
Graduate degree and institution typeMaster's degree, public 13.9 9.1 t tMaster's degree, private, not-for-profit 9.5* 4.3* -4.76 0.97Doctoral degree, public 4A* 8.5 -0.59 5.69Doctoral degree, private, not-for-profit 8* 12.0 2.95 5.80First-professional, public 3.6* 22.5 13.41 15.13
First-professional, private, not-for-profit 2.1* 20.1 11.04 15.10
Other2 11.8 12.8 3.71 2.45
Graduate degree typeDoctorate 5.9* 7.4 -6.85 5.50First-professional 2.7* -4.7 -18.97 15.00
Other8 10.6 6.2* -8.06 2.61
Master's 12.3 14.3 t t
Attendance patternFull-time, full year 5.5* 9.5 -0.74 1.10
Full-time, part year 10.1 11.6 1.40 1.50
Part-time, part year 13.0 10.0 -0.17 1.01
Part-time, full year 12.9 10.2 t t*p < .05.
-I. Not applicable for the reference group.The italicized group in each category is the reference group being compared.
2 The estimates are from the NPSAS:2000 Undergraduate Data Analysis System.3 The percentages are adjusted for differences associated with other variables in the table (see appendix B).4Weighted least squares (WLS) coefficient, multiplied by 100 to reflect percentage (see appendix B).5 Standard error of WLS coefficient, adjusted for design effect, multiplied by 100 to reflect percentage (see appendix B).6 Following the census 2000 model, NPSAS respondents were given the option of choosing more than one race. Those whochose more than one race were then asked: For historical purposes, could you please identify which single race best describesyou? Priority was given to Hispanic/Latino regardless of race, and then to the response of those who chose more than one raceto the "historical" choice question.7 Includes postbaccalaureate certificates and "other" (unspecified).8 Includes "non-degree, public, non-doctoral," "non-degree, public, doctoral," and "other" (unspecified).
SOURCE: U.S. Department of Education, National Center for Education Statistics, 1999-2000 National Postsecondary StudentAid Study (NPSAS:2000).
33 46 BEST COPY AVAILABLE
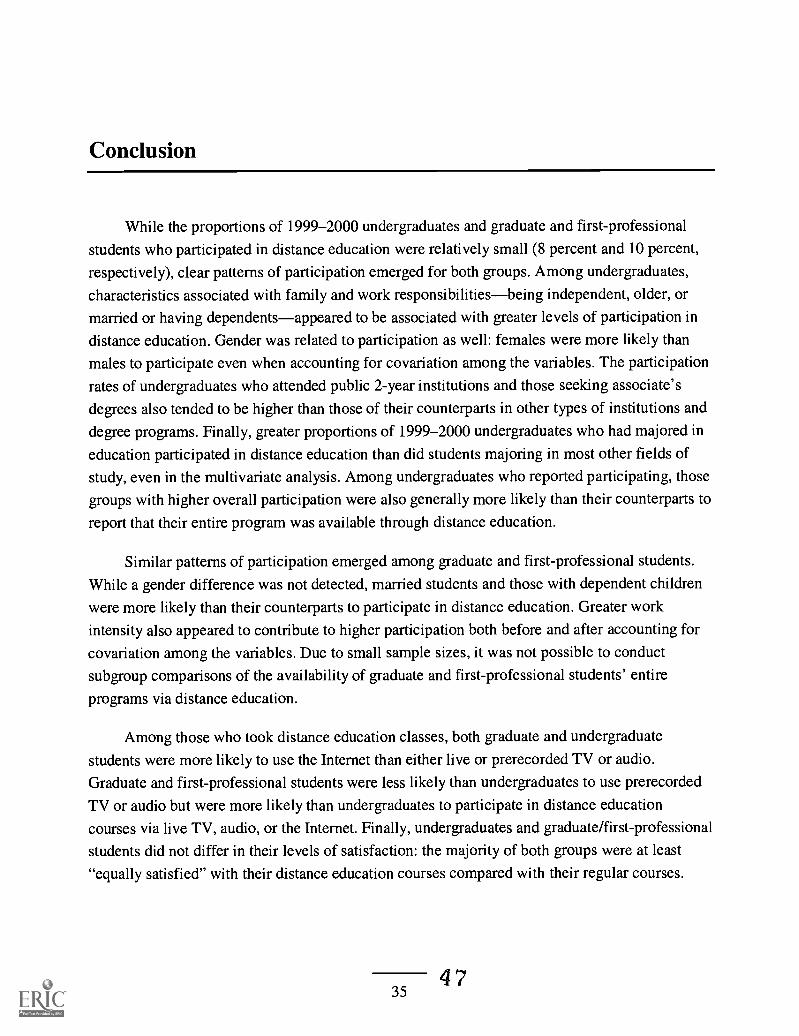
Conclusion
While the proportions of 1999-2000 undergraduates and graduate and first-professional
students who participated in distance education were relatively small (8 percent and 10 percent,
respectively), clear patterns of participation emerged for both groups. Among undergraduates,
characteristics associated with family and work responsibilitiesbeing independent, older, ormarried or having dependentsappeared to be associated with greater levels of participation indistance education. Gender was related to participation as well: females were more likely than
males to participate even when accounting for covariation among the variables. The participation
rates of undergraduates who attended public 2-year institutions and those seeking associate's
degrees also tended to be higher than those of their counterparts in other types of institutions and
degree programs. Finally, greater proportions of 1999-2000 undergraduates who had majored in
education participated in distance education than did students majoring in most other fields of
study, even in the multivariate analysis. Among undergraduates who reported participating, those
groups with higher overall participation were also generally more likely than their counterparts to
report that their entire program was available through distance education.
Similar patterns of participation emerged among graduate and first-professional students.
While a gender difference was not detected, married students and those with dependent children
were more likely than their counterparts to participate in distance education. Greater work
intensity also appeared to contribute to higher participation both before and after accounting for
covariation among the variables. Due to small sample sizes, it was not possible to conduct
subgroup comparisons of the availability of graduate and first-professional students' entire
programs via distance education.
Among those who took distance education classes, both graduate and undergraduate
students were more likely to use the Internet than either live or prerecorded TV or audio.
Graduate and first-professional students were less likely than undergraduates to use prerecorded
TV or audio but were more likely than undergraduates to participate in distance education
courses via live TV, audio, or the Internet. Finally, undergraduates and graduate/first-professional
students did not differ in their levels of satisfaction: the majority of both groups were at least
"equally satisfied" with their distance education courses compared with their regular courses.

References
Bradburn, E.M. (2002). Distance Education Instruction by Postsecondary Faculty and Staff at
Degree-Granting Institutions (NCES 2002-155). U.S. Department of Education, National
Center for Education Statistics. Washington, DC: U.S. Government Printing Office.
Gladieux, L.E., and Swail, W.S. (1999). The Virtual University and Educational Opportunity:
Issues of Equity and Access for the Next Generation. Washington, DC: The College Board.
Horn, L., Peter, K., and Rooney, K. (2002). Profile of Undergraduates in U.S. Postsecondary
Education Institutions: 1999-2000 (NCES 2002-168). U.S. Department of Education,National Center for Education Statistics. Washington, DC: U.S. Government Printing Office.
Lewis, L., Snow, K., Farris, E., and Levin, D. (1999). Distance Education at PostsecondaryEducation Institutions: 1997-98 (NCES 2000-013). U.S. Department of Education, National
Center for Education Statistics. Washington, DC: U.S. Government Printing Office.
Oblinger, D.G., Barone, C.A., and Hawkins, B.L. (2001). Distributed Education and Its
Challenges: An Overview. Washington, DC: American Council on Education and
EDUCAUSE.
43
37
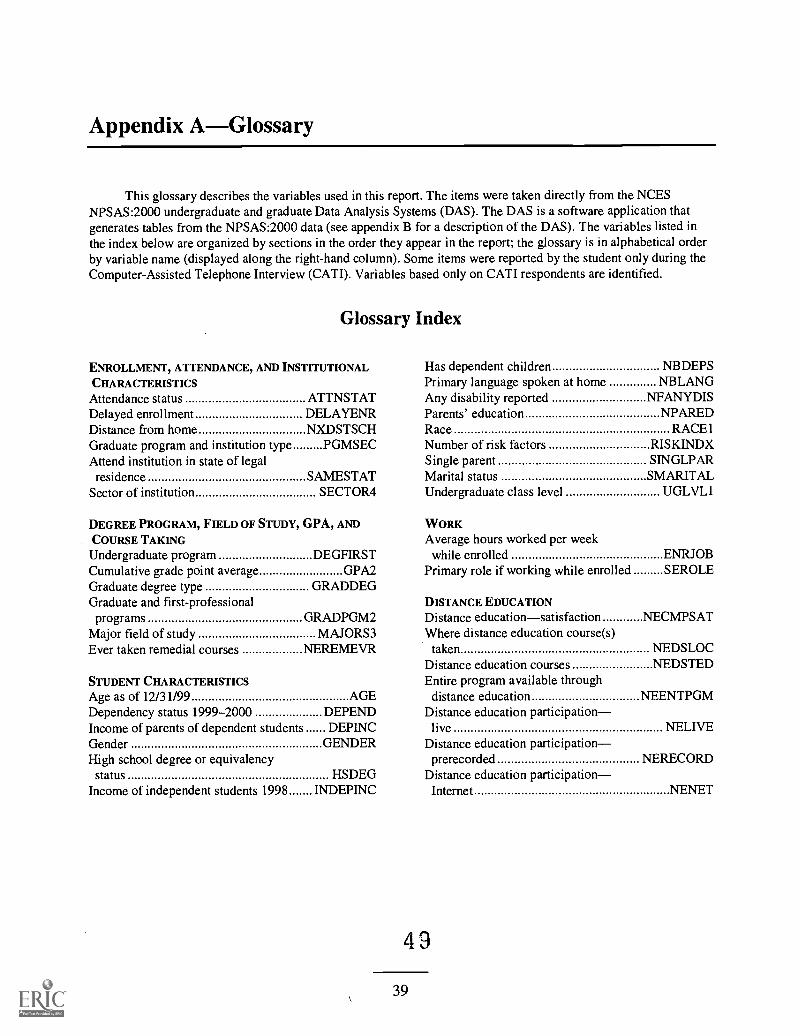
Appendix A Glossary
This glossary describes the variables used in this report. The items were taken directly from the NCESNPSAS:2000 undergraduate and graduate Data Analysis Systems (DAS). The DAS is a software application thatgenerates tables from the NPSAS:2000 data (see appendix B for a description of the DAS). The variables listed inthe index below are organized by sections in the order they appear in the report; the glossary is in alphabetical orderby variable name (displayed along the right-hand column). Some items were reported by the student only during theComputer-Assisted Telephone Interview (CATI). Variables based only on CATI respondents are identified.
Glossary Index
ENROLLMENT, ATTENDANCE, AND INSTITUTIONAL Has dependent children NBDEPSCHARACTERISTICS Primary language spoken at home NBLANGAttendance status ATTNSTAT Any disability reported NFANYDISDelayed enrollment DELAYENR Parents' education NPAREDDistance from home NXDSTSCH Race RACE IGraduate program and institution type PGMSEC Number of risk factors RISKINDXAttend institution in state of legal Single parent SINGLPAR
residence SAMESTAT Marital status SMARITALSector of institution SECTOR4 Undergraduate class level UGLVLI
DEGREE PROGRAM, FIELD OF STUDY, GPA, ANDCOURSE TAKINGUndergraduate program DEGFIRSTCumulative grade point average GPA2Graduate degree type GRADDEGGraduate and first-professional
programs GRADPGM2Major field of study MAJORS3Ever taken remedial courses NEREMEVR
STUDENT CHARACTERISTICSAge as of 12/31/99 AGEDependency status 1999-2000 DEPENDIncome of parents of dependent students DEPINCGender GENDERHigh school degree or equivalency
status HSDEGIncome of independent students 1998 INDEPINC
WORKAverage hours worked per week
while enrolled ENRJOBPrimary role if working while enrolled SEROLE
DISTANCE EDUCATIONDistance educationsatisfaction NECMPS ATWhere distance education course(s)
taken NEDSLOCDistance education courses NEDSTEDEntire program available throughdistance education NEENTPGM
Distance education participationlive NELIVE
Distance education participationprerecorded NERECORD
Distance education participationInternet NENET
49
39
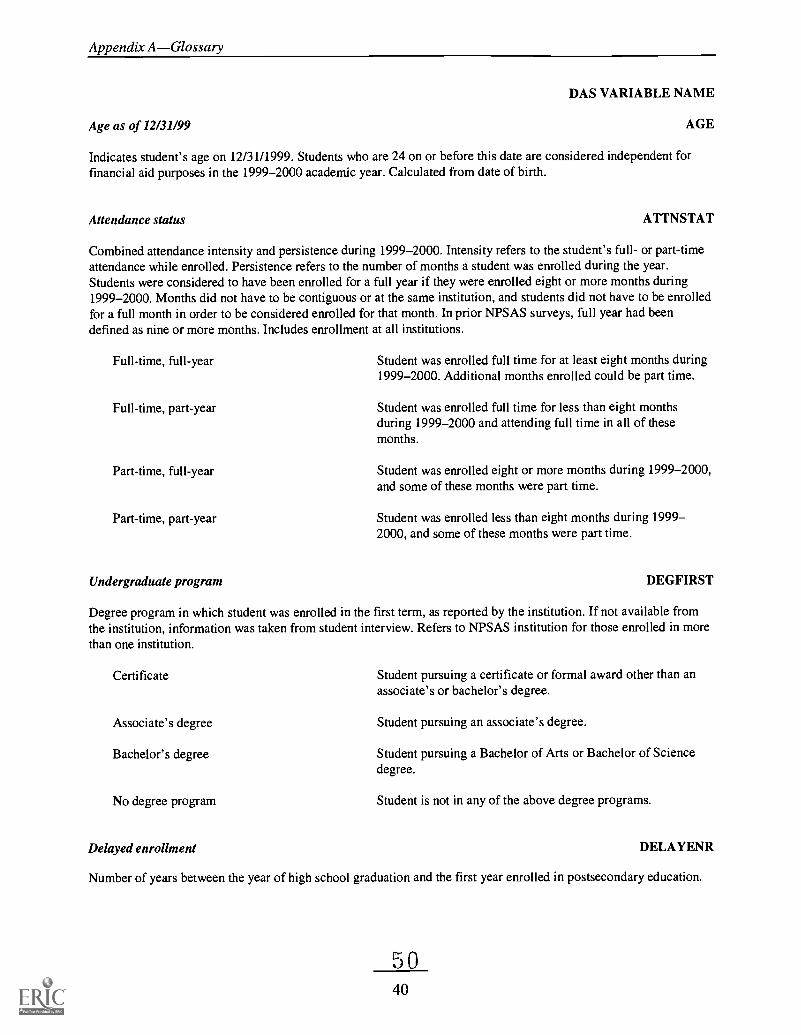
Appendix AGlossary
DAS VARIABLE NAME
Age as of 12/31/99 AGE
Indicates student's age on 12/31/1999. Students who are 24 on or before this date are considered independent forfinancial aid purposes in the 1999-2000 academic year. Calculated from date of birth.
Attendance status ATTNSTAT
Combined attendance intensity and persistence during 1999-2000. Intensity refers to the student's full- or part-timeattendance while enrolled. Persistence refers to the number of months a student was enrolled during the year.Students were considered to have been enrolled for a full year if they were enrolled eight or more months during1999-2000. Months did not have to be contiguous or at the same institution, and students did not have to be enrolledfor a full month in order to be considered enrolled for that month. In prior NPSAS surveys, full year had beendefined as nine or more months. Includes enrollment at all institutions.
Full-time, full-year Student was enrolled full time for at least eight months during1999-2000. Additional months enrolled could be part time.
Full-time, part-year Student was enrolled full time for less than eight monthsduring 1999-2000 and attending full time in all of thesemonths.
Part-time, full-year Student was enrolled eight or more months during 1999-2000,and some of these months were part time.
Part-time, part-year Student was enrolled less than eight months during 1999-2000, and some of these months were part time.
Undergraduate program DEGFIRST
Degree program in which student was enrolled in the first term, as reported by the institution. If not available fromthe institution, information was taken from student interview. Refers to NPSAS institution for those enrolled in morethan one institution.
Certificate Student pursuing a certificate or formal award other than anassociate's or bachelor's degree.
Associate's degree
Bachelor's degree
No degree program
Delayed enrollment
Student pursuing an associate's degree.
Student pursuing a Bachelor of Arts or Bachelor of Sciencedegree.
Student is not in any of the above degree programs.
DELAYENR
Number of years between the year of high school graduation and the first year enrolled in postsecondary education.
5040
Appendix AGlossary
DAS VARIABLE NAME
Dependency status 1999-2000 DEPEND
Student dependency status for federal financial aid. Students under age 24 are generally considered to be dependenton their parents for financial support. Students were considered to be independent in 1999-2000 if they met any ofthe following criteria:
1) Age twenty-four or older as of 12/31/19992) A veteran of the U.S. Armed Forces3) Enrolled in a graduate or professional program beyond a bachelors degree4) Married5) Orphan or ward of the court6) Have legal dependents other than a spouse
Students under 24 who do not meet any of these conditions but are receiving no parental support may be classified asindependent by campus financial aid officers using their professional judgment.
DependentIndependent
Income of parents of dependent students DEPINC
Indicates dependent student parents' total income for 1998.
Average hours worked per week while enrolled ENRJOB
Average number of hours per week that students reported working while enrolled in 1999-2000. It is based on thestudent CATI question "About how many hours did you work per week while you were enrolled?" The variable doesnot include hours worked when student was not enrolled.
Did not work Student did not work.
Worked part time Student worked less than 35 hours per week while enrolled.
Worked full time Student worked more than 35 hours per week while enrolled.
Gender GENDER
MaleFemale
Cumulative grade point average GPA2
Student's GPA reported by the institution recoded into a 4.0 scale. If the data were not available, the student-reported categorical GPAs were used. Refers to NPSAS institution for those enrolled in more than one institution.
5141

Appendix AGlossary
DAS VARIABLE NAME
Graduate degree type GRADDEG
Indicates the general type of graduate degree program in which the student was enrolled in 1999-2000. NCESdefines first-professional programs to include the following ten fields of study: dentistry, medicine, optometry,osteopathic medicine, pharmacy, podiatric medicine, veterinary medicine, chiropractic, law, and theologicalprofessions.
Master'sDoctorateFirst-professionalPost-baccalaureate certificateOther
Graduate and first-professional programs GRADPGM2
Graduate and first-professional program type
M.B.A./M.A./M.S./M.E.D.Ph.D./Ed.D.M.D./J.D./Theology/Other health sciences
High school degree or equivalency status HSDEG
Form in which high school degree or equivalent was received.
High school diploma Student graduated from high school.
GED, high school equivalent, or certificate Student did not graduate from high school but passed theGeneral Educational Development (GED) exam or high schoolequivalent, administered by the American Council onEducation, or received a certificate of completion.
No high school degree/certificate Student neither graduated from high school nor earned a GEDor certificate of completion.
Income of independent students 1998 INDEPINC
Total income of independent students in 1998, including income of a spouse.
Major field of study MAJORS3
Undergraduate major field of study among those with declared majors. Refers to NPSAS institution for thoseenrolled in more than one institution.
42

Appendix AGlossary
DAS VARIABLE NAME
Major field of study, continued
Undeclared/no major No declared major
Humanities English, liberal arts, philosophy, theology, art, music,speech/drama, art history/fine arts, area studies, African-American studies, ethnic studies, foreign languages, liberalstudies, women's studies.
Social/behavioral sciences Psychology, economics, political science, Americancivilization, clinical pastoral care, social work,anthropology/archaeology, history, sociology.
Life sciences Natural resources, forestry, biological science (includingzoology), botany, biophysics, geography, interdisciplinarystudies, including biopsychology, environmental studies.
Physical sciences Physical sciences including chemistry, physics.
Math Mathematics, statistics.
Computer/information science Computer/information science, computer programming.
Engineering Electrical, chemical, mechanical, civil, or other engineering;engineering technology; electronics.
Education
Business management
Health
Vocational/technical
Other technical/professional
Early childhood, elementary, secondary, special, or physicaleducation; other education; leisure studies; library/archivalsciences.
Accounting, finance, secretarial, data processing,business/management systems, public administration,marketing/distribution, business support, internationalrelations.
Nursing, nurse assisting, community/mental health, medicine,physical education/recreation, audiology, clinical health,dentistry, veterinary medicine, health/hospital, public health,dietetics, other/general health.
Mechanic technology including transportation, protectiveservices, construction, air/other transportation, precisionproduction.
Agriculture, agricultural science, architecture, professional cityplanning, journalism, communications, communicationstechnology, cosmetology, textiles, military science,dental/medical technology, home economics, vocational homeeconomics including child care, law, paralegal, basic/personalskills.
5343
Appendix AGlossary
DAS VARIABLE NAME
Has dependent children NBDEPS
Student's response to the question "When you were enrolled in the 1999-2000 school year, did you have anychildren that you (and your spouse) supported financially?" Asked by student CATI.
Has dependent childrenDoes not have dependent children
Primary language spoken at home NBLANG
Student's response to the question "What language was spoken most often at home as you were growing up?" Askedby student CATI.
EnglishOther
Distance educationsatisfaction NECMPSAT
Student's response to the question "Compared to other courses you've taken, are you more satisfied, equallysatisfied, or less satisfied with the quality of instruction you've received in your distance education courses?"Asked by student CATI.
More satisfiedLiked both the sameLess satisfiedAll courses were distance education coursesDid not take distance education
Where distance education course(s) taken NEDSLOC
Student's response to the question "Was this course (or courses) offered through your school where primarilyenrolled, somewhere else, or both?" Asked by student CATI.
Target school where primarily enrolledSomewhere elseBothDid not take distance education courses
Distance education courses NEDSTED
Student's response to the question: "During the 1999-2000 school year, did you take any courses for credit that weredistance education courses? By distance education, I mean courses delivered off campus using live, interactive TV oraudio, prerecorded TV or video, CD-ROM, or a computer-based system such as the Internet, e-mail, or chat rooms."Distance education does not include correspondence courses. Asked by student CATI.
Took distance education courseDid not take distance education course
Appendix AGlossary
DAS VARIABLE NAME
Distance educationentire program NEENTPGM
Student response to the question: "Is your entire program taught through distance education?" Asked by studentCATI.
Entire program not distance educationEntire program distance educationDid not take distance education
Distance educationlive NELIVE
Student's response to the question: "Did your distance education classes use live, interactive TV or audio?" Askedby student CATI.
Used live TV/audioDid not use live TV/audio
Distance educationInternet NENET
Student's response to the question: "Did your distance education classes use the Internet?" Asked by student CATI.
Used the InternetDid not use the Internet
Distance educationprerecorded NERECORD
Student's response to the question: "Did your distance education classes use prerecorded TV or audio?" Asked bystudent CATI.
Used prerecorded TV/audioDid not use prerecorded TV/audio
Ever taken remedial courses NEREMEVR
Student's response to the question: "Since you've been in college, have you ever taken remedial or developmentalcourses to improve your basic skills, such as in mathematics, reading, or writing?"
YesNo
Any disability reported NFANYDIS
A derived variable that indicates whether the respondent has reported any type of disability at all, based on responsesto the first set of questions in the disability section of the interview.
Disability reportedNo disability reported
5545
Appendix AGlossary
DAS VARIABLE NAME
Parents' education NPARED
The highest level of education completed by the student's mother or father, whoever had the highest level. Thevariable was aggregated to the following categories in this report:
Less than a bachelor's degree Students' parents earned a high school diploma or equivalentor did not complete high school. This includes students'parents who may have attended some postsecondary education,but did not earn a bachelor's degree.
Bachelor's degree or higher Students' parents attained a bachelor's or advanced degree.
Distance from home NXDSTSCH
The straight-line distance (in miles) between student's home and NPSAS institution.
Graduate program and institution type PGMSEC
Indicates the type of NPSAS sample institution and the type of degree program in which graduate/first-professionalstudents were enrolled. Graduate students sampled at less-than-4-year institutions (where they were takingundergraduate courses) are classified as 'other'.
Masters degree, publicMasters degree, privateFirst-professional, publicFirst-professional, privateDoctoral degree, publicDoctoral degree, privateOther
Race RACE1
Student's race/ethnicity by historical categories used in prior surveys. Students choosing more than one race wereasked "For historical purposes, could you please identify which single race best describes you?" Since so fewstudents participate in distance education overall, the historical version of this variable (rather than the censusversion) was used to maximize the sample size of each racial/ethnic category by coding students who chose multipleraces into the racial category they would pick if they could only choose one.
Two percent of 1999-2000 undergraduates chose more than one race (Horn et al. 2002). When asked to choose onerace, 31 percent of those undergraduates chose White, non-Hispanic, 13 percent chose Black, non-Hispanic, 27percent chose Hispanic, 10 percent chose Asian, 6 percent chose American Indian/Alaska Native, 3 percent chosePacific Islander/Native Hawaiian, and 10 percent chose Other (NPSAS:2000).
Two percent of all graduate and first-professional students chose more than one race. When asked to select one racefor historical purposes, 29 percent of those graduate and first-professional students selected White, non-Hispanic, 11percent selected Black, non-Hispanic, 22 percent selected Hispanic, 18 percent selected Asian, 3 percent selectedAmerican Indian/Alaska Native, 6 percent selected Pacific Islander/Native Hawaiian, and 11 percent selected Other(NPSAS:2000).
46

Appendix AGlossary
Race, continued
White, non-Hispanic
Black, non-Hispanic
Hispanic or Latino
DAS VARIABLE NAME
A person having origins in any of the original peoples ofEurope, North Africa, or the Middle East.
A person having origins in any of the black racial groups ofAfrica.
A person of Mexican, Puerto Rican, Cuban, Central or SouthAmerican, or other Spanish culture or origin, regardless ofrace.
Asian A person having origins in any of the peoples of the Far East,Southeast Asia, or the Indian subcontinent. This includespeople from China, Japan, Korea, the Philippine Islands, India,and Vietnam.
American Indian/Alaska Native
Pacific Islander/Native Hawaiian
Other
Number of risk factors
A person having origins in any of the original peoples of NorthAmerica and who maintains cultural identification throughtribal affiliation or community recognition.
A person having origins in the Pacific Islands includingHawaii and Samoa.
A person having origins in a race not listed above.
RISKINDX
Represents an index of risk of 0-7 related to seven characteristics known to adversely affect persistence andattainment. Characteristics include delayed enrollment, no high school diploma (including GED recipients), part-timeenrollment, financial independents, having independents other than spouse, single parent status, and working part-time while enrolled.
Attend institution in state of legal residence SAMESTAT
Indicates whether the sampled NPSAS institution was in the same state as the state of legal residence of the student.
Attended in same state as legal residenceAttended out-of-state institution
Sector of institution SECTOR4
Indicates type of institution.
Public 4-yearPrivate not-for-profit 4-yearPublic 2-yearPrivate for-profit
5747
Appendix AGlossary
DAS VARIABLE NAME
Primary role if working while enrolled SEROLE
Student response to the question "While you were working, would you say that you were primarily a student workingto meet expenses or an employee who's decided to enroll in school?" Asked by student CATI.
Student who works Student working to meet expenses
Employee who studies Employee enrolled in school
Does not work Respondent does not work
Single parent SINGLPAR
Indicates whether student was a single parent in 1999-2000. Students were considered to be single parents if theyhad dependents and were not married.
Single parentNot a single parent
Marital status SMARITAL
Marital status of student when applied for financial aid in 1999-2000.
MarriedNot married (including separated)
Undergraduate class level UGLVL1
Year in school. A function of class level reported by the institution for the first term in college. If not available fromthe institution, information was taken from the financial aid form, loan record, or student interview. Refers toNPSAS institution for those enrolled in more than one institution.
First, second, or third-year undergraduatesGraduating seniorsGraduated 1999-2000 or other
58
48

Appendix BTechnical Notes and Methodology
The 1999-2000 National Postsecondary Student Aid Study
The 1999-2000 National Postsecondary Student Aid Study (NPSAS:2000) is a
comprehensive nationwide study conducted by the U.S. Department of Education's National
Center for Education Statistics (NCES) to determine how students and their families pay for
postsecondary education." It also describes demographic and other characteristics of students
enrolled. The study is based on a nationally representative sample of all students in
postsecondary education institutions, including undergraduate, graduate, and first-professional
students. For NPSAS:2000, information was obtained from more than 900 postsecondary
institutions on approximately 50,000 undergraduate, 9,000 graduate, and 3,000 first-professional
students. They represented about 16.5 million undergraduates, 2.4 million graduate students, and
300,000 first-professional students who were enrolled at some time between July 1, 1999 and
June 30, 2000.12
Accuracy of Estimates
The statistics in this report are estimates derived from a sample. Two broad categories of
error occur in such estimates: sampling and nonsampling errors. Sampling errors occur because
observations are made only on samples of students, not entire populations. Nonsampling errors
occur not only in sample surveys but also in complete censuses of entire populations.
Nonsampling errors can be attributed to a number of sources: inability to obtain complete
information about all students in all institutions in the sample (some students or institutions
refused to participate, or students participated but answered only certain items); ambiguous
definitions; differences in interpreting questions; inability or unwillingness to give correct
information; mistakes in recording or coding data; and other errors of collecting, processing,
sampling, and imputing missing data.
11For more information on the NPSAS survey, consult U.S. Department of Education, National Center for Education Statistics,Methodology Report for the 1999-2000 National Postsecondary Student Aid Study (NCES 2002-152) (Washington, DC: 2001).Additional information is also available at the NPSAS Web site http: / /nces.ed.gov /npsas.
12For response rates, see tables A3 and A4 in A. Malizio, National Postsecondary Student Aid Study: Student Financial AidEstimates for 1999-2000 (NCES 2001-209) (Washington, DC: U.S. Department of Education, National Center for EducationStatistics, 2001).
5949
Appendix BTechnical Notes and Methodology
Data Analysis System
The estimates presented in this report were produced using the NPSAS:2000 undergraduate
Data Analysis Systems (DAS). The DAS software makes it possible for users to specify and
generate their own tables. With the DAS, users can replicate or expand upon the tables presented
in this report. In addition to the table estimates, the DAS calculates proper standard errors13 and
weighted sample sizes for these estimates. For example, table B1 contains standard errors that
correspond to table 1, generated by the DAS. If the number of valid cases is too small to produce
a reliable estimate (less than 30 cases), the DAS prints the message "low-N" instead of the
estimate.
In addition to tables, the DAS will also produce a correlation matrix of selected variables to
be used for linear regression models. Included in the output with the correlation matrix are the
design effects (DEFTs) for each variable in the matrix. Since statistical procedures generally
compute regression coefficients based on simple random sample assumptions, the standard errors
must be adjusted with the design effects to take into account the stratified sampling method used
in the NPSAS surveys.
For more information about the NPSAS:2000 and other Data Analysis Systems, consult the
NCES DAS Web site (nces.ed.Rov /das) or contact:
Aurora D'AmicoNational Center for Education Statistics1990 K Street, NWRoom 8115Washington, DC 20006(202) 502-7334Internet address: Aurora.D'[email protected]
13The NPSAS:2000 samples are not simple random samples, and therefore, simple random sample techniques for estimatingsampling error cannot be applied to these data. The DAS takes into account the complexity of the sampling procedures andcalculates standard errors appropriate for such samples. The method for computing sampling errors used by the DAS involvesapproximating the estimator by the linear terms of a Taylor series expansion. The procedure is typically referred to as the Taylorseries method.
0050

Appendix B-Technical Notes and Methodology
Table B1. -Standard errors for table 1: Percentage of 1999-2000 undergraduate students who participatedin distance education, and of those, the percentage whose entire program was taught throughdistance education, by student characteristics
Total
Entire programtaught through
distance education
Total 0.28 1.17
GenderMale 0.35 1.94
Female 0.37 1.48
Race/ethnicity*White, non-Hispanic 0.33 1.42
Black, non-Hispanic 0.66 3.69Hispanic 0.69 4.60Asian 1.01 6.05American Indian/Alaska Native 2.65 (#)Pacific Islander/Native Hawaiian 2.28 ( #)
Other 1.18 ( #)
Primary languageEnglish 0.30 1.26
Other 0.61 3.96
AgeUnder 24 0.26 1.82
24 and over 0.50 1.57
Disability statusDisability reported 0.69 3.18No disability reported 0.29 1.25
#Too small to report.*Following the Census 2000 model, NPSAS respondents were given the option of choosing more than one race. Those whochose more than one race were then asked: For historical purposes, could you please identify which single race best describesyou? Priority was given to Hispanic/Latino regardless of race, and then to the response of those who chose more than one race tothe "historical" choice question.
NOTE: Includes students who participated either only at the institution where they were primarily enrolled or both at theinstitution where they were primarily enrolled and somewhere else. Students who participated in distance education only at aninstitution other than the one where they were primarily enrolled were excluded.
SOURCE: U.S. Department of Education, National Center for Education Statistics, 1999-2000 National Postsecondary StudentAid Study (NPSAS:2000).
6151

Appendix BTechnical Notes and Methodology
Statistical Procedures
Differences Between Means
The descriptive comparisons were tested in this report using Student's t statistic.
Differences between estimates are tested against the probability of a Type I error," or
significance level. The significance levels were determined by calculating the Student's t values
for the differences between each pair of means or proportions and comparing these with
published tables of significance levels for two-tailed hypothesis testing.
Student's t values may be computed to test the difference between estimates with the
following formula:
t= E1 E2
se + se2
1 2
where E1 and E2 are the estimates to be compared and sel and see are their corresponding
standard errors. This formula is valid only for independent estimates. When estimates are not
independent, a covariance term must be added to the formula:
(1)
E1 E2t (2)
11se; se22 2(r)se
1see2
where r is the correlation between the two estimates.I5 This formula is used when comparing two
percentages from a distribution that adds to 100. If the comparison is between the mean of a
subgroup and the mean of the total group, the following formula is used:
Esub Ewtt=2
sesub + seof 2p se sub2 2
(3)
where p is the proportion of the total group contained in the subgroup.I6 The estimates, standard
errors, and correlations can all be obtained from the DAS.
14A Type I error occurs when one concludes that a difference observed in a sample reflects a true difference in the populationfrom which the sample was drawn, when no such difference is present.15U.S. Department of Education, National Center for Education Statistics, A Note from the Chief Statistician, no. 2, 1993.161bid. f'2
52
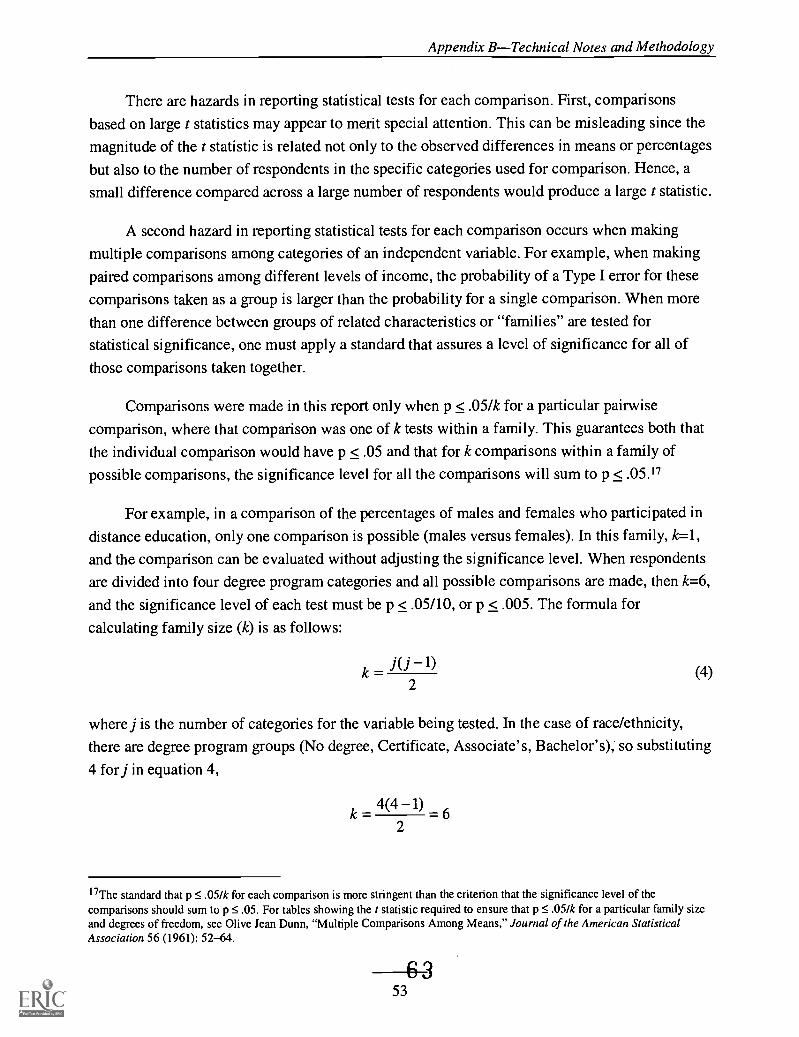
Appendix BTechnical Notes and Methodology
There are hazards in reporting statistical tests for each comparison. First, comparisons
based on large t statistics may appear to merit special attention. This can be misleading since the
magnitude of the t statistic is related not only to the observed differences in means or percentages
but also to the number of respondents in the specific categories used for comparison. Hence, a
small difference compared across a large number of respondents would produce a large t statistic.
A second hazard in reporting statistical tests for each comparison occurs when making
multiple comparisons among categories of an independent variable. For example, when making
paired comparisons among different levels of income, the probability of a Type I error for these
comparisons taken as a group is larger than the probability for a single comparison. When more
than one difference between groups of related characteristics or "families" are tested for
statistical significance, one must apply a standard that assures a level of significance for all of
those comparisons taken together.
Comparisons were made in this report only when p < .05/k for a particular pairwise
comparison, where that comparison was one of k tests within a family. This guarantees both that
the individual comparison would have p < .05 and that for k comparisons within a family of
possible comparisons, the significance level for all the comparisons will sum to p < .05.17
For example, in a comparison of the percentages of males and females who participated in
distance education, only one comparison is possible (males versus females). In this family, k=1,
and the comparison can be evaluated without adjusting the significance level. When respondents
are divided into four degree program categories and all possible comparisons are made, then k=6,
and the significance level of each test must be p < .05/10, or p < .005. The formula for
calculating family size (k) is as follows:
k = 1)2
(4)
where j is the number of categories for the variable being tested. In the case of race/ethnicity,
there are degree program groups (No degree, Certificate, Associate's, Bachelor's), so substituting
4 for j in equation 4,
k =4(4 1)
= 62
I7The standard that p .05/k for each comparison is more stringent than the criterion that the significance level of thecomparisons should sum to p 5 .05. For tables showing the t statistic required to ensure that p .05/k for a particular family sizeand degrees of freedom, see Olive Jean Dunn, "Multiple Comparisons Among Means," Journal of the American StatisticalAssociation 56 (1961): 52-64.
53

Appendix BTechnical Notes and Methodology
Adjustment of Means to Control for Background Variation
Many of the independent variables included in the analyses in this report are related, and to
some extent the pattern of differences found in the descriptive analyses reflect this covariation.
For example, when examining rates of participation in distance education by gender, it is
possible that some of the observed relationship is due to differences in other factors related to
gender, such as number of dependents, institution type, and so on. However, if nested tables were
used to isolate the influence of these other factors, cell sizes would become too small to identify
the significant differences in patterns. When the sample size becomes too small to support
controls for another level of variation, other methods must be used to take such variation into
account. The method used in this report estimates adjusted means with regression models, an
approach sometimes referred to as communality analysis.
For the analysis of distance education participation, multiple linear regression was used to
obtain means that were adjusted for covariation among a list of control variables." Each
independent variable is divided into several discrete categories. To find an estimated mean value
on the dependent variable for each category of an independent variable, while adjusting for its
covariation with other independent variables in the equation, substitute the following in the
equation: (1) a one in the category's term in the equation, (2) zeroes for the other categories of
this variable, and (3) the mean proportions for all other independent variables. This procedure
holds the impact of all remaining independent variables constant, and differences between
adjusted means of categories of an independent variable represent hypothetical groups that are
balanced or proportionately equal on all other characteristics included in the model as
independent variables.
For example, consider a hypothetical case in which two variables, age and gender, are used
to describe an outcome, Y (such as participation in distance education). The variables age and
gender are recoded into a dummy variable representing age, A, and a dummy variable
representing gender, G:
Age A
Less than 24 years old 1
24 years or older 0
18For more information about least squares regression, see Michael S. Lewis-Beck, Applied Regression: An Introduction, Vol.22 (Beverly Hills, CA: Sage Publications, Inc., 1980); William D. Berry and Stanley Feldman, Multiple Regression in Practice,Vol. 50 (Beverly Hills, CA: Sage Publications, Inc., 1987).

Appendix BTechnical Notes and Methodology
andGender
Female 1
Male 0
The following regression equation is then estimated from the correlation matrix output from the
DAS as input data for standard regression procedures:
= a +blit+b2G (5)
To estimate the adjusted mean for any subgroup evaluated at the mean of all other
variables, one substitutes the appropriate values for that subgroup's dummy variables (1 or 0) and
the mean for the dummy variable(s) representing all other subgroups. For example, suppose Y
represents participation in distance education, which is being described by age (A) and gender
(G), coded as shown above. Suppose the unadjusted mean values of these two variables are as
follows:
Variable MeanA 0.355G 0.411
Next, suppose the regression equation results are as follows:
Y= 0.51- 0.17A -0.21G (6)
To estimate the adjusted value for younger students, one substitutes the appropriate
parameter estimates and variable values into equation 6.
Variable Parameter Valuea 0.51A -0.17 1.000G -0.21 0.411
This results in the following equation:
= 0.51 (0.17)(1) (0.21)(0.411) = 0.254
In this case, the adjusted mean for younger students is 0.254 and represents the expected
outcome for younger students who resemble the average student across the other variables (in
this example, gender). In other words, the adjusted percentage of younger students participating
in distance education classes, controlling for gender, is 25.4 percent (0.254 x 100 for conversion
to a percentage).
55 6

Appendix BTechnical Notes and Methodology
It is relatively straightforward to produce a multivariate model using the DAS, since one of
the DAS output options is a correlation matrix, computed using pairwise missing values. In
regression analysis, there are several common approaches to the problem of missing data. The
two simplest are pairwise deletion of missing data and listwise deletion of missing data. In
pairwise deletion, each correlation is calculated using all of the cases for the two relevant
variables. For example, suppose you have a regression analysis that uses variables Xl, X2, and
X3. The regression is based on the correlation matrix between Xl, X2, and X3. In pairwise
deletion, the correlation between X1 and X2 is based on the nonmissing cases for Xl and X2.
Cases missing on either X1 or X2 would be excluded from the calculation of the correlation. In
listwise deletion, the correlation between X1 and X2 would be based on the nonmissing values
for Xl, X2, and X3. That is, all of the cases with missing data on any of the three variables
would be excluded from the analysis.
The correlation matrix can be used by most statistical software packages as the input data
for least squares regression. That is the approach used for this report, with an additional
adjustment to incorporate the complex sample design into the statistical significance tests of the
parameter estimates (described below).19
Most statistical software packages assume simple random sampling when computing
standard errors of parameter estimates. Because of the complex sampling design used for the
NPSAS survey, this assumption is incorrect. A better approximation of their standard errors is to
multiply each standard error by the design effect associated with the dependent variable
(DEFT),20 where the DEFT is the ratio of the true standard error to the standard error computed
under the assumption of simple random sampling. It is calculated by the DAS and produced with
the correlation matrix output.
19Although the DAS simplifies the process of making regression models, it also limits the range of models. Analysts who wish toestimate other types of models, such as logic models, can apply for a restricted data license from NCES.
20The adjustment procedure and its limitations are described in C.J. Skinner, D. Holt, and T.M.F. Smith, eds., Analysis ofComplex Surveys (New York: John Wiley & Sons, 1989).
U.S. Department of EducationOffice of Educational Research and Improvement (OERI)
National Library of Education (NLE)
Educational Resources Information Center (ERIC)
NOTICE
Reproduction Basis
Educational Rosana Intimation Centel
This document is covered by a signed "Reproduction Release (Blanket)"form (on file within the ERIC system), encompassing all or classes ofdocuments from its source organization and, therefore, does not requirea"Specific Document" Release form.
This document is Federally-funded, or carries its own permission toreproduce, or is otherwise in the public domain and, therefore, may bereproduced by ERIC without a signed Reproduction Release form (either"Specific Document" or "Blanket").
EFF-089 (1/2003)