Embed Size (px)
Citation preview
ED 053 823
TITLE
INSTITUTIONREPORT NOPUB DATENOTEAVAILABLE FROM
EDRS PRICEDESCRIPTORS
IDENTIFIERS
ABSTRACT
DOCUMENT RESUME
RC 005 380
IMPACT of City-County Consolidation of theRural-Urban Fringe: Nashville-Davidson County,Tennessee.Economic Research Service (DOA) , Washington, D.C.AER-206Jun 7139p.Superintendent of Documents, U.S. GovernmentPrint: ng Office, Washington, D.C. 20402
EDRS Price MF-$0.65 HC-$3.29*Attitudes, City Government, Education, FinancialSupport, Income, Law Enforcement, Parks, Recreation,Rural Population, *Rural Urban Differences,*Services, Surveys, *Taxes, Transportation,*Urbanization, Urban PopulationTennessee
This report analyzed the effect of consolidation ofcity and county governments in Nashville, Tenn., on local publicfinance and the availability of public services in the rural areas ofthe county. Comparisons were made between governmental costs andfunctions before and 3 years after the metropolitan district wasformed. Some 299 voters in the rural-urban fringe of the metropolitanarea were interviewed to determine their attitudes toward taxchanges, services, and political access of the metropolitangovernment (hetro) compared with the previous city and countygovernments. In general, the Metro district produced improvedservices and higher taxes in rural areas, but a majority of thepeople were satisfied with the change. Two figures, 16 tables, and anappendix on factors affecting respondents' opinions of Metro areincluded. (Author/MJB)

U.S. DEPARTMENT OF HEALTH,EDUCATION & WELFAREOFFICE OF EDUCATION
THIS DOCUMENT HAS BEEN REPRO-DUCED EXACTLY AS RECEIVED FROMTHE PERSON OR ORGANIZATION ORIGINATING IT. POINTS OF VIEW OR OPIN-IONS STATED DO NOT NECESSARILYREPRESENT OFFICIAL OFFICE OF EDU-CATION POSITION OR POLICY.
Agricultural Economic Report No. 206
7.Ir
6' RECEIVED e,;1-, JUL 26 1971
NMSUE. R .I. C.
IMPACT of City-County Consolidation
of the Rural-Urban Fringe:
NASHVILLE-DAVIDSON COUNTY , TENN.
ECONOMIC RESEARCH SERVICE
U.S. DEPARTMENT OF AGRICULTURE

ABSTRACT
This report analyzes the effect of consolidation of city and countygovernments in Nashville, Tenn., on local public finance and the availabilityof public services in the rural areas of the county. Comparisons were madebetween governmental costs and functions before and 3 years after theMetropolitan district was formed. About 300 voters in the rural-urban fringeof the metropolitan area were interviewed to determine their attitudes towardtax changes, services, and political access of the Metropolitan government,compared with the previous city and county governments. In general, theMetro district produced improved services and high(ir taxes in rural areas, buta pagjority of the people were satisfied with the change.
KEY WORDS: Attitudes, efficiency, finance, rural-urban fringe,urbanization, access, taxes.
For sole by the Superintendent of Docurnsnts, U.S. Go...ern:tient Printin9 Onice, ViCiShiiivton, D.C., 20402

PREFACE
As our society becomes increasingly urbanized, more and more farmers andother rural residents feel the impact of city expansion. With increasingurbanization come increasingly complex governmental problems, and innovationsare needed in local government. One of these innovations has been the con-solidation of cities with the counties surrounding them. To find out moreabout city-county consolidations and their effect on rural residents, theEconomic Research Service contracted with Vanderbilt University for a studyof the Nashville-Davidson County consolidation; this bulletin reports theresults of that study. The author was on the university staff at the time ofthe study. Daniel Grant supervised the study.
iii

CONTENTS
Page
HighlightsIntroduction 1
Purpose of Study 1
Method of Study 2
The Study Area 4
Metro's Effect on Fringe Services 5
Public Schools 8
Police Protection 9
Streets and Roads 12
Parks and Recreation 13Metro's Effect on Public Finance 15
Changes in the Tax Rates 15
New Revenue Sources 18Metro and the Rural Citizen 19
Attitudes Toward Services 19
Attitudes Toward Taxes 21
Political Access 24
Appendix. Factors Affecting Respondents' Opinions of Metro 28
Washington, D. C. 20250
iv
4
June 1971

HIGHLIGHTS
The establishment of a metropolitan government- Metro - -in Nashville,Tenn., significantly strengthened services to urban and rural residents. Therural resident, especially in the rural-urban fringe area, obtained bettorschools, and additional police and fire protection. The central city residentobtained better schools through an enlargement of the system and a vastimprovement in his access to recreational and park facilities.
The most significant improvement was in the school system. The quality ofeducation was, equalized throughout the county. Higher per capita expendituresfor education occurred within the city and in the county. Expenditures fortextbooks increased fourfold. Curricula were enlarged. Teachers' standardswere improved, additional administrative and supervisory staff were added,teachers' salaries were raised, and the pupil-teacher ratio decreased. Acentral warehouse for financial and inventory control of materials andequipment was established, making supplies and aids more readily available toall teachers. Metropolitan consolidation made possible centralized schoolhealth and pupil personnel services.
Consolidation of law enforcement took place rapidly. City and countypatrols were merged and many actions were undertaken to improve the image ofmunicipal law enforcement. Law enforcement became a county-wide professionalpolice operation. Major crime decreased 7 percent in Nashville, under a Metropolice force in 1965, compared with a 5-percent increase nationally.
The administration of road maintenance was improved. The MetroDepartment of Public Works was able to purchase specialized equipment whichneither the city or county alone could have justified before consolidation.General service expenditures increased markedly in the rural areas.
Parks and recreational facilities became a general service to be providedthroughout the Metro area. A park board was established with authority toacquire parkland in advance of urban development. Priority systems wereestablished, and park and school facilities were combined to provide optimumrecreational facilities to all residents of the area.
Metro expenditures the first year after formation were about 7 percenthigher than the total expenditures of the separate city and county governmentsthe previous year. Although this modest increase might have occurred withoutconsolidation, Metro's major impact on taxes resulted from a marked shift intaxes from urban to rural residents. Property tax rates for the city residentdecreased about 1 percent the first year, whereas those for the rural residentincreased more than 34 percent.
The second year, Metro expanded its sources of revenue by adopting a 1-percent sales tax and a user charge for sewer and water financing. Propertytax rates were reduced.
Analysis of fringe voters' opinions concerning the tax situation under
v
5

the metropolitan districts showed 61 percent thought taxes were too high.About 46 percent were less satisfied with taxes under Metro than before.However, almost three-fifths of the fringe dwellers agreed with the statementthat "the tax burden is more fairly distributed under Metro than it was beforeMetro was adopted."
Even though their taxes increased markedly, more than one-half of thefringe residents were satisfied with each type of service under a metropolitangovernment. When asked to rnte all services as a whole, more than four-fifthssaid they were satisfied. Furthermore, more than two-thirds of the fringeresidents agreed that the me.:rol.olitan districts were generally more efficientthan the city-county governments were before Metro was adopted.
Nearly 70 percent of the residents of the rural-urban fringe believedthey received as much or more attention from their councilmen under Metro asthey received from their magistrates under the previous county government.
vi
6

IMPACT OF CITY-COUNTY CONSOLIDATION OF THERURAL-URBAN FRINGE: NASHVILLE-DAVIDSON COUNTY, TENN.
by
Robert E. McArthur 1/Economic Development Division
Economic Research Service
INTRODUCTION
Urban America has become increasingly aware of "the metropolitan problem,"a collection of ills which affects every metropolitan area in the Nation andseems to grow more pressing each year. In recent years, city-county con-solidation has been proposed often--but almost never adopted--as a remedy forthe difficulties created by metropolitan expansion and the accompanyingfragmentation of local government.
In 1962, city-county consolidation was adopted in Nashville andDavidson County, Tenn., in an effort to achieve unified area-wide governmentfor an entire metropolitan community, including a large rural fringesurrounding the central city. thider the "Metropolitan Government ofNashville and Davidson County," a new structure replaced the former city andcounty governments; legislative power was vested in a 40-member MetropolitanCouncil; 35 members being elected from single-member districts, and 5 memberschosen at large; the metropolitan mayor was elected by the county-wideelectorate. Rural voters, greatly outnumbered in any governmental scheme basedon population, displayed widespread opposition to this consolidation, just asthey had to an earlier attempt in 1958. They expressed considerableapprehension concerning the potential effect of this "Metro" on their welfare.
What happens to rural residents when they are incorporated into amunicipal type of metropolitan government? Does the actual operation of thenew government allay or reinforce the fears of fringe residents? Is thedegree of satisfaction with the new system related to governmental performanceor primarily to other factors? What is the impact of adopting a metropolitanform of government on services, taxes, and political access in the rural-urbanfringe? The Nashville experience made it possible to examine these andrelated questions which have thus far been largely speculative.
Purpose of Study
The purpose of this study was to gage the impact of Metro upon theresidents of a fringe area which included not only farmers, but also
1/ Associate Professor of Political Science and Governmental Research,University of Mississippi.
7

long-time rural residents with urban occupations, and thousands of newarrivals in the fringe subdivisions. The report was based upon the experienceof the rural portion of Davidson County during the first 3 years of Metrooperation, from 1963 through 1965. An effort was made to study both theperformance of Metro and citizens' perceptions of that performance, recognizingthat the two are not necessarily the same.
Method of Study
A search was made of the relevant social science literature in an effortto discover what writers have predicted would happen when rural areas comeunder the political jurisdiction of municipal-type government. This search
resulted in the formulation of three propositions concerning the actualperformance of Metro in the fringe.
These were as follows:
Propositions:
1. Metropolitan government extended and strengthenedsignificantly the services of the residents of therural-urban fringe.
2. Metropolitan government increased the tax responsibilityof the residents of the rural-urban fringe.
3. Metropolitan government diluted the representation ofrural-urban fringe residents and their access to localgovernment decisionmaking.
The propositions concerning Metro's governmental performance were testedby comparing effects on four public services--schools, police protection,streets and roads, and parks and recreation. Services and revenue beforeMetro and 3 years after Metro were compared. Background material was obtainedfrom informed observers and government officials, newspaper reports, andprevious research in the Nashville area. Major reliance was placed on the useof government records and the responses of citizens to questions in a samplesurvey in the summer and fall of 1965.
To test the citizens' perception of Metro operations, a survey of asample of the residents in the rural-urban fringe area was conducted. Thesample was drawn from the official list of registered voters in the rural-urbanfringe, precincts of the county, an area containing approximately 22,500 votersin 1964. Every seventieth voter was selected, providing an original sampleof 321 persons. Twenty-two could not be interviewed, reducing the sample to299 voters. Interviews were conducted from August through November 1965.
2
A
8

FIGURE 1.--THE DAVIDSON COUNTY
RURAL-URBAN FRINGE, 1966
3
9

THE STUDY AREA
The Nashville rural-urban fringe consisted in 1966 of the territory inDavidson County which lay outside the "urbanized area" of the county. 2/ It
comprised more than half the area of the county (fig. 1).
An examination of this area revealed that the Nashville peripherypossessed the major traits of the typical fringe area: booming populationgrowth, inconsistent land use, and mixed economic activity.
Prior to World War II, population growth in Davidson County was generallyconcentrated along the major roads and transportation routes. Growth tookplace in areas contiguous to territory already densely populated. In thepostwar period this pattern of growth shifted, as in most other metropolitanareas, from "sector type" to "concentric zone" development, and concentrationalong major highways gave way to great dispersion in outer areas. The centralcity tended to decrease in population or to stagnate, while growth ratesincreased as distance from the central city increased. The growth rates weregreatest in the large subdivisions which sprang up in previously rural areas.
The Davidson County fringe has been characterized for some time by agrowing and diverse population. For over 60 years, the county has been grow-ing at a rate greater than the State of Tennessee. It has surpassed thenational rate of population growth for the past 40 years. This process hasincreased the area's population density and has steadily decreased theproportion of the population designated rural (table 1).
Table 1.--Rural and urban population of Davidson County, 1920-60
Year : Total : Urban : Rural : Rural
: Persons Percent
1920 : 167,815 118,342 49,473 29.51930 : 222,854 153,866 68,988 31.01940 : 257,267 167,402 89,865 34.91950 : 321,758 258,886 62,871 19.51960 : 399,743 350,559 49,184 12.3
Source: U.S. Bureau of the Census.
2/ In 1950, the Bureau of the Census adopted the concept of the"urbanized area" so that persons living in densely settled areas outside thelegal liuits of central cities could be more accurately included in the urbanpopulation of the Nation. In 1960 an urbanized area contained, in additionto its central city or cities, (1) incorporated places in the fringe with2,500 inhabitants or more, (2) incorporated places in the fringe with lessthan 2,500 inhabitants but a densely settled area of 100 housing units ormore, and (3) unincorporated territory with a population density of 1,000inhabitants or more per square mile. U.S. Census of Population: 1960.Tennessee, 1, xvii.
4
-10

As the urbanized area expanded, the area in front of the urbanizing ringswas thrown into typical land-use confusion. Land was taken out of agriculturaluse and either developed commercially or held for future profitable developmentwhen the wave of urbanization moved over the area. Highway sprawl, composedof service stations, curio shops, taverns, and roadside stands, surrounded theroadways, while subdivisions, farms, and abandoned buildings dotted much of thecountryside.
The Davidson County fringe economy was similarly in transition. A largeportion of the residents worked either in the central city or in the urbanizedportion of the county. In 1960, for instance, from a total of 85,111 workersliving in. the Standard Metropolitan Statistical Area ring around the City ofNashville, 43,167 (50.7 percent) worked in the central city. Fewer and fewerfringe residents could be classified as farm population (table 2).
The evidence thus indicated a study area in which a constantly growingpopulation lived in a zone of mixed land use and inconsistent development andtended to be employed in urban occupations. More and more fringe people workedin the city and farmed only to supplement their income or to gain products forhome consumption. In 1960, the full-time farm population stood at 5,066persons, only 10.3 percent of the rural population and 1.3 percent of thetotal county population. In 1966, there was no indication of a reversal ofthis decline; it appeared that the fringe will continue to present a mixtureof agricultural and nonagricultural pursuits until it is finally absorbedinto the urbanized area.
METRO'S EFFECT ON FRINGE SERVICES
Previous research findings in Nashville indicated that the expectation ofservice improvement was an important contributing factor to an individual'sfavorable attitude toward metropolitan governmental reorganization. Just asservice expectations were high among pro-Metro voters, however, personsopposed to Metro were skeptical of the proponents' predictions of improvedservices. In the .Fural-urban fringe of Davidson County there was apparentlya general feeling that many of the service benefits of consolidation would not
Table 2.--Farm and nonfarm population of Davidson County, 1920-60
Year ' : Total Farm Nonfarm : Farm:
. :
e Persons Percent
1920 49,473 16,500 32,973 33.41930 68,988 18,105 50,883 26.21940 89,865 21,763 68,102 24.21950 : 62,871 12,010 50,861 19.11960 : 49,184 5,066 44,118 10.3
Source: U.S. Bureau of the Census.
5

URBAN SERVICES DISTRICT 1111
GENERAL SERVICES DISTRICT INCLUDES ALL COUNTY TERRITORY.
FIGURE 2.--METROPOLITAN SERVICE DISTRICTS, 1966
6
12

reach the fringe for some time. Above every other consideration, the fringeresidents feared that Metro would bring higher taxes; they preferred the statusquo rather than risk increased taxes with no appreciable improvement inservice. 3/
Metropolitan Government in Nashville renders service to its citizens bymeans of an interesting service-taxation mechanism. The Metro charter set uptwo service "districts." The General Services District (GSD) consists of theentire county; the smaller Urban Services District (USD) consisted in 1966 ofthe area of the former city of Nashville (fig. 2). Each district has itsown property tax rate to support the services which it provides. Residentsof the USD pay both USD and GSD property taxes. Under the Charter, the USDmay be expanded whenever the Metropolitan Council determines that a given areaneeds urban services and that such services can be provided in the annexed areawithin 1 year.
In 1966 the General Services District provided the following services:
General administrationPoliceCourtsJailsAssessmentHealthWelfareHospitalsHousing for the agedStreets and roadsTrafficSchoolsParks and recreationLibrariesAuditorium
AirportUrban redevelopmentPlanningBuilding codeHousing codeTransitBeer supervisionFair groundsPublic housingUrban renewalElectrical codePlumbing codeElectricityRefuse disposalTaxicab regulation
These services, because they were offered to all residents of the county,were the ones of direct interest to the rural-urban fringe. It should benoted, however, that inhabitants of the Urban Services District received thefollowing additional services:
Additional policeprotection
Fire protectionWaterSanitary sewers
Storm sewersStreet lightingStreet cleaningRefuse collectionWine and whiskey
supervision
3/ Hawkins, Brett William. "Sources of Opposition and Support forMetropolitan Reorganization: The Nashville Experience." Unpublished Ph.D.'dissertation, Department of Political Science, Vanderbilt University, 1964.
7
13

To test the proposition that Metro significantly extended and strengthenedthe services of the residents of the rural-urban fringe, four services wereselected as representative--schools, police protection, streets and roads, andparks and recreation.
Public Schools
Nowhere was the pro-Metro charge of "duplication and waste" under dividedgovernment made more frequently than with regard to public education. In thecampaign for consolidation, evidence was found showing that increasing per-centages of Davidson County school children were living outside the city ofNashville. Yet the county was almost automatically prevented from providing aneducation for these children equivalent to the one provided city children,because the county revenue spent for schools had to be apportioned, on thebasis of average daily attendance, between the county and city schools. Thismeant that school children in both the city and county systems sharedproportionately in the county revenues. The city of Nashville could then useits taxing powers to gain additional revenue for its schools. The result wasa considerably higher per capita expenditure for education in the city than inthe county: in 1962-63, the expenditure per pupil in the city of Nashvillewas $350, compared with $262 in the Davidson County schools. The city schoolswere able to provide many services not available to county children.
The desire to equalize educational opportunity through the entire countywas one of the main forces behind the movement for Metro. Its proponentsclaimed united government could remedy the inequities in divided schoolsystems.
Under Metro, the per capita expenditure for the education of each childin the rural-urban fringe increased from the 1962-63 County average of $262to a 1965-66 Metro average of $410.53. Some of the increase was probablyattributable to inflation and to an increase in the cost of education, butthese factors scarcely account for all the increase.
Teacher standards were improved, additional administrative andsupervisory staff were employed, teachers received raises in base salary andwere made eligible for more employee benefits. The raises were greatest forformer county teachers, whose salaries were equalized with those of teachers inthe former city system. In 1962-63, the county average annual salary forteachers was $4,865; in 1964-65, under Metro it was $5,694.
The pupil-teacher ratio decreased slightly throughout the system.Particular attention was given to the primary grades: the average class loadof a first-grade teacher in 1962 was 32 pupils; in 1964-65 this was down to lessthan 28 pupils. Other factors such as teacher aids; clerical help to relieveteachers of much paperwork; more supervision; and additional supplies alsocontributed to improvements in the educational program.
Metropolitan consolidation made possible centralized health and pupilpersonnel services. The physical and psychological needs of the childrenwere more closely watched. One out of every three Metro school childrenreceived the benefit of a special foundation or government program.
8
14'

Under Metro, a central warehouse for financial and inventory control of
materials and equipment was established, making supplies more readily available.
A unified textbooks program increased the expenditures for textbooks from
$235,043 in 1962-63 to $795,000 in 1965-66.
School attendance zones were also established for all Metro schools. As
population shifted, these zones could be changed to facilitate the most
efficient use of buildings and other facilities. There were no longer any
boundaries between the city and county to obstruct this zoning operation. In
addition, it was easier for a teacher or principal to transfer from one school
to another, even to a distant portion of the county. Such staff transfers
under the former divided school system were much more difficult for teachers
and virtually impossible for principals.
It was clear that the major impact of Metro upon public education wasequalization. In most cases this meant considerable upgrading of educationalservices in the fringe. Prior to consolidation, the city of Nashville containedthe major concentration of revenue sources in Davidson County. Under Metrothese sources were more readily available to the county as a whole. Teacher
salaries were equalized and all schools offered the same basic curriculum.The enlargement of the system increased the amount of State and Federal fundsavailable. One observer summarized the impact of Metro on public education:
The larger the system, the more you can givethe child in the way of education. . . . Metro providesfor every child regardless of his residence or hiseconomic status the best education he can take.
This was a significant achievement and represented what was perhaps themajor service accomplishment of Metro during its first 3 years.
Police Protection
Before Metro, law enforcement in the rural-urban fringe was theresponsibility of the constables and the sheriff. The election of constablesfor 2-year terms was required by the Tennessee Constitution. Two constableswere chosen from Nashville and one in each of the other civil districts inthe county. Their jurisdiction was county-wide, their powers were thoseset by common law, and they operated on a fee basis. A 1952 report indicated,however, that "most of these officials seem to be doing nothing which willearn fees for themselves." As law enforcement officials, the constables wereof little importance.
The Davidson County sheriff was popularly elected for a 2-year term andcould serve no more than three consecutive terms. His jurisdiction was theentire county for most purposes, but he confined his law enforcement workprimarily to the territory outside Nashville.
After the adoption of Metro, the constables were retained because theywere constitutional officers. However, their number was greatly reduced and,in the first election after the institution of Metro, three constables whopledged "to do nothing" in their positions were elected.
9
15

Under the Metropolitan Charter, the sheriff possessed custody and controlof the Metropolitan Jail and Workhouse, but he was no longer the principalconservator of the peace. Responsibility for law enforcement throughout thecounty rested with the Metropolitan Chief of Police.
Under Metro, the consolidation of law enforcement took place rapidly.City and county patrol beats were merged, and many actions were undertaken toimprove the image of municipal law enforcement in Davidson County.
There was a vastly increased area of responsibility for law enforcement.The police jurisdiction increased from 72 square miles (the area of the formercity) to 533 square miles (the area of the entire county). At the time,
Oklahoma City was the only city in the Nation territorially larger than Metro.The police jurisdiction was seven times the size of the former city, and the
population was 67 percent greater.
With the advent of Metro, the Police Department underwent a completereorganization which benefited the fringe. In the rural-urban area the threeitems of greatest change in police protection were personnel administration,patrol coverage, and professional standards.
Personnel Administration -- Under the pre-Metro system there was frequentpersonnel turnover in the Sheriff's office. No person could serve as Sheriff
more than 6 years in succession. If the incumbent were succeeded by a closeassociate, the shakeup was not so drastic, but if a new political factionwon the office, personnel changes were widespread. These resignations impaired
continuity in county law enforcement. It was not that the Sheriff's officewas inefficient; it was just that the direction of the law enforcementoperation was greatly influenced by*the outcome of the election every 2 years.
Under Metro, the entire Police Department was given a permanent careerservice, entirely responsible to an appointive Chief of Police. New pro-
fessional training programs were undertaken. These personnel improvementswere likely to affect the level of law enforcement throughout the county,including the rural-urban fringe.
Patrol Coverage -- As mentioned above, the Metro Police Department had agreater area to patrol than any other law enforcement agency in the countryexcept Oklahoma City. The drastic increase in territory occasioned bycity-county consolidation created great problems for law enforcement duringthe first months under the new system.
Prior to the adoption of Metro, the Nashville City Police employed 408persons to police 72 square miles, for an average of 5.66 police employeesper square mile. After Metro was inaugurated, 103 county police employeeswere added to the force, bringing total employment to 511. This wasequivalent to less than one man per square mile. When this total employmentwas divided into three shifts, only 170 men were available at any one timeto police 533 square miles. On an average shift, there was only onepoliceman on duty per 2,488 citizens. This total included not only patrolmen,but also traffic control personnel, bookkeeping employees, identificationofficers, radio dispatchers, and others.
10
16
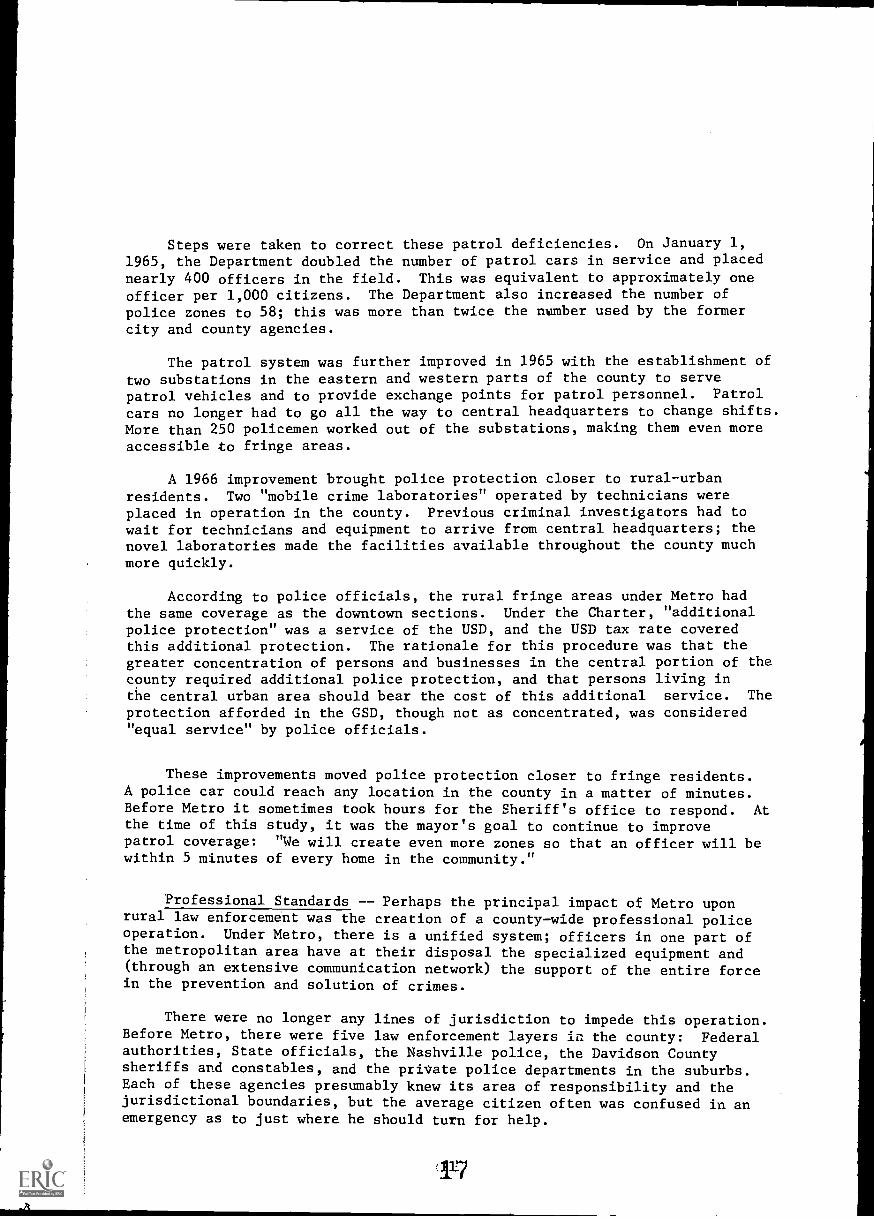
Steps were taken to correct these patrol deficiencies. On January 1,1965, the Department doubled the number of patrol cars in service and placednearly 400 officers in the field. This was equivalent to approximately oneofficer per 1,000 citizens. The Department also increased the number ofpolice zones to 58; this was more than twice the number used by the formercity and county agencies.
The patrol system was further improved in 1965 with the establishment oftwo substations in the eastern and western parts of the county to servepatrol vehicles and to provide exchange points for patrol personnel. Patrol
cars no longer had to go all the way to central headquarters to change shifts.More than 250 policemen worked out of the substations, making them even moreaccessible to fringe areas.
A 1966 improvement brought police protection closer to rural-urbanresidents. Two "mobile crime laboratories" operated by technicians wereplaced in operation in the county. Previous criminal investigators had towait for technicians and equipment to arrive from central headquarters; thenovel laboratories made the facilities available throughout the county muchmore quickly.
According to police officials, the rural fringe areas under Metro hadthe same coverage as the downtown sections. Under the Charter, "additionalpolice protection" was a service of the USD, and the USD tax rate coveredthis additional protection. The rationale for this procedure was that thegreater concentration of persons and businesses in the central portion of thecounty required additional police protection, and that persons living inthe central urban area should bear the cost of this additional service. The
protection afforded in the GSD, though not as concentrated, was considered"equal service" by police officials.
These improvements moved police protection closer to fringe residents.A police car could reach any location in the county in a matter of minutes.Before Metro it sometimes took hours for the Sheriff's office to respond. Atthe time of this study, it was the mayor's goal to continue to improvepatrol coverage: "We will create even more zones so that an officer will bewithin 5 minutes of every home in the community."
Professional Standards -- Perhaps the principal impact of Metro uponrural law enforcement was the creation of a county-wide professional policeoperation. Under Metro, there is a unified system; officers in one part ofthe metropolitan area have at their disposal the specialized equipment and(through an extensive communication network) the support of the entire forcein the prevention and solution of crimes.
There were no longer any lines of jurisdiction to impede this operation.Before Metro, there were five law enforcement layers in the county: Federalauthorities, State officials, the Nashville police, the Davidson Countysheriffs and constables, and the private police departments in the suburbs.Each of these agencies presumably knew its area of responsibility and thejurisdictional boundaries, but the average citizen often was confused in anemergency as to just where he should turn for help.

Metropolitan officials claimed that the expansion of police jurisdictionresulted in a more effective police operation. They cited as evidence the1965 Annual Report of the Federal Bureau of Investigation, which noted thatthere was 7 percent less major crime in Nashville in 1965, compared with 1965,
while the national crime rate increased by 5 percent.
These improvements were areawide in scope, and it was not always possibleto quantify the changes in different parts of the county. It was evident,however, that police protection had been strengthened, and it seemed safe toassume that residents of the outlying areas were major beneficiaries of this
improvement.
Streets and Roads
In the former government of Davidson County, the major item in the public
works budget was highway and road construction. County roads and highways werethe responsibility of the County Highway Commission, which was selected by theCounty's governing body, the Quarterly Court. The commission supervised thebuilding and maintenance of an extensive road system in the rural-urban fringe.At the time of the government reorganization, there were about 1,200 miles ofroads in the County jurisdiction, and only 60 miles of roadway were unsurfaced.
The City of Nashville maintained its own streets and performed no roadservice in the fringe. There was therefore little necessity for the city andcounty to work together in the performance of this function. In terms ofactual operation, there was no real pressure to consolidate the public worksfunction of the two jurisdictions.
Few changes were made in streets and roads in the fringe after theestablishment of one consolidated Metropolitan Department of Public Works.Administratively, a measure of separation was retained between work in urbanand fringe areas. There was a Streets Division which worked primarily in theurban area and a Roads Division which covered the remainder of the county. In
the allocation of equipment and personnel to projects, the main criterion wastraffic; this factor tended to place urban undertakings at the top of any listof priorities:
If one 'identified the GSD with the former county, however, it was evidentthat there was a reversal in the expenditures after the first year of Metro(table 3).
Table 3.--Street and road appropriations, Nashvilleand Davidson County, 1956-65
YearUrban Services District(Nashville before 1963)
General Services District(Davidson County before 1963)
1959 $1,262,927 $1,378,8051960 1,211,291 1,669,2601961 1,603,687 1,614,600
1962 1,703,881 1,621,400
1963 1,684,117 1,494,768
1964 1,726,894 1,839,910
1965 1,425,000 2,107,800
Source: Metropolitan Department of Public Works, Nashville.
12 18
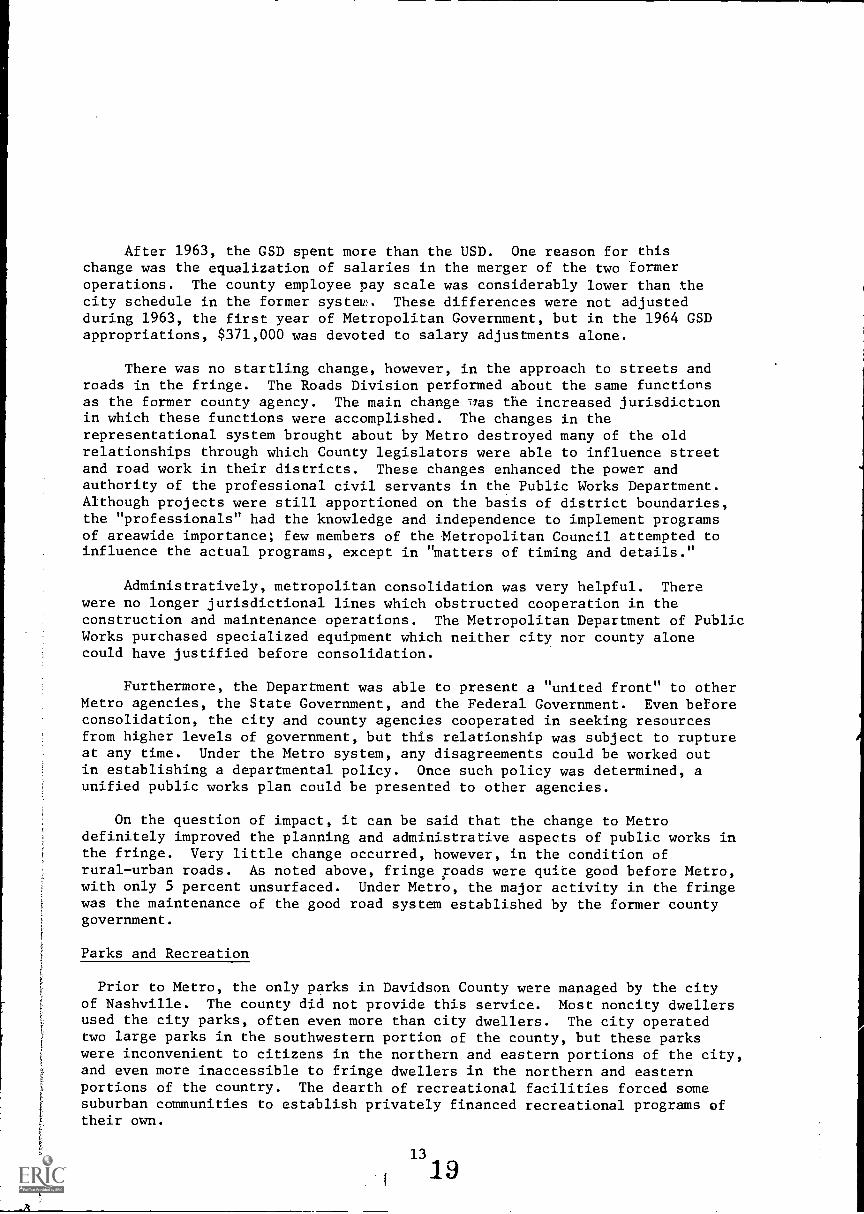
After 1963, the GSD spent more than the USD. One reason for thischange was the equalization of salaries in the merger of the two formeroperations. The county employee pay scale was considerably lower than thecity schedule in the former system. These differences were not adjustedduring 1963, the first year of Metropolitan Government, but in the 1964 GSDappropriations, $371,000 was devoted to salary adjustments alone.
There was no startling change, however, in the approach to streets androads in the fringe. The Roads Division performed about the same functionsas the former county agency. The main change was the increased jurisdictionin which these functions were accomplished. The changes in therepresentational system brought about by Metro destroyed many of the oldrelationships through which County legislators were able to influence streetand road work in their districts. These changes enhanced the power andauthority of the professional civil servants in the Public Works Department.Although projects were still apportioned on the basis of district boundaries,the "professionals" had the knowledge and independence to implement programsof areawide importance; few members of the Metropolitan Council attempted toinfluence the actual programs, except in "matters of timing and details."
Administratively, metropolitan consolidation was very helpful. Therewere no longer jurisdictional lines which obstructed cooperation in theconstruction and maintenance operations. The Metropolitan Department of PublicWorks purchased specialized equipment which neither city nor county alonecould have justified before consolidation.
Furthermore, the Department was able to present a "united front" to otherMetro agencies, the State Government, and the Federal Government. Even beforeconsolidation, the city and county agencies cooperated in seeking resourcesfrom higher levels of government, but this relationship was subject to ruptureat any time. Under the Metro system, any disagreements could be worked outin establishing a departmental policy. Once such policy was determined, aunified public works plan could be presented to other agencies.
On the question of impact, it can be said that the change to Metrodefinitely improved the planning and administrative aspects of public works inthe fringe. Very little change occurred, however, in the condition ofrural-urban roads. As noted above, fringe roads were quite good before Metro,with only 5 percent unsurfaced. Under Metro, the major activity in the fringewas the maintenance of the good road system established by the former countygovernment.
Parks and Recreation
Prior to Metro, the only parks in Davidson County were managed by the cityof Nashville. The county did not provide this service. Most noncity dwellersused the city parks, often even more than city dwellers. The city operatedtwo large parks in the southwestern portion of the county, but these parkswere inconvenient to citizens in the northern and eastern portions of the city,and even more inaccessible to fringe dwellers in the northern and easternportions of the country. The dearth of recreational facilities forced somesuburban communities to establish privately financed recreational programs oftheir own.
13
19

Under the Metropolitan Charter, parks and recreation became a generalservice to be provided throughout the county. The service was to be renderedby a seven-member Board of Parks and Recreation appointed by the mayor withCouncil approval. The Board developed three policies which affected the fringeand promised to produce even greater impact in the future. These policiesconcerned (1) the acquisition of parklands in advance of full urban developmentto maximize selection, ensure proper location, and minimize land costs; (2)the establishment of a priority system of land acquisition providing for largeurban parks, playfield parks, and playground-parks, procured in that order;and (3) the appropriate consolidation, to the fullest extent feasible, ofpark and school recreation facilities.
The planned schedule called for the purchase of the tracts for the largeurban parks first, the acreage for the playfield parks second, and the landfor the playground-parks last. This priority system seemed likely to affectthe fringe more quickly than other areas because of the relative abundance oflarge tracts in the outlying areas, compared with the more urban portions ofthe country.
The acquisition and priority programs were planning policies, however,and their full impact in the fringe would not be realized for several years.A more immediate change in park service was the improvement of recreation forchildren in the fringe through the provision of recreational facilitiesthrough the schools. The Metropolitan Planning Commission recommended thisconsolidation:
It would be to the advantage of the total communityto utilize to the fullest extent feasible whatever existingpublic facilities are available and suitable for recreationalactivity. These facilities would be an especially valuableadjunct to community service when specialized play areas.ire not yet available. The public school plant probably ismost suited to this kind of utilization. Although not allschool sites will lend themselves appropriately to use asjoint educational-recreational facilities, there are manythat could. Keeping in mind that our total school plantserves foremost an educational function, some durality ofuse of the physical plant is no doubt practical.
In this way, Metro extended supervised recreation to the rural-urban fringe.
Each of these policies -- acquisition, priority, and school-parkconsolidation -- suggested that the major impact of Metro upon parks andfringe recreation was the elimination of boundaries between the former cityand county. Insofar as general usage was concerned, these boundaries neverexisted; rural residents used city recreational facilities before Metro. But
under divided government, there was no provision for parks in the fringe areaitself, and citizens in that area frequently had to travel great distancesto parks and organized recreational activities,
The elimination of boundaries under Metro also improved planning andadministration. The relationships among local, State, and Federal agencieswere strengthened, and planners could consider the needs of the entire countyin purchasing open space and planning for its use.
14
20

METRO'S EFFECT ON PUBLIC FINANCE
We have previously considered the services provided by the two servicedistricts, USD and GSD. This information made it clear that the consolidationinvolved a major shift in governmental functions to the county-wide GSD. Many
functions which were former city services became aD services. This wasespecially noticeable in parks and recreation, codes administration andinspection, and traffic regulation and control. In some enterprises such asroads and schools, where both the county and the city had provided parallelservices, the Metro Charter transferred all responsibility to the GSD. Fireprotection, sewerage, street lighting, and refuse collection were the onlymajor services confined to the USD and thus denied to fringe residents.
Transfer of functions had an interesting effect both on expenditures andon each expenditure's percentage of the total budget. Expenditures for everyservice function except one increase: the first yer.. after consolidation(table 4). The sharpest increases were in law enforcement; welfare, health,and hospitals; public libraries; and debt service.
To pay for these service increases, the GSD inherited many of therevenues that were previously available only to the City of Nashville.Significantly, the property tax percentage of total revenues fell during thefirst year of Metro from 56.72 Fercent to 46.99. Increases were registeredin revenue from other local taxes, charges for current services, and fromfines, forfeitures, and penalties.
There was thus ample evidence that the transfer of services and revenuesunder Metro was considerable, The GSD received the bulk of expenditures fromthe consolidation, with the US!, retaining only a small percentage of theexpenses and revenues of the former city. By 1965, Metro was spendingthrough both GSD and USD approximately $25G,000 per day to perform about1,000 different services for a working day population of about 500,000persons.
Any change in the distribution of services is likely to influence thetax rate of the governments providing the, services. And when the redistribu-tion transfers most of the services from one city government to a more generalcountywide government, an increase in the tax responsibility of the countyresident would seem inevitable. Such an increase occurred under Metro.
Changes in the Tax Rates
Through the years the assessments of Davidson County had been increasingat a steady rate, so that a moderate increase in property tax rates wassufficient to support country expenditures. In 1963, the first year of Metro,the total assessments of the County increased by a moderate 3.4 percent.This could not produce a tax base large eAough to support the increased GSDresponsibilities at the same tax rate. Thus, even though Davidson County
possessed a per capita estimated property valuation higher than any otherlarge county in Tennessee, an increase in the tax rate was necessary.
The first year's GSD expenditures were over $27,500,000 greater thanthe Davidson County expenditures for the last year before /etro, an increase
15,
21

Table 4.--Percentage change in annual expenditures by type of service,from the last: Davidson County fiscal year (1962-63) to the
first fiscal yea of the General ServicesDistrict (1963-64)
Service Change
Percent
General government 68.4
Administration of justice 29.5
LaN enforcement and care of prisoners 618.8
Codes administratioh and inspection 100.0
Conservation of natural resources 13.7
Welfare, health, and hospitals 135.0
Public libraries 314.4
Public works 59.9
Traffic regulation and control 100.0
Recreat-i.onal and cultural 100.0
Employee benefits 18,6
Miscellaneous -57.9
Debt service 135.8
Schools 59.4
Source: Annual financial reports of Davidson County and theMetropolitan Government.
16
22

Table 5.--General miliage rates for Davidson County unincorporatedareas and the city of Nashville, 1955-62, and for the general
services district and the urban services district,1963-65, per $100 assessed valuation
YearDavidson County
unincorporated areasCity of
Nashville
Rate per $100 Rate per $100
1955 $2.55 $2.50
1956 2.55 2.50
1957 2.55 2.50
1958 2.55 2.50
1959 2.78 3.00
1961 2.78 3.00
1962 2.76 3.00
YearGeneral Services
DistrictUrban Services
District
Rate per $100 Rate per $100
1963 $3.70 $2.00
1964 3.70 2.00
1965 3.50 1.80
Source: Planning Commission of the Metropolitan Government, LocalGovernment, Nashville and Davidson County, Tennessee, Fact Book Series,Volume II (February, 1966).
17
23

of over 90 percent. Although some city revenues were transferred to the GSDfund to meet part of the increase, more than $11 million had to come from aproperty tax increase.
During the first year of Metro, the property tax rate was increased fromthe 1962-63 county rate of $2.76 for residents in the fringe to a GSD rate of$3.70, a 34.1 percent increase for taxpayers in outlying areas (table 5). Thisincrease gave Davidson County the highest per capita property tax among thelargest counties in Tennessee. At the same time, the USD tax rate for theresidents of the former city fell from $3 to $2. Therefore, the urban pro-perty owner's GSD-USD rate became $5.70 as compared with the city-county rateof $5.76 before consolidation.
It was argued that this increase in taxation was merely an equitableadjustment, whereby rural and suburban residents came to support the servicesthey enjoyed for so long at the expense of the City of Nashville. But thisin no, way detracted from the fact that county taxpayers were paying more forgovernment, a result which many feared when they voted against city-countyconsolidation.
The evidence was clear that appropriations for Metro's first year weregreater than the combined expenditures for the two previous governments in1962-63; the latter were $65,764,000 compared to the first-year Metro budgetof $70,000,000. And the comprehensive consolidation of the Nashvillemetropolitan area certainly aroused the "booster spirit" of the new Government,a factor which may have encouraged excessive expenditures.
But observers of the financial situation both before and after theadoption of Metro were almost unanimous in the opinion that the expendituresfor the governments in the metropolitan area would have increased even if theconsolidation had not taken place. How great the increase would have beenwas open to question. It was true, however, that the former county hadproposed a tax. rate of about $3.15 before the approval of Metro, and thatafter approval of the Charter, the County Quarterly Court cut the budget toprovide for a county tax rate of only $2.76.
The first Metro budget revealed two important changes related to thegovernmental change: a difference in the political environment which enabledthe public schools to get in the first year an equilization of teachers'salaries, and a shift in financial responsibility from the core city to theentire metropolitan area. Other factors in the financial situation, includingdepartmental confusion, assessment difficulties, and d bts and responsibilitiesleft over from the two former governments, were either transitional orcompletely unrelated to the change in governmental structure.
New Revenue Sources
Regardless of the reasons for the increased property tax rate, Metroattempted to cultivate two new sources of revenue after the first year ofoperation, largely to reduce dependence upon the property tax. These newsources wer!: service charges to users of Metro's water-sewer services, anda local 1-pe..,cent sales tax.
The shift in sewer-water financing from reliance on the USD tax rate toreliance on direct consumer charges resulted in higher consumer costs in theUSD for the service, together with much discontent among residents of the
2418

former city. But it allowed a reduction in the USD ta* rate for 1965-66 from$2.00 to $1.80. While this did not affect many fringe residents at the time,it did assure that all future water-sewer services would be financed by usersof the service and not b' transferred to the GSD tax levy to be. paid by allresidents of the metropolitan area. And the change actually gave a sizablereduction in water rates to users in the GSD.
On July 1, 1965, a new 1 percent sales tax became effective, and Metrothus joined the other large Tennessee counties in availing itself of thisadded revenue source. On the day of its inauguration, tax officials estimatedthat about 20 percent of the money collected annually from the sales taxwould come from people who lived outside Metro. On the basis of revenueestimates from this new source, the GSD property tax levy was reduced from$3.70 to $3.50 in the 1965-66 budget.
Thus, in its third year, the Metropolitan Government reduced both servicedistricts' property tax levies, the first general tax cut for Davidson Countyin many years.
METRO AND THE RURAL CITIZEN
Attitudes Toward Services
An important factor in the evaluation of Metro services was the opinionof fringe citizens. To gage this opinion, several items relating to services,
particularly the four functions selected for special attention, were includedin the survey questionnaire administered to 299 voters in connection withthis study. "Don't know" and "no answer" responses were discarded in eachcase, as were the answers of those interviewees who were undecided.
Table 6.--Attitudes toward selected services in therural-urban fringe of Davidson County, 1965
Service Satisfied Dissatisfied
Percent Percent
Schools : 85.7 14.3Streets and roads : 74.9 25.1Parks and recreation : 68.7 31.3Police protection : 66.9 33.1All local services :
considered "as a whole" : 83.2 16.8
More than two-thirds of the respondents were satisfied with each service.When askEd to rate all services "considered as a whole," 83 percent said theywere satisfied (table 6). Furthermore, 68 percent of the respondents agreedeither strongly or mildly that Metro was generally more efficient than cityand county governments were before Metro was adopted (table 7).
On the question of services under Metro compared with those before, how-ever, 58 percent thought they were "about the same" (table 8). This was asignificant indication that, for the majority of fringe respondents at least,
19 25
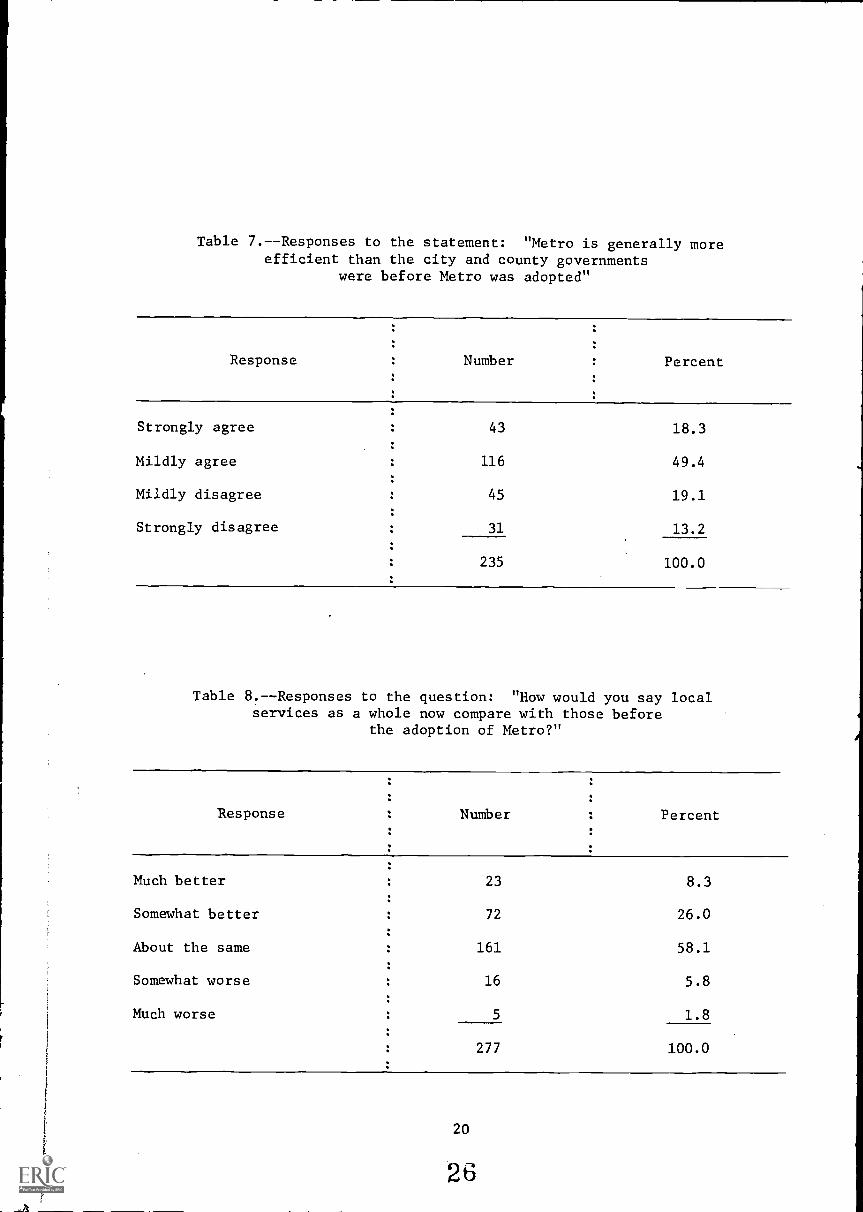
Table 7.--Responses to the statement: "Metro is generally moreefficient than the city and county governments
were before Metro was adopted"
Response Number Percent
Strongly agree 43 18.3
Mildly agree 116 49.4
Mildly disagree 45 19.1
Strongly disagree 31 13.2
235 100.0
Table 8.--Responses to the question: "How would you say localservices as a whole now compare with those before
the adoption of Metro?"
Response Number Percent
Much better 23 8.3
Somewhat better 72 26.0
About the same 161 58.1
Somewhat worse 16 5.8
Much worse 5 1.8
277 100.0
20
26

even though they were satisfied with their services, they believed these hadnot improved greatly under Metro. Of the 42 percent who thought services hadchanged, most of them, by a ratio of more than four to one, said serviceshad improved. Even so, it must be concluded that there was little popularawareness of the marked improvement which Metro proponents claimed wouldfollow consolidation.
There was evidence that distance played a part in shaping these attitudes,that is, that persons living farther from the central city (and thuspresumably the last to receive service improvements) were less likely to feelMetro was more efficient than persons living nearer the central city (table 9).
Table 9.--Relationship between distance from the courthouse (interviewer'sestimate) and response to the statement: "Metro is generallymore efficient than the city and county governments were before
Metro was adopted."
Distance : RespondingAgreed withstatement
: Number Number Percent
Less than 5 miles : 3 3 100.0
5 - 9 miles : 107 76 71.0
10 - 14 miles : 103 69 67.0
15 - 20 miles : 21 11 52.4
Total : 234 159 67.9
A comparison of the results of a previous Metro-wide survey in 1964 withthe attitudes of fringe residents in 1965 revealed similarities. Rural-urbanfringe opinions were closest to those of all Metro voters on public schoolsand all services "considered as a whole," and, to some extent, on parks andrecreation (table 10). It should be remembered that schools and recreationwere two of the services which were most rapidly expanded in the fringe areas.The substantial equalization in these functions may account for the similaritybetween fringe and Metro-wide opinion concerning them, as well as theattitudes toward all services "considered as a whole." Although more than 60percent of the fringe respondents were satisfied with police protection theywere not as satisfied as residents of the county as a whole.
Attitudes Toward Taxes
As in the case of the service analysis, an important factor in theevaluation of Metro's impact upon rural-urban finance was the opinion fringecitizens expressed toward the situation. To gage this opinion, severalquestions relating to local taxes were included in the survey.
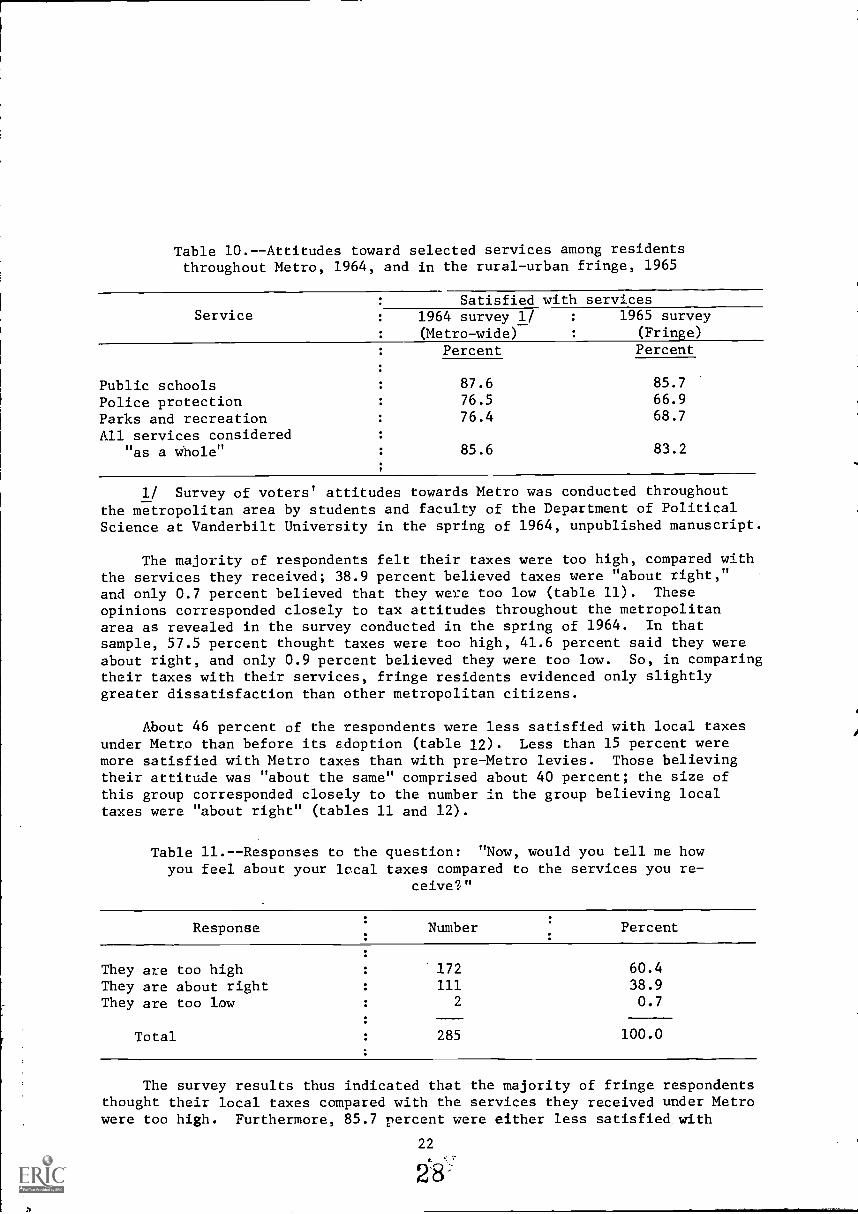
Table 10.--Attitudes toward selected services among residentsthroughout Metro, 1964, and in the rural-urban fringe, 1965
ServiceSatisfied with services
1964 survey 1/ 1965 survey(Metro-wide) (Fringe)
Percent Percent
Public schools 87.6 85.7
Police protection 76.5 66.9
Parks and recreation 76.4 68.7
All services considered"as a whole" 85.6 83.2
1/ Survey of voters' attitudes towards Metro was conducted throughoutthe metropolitan area by students and faculty of the Department of PoliticalScience at Vanderbilt University in the spring of 1964, unpublished manuscript.
The majority of respondents felt their taxes were too high, compared withthe services they received; 38.9 percent believed taxes were "about right,"and only 0.7 percent believed that they were too low (table 11). These
opinions corresponded closely to tax attitudes throughout the metropolitanarea as revealed in the survey conducted in the spring of 1964. In thatsample, 57.5 percent thought taxes were too high, 41.6 percent said they wereabout right, and only 0.9 percent believed they were too low. So, in comparingtheir taxes with their services, fringe residents evidenced only slightlygreater dissatisfaction than other metropolitan citizens.
About 46 percent of the respondents were less satisfied with local taxesunder Metro than before its adoption (table 12). Less than 15 percent weremore satisfied with Metro taxes than with pre-Metro levies. Those believingtheir attitude was "about the same" comprised about 40 percent; the size ofthis group corresponded closely to the number in the group believing localtaxes were "about right" (tables 11 and 12).
Table 11.--Responses to the question: "Now, would you tell me howyou feel about your local taxes compared to the services you re-
ceive?"
Response Number Percent
They are too high 172 60.4
They are about right 111 38.9
They are too low 2 0.7
Total 285 100.0
The survey results thus indicated that the majority of fringe respondentsthought their local taxes compared with the services they received under Metrowere too high. Furthermore, 85.7 percent were either less satisfied with
22
1'28

local taxes under Metro than before, or they felt about the same. There was
only negligible feeling of greater tax satisfaction under Metro.
Table 12.--Responses to the question: "How would you compare your presentattitude toward local taxes with your attitude toward local taxes
before the adoption of Metro?"
Response Number Percent
More satisfied 38 14.3
About the same 105 39.5
Less satisfied' 123 46.2
Total 266 100.0
Despite their dissatisfaction with local taxes, however, 57 percent ofthe fringe residents agreed that under Metro the tax burden was more fairlydistributed than before its adoption (table 13). Apparently there was agreater realization in the fringe than generally acknowledged that ruralresidents were getting a "free ride" in the use of city facilities underdivided government. Thus, the majothy of fringe dwellers, while lackinggreat enthusiasm for their Metro tax rates, indicated a general belief thatthe new system was fairer in its shifting of a larger portion of the taxburden to residents of the rural-urban fringe.
Both in terms of citizen perception and empirical analysis, the pro-position that Metro increased the tax responsibility of the residents of therural-urban fringe was confirmed. Local taxes increased, with citizens ofthe outlying areas experiencing a considerable increase in their tax rate.It had been anticipated that dissatisfaction would therefore be greater thanunder the previous county government. The survey revealed this dissatisfaction.
Analysis of the budgets and tax rate of the new government indicatedthat the General Services District assumed responsibility for services whichfringe and suburban residents had been using for some time at the expense of
Table 13.--Responses tr the statement: "The tax burden is morefairly distributed under Metro than it was before Metro was
adopted."
Response Number Percent
Agree 129 57.3Disagree 96 42.7
Total 225 100.0
23

the City of Nashville. This shift of financial responsibility had beendemanded by the urban supporters of Metro as the "fair thing to do." The surveyresults suggested that a large number of fringe voters agreed that the Metroshift had resulted in a fairer distribution of the tax burden. Rural-urbanresidents thus seemed to acknowledge that, although taxes were too high andless satisfactory to them personally under Metro than before, the redistribu-tion of the tax load to force them to pay more to support general services wasa fairer arrangement.
Political Access
Metropolitan reorganization may consolidate authority and responsibility;in so doing, it may give citizens a greater sense of belonging to acommunity which is both willing and able to deal with their governmentalproblems. On the other hand, it may create in the minds of some citizens,especially those in the fringe, a sense of alienation from the politicalprocess, a feeling that big government will not listen to their complaints.
In connection with this question, the third proposition examined in thisstudy stated that Metro, while improving services and increasing taxes,diluted the political access of fringe residents. The validity of thisproposition was tested by a consideration of the Metro representationalsystem and the political knowledge and attitudes of fringe respondents.
The pre-Metro Davidson County government was more tradition-dominatedthan any of the other metropolitan counties in Tennessee. The other threelarge Tennessee counties had altered their basic Quarterly Court and CountyJudge arrangement, but Davidson County legislative and executive procedureswere over a century old, and dominated by rural interests.
The County Court representation clearly favored the sparsely populatedareas in the rural-urban fringe. In 1950, the average rural-urban districthad one magistrate per 3,478 persons, compared with the county average of6,846 and the City of Nashville average of 9,174. Subsequent increases inQuarterly Court membership did little to change this overrepresentation. It
seemed likely that each of these fringe magistrates was able to give moreattention to individual needs in his smaller constituency than magistrates inthe more populous districts.
Rural power was drastically reduced by the new Metro representationalsystem. The Charter established one county-wide legislative body, theMetropolitan Council, composed of five councilmen-at-large, and 35 councilmenelected from single-member districts based upon decennial reapportionment.Given the decided minority status of rural-urban residents in themetropolitan area, it was highly unlikely that a fringe resident wouldcapture an at-large post. Moreover, the "one-man, one-vote" apportionment ofthe single-member constituencies removed the previous overrepresentationwhich fringe voters enjoyed in the former Davidson County Quarterly Court.
Of the 10 single-member districts including fringe territory, only twowere dominated by rural residents; eight contained significant areas ofdensely populated subdivisions. It could be assumed that in most of thedistricts the subdivisions equaled or surpassed the fringe residents in votingpower, diluting rural ability to elect and influence members of the council.
24
Moreover, the metropolitan mayor under the Charter headed an extensive
administration which was responsible to him rather than to the council. Elected
by a metropolitan electorate, the mayor presumably tended to favor the
interests of the majority of the voters; in Metro, that meant urban voters.
In addition, the mayor headed an urban bureaucracy with even more influence
in consolidated government than before. Citizens increasingly turned from
legislators to civil servants in attempts to solve their day-to-day
governmental problems.
It thus appeared on the surface that, in terms of representation and
administrative reorganization, Metro had resulted in the dilution of the
access to decisionmakers which rural-urban voters possessed in the former
county system.
Analysis of Metro's impact upon formal structure, however, was not
enough to evaluate the access which fringe residents had to their new govern-
ment. The amount of political access is also closely associated with personal
attitudes. Structural changes might be made which impeded or facilitated
access, yet the opinions concerning access might remain substantially the
same among voters. In the final analysis, these "feelings" of political
access by fringe residents were probably more important in the context of
democratic government than any quantitative manipulation of single-member
districts.
For this reason, questions concerning access were included in thequestionnaire administered to the voter sample. To measure the personalattitudes of voters toward political access under Metro, respondents wereasked three main questions:
1. Who gave you the most attention, your magistrates (beforeMetro) or your councilman (under Metro)?
2. Now how do you feel about the effect of Metro on yourpersonal ability to get an attentive hearing (fromthe responsible officials when you feel a problemexists in the community)?
3. Do you agree or disagree with the following statement:"Under Metro it is easier to know whom to call or seewhen you have a problem than it was under separate cityand county governments."
In response to the question concerning attention from magistrates beforeMetro, compared with attention from councilmen under Metro, 66 of therespondents felt their councilmen gave them more attention than theirmagistrates did, whereas 64 preferred the attention of the magistrates. Thelargest number of interviewees thought there was no difference betweenattention from magistrates and councilmen (table 14). These results wereunexpected because redistricting reduced fringe mathematical representation.An important finding was that 69.1 percent of those answering the questionthought either that attention under Metro was better than before or thatgovernmental change had made no difference in attention from their legislativerepresentative.
25
31.

Table 14.--Responses to the question: "Who gave you the most attention, yourmagistrates (before Metro) or your councilman (under Metro)?"
Response Number Percent
Magistrates : 64 30.9Councilman : 66 31.9No difference : 77 37.2
Total 207 100.0
In table 15 is shown the division in the sample on the question ofindividual ability to get an attentive hearing from government officials whena problem was thought to exist in the community. Half of those answering thequestion felt that Metro had made it easier to get an attentive hearing,while 30 percent believed Metro had brought no change in their ability to getan attentive hearing. Only one respondent in five felt that Metro had madeit harder to get a hearing from the responsible officials. Four out of fiverespondents believed that Metro had either made a hearing easier or had broughtno change.
Table 15.--Responses to the question: "Now, how do you feel about the effectof Metro on your personal ability to get an attentive hearing(from the responsible officials when you feel a problem exists
in the community)?"
Response Number Percent
Metro made it easier 135 50.0Metro brought no change 81 30.0Metro made it harder 54 20.0
Total 270 100.0
Well over half the respondents agreed that it was easier to know whom tocontact concerning a problem under Metro than under the previous system ofdivided government (table 16). Only slightly over one in three respondentsdisagreed.

The responses to these questions suggested that a large proportion of theresidents of the rural-urban fringe felt their access was the same or betterunder Metro than it had been under the previous system. Nearly 70 percent ofthose responding believed either that they received more attention from theirmagistrates or that there was no difference. Half the respondents felt Metrohad improved their personal ability to get the attention of officials inmatters conzerning the community; 30 percent felt Metro had brought no change.Over 60 percent agreed that under Metro it was easier to establish contactwith the "right person" than under separate governments.
Table 16.--Responses to the statement: "Under Metro it is easier to knowwhom to call or see when you have a problem thaz it was under
separate city and county governments2;
Response Number Percent
Agree 144 63.7
Disagree 82 36.3
Total 226 100.0
27
3a

APPENDIX. FACTORS AFFECTING RESPONDENTS' OPINIONS OF METRO
In the three preceding sections, the impact of metropolitan reorganizationupon the services, taxes, and political access of the fringe was discussed.In each ca=e, the characteristics of Metro's operation in the outlying areawere reviewed, and the performance was compared with the attitudes ofrespondents toward their services, taxes, and access.
In a democratic polity, however, mere "objective" indices are usuallyinsufficient. A government may perform its functions smoothly and still failto satisfy its citizens, for any number of reasons. In the case of theMetropolitan Government of Nashville and Davidson County, it may be that certaincitizens simply disliked the idea of areawide, centralized government. Orthey might have generalized from one contact with the government or one of itsofficials to a general disapproval of Metro.
It was hypothesized that certain characteristics had an influence onsatisfaction with the new government, independent of the specific achievementsor aims of Metro.
Socioeconomic Status
One of the hypotheses to be tested was that respondents with highersocioeconomic status (higher income, more education, more prestigious occupa-tion) were more likely to be satisfied with Metro than those with lowersocioeconomic status.
There was a significant association between education and satisfactionwith Metro (appendix table 1). As lee1 of education increased, satisfactiontended to increase. There was no consistent relationship between occupationand satisfaction, although the highest prestige grouping (professional andtechnical) was most satisfied with Metro. There was some apparent associationwith Metro, satisfaction tending to increase as income increased, but thecorrelation did not meet the statistical test of significance.
Appendix table 2.--Relationship between level of education and satisfactionwith Metro
Education attained
Satisfied with: Interviewees Metro
Number Number : Percent
11 grades or less 108 49 45.4High school graduate 93 57 61.3Some college 36 24 66.7College graduate 29 19 65.5Postgraduate 13 12 92.3Other 1 1 100.0
Total 280 162 57.9
28
34-

Majority satisfaction with Metro was found in all socioeconomic categoriesexcept persons with less than a high school education, businessmen andproprietors, retired and unemployed persons, and persons earning less than$3,000 annually.
Knowledge of Local Government
Knowledgeability in this study was tested by questions relating to mun-dane but important information which the average informed citizen might beexpected to know: (1) the name of his councilman, (2) the number of hiscouncilmanic district, and (3) the name of his magistrate before Metro. Inaddition, homeowners were asked to give the effect of Metro upon the propertytax rate and the amount of the tax rate.
The responses revealed no support for the hypothesis that voters who weremore knowledgeable concerning local governmental affairs were more likely tobe satisfied with Metro than those who were less knowledgeable (appendixtable 2). A majority in each classification were satisfied with Metro,regardless of their level of local political knowledge. No pattern emergedwhich would indicate that this satisfaction varied in relation to knowledgeof local government as measured by the questions. Indeed, satisfaction wasgreater among those completely ignorant of local government (59 percent) thanamong those answering all three questions correctly (55 percent).
Appendix table 2.--Relationship between knowledge of localgovernment and satisfaction with Metro (all voters)
Accuracy of response to threequestions 1/
Interviewees
Number
Satisfied withMetro
Number : Percent
No answer correct 74 44 59.5One answer correct 86 55 64.0Two answers correct 77 40 51.9Three answers correct 44 24 54.5
Total 281 163 58.0
1/ Voter knew (1) name of his councilman; (2) number of his councilman'sdistrict; (3) name of his magistrate before Metro.
Geographic Location
It was hypothesized that the distance factor would be an important influ-
ence upon satisfaction with Metro. As distance increased, the affinity for
the central city was expected to decrease. Residents in the periphery of themetropolitan area were expected to be less satisfied with consolidation thanthose near the central city.
29

There was considerable apparent support for the hypothesis, forsatisfaction with Metro did indeed increase as distance from the central city
decreased, but the relationship between distance and satisfaction did notmeet the statistical test (appendix table 3), and the hypothesis cculd not be
accepted.
Rurality
It was hypothesized that rural values and attitudes influenced satisfac-tion with metropolitan consolidation, and that voters with weak ruralcharacteristics (as measured by several variables) were more likely to besatisfied with Metro than those who possessed strong rural attachments andcharacteristics.
The variables selected to measure rurality were: (1) whether the
respondent preferred to name the new government "Metropolitan Nashville" or"Metropolitan Davidson. County," (2) whether the respondent felt he lived inthe "city" or the "country," (3) length of residence in the fringe, (4) landuse, and (5) rural values, as measured by a "rurality score." It was expected
that a person with strong rural attachments would favor "Davidson County" asthe name for the new government, to say he lived "in the country," to havelived in the fringe a relatively long time, to live on a farm, and to havestrong rural values; he was also expected to be dissatisfied with Metro. The
weaker a citizen's rural attachment as measured by these variables, thestronger his support for Metro was predicted to be.
All measures concerning this hypothesis strongly supported the relation-ship between rurality and attitudes toward Metro. Persons most satisfiedwith Metro tended to prefer "Metropolitan Nashville" as the name for thegovernment, to perceive themselves as city dwellers, to have lived in thefringe less than 5 years, and to live in a subdivision (appendix tables 4 to 7).
Appendix table 3.--Relationship between distance to the courthouse(interviewer's estimate) and satisfaction with
Metro
Distance to courthouseRespondents
Numbers
Satisfied withMetro
Number : Percent
Less than 10 miles 129 80 62.0
10 - 14 miles 120 70 58.3
15 - 20 miles 31 12 38.7
Total 280 162 57.9
In connection with the measure of rural values, respondents were askedto state their agreement or disagreement with six statements concerning ruraland urban living:
30
36

1. Other things being equal, a political candidate who grew up inthe city will understand the problems of Davidson County betterthan one who grew up in the country.
2. Country people are generally more friendly than those living inthe city.
3. Generally speaking, the country is the best place to rearchildren.
4. Thomas Jefferson was right when he said that America shouldremain a nation of farmers and not be overrun with cities.
5. Rapid urbanization is good for the United States.
6. Moral standards are generally higher in the country than inthe cities.
These statements were scattered through a much longer list of statementsrelating to many subjects. Each respondent was given live possible answersto each statement: strongly agree, mildly agree, undecided, mildly disagree,and strongly disagree. Each answer was weighted, and, on the basis of hisanswers to the six statements, each respondent was given a "rurality score."A "rural" respondent was one with a score ranging from +3 to +12 on therurality scale, while a respondent who scored between -3 and -12 on the scalewas considered "urban."
There was a clear differentiation between respondents who could beclassified "rural" and "urban" on the rurality scale. Among the 170 respond-ents so classified, there was a clear relationship between the ruralityscore and Metro satisfaction (appendix table 8). While "urban" people weresatisfied with Metro by nearly two to one, less than half the "rural"respondents were satisfied. There was a definite association betweenpossession of rural values (as measured by the rurality score) and dissatisfac-tion with Metro.
All five measures of rurality thus strongly supported the hypothesis.Respondents with weak rural characteristics were more likely to be satisfiedwith Metro than those who had strong rural characteristics. Of the fourhypothetical variables discussed in this section as possible influences onsatisfaction with Metro--socioeconomic status, knowledge of local government,geographical location, and rurality--rurality, together with education,exerted the strongest influence.
It is interesting to note that education and rurality are closelyrelated to the "innermost sentiments and values" which many believe to be ofcrucial importance in determining an individual's political behavior. On thebasis of the data presented in this section, it can certainly be said thatthese values strongly influenced respondent attitudes toward the performanceof Metro.
31
37

r.
Appendix table 4.--Relationship between preference for name of
the new government and satisfaction with Metro
Name Preference RespondentsSatisfied with
MetroNumber Number Percent
Metropolitan Nashville 149 97 65.1Metropolitan Davidson
County 100 56 50.9
Total 259 153 59.1
Appendix table 5.--Relationship between city-county residenceperception and satisfaction with Metro
Residence perception RespondentsSatisfied with
Metro
: Number Number Percent
"City" 150 86 64.0
"Country" 120 58 48.3
Total 270 144 53.3
Appendix table 6.--Relationship between length of residenceand satisfaction with Metro
Length of residence : RespondentsSatisfied with
Metro
Less than 5 years
5-10 years
More than 10 years
Total
Number
119
93
69
281
Number Percent
79 66.4
52 55.9
32 46.4
163 58.0
32 38
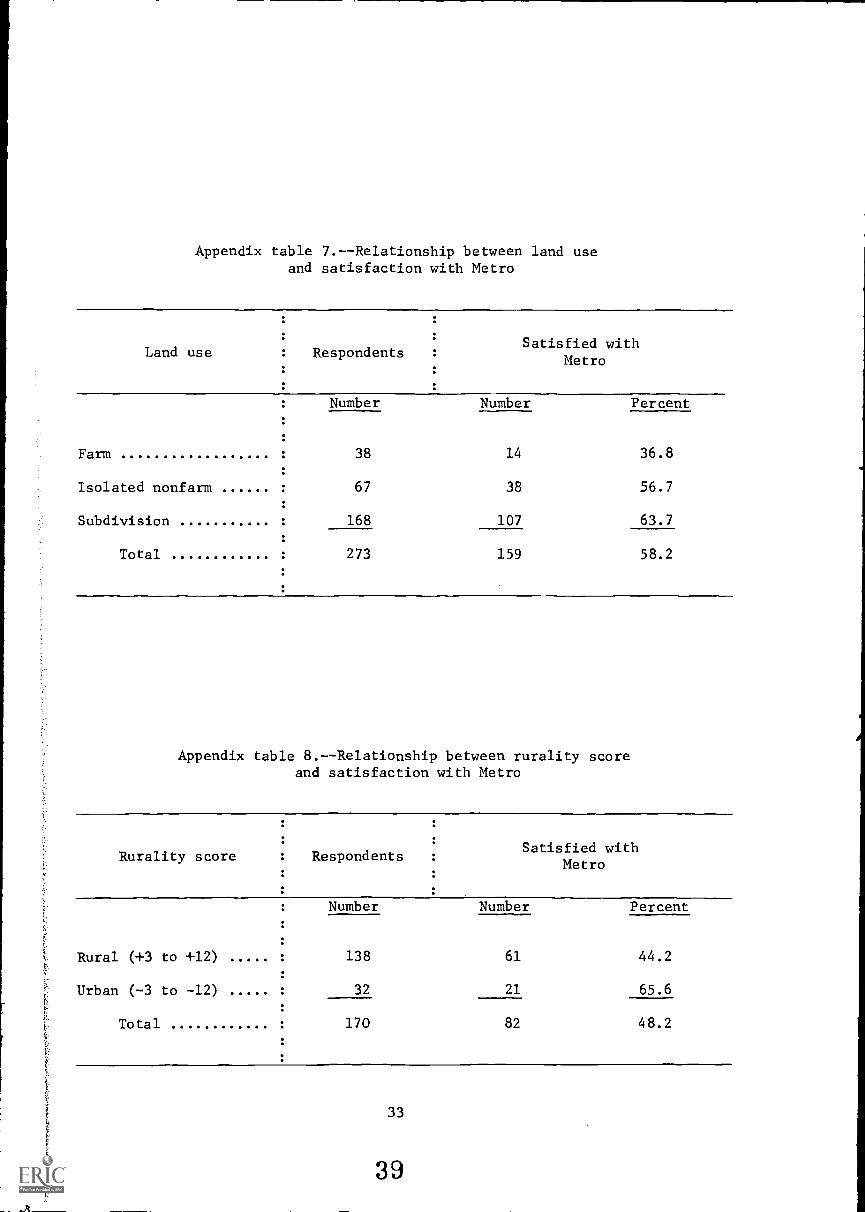
Appendix table 7.--Relationship between land useand satisfaction with Metro
Land use RespondentsSatisfied with
Metro
Number Number Percent
Farm 38 14 36.8
Isolated nonfarm 67 38 56.7
Subdivision 168 107 63.7
Total 273 159 58.2
Appendix table 8.--Relationship between rurality scoreand satisfaction with Metro
Rurality score RespondentsSatisfied with
Metro
Number Number Percent
Rural (+3 to +12) 138 61 44.2
Urban (-3 to -12) 32 21 65.6
Total 170 82 48.2
33
39


![[XLS]tax.vermont.govtax.vermont.gov/sites/tax/files/documents/SPAN Data List... · Web view015-005-10947 015-005-10091 015-005-11649 015-005-10773 015-005-11222 015-005-10889 015-005-11109](https://img.dokumen.tips/doc/110x75/5ac161e67f8b9a5a4e8d129a/xlstax-data-listweb-view015-005-10947-015-005-10091-015-005-11649-015-005-10773.jpg)