Embed Size (px)
Citation preview

DOCUMENT RESUME
PUB TYPE
urray, Mary AnneThe Concepts Underly ng Structure Coe ficients,Communality, and Factor Scores in the ExploratoryFactor Analytic Case.30 Jan 8717p.; Paper presented at the Annual Meeting of theSouthwest Educational Research Association (DallasTX, January 29-31, 1987).Speeches/Conference Papers (150) -- ReportResearch/Technical (143)
TM 970 253
EDRS PRICE MF01/PC07. Plus Postage.DESCRIPTORS Correlation; *Factor Analysis; *Factor Structure;
*Goodness of Fit; Higher Education; MathematicalModels; *Matrices; Multiple Regression Analysis;Research Methodology; Simulation; StatisticalStudies; *Weighted Scores
IDENTIFIERS *Communaljtv. Z Scores
CTThis paper illustrates the transformat on of a raw
data matrix into a matrix of associations, and then into a factormatrix. Factor analysis attempts to distill the most importantrelationships among a set of variables, thereby permitting sometheoretical simplification. In this heuristic data, a correlationmatrix was derived to display associations among the variables.Multiple regression, both with and without Z-score transformation,was used to generate structure coefficients and the factor matrix.This matrix shows the correlation of each variable with the factorsextracted from the association pattern. Two factors were extracted inthis case. For each, the scores constitute a new variable, a weightedcombination of the scores on each of the original variables. Eachfactor is treated as a hypothetical construct, to be interpreted fromthe-pattern of factor scores. Communality is the proportion ofvariance of each variable that is reproduced in the extractedfactors. If multiple :egression is the factoring method, than the sumof communalities is equivalent to the multiple correlationcoefficient. (LFG)
** **** **** ********* ** ** *************uctions supplied by EDRS are the best that can be made
from the original document.********************** **************** *************
THE CONCEPTS UNDERLYING
STRUCTURE COEFFICIENTS, COMMUNALITY, AND FACTOR SCORES
IN THE EXPLORATORY FACTOR ANALYTIC CASE
Mary Anne McMurray
Un versity of New Orleans 70148
1.14. DWPANTIOKPIT O (DUCAT)ONQ. le gemstone Reeemon end unpeownontEOUGAMONel. RESOURCES INFORMATION
CENTER (ERIC)
M document WI Win teptodimed esMild from Ina Olteen Ow WontMoon
mtemling ita Minor Changes WM been meds to unpromi
MIMMIX.WWW4M
Poore& otiow or comae. owed in tho OcCikment do net niKeteatinit negnesent eMoiel
OEM RoNhon ot Robrio
"PERMISSION TO REPRODUCE THISMATERIAL HAS BEEN GRANTED BY
/ii f% fikAh4 t-r9
TO THE EDUCATIONAL RESOURCESINFORMATION CENTER (ERIC)."
Paper presented at the annual meeting of the Southwest Educational:Research Association, Dallas January 30, 1987.
Abstract
This paper illustra_es the transformation of a raw data matrix into
a matrix of associations, and then into a factor matrix. In the procesS
of extracting two factors from heuristic data, the nature of structure
coefficients is explored, the derivation and utility of factor scores are
discussed, and the concept of communality is related to the multiple
co- elation coefficient.
Although factor analysis has several possible uses, an important,
application is the service the procedures provide to summarizing
scientific data, thus enabling empirical relationships to be more easily
conceptualized (Gorsuch, 1974, pi 2). The analysis evaluates a data
matrix defined by two dimensions and can be visualized as a rectangular
table _ith the columns defining one set of entities (such as variables,
people ) or occasions of measurement) and the rows defining a group of
replicates -ver which those entities are measured.
According to Horst (1965, p. 17), tta primary concern of factor
analysis with such a table of numbers is to determine whether the table
may be simplified in some way". The original dati matrix may contain
random or unreliable information in addition to relevant or systematic
info -ation (p. 469). A simplif cation of the matrix, it is expected,
will help to disentangle complex interrelationships so that they may be
more easily understood as they exist in .eal life (Rummel, 1970, pp.
3-4). Factor analysis "distill the info ation in the ,variables such
that the data are more meaningful'
Several values derived through factor analytic procedures allow the
researcher to examine different aspects of the relationships among the
variables of a study. The present paper discusses the concepts
underlying these indices. Specifically, this paper focuses upon
ucture coefficients factor scores, and commLna ity coefficients.'
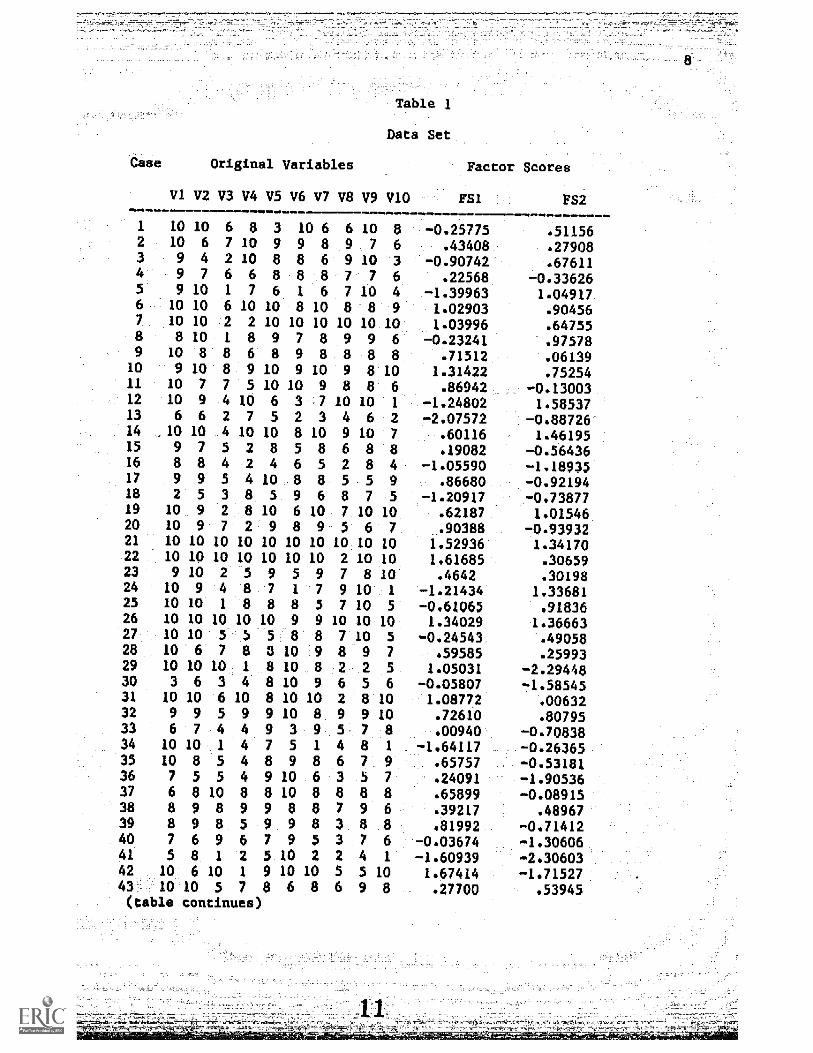
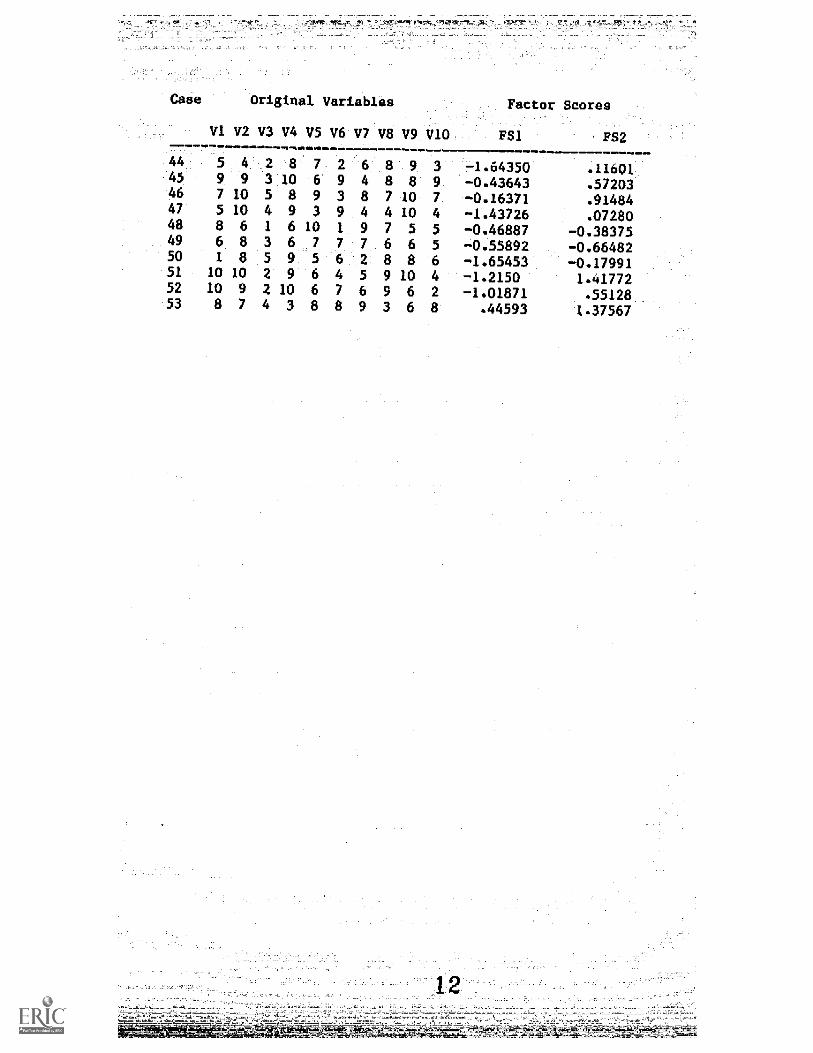
Hypothetical Data
-x presented in Table 1 is analyzed in the presentThe raw data ma

paper for illustrative purposes. The var ables are ten inst uc
-elegies ratedby a sample of 53 college students on a scale of 1 to 10
with respect to their helpfulness to learn ng. The -trategies analyzed _
consisted of the following:
The tfacher provides some kind of outline in advance to indicate
what is :o be studied.
2. The teacher directs the manipulation of materials leading to
discovery of concepts.
3. The teacher asks the class questions that can be answer es" 'or
"no."
4. The teacher directs the writing of term papers or work ort
projects to be -ompleted outside of class time
5* The teacher provides opportunitieS for discussion of concepts
with classmates.
6. The teacher writes notes on board for students to copy.
7. The teacher provides opportunities for work/discussion in
groups'
8. The teacher assigns reading from sources other than textbook *
9. the teacher directs the manipulation of materials that
illustrate concepts presented.
10. The teacher encourages students to study with classmates.
Included in Table 1 is the data utilized in the study.
Insert Table 1 about here.
An initial step in factor analysis is the computation of a matrix of
asbociation coefficients frcm the raw data matrix. In the present study

a correlation matrix was derived. Perusal of that matrix, sho
2, reveals that _ome pairs of variables have highe correlations with one
another than do others. A pattern may exio: among the correlation
coefficients.
Insert Table 2 about here.
Determination of that pattern is the next logical step in factor
analysis. A new matrix is derived, the elements of which can be termed,
tructure coefficients. A structure
correlation between a variable and a varie:
process of weighting and aggregating (Thon
analytic case the derived entity is a far
Avrtion_ of bome or all of the original
the factor matrix, the original variablel
'the columns. For the illustrative dat
initially extracted using the principai
Indicates the
4erived by
the factor
composite of
t4e new matrix,
nd factors form
two factors were
procedure, and the
results were subjected to varimax rotatic.L lify their meaning. The
two factors seem to distinguish be rategies which promoted
communication with classmates and dependence upon the instructor (Factor
and strategies which encouraged selfinvolvement of the student with
learning materials (Factor II). The structure coefficients of the 10
variables for each of the two factors are presented in Table 3.
Insert Table about here,
Factor Incftrp-cetation'
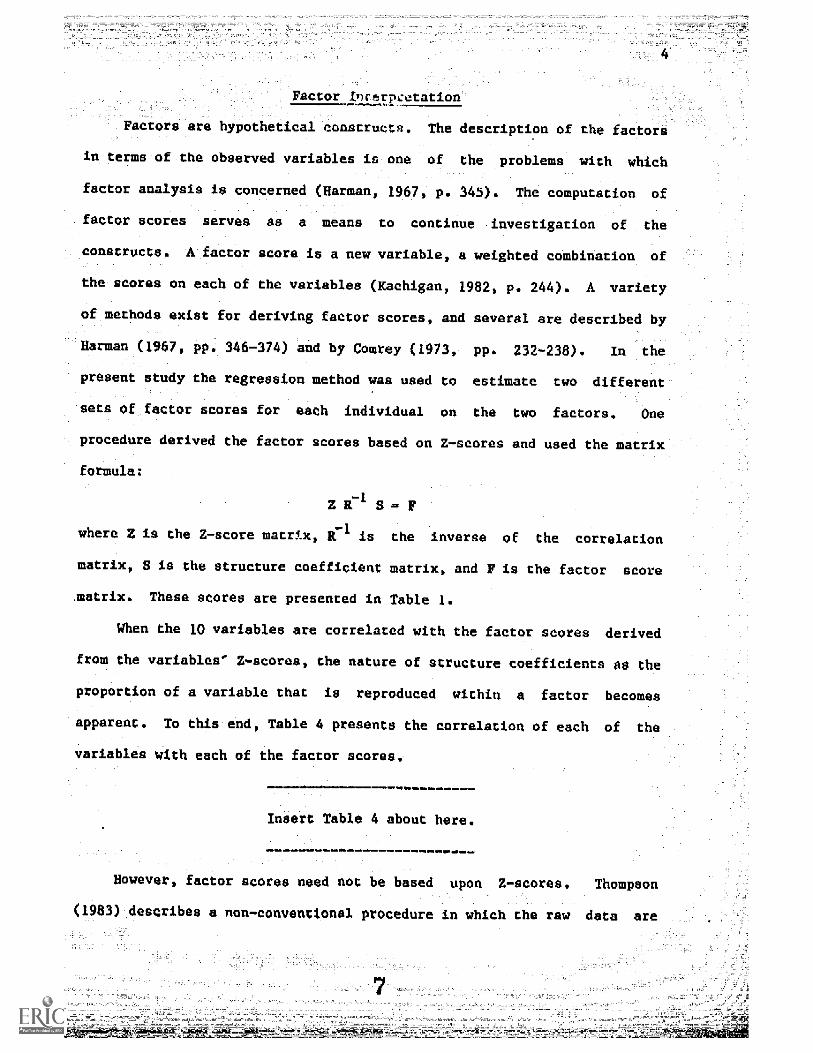
.Factors are hypothetical construatn. The description of the factors
in terms of the observed variables is one of the problems with which
factor analysis is concerned (Harman, 1987, P. 345 ). The computation of
factor scores serves as a means to continue investigation of the
constructs. A factor score is a new variable, a weighted combination of
the scores on each of the variables (Kachigan, 1982, p. 244). A variety
of methods exist for deriving factor scores, and several are described by
Harman (1987, pp. 3467374) and by Comrey (1473, pp. 232-238). In the
present study the regression method was used to estimate two different
sets of factor scores for each individual on the two factors. One
procedure derived the factor scores based on Z-scores and used the matrix
fo-Tula:
where Z is the 2-score mat_i.
Z R S
is the inverse of the correlation
matriX, S is the structure coefficient matrix, and F is the factor score
.matrix. These scores are presented in Table 1.
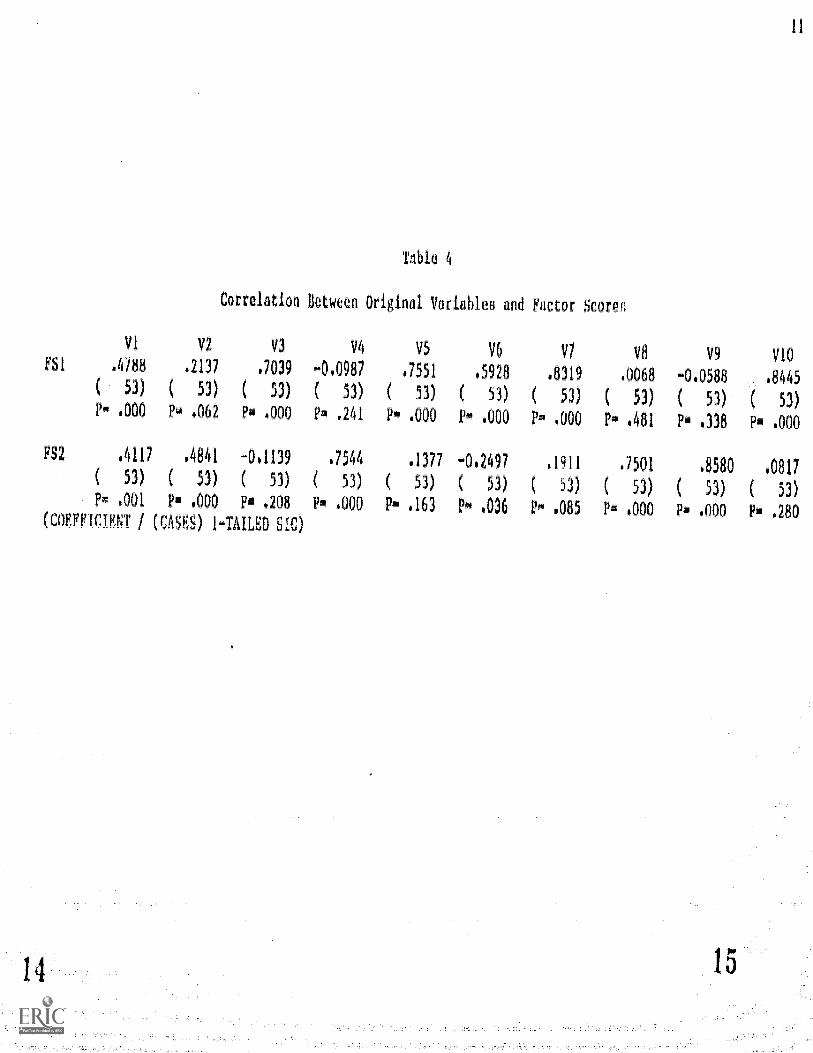
When the 10 variables are correlated -ith the factor scores derived
from th- variables Z-scores the nature of structure coefficients as the
proportion.of a variable that is reproduced within a factor becomes
-apparent. Tothis- end, Table 4 presents the co- elation of each of the -
variables -ith each of the factor scores.-
Insert Table 4 about here.
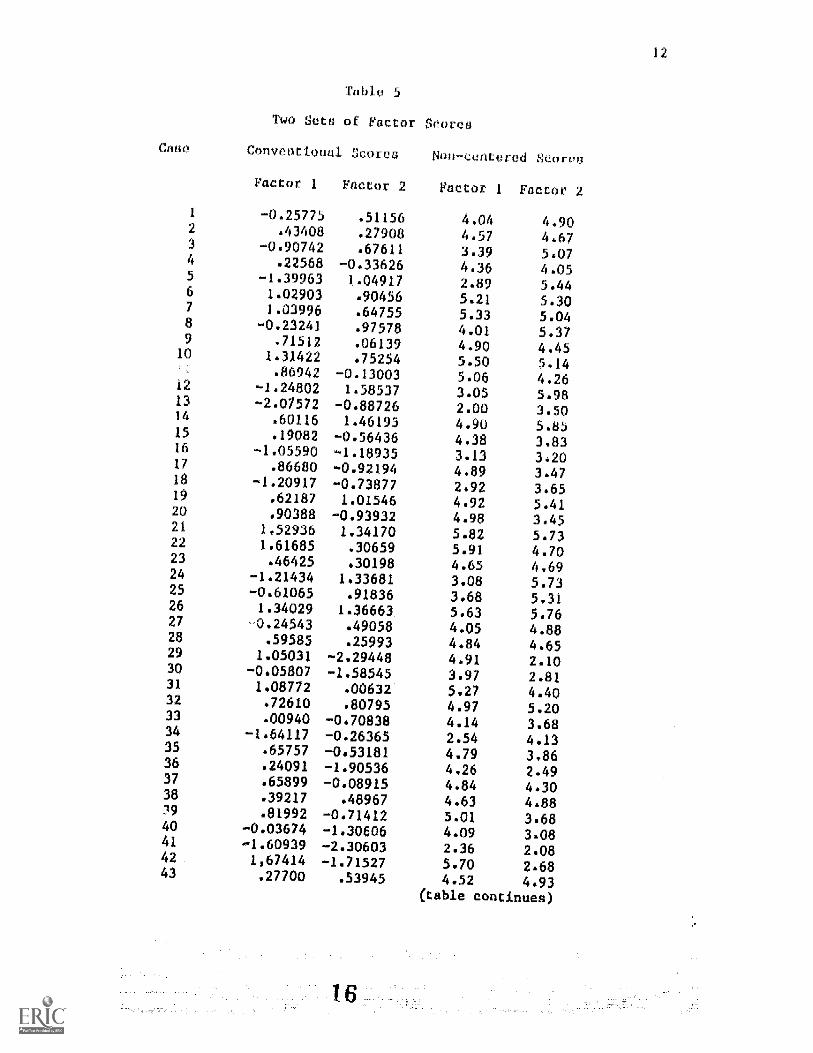
Howeve_, factor scores need not be based upon Z-scores. Thompson
a non-conventional procedure in which the raw data are
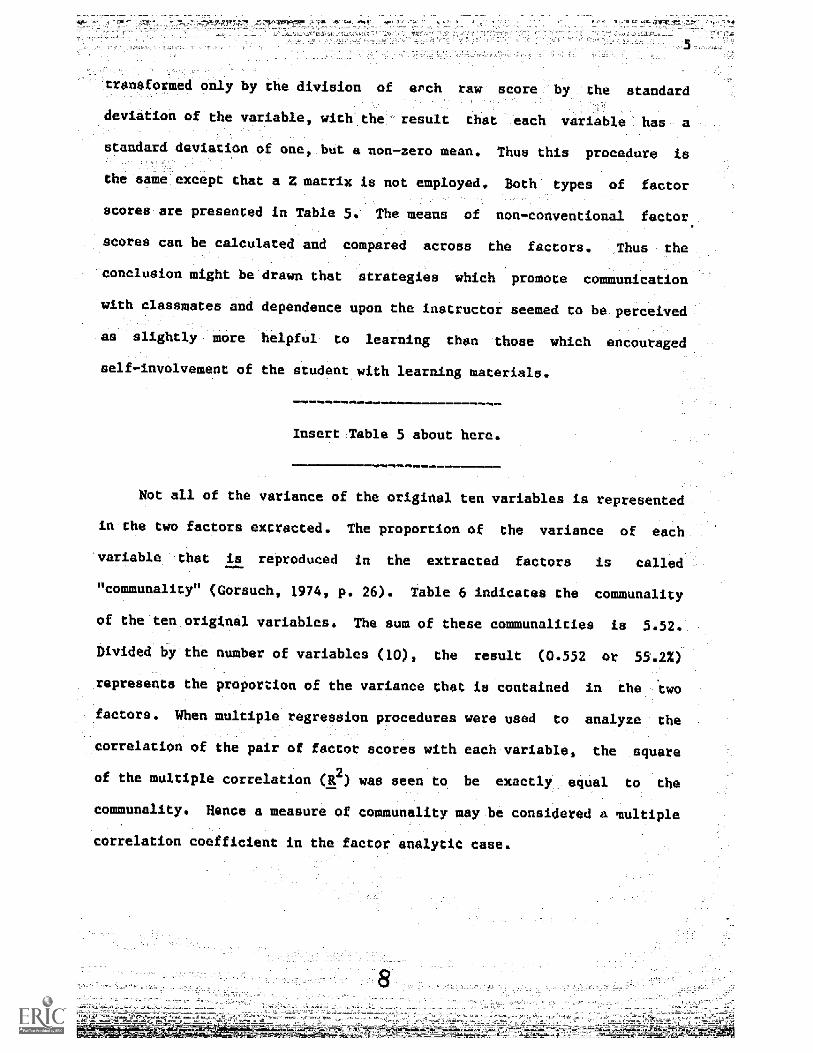
ransformed only by the division of erch raw score 'by, the standard
deviation of the variable with the result that each variable has a
standard deviation of one, bUt a non-zero mean. Thus this procedure is
thO same except that a Z matrix is not employed. Both types of factor
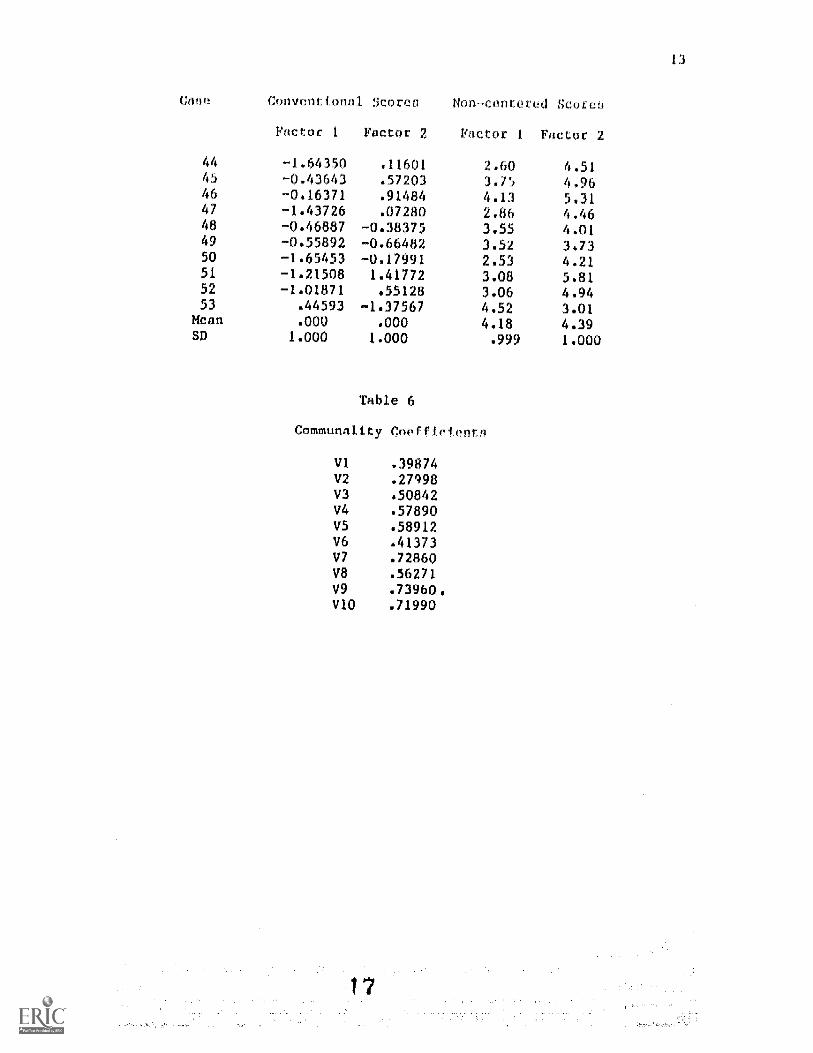
scores are presented in Table 5.' The means of non7conventional factor
scores can be calculated and compared across the factors. Thus the
conclusion might be drawn that strategies which promote communication
ith classmates and dependence upon the instructor seemed to be perceived
slightly more helpful to learning than those which encouraged
self-involvement of the _tudent with learning materials.
Insert :Table 5 about here.
Not all, of the variance of the original ten variables is represented
in the two factors extracted. The proportion of the variance of each
'variable that is reproduced in the extracted factors is called
"communality" (Gorsuch, 1974, p. 26). Table 6 Indicates the communality
of the ten original variables. The sum of these communalities is 5.52.
Divided by the,number of variables (10), the result (0.552 or 55.2%)
represents the proPortion of the variance that is contained in the two
factors. When multiple regression procedures were used to analyze the
correlation of the pair of factor scores -ith each variable, the square
of the multiple correlation (R2) was seen to be exactly_ equal to the
communality. Hence a measure of communality may be considered a multiple
correlation coefficient in the factor analytic case.
InsertTable 6 about here.
_
Discussion
Through factor analysis the complex web of interrelationships a ong
variable- can be disentangled. Research can focus upon relevant
information and patterns can be made evident. This paper illustrated
the transformation of"a raw data matrix into a matrix of associations,
and then into a factor matrix. In the process of extracting two factor-
the nature of structure coefficients has been explored, the derivation
and utility of factor scores has been discussed, and the concept of
communality has been related to the multiple correlation coefficient-.
Comrey, A. L. (1973
Academic Press.
Gorsuch, R. L. (1974).
Company.
A:Firs Course in actor Ana so New York:
Factor Ana 'Philadelphia: W. B. Saunders
Harman,'. H. H. (1967 ). dern Factor Analysis. Chicago: The University
of Chicago Press.
Horst, P. (1965). FactorAna].ysisofDataMatrices. New York: Ho
Rinehart and Winston, Inc.
Kachigan S. K. (1982). Multivariate Statistical Anal sis. New York:
Radius Press.
Rummel, R. J. (1970). Applied Factor Analysis. Evans on: Northwestern_
University Press.
Thompson, B. (1983). The Ca1culaton of Factor Scores ternat veo
Paper presented at the annual meeting of the Southwest Educational
Research Association, Houstono
Thompson, B., & Borello, G. M. (1985). The importance uf structure
coeff4.4ents in regression reiearch. Educational and_Psychological
Measurement, 45, 203-209.
10
Casa- Original Variables
Data Set
VI V2 V3 V4 V5 V6 V7 V8 V9 VIO
10 10 6 8 3 10 6 6 10 810 6 7 10 9 9 8 9, 7 69 41 2 10 8 8 6 9 10 -39 7 6 6 8 8 8 7 7: 69 10 1 7 6 1 6 7 10 4
10 10 6 10 10 8 10 8' 8 910 10 2 2 10 10 10 10 10 10
: 8 8 10 1 8 9 7 8 9 9 69 10 8 8 6 8 9 8 8 8 8
10 9 10 8 9 10 9 10 9 8 011 10 7 7 5 10 10 9 8 8 612 10 9 4 10 6 3 7 10 10 1
13 6 6 2 7 5 2 3 4 6 214 10 10 4 10 10 8 10 9 10 715 9 7 5 2 8 5 8 0 8 816 8 8 4 2 4 6 5 2 8 417 9 9 5 4 10: 8 8, 5 5 918 2: 5 3 8 5 9 6 8 7 519 10 9 2 8 10 6 10 7 10 10 :20 10 9- 7 2 9 8 9: 5 6 721 10 10 10 10 10 10 10 10,10 1022 10 10 10 10 10 10 10 2 10 JO23 9 10 2 5 9 5 9 7 8 1024 10 9 4 8 7 7 9 10 1
25 10 10 1 8 8 8 5 7 10 526 10 10 10 10 10 9 9 10 10 1027
' 10 10 5-: 5 5 8 tEV 7 10 528 10 6 7 8 3 10 9 8 9 7
29 10 10 10 1 8 10 8 2 2 5:30 3 6 3 4 8 10 9 6 5 631 10 10 6 10 8 10 10 2 8 1032 9 9 5 9 9 10 8 9 9 1033 6 :7 , 4 4 9 3 9 5', 7 834 10 10 1 4 7 5 1 4 8 1
35 10 8 5 4 8 9 8 r6 7:_ 9_
36 7 5 5 4 9 10 6 3 5 7-
37 6 8 10 8 8 10 8 8 8 838 8 9 8 9 9 8 8 7 9 6 :
39 8 9 0 5 9 9 8 3 8 840 7 6 9 6 7 9 5 3 7 6
41 5 8 1 2 5 10 2 2 4 1
42 10 6 10 1 9 10 10 5 5 1043 10'10 5 7 8 6 8 6 9 8(table continues)
Factor Scores
=7,.
FS1 FS2
70.25775 .51156043408 .27908
-0.90742 .67611.22568 70.33626
71.39963 1.049171.02903 4904561.03996 .64755
70.23241 497578.71512: .06139
1.31422 .75254.86942 -0.13003
-1.24802 1.5853772.07572 -0.88726'
.60116 1.46195
.19082 -0.5643671.05590 -1018935
.86680 70.921941.20917 -0.73877.62187 1.01546.90388 70.93932
1.52936 1.341701.61685 .30659.4642 .30198
-1.21434 1.33681-0.61065 .918361.34029 1.36663
70.24543 .49058.59585 .25993
1.05031 72.2944870.05807 71.585451.08772 .00632.72610 .80795.00940 70.70838
_.64117 -0.26365.65757 70.53181.24091 -1.90536.65899 -0.08915.39217 .48967.81992 -0.71412 '
r0.03674 -1.30606-1.60939 -2.306031.07414 -1.71527 :.27700 .53945
Cas Original Variables Fac or Scores
V1 V2 V3 V4 V5 V6 V7 V8 V9 V10 FS1 F82
44: H 5 4: 2: 8 7 2 6 8 9: 3 .1.64350 .11601-.45 9 9 310 0 9 4 8 8 9 -0.43643 .5720346 7 10 5 8 9 3 8 7 10 7 -046371 .9148447 5 10 4 9 3 9 4 4 10 4 -1.43726 .0728048 8 6 1610 9 7 5 5 -0.46887 -0.3837549 6 8 3 6 .7 7 7 6 6 5 -0.55892 -0.6648250 1 8 5 9 5 6 2 Er 8 6 -1.65453 -0.1799151 10 10 2 9 6 4 5 9 10 4 -1.2150 1.4177252 10 9 2 10 6 7 6 9 6 2 -1.01871 .5512853 8 7 4 3 8 8 9 3 6 8 .44593 1.37567

VI
VI
1.00000
V2 V3 V4
TAW 2
'orriikOQ Mouix
V5 V6 V7
V2 .44008 1.00000
V3 .21506 .07076 1.00000
V4 .0543 .18742 .02269 1.00000V5 .37875 .05358 .31884 -0.01260 1.00000V6 .09428 .04883 .52394 -0.06303 .16672 1.00000V7 .42105 .12693 .43832 .00028 .74207 .24176 1.00000V8 .16704 .07501 -0.10493 .53452 .20687 -0.13630 .21239V9 .27054 .38923 0.06837 .59362 -0.03472 -0.16951 .075096110 .24897 .22979 .49499 .00252 .58438 .48772 .67759
Table 3
Structure Coffic1entH
Factor 1 Factor 2
V1 .47882 .41166
V2 .21368 .48407
V3 .70389 -0.11386
V4 -049875 .75442
V5 .75509 .13769
V6 .59279 -0,24966
V7 .83191 .19110
V8 .00680 .75011
V9 -0.05879 .85799
VIO .84452 .08172
V8 19 VIO
1.00000
.50366 1.00000
.04256 .08867 1.00000
91
08/2 d 000' wd
(ES (ES )
11802 08582
0002 REt
(CS ES )
019 985
OIA 6A
ii
000' w d 5801 9E02 C91' w( 000' -LI
(E5 (V (ES (ES (EC )
IOSt 1161' t6in 0 LEI' 2/95V
191/2 000 000 000' lig
(EC (EC (c5 (EC (EC
8900 61E0 OZ652 I5CL2 06020- 8A LA 9A SA t/A
uo oppa pu DI(PTIUA TIM
9 DWI
IS ORIIVI-1 (RRSVO) / bid ko) 80Z2 a 000' 1004 24
(ES ) (ES (t5 )
6E1120- 11/9172
000'
(CS
6E01.2
CA
0 Limn upuT0310D
z90' 000'
(EC (ES
LEV HO' ISA
ZA IA
Ca
12
5
.
Two Seta of
Conventional
Factor 1 Factor 2
scor,-
Nott-entcred Soo
Factor 1 Factor
1 0.25775 .51156 4.04 4.902 .43408 .27908 4.57 4.673 -0.90742 .67611 3.39 5.074 .22568 -0.33626 4.36 4.055 .39963 1.04917 2.89 5.446 1.02903 .90456 5.21 5.307 1.03996 .64755 5.33 5.048 -0.23241 .97578 4.01 5.379 .71512 .06139 4.90 4.4510 1.31422 .75254 5.50 5.14
.86942 -0.13003 5.06 4.2612 -1.24802 1.58537 3.05 5.9813 -2.07572 -0.88726 2.00 3.5014 .60116 1.46195 4.90 5.8515 .19082 -0.56436 4.38 3.8316 .05590 -1.18935 3.13 3.2017 .86680 -0.92194 4.89 3.4718 -1.20917 -0.73877 2.92 3.6519 .62187 1.01546 4.92 5.4120 .90388 -0.93932 4.98 3.4521 1.52936 1.34170 5.82 5.7322 1.61685 .30659 5.91 4.7023 .46425 .30198 4.65 4.6924 -1.21434 1.33681 3.08 5.7325 -0.61065 .91836 3.68 5.3126 1.34029 1.36663 5.63 5.7627 0.24543 .49058 4.05 4.8828 .59585 .25993 4.84 4.6529 1.05031 -2.29448 4.91 2.1030 -0.05807 -1.58545 3.97 2.8131 1.08772 .00632 5.27 4.4032 .72610 .80795 4.97 5.2033 .00940 -0.70838 4.14 3.6834 1.64117 -0.26365 2.54 4.1335 .65757 -0.53181 4.79 3.8636 .24091 -1.90536 4.26 2.4937 .65899 -0.08915 4.84 4.3038 .39217 .48967 4.63 4.8879 .81992 -0.71412 5.01 3.6840 -0.03674 -1.30E06 4.09 3.0841 -1.60939 -2.30603 2.36 2.0842 1,67414 -1.71527 5.70 2.6843 .27700 .53945 4.52 4.93
table continues)
Cntm COnventional
Factor 1
:koren
Factor 2
14 n- nn'i' I
Factor 1 Fac 2
-1.64350 .11601 2.60 4.5145 -0.43643 .57203 3.75 4.9646 -0.16371 .91484 4.13 5.3147 -1.43726 .07280 2.86 4.4648 -0.46887 -0.38375 3.55 4.0149 -0.55892 -0.66482 3.52 3.7350 -1,65453 -0.17991 2.53 4.2151 -1.21508 1.41772 3.08 5.8152 -1.01871 .55128 3,06 4.9453 .44593 -1.37567 4.52 3.01
Mean .000 .000 4.18 4.39SD 1.000 1.000 .999 1.000
Table 6
Communality Coeffic1ent0
1 .39674V2 .27998V3 .50842V4 .57890V5 .58912V6 .41373V7 .72860V8 .56271V9 .73960.VIO .71990
1 7


' "'V
;