Embed Size (px)
Citation preview


DOCUMENT RESUME
ED 107 411 RC 008 539
TITLE A Study of Selected Socio-Economic Characteristics ofEthnic Minorities Based on the 1970 Census. Volume I:Americans of Spanish Origin.
INSTITUTION RJ Associates, Inc., Arlington, Va.SPONS AGENCY Department of Health, Education, and Welfare,
Washington, D.C. Office of the Assistant Secretaryfor Planning and Evaluation.
REPORT NO HEW-Pub-(0S)-75-120PUB DATE Jul 74NOTE 148p.
EDRS PRICE MF-$0.76 HC-$6.97 PLUS POSTAGEDESCRIPTORS Academic Achievement; Age; *Census Figures; Cubans;
*Demography; Employment Patterns; Family Structure;Income; Mexican Americans; *Population Trends; PuertoRicans; *Socioeconomic Background; *Spanish Culture;Statistical Data
ABSTRACTPersons of Spanish Origin are the second largest
minority group in the United States. In 1970, they numbered 9.1million people; 2.4 million of whom were in poverty. These 9.1million persons are a diverse group of people, from divergent areasof the world, and of different national backgrounds. The separateSpanish groups were designated by the 1970 Census as the: MexicanAmericans, Puerto Ricans, Cuban Americans, Central and SouthAmericans, and Other Spanish (those persons whose families originateddirectly from Spain or were living in this country prior to 1848).Selected data from the 1970 U.S. Census on persons of Spanish Originwas analyzed in this report. Detailed socioeconomic information onthe 3 largest Spanish subgroups in the U.S.--Mexican Americans,Puerto Ricans, and Cuban Americans--was obtained from U.S. CensusBureau publications based on tabulations from the 1970 Census. Theanalysis of national and local data focused on such characteristicsas immigration and in-migration, geographic and age distributions,nativity, family sturucture, education, employment, income, andpoverty. Data from selected local areas was analyzed to highlightonly those situations where local data varied markedly from or wereotherwise notable in comparison to the national picture. (NQ)
3\3\k . r /
A STUDY OF SELECTE _
SOCIO-ECONOMIC CHARACTERISTICSOF ETHNIC MINORITIES BASED
ON THE 1970 CENSUS
Volume I:Americans of Spanish Origin
U S OEPARTMENT OF HEALTH.EOUCATION &WELFARENATIONAL INSTITUTE OF
EOUCATIONTHIS DOCUMENT HAS BEEN REPROOUCEO EXACTLY AS RECEIVED FROMTHE PERSON OR ORGANIZATION ORIGINA TiNO, IT POINTS OF VIEW OR OPINIONSSTATED 00 NOT NECESSARILY REPRESENT OFFICIAL NATIONAL INSTITUTE OFEOUCATION POSITION OR POLICY
OFFICE OF SPECIAL CONCERNS
Office of the Assistant Secretary for Planning and EvaluationDEPARTMENT OF HEALTH , EDUCATION , AND WELFARE

rf
CD
C)Li
July, 1974
A STUDY OF SELECTED
SOCIO-ECONOMIC CHARACTERISTICS
OF ETHNIC MINORITIES BASED ON
THE 1970 CENSUS
Volume I: Americans of Spanish Origin
Principals of URBAN ASSOCIATESare now operating as RJ ASSOCIATES
Prepared for: Department of Health, Educationand Welfare
Office of the Secretary330 Independence Avenue, S.W.Washington, D.C. 20201
Prepared by: Urban Associates, Inc.1018 Wilson BoulevardArlington, Va. 22209
(703) 524-3360
1
The work upon which this publication is basedwas performed pursuant to Contract HEW-OS-72-209with the Department of Health, Education and Welfare.
HEW Publication No. (OS) 75-120
0003

TABLE OF CONTENTS
Highlights
Preface xx
I. Introduction 1
A. Differences Between the 1970 Census andPast Census 1
B. Methods Used to Collect Data 3
C. Undercount of Persons of Spanish Origin . . . 7
II. Methodology and Selection of Local Data 13
III. National and Local Analyses of Persons ofSpanish Origin 16
A. Immigration and In-migration 16
B. Population Characteristics 21
C. Family Characteristics 35
D. Education Characteristics 47
E. Employment Characteristics 62
F. Income Characteristics 76
G. Poverty Characteristics 83
H. Cuban Americans 93
IV. Glossary 108
Sources 117

TABLES
TITLE
Introduction
I-1 Spanish Origin Subgroups According tc, the 197vCensus
1-2 Spanish American and Mexican American Pult,'It:.°-of Five Southwestern States as Variously 17(;rn- f.t.din Censuses of 1930 thru 1970
1-3 Number of Persons of Spanish Origin 1970 Censul-and March 1973
PASTE
2
4
9
Immigration and In-migration
A-1 Immigration of Persons of'Spanish Origin, 1960-1973 18
A-2 Persons of Puerto Rican Birth and Parentage in the _)United States: 1910-1973
Population Characteristics
B-1 Population Characteristics of the U.S. Total am' 22Mexican and Puerto Rican Origin Populations, 1070
B-2 Urban/Rural Shift of Spanish Population in 5 South- :15western States: 1940-1970
B-3 Destination of Puerto Rican Migrants to the United 26States: 1965-1970
B-4 Age Distribution of Puerto Ricans, 14 Years Old and 31Over, Who Came to the U.S. between 1965-1970
B-5 Sex Ratios of Mexican Americans by Age and Residence 33
Family Characteristics
C-1 Family Characteristics of the U.S. Total and Mexican 36and Puertc Rican Origin Populations, 1970
C-2 Age Distribution of Female Family Heads: 1970
C-3 Family Composition: Summary 1970
C-4 Marriage Within Own Subgroup
C-5 Ethnic Origin of Spouse for Mexican Americans and 46Puerto Ricans
41
42
45
000

TABLES
TITLE PAGE
Education Characteristics
D-1 Education Characteristics of the U.S. Total and 48Mexican and Puerto Rican Origin Populations, 1970
D-2 Vocational Training Completed by Persons 16-64Years Old with Less Than 3 Years College 53
D-3 Language Usage and Mother Tongue of Mexican Americans 59and Puerto Ricans: 1969
D-4 Mexican AmeriCans and Puerto Ricans Reporting Spanish 60Currently Spoken at Home, by Age: 1971
D-5 Years of School Completed by Mexican Americans and 61Puerto Ricans 14 Years Old and Over and LanguageSpoken at Home: 1971
Employment Characteristics
E-1 Employment Characteristics of the U.S. Total and 63Mexican American and Puerto Rican Origin Populations,1970
E-2 tabor Force Participation of Spanish Origin Wives 65and Female Heads
E-3 Number of Earners Per Family: by Selected Groups, 661969
E-4 Puerto Rican Women in Labor Force, by Nativity and 68Age 1960-1970
E-5 Percent Puerto Rican Women in Labor Force, by 69Nativity and Age, for Selected States: 1960-1970
E-6 Mexican American Women in Operative and Service 73Occupations, by State: 1970
Income Characteristics
,%-.1 Income Characteristics of the U.S. Total and Mexican 77American and Puerto Rican Populations, 1970

TiBLES
TITLE PAGE
Poverty Characteristics and Sources of Income
G-1 Poverty Characteristics and Sources of Incomes of 84the U.S. Total and Mexican and Puerto Rican OriginPopulations, 1970
G-2 Ratio of Family Income to Poverty Level as a Percent 85of All Families
G-3 Percent of All Families in Poverty by Education of 87of Family Heaa
G-4 Families with Incomes Near and Below Poverty 88
Cuban Americans
H-1 Population and Family Characteriscs of the U.S. 94Total and Cuban American Populations, 1970
H-2 Sex of Cuban Immigrants, 1960-1973 97
H-3 Sex of Cuban American Population, by Age: 1970 97
H-4 Socio-Economic Characteristics of the U.S. Total 101and Cuban American Population, 1970
H-5 Vocational Training Completed 102
H-6 Distribution of Occupations of Cuban Immigrants 103
H-7 Occupations of Cuban Americans: 1970 104
0 0 0

CHARTS
TITLE PAGE
Introduction
I-a Population in the five Southwestern States of Spanish 5Persons, According to Census Classifications 1930-1970.
Immigration and In-migration
A-a Year of Immigration of Spanish Origin Foreign Born popu- 17lation
Population Characteristics
B-a % of the Spanish Population of The 5 Southwestern States: 24% Urban-Rural 1940-1970
B-b Nativity of Mexican Americans and Puerto Ricans, by Age 28
B-c. Nativity and State of Birth: Mexican Americans 29
Family Characteristics
C-a Family Structure Among Mexican Americans and Puerto Ricans 37
C-b Mexican American and Puerto Ricans Families with Children 39under 18 Years Old
Education Characteristics
D-a Schooling Completed by Persons 16 Years of Age and Over,in Selected Groups: 1970
D-b Persons enrolled in School, 14-17 and 18-24 Years of Age, 56by Sex, for Selected Groups
49
Employment Characteristics
E-a Labor Force and Unemployment Rates for .Mexican Americans 67and Puerto Ricans 16 Years of Age and Over
E-b Types of Occupations of Mexican American and Puerto RicanMales 1970
71
E-c Types of Occupations of Mexican American and Puerto Rican 74Females: 1970
Income Characteristics
F-a Income of Mexican American and Puerto Rican Families by 81Sex of Head: 1970
0'0,J_CS

CHARTS
TITLE
Cuban Americans
H-a Nativity of Cubans: 1970
H-b Age Distribution of Cuban Immigrants at Time of Entry
PAGE
95

HIGHLIGHTS
The highlights of our Study of the Socio-EconomicCharacteristics of Americans of Spanish Origin arepresented below. The full text of the report, includingsubstantiating data, follows. The highlights are organizedaccording to the primary subgroups in the Spanish Originpopulation: Mexican Americans, Puerto Ricans, and CubanAmericans.
0 ;1 u

ii
Mexican Americans
Population Characteristics
Mexican Americans constitute some 2.2% of the totalpopulation of the United States.
Of all Mexican Americans in the United States, 87%live in the five southwestern states: California(41%), Texas (36%), Arizona (5%), New Mexico (3%),and Colorado (2%).
Four out of every five Mexican Americans were bornin the United States. More than half (57%) hadparents who were also born in this country.
Mexican Americans, commonly stereotyped as beingfarm workers, are more concentrated in the citiesthan is the total U.S. population. They live mainlyin the central cities large metropolitan area.Nearly half of the Mexican Americans (46%) live incentral cities, while 32% are.found in suburbanareas surrounding these cities. 11% are reportedliving in smaller urban areas and only 15% live inrural areas.
Census Undercount
The Census Bureau admits to some degree of undercountfor the Spanish Speaking, and recent Census estimatesof the number of persons of Spanish Origin in theUnited States have been revised upward. The greatestchange occurred in estimates of the Mexican Americanpopulation with a nearly 40% rise projected in 1973over 1970.
Immigration
The Mexican Americans constitute the largest SpanishSpeaking population group both among native born andamong foreign born. Between 1960 and 1973, over660,000 legal Mexican immigrants entered the UnitedStates, an average of 47,000 each year.
Age Distribution
About one-third tf the total population in the UnitedStates is under 18 years of age. However, familiesof Spanish Origin tend to be larger and include morechildren. Almost half (47%) of the Mexican Americansare under 18 years of age.
111
Fewer Mexican Americans are elderly. Only 4% of allthe Mexican Americans in this country are 65 or over,compared to 10% of all persons in this country. Severalfactors may be responsible for this low proportion ofolder persons: (a) most recent Mexican American immi-grants in the U.S. are young, (b) some Mexican Americanschoose to return to Mexico when they become older; and(c) the poverty conditions that characterize theMexican American population in this country, coupled withinadequate medical care, generally yield ill health, andhence shorter live.
Family Characteristics
Few Mexican American family units contain dissolvedmarriages, although the percentage of husband/wifefamilies in the Mexican American population (82%) isstill somewhat lower than in the total U.S. population(86%). Of all Mexican American families, 13% have awoman as the head compared to 11% in the total popu-lation.
Of all the children in the total population under18 years of age, 85% live with both their parents.In the Mexican American population, 4 out of every5 children (80%) live with both their parents, aproportion only slightly under that for the totalpopulation.
Just over half of all husband/wife families in theUnited States (56%) have children, but fully three-quarters (76%) of all the Mexican American husband/wifefamilies have.
Approximately one-quarter (27%) of all husband/wifefamilies in the country have young children 6 yearsold or less, but almost half (46%) of all MexicanAmerican families have children in this age group.
Among all families with children 18 years old or lessin the total U.S. population, 36% have three or more.The percentage is a very high 52% for Mexicans.
While 55% of all female-headed families in the UnitedStates have children under 18, 68% of Mexican Americanfemale-headed families do.
About one out of every six married persons of MexicanAmerican origin is married to spouse of a differentsubgroup compared to 1% in the total U.S. population.The rate of intermarriage among younger MexicanAnericans has been increasing steadily.
-ea

iv
Education Characteristics
The education system has .erved as a major barrier toeconomic success for pers,as of Spanish Origin. In1970, about one-quarter (27.) of Mexican Americans16 years of age and over had graduated from highschool. This is seriously below the 55% of the U. S.population who had gradu,ed from high school.
Magnifying the problem eve: fu cher, almost half (47%)of all Mexican American males 16 and over have notprogressed beyond the eighth grade, while only 27% ofall U.S. males, 16 and over, have had so littleeducation.
In 1970, Mexican Ameiicans still had few collegegraduates. Of those 16 years old and over, only 2.5%and 1.40 of the males and female:; respectively werecollege graduates, compared to 12.6% of the males and 7.8%of the females in the total U.S. population with this mucheducation.
Only 25% of Mexican American men 18-24 are enrolledin schools and colleges, which is 13% lower than theaverage for all men in the U.S. Mexican Americanfemales fall well below that rate with only 18% ofthat age enrolled in school, compared to 27% of thefemales in the total population who are enrolled.
In 1969, 72% of all Mexican Americans reported thatthey spoke Spanish in their homes when they werechildren (mother tongue). The majority of thesepersons continued to use Spanish in the home; 47% ofMexican Americans reported speaking Spanish at home.In 1971, some 90% of the Mexican Americans who didnot complete elementary school spoke English intheir homes.
Employment Characteristics
77% of all the Mexican American men are in the laborforce--the same as for the total male population inthe U.S.; nonetheless, a much larger proportion ofMexican American men are unemployed (6.1%) comparedto the nation _:1 rate of 3.9%. A most important factorrelated to the relatively high unemployment rates isthe lower levels of education experienced by MexicanAmericans.
0010

V
The labor-force participation rate for Mexican Americanwomen at (36%) is below the national rate for all womenin the United States (41%). The employment status ofMexican American women is made worse by the fact that8.9% are unemployed. Thus, the actual number of MexicanAmerican women is even smaller than their labor forceparticipation rates indicate; only 33% of all MexicanAmerican women are employed, while 39% of all women inthe U.S. are employed.
Over half (51%) of all families in the United Statesare supported by more than one earner. Mexican Americanfamilies are at about the same level, yet only 29% ofall Mexican American wives in husband/wife families areemployed, compared to 39% of all such wives in thecountry. This suggests that more Mexican American youngpeople are employed in order to supplement the familyincome.
Close to one-third of all Mexican American women areemployed in low-skilled, white-collar occupations.Nationally, over 40% of the total female populationare employed in such positions.
About a quarter (26%) of all employed Mexican Americanwomen are in semi-skilled, blue-collar jobs, and anotherquarter (26%) are in low-skilled service jobs, comparedto 14s and 20% respectively of women in the total U.S.population who hold these jobs.
The proportion of Mexican American men employed inhigh status, professional and managerial occupationsis extremely low. In the total population, 25% ofall males are employed in such occupations; only oneof every eleven Mexican American males (9%) is employedin these high status positions.
While the proportion of Mexican American men who arein the skilled, blue-collar occupations (21%) equalsthe national figures for the U.S. male population,the proportion of Mexican American men who are employedin the low-skilled, labor occupations is extremely high( 23 ;) , in comparison to the national figure of 11%.
Although the Mexican American is stereotyped as a farmworker, only one of every ten Mexican American men isemployed as a farm manager or farm laborer.
vi
Income Characteristics
Of all Mexican American males 16 and over, 43% havean annual income of less than $4,000--compared to31% of all males in the country earning such lowincomes.
While a quarter (25%) of all men in the United Stateshave an income of *10,000 a year or more, only 10%of the Mexican American men have such incomes. Aclear relationship exists between the low percentageof Mexican American men in professional and managerialoccupations and the similarly low percentage of menwith earnings over $10,000 a year.
With such low incomes, the income-,of a second bread-winner is a vital factor for Mexican Americans inthe support of their large families. Yet the pro-portion of Mexican American wives in the labor forceis 10% lower than for the country as a whole.
Of all women nationally,barely 3% earn $10,000 aAmerican women, 79% earnhas an income of $10,000
68% make under $4,000 andyear or more. Of all Mexican$4,000 or less; and only 1%and above.
A quarter of Mexican American families exist on anincome of less than $4,000 a year. This is 10% greaterthan the proportion of low income families found inthe total population. However, these figures do notreflect the impact that the large number of personsper family has on the income of the Mexican Americans.Mexican Americans have a family income of $6,962 anda per capita income of $1,716, .far below that of thetotal U.S. population, where family income is $9,590and per capita income is $3,139.
Just over a quarter (27%) of Mexican American familiesnationally have an annual income of $10,000 or more.This is 20% less than the proportion earning this muchin the total population.
Mexican American female-headed families are far worseoff than the general population of female-headedfamilies. Of all female-headed families, 41% have anincome under $4,000, while 57% of Mexican Americanfamilies in this category earn such low incomes.While 18% of all female heads support their familieson $10,000 or more per year, half as many MexicanAmerican female heads do.
0'31 0

vii
Poverty Characteristics
Close to one-quarter (24%) of all Mexican Americanfamilies in this country are in poverty, a proportiontwice as great as in the total population (11%). Thepoverty status is exacerbated by the fact that theMexican American family is among the largest in theUnited States.
Levels of poverty are highest among the uneducated inthe Mexican American population. At every level ofeducation completed by family heads, there is greaterpoverty in the Mexican American population than inthe total population. For example, the rate of povertyamong Mexican American families whose heads are collegeeducated (about 4%) is twice as great as the rate ofpoverty among all families with a college-educatedhead (about 2%).
Over half of the Mexican American female-headed familiesare in poverty, while less than one-third of such familiesin the total population are poor.
Of all elderly Mexican Americans, 37% are poor, a pro-portion 11% above the national rate. 44% of allMexican Americans who live alone (unrelated individuals)are in poverty, compared to a national rate of 37%.
Sources of Income
Social Security
The Mexican Americans are not receiving Social Securitybenefits at a rate comparable to the rest of the popu-lation. One in every five families in the total populationreceives this type of income, but only 14% of MexicanAmericans do.
Although Social Security benefits are received primarilyby the elderly, and the proportion of elderly in theMexican American population is much less than in thetotal U.S. population, the proportion of MexicanAmericans receiving Social Security is less compara-tively than their proportion of elderly. Of all U.S.families with family heads who are 65 years old or over,84% receive Social Security, but only 72% of MexicanAmericans in this category do. The proportion ofpoverty families with an elderly head of householdreceiving Social Security is lower still (69%).

viii
Public Assistance
With their high rate of poverty, a very large pro-portion of Mexican American families, close to oneout of eight (12%), are on public assistance - -morethan twice the rate for all U.S. families (5%). One-half the number of Mexican American families withinadequate incomes are receiving public assistance.
OG 1

ixPuerto Ricans
Population Characteristics
The 1.4 million Puerto Ricans in the United Statesrepresent 0.7% of the country's total population.More than three-quarters of all Puerto Ricans livein the tri-state area of New York (64%), New Jersey(10%) and Connecticut (3%).
In 1910, about 1,500 persons born in Puerto Rico werereported in the United States. In each decade sincethat time (with the exception of the 1940's) the Censushas recorded a substantial growth in this population.However, between 1960 and 1970 the rate of growthappears once more to have decreased. In terms of actualnumbers, the number of persons of Puerto Rican birthrecorded in the 1970 Census increased only a third overthe number reported in the 1960 Census, whereas thenumber of persons of Puerto Rican birth in the 1960Census had been a one-and-three-quarter increase overthe 1950 Census.;
A majority of the Spanish American populations in theUnited States are urban dwellers; this is particularlytrue of the Puerto Ricans of whom 98% are urban. Alarge majority of those Puerto Ricans who entered theUnited States following World War II settled in New YorkCity; since then, however, younger Puerto Ricans aresettling in other metropolitan areas. In 1940, 88% ofall Puerto Ricans in the United States lived in New YorkCity, but by 1970, only 59% lived there.
Over half of all Puerto/Ricans in this country were born
in Puerto Rico. Of those Puerto Ricans 20 years of ageand above, only 15% were born in the United States. Theproportion who were born on the Island remains about thesame in all the states where Puerto Ricans are nowconcentrated. Among the elderly, who represent a verysmall percentage of the Puerto Rican population, only9% are of U.S. birth.
About one-third of the total population in the UnitedStates is under 18 years of age. However, families ofSpanish Origin tend to be larger and include more children;almost half (47%) of the Puerto Rican population is under18 years of age.
Family Characteristics
In the United States, 86% of all families consist of ahusband, wife, and their children, if they have any.Among Puerto Ricans in the U.S., however, only 72% ofthe families contain both husbands and wives.
0

x
Over half (56') of all husband/wife families in theUnited States have children under 18, but fully three-quarters (75%) of all Puerto Rican families do.
Approximately one-quarter (27%) of all husband/wifefamilies in the country have young children, 6 yearsold or less, but almost half (45%) of all Puerto Ricanfamilies have children in this age group.
In the total U.S. population, of those families withchildren 18 years old or under, 36% have three or morechildren. The' percentage is considerably higher forPuerto Ricans at 44%.
Of all the children in the total population under 18years of age, 85% live with both their parents. Lessthan two-thirds of all Puerto Rican children live withboth their parents.
Almost a quarter (24%) of all Puerto Rican families inthe United States have a female head,compared to 11%in the total U.S. population; furthermore, 82% of thePuerto Rican female-headed families have children under18, while only 55% of female-headed families in thetotal population have children under 18.
About one out of every six married persons of PuertoRican origin is married to a spouse of a differentsubgroup, compared to a 1% intermarriage rate for thetotal population. The rate of intermarriage among PuertoRicans varies little on the basis of age and, in the caseof women, has actually decreased.
IEducational Characteristics
04
Only 72% of all Puerto Rican males and 70% of PuertoRican females 14-17 years old are enrolled in school,over 20% below the average for the total population. Noother population group has as serious a school drop-outrate. The economic disadvantage which the drop-out ratereveals is made clearer by the fact that 45% of allPuerto Rican male youths 16-24 years of age, who lefthigh school prior to graduation, are without a job.
Only 13% of Puerto Rican males 18-24 years of age areenrolled in school, a rate nearly two-thirds less thanthat of the total population. The enrollment rate of the

xi
Puerto Rican females is the lowest of all. Only 10%of the female Puerto Rican population of this age areenrolled in any kind of postsecondary educationalprogram, the lowest rate for any population subgroup.
The educational attainment of Puerto Rican men is verylow with only 9.7 median years of schooling, comparedto 12.1 years for total U.S. men. The percentage ofpoorly educated men (with eight or fewer years of school)is 43%, 16% higher than that of the total population;only 27% of Puerto Rican men have completed high schoolin contrast to 54% of the total male population.
The Puerto Rican population is basically an urban popu-lation whose various social (including educational)characteristics are affected little by the rural variances.Despite this, educational achievement for Puerto Ricanwomen is extremely low compared to that of the women inthe total U.S. population. The median years of schoolingattained by Puerto Rican women is only 9.3 years, incontrast to 12.1 years for the total female population.
Of all Puerto Rican women, 48% have not attended schoolbeyond the elementary level. Unusually, the proportionof Puerto Rican women completing no more than eight orfewer years of school is 5% greater than the rate amongPuerto Rican men.
Only one-quarter (26%) of Puerto Rican women are highschool graduates and only 1.7% are college graduates. Incontrast, 55% of women in the total U.S. population havegraduated from high school, and 7.8% are college graduates.
With the low level of education attained by Puerto Ricansa major increase in educational opportunities, includingopportunities for vocational training, is clearly animportant need. However, the proportion of Puerto Ricanswho currently have completed a vocational training program(16% of all persons 16-64 years of age with less than 3years of college education) falls far short of persons ofthat age with less than 3 years of college who havecompleted such training in the total population (25%).
In 1969, 83% of all Puerto Ricans reported that they spokeSpanish in their home when they were children (mothertongue). The majority of these persons continued to 1.-:eSpanish in the home; 72% of Puerto Ricans reported sp,iakingSpanish at home. In 1971, some 90% of the Puerto Ricanswho did not complete elementary school reported speakingSpanish in their home.
) k)
xii
Employment Characteristics
y The 1970 Census clearly indicates that the Puerto Ricansare a hard-working people. 76% of the Puerto Rican menare in the labor force--virtually the same as the totalmale population in the U.S.
Nonetheless, a much larger proportion of Puerto Ricanmen are unemployed (5.6%) than men in the total popu-lation (3.9%). A most important factor related to therelatively high unemployment rates is the lower ratesof education experienced by Puerto Ricans.
y The labor force participation rate for Puerto Ricanwomen at 32% is far below the 41% national rate for allwomen in the United States.
e The employment status of Puerto Rican women is madeworse by the fact that 8.7% are unemployed; thus, theactual number of Puerto Rican women who are employedis even smaller than their low labor force participationrates indicate. Only 29% of all Puerto Rican women arein fact employed.
e Over half (51%) of all families in the United States aresupported by more than one earner. Puerto Rican familieshave a much smaller proportion of their families with twoor more earners (36%). Only 28% of all Puerto Rican wivesin husband/wife families are in the labor force comparedto 39% of all such wives in the country.
Among Puerto Ricans, fewer female heads of families (24%)than wives (28%) are in the work force. This presents anopposite picture from the total U.S. population where 56%of all female heads work, but only 39% of wives in husband/wife families do.
e The rate of labor force participation of Puerto Rican womenhas actually declined for virtually all age levels over thepast 10 years. This pattern is contrary to the trend forwomen in every other population group, whose participationin the work force has increased during the past decade.The decline in labor force participation has been amongPuerto Rican women born on the Island rather than amongthose born in the United States. Labor force participationamong the latter has remained constant and even gainedamong mature women, 45-64 years old.

e The proportion of employed Puerto Rican men in higherstatus professional and managerial occupations, is onein ten, compared to one in four for all males in thetotal population.
e Just over half of all Puerto Rican males are employedin skilled and semi-skilled, blue-collar occupationswith twice as many in the semi-skilled occupations (34%)as in the skilled ones (17%). In contrast, 21% of themen in the total population are employed in the skilled,blue-collar jobs and 20% are in the semi-skilled ones.
A quarter (26%) of all Puerto Rican men are employed inthe primarily low-skilled occupations as laborers andservice workers. This is 8% greater than the proportionof the total U.S. male population employed in the sameoccupational categories.
As it is for Puerto Rican males, the largest singleemployment category for Puerto Rican females in the UnitedStates is as semi-skilled operatives. Two in five (40%)Puerto Rican women work in this occupation; only 14% ofall women in the U.S. are employed in this occupationalarea.
Another 34% of Puerto Rican women are employed as white-collar, clerical and sales workers. This is 8% less thanthe proportion among women in the total population, butclose enough to national levels to indicate some economicmobility from blue-collar to white-collar jobs on the partof the Puerto Rican female.
Only a:,out 9', of all Puerto Rican women are in professionaland managerial occupations. This is the same percentageas among Puerto Rican men and one-half the percentage foundamong all women in the population.
Despite low educational attainments, only 14% of PuertoRican women are employed in the low-skilled serviceoccupations-6> less than the proportion among all womenin the United States. Puerto Rican women who are unableto obtain employment in more skilled occupations, by virtueof their poor educational backgrounds and language diffi-culties, apparently stay out of the labor force entirely.
Incense Characteristics
e The ....roportion of Puerto Rican males 16 years and over witha low income less than $4,000 (34%) is only slightlygreater than the average for the total country (31%), inpar} 1 product of Puerto Rican concentration in the Northeastwhere the cost of living and incomes are higher than inmany other parts of the U.s.
0 tris 2,,

The proportion of Puerto Rican males earning $10,000or more (8%) is one-third of that for the nation as awhole (25%). Although the proportion in very low incomebrackets among the men is not high, the proportionearning moderate or higher incomes is very low indeed.The lower income ranges of Puerto Rican males highlightthe fact that the additional income from a second earneris of great importance to the economic sufficiency ofthe family, yet the labor force participation rate ofPuerto Rican women is extremely low.
Nationally, the percentage of Puerto Rican women withan income less than $4,000 is close to the average forthe country; 70% compared to 68% for the nation as awhole; but only 1% are earning over $10,000 a yearcompared to 3% of women nationally. This small percentageof higher income earners among women all but cancels anyindication of economic progress that the smaller proportionin the lowest wage bracket might suggest.
The fewer earners and the higher proportion of female-headedfamilies produce the great proportion of low income levelsin Puerto Rican families. Almost three in ten (28%) of allPuerto Rican families have an annual income of less than$4,000, and only 22% earn $10,000 or more.
Among Puerto Ricans the head of one of every four familiesis a young woman who has the sole responsibility forsupporting her children. It is these family heads whohave the greatest difficulty earning an income sufficientto support the other members. Of all Puerto Rican femaleheads of families, 65% support their families on incomesunder $4,000--24% more than families with female headsnationally.
Poverty Characteristics
Of all Puerto Rican families, 27% are in poverty, 16%more than the percentage of poverty among all U.S.families.
Over half (53%) of all Puerto Rican families in povertyare female headed compared to the total U.S. rate of 33%.
The incidence of poverty among elderly persons (29%) andpersons who live alone (33%) is not markedly higher inthe Puerto Rican population than among the total U.S.population. 26% of the total U.S. elderly population,are poor and 37% of persons living alone in the totalU.S. are poor. Thus the problem of poverty among thePuerto Ricans is acute, but characteristically foundamong young families, particularly female-headed families,rather than among single or elderly persons.
0 ')

XV
Sources of Income
Social Security
The Puerto Ricans are not receiving Social Securitybenefits at a rate comparable to the rest of the popu-lation. One in every five families in the total popu-lation receives this type of income, but the proportionis less than one in ten for Puerto Rican families.
Although Social Security benefits are received primarilyby the elderly, and the proportion of elderly in thePuerto Rican population is much less than in the totalU.S. population, the proportion of Puerto Ricans receivingSocial Security is smaller than their numbers appear towarrant.
Public Assistance
With their very high rate of poverty and accessibilityto urban social service agencies, the proportion ofPuerto Rican families receiving public assistance (24%)is higher than the proportion of the national populationreceiving public assistance.

xvi
Cuban Americans
Immigration
Only about 5,000 Cubans were reported as immigrants to theUnited States prior to 1925. It was not until the advent ofFidel Castro in Cuba that the major flow of Cuban refugees tothe United States ensued. Between 1960 and 1970, over a quarterof a million (265,000) Cubans immigrated legally to this country.The rate of immigration reached its height in 1968, when 99,000Cubans entered the United States. Since 1968, the rate ofimmigration has greatly decreased, because of restrictions onemigration imposed by the Cuban govern.nent. Since 1970, anaverage of 22,000 Cubans have immigrated to the U.S. each year.There are now over 600,000 Cuban Americans in the United States.
Population Characteristics
The main destination for the Cuban refugee populationduring the 1960-1970 decade was Florida; 45% of the Cubanimmigrants listed that state as their U.S. destination.More Cuban Americans have moved to Florida from otherstates than have left Florida. 46% of all Cuban Americanslive in the state.
The Cuban Americans are almost entirely urban dwellers.Of all Cuban Americans, 98% live in cities.
Barely 18% of the Cuban American population were born inthe U.S. The majority of native-born Cuban Americans arestill young children, and 93% of all Cuban Americans whoare 18 years old or over are foreign born.
Throughout most of the recent decade of Cuban immigration,more Cuban females than Cuban males have come to the U.S.Recently almost half the Cuban immigrants have been middle-aged or elderly.
Unlike the other Spanish Origin groups, the median age ofthe Cuban American population (about 32 years for both menand women) is among the highest of any population. YoungCuban Americans (18 years old and under)\ comprise lessthan one-third of the total Cuban American,pOpulation.
Of the total Cuban American population, 6% are 65 yearsold or older, a proportion smaller than for elderly inthe total U.S. population, but larger than in the otherSpanish Origin populations.

xvii
Family Characteristics
The Cuban American family is one of the most stable,with a high proportion of husband/wife families andhigh proportion of children, 18 and under, livingwith both their parents. The proportion of familiesheaded by a female (12%) is only 1% above the nationalaverage.
As Cuban refugees immigrate to this country, they areapparently moving in with. relatives who are alreadyestablished. This is indicated by the fact that whileCuban American families have fewer young children thanany other population group, a large proportion of thefamilies (27%) have five or more members, indicatinga high number of extended families.
Education Characteristics
The Cuban American population has just as high apercentage of persons without much education as otherSpanish Origin populations. 45% of all adult CubanAmericans have eight or fewer years of education.
The proportion of Cuban Americans who are high schoolgraduates is high compared to other Spanish Origingroups, but still 11% below the average for the totalU.S. population.
Of the total Cuban American population in 1970, 96%reported Spanish as their motner tongue; this is notunexpectea, given the very large proportion of CubanAmericans who are foreign born.
Employment Characteristics
In 1970, 84% of Cuban American males were in the laborforce, the highest rate of participation by any groupin the country. The labor force participation rate ofCuban American women is also among the highest at 51%.
Unemployment among Cuban American males is close to theU.S. average. Wnile the unemployment rate among CubanAmerican women, at 7.3%, is slightly higher than theU.S. average,it is lower than that reported for otherSpanish American women.
Ut-

xviii
A quarter of all the Cubans immigrating between 1960and 1973 wno had an occupation when they immigratedwere in professional and managerial occupations. Another15% w-re white-collar clerical workers. However, theproportion of immigrants who are white-collar workershas decreased steadily since the mid-sixties. Morerecent immigrants are largely from blue-collar, semi-skilled and unskilled occupations. Since 1970, halfof all immigrants with occupations were operatives,service workers, and laborers.
The contrast in jobs held by the Cuban American womenand women in the total population is marked. While afifth of all women in the United States are in theprofessional and managerial occupations, less thanhalf the proportion of Cuban American women (10%) arein these higher status occupations. Over half the CubanAmerican women are employed in semi-skilled and unskilledoccupations, compared to 36% of all women.
Income Characteristics
With the high proportion of persons in the work force,the average Cuban American family is able to generatea greater family income. Three out of five of all CubanAmerican families have two or more earners.
Although higher than for other Spanish American populations,the income level of Cuban American families is still notup to the average for the total population, despite thecontribution of more earners. Of all Cuban Americanfamilies, 17% are living on an income of less than $4,000a year, compared to 15% of all families in the U.S. Ofall Cuban American families, 39% have an annual income of$10,000 or more, whereas the proportion for families inthe total population is 47%.
Poverty Characteristics
Currently, the rate of poverty among Cuban American families,13%, is just over the average for the country (11%). Thepoverty rate among Cuban families who immigrated to theU.S. between 1955 and 1965 is only 8%, but among familieswho have immigrated since 1965, it is twice the U.S.average (22%).
uf.)24

xi x
Poverty among female-headed Cuban American familiesand elderly Cuban Americans is son..,:tat lower thanamong the country as a whole, possibly because of theextended family structure, within which family memberswith limited means are assisted by relatives.
Under the Cuban Refugee Program, public assistancefor the Cuban American population has not been basedsolely on poverty status and the percentage of CubanAmerican families receiving public assistance (17%)is greater than the percentage of families in poverty (13%).
1JI",
*: C;

xx
PREFACE
This report is one of a series being developed by UrbanAssociates, Inc. (UAI), under Contract No. HEW OS -72 -209 with theOffice of Special Concerns, Office of the Assistant Secretaryfor Planning and Evaluation, Office ofthe Secretary, U. S.Department of Health, Education, and Welfare.
The basic purpose of the contract was to conduct a two-phase, comprehensive study of major barriers to culturally-relevant delivery of DHEW services to three major ethnicminority groups in America today: Americans of SpanishOrigin, Asian Americans, and American Indians. Under Phase Iof the contract, UAI undertook to:
Survey the parameters of the problem
Identify major problem areas
Make an overall assessment of the degree towhich ethnic minorities obtain their fairshare of culturally-relevant services
Identify the major barriers involved
Three major conclusions were drawn from the Phase I studyconcerning the ethnic minorities:
IL. All of the ethnic minority groups have seriousdeficiencies in the areas of health, education,and welfare; deficiencies which flow fromimpoverishment, cultural differences or, mostoften, a combination of both; and thus havesubstantial need for the services DHEW iscommitted to provide for all Americans.
2. Each ethnic group is unique, having a differentlanguage (or languages), life style, world view,and differing kinds and degrees of need forvarious services, such that, for each groupseparate, individualized, and culturally-sensi-tive planning and delivery vehicles are necessaryif their needs are to be adequately met.
002)

xxi
3. Contact with community agencies by the ethnicconsultants during Phase I indicated that eachof the ethnic communities complained aboutserious problems in the availability, methodof delivery, cultural sensitivity, and presenceof ethnic minority staff in DHEW-funded programsat the local level.
Based upon the results of Phase I, the Office of SpecialConcerns selected a number of issues for in-depth review byUrban Associates in Phase II.
In addition to this analysis of 1970 Census data pertainingto the three ethnic minorities, the other components of thePhase II study are:
An Evaluation of the Indian Health Service
A Study of Ethnic Minorities in the HealthOccupations
A Study of the Impact of DHEW Decentralizationon the Ethnic Minorities
A Field Study to determine the extent to which DHEW servicesare responsive to the needs of the Asian Americans
0 53u

I. INTRODUCTION
This volume, analyzing selected data from the U. S. Censusof 1970 on persons of Spanish Origin, represents one of threesuch volumes on three major ethnic minority groups in Americatoday (the other two groups being Asian Americans andAmerican Indians). The development of this report stemmed from thefinding in Phase I of the contract that there was a considerableabsence of data on the numbers and characteristics of ethnicminority consumers, the service needs of ethnic individuals,beneficiary data by ethnic group, and other key indicators of theethnic minorities' needs for services. Such information isindispensable to effective program planning by HEW. Therefore,this study focuses on generating specific data on the character-istics of ethnic minority individuals who are potential consumersof HEW services.
Our primary objective was to develop a report that would beuseful to the different audiences within HEW, as well as to thestate agencies dispensing HEW funds.
In conducting our analysis, we have given special attentionto the stereotypes of ethnic minorities held by many persons.The reader will find that most of these stereotypes cannot,infact,be maintained. We have also endeavored to look beyond thenational data on each of the groups, to local data, in order todetermine whether characteristics as reflected in national datawere also reflected in the data from particular localities. Ourstudy results have shown that national data on the ethnic minor-ities do frequently obscure, rather than reveal, the varyingfacts about many of the ethnic minority groups. We have presentedour findings with the intention of highlighting these distinctions.
A. DIFFERENCES BETWEEN THE 1970 CENSUS AND PAST CENSUSES
In 1970, the U. S. Bureau of the Census for the first timereported on persons of Spanish Origin as a major ethnic group,warranting national attention. Persons of Spanish Origin arethe second largest minority group in the United States. In all,they numbered 9.1 million people in 1970,1/ 2.4 million of whomwere in poverty.
1/ According to Census 1973 Current Population Survey, thereare 10.6 million persons of Spanish Origin. U. S. Bureau ofthe Census, Current Characteristics, Persons of Spanish Originin the United States: March 1973 (Advance Report), Series P-20,No. 259, January, 1974 (Reprint). Also see Section on Census Under-count.
0031
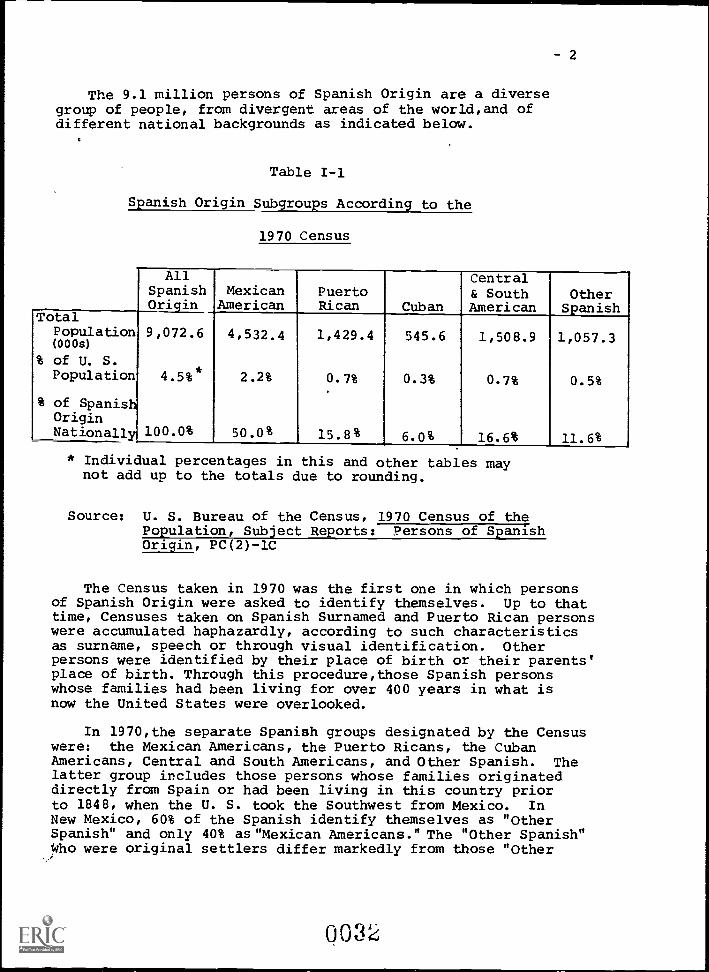
The 9.1 million persons of Spanish Origin are a diversegroup of people, from divergent areas of the world,and ofdifferent national backgrounds as indicated below.
Table I-1
Spanish Origin Subgroups According to the
1970 Census
TotalPopulation(000s)
% of U. S.Population
% of SpanisOriginNationall
- 2
AllSpanishOrigin
MexicanAmerican
PuertoRican Cuban
Central& SouthAmerican
OtherSpanish
9,072.6 4,532.4 1,429.4 545.6 1,508.9 1,057.3
4.5%* 2.2% 0.7% 0.3% 0.7% 0.5%
100.0% 50.0% 15.8% 6.0% 16.6% 11.6%
* Individual percentages in this and other tables maynot add up to the totals due to rounding.
Source: U. S. Bureau of the Census, 1970 Census of thePopulation, Subject Reports: Persons of SpanishOrigin, PC(2)-1C
The Census taken in 1970 was the first one in which personsof Spanish Origin were asked to identify themselves. Up to thattime, Censuses taken on Spanish Surnamed and Puerto Rican personswere accumulated haphazardly, according to such characteristicsas surname, speech or through visual identification. Otherpersons were identified by their place of birth or their parents'place of birth. Through this procedure,those Spanish personswhose families had been living for over 400 years in what isnow the United States were overlooked.
In 1970,the separate Spanish groups designated by the Censuswere: the Mexican Americans, the Puerto Ricans, the CubanAmericans, Central and South Americans, and Other Spanish. Thelatter group includes those persons whose families originateddirectly from Spain or had been living in this country priorto 1848, when the U. S. took the Southwest from Mexico. InNew Mexico, 60% of the Spanish identify themselves as "OtherSpanish" and only 40% as"Mexican Americans." The "Other Spanish"Who were original settlers differ markedly from those "Other
0032

Spanish" who immigrated from Spain and have been living in thiscountry for varying lengths of time.
The varying terms, such as Spanish Origin, Spanish Heritage,Spanish Surname, Spanish Speaking, etc. that are used todesignate Spanish Americans,often cause confusion. Puerto Ricans,whether born in Puerto Rico or in the United States, arelisted as "native born;" yet for all practical purposes, thoseborn in Puerto Rico have as many and as complex difficultiesas those "foreign born" persons from Mexico, South America, orCentral America.
Because of the variation in methods utilized to collect dataon the Spanish, some discrepancies may exist among Census datacollected over the decades. However, there is adequate com-parability of data on Spanish Origin population reported in the1970 Subject Reports: Spanish Origin or in the General Socialand Economic Characteristics, on "Spanish Language" or "Surname"or "Spanish Heritage." Data for the five southwestern statesare compared with data available for those five states inprevious decades (see Table 1-2 and Chart I-a).
The difficulties experienced by the Mexican Americans andPuerto Ricans--the two largest groups and those having thegreatest problems of economic and social adjustment into U. S.society--have been obscured within the total Spanish data."Other Spanish" (except for those who are long-time inhabitantsof the Southwest) and "Central and South Americans," becauseof their income, education, and integration into the society,apparently have had fewer socio-economic problems. Additionally,"Other Spanish" have been the only group whose members haveintermarried in large numbers 1/ with non-Spanish, which hastended to reduce language barriers for the children and easetheir integration into the general society.
The entry adjustment problems of newly arrived Cubanimmigrants have been mitigated by major infusions offederal money through the Cuban Refugee Act, which has providedfunds to meet their economic and social needs.
B. METHODS USED TO COLLECT DATA
In terms of completeness and accuracy of data obtained andpublished, this Census was much improved over previous counts.Special emphasis was placed on ethnic/racial minority groups,in response to increased interest expressed by government andprivate agencies, ethnic/racial and community organizations,
1/ Only 40% of -"Other Spanish" husbands are married towomen of Spanish Origin, see U.S. Bureau of the Census, CurrentPopulation Reports: Persons of Spanish Origin in the Unit-ea--States November 1969, Series P-20, No. 213
OrJ
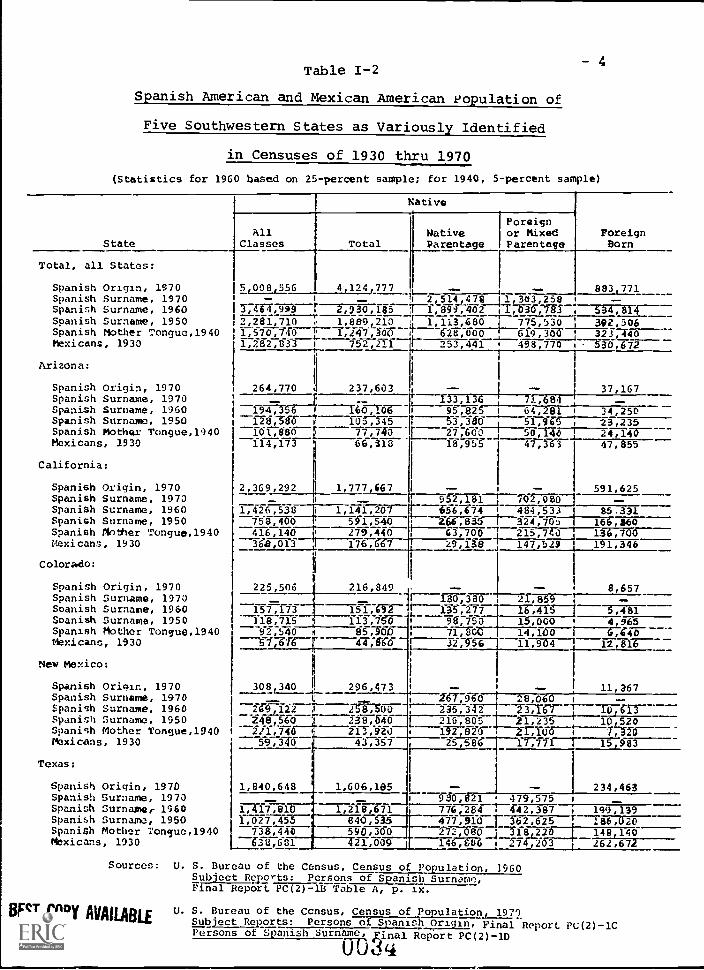
Table 1-2-.4
Spanish American and Mexican American copulation of
Five Southwestern States as Variously Identified
in Censuses of 1930 thru 1970
(Statistics for 1960 based on 25-percent sample; for 1940, 5-percent sample)
State
Total, all States:
Native
Spanish Origin, 1970Spanish Surname, 1970Spanish Surname, 1960Spanish Surname, 1950Spanish Mother Tongue,1940Mexicans, 1930
Arizona:
Spanish Origin, 1970Spanish Surname, 1970Spanish Surname, 1960Spanish Surname, 1950Spanish Mother Tongue,1940Mexicans, 1930
California:
Spanish Origin, 1970Spanish Surname, 1970Spanish Surname, 1960Spanish Surname, 1950Spanish Mother Tongue,1940Mexicans, 1930
Colorado:
Spanish Origin, 1970Spanish Surname, 1970Soanish Surname, 1960Soanish Surname, 1950Spanish Mother Tongue,1940Mexicans, 1930
New Mexico:
AllClasses Total
5,008556 4,124,777- -
1-7464,999 -27930,105-----..,.2,281,710 . 1,889,210
1,247,3001:282:833 752,211
264,770 237,603
NativeParentage
Poreignor MixedParentage
ForeignBorn
-- -- 883 7712,514,478 11,303,258
T--1,6.9-1,402 1,03077U 534,8141,113,680
T--- 628,660I-- 253,441
775,530 392,306619,36T 323,440
1 498,770 7-g-50,672
-- - 37,167----f33,136 7 84,
194,356 140-71-6-6-- 95,8257-1 64,281 34,250128386-7 1057345 -----53,3g6 5-1,96t,---"--T3,235
--1-61-700-17 77,740 27:600 50,146 24,146--114,173 66,313 18,955 47,363 47,855
1
2,369,292 I 1,777,667i --
1,426,538 i 1,141,267758,400 ' 50-1,540416,140 279,440368,013 , 176, 67
11
i
- -952,181 702,080 --656,674-_-467;7533 85.3312.64,83-6-7---324,70..) 166,86063,700 215714-0 136,70029,138 147,529 191,346
591,625
225,506 216,849 -- -_ f-----f-8-67330 21,859
157,313 15-1,0-2 r --135:277 ---166,415118,715
i113;75T- , 98,756 15,000
927t,4o m 85:560 , 7,30 A5 14,16r G,640---51,616-7 a, 16- 1177§a---1 12,816
8,657
5,4814 965
1
Spanish Origin, 1970 308,3400! 296,473Spanish Surname, 1970 - t
Spanish Surname, 1960 269,122 187500Spanish Surname, 1950 Z48,560 1 238,640Spanish Mother Tongue,1940 211,740 q 213,920Mexicans, 1930 59,3T0 43,357
Texas:
Spanish Origin, 1970Spanish Surname, 1970Spanish Surname, 1960Spanish Surname, 1950SpaniSh Mother Tonguc,1940Mexicans, 1930
1,840,648
117,8101,027,4557_,440533,631
1,606,185
1,211101840,535590,30021,009
- -- 11,367--2-6-7-,-90 28,060 --
235;142 1 23,167 10,613E---216,805 21,235 10,520
1M2,820 21,100 7, I6--25,58 17,711 15 983
- - 234,4639T0,821 479,575 -776,284 /442,387 199,139477,910J- 362,625 lar-272,080_1 3181220 140,14014675 d i 274,203 262,672
Sources: U. S. Bureau of the Census, Census of Population, 1960Subject Reports: Persons of Spanish Surnam,Final Report PC(2) -1B Table A, p. ix.
BEST COPY AVAILABLE U. S. Bureau of the Ccnsus, Census of Population, 197')Subject Reports: Persons of Spanish Origin, Final Report PC(2)-1CPersons of parish Surname, inal Report PC(2)-1D
Ori

Cha
rt I-
a
PO
PU
LAT
ION
IN T
HE
FIV
E S
OU
TH
WE
ST
ER
N S
TA
TE
S O
F S
PA
NIS
H P
ER
SO
NS
, AC
CO
RD
ING
TO
CE
NS
US
CLA
SS
IFIC
AT
ION
S 1
930
- 19
70
5.00
0.00
05,
008,
556
.
4,50
0,00
0
82%
- -4,
000,
000
Source:
U.S. Bureau
U.S. Bureau
of the Census, 1970 Census of Population,
1111
----
-,
MPC(2) -1C
MPC(2)-1B, Table A
Mof Spanish Origin,
,SIMen=orotf.s1:,,oppmzoircrn
of the Census,
Population,
Subject Reports:
Persons of Spanish Surname,
3,50
0,00
0
M M El
M In
3,00
0,00
0
For
eign
Bor
n
P..
Tot
al
3,48
5,00
0
85%
M - MI - In IN M M IIIM
-mm - MB M M M M MI
MI
2,50
0,00
0
2,00
0,00
0
2281
,700
on M
83%
m M
In - -Mm
eN
B
MI -
1,50
0,00
f1,
570,
700m
i
MI
M -M- M M
I1M M M M
IM
1111
-M
I - M M--
= M MI - NI
1,00
0,00
0
1,28
2,80
3
59%
MI
MI
79%
M li MI
MI
MI
M III MI
M -50
0,00
0
IN NI
54%
2nmi
M MI
MMI
3,44
0m
21%
MI
III
-M MmI
534,
814
M M NI
883,
779
18%
M M
M IM I1M
15%
17%
MI
III
E III III
MB M M III UM
Eth
nic
Des
igna
tion
1930
Mes
ita.
1940
Spa
nish
Mot
her
Ton
gue
% In
crea
se fr
om P
revi
ous'
Cen
sus
22.4
%
1950
Spa
nish
Sur
nam
e
45.3
%
1900
Spa
nish
Sam
na
51.9
%
1970
Spa
nish
Orig
in
44.8
%
Ln

- 6
and researchers. For the first time, the U. S. Bureau of theCensus launched an extensive program to improve minority coverage,including a pre-Census campaign to contact major minority groupsand gain their cooperation in the count. Special brochures andposters were printed for Spanish Speaking groups and communityeducators were employed in major cities to explain the Census,assure groups of the confidentiality of individual Censusreturns, and show how Census data is used to benefit citizens(for example, in planning and funding government programs).Community groups were asked to help the Bureau locate indigenouspersons to be employed as enumerators and supervisors, and tohelp with special problems (for example, to contact and assistpersons who spoke no English and who mistakenly threw awayCensus questionnaires received by mail).
Special procedures and funds were used during the Censusenumeration to reduce the "undercount" of ethnic minority groups.Enumerators in some areas were paid more for more difficult tasks,enumeration teams were used and enumerators speaking the nativelanguage were used whenever possible, particularly in barrios,etc.
In 60 cities in the country (principally in metropolitanareas), the Census Bureau, with the cooperation of the U. S.Post Office, used mail-out/mail-back forms based on addressregisters. This is in contrast to previous Censuses wherebyenumerators called personally on each household. In the1970 Census, such enumerators were used primarily in ruralareas and when it was necessary to contact households that didnot respond to the initial mail survey.
The Census forms were designed to maximize the count andaccuracy of data with respect to ethnic minorities. On a 20%sample nationally (i. e. every fifth person or household)respondents were asked to enumerate themselves by race and ethnicorigin, for example, persons were asked to state whether or notthey were of Spanish Speaking origin. Also persons who identi-fied Spanish as their "mother tongue" (language spoken in theirhouseholds when they were children) were designated as SpanishSpeaking. Finally, if the father in a household was determinedto be Spanish Speaking by such criteria, the entire householdwas counted as Spanish Speaking.
Therefore, the data on the Spanish populations as reflected inthis report are based primarily on persons of Spanish Origin 1/in preference to persons of Spanish Surname. 2/ The latterincludes persons with Spanish last name.: whether or not theywere of Spanish Speaking background (for example, Pilipinos),and excludes those persons whose surnames may not reflect theirSpanish Origins (e.g. Pedro O'Brian).
1/ U. S. Bureau of the Census, Census of Population, 1970Subject Reports:
2/ U. S. BureauSubject Reports: Persons of Spanish Surname, Vol. PC(2)-1D.
Persons of Spanish Origin Vol. PC(2)-1C.
of the Census, Census of Population, 1970
00 3u
7
Publications from the U. S. Census Bureau based on taL ationsfrom the 1970 Census provided the detailed socio-economic infor-mation on the three largest Spanish subgroups in the UnitedStates--the Mexican Americans, the Puerto Ricans and the CubanAmerican. In addition, information on all persons of SpanishOrigin was provided.
Except where indicated, the source of all data in this volumeis the 1970 Census of Population, as published by the U. S. Bureauof the Census, specifically in the following puhlications:l/
General Population Characteristics, UnitedStates Summary, PC(1)-B1
General Social and Economic Characteristics,United States Summary, PC(1)-C1
Detailed Characteristics, United States SummarY,PC(1)-D1
Subject Reports: Persons of Spanish Origin, PC(2)-1CPuerto Ricans in the United States,PC(2)-1E
Results from subsequent surveys and tabulations of personsof Spanish Origin have been issued by the Census Bureau andwhere these are the source of data, they are cited as footnotes.
C. UNDERCOUNT OF SPANISH IN THE 1970 CENSUS
Since the publication of the 1970 Census, the validity of the9.1 million population count of persons of Spanish Origin in theUnited States has been questioned. It has been charged that thenumber of Spanish persons has been seriously underestimated,due to inaccurate Census designations and inaccurate methods ofgathering data.
The U. S. Commission on Civil Rights, in its report on theSpanish Speaking undercount, 2/ stated that insufficient attentionwas given to the necessary methodology for collecting data on theSpanish Speaking.
1/ A detailed list of Census publications with data on personsof Spanish Origin is contained at the end of this report.
2/ U. S. Commission on Civil Rights Counting the Forgotten,U. S. Government Printing Office, April, 1974.
003
- 8
The report goes on to point out that the mailing listsused to send out Census questionnaires were commercial mailinglists.(such as lists of property tax payers) which were notrepresentative of the Spanish Speaking population. Also, noneof the actual forms used to enumerate the population weretranslated into Spanish. Only instructional materials (includingsamples of the Questionnaire forms) had been translated.
As a result of the report on the Spanish Speaking undercount,there appears to be no doubt but that there was an undercount;rather the question is to what degree. the Spanish Speaking wereundercounted.
The Census Bureau itself admits to some degree of under-count 1/ and recent Census estimates of the number of personsof Spanish Origin in the United States have recently beenrevised upward, 2/ so that the figure for people of SpanishOrigin in the United States in 1973, 10.6 million people, re-presents an increase of 1.5 million people over the 1970 figure.The more recent figures represent a 16.6% increase over figuresfor 1970 (see Table 1-3). The greatest change occurred in estimatesof the Mexican American population--a nearly 40% rise over 1970totals. While persons of Spanish Origin were estimated to be4.5% of the total U. S. population in 1970, in 1973, this pro-portion increased to 5.1%.
Since the 1970 Census data are the basis for program decisionsfor the allocation of funds under formula grants, resource allo-cation in general and special revenue sharing, Congressionalapportionment, etc., the impact of the population revisionswould be substantial. With more than $70 billion in the U.S.domestic budget, the difference in numbers of Spanish Originpeople in the United States represents at a minimum, $350million of funding allocation. Yet, at present, it is the1970 Census figures and not the updated figures that willbe the base upon which allocations are made. Clearly, seriousattention should be given to the implications of the new Censusfigures.
The Census Bureau cites several factors as being reseJnsiblefor the marked increase in population from 1970 to 1973 includingreclassification cf the origin of children under 14 living inhouseholds with a lead or wife of head of Spanish Origin; newterms used to identify persons of Mexican origin; direct
1/ See, for example, U. S. Bureau of the Census, SubjectReports: Persons of Spanish Surname, Vol. PC(2)-1D and_Estimates of Coverage of the Ponulation_pv Sex, Race andAge in the 1970 Census" (paper presented at the annualmeeting of the Population Association of AmeriCa, New Orleans,La. April 26, 1973) by Jacob S. Siegel of the U. S. Bureau ofthe Census.
2/ U. S. Bureau of the Census, Current Population Reports,Persons of Spanish Origin in the United States (Advance Report)March 1973. P-20, No. 259
00 36

Table 1-3
Number of Persons of Spanish Origin
1970 Census and March 1973
- 9
Type ofSpanish Origin
1970Census
-1973
NumberPercentChange
Total, Spanish Origin 9,072,602 10,577,000 16.6%
Mexican Origin 4,532,435 6,293,000 38.8
Puerto Rican Origin 1,429,395 1,548,000 8.3
Cuban Origin 544,600 733,000 34.6
Central or SouthAmerican Origin 1,508,866 597,000 -60.4
Other Spanish Origin 1,057,305 1,406,000 33.0
The decrease in the total number of persons designated asof Central or South American origin between 1970 and 1973 mayhave occurred because of: (1) a shift to one of four newterms used to designate persons of Mexican origin in the 1973Survey and (2) the replacement of self-reporting with directinterview as the primary method of gathering data.
Source: U. S. Bureau of the Census, Current Population Revorts,Population Characteristics, Persons of Spanish Originin the United States: March, 1973, (Advance Report),Series P-20, No. 25-9, January, 1974 (Reprint).
H&J
- 10
interviewing instead of self-enumeration; a revised sampledesign reflecting results obtained from the 1970 Census; andactual increase due to new births and immigration.
(1) Racial/Ethnic Classification of Children
As of 1973, all children under 14 in families wherethe wife of head was Spanish, were counted as being ofSpanish Origin. Prior to this, children under 14 living infamilies with a wife of head of Spanish Origin but a house-hold head of origin other than Spanish were classifiedaccording to the race of the head.
(2) Additional Self-Designation Categories
In 1970, only one category "Mexican" was given topersons for self-designation as far as persons of Mexicanorigin were concerned. By 1973, however, three othercategorLes--"Mexicano," "Chicano," and "Mexican American"were aided. These new designations apparently increasedboth the Mexican count and the total Spanish Origin count.
(3) Use of Direct Interviewing
While the 1970 Census used both self-enumeration anddirect interview to collect data on Spanish Origin, the1973 Survey was done entirely by interviewing, much of itby telephone.
(4) Sample Design'
Since the estimates of the total number of persons ofSpanish Origin in 1973 were based on a sample and not on atotal Census, estimates were subject to some degree of error.However, the sampling was changed to reflect new informationavailable from the 1970 Census rendering it probably moreaccurate than past estimates.
(5) Actual Increase
The Census Bureauincrease due to birthsUnited States is aboutthis would amount to a
estimates that the rate of naturalfor persons of Spanish Origin in the1.8% per year. Between 1970 and 19735.5% increase or about 506,000 persons.
OG4u
11
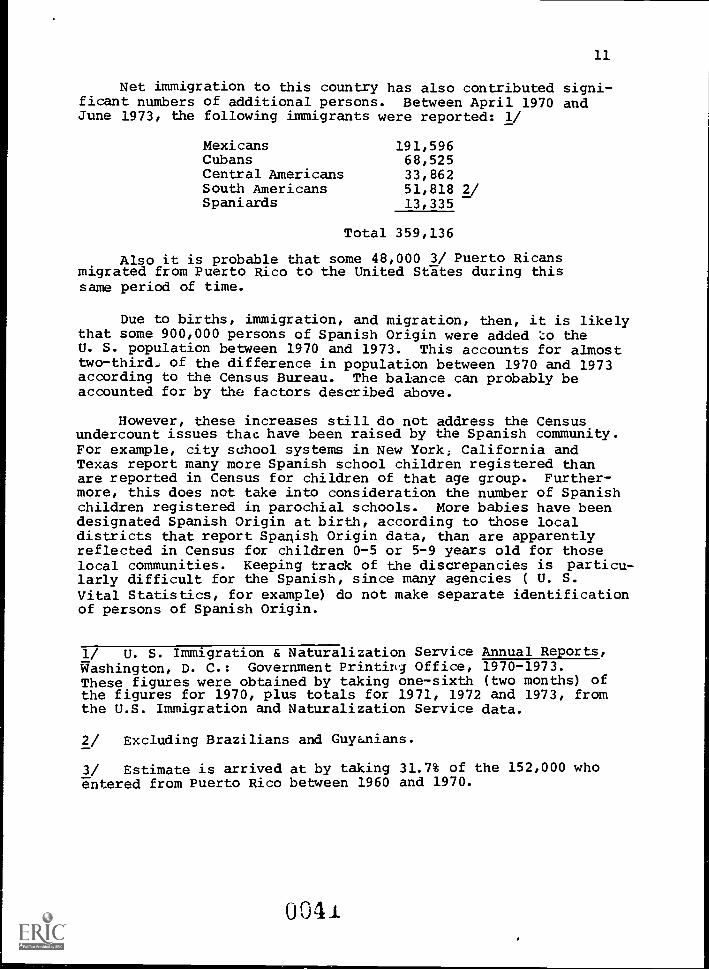
Net immigration to this country has also contributed signi-ficant numbers of additional persons. Between April 1970 andJune 1973, the following immigrants were reported: 1/
MexicansCubansCentral AmericansSouth AmericansSpaniards
191,59668,52533,86251,818 2/13,335
Total 359,136
Also it is probable that some 48,000 3/ Puerto Ricansmigrated from Puerto Rico to the United States during thissame period of time.
Due to births, immigration, and migration, then, it is likelythat some 900,000 persons of Spanish Origin were added theU. S. population between 1970 and 1973. This accounts for almosttwo-third_, of the difference in population between 1970 and 1973according to the Census Bureau. The balance can probably beaccounted for by the factors described above.
However, these increases still do not address the Censusundercount issues that have been raised by the Spanish community.For example, city school systems in New York; California andTexas report many more Spanish school children registered thanare reported in Census for children of that age group. Further-more, this does not take into consideration the number of Spanishchildren registered in parochial schools. More babies have beendesignated Spanish Origin at birth, according to those localdistricts that report Spanish Origin data, than are apparentlyreflected in Census for children 0-5 or 5-9 years old for thoselocal communities. Keeping track of the discrepancies is particu-larly difficult for the Spanish, since many agencies ( U. S.Vital Statistics, for example) do not make separate identificationof persons of Spanish Origin.
1/ U. S. Immigration & Naturalization Service Annual Reports,Washington, D. C.: Government Printing Office, 1970-1973.These figures were obtained by taking one-sixth (two months) ofthe figures for 1970, plus totals for 1971, 1972 and 1973, fromthe U.S. Immigration and Naturalization Service data.
2/ Excluding Brazilians and Guyealians.
3/ Estimate is arrived at by taking 31.7% of the 152,000 whoentered from Puerto Rico between 1960 and 1970.
0041
- 12
While the total numbers of Spanish persons recorded in 1970is low, the sample that the Census represents is infinitelylarger than any other data source. Thus, the profile of thecharacteristics of each ethnic minority group is likely to bemore accurate. The emphasis in this report, then, has beenplaced on the characteristics of the groups as revealed byCensus rather than on the actual numbers of people in each ofthese groups.
0044

- 13
II. METHODOLOGY AND SELECTION OF LOCAL DATA
The analysis of national and local data on persons ofSpanish Origin focuses on the basic characteristics generallyemployed when examining a given population group including:population characteristics,family structure, education,employment, income and poverty. The nature of the analysis bysubsection is described briefly below.
Section A. Immigration and In-migration: Discusses the recentimmigration and in-migration trends of the SpanishOrigin groups studied.
Section B.
Section C.
Population Characteristics: Covers general popu-lation characteristics including geographicdistribution, age distribution, and nativity.
Family Characteristics: Topics include inter-marriage, size of families, family stability,children living with parents by age and type offamily, and female heads of households.
Section D. Education Characteristics: Rates.of schoolingcompleted by populations 16 years old and over andthe present enrollment rates of children and youngadults are discussed. Where the data were avail-able, an analysis was made of the mother tongue ofmembers of the ethnic populations and the languagespoken in their homes. This is treated under Educationbecause of its impact on an ethnic group's ability toobtain a good education. Conversely, it is mainlythrough education that linguistic barriers will beremoved.
Section E. Employment Characteristics: This section focuses onlabor participation rates, unemployment rates, andthe distribution of ethnic minorities, both maleand female, in the major occupational classifications.
,
Section F. Income Characteristics: This section analyzes incomeranges for individual males and females, families,and families with female heads.
Section G. Poverty Characteristics and Sources of Income: Thissection discusses the proportion of families in eachethnic minority group receiving Social Security andPublic Assistance, compares rates of poverty for allpersons, for elderly' persons, for families, for female-head families, and for persons living alone (unrelatedindividuals).
OGC)

- 14
Section H. Cuban Americans: This section is a separate analysisof the Cuban population in the United States whichincludes the topics listed above in sections Athru G.
Accompanying most sections is a table summarizing the basicstate and local data for Mexican Americans and Puerto Ricans. Inaddition to this major table, supporting charts and other tabulardata have been included for the purpose of emphasizing or clari-fying special issues. 1/
Most data analyzed in the text appear in either a tableor chart within the report. Reference is made to other datacontained in the Census publications. Where occasional use hasbeen made of non-Census data, or Census data from sources notpreviously cited, the source is indicated as a footnote.
All data are examined primarily on the basis of nationaldata for each subgroup. It was not considered necessary, undera given topic, to discuss local statistics which mirrored thenational data for any particular subgroup. Our emphasis inanalyzing data from selected local areas was to highlightonly those situations where local data vary markedly from orare otherwise notable in comparison to the national picture.
SELECTING LOCAL AREAS OF ANALYSIS
The selection of those local areas whose data were mostappropriate for use in our analysis was made individuallyby ethnic minority group. For the Spanish Speaking, subgroupsto be utilized in the study were selected on the basis of theconcentration of each subgroup in a particular area of the nation.Mexican Americans were viewed according to their characteristicsin the five southwestern states (California, Arizona, NewMexico, Colorado and Texas) where 87% of that population reside.Of all Puerto Ricans, 83% are concentrated in the northeasternstates of Connecticut, New Jersey, and New York; therefore,these states formed the basis of our analysis.
Both Mexican American and Puerto Rican populations inIllinois were analyzed, because that is the one state wherethere are sufficient numbers of both subgroups to permit a com-parative analysis within the same geographic area. The groups
1/ Unless they are very small, all percentages used in thisreport -have been rounded to their nearest whole number. Sums ofpercentages may not equal 100 because of rounding.
0044
- 15
lend themselves to cross-analysis, since 99% of the Puerto Ricansand 76% of the Mexican Americans in Illinois reside in urban areas.Such a comparison makes for a more accurate study of the socio-economic conditions of each group, irrespective of the differingsocial and economic climates indigenous to different parts ofthe country.
In addition to the two major groups, the Cuban Americanshave been analyzed separately. Data on the Cubans are taken fromFlorida (where 46% of all Cubans live), New York-New Jersey where29% of all Cubans live, and from the entire U. S.
004J

- 16
III. NATIONAL AND LOCAL ANALYSES OF PERSONS OF SPANISH ORIGIN
A. IMMIGRAT: AND IN-MIGRATION
.Immigration
The 1970 Census recorded the presence of over 2.5 millionforeign-born persons of Spanish Origin. The majority of thesepersons had arrived in the United States recently (see Chart A-a),the rate of immigration by persons from Western Hemisphere SpanishSpeaking countries having risen steadily since the end ofWorld War II.
The Mexican Americans constitute the largest Spanish Speakingpopulation group both among native born and among the foreign born.Over 140,000 foreign-born Mexican Americans were reported to haveimmigrated to the United States prior to 1925. Immigration to theUnited States from Mexico decreased considerably around WorldWar II, averaging just over 2,000 pergons per year. Sincethen, however, the rate has been much higher. More recently,between 1960 and 1973, over 660,000 legal Mexican immigrants enteredthe United States (see Table A-1), an average of 47,000 each year. 1/
Until recently, the immigration by persons of other SpanishOrigins has proceeded at a much lower rate compared to the Mexicannationals. Less than 5,000 Cubans and only about 12,000 personsfrom other Central and South American countries were reported asimmigrants to the United States prior to 1925. It was not untilafter 1945 that the immigration rates for these groups began toaccelerate. In the most recent period, between 1960 and 1973,yearly immigration from Cuba has averaged 23,600 persons per year 2/and from other parts of Central and South America, an average of 28,700persons per year.
As American citizens, Puerto Ricans have not entered the UnitedStates under immigration quotas. Lacking also is any clear recordof the numbers of Puerto Ricans entering and leaving the UnitedStates. In 1910, about 1,500 persons born in Puerto Rico werereported in the United States. In each decade since that time(with the exception of the 1940's) the Census has recorded a substan-tial growth in this population. However, between 1960 and 1970(see Table A-2) the rate of growth appears once more to have decreased.
1/ Census figures and INS figures on Mexican Americans are notcomparable since the former records the presence of all persons andthe latter indicates only persons granted an immigrant visa. "Temporary"workers, illegal immigrants, persons not holding immigrant visas butintending to remain in the United States would not be recorded.
2/ A more detailed discussion of Cuban immigration occurs in SectionH. Cuban Americans.
0046

Year oImm lust
I 1111111111111111111 1111111111111 III11111111 111111 ILE III"'III 1111 11 111 MI1111111
VII III 11111111111rd 1111111111
I IIIIM III 1111111011 111111111111
1111111E1 1111 III 11111 AIIIIIIIIIIII
I IlNlN 1l111!'
"i1i
1E11111M11111111111111111
.
a

- 18
Table A-1
Immigration of Persons of Spanish Origin:
1960-1973
Place of OriginYear of
Immigration Mexico CubaCentralAmerica
South''America Spain
1960 32,689 8,283 6,661 11,649 1,737
1961 41,632 14,287 6,817 14,027 1,812
1962 55,291 16,254 8,405 16,032 2,148
1963 55,253 10,587 10,275 20,946 2,187
1964 32,967 15,808 11,500 28,686 2,252
1965 37,969 19,760 12,423 28,093 2,200
1966 45,163 17,35r, 9,658 23,439 2,954
1967 42,371 33,321 8,551 14,841 3,620
1968 43,563 99,312 10,675 19,451 5,260
1969 44,623 13,751 9,692 20,600 3,916
1970 44,469 16,334 9,343 7 .291 4,139
1971 50,103 21,611 8,626 17,172 4,125
1972 64,040 20,045 11,283 15,444 4,386
1973 70,141 24,147 12,396 16,153 4,134
660,274 330,855 136,305 264,824 44,870
Source: U. S. Dept. of Justice, U. S. Immigration andNaturalization Service, Annual Reports, Washington,D.C.: Government Printing Office, 1960-1973.
* Without Brazil or Guyana
0046

- 19
Table A-2
Persons of Puerto Rican Birth and Parentage
in the United States: 1910-1973
Year of Census NumberPercentIncrease
Nativity
1,500Born inPuerto Rico: 1910
1920 11,811 680.6%
1930 52,774 346.8
1940 69,967 32.6
1950 226,110 223.2
1960 617,056 172.9
1970 810,087 31.3
Born in theUnited Statesof Puerto RicanBorn Parents:
1950 75,265 -
1960 275,457 266.0%
1970 581,376 111.1
Source: U.S. Bureau of the Census,1960 Census of Population,Subject Reports: Puerto Ricans in the United StatesPC 2) -1D; 1970 Census of Population, Subject Reports:Puerto Ricans in the United States PC(2)-1E.
OG4t)
20
In terms of actual numbers, the net increase 1/ of personsof Puerto Rican birth recorded between the 1960 and 1970 Censuses(193,000 persons) was only half of the net increase reportedbetween the 1950 and 1960 Censuses (391,000 persons). Perhaps thedeprived status of the Puerto Ricans currently living in the UnitedStates has made others living on the Island reluctant to moveto the United States.
The Puerto Rican population can be divided into those born onthe Island and those born in the United States. Data on PuertoRicans of second or succeeding generations were not collected Priorto the 1950 Census although the 1970 Census shows that there aresome 42,000 second generation Puerto Ricans (born outside ofPuerto Rico with Puerto Rican-born parents) who would have been bornbefore the 1940 Census.
In 1970, there was a difference of 64,700 in the numberof U.S.-born Puerto Ricans shown in Subject Reports: Personsof Spanish Origin, PC(2)-1C (which included Puerto Ricansof third and subsequent generations in the United States) and
Subject Reports: Puerto Ricans in the United States, PC(2)-1E(which included only persons of first and second generationsin the United States). There are, therefore, at least thismany Puerto Ricans in the United States of third and subsequentgenerations.
1/ It is known that Puerto Rican families migrate freely betweenPuerto Rico and the United States. There is no accurate data,however, on the number arriving or leaving the United States fromyear to year.
005u

- 21
III. B. POPULATION CHARACTERISTICS
This section discusses such popu3ation characteristics asgeographic distribution, mobility within the United States andthe age distributions of persons of Mexican and Puerto Ricanorigin.
Distribution
In 1970, the Bureau of the Census counted over 9 millionpersons of Spanish Origin in this country 1/ (see Table B-1).Half of these (4.5 million) are Mexican Americans. Of allMexican Americans in the United States, 87% live in the fivesouthwestern states: Arizona (with 5% of all Mexican Americans),California (41%), Texas (36%), New Mexico (3%) and Colorado(2%), Sizeable Mexican American populations are also found inthe Midwest. In Illinois alone, there are some 160,000 MexicanAmericans. In all, the Mexican Americans constitute some 2.2%of the total population of the United States.
There are 1.4 million Puerto Ricans in the United States.2/About three-quarters of all Puerto Ricans live in the tri-statearea of New York (64%), New Jersey (10%) and Connecticut (3%).Another 6% of the Puerto Rican population lives in Illinois,where they number about 87,000.
1/ In March 1973, the Bureau of the Census completed a recountof the Spanish Speaking population. As a result of reclassi-fications and natural population increase, Census placed thelatest figures for Spanish Speaking in the U.S. at 10.5 million,an increase of 17% over the 1970 figure. The biggest increasewas for Mexican Americans, up 39% to 6.3 million. Puerto Ricansincreased 8% to 1.6 million (see Section I. B. Census Undercount).
2/ There are also 1.5 million Central and South Americans inthe U.S. and over half a million Cuban Americans.
0051
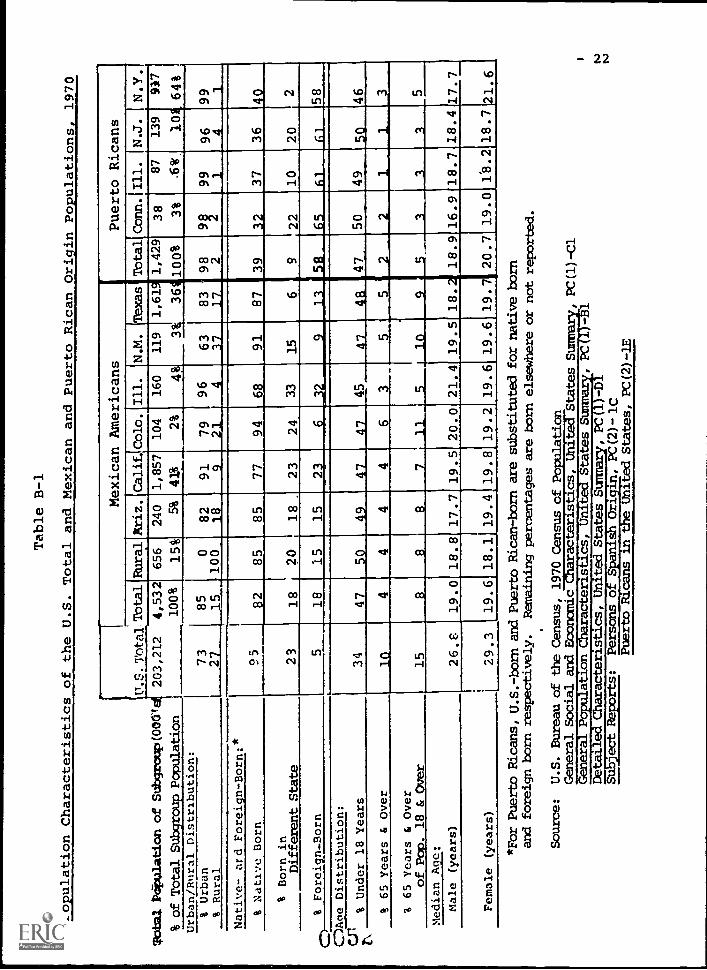
Table B-1
Population Characteristics of the U.S. Total and Mexican and Puerto Rican Origin Populations,
1970
Mexican Americans
Puerto Ricans
.
U.S.Mtal.Total
RuralAriz.
Calif.Colo.
Ill.
N.M.
Texas
TotalConn.II11.
N.J.
N.Y.
tat Pdpulation of Subgroup(00010
% of Total Subgroup Population
203,212
4,532
100%
656
15%
240 5%
1,857
41%
104 2%
160 4%
119 3sk
1,619
369100%
83
17
1,429
98 2
38 3%
98
87
6%.
99 1
139
10
96 4
917
64%
99 1
Urban/Rural Distribution:
73
27
85 5
0100_
8218
91 9
79
21
96 4
63
37
% Urban
% Rural
I
Native- and Foreign-Born:*
95
82
85
77
94
68
91
87
39
32
37
36
% Native Born
% Born in
Different State
23
18
20
18
.23
24
33
15
69
22
10
,40
20
2
% Foreign-Born
518
.15
15
_23
§_.,12_._a_._.ja.__ilLj25faL.-.._._iai._._._5L3--
)Age Distribution:
34
10
47 4
50 4
49 4
47 4
47
45
63
47
48
5 :
5
47, 2
_
50 2
49 1
5Q 1
46 3
1% Under 18 Years
% 65 Years & over
% 65 Years & Over
of Pop. 18 & Over
15 26.8
8
19.0
8
18.8
8
17.7
7
19.5
11
5
20.0 21.4
10
9
19.5 18.2
5 18.9_1336
16.9
18.7
18.417.7
Median Age
Male (years)
Female (years)
29.3
19.6
18.1
19.4.19.8
19.2 19.6
19.6 19.7
20.7
19.0
18.218.721.6
*Fbr Puerto Ricans, U.S.-born and Puerto Rican-born are substituted for native born
and foreign born respectively.
Remaining percentages are born elsewhere or not reported.
Source:
U.S. Bureau of the Census, 1970 Census of Population
General Social and Economic Characteristics, United States Summary, PC(1)-C1
General Population Characteristics, United States Summary, PC(1)-131
Detailed Characteristics, United States Summary, PC(1)-Di
Subject Reports:
Persons of Spanish Origin, PC(2)- 1C
Puerto Ricans in the United States, PC(2)-1E
- 23
Urban/Rural Residence
A majority of the Spanish populations in the United Statesare urban dwellers, for example, the Puerto Ricans (98% urban),who have settled in the major cities in the East. In contrast,only 73% of the total U. S. population live in urban areas.
Even the Mexican Americans, commonly stereotyped as beingfarm workers, are more concentrated in the cities than is thetotal U.S. population. Some 85% of all the Mexican Americansin this country live in cities.
Programs for Mexican Americans still have their major focuson the rural migrant. Indeed, until recently, many federalagencies equated rural programs for the migrant with programsfor all Mexican Americans in the United States. In fact, notsince 1940 has a major proportion of Mexican Americans livedin rural areas (see Chart B-a) 1/. In 1970, even 56% of MexicanAmericans employed in farm-related occupations had residencesin urban areas.
Population Mobility
Table B-2 illustrates the rural to urban shift by theMexican American population in recent decades. In every stateexcept California, there has been a decrease between 1940and 1970 not only in the percentage of the population thatis rural, but in actual numbers as well. In Californiathere has been an overall increase of 65,000 Spanish personsin rural areas since 1940.
The data suggest that there has been some movement by thepopulation from other southwestern states to California as wellas overall movement from rural areas to urban areas.
By 1970 the Mexican Americans lived mainly in the Lentralcities of large metropolitan areas. Of all Mexican Americanfamilies in 1972, 78% lived in major SMSA's and 69% lived inSMSA's with total populations numbering a quarter of a millionor above. Nearly half of the Mexican Americans (46%) live incentral cities while 32% are found in suburban areas surround-
1/ Data on Mexicanlimited to the fivewere not identifiedsee Introduction of
Americans taken prior to 1970 Census aresouthwestern states, as Mexican Americansseparately in any other states until 1970;this report.
0 5

PERCENT OF TOTAL
IS
70
50
40
30
20
10
CHART B-a
% OF THE SPANISH POPULATION OF THE
5 SOUTHWESTERN STATES: URBAN-RURAL
1940 -1970
24
79%._
II % Urban
% Rural
51% 49%
66%
34%
85%
21%
YEAR OF CENSUS
Source: U.S. Bureau of the Census,
U.S. Bureau of the Census,
U.S. Bureau of the Census,
U.S. Bureau of the Census,
15%
1940 1950 1960 1970
1940 Census of the Population, Nativity andWhite Population, "Mother Tongue"1950 Census of the Population Persons of SVo . IV, part C1960 Census of the Population, Subject RepoSpanish Surname, PC(2)-1BISTO Census of the Population, Subject RepoSpanish Origin, PC(2)-71C
Parentage of the
anish Surname,
rta: Persons of
rts: Persons of
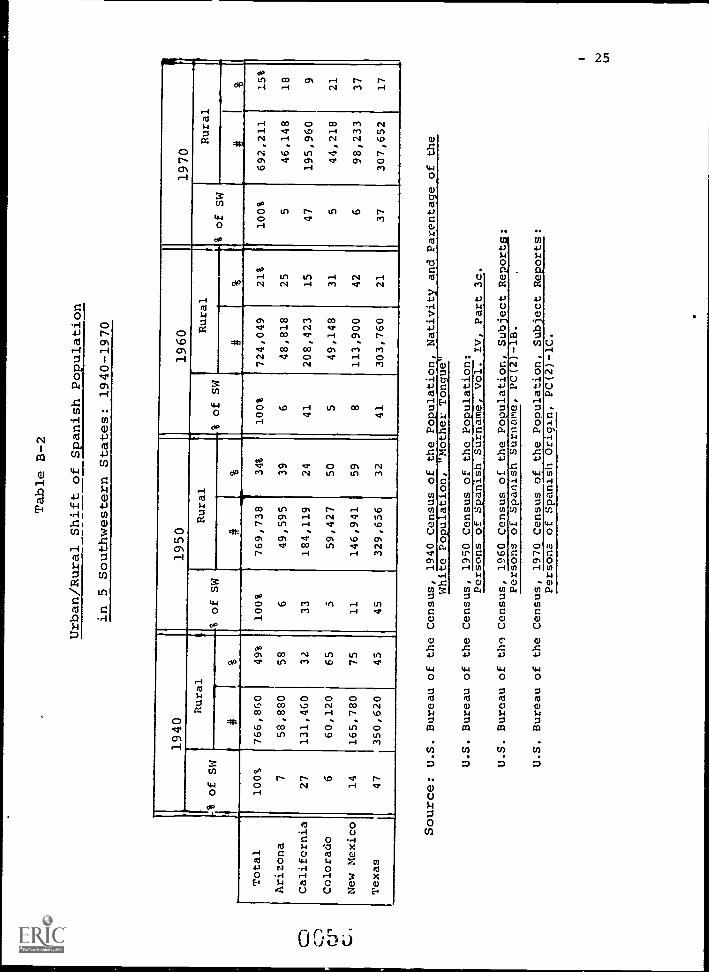
CD
C7) CP C.
Table B-2
Urban/Rural Shift of Spanish Population
in 5 Southwestern States: 1940-1970
1940
1950
1960
1970
% of SW
Rural
of SW
Rural
of SW
Rural
of SW
Rural
,..
aa
Total
100%
766,860
49%
100%
769,738
34%
100%
724,049
21%
100%
692,211
15%
Arizona
758,880
58
649,595
39
648,818
25
546,148
18
California
27
131,460
32
33
184,119
24
41
208,423
15
47
195,960
9
Colorado
660,120
65
559,427
50
549,148
31
544,218
21
New Mexico
14
165,780
75
11
146,941
59
8113,900
42
698,233
37
Texas
47
350,620
45
45
329,656
32
41
303,760
21
37
307,652
17
Source: U.S. Bureau of the Census, 1940 Census of the Population, Nativity and Parentage of the
White Population, "Mother Tongue"
U.S. Bureau of the Census, 1950 Census of the Population:
Persons of Spanish Surname, Vol. IV, Part 3c.
U.S. Bureau of thq Census, 1960 Census of the Population, Subject Reports:
Persons of Spanish Surname, PC(2)-18.
U.S. Bureau of the Census, 1970 Census of the Population, Subject Reports:
Persons of Spanish Origin, PC(2)-1C.
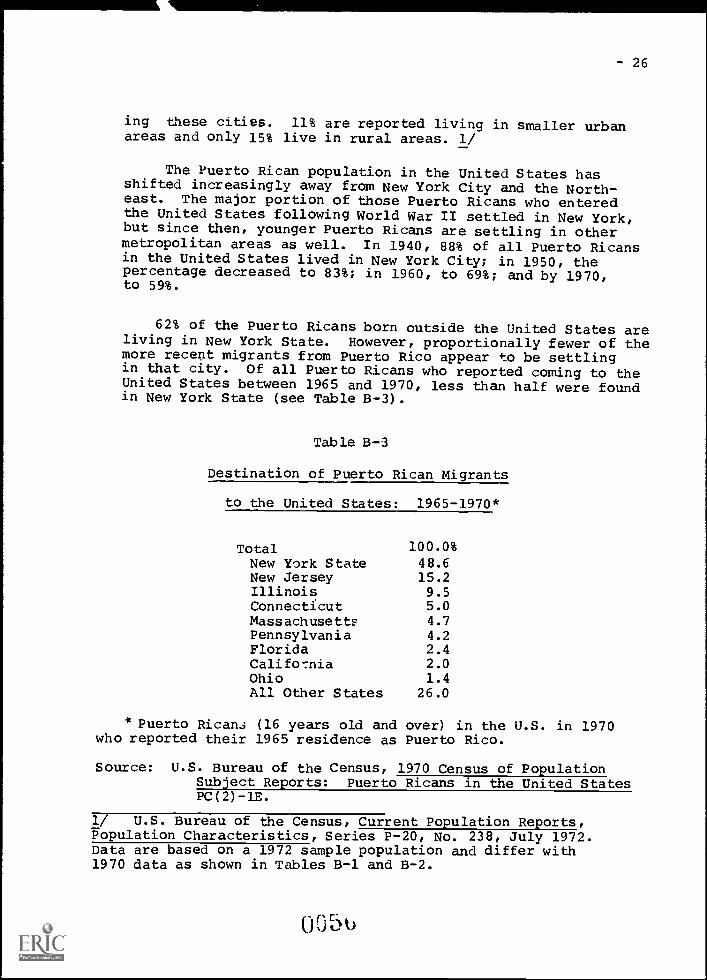
- 26
ing these cities. 11% are reported living in smaller urbanareas and only 15% live in rural areas. 1/
The Puerto Rican population in the United States hasshifted increasingly away from New York City and the North-east. The major portion of those Puerto Ricans who enteredthe United States following World War II settled in New York,but since then, younger Puerto Ricans are settling in othermetropolitan areas as well. In 1940, 88% of all Puerto Ricansin the United States lived in New York City; in 1950, thepercentage decreased to 83%; in 1960, to 69%; and by 1970,to 59%.
62% of the Puerto Ricans born outside the United States areliving in New York State. However, proportionally fewer of themore recent migrants from Puerto Rico appear to be settlingin that city. Of all Puerto Ricans who reported coming to theUnited States between 1965 and 1970, less than half were foundin New York State (see Table B-3).
Table B-3
Destination of Puerto Rican Migrants
to the United States: 1965-1970*
TotalNew York StateNew Jersey
100.0%48.615.2
Illinois 9.5Connecticut 5.0Massachusetts 4.7Pennsylvania 4.2Florida 2.4California 2.0Ohio 1.4All Other States 26.0
*Puerto Ricans (16 years old and over) in the U.S. in 1970who reported their 1965 residence as Puerto Rico.
Source: U.S. Bureau of the Census, 1970 Census of PopulationSubject Reports: Puerto Ricans in the United StatesPC(2)-1E.
1/ U.S. Bureau of the Census, Current Population Reports,Population Characteristics, Series P-20, No. 238, July 1972.Data are based on a 1972 sample population and differ with1970 data as shown in Tables B-1 and B-2.
055u
- 27
Nativity
Four out of every five Mexican Americans were born in theUnited States. More than half (57%) had parents who were alsoborn in this country (natives of native-born parents), indicat-ing that most Mexican American families have been in residencein this country over a span of several generations. Chart B-bdemonstrates the distribution of Mexican Americans by age,according to nativity.
Among children 19 years of age and under, fully 92%were born in the U.S. Among adults of middle age, 45-64 yearsold, two-thirds (65%) are native to the United States. Onlyin the elderly population, 65 years old or over,are there moreforeign born (59%) than there are U.S. born.
Most of the more recent Mexican American immigrants nowlive in cities. Almost 90% of all first-generation Mexican Americanimmigrants live in urban areas, while a somewhat lower, 85%of U.S.-born Mexican Americans do. The immigrants havetended to settle in the Far West and the Midwest. States likeCalifornia and Illinois have higher percentages of foreign bornamong their total Mexican American populations (23% and 32%respectively). But in Colorado and New Mexico, well over 90%of all the Mexican American population were born in the U.S.Even in Texas, a major point of entry from Mexico, a verylarge 87% of the Mexican American population was born on U.S.soil (see Chart B-c).
Among U.S.-born Mexican Americans, there has also been amovement of population. Many Mexican American migratoryworkers have settled in the Far West and the Midwest. Instates like California, Colorado, and Illinois, from nearlya quarter to a third of the U.S.-born Mexican Americans movedto their present states of residence from elsewhere. In Texas,almost all the U.S.-born Mexican Americans now living in thatstate were born there (94%) (see Table B-1). 1/
1/ Note that percent ges of Mexican Americans born in adifferent state as indicated on Table B-1 and Chart B-c donot totally agree. The former is calculated on a base ofall persons who are U.S.-born while the latter is calculatedon a base of the total Mexican American population.
005

Total In 400,000
Population
350,000
300.000
250,000
200,600
150,000
100,000
50,000
NATIVITY OF MEXICAN AMERICANS AND PUERTO RICANS, BY AGE\ 28
Chart B-b
PUERTO RICANS
la Puerto IlIcanBorn
III United States Born
Total in1'200'000
Population
1,000,000
800,000
600,000
400,000
200,000
0.9 10 - 19 20 - 29 30 - 39 40 - 4t 50 - 59 80 - 69 70 and
Age Group ( Years ) above
MEXICAN AMERICANS
ig Foreign Born
5 Native Born
0 - 9 10 - 19 20 - 29 30 - 39 40 - 49
Age Group ( Years )
50 - 59 60 - 69I
70 and
above
Source: U.S. Bureau of the Census, 1970 Census of Population,Subject Reports: National Origin and Language, PC(2)-1A
Persons of Spanish Origin, PC(2)-1CPuerto Ricans in the United States, PC(2)-1E

Total in
Population
1,800,000
1,600,000
1,400,000
1,200,000
1,000,000
800,000
600,000
400,000
200,000
- 29
Chart B-c
NATIVITY AND STATE OF BIRTH : MEXICAN AMERICANS
Rural U. S. California Texas Arizona Illinois N" ColoradoMexico
Foreign Born
Born in Same1
Born in Different
StateatCol
3 Native
11 NativeState
.-CV
atCo2
ata)
atin
at
inatCVCO
atinat
CO
a)CO
atrt.n
Co
4atco
at.a.
Source: U.S. Bureau of the Census, 1970 Census of Population,Subject Reports: Persons of Spanish Origin, PC(2)-1C
0 G '5 b

- 30
In California and Illinois most of the U.S.-born Mexicanresidents who came from out of state had their origin in thesouthern part of the country (presumably Texas). The newerarrivals in Colorado, however, came from other western statesand settled in the urban areas.
In contrast to Mexican Americans, the Puerto Ricans are relativenew-comers to the U.S. 1/ Over half of all Puerto Ricans inthis country were born in Puerto Rico. Of those born withinthe United States, 84% are still 19 years old and under (seeChart B-b). Of those Puerto Ricans 20 years old or older, only15% were born in the United States. Among the elderly, only9% are of U.S. birth. The proportion who were born on theIsland remains about the same in all the states where PuertoRicans are now concentrated.
The data (see Table B-1) show that, in all states otherthan New York, some proportion of the young, U.S.-born PuertoRicans (ranging from 10% in Illinois to 22% in Connecticut)were born in a state in the Northeast other than that of theirresidence. From this, one can infer that some of the PuertoRican families now living outside New York State started theirfamilies in New York and subsequently moved to other states,but that this represents less than 25% of all Puerto Ricansin all states of high concentration.
Chart B-b illustrates the differing concentrations of U.Sborn and non-U.S. born in the Mexican American and Puerto Ricanpopulations by age group.
Age Distribution
About one-third of the total population in the United Statesis under 18 years of age. However, families of Spanish Origintend to be larger and include more children (see Section C. FamilyCharacteristics) and thus almost half (47%) of the people in boththe Mexican American and Puerto Rican population are under 18 yearsof age. 50% of the Puerto Rican population outside of NewYork are under 18 years of age; this is equaled only by therural Mexican population.
1/ Data on the nativity of Puerto Ricans in two separate Census_publications are not comparable. Subject Reports: Persons ofSpanish Origin, PC(2)-1C, includes those who are of third anasubsequent generation in the United States, while Subject Reports:Puerto Ricans in the United States, PC(2)-1E, includes onlyPuerto Ricans in e Unite States for one or two generations.Tito number of J.S. -born Puerto Ricans shown in the first publicationis L4,700 greater than in the second one--an 11% difference.Data in this section are taken from Subject Reports: Personsof Spanish Origin, PC(2) -1.C.
0 064u

- 31
For Mexican Americans, the proportion of young people isgreater in rural areas--a full 50%. The proportion of childrenin the population is slightly lower among the heavily urbanMexican American population,particularly in Illinois, where 45%are under 18 years of age.
Among Puerto Ricans, the relatively high proportion ofyoung people is affected somewhat by the lack of elderly. Fewof the younger Puerto Ricans who migrate to the U.S. bring theirelderly relatives with them. As Table B-4 illustrates, of thosePuerto Ricans 14 years old and over who reportedly came to theUnited States between 1965 and 1970, only 2% were elderly.
Table B-4
Age Distribution of Puerto Ricans, 14 Years Old and Over,
Who Came to the U.S. Between 1965-1970*
Age Group14-19 21%
20-24 29%
25-34 26%
35-44 12%
45-64 10%
65 and Over
*Data computed on Puerto Ricans in the U.S. in 1970 whoreported their 1965 residence as Puerto Rico.
Source: U.S. Bureau of the Census, 1970 Census of Population,Subject Reports: Puerto Ricans in the United StatesPC(2)-E.
Another reason for the low proportion of elderly is that somemay tend to return to the Island to spend their old age. Whilenationally, about one-tenth of the entire population is 65 yearsold or over, only 2% of the Puerto Ricans in this country are.While 15% of the U.S. adult population (18 years old and over) iselderly (an age adjustment to statistically eliminate the factorof differing proportions of children in each population), only5% of all Puerto Ricans, 18 and over, are elderly.
00B

- 32
Of those elderly Puerto Ricans who are living In the U.S.more are concentrated in the State of New York. (There, theelderly are about 5% of the total Puerto Rican population.)The proportion of elderly in other states like Connecticut,Illinois, and New Jersey is smaller (around 3%). At the sametime, Puerto Rican families in these other states have some-what larger proportions of children under 18 (50%). Thisdifference may be due to the fact that earlier migrating PuertoRican families tended to stay in New York State. However, morerecently some of the younger Puerto Rican families have settledin the other states.
As with the Puerto Ricans, fewer Mexican Americans areelderly. Only 4% of all the Mexican Americans in this countryare 65 or over, compared to 10% of all persons in this country.Taken as a proportion of the adult population (18 years old andover), there are still only half as many elderly in theMexican population (8%) as in the total population (15%).
Several factors may be responsible for this low proportionof older persons:most recent Mexican Americans immigratinginto the U.S. are young, few are elderly; 1/ some MexicanAmericans choose to return to Mexican soil when they becomeolder finally, the poverty conditions that characterizethe Mexican American population in this country promote illhealth and inadequate medical care. It is possible that, asa result, Mexican Americans have a shorter life span withfewer persons surviving into old age.
Slightly greater concentrations of elderly Mexican Americansare to be found in Texas (9% of the adult population), NewMexico (10%), ani Colorado (11%). California and Illinois, withthe highest proportions of recently immigrant Mexicans, havethe lowest proportions of elderly (i; and 5% respectively ofthe adUlt Mexican Americans).
Given a greater --- )rtion of young persons, the medianage of Spanish SpeaAing populations in this country is youngerthan the total U.S. population. The median age of both MexicanAmerican and Puerto Rican males is about 19 years, compared to26.8 for the entire population. Among Mexican Americans, Illinoismales have the highest median age, 21.4 years, and Arizona maleshave the lowest, 17.7 years, compared to the national median of19.0 years for Mexican American males.
1/ The median age of the 186,000 Mexicans reported in the 1970Census as having immigrated to the United States between 1965and 1970 was 22.5 years.
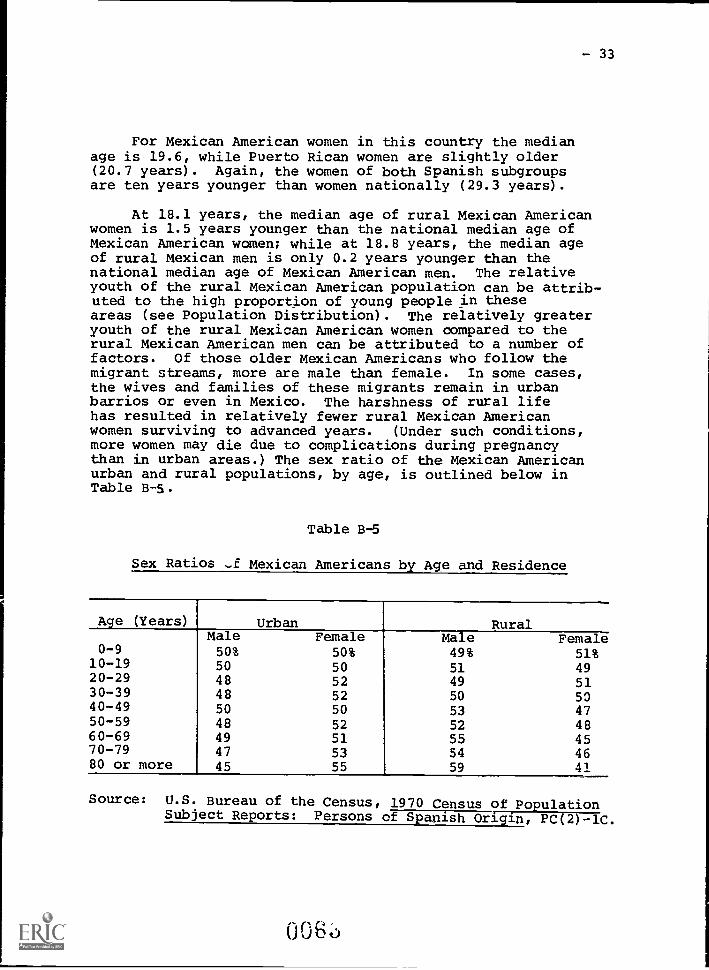
- 33
For Mexican American women in this country the medianage is 19.6, while Puerto Rican women are slightly older(20.7 years). Again, the women of both Spanish subgroupsare ten years younger than women nationally (29.3 years).
At 18.1 years, the median age of rural Mexican Americanwomen is 1.5 years younger than the national median age ofMexican American women; while at 18.8 years, the median ageof rural Mexican men is only 0.2 years younger than thenational median age of Mexican American men. The relativeyouth of the rural Mexican American population can be attrib-uted to the high proportion of young people in theseareas (see Population Distribution). The relatively greateryouth of the rural Mexican American women compared to therural Mexican American men can be attributed to a number offactors. Of those older Mexican Americans who follow themigrant streams, more are male than female. In some cases,the wives and families of these migrants remain in urbanbarrios or even in Mexico. The harshness of rural lifehas resulted in relatively fewer rural Mexican Americanwomen surviving to advanced years. (Under such conditions,more women may die due to complications during pregnancythan in urban areas.) The sex ratio of the Mexican Americanurban and rural populations, by age, is outlined below inTable B-5.
Table B-5
Sex Ratios -f Mexican Americans by Age and Residence
Age (Years) Urban RuralMale Female Male Female
0-9 50% 50% 49% 51%10-19 50 50 51 4920-29 48 52 49 5130-39 48 52 50 5040-49 50 50 53 4750-59 48 52 52 4860-69 49 51 55 4570-79 47 53 54 4680 or more 45 55 59 41
Source: U.S. Bureau of the Census, 1970 Census of PopulationSubject Reports: Persons of Spanish Origin, PC(2)-1C.
0 0 6

- 34
As the percentages indicate, the proportions of malesand females in both urban and rural areas are about thesame among children and younger adults. In the population ofpersons who are middle-aged, however, women outnumber men inurban areas while men outnumber women in rural areas.
The median age of the Puerto Rican males does not deviategreatly from state to state except in Connecticut where themedian age is 16.9 years, 2 years younger than the median forall Puerto Rican men nationally. The median ages of the PuertoRican women living in Connecticut, Illinois and New Jersey areabout three years under the median for Puerto Rican women inNew York (21.6 years). 1/
1/ For Puerto Ricans, median ages nationally vary accordingto Census data source. For example, according to SubjectEnortsi_persons of Spanish Origin, PC(2)-1C, the median ageof Puerto Rican males is 18.9 and for females, 20.7.According to Subject Reports: Puerto Ricans in the United States,PC(2)-1E, however, median ages for men and women are 19.4 and 21.2,respectively. The former source includes all persons of PuertoRican origin while the latter only includes those Puerto Ricansin the U.S. for one or two generations (Puerto Rican birth orparentage).
0064
- 35
III. C. FAMILY CHARACTERISTICS
The Mexican American and Puerto Rican families sharecertain distinguishing characteristics from the general popu-lation of the United States, such as higher percentages oflarge families, greater numbers of children in the familiesand comparatively fewer nunbers of primary individuals. TheMexican American families are particularly large, with manychildren. The Puerto Rican families, on the other hand, appearto have a relatively high rate of disintegration of marriages.These and other characteristics of the Mexican American andthe Puerto Rican families are detailed in this section. Thedata from which the discussion is drawn appear in Table C-1.
Family Structure
In the United States, 86% of all families consist of ahusband, wife, and their children,if they have any. AmongPuerto Ricans in the U.S., however, only 72% of the familiescontain both parents, 10% below the proportion for MexicanAmericans. The proportion is lower still in New York whereonly 68% of Puerto Rican families are husband/wife. Almosta quarter (24%) of all Puerto Rican families in the UnitedStates have a female head, while 4% are headed by a malewithout a wife. In New York, 28% of all Puerto Rican familiesare female headed.
Compared to Puerto Rican families, fewer Mexican Americanfamily units contain dissolved marriages, although the percentageof husband/wife families in the Mexican American population(82%) is still somewhat lower than in the total U.S. population.Of all Mexican American families, 13% have a woman as the headcompared to 11% in the total population (see Chart C-a).
For economic reasons, the presence of both parents in thefamily unit is an advantage. Proportionally, more rural thanurban Mexican American husband/wife families are livingtogether, possibly because traditions binding familiestogether are stronger in rural areas. In rural areas, 87% ofall Mexican American families are in the husband/wife modeand only 9% have a female head.
006

CD CD
t Female-Headed
Families
Ct With Children
Under 18
Table C-1
Family Characteristics of the U.S. Total and Mexican and Puerto RicanOrigin Populations, 1970
% Husband/Wife
Families
% With Children
Under 18
% With Children
Under 6
% Persons Under 18
Living with Both
Parents
% With Children
Under 6
"C-1771Gory
Individuals
t Male
% Female
% Families with 3 0
More Own Children
Under 18
% Families with 5
or
More Persons
t
U.S.
Total
Mexican Americans
Puerto Ricans
Total
Rural
Ariz.
Calif.Colo.
Ill.
N.Mex.TexasTotal "
N
Conn.
Ill.
N.J.
N.Y.
.
(
86%
82%
87%
82%
82%
82%
84%
81%
81%
72%
76%
78%
74%
G8%
56
76
78
78
76
73
76
73
76
75
el
17
79
74
27
46
48
47
47
44
46
45
46
45
55
49
51
44
85
80
79
80
80
77
83
78
50
65
70
73
69
61
1%
11
13
913
14
14
10
14
14
24
21
16
21
28
55
68
63
64
72
72
76
64
62
82
88
77
87
81
21
31
30
24
33
44
34
25
27
46
52
49
47
45
.
20
12
911
14
14
13
12
912
910
912
37
55
64
50
58
55
66
49
45
58
75
76
72
54
63
45
36
50
42
45
34
51
55
42
25
24
28
46
20
38
144
41
37
35
37
37
39
133
41
36
38
32
25
46
53
49
44
42
45
43
49
136
144
40
40
34
Source:
U.S. Bureau of the Census, 1970 Census of Population
General Social and Economic Characteristics, UnitedStates Summary, PC(1)-C1
Detailed Characteristics, United States Summary,PC(1)-Dl
Subject Reports:
Persons of Spanish Origin, pc(2)-1C
Puerto Ricans in the United States, PC(2)-1E

.37
Chart C-a
FAMILY STRUCTURE AMONG MEXICAN AMERICANS AND PUERTO RICANS
Husband/wifePercentage of all Families families
82% on86% 111 Female-head families
8 0 a NI III Wifeless male
NI IIN head families
72% IN MN
MN MN70 NI a a
lira aa aNI a NI
IIIII---- aa aa a a
50 a --Ell,a aa NI a
IN IN a40 II MI 111
MI aIII aIN III30
INa- a MIN 24% a MNMN
20 a MN NMaNI IN III11111 13% IN
IN MO 11%
NIIN 4% NINI
5% IN 3%MN NI
60
10
Puerto Ricans Mexican Americans U. S. Total
Source: U.S. Bureau of the Census, 1970 Census of Population,General Social and Economic Characteristics, United States Summary, PC(1)-C1Subject Reports: Persons of J.5 nish Origin, PC(2)-1C
0 U
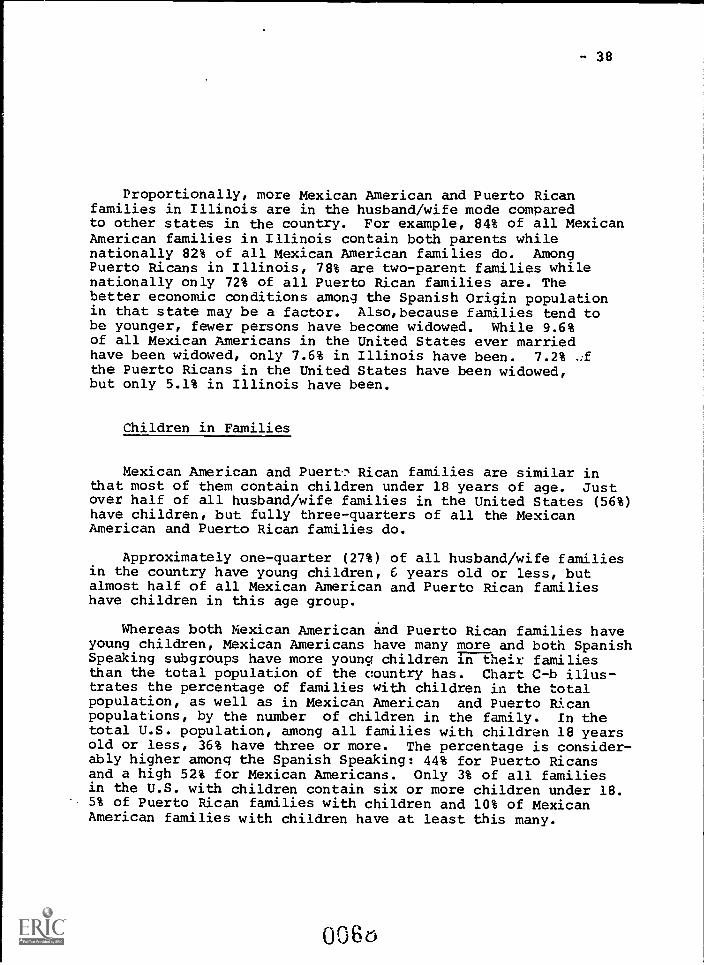
- 38
Proportionally, more Mexican American and Puerto Ricanfamilies in Illinois are in the husband/wife mode comparedto other states in the country. For example, 84% of all MexicanAmerican families in Illinois contain both parents whilenationally 82% of all Mexican American families do. AmongPuerto Ricans in Illinois, 78% are two-parent families whilenationally only 72% of all Puerto Rican families are. Thebetter economic conditions among the Spanish Origin populationin that state may be a factor. Also,because families tend tobe younger, fewer persons have become widowed. While 9.6%of all Mexican Americans in the United States ever marriedhave been widowed, only 7.6% in Illinois have been. 7.2%the Puerto Ricans in the United States have been widowed,but only 5.1% in Illinois have been.
Children in Families
Mexican American and Puer:, Rican families are similar inthat most of them contain children under 18 years of age. Justover half of all husband/wife families in the United States (56%)have children, but fully three-quarters of all the MexicanAmerican and Puerto Rican families do.
Approximately one-quarter (27%) of all husband/wife familiesin the country have young children, 6 years old or less, butalmost half of all Mexican American and Puerto Rican familieshave children in this age group.
Whereas both Mexican American and Puerto Rican families haveyoung children, Mexican Americans have many more and both SpanishSpeaking subgroups have more young children TE-Eheir familiesthan the total population of the country has. Chart C-b illus-trates the percentage of families with children in the totalpopulation, as well as in Mexican American and Puerto Ricanpopulations, by the number of children in the family. In thetotal U.S. population, among all families with children 18 yearsold or less, 36% have three or more. The percentage is consider-ably higher among the Spanish Speaking: 44% for Puerto Ricansand a high 52% for Mexican Americans. Only 3% of all familiesin the U.S. with children contain six or more children under 18.5% of Puerto Rican families with children and 10% of MexicanAmerican families with children have at least this many.
OQ6
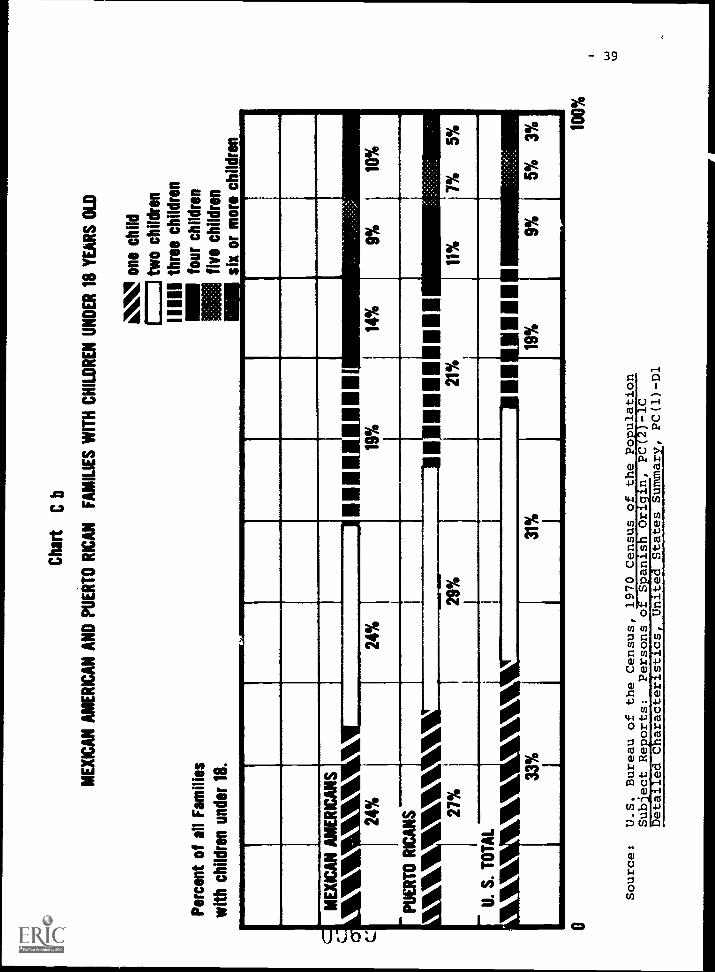
Cha
rtC
b
ME
XIC
AN
AM
ER
ICA
N A
ND
PU
ER
TO
RIC
AN
FA
MIL
IES
WIT
H C
HIL
DR
EN
UN
DE
R 1
8 Y
EA
RS
OLD
Per
cent
of a
ll F
amili
es
with
chi
ldre
n un
der
18.
11.
one
child
two
child
ren
1111
1 th
ree
child
ren
four
chi
ldre
n=
five
chi
ldre
n
ME
XIC
AN
MI 1
1r
PU
ER
TO
RIC
AN
S
Me.
11.7
11vi
lat
U. S
. TO
TA
L
a k
_VIK
WIA
AM
ER
ICA
NS
24%
.1 1
19%
14%
9%10
%
VI
24%
27%
21%
11%
' 7%
5%i
29%
!ILW
elk
33%
19%
11
9%5%
3%31
%
100%
Source:
U.S. Bureau of the Census, 1970 Census of the Population
Subject Reports:
Persons of Spanish Origin, PC(2)-1C
Detailed Characteristics, United States Summary, PC(1)-D1

40
The rural Mexican American family is larger still. Of allrural Mexican American families with children, 11% have six ormore. Nationally, 38% of all Mexican American families (includ-ing those with no children at all) have three or more children;in rural areas, 44% do.
With so many children in the home, it is advantageous forboth husband and wife to be able to care for them. Of all thechildren in the total population under 18 years of age, 85% livewith both their parents. In the Mexican American population,4 out of every 5 children live with both their parents, aproportion slightly under that for the total population.However, less than two-thirds of all Puerto Rican childrenlive with both their parents.
It is particularly difficult for the female head of alarge family to support many children. Disadvantaged by asmaller income, the feitiale is often the sole earner, partic-ularly when the children are not yet old enough to contrib-ute to the family income. While 55% of all the female-headed families in the United States have children under 18,68% of Mexican American female-head families and a veryhigh 82% of the Puerto Rican female-head families do.
The female head who has younger, preschool age childrento support is further burdened economically by the need toprovide child care while she is at work. Only one-fifth of allfemale-headed families in the United States have such youngchildren, but among the Spanish Speaking, 31% of the MexicanAmerican female-headed families, and a very high 46% ofPuerto Rican female-headed families have young children forwhom child care must be provided if the woman is to work.
Because Spanish female heads of families are younger, theyare more likely to have young children. But a clear differenceexists between Mexican American and Puerto Rican families inthis regard. While the Mexican American, female-headed familyis likely to have more children than any other subgroup, morePuerto Rican families have young children. This is becausemost Puerto Rican female heads are at the height of child-bearing age; quite likely they had just started their familieswhen left with the responsibility for their households.The Mexican American female head is likely to have beenmarried longer and thus have produced more children.The age distribution of female heads in selected populationgroups is shown in Table C-2.
0 0 'r u

U.S. TotalMexicanAmericansPuertoRicans
- 41
Table C-2
Age Distribution of Female Family Heads: 1970
A e Group (Years)
Total 16-24 25-34 35-44 45 and Over
100% 7% 18% 21% 52%
100% 9% 21% 26% 41%
100% 15% 37% 25% 23%
Source: U.S. Bureau of the Census, 1970 Census of the Population,Detailed Characteristics, United States Summary, PC (I) -DlSubject Reports: Persons of Spanish Origin, PC(2)-1C
As the data show, over half of all the Puerto Ricanfemale family heads are still between the ages of 16 and 34years of age. No other population has so high a proportionof younger female heads. (Only 25% of the total populationand 30% of Mexican American female heads of household are thisyoung.)
The highest rates of broken families among Puerto Ricansare in New York State. There, Puerto Rican families havebeen established longer and, over time, more marriages havedissolved. The families living outside New York are youngerand more of them have young children. In Connecticut and NewJersey, over half of Puerto Rican husband/wife families havechildren under six years of age. The proportion is nearly ashigh among the Puerto Rican female-headed families in Connecticutand Illinois (52% and 49%, respectively).
Extended Families
Traditionally, families in Spanish Speaking culturesretain the extended family (containing more than just theimmediate family and including other relatives, such asgrandparents, aunts, or uncles). In the country as a whole,88% of all families are nuclear families (containing justparents and, where present, children). Among the SpanishSpeaking populations, the proportion is slightly less (85%for the Puerto Ricans and 84% for other Spanish Speakingpopulations, such as Mexican Americans, Cuban Americans,Central and South Americans, etc. (see Table C-3).
007

Table C-3
Family Composition:
Summary 1970
Ethnicity
of Head
Nuclear
Families
Total
Without
Children
With
Children
U.S. Totals
88%
29%
59%
CDCD
Puerto Ricans
85
12
73
OtIcr Spanish
Speaking *
84
15
69
Extended
Families
3-4 generation
Families with
linear family,
only relatives other
including grand- than grandchildren
children or par- or parents of head
Total ents of head
(brothers, sisters,etc)
12%
7%
5%
15
7
16
9
Source:
U.S. Bureau of the Census, 1970 Census of Po uIation
Family Composition, PC
(2)-4A. Table 32.
Sub'ect
Re orts:
*Includes Mexican Americans, Cuban Americans and persons of other Spanish
Origins. Data pertain only to those families with a family head who is
foreign born or whose parents are foreign born.
- 43
Local data on extended families among Spanish Speakingpopulations are not available in the above form. But bysubtracting the percentage of all families with three ormore children under 18 years of age from families withfive or more members of any age or relationship, one isable to determine the degree to which extended familyrelationships exist in a particular population group(e.g. by the presence of persons over 18 years of ageother than the parents). 1/
Among Mexican Americans, the differential between thepercentage of families with three or more children and thepercentage of families with five or more persons, nationally,is 8%. (The differential among all families in the totalpopulation is 5%.) The differential among Mexican Americansis higher in rural areas (9%), as well as in the State ofTexas (10%), suggesting a greater tendency for extendedfamilies among Mexican Americans in these areas.
Primary Individuals
A fifth of all households in the United States aresingle-person households (primary individuals). Personsin this category include elderly persons, widowed and alone, aswell as young, single persons who have yet to establish theirown families. Among primary individuals in the United States,the ratio of women to men is a high 63% to 37%, because womenoutlive men and hence outnumber men as they become elderly.
1/ Among Puerto Ricans, the differential between the percentageof families with three or more children and the percentage offamilies with five or more persons is, nationally,3% (see TableC-1). The differential is lower than that of the total U.S.population (5%) although data on Table C-3 indicate that thereare proportionally more extended families in the Puerto Rica rltpopulation than in the total population. The apparent contra-diction might be due to the high proportion of Puerto Ricanfamilies containing only one parent (28% of all Puerto Ricanfamilies) whereas the analysis of the differentials of thepercent of families with 5 or more members and 3 or moremembers as an index of the presence of extended families isbased on a two parent family norm. Because of the discrepancy,no attempt is made to analyze the data on Puerto Ricans locally.

- 44
Among the Spanish Speaking populations, the proportionof persons living alone without relatives (12% for bothMexican Americans and Puerto Ricans) is lower than in thetotal population (20%). Possible reasons may be that Spanishyoung people tend to stay with their families until theymarry, and that the elderly live with relatives or returnto their native homes to spend their old age. In particular,it appears that the women tend to stay with their families,for male primary individuals greatly outnumber females inboth Spanish Speaking populations.
In some states, cne sex ratio for Spanish Speakingprimary individuals is a complete reversal of the ratio inthe total U.S. population. In Illinois, for example, malesconstitute 66% of the Mexican American and 76% of the Puerto Ricanprimary individual populations. Similar ratios existamong Puerto Ricans in states outside of New York, and forMexican Americans in rural areas (see Table C-1).
Intermarriage
The pattern for intermarrying outside the subgroup differsgreatly for Mexican Americans and Puerto Ricans in the UnitedStates, although the total figures on intermarriage within thepopulation are very close. About one out of every six marriedpersons of Mexican American and Puerto Rican origin is marriedto a spouse of a different subgroup (see Table C-4).
0074

- 45
Table C-4
Marriage Within Own Subgroup
Married to Spouseof Same Ethnic/Racial Group
U.S.
Total
i
Spanish Speaking
Nexican i, PuertoAmericans' Ricans
99t*
99
1
841
I1
t
83
81%
83
Total 16 % Male& Over:
% Female
16-24 Yrs: % Male
% Female
NA
NA
Fi
77
79t
79
84
25-44 Yrs: % Male
% Female
NA
NA
83
83
81
82
45 Years % MaleS Over:
% Female
NA
NA
88
87
81
79
Source: U.S. Bureau of the Census, 1970 Census of Population:Detailed Characteristics, United States Summary, PC(1)-D1Subject Reports: Persons of Spanish Origin, PC(2)-1C

- 46
While the rate of intermarriage among younger MexicanAmericans has been increasing steadily, the rate of inter-marriage among Puerto Ricans has hardly changed at alland, in the case of women, has actually decreased.
For middle-aged or older Puerto Rican men, 19% have non-Puerto Rican wives, but the figure increases only slightly,to 21%, for younger men 16-24 years of age. Among women, therate of intermarriage has actually decreased. Of Puerto Ricanwomen 45 years old and over, 21% have married a person who isnot Puerto Rican, but only 16% of the younger 16-24 year oldPuerto Rican women have.
Of those married to persons of a different subgroup, themajority have married persons who are not Spanish Speaking,as Table c-5 below illustrates:
Table C-5
Ethnic Origin of Spouse for Mexican
Americans and Puerto Ricans
Ethnic OriginSame
SubgroupOther
Spanish Non-SpanishHusband
Mexican American 84% 2% 14%
Puerto Rican 81 5 14Wife
Mexican American 83 3 14
Puerto Rican 83 5 12
Source: U.S. Bureau of the Census, 1970 Census of thePopulation, Subject Reports: Marital Status,PC(2)-4C.

- 47
III. D. EDUCATION CHARACTERISTICS
The education system has served as a major barrier to economicsuccess for persons of Spanish Origin. It has been and remains amajor problem for the Mexican Americans and the Puerto Ricans.Nationally, the education levels attained by both the MexicanAmericans and the Puerto Ricans are far lower than those attainedby the general population in the United States. In 1970 almosthalf of all persons of Spanish Origin 16 years old and over havenot had more than an elementary education. In 1960, 18% ofMexican Americans 1/ and 16% of Puerto Ricans, 2/ 14 years oldand over had completed high school. In 1970, about one-quarter(24%) of both Mexican Americans and Puerto Ricans of this agegroup 3/ had graduated from high school. The gain over the decade,however, is a very small one when one considers that 41% of theU.S. population, 14 and over had graduated from high school in1960 and by 1970, 52% had.
Schooling Completed
Mexican American Males
Magnifying the situation even further, almost half of allMexican American males 16 and over have not progressed beyondthe eighth grade; while 27% of all U.S. males, 16 and over,have had so little education (see Table D-1).
Only 2.3% of all Mexican American males 14 and over havegraduated from college, less then one-fifth of the proportion forthe entire U.S. male population. And this situation has not beenimproving either. There has been only the slightest indicationof a gain in Mexican American college graduates, from 1.2% in 1960to 2.3% in 1970.
Few male populations are as poorly educated as the MexicanAmerican. Rural Mexican Americans are even less educated. 62% ofall rural Mexican American males 16 years old and over havenot gone beyond the eighth grade and a very small 18% havecompleted high school (see Chart D-a).
1/ U.S. Bureau of the Census, 1960 Census of the Population,Subject Reports: Persons of Spanish Surname, PC(2)-1B. Datareflect the five southwestern states only.
2/ U.S. Bureau of the Census, 1960 Census of the Population,Subject Reports: Puerto Ricans in the United States: PC(2)-1D.
3/ These data differ slightly from the national data on Table D-1which reflect schooling completed by persons 16 years old and overin 1970. The adjustment was necessary to make the 1970 datacomparable to the 1960 data which are only available for persons14 and over.
007

Table D-1
Education Characteristics of the U.S. Total and Mexican and Puerto Rican Origin Populations, 1970
Schooling Completed
O-t'al
27%
Mexican Americans
Puerto Ricans
'TotalRural
Ariz.
Calif.Colo.
Ill.
N.fix.TexasTotal
Conn.
Ill.
N.J.
N.Y.
47%
62%
47%
40%
41%
52%
44%
58%
43%
54%
54%
52%
43%
(16 Yrs of Age or Older)
Males: % 8 Yrs. Schooling
or Less
% High School
Graduates
54
28
18
28
32
32
23
32
21
27
20
18
22
25
% 4 Yrs.,:College
or More
12.6
2.5
1.4
2.3
2.3
2.7
1.7
3.9
2.1
2.2
1.6
2.1
1.8
1.4
Median Schooling (yrs)
12.
.9.4
7.6
9.3
10.0
10.0
8.8
9.8
8.1
9.7
8.7
8.7
8.8
9.7
. Females:% 8 Yrs. School-
ing or less
25%
49%
61%
50%
42%
42%
30%
46%
61%
48%
52%
54%
r;%
48%
% High School
Graduates
55
26
18
26
30
27
26
27
20
26
21
20
22
24
%4 Yrs. College
or more
7.8
1.4
1.0
0.9
1.2
0.8
0.9
1.9
1.4
1.7
2.1
1.6
1.3
1.0
Median Schooling(nm) -712.1
9.1
7.9
9.0
9.8
9.8
9.0
9.4
7.7
9.3
8.8
8.7
8.6
9.2
Enrollment in School
14%
12%
12%
17%
22%
120
11%
11%
140
12%
12%
13%
15%
% 3-4 Yrs. Old
.14
% 18-24 Yrs. Old:Male
Female
38
27
25
18
23
17
25
17
23
17
22
15
19
12
31
22
30
19
13
10
16
12
9
10
.9
14
710
Source:
U.S. Bureau of the Census, 1970 Census of Population
General Social and Economic Characteristics, United States
Detailed Characteristics, United States Summary, PC 1 -D1
Subject Reports:
Persons of Spanish Origin, PC(2)-1c
Puerto Ricans in the United States, PC(2)-1E
, PC(1) -C1

% O
F T
OT
AL
100
MF
Chart
114
SCHOOLING COMPLETED BY PERSONS 16 YEARS OF AGE AND OVER
IN SELECTED GROUPS: 1970
11%
4yea
rsco
llege
ormore
%m
oret
hani
lyea
rssc
hool
21: % H.S
grad
uate
s w
ithou
tw
ithou
t fra
duat
ingf
rom
high
scho
ol
4 ye
arco
llegs
,10
%8
yaw
s sc
hool
or
less
.
M F
1.4%
M F
2.2%
-mig
uxF
1.41
4IM
MI.O
V"
70 10
U.S. Total
Mex
ican
Am
eric
ans
Pue
rto
Ric
ans
Rur
al
Mex
ican
Am
eric
ans
Source:
U.S. Bureau of the Census, 1970 Census of Population,
General Social and Economic Characteristics, United States Summary, PC(1)-C1
Subject Reports:
Persons of Spanish Origin:
PC(2)-1C

- 50
A large proportion of the Mexican American population in Texasis poorly educated. Among the Mexican American men in that state,58% have had eight or less years of schooling. The education levelsattained by Mexican American men in Illinois are also low, which issurprising because the income level for Mexican Americans residingin that state is among the highest for Mexican Americans in theentire country. Such relatively high incomes in Illinois populationwere achieved despite the fact that 52% of the males have been inschool eight years or less and fewer than a quarter have graduatedfrom high school.
Mexican American men living in Colorado and Californiaare somewhat better educated. In these two states, medianschooling is up to a full tell years and almost a third havegraduated from high school. The proportion of collegegraduates, however, is still at the level for all MexicanAmerican men nationally (2.3% for California and 2.7%for Colorado, compared to 2.5% for Mexican American mennationally).
Puerto Rican Males
The educational attainments of Puerto Rican men are scarcelybetter than the levels reached by Mexican American men. Themedian schooling of the Puerto Rican male population, 9.7 years,is only 0.3 years higher than the median for the Mexican Americanmales--hardly a significant difference. Although the percentageof poorly educated men (with eight or fewer years of school) is4% smaller than among Mexican Americans, Puerto Ricans have pro-portionately fewer high school graduates (27% compared to 28%among Mexican Americans) and fewer college graduates (2.2% comparedto 2.5%).
In states outside of New York, Puerto Rican men are even lesswell educated. In Connecticut, Illinois, and New Jersey, medianschooling for Puerto Rican men is less than nine years. Overhalf the men have not gone beyond the eighth grade, and the pro-portion of high school graduates ranges from 18% (Illinois) to22% (New Jersey).
The proportion of Puerto Rican male college graduates isminiscule in all the states. It is lowest in New York (1.4% ofall men) and highest in Illinois (2.1%).
00.:10

- 51
Mexican American Females
Educational accomplishments of the Mexican American femalepopulation are even lower than for the men. However, theMexican American males are doing so poorly that the levelsreached by the females are only slightly lower than thosereached by the men.
The median educational attainment of the Mexican Americanfemale (9.1 years) is three years behind that for the entirefemale population (12.1), but only 0.3 years behind that forthe Mexican American male. Almost half of all Mexican Americanwomen 16 years old and over did not go beyond the eighth grade.In comparison, only a quarter of all women in the United Stateshave not gone beyond the eighth grade.
The proportion of women in the total population who havegraduated from high school (55%) is greater than the propor-tion of men who have. But the proportion of Mexican Americanwomen who have graduated from high school, at 26%, is2% less than the proportion of Mexican American men whohave graduated from high school. The proportion of femaleMexican Americans who have graduated from college is evenless. Of all Mexican American women,only 1.4% are collegegraduates. In the total population, the proportion of femalecollege graduates is 5.5 times greater.
Mexican American women living in rural areas are farless educated than tneir urban counterparts. Rural MexicanAmerican women have a higher median schooling, however,than males living in rural areas (7.9 years compared to7.6 years). Of Mexican American women living in rural areas,61% have had eight or fewer years of school. In contrast,49% of the total female Mexican American population and onlya quarter of the nation's total female population have hadso little education.
The educational levels attained by the Mexican Americanwomen living in Texas are equally low. There, the medianyears of schooling is only 7.7.
Puerto Rican Females
The Puerto Rican population is basically an urban popula-tion whose various _rcial (including educational) characteristicsare affected little by the rural variances which affect theMexican American population. Despite this difference, however,
0081

- 52
the educational profile of the Puerto Rican women is almostidentical to that of the Mexican American female. Educationalachievement is extremely low compared to that of the womenin the total U.S. population. For example, the median yearsof schooling attained by the Puerto Rican women is only 9.3years, 0.2 years more than that attained by the Mexican Americanwomen and 0.4 years less than the median for the Puerto Rican men.
Of all Puerto Rican women, 48% have no- attended schoolbeyond the elementary level. The Mexican American women havean equally large share of poorly educated women (49%). Theproportion of Mexican American women with little schooling is2% greater than among Mexican American men while the proportionof Puerto Rican women completing eight or less years of school is5% greater than the rate among Puerto Rican men.
Mexican American and Puerto Rican women share the same propor-tion of high school graduates (26%) and nearly the same propor-tion of college graduates, 1.4% and 1.7% respectively. In contrast,55% of women in total population have graduated from high school,and 7.8% of all women are college graduates.
As in the case of Puerto Rican men, Puerto Rican women are evenless well educated in states outside of New York. The medianyears of schooling achieved by women as well as by men inConnecticut, Illinois, and New Jersey is less than nine years,and only a fifth of the population in,these states (both male andfemale) have completed high school.
Vocational Training
With the low level of education attained by many in theSpanish populations,a major increase in educational opportu-nities,including opportunities for vocational training,isclearly an important need. The provision of such trainingprobably would make a major lifference in the e-ventual earningcapacity of Spanish Origin peoples. Without such training,they are likely to be relegated to employment only in jobsrequiring the lowest of skills. At a further disadvantage due tolanguage barriers, training that would include English languageinstruction would be essential for many.
The prnoortion of Mexican Americans and Puerto Ricans whocurrently have completed a vocational training program (16%of all persons 16-64 years ,./f age with less than 3 years ofcollege education) falls far short of the proportion who havecompleted such training in the total population (25%) (seeTable D-2).
0 '3 8

- 53
Table D-2
Vocational Training Completed by
Persons 16-64 Years Old with
Less Than 3 Years College
Mexican Americans*
U.S. Total:* 25%
Puerto Ricans*
Total: 16% Total: 16%
Rural: 10% Illinois: 15%
California: 18% New York: 15%
Colorado: 17% New Jersey: 13%
Arizona: 16%
Illinois: 16%
New Mexico: 14%
Texas: _14%
* Males and Females Combined
Source: U.S. Bureau of the Census, 1970 Census of Population,Subject Reports: Vocational Training, PC(2)-5C
Persons of Spanish Origin, PC(2)-1C
008o

- 54
The rates are lower still in certain local areas.For Mexican Americans in rural areas, for example, only10% of all adults without a college education have hadany vocational training. Such programs simply are notaccessible to the rural populations. In the states ofNew Mexico and Texas, only 14% of the Mexican Americanpopulation have completed such programs.
Among Puerto Ricans, New Jersey has the lowest per-centage of persons. without a college education who havecompleted vocational training (13%).
Enrollment in School
3-4 Years Olds
Currently, the nation 1 rate of preschool enrollment byMexican American and Puerto Rican 3-4 year olds is up to therate of the rest of the U.S. population (14%) (see TableD-1). However, the need for preschool services for youngchildren in both Spanish Origin subgroups is greater thanthat of the total population. In a preschool program,the young Spanish Origin child begins adjusting to the biculturaland bilingual world in which he/she is likely to live through-out his/her life. In preschool, the Mexican American andPuerto Rican child who, until then, may have known onlySpanish, can more easily master the English language.
Currently, the proportion of Mexican American and PuertoRican women who are in the work force is among the lowest of allethnic groups. To give more of these women, particularly thosewho are mothers of young children, the opportunity to work outsideof their homes and thus contribute to their family incomes, moreMexican American and Puerto Rican preschoolers should have thechance to enroll in preschool programs. Children who are lessthan six years old are found in 43% of all Mexican American familiesand 45% of all Puerto Rican families.
The rate of preschool enrollment by Mexican American 3-4year olds in most states is lower than the national average of 14%.In Texas and New Mexico, only 11% of the Mexican American3-4 year olds are in any type of preschool program, 3%lower than the national average both for the total popu-lation and for Mexican Americans. The enrollment rates ofyoung Mexican American children in Arizona, Illinois, andall rural areas is only 12%. Indeed, only in California(17%) and Colorado (a very high 22%) are the childrenenrolled at rates higher than the U.S. national average.
f
0584

- 55
For Puerto Ricans, the need for preschool services for3-4 year old children is also acute. Most Puerto Rican familieshave arrived on the mainland only recently and appear to useSpanish in the homes to a greater extent than do Mexican Americans.Nearly half of Puerto Rican families have children who are lessthan six years of age. A quarter of all Puerto Rican familiesare female-headed and half of these also contain children undersix.
Yet,.outside of New York State, the enrollment rates of3-4 year old Puerto Rican children fall below the nationalaverage. In Connecticut and Illinois, only 12% of the childrenare in a preschool program, and in New Jersey, only 13% are.Although the rate of enrollment in New York (15%) is above thenational rate, given the high proportion of female-headed families(where the female head of family and mother has majorresponsibility to support her family), Puerto Ricans arestill underserved.
Elementary and High School Enrollment
14-17 Year Olds
While in most states education is not compulsory beyond16 years of age, the majority of young people remain in schoolto complete their high school education. In the total U.S. popu-lation, 93% of all males and 92% of all females between 14and 17 years old are enrolled in school. Among the Spanish,however, the rate of high school enrollment lags (see Chart D-b).Fewer young people are staying in school to complete high school,indicating that the spiral of poverty that results from aninadequate education, low job skills, and resultant low incomespromises to continue.
In the Mexican American population, 86% of 14-17 year oldmales and 83% of 14-17 year old females are in school, rates thatare 7% and 9% below the national average. The fact that thedifferential is greater for females indicates that, not only areMexican Americans dropping out of high school at a greater ratethan is the rest of the population, but also that girls areleaving school at a greater rate than are boys.
0 08o

Chart D-b
93%
92%
1
4
- 56
Persons enrolled in school, 14-17
and 18-24 years of age, by sex, for
selected groups
iii iiiiI14-17 years olds 18-7:-; years old
11111111 i IlliiiIrli 111111138%27%I
1 I
86111111111111111111111 111111411
83% 8%
I I i IRICANS
n/4161111146170%
III Males- Females
1
1113%10%
X
100% 0(% OF TOTAL)
Source: U.S. Bureau of the Census, 1970 Census of Population,General Social and Economic Characteristics, UnitedStates Summary, PC(1)-C1Subject Reports: Persons of Spanish Origin, PC(2)-1C
U 0 8 k)
100%

- 57
The enrollment rate of Puerto Rican teenagers is much lower.Only 72% of all Puerto Rican males and 70% of Puerto Ricanfemales 14-17 years old are still enrolled in school, 21%and 22% below the averages for the total population. No otherpopulation group has as serious a drop-out rate. The economicdisadvantage which the drop-out faces is made more clear byfigures showing that 45% of all Puerto Rican male youths 16-24years old in this country who left high school prior to gradua-tion are without a job.
Such data suggest that greater efforts must be made toencourage Spanish Origin youths to remain in school or, if theyleave, to provide them with sufficient supportive training andservices to enable them to prepare for employment.
18-24 Year Olds
With high school enrollment by Spanish Origin youths laggingbehind the rate of enrollment by young people in the total popu-lation, rates of college and other pnstsecondary_school enroll-ment fall behind total population lutes even further.
Nationally, 38% of all men 18-24 years old are enrolled inschool. A quarter of Mexican American men are enrolled; this is13% lower. In the Puerto Rican population, the rates are lowerstill. Only 13% of the males are enrolled, a rate nearly two-thirds less than that of the total population. Such a lowrate promises to prevent any significant proportion of thePuerto Rican population from obtaining advanced professionaleducation leading to higher status professional careers essen-tial in providing service to Puerto Rican communities.
Of all 18-24 year old women in the United States, 27% areenrolled in school--most of them in college. The MexicanAmerican females fall well below that rate with only 18%enrolled in school.
The enrollment rate of the Puerto Rican females is the lowestof all. Only 10% of the female Puerto Rican population who are18-24 years old are enrolled in any kind of postsecondaryeducational program.
0081

- 58
Mother Tongue and Language Usually Spoken at Home
The greatest disadvantage suffered by a large portion ofthe Spanish Origin populations is their inabilityto use English. Because of this, many young people areunable to remain in school and obtain an education. In thelabor force, the inability to use English restricts persons tolow-skilled menial occupations.
In 1969, 72% of all Mexican Americans and 83% of all PuertoRicans reported that they spoke Spanish in their homes when theywere children (mother tongue). The majority of these personscontinue to use Spanish in the home; 47% of Mexican Americansand 72% of Puerto Ricans reported speaking Spanish at home(see Table D-3). Among those born in the country of origin,the use of Spanish, expectedly, is much higher. Among MexicanAmericans who were born in Mexico, 75% still speak Spanish intheir hom( and of Puerto Ricans born in Puerto Rico, 82%speak Span...a in their homes
The proportion of Mexican Americans and Puerto Ricansspeaking Spanish, by age, for the year 1971 1/ is reportedin Table D-4. In both populations, the percentage still usingSpanish in the home is highest among older persons 55 years oldand over. Young adults in their twenties use Spanish the least.
Among both Mexican American and Puerto Rican children andteenagers, the proportion using Spanish is considerably higher.Although many of these young people were born in the United Statesthey are still speaking Spanish with their parents and their peers.At the critical ages, 14 to 19 years old, the proportions of youngpersons speaking Spanish in both the Mexican American (75%) and thePuerto Rican (91%) groups are highest, except for the elderly.This has important implications because, for part of this age group,education is no longer mandatory and unless educational programsare responsive to the difficulties that the young persons inthis age group have with the English language, they are likely todrop out of school at this juncture.
Currently, the educational levels attained by Mexican Americansand Puerto Ricans who speak Spanish in their homes are far lowerthan the educational levels attained by the more assim....nted whospeak English (see Table D-5). Some 90% of both the Moxi':anAmericans and the Puerto Ricans who did not complete elementaryschool speak Spanish in their homes. If more educational programscould be developed bilingually/and if more supplementary Englishlanguage instruction programs could be provided, it would probablyreduce the barriers that currently exist for these populations andenable more persons of Spanish Origin to achieve a level ofeducation comparable to the rest of the population in this country.
TrThere is 'considerable discrepancy between 1969 and 1971Uata. In 1969, 47% of Mexican Americans reported speak.ingSpanish at home while in 1971, 71% did. In 1969, 72% of thePuerto Ricans reported speaking Spanish, while in 1971, 85% did.
0 0 8 (5

Table D-3
Language Usage and Mother Tongue of
Mexican Americans and Puerto Ricans: 1969
MexicanAmericans
Born inMexico
PuertoRicans
Born inPuerto Rico
- 59
% With SpanishMother Tongue
% With Spanishas LanguageUsually Spokenat Homewas
72% 47%
94 75
83% 72%
96 82 I
Source: U.S. Bureau of the Census, Current Population Reports,Persons of Spanish Origin in the United States:November 1q69, Series P-20, No.213.
0081)
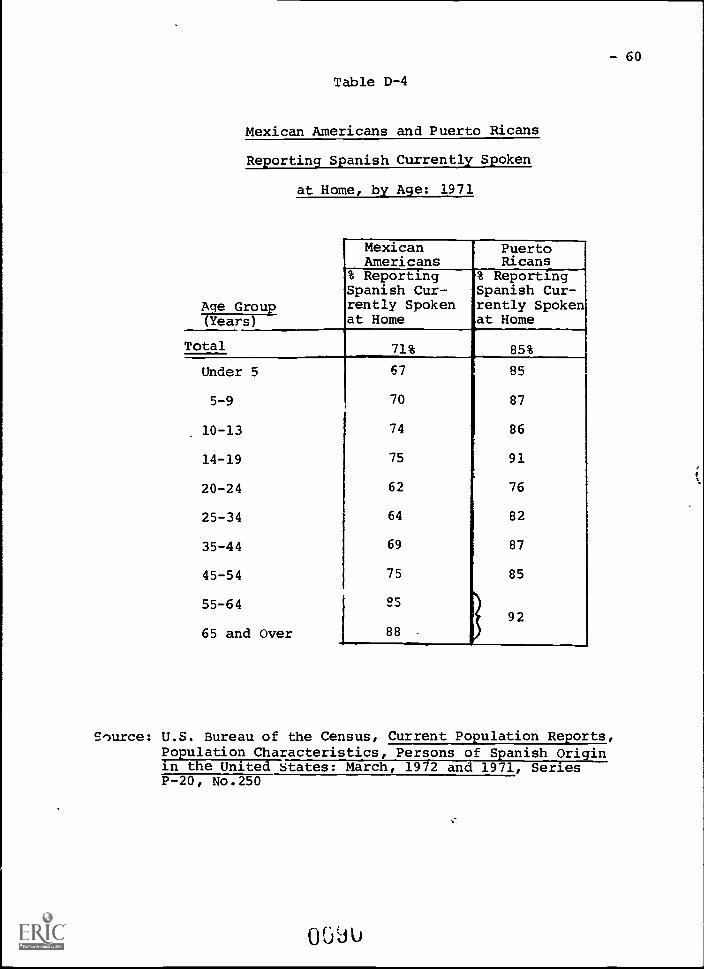
Table D-4
Mexican Americans and Puerto Ricans
Reporting Spanish Currently Spoken
at Home, by Age: 1971
Age Group(Years)
Total
Under 5
5-9
10-13
14-19
20-24
25-34
35-44
45-54
55-64
65 and Over
MexicanAmericans
PuertoRicans
% ReportingSpanish Cur-rently Spokenat Home
% ReportingSpanish Cur-rently Spokenat Home
71% 85%
67 85
70 87
74 86
75 91
62 76
64 82
69 87
75 85
05
9288 -
-60
Source: U.S. Bureau of the Census, Current Population Reports,Population Characteristics, Persons of Spanish Originin the United States: March, 1972 and 1971, SeriesP-20, No.250

Table D-5
Years' of School Completed by Mexican Americans
and Puerto Ricans 14 Years Old and Over and
Language
'Spoken at Home:
1971
Mexican Americans
Puerto Ricans
Years of School
Completed
% Reporting
Spanish Currently
Spoken at Home
% Reporting
Spanish Currently
Spoken at Home
Elementary School
938
93%
0-4 years
-5-7 years
89
93
8 years
73
89
High School
(.,, 64
78
1-3 years
4 years
50
73
College
47
74
1-3 years
4 or more
years
48
64
Source: U.S. Bureau of the Census, Current Population
Reports, Persons of
Spanish Origin in the United States: March 1972 and
1971,
Series P-20, No. 250, April 1973.

- 62
III. E. EMPLOYMENT CHARACTERISTICS
Statistics on employment status and occupations of MexicanAmericans and Puerto Ricans are present. d in Table E-1.
Employment Status - Males
The 1970 Census clearly indicates that, contrary to stereo-type, the Spanish Speaking are a hard-working people. 77% ofthe Mexican American and 76% of the Puerto Rican men are inthe labor force--virtually the same as for the total malepopulation in the U.S. The labor force participation ratefor men has remained consistently high over the years, asindicated in previous Census reports.
Rates vary by locale. For example, the labor force participationrate for rural Mexican American males drops 4% from total figures.Migrant workers are frequently out of the labor force during theoff-season when the Census is taken. A comparison of weeks workedby Mexican American males shows that,nationally,the proportion ofmen who worked a full year (50-52 weeks) is 4% higher among allMexican American men than among the rural Mexican American men.The 4% -differential is probably composed of those Mexican Americanfarm workers who, because of the seasonal nature of their jobs,worked less than full-time.
The lowest rates of labor force narticipation are found inColorado and New Mexico, states which have the largest proportions ofrural populations (37% and 21% respectively), while the highestrates for the Mexican Americans are in Arizona (78%), California(79%), and Illinois (85%).
For Puerto Ricans, labor force participation rates alsovary considerably by local area. Their lowest participationis found in New York State (72%), and the highest in Illinoisand New Jersey (84% in both states, far surpassing the ratefor Puerto Ricans nationally).
Although the labor force participation rates of MexicianAmerican and Puerto Rican men are close to that for all menin the country, their rate of unemployment is far higher.About 6% of all Mexican American men and 5.6% of all PuertoRican men in the labor force are unemployed, compared to only3.9% for all men.
The unemployment rates, however, vary according to geo-graphic area. For example, in Caliifornia and Colorado, unem-ployment for the Mexican Americans is at 7.1% and 8.0% re-spectively. Among Puerto Ricans, unemployment is particularlyhigh in the State of Connecticut (7.3%).
0094

Table E-1
Employment Characteristics of the U.S. Total and Mexican Americanand
Puerto Rican Origin Populations, 1970
Employment Status
(16 years old and over)
% in Labor Force
Male
Female
% Unemployed
Male
Female
Mexican Americans
U.
rotal Total 'Rural 'Ariz. I Calif. Colo. In.
77%,
41 3.9
5.1
77%
3%
36 6.1
8.9
28 6.4
9,8
78%
34
79%
38
5.7
7.1
6.6 10.7
72%
32 8.0
9.7
85%
45 4.1
7.2
Puerto Ricans
N.Mex.Texas
Total
Conn.
111.
N.J.
N.Y.
72%
30 5.6
9.8
75%
34 5.1
6.8
76%
32 5.6
8.7
81%
35
84%
43
7.3
4.9
9.4
11.1
84%
36 5.7
11.2
72%
29 5.5
7.9
Major Occupations
Professional &
Tech. Workers
O CDManagers &
Administrators
C.10
Male
FPmaIP
14.3 15.3
16
6.4
3.0
7.0
5.0
6.3
5.1
5.5
6.7
6.7
3.8
4.4
8.4
74
4.6
6_8
4.7
7.1
4.2
4.3
2.2
4.5
5.5
4.4
4.1
6.4
Male
Female
Sales Workers
Male
Female
Clerical Workers
Male
Female
Craftsmen, Foremen
& Kindred Worers Male
Female
11.2
14.0
3.6
6.91
7.4
1.9
3.2
5.7
2.6
1.9
1.6
4.4
4.0
1.7
3.4
6.0
7.6
5.8
2.2
4.6
35
21 1.8-
26
17
27
21
Operatives
Male
Female
Laborers, Except
Farm'
Male
Female
20
14
2726
14 1.5
20 1.4
3.5
1,6
2.8
4.9
6.0
27
21 2.2
3.8
2.0
3.6
5.6
5.4
25
18 1.9
2.1
0.6
2.0
4.8
5.3
2.0
3.1
4.8
6.9
5.1
27
_27
L8
20
2 2
Farr. Managers
and Laborers
Male
Female
service
Workers
Male
Female
6.6
13
1.0
1.7
713
16
15
14
14
1.1
1.4
2.3
2.0
1.6
4.5
9.8
1.0 10.5
7.2
0.9
0.8
4
20
26
111
10
10
13
g0
40
A5
144
10
14
lit?
11
8
Source:
U.S. Bureau of the Census, 1970 Census of Population
General Social and Econanic Characteristics,United States Sumery, PC (1) -C1
Detailed Characteristics, United States Samnary, PC(1)-D1
Subject Reports:
Persons of Spanish Origin, PC(2) -1C
Puerto Ricans in the United States, PC(2) -1E
5 229
"31
2616
2 7
41 4
19 0.9
4.8
2.2
4.0
7.3
5.6
24
23 2.6
22
12
24
20
11 1 9
1
40.6
14.5
4 1
5 5
0.9
1 .31
J.0.4
0 2
1.3
3
4.2
1.5
3.8
3.9
2.5
1.5
2.4
1.3
2.6
1.0
4.6
1.4
2.3
3.2
2.0
3.0
2.8
3.8
6.8
23
4.6
4.1
113,0.3
0
17 2.5
4.8
22
18 2.2
7.5
16
16 2.9
15 2.1
134
40
4652
51
51
44 55
12.t
34
17 2.6_
31
37
8
1.8
1.0
10.0
1.5
a, 0.3
9 1.0
2.6
1.0
634
7 1.9
0.3
12 9
10 1.4
3.3
10.2
kl 0
6 1.0
0.3
14
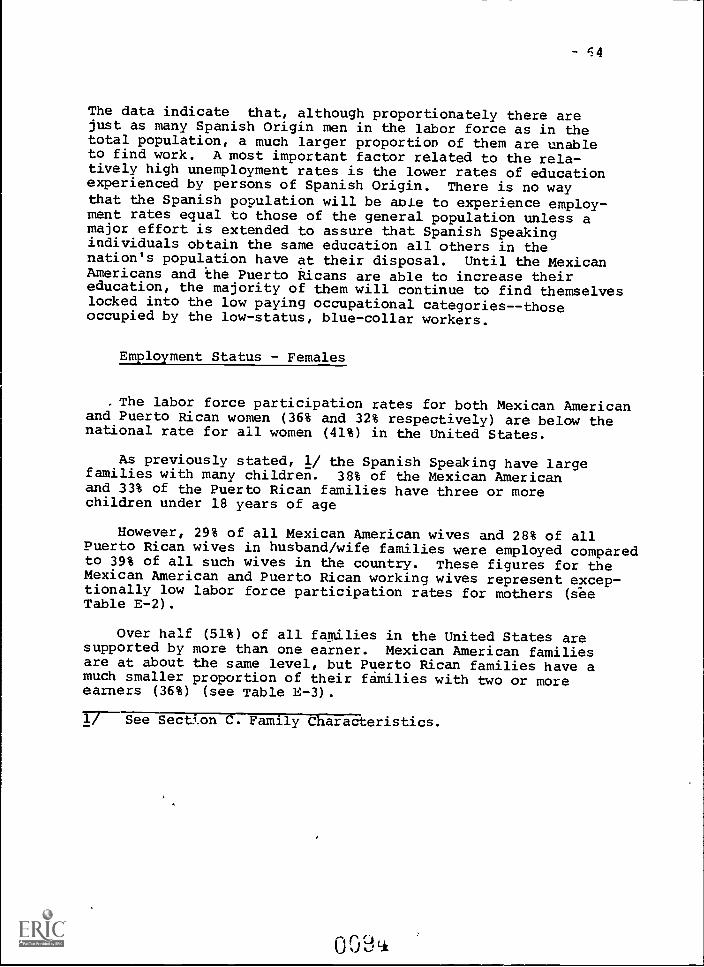
64
The data indicate that, although proportionately there arejust as many Spanish Origin men in the labor force as in thetotal population, a much larger proportion of them are unableto find work. A most important factor related to the rela-tively high unemployment rates is the lower rates of educationexperienced by persons of Spanish Origin. There is no waythat the Spanish population will be able to experience employ-ment rates equal to those of the general population unless amajor effort is extended to assure that Spanish Speakingindividuals obtain the same education all others in thenation's population have at their disposal. Until the MexicanAmericans and the Puerto Ricans are able to increase theireducation, the majority of them will continue to find themselveslocked into the low paying occupational categories--thoseoccupied by the low-status, blue-collar workers.
Employment Status - Females
. The labor force participation rates for both Mexican Americanand Puerto Rican women (36% and 32% respectively) are below thenational rate for all women (41%) in the United States.
As previously stated, 1/ the Spanish Speaking have largefamilies with many children. 38% of the Mexican Americanand 33% of the Puerto Rican families have three or morechildren under 18 years of age
However, 29% of all Mexican American wives and 28% of allPuerto Rican wives in husband/wife families were employed comparedto 39% of all such wives in the country. These figures for theMexican American and Puerto Rican working wives represent excep-tionally low labor force participation rates for mothers (seeTable E-2).
Over half (51%) of all families in the United States aresupported by more than one earner. Mexican American familiesare at about the same level, but Puerto Rican families have amuch smaller proportion of their families with two or moreearners (36%) (see Table U-3).
1/ See Section C. Family Characteristics.

- 65
Table E-2
Labor Force Participation of Spanish Origin
Wives and Female Heads
U.S.Total
Ail spanfiliTheTeicanOrigin s American
PuertoRican
gives in
'39% 35% 29% 28$
Husband-WifeFamilies
% inLaborForce
% withChildrenUnder 6 27 41 46 45
% withChildrenUnder 6in LaborForce 28 27 24 20
Female
56 44 43 24
-Heado ofTER-Iris
% inLaborForce
% withChildrenUnder 6 21 33 30 46
% withChildrenUnder 6in Labor
i Force 51 34 NA NA
* Includes Cuban Americans, ,entral and South Americans,and persons of other Spanish Origin,
Source: U.S. Bureau oc the Census, 1970 Census of the Population,General Social and Economic Characteristics,United States Summary, PC(fT-Cl.Subject Reports:persons of Spanish Origin, PC(2)-1C.
009i

- 66
Table E -3
Number of Earners Per Family:
by Selected Groups, 1969
Racial/Ethnic Group
Number of Earners Per Family
0 1 2 or More
Total---7- 9%U.S. 40% 51%
MexicanAmerican 8 42 50
PuertoRican 21 44 36
Source: U.S. Bureau of the Census, 1970 Census of Population,General Social and Economic: United States SummaryPC(1)-Cl; Subject Reports: Persons of Spanish Origin PC(2)-1C.
The employment status of Mexican American and Puerto Ricanwomen is made worse by the fact that 9% of both the MexicanAmerican and Puerto Rican women are unemployed; unemploymentfor both groups of females is higher than for all women inthe United States. Thus, the actual number of Spanishwomen who are employed is even smaller than their lowerlabor force participation rates indicate; only 29% of allPuerto Rican women and 33% of all Mexican American womenare working, while 39% of all women in the U.S. are employed.The fact that such a high percentage of Mexican American andPuerto Rican women are seeking employment implies that, ifadditional jobs were available and if more Puerto Rican womenwere better trained for local job market conditions, more womenwould participate in the work force (see Chart E-a).
In most population groups, women who are heads of theirfamilies are in the labor force in greater proportions than thosewho are not. In the country as a whole, 39% of the wives inhusband/wife families work, while 56% of all female heads work.Among Mexican Americans, a similar relationship exists: 29%
009u


Chart E-a
LABOR FORCE AND UNEMPLOYMENT RATES FOR MEXICAN AMERICANS
AND PUERTO RICANS, 16 YEARS OF AGE AND OYER
Ill NOT II LABOR FORCE
UNEMPLOYED
EMPLOYED.' LABOR FORCE
Male Female Male Female Male Female
- 67
77%
9°/0
76%
41%
11%27%
U.S. Total
32%
23%
Mexican Puerto Ricans
Americans
100%
Source: U.S. Bureau of the Census, 1.'70 Census of Population,Subject Reports: Persons of Spanish Origin, PC(2)-1CGeneral Social and Economic Characteristics, United States Summary, PC(1)-C1
0091
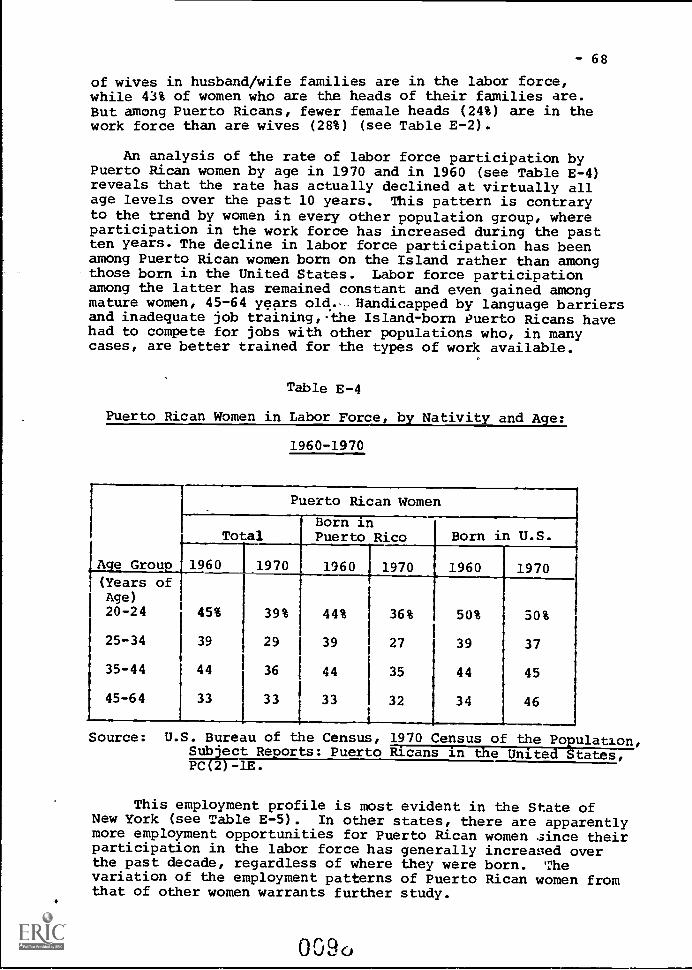
- 68
of wives in husband/wife families are in the labor force,while 43% of women who are the heads of their families are.But among Puerto Ricans, fewer female heads (24%) are in thework force than are wives (28%) (see Table E-2).
An analysis of the rate of labor force participation byPuerto Rican women by age in 1970 and in 1960 (see Table E-4)reveals that the rate has actually declined at virtually allage levels over the past 10 years. This pattern is contraryto the trend by women in every other population group, whereparticipation in the work force has increased during the pastten years. The decline in labor force participation has beenamong Puerto Rican women born on the Island rather than amongthose born in the United States. Labor force participationamong the latter has remained constant and even gained amongmature women, 45-64 years old.-- .Handicapped by language barriersand inadequate job training,-the Island-born Puerto Ricans havehad to compete for jobs with other populations who, in manycases, are better trained for the types of work available.
Table E-4
Puerto Rican Women in Labor Force, by Nativity and Age:
1960-1970
Puerto Rican Women
TotalBorn inPuerto Rico Born in U.S.
Age Group 1960 1970 1960 1970 1960 1970(Years ofAge)20-24 45% 39% 44% 36% 50% 50%
25-34 39 29 39 27 39 37
35-44 44 36 44 35 44 45
45-64 33 33 33 32 34 46
Source: U.S. Bureau of the Census, 1970 Census of the Population,Subject Reports: Puerto Ricans in the United States,PC(2)-1E.
This employment profile is most evident in the State ofNew York (see Table E-5). In other states, there are apparentlymore employment opportunities for Puerto Rican women since theirparticipation in the labor force has generally increased overthe past decade, regardless of where they were born. Thevariation of the employment patterns of Puerto Rican women fromthat of other women warrants further study.
0090

-69
Table E-5
Percent Puerto Rican Women in Labor Force,
By Nativity and Age, for
Selected States: 1960-1970
..----New York Illinois New Jersey
.------1970 1970 1970
% of all % of all % of allWomen Women WomenBorn in Born in Born in
Age Group 1960 Total U.S. 1960 Total U.S. 1960 Total U.S.
(Years ofAge)
20-24 48% 36t 24% 40% 48% 7% 42% 43% 12%
25-34 41 25 12 37 38 5 39 34 8
35-44 46 33 10 38 46 4 43 45 10
45-64 34 32 4 21 31 3 30 35 7
Source: U.S. Bureau of the Census, 1960 Census of thePopulation, Special Reports: Puerto Ricansin the United States, PC(2)-1D.
U.S. Bureau of the Census, 1970 Census of thePopulation, Special Reports: Puerto Ricansin the United States PC(2)-1E.
In local areas, variations in rates of labor participationand unemployment by women parallel those of Spanish Origin males.As with males, the rates of labor force participation are highestfor both Mexican American and Puerto Rican women in the Stateof Illinois (45% and 43% respectively). Among Mexican Americans,the rate in California (38%) is high also, as is the rate ofunemployment (almost 11%). Mexican American women in ruralareas and Puerto Rican women in New York State have the lowestproportion in the work force.
Besides a high near 11% in California, unemployment forMexican American women is at a high level, near 10%, in ruralareas as well as in the States of Colorado and New Mexico.It is over 11% for Puerto Rican women in Illinois and NewJersey.
° ° 9

-70Occupations
Mexican American Males
The proportion of Mexican American men employed in high'status, professional and managerial occupations is extremelylow. In the total population, one of every four or just over25% of all males are employed in such occupations; only one ofevery eleven Mexican American males (9%) is employed in highstatus positions (see Chart E-b). These figures reflect theeducational disadvantage with which the Mexican American menenter the labor force.
While the proportion of Mexican American men who are inthe skilled blue-collar occupations (21%), equals the nationalfigures for the U.S. male population, the proportion of MexicanAmerican men who are employed in the low-skilled, labor occu-pations is extremely high (23%),.in comparison to the nationalfigure of 11%.
Although the Mexican American is stereotyped as a farmworker, only one of every ten Mexican American men is employedas a farm manager or farm laborer.
The percentage distribution of Mexican American men in thevarious broad occupational categories varies with local labormarket conditions. Of Mexican Americans living in rural areas,41% are employed in farm-related work.
In Texas, the ratio of Mexican American semi-skilled, blue-collar workers (24%) and skilled ones (23%) is virtually one-to-one, while a very sharp difference occurs among Mexican American
.working men in Illinois, where 18% are in the higher skilledtrades and a very high, 41%, are in the semi-skilled trades, aratio of 1:2.3.
Puerto Rican Males
The proportion of Puerto Rican men employed in higher statusprofessional and managerial occupations is the same as amongMexican American men, one in ten, compared to one in four forall males in the total population. As with Mexican Americans,Puerto Ricans are burdened by serious educational deprivationand language barriers that prevent a significant proportion oftheir population from achieving the education necessary forhigher status white-collar employment.
0100
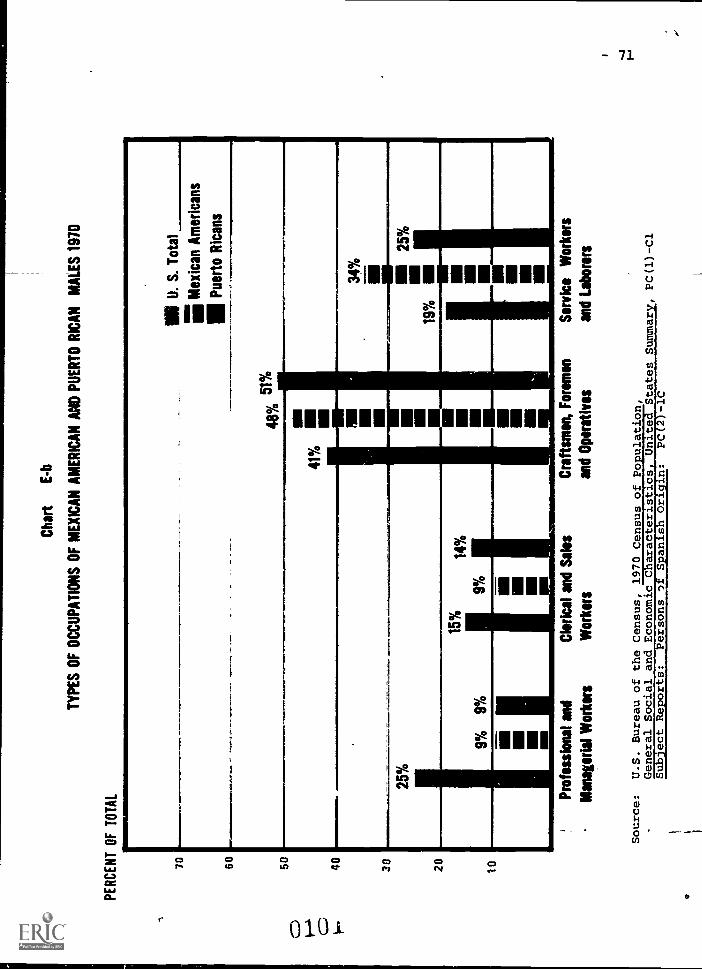
PE
RC
EN
T O
F T
OT
AL
70 60 50CD
40
30 20 10
Cha
rtE
-b
TY
PE
S O
F O
CC
UP
AT
ION
S O
F M
EX
ICA
N A
ME
RIC
AN
AN
D P
UE
RT
O R
ICA
N M
ALE
S 1
970
* U
. S. T
otal
mi
Mex
ican
Pue
rto
Am
eric
ans
Ric
ans
48%
51%
MM
IWT
V.I
IT a
iiii.1
-1r0
,1*-
Tr7
UT
PIT
41%
so PIM
34% a
25%
19%
25%
15%
9% 9
%9%
14%
MI
=I
owE
l
Pro
fess
iona
l and
Man
ager
ial W
orke
rs
Cle
rical
and
Sal
es
Wor
kers
Cra
ftsm
en, F
orem
en
and
Ope
rativ
es
Ser
vice
Wor
kers
and
Labo
rers
Source:
U.S. Bureau of the Census, 1970 Census of Population,
General Social and Economic Characteristics, United States Summary, PC(1)-C1
Subject Reports:
Persons
Spanish Origin:
PC(2)-1C

- 72
However, the percentage of Puerto Rican men in lowerstatus, white-collar employment (sales and clerical workers)is only 1% less than for all working men in the country (15%),while only 9% of all Mexican American men are employed inthese occupations. The higher proportion of Puerto Rican menso employed is in part a reflection of the.labor market in theNortheast, where most of the Puerto Rican population is located.
Just over half of all Puerto Rican males are employedin skilled and semi-skilled, blue-collar occupations, with twiceas many in the semi-skilled occupations (34%) as in the skilledones (17%). In contrast, thc:re are the same number of menin the total population employed in the skilled, blue-collarjobs (21%) as in the semi-skilled ones (20%). More vocationaltraining is clearly needed to enable greater numbers of PuertoRicans to enter the more skilled jobs.
A quarter of all Puerto Rican men are employed in the pri-marily low-skilled occupations as laborers and service workers.This is 8% greater than the proportion in the total U.S. malepopulation employed in the same occupational categories.
Locally, the proportions of Puerto Ricans in professionaland managerial occupations is particularly low in Illinois(4.6%), as it is for Mexican American males (5.9%). In NewYork State, over 17% of all male Puerto Rican workers are inlow-skilled, white-collar occupations, while in nearby Connecticut,only 7% are so employed.
The imbalance of skilled and semi-skilled, blue-collarworkers among Puerto Ricans is particularly marked in Illinoisand New Jersey. In both these states, there are three timesas many Puerto Rican males working in semi-skilled occupationsas there are working in skilled occupation (51% to 16% inIllinois and 44% to 15% in New Jersey). There are twice asmany Puerto Rican service workers, proportionally, in New YorkState as there are in Connecticut,_ New Jersey, and Illinois.
Mexican American Females
The low education rates of the Mexican American femalesare further reflected in their employment status by occupationalcategory. The proportion of the total U.S. female populationemployed in professional and managerial occupations (20%) istwo and one-half times greater than the proportion of MexicanAmerican women so employed. Without improving her educationalstatus, the Mexican American female cannot hope to lift herselffrom the low status occupations.
o
0.4
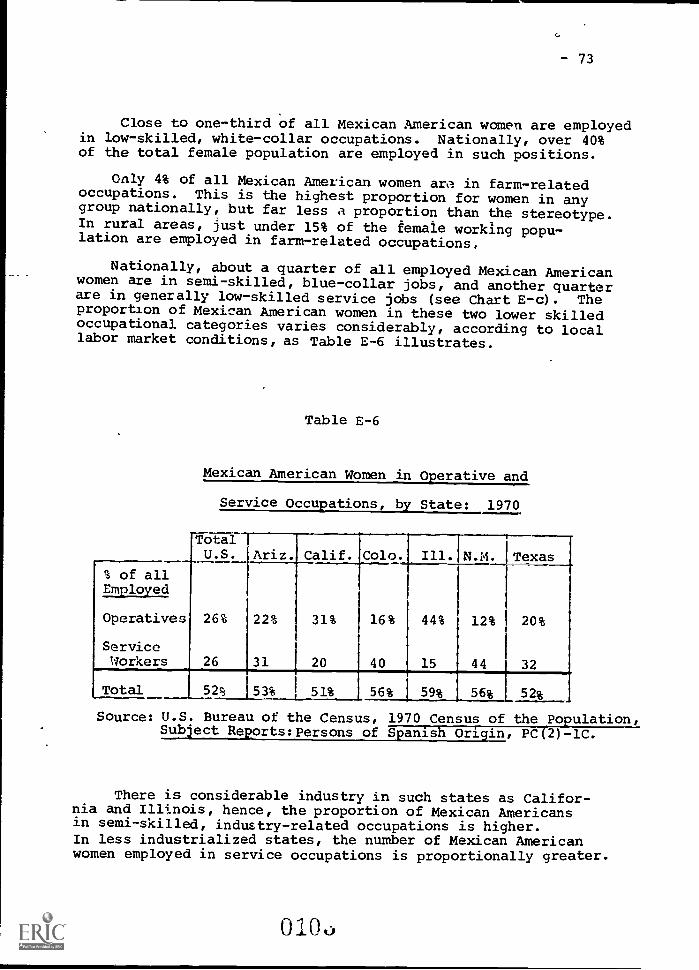
- 73
Close to one-third of all Mexican American women are employedin low-skilled, white-collar occupations. Nationally, over 40%of the total female population are employed in such positions.
Only 4% of all Mexican American women ar in farm-relatedoccupations. This is the highest proportion for women in anygroup nationally, but far less a proportion than the stereotype.In rural areas, just under 15% of the female working popu-lation are employed in farm-related occupations
Nationally, about a quarter of all employed Mexican Americanwomen are in semi-skilled, blue-collar jobs, and another quarterare in generally low-skilled service jobs (see Chart E-c). Theproportion of Mexican American women in these two lower skilledoccupational categories varies considerably, according to locallabor market conditions, as Table E-6 illustrates.
Table E-6
Mexican American Women in Operative and
Service Occupations, by State: 1970
TotalU.S. Ariz. Calif. Colo. Ill. N.M. Texas
% of allEmployed
Operatives 26% 22% 31% 16% 44% 12% 20%
ServiceWorkers 26 31 20 40 15 44 32
Total 52; 53% 51% 56% 1 59% 56% 52%
Source: U.S. Bureau of the Census, 1970 Census of the Population,Subject Reports:Persons of Spanish Origin, PC(2)-1C.
There is considerable industry in such states as Califor-nia and Illinois, hence, the proportion of Mexican Americansin semi-skilled, industry-related occupations is higher.In less industrialized states, the number of Mexican Americanwomen employed in service occupations is proportionally greater.
0 0 1. 1

PERCENT OF
TOTAL 40 30
20
Cha
rtE
-c
TY
PE
S O
F O
CC
UP
AT
ION
S O
F M
EX
ICA
N A
ME
RIC
AN
AN
D P
UE
RT
O R
ICA
NF
EM
ALE
S: 1
970
U. S
. Tot
al
a M
exic
an A
mer
ican
s
1111
Pue
rto
Ric
ans
os
42%
43%
1mi
1111
1111
34%
32%
1111
28%
fit
32%
20%
1M -MI
M-
OM
1111NI
16%
III1M
1111
NI
IIII
IIIM
MI
MM
1111
-87
.- -
9%--
---
--W
-M IMM
I
MI
INMI
MI li
NI
IM MNI
IPP
rofe
ssio
nal a
ndC
leric
alan
d S
ales
Cra
ftsm
en, F
orem
enM
anag
eria
l Wor
kers
Wor
kers
and
Ope
rativ
es
22%
*Includes farm-related occupations.
Source:
U.S. Bureau of the Census, 1970 Census of Population,
General Social and Economic Characteristics, United States Summary, PC(1)-C1
Subject Reports:
Persons of Spanish Origin, PC(2)-1G

75
Puerto Rican Females
As it is for Puerto Li ca;, males, the largest singleemployment category for Puerto Rican females in the UnitedStates is as semi-skilled or.catives. Two out of everyfive Puerto Rican women work n this occupation. The highconcentration is related to the highly industrialized natureof the Northeast and the Midwest, where Puerto Ricans areprimarily concentrated. Only 14% og all women in the U.S.are employed in this occupational area.
Another 34% of Puerto Rican women are employed as white-collar, clerical and sales workers. This is less than theproportion among women in the total population, but closeenough to national levels to indicate that economic mobilityfrom blue-collar to white-collar jobs on the part of thePuerto Rican female population is influenced by the con-centration of Puerto Ricans in the Northeast which, as thebusiness and commercial center of the country, offers anabundance of clerical jobs.
Only about 9% of all Puerto Rican women are in pro-fessional and managerial occupations. This is the samepercentage as among Puerto Rican men and one-half thepercentage found among all women in the population.
Despite low educational attainments, only 14% of PuertoRican women are employed in the low-skilled service occupations- -6% less than the proportion among all women in the UnitedStates and half the proportion in the Mexican American femalepopulation. As noted earlier, in areas where other minoritiespredominate in the service occupations, the proportion ofSpanish so employed decreases. Women who are unable to obtainemployment in more skilled occupations, by virtue of theirpoor educational backgrounds and language difficulties, stayout of the labor force entirely.
In local areas, the high concentration of commercial andbusiness-related jobs in New York is evident, as 38% of allPuerto Rican women in that state are employed in sales andclerical occupations, compared to 32% of Puerto Rican womennationally.
In other states, well over half of the Puerto Ricanwomen are employed as operatives (52% in Connecticut, 55%in New Jersey, and a very high 61% in Illinois).
0100
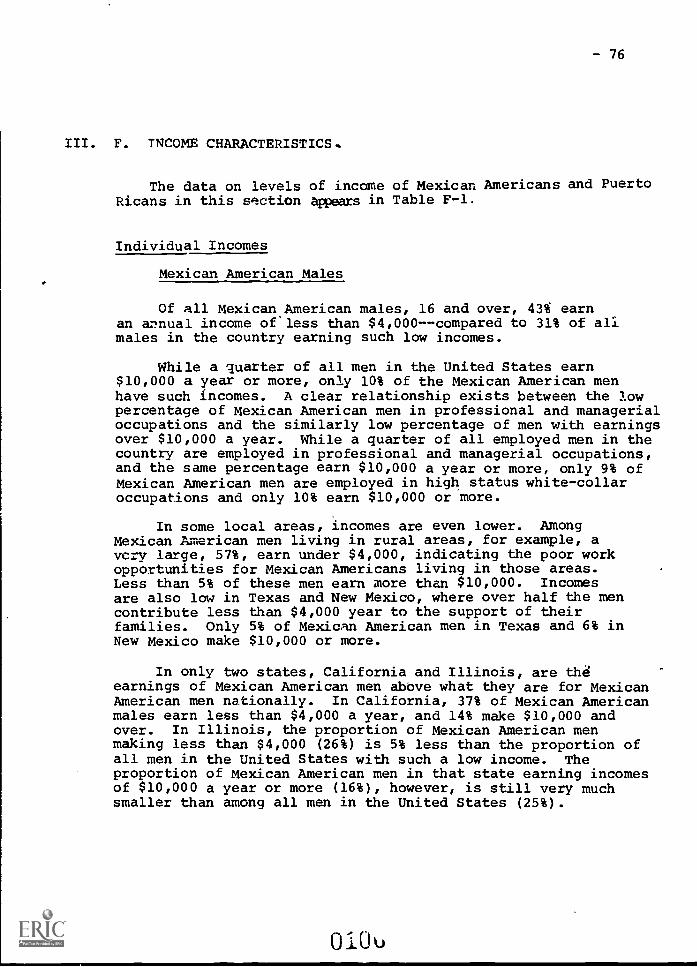
- 76
III. F. INCOME CHARACTERISTICS.
The data on levels of income of Mexican Americans and PuertoRicans in this section appears in Table F-1.
Individual Incomes
Mexican American Males
Of all Mexican American males, 16 and over, 43i earnan annual income of less than $4,000--compared to 31% of allmales in the country earning such low incomes.
While a quarter of all men in the United States earn$10,000 a year or more, only 10% of the Mexican American menhave such incomes. A clear relationship exists between the lowpercentage of Mexican American men in professional and managerialoccupations and the similarly low percentage of men with earningsover $10,000 a year. While a quarter of all employed men in thecountry are employed in professional and managerial occupations,and the same percentage earn $10,000 a year or more, only 9% ofMexican American men are employed in high status white-collaroccupations and only 10% earn $10,000 or more.
In some local areas, incomes are even lower. AmongMexican American men living in rural areas, for example, avery large, 57%, earn under $4,000, indicating the poor workopportunities for Mexican Americans living in those areas.Less than 5% of these men earn more than $10,000. Incomesare also low in Texas and New Mexico, where over half the mencontribute less than $4,000 year to the support of theirfamilies. Only 5% of Mexican American men in Texas and 6% inNew Mexico make $10,000 or more.
In only two states, California and Illinois, are th4earnings of Mexican American men abbve what they are for MexicanAmerican men nationally. In California, 37% of Mexican Americanmales earn less than $4,000 a year, and 14% make $10,000 andover. In Illinois, the proportion of Mexican American menmaking less than $4,000 (26%) is 5% less than the proportion ofall men in the United States with such a low income. Theproportion of Mexican American men in that state earning incomesof $10,000 a year or more (16%), however, is still very muchsmaller than among all men in the United States (25%).
010u

Table F-1
Income Characteristics of the U.S. Total and Mexican American and Puerto RicanPopulations, 1970
lnygmuf
rexsons
% Under S4,006 Male
Female
% $10,000 & Over
Mnle
Female
Income of Families
S Under $4,000
t 410,000 & Over
Tian Income (dollars)
Income of Families
with Female Heads
t Under $4,000
% $10,000 & Ovei
Median Income (dollars)
Mexican Americans
_Puerto Ricans
.q
U.S.
total
'DotalRural
Ariz.
Calif.Colo.
Ill.
N.Max
Texas'Ibtal
Conn.
Ill.
1 N.J.
N.Y.
31%
43%
57%
41%
37%
45%
26%
50%
54%
34%
30%
29%
33%
33%
68
79
89
84
75
84
62
87
86
70
71
40
73
69
?5.2
10.1
4.9
7.8
13.6
6.5
15.8
5.9
4.7
7.6
6.9
7.0
7......627
3.2
1.0
0.5
0.7
1.3
0.4
1.0
0.8
0.5
1.3
0.8
0.7
0.6
14
15
25
35
23
18
26
11
35
35
28
24
20
25
31
47
27
15
25
34
22
r
16
16
22
23
27
22
19
9 590
62
5.174
7.082
8,050
,45
6,518
9,301
5,582,5,430
6,165
6,773
7,275,6,265
5,825
41%
57%
61%
61%
50%
68%
31%
72%
66%
65%
65%
61%
66%
65%
18.0
0.8
7.9
6.7
10.3
5.5
18.1
5,575
6.1
6.3
2,498 2,7813,229
5.9
8.1
3,035
13,2
3,438
5.0
3,115
5.4
3,266
4.962
.483
3,771
3,104
3,989
2,877
Source:
U.S. Bureau of the Census, 1970 Census of Pogalation
General Social and Etcncmic CharacteristicsUnidtatesS
PC(1)-C1
Detailed Characteristics, United States Summary, Pc(1)-ra
Subi
tect
Pers
onso
fsh
2)-1C
Puerto Ricans in tifeelnited States, PC(2)-1E
a
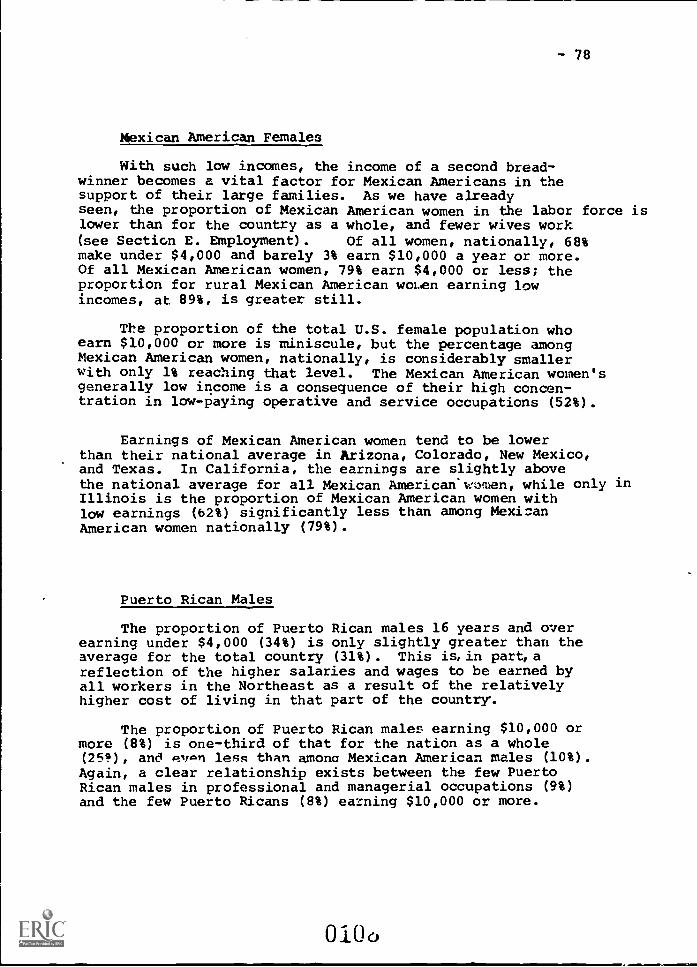
- 78
Mexican American Females
With such low incomes, the income of a second bread-winner becomes a vital factor for Mexican Americans in thesupport of their large families. As we have alreadyseen, the proportion of Mexican American women in the labor force islower than for the country as a whole, and fewer wives work(see Section E. Employment). Of all women, nationally, 68%make under $4,000 and barely 3% earn $10,000 a year or more.Of all Mexican American women, 79% earn $4,000 or less; theproportion for rural Mexican American woi.en earning lowincomes, at 89%, is greater still.
The proportion of the total U.S. female population whoearn $10,000 or more is miniscule, but the percentage amongMexican American women, nationally, is considerably smallerwith only 1% reaching that level. The Mexican American women'sgenerally low income is a consequence of their high concen-tration in low-paying operative and service occupations (52 %).
Earnings of Mexican American women tend to be lowerthan their national average in Arizona, Colorado, New Mexico,and Texas. In California, the earnings are slightly abovethe national average for all Mexican American'w;)men, while only inIllinois is the proportion of Mexican American women withlow earnings (62%) significantly less than among MexicanAmerican women nationally (79%).
Puerto Rican Males
The proportion of Puerto Rican males 16 years and overearning under $4,000 (34%) is only slightly greater than theaverage for the total country (31%). This is, in part,areflection of the higher salaries and wages to be earned byall workers in the Northeast as a result of the relativelyhigher cost of living in that part of the country.
The proportion of Puerto Rican males earning $10,000 ormore (8%) is one-third of that for the nation as a whole(25), and evc.n less than amona Mexican American males (10%).Again, a clear relationship exists between the few PuertoRican males in professional and managerial occupations (9%)and the few Puerto Ricans (8%) eaming $10,000 or more.
0100
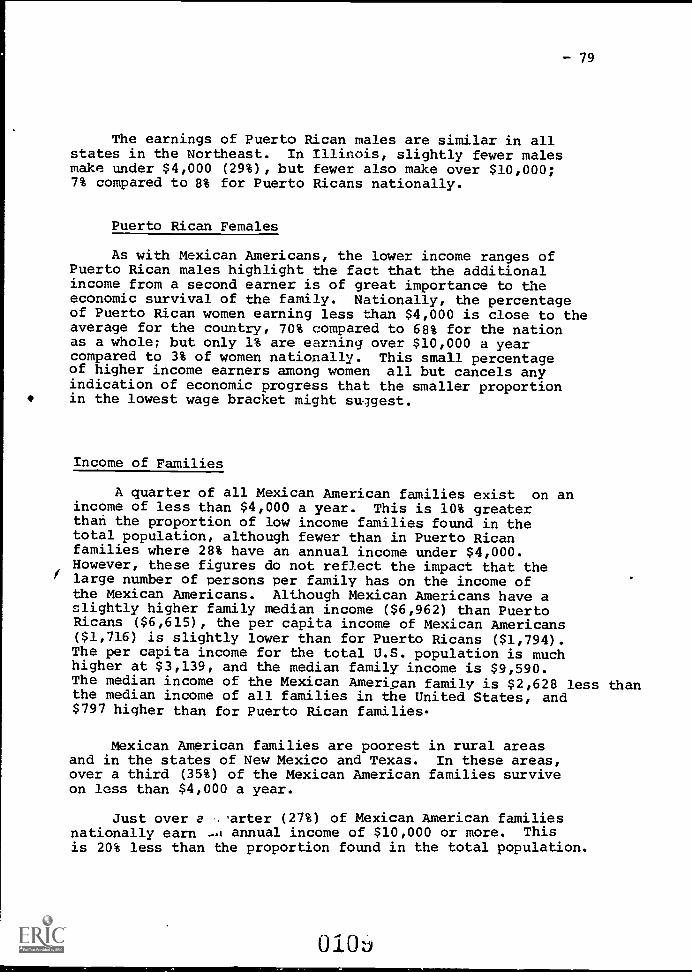
-79
The earnings of Puerto Rican males are similar in allstates in the Northeast. In Illinois, slightly fewer malesmake under $4,000 (29%), but fewer also make over $10,000;7% compared to 8% for Puerto Ricans nationally.
Puerto Rican Females
As with Mexican Americans, the lower income ranges ofPuerto Rican males highlight the fact that the additionalincome from a second earner is of great importance to theeconomic survival of the family. Nationally, the percentageof Puerto Rican women earning less than $4,000 is close to theaverage for the country, 70% compared to 68% for the nationas a whole; but only 1% are earning over $10,000 a yearcompared to 3% of women nationally. This small percentageof higher income earners among women all but cancels anyindication of economic progress that the smaller proportionin the lowest wage bracket might suggest.
Income of Families
A quarter of all Mexican American families exist on anincome of less than $4,000 a year. This is 10% greaterthan the proportion of low income families found in thetotal population, although fewer than in Puerto Ricanfamilies where 28% have an annual income under $4,000.However, these figures do not reflect the impact that thelarge number of persons per family has on the income ofthe Mexican Americans. Although Mexican Americans have aslightly higher family median income ($6,962) than PuertoRicans ($6,615), the per capita income of Mexican Americans($1,716) is slightly lower than for Puerto Ricans ($1,794).The per capita income for the total U.S. population is muchhigher at $3,139, and the median family income is $9,590.The median income of the Mexican American family is $2,628 less thanthe median income of all families in the United States, and$797 higher than for Puerto Rican families.
Mexican American families are poorest in rural areasand in the states of New Mexico and Texas. In these areas,over a third (35%) of the Mexican American families surviveon less than $4,000 a year.
Just over e ,'arter (27%) of Mexican American familiesnationally earn annual income of $10,000 or more. Thisis 20% less than the proportion found in the total population.
OiOi

- 80
In local areas, there are considerable variations in incomelevel. A third of the Mexican American families in Californiaearn over $10,000 a year, and their median income is up to$8,050 a year. Incomes are higher still in Illinois, where 45%of all families have incomes of $10,000 and above, and themedian income is $9,301, compared to only 27% of Puerto Ricanfamilies in Illinois earning $10,000 and above, with a medianincome of $7,275. Although the median income for PuertoRicans in Illinois is higher than for Puerto Ricans nationally,the difference is not so great as for Mexican Americans inIllinois compared with Mexican Americans nationally.
With fewer earners and a high proportion of female-headed families, the income levels of Puerto Rican familiesare lower than those for Mexican Americans. As noted, 28% of allPuerto Rican families have an annual income of less than$4,000, and only 22% earn $10,000 or more. Family incomesare lowest in New York State, where almost a third of thefamilies earn $4,000 a year or less and the median income isonly $5,825.
As noted in Section E, Puerto Ricans have markedly fewerearners per family than do other groups. Only 36% of Puerto Ricanfamilies have more than one earner, 15% less than for thecountry as a whole. Only 28% of Puerto Rican wives in husband/wife families and only 24% of female heads of households areemployed. Many Puerto Rican women who are employed are youngwomen heads of households who have the sole responsibility forsupporting their children. In light of the lower income levelsof the Puerto Rican women, this is particularly disturbing.
The incomes of Puerto Rican families are highest inIllinois, but in this state their income level is still notas high as for Mexican Americans. In Illinois, only 11%of Mexican American families earn under $4,000; almosttwice as large a proportion (20%) of Puerto Rican familiesdo, and the median income of Mexican American families is morethan $2,000 higher than that of Puerto Rican families.
Female-Headed Families
For Puerto Ricans, one of every four families is female-headed, and it is these family heads who have the greatestdifficulty earning an income sufficient to support the othermembers. Of all Puerto Rican female heads, 65% must supporttheir families on incomes under $4,000--24% more than familieswith female heads nationally.
O i

PERCENT
OF TOTAL
10
10
- 81
Chart Fa
Income of lloxkle Amnion and Puerto Rican Families by Sex of Heat 1970
65%
51%
22%
SIDOCAN mamma
PUERTO RIMS
21%
I1 1 %
I i7%
4%I II 2.4m Z.a4
Under
FEMALE HEADS $4,000
$4,000 $7,000 510,000 $15,000
$6,999 611,999 $14,999 & over
Under $4,006 $7,000
ALL HEADS $4,000 $6,999 $9,999
1% 1%OM UM
$10,000 $15,000 $25,000$14,999 $24,999 & over
Source: U.S. Bureau of the Census, 1970 Census of Population,Subject Puports: Persons of Spanish Origin, PC(2)-1C
will

82
The median income of Puerto Rican female-headed families isonly $3,229; this is $254 less than that of Mexican Americanfemale-headed families, and $1,733 less than all female-headedfamilies naticnally, which in turn is 48% less than allfamilies nationally. With almost one-quarter of all PuertoRican families female-headed, this serious lag of PuertoRican female-headed families has important implications forPuerto Rican children. Of the 28% of the fan ilies in NewYork State that are female headed, 81% have children under 18;with a median income of $3,266, a critical situation forPuerto Rican women and children is produced.
Only 6% of female-headed Puerto Rican families have. incomesof $10,000 or more. Nationally three times more women havean income over $10,000.
Mexican American female-headed families are far worseoff than the general population of female-headed families.Of all female-headed families, 41% have an income under$4,000, while 57% of Mexican American families in thiscategory earn such low incomes. While 18% of all femaleheads support their families on'$10,000 a year or more,half as many Mexican American female heads do.
In Illinois, where the rate of labor force participationby Mexican American women is greater than the rate for allwomen in the country, only 31% of female-headed families haveincomes under $4,000. The median incomes of female-headed familiesin that state, unlike any other state, are up to the medianincomes of all Mexican American families in poorer stateslike Texas and New Mexico. Female-headed families are worstoff in states like Colorado, Texas, and New Mexico, wheretheir median incomes fall below $3,000 a year.
0 I 1 4,

- 83
III. G. POVERTY CHARACTERISTICS AND SOURCES OF INCOMF
Poverty
All Persons of Spanish Origin
Despite the many programs which have been developed inthe United States to combat poverty, large segments of thecountry's population--particularly large segments of itsminority populations--are poor and continue to have tostruggle with the basic problems of day-to-day survival. TheSpanish populations in the United States are among the groupswith the highest rates of poverty. In 1970, close to a quarterof all persons of Spanish Origin (close to 2.2 million people)were in poverty. On the other hand, the rate of poverty forthe total population was only 14% (see Table G-1) . 11% of allfamilies in the United States have incomes less than poverty level,but in the Spanish population, the proportion is twice ashigh (21%).
These poverty figures are the manifestation of deeplyrooted socio-economic problems faced by the Spanish Speakingin the United States today. As noted in Section F. IncomeCharacteristics, the overall income levels of the Spanishpopulation in the United States are far lower than in the totalpopulation. An analysis of the ratio of family income to povertylevels further illustrates the plight of Spanish families (seeTable G-2). There are proportionally nearly twice as manySpanish families at the lowest levels of poverty as thereare in the total population. Almost 8% of all SpanishOrigin families have incomes that are only 50%of poverty level. Comparatively, only 4.4% of all familiesin the country have such a low income. More than three-fourths (78%) of all U.S. families have incomes which areat least one and a half times the poverty level. Theproportion in Spanish Origin families, however, is lessthan 60% (see Table G-2).
The lack of education is a critical factor preventingSpanish Speaking persons from advancing into secure and well-paying employment. As has been noted in Section D. Education,the amount of education that has been completed by the Spanishpopulations in the United States ranks far below that completed bythe total population. Levels of poverty are highest among the un-educated in the Spanish populations.
Oily

Table G-1
Poverty Characteristics and Sources of Incomes of the U.S. Total and
Mexican and Puerto Rican Origin Populations, 1970
u.s.
Type of Income
Total
Mexican Americans
Puerto Ricans
Total
Rural
Arizona
Calif.
Colo.
Ill.
N.:tx.
Texas
Total
Conn.
Ill.
N.J.
N.Y.
I of Families Receiving
Social Security
20%
14%
12
13%
12
14%
9
13%
16
16%
18.
10%
4
14%
11
15%
9
8%
24
6%
18
6%
14
6%
22
t)%
28
S of Families Receiving
Public Assistance
5
Incidence of Poverty*
11
24
38
24
18
24
10
33
36
2'
26
21
426
29
I of All Families
)
I Female Headed
33
28
13
32
36
37
26
27
22
53
53
43
50
56
A S Female Headed Fam-
ilies in Poverty
32
51
58
57
45
64
26
64
58
58
66
57
62
57
1 of All Persons
14
28
42
27
20
28
13
38
40
30
29
23
29
31
% Who are 65 & Over
19
6
37
5
21
7
45
5 24
9 44
6 25
8_
53
6 49
2
29
1
26
2
27
1
30
3
30
% of 65 & Over
in Poverty
26
% Unrelated Individuals
in Poverty
37
44
54
55
35
52
33
65
60
33
36
30
29
32
*Per definition used by U.S. Census
Source:
U.S. Bureau of the Census, 1970 Census of Population
General Social and Economic Characteristics, UnitedStates Summary, PC(1)-1C
Detailed CharacteristraTTinTud States Summary,
PC(1)-D1
Subject Reports:
Persons ot Spanish Origin, PC(2)-1C
Puerto Ricans in the United States, PC(2)-1E

- 85
Table G-2
Ratio of Family Income to Poverty Level as a
Percent of All Families
Income Level Total Population Spanish Origin
Less than .50 4.4% 7.96
.50 .74 3.3 6.7
.75 - .99 4.0 8.1
1.00 to 1.24 4.8 9.1
1.25 to 1.49 5.3 8.9
1.50 and Over 78.3 5°.6
Source: U. S. Bureau of the Census, 1970 Cenrs of Poulation,Detailed Characteristics, U. S. Summery, Fell) -D1
011i
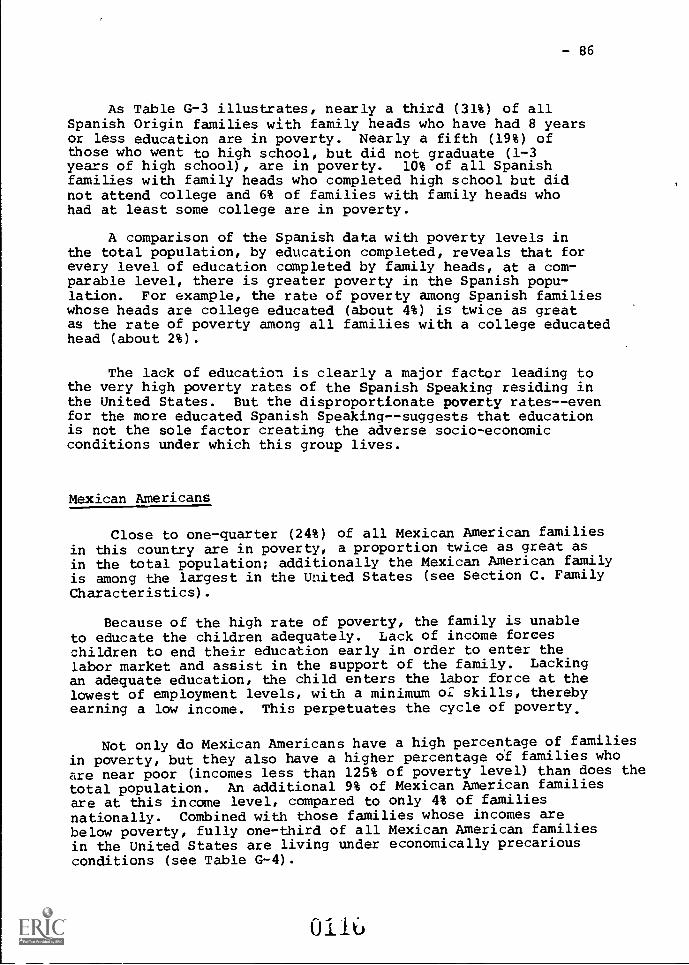
- 86
As Table G-3 illustrates, nearly a third (31%) of allSpanish Origin families with family heads who have had 8 yearsor less education are in poverty. Nearly a fifth (19%) ofthose who went to high school, but did not graduate (1-3years of high school), are in poverty. 10% of all Spanishfamilies with family heads who completed high school but didnot attend college and 6% of families with family heads whohad at least some college are in poverty.
A comparison of the Spanish data with poverty levels inthe total population, by education completed, reveals that forevery level of education completed by family heads, at a com-parable level, there is greater poverty in the Spanish popu-lation. For example, the rate of poverty among Spanish familieswhose heads are college educated (about 4%) is twice as greatas the rate of poverty among all families with a college educatedhead (about 2%).
The lack of education is clearly a major factor leading tothe very high poverty rates of the Spanish Speaking residing inthe United States. But the disproportionate poverty rates--evenfor the more educated Spanish Speaking--suggests that educationis not the sole factor creating the adverse socio-economicconditions under which this group lives.
Mexican Americans
Close to one-quarter (24%) of all Mexican American familiesin this country are in poverty, a proportion twice as great asin the total population; additionally the Mexican American familyis among the largest in the United States (see Section C. Family
Characteristics).
Because of the high rate of poverty, the family is unableto educate the children adequately. Lack of income forceschildren to end their education early in order to enter thelabor market and assist in the support of the family. Lackingan adequate education, the child enters the labor force at thelowest of employment levels, with a minimum skills, therebyearning a low income. This perpetuates the cycle of poverty,
Not only do Mexican Americans have a high percentage of familiesin poverty, but they also have a higher percentage of families whoare near poor (incomes less than 125% of poverty level) than does thetotal population. An additional 9% of Mexican American familiesare at this income level, compared to only 4% of families
nationally. Combined with those families whose incomes arebelow poverty, fully one-third of all Mexican American familiesin the United States are living under economically precariousconditions (see Table G-4).
01 1.6

- 87
Table G-3
Percent of All Families in Poverty
by Education of Family Head
Years of Schooling Total U.S.Persons ofSpanish
Completed. Population Origin
Total 11% 20%
8 Years or Less 20 31
1-3 Years High School 12 19
4 Years High School 7 10
Some College and 4 6
College Graduates
Source: U.S. Bureau of the Census, 1970 Census of Populatidn,Detailed Characteristics, U.S. Summary, PC(1)-D1
0111

Table G-4
Families With Incomes Near and Below Poverty
Mexican Americans
Puerto Ricans
U.S.
Total
Tote.).1AuralAriz.
CalifIolo.
Ill.
N. M.
TexasTotal
Conn.New
YorkNew Jerseya11.
.
Families with
Incomes Below
Poverty
11%
24%
38%
23%
18%
,
22%
1P%
30%
36%
27%
26%
29%
26%
21%
Families with
Incomes Near
Poverty
(1.00-1.24%
of Poverty)
49
12
98
97
10
12
1
,
10
911
11
8
Total
15
33
50
32
26
31
17
40
48
0--37
35
40
6,----.
I
37
29
Source:
U.S. Bureau of the Census, 1970 Census of Population General Social
and Economic Characteristics, United States Summary, PC(1)-C1
Detailed Characteristics, United States Summary, PC(1)-D1
Subject Reports: Persons of Spanish Origin, PC(2)-1C
Puerto Ricans in the United States, PC(2) -lE
1 co co

- 89
The degree to which such conditions exist in the MexicanAmerican community varies according to geographic location.The highest rates of family poverty are found in the ruralareas, where 38% of the Mexican Americans are in poverty.The variance from the national rate is quite substantial(nationally 24% of the Mexican American population are inpoverty) and reflects the low income rates for the MexicanAmerican rural dweller. Adding the proportion of familieswith incomes under 125% of poverty level,half of all theMexican American families in rural areas are poor or nearpoor.
By state, the poverty rates run highest in Texas where36% of all the Mexican American families are in povertyand 12% are near poverty. Characteristically, the ruralareas in Texas and in other states offer little in termsof employment. Income levels are significantly lower insuch locations, and the already difficult task of educatingthe young is much more difficult in rural areas than inurban areas.
Over half of the Mexican American female-headed familiesare in poverty, while less than one-third of such familiesin the total population are poor.
As it is for families, the rate of poverty among personstwice as high in the Mexican American population (28%)
as in the total population (14%). Of all elderly MexicanAmericans, 37% are poor, a proportion 11% above the nationalrate. 44% of all Mexican Americans who live alone (unrelatedindividuals) are in poverty.
Puerto Ricans
Of all Puerto Rican families, 27% are in poverty. Thisis 16% greater than the percentage among all U. S. familiesand 3% higher than the rate for Mexican Americans.
Two-thirds of all Puerto Ricans reside in the Stateof New York, where the rates of poverty are even higher(29%). With the addition of families whose incomes arenear the poverty level, 37% of all Puerto Rican familiesand 40% of Puerto Rican families in New York have incomesat or near poverty.
Over half (53%) of all Puerto Rican families in povertyare female headed. Close to three out of every five Puerto
011z)

- 90
Rican female-headed families are in poverty (58%); thehighest rate of any subgroup. The rate of poverty forfemale-headed families in the total population is 32%.The instability that characterizes poor families leads toa multitude of problems for the Puerto Ricans; therefore,efforts to assist Puerto Rican female family heads adequatelyto support their young families should be given priority.
In all local areas, female-headed families comprisea very large share of Puerto Rican poverty families. Therates of poverty among female-headed families are particu-larly high in the State of Connecticut, where two outof every three Puerto Rican female-headed families arepoor.
As with the families, the 30% rate of poverty amongPuerto Rican individuals is considerably higher than forthe total population. However, the incidence of povertyamong elderly persons and persons who live alone is notmarkedly higher in the Puerto Rican population. While26% of all elderly persons in the United States are poor,29% of Puerto Rican elderly are. While 37% of all personsin the total population who live alone are poor, only 33%of the Puerto Ricans who live alone are poor--this islower than the national average. The problem of povertyamong the Puerto Rican, then, is acute, but characteris-tically found among young families, particularly female-headed families rather than among elderly persons.
Puerto Ricans are a highly urbanized population with aminimal percentage of rural dwellers. This factor isimportant because vastly different socio-economic cir-cumstances characterize rural and urban populations of theUnited States. Employment, education, and income areless accessible in rural areas, so that, as this reportillustrates, in some ethnic populations like the MexicanAmericans, rural dwellers tend to be poorer than urbandwellers. The urban population, being closer to schoolsand to medical and social service centers and greateremployment posibilities, is usually better off economically.Yet the Puerto Rican, despite being almost entirely an urbandweller, is amonc the poorest of ethnic subgroups.
012u

- 91
Source of Income
Social Security
The Spanish Speaking are not receiving Social Securitybenefits at a rate comparable to the rest of the poplatIon.One in every five families in the total populationreceives this type of income, but the proportion is only14% for Mexican American and 8% for Pwtrto Rican families.
Although Social Security benefits are received primarilyby the elderly, and the proportions of elderly in the MexicanAmerican and Puerto Rican populations are much less thanin the total U.S. population, a comparison of the proportionsof elderly persons receiving Social Security reveals that amuch smaller percentage of the Mexican American and PuertoRican elderly are receiving an income from Social Securitythan in the total population of elderly in the country. Of allU.S. families with family heads who are 65 years old or over,84% receive Social Security, but only 72% of Spanish Speakingin this category do. The percentage of Spanish Speakingpoverty families with an elderly head of household receivingSocial Security is lower still (69%).
Fewer elderly Mexican Americans and Puerto Ricans havebeen able to utilize Social Security as an income source;whether this is because of an inability to qualify or becausethose who might qualify have been unable to negotiate thesystem, warrants further investigation.
Public Assistance
Mexican Americans
With their high rate of poverty, a very large proportionof Mexican American families, close to one out of eight (12%),are on public assistance--more than twice the rate for all U.S.families. One-half the number of Mexican American familieswith inadequate incomes are receiving public assistance (24%have inadequate incomes; 12% of them are receiving publicassistance).
The percentage of families getting welfare paymentsvaries considerably from state to state. One in five MexicanAmerican families in Colorado (18%) and one in six inCalifornia (16%) are on welfare. But in Texas and New Mexico
0121

- 92
(the two states with the highest proportion of poor Mexican.
American families) the proportion of families on welfare is
much lower (9% and 11% respectively).
Puerto Ricans
With their very high rate of poverty and accessibilityto urban social service agencies, the proportion of PuertoRican families receiving public assistance (24%) is higherthan the proportion of the national population receivingpublic assistance. Locally, Puerto Ricans are receivingpublic assistance at rates varying from a low of 14% inIllinois (where the rate of poverty also is lowest, 21%), toa high of 28% in New York (where the rate of poverty is 29%).
012'4
- 93
III. H. CUBAN AMERICANS
Immigration
Fidel Castro's ascendancy to power in Cuba was accompaniedby a massive flow of Cuban refugees to the United States,particularly during the latter part of the decade. Between1960 and 1970, over a quarter of a million (265,000) Cubansimmigrated legally to this country. The rate of immigrationreached its apex in 1968, when some 99,000 Cubans enteredthe United States (see Table A-1 in Section A. Immigrationand In-Migration). Since 1968, the rate of immigration hasgreatly decreased, because of restrictions on emigration imposedby the Castro government, although it is still larger than therate prior to the Cuban Revolution. Since 1970, an averageof 22,000 Cubans have immigrated to the U.S. each year.
Population Distribution
The main destination for the Cuban refugee populationduring the 1960-1970 decade was Florida; 45% of the Cubanimmigrants listed that state as their U.Sr destination.However, sizeable proportions of the Cuban population alsosettled elsewhere; 28% went to the New York-New Jersey area,while other major destinations included Illinois, California,and Puerto Rico. By 1970, a quarter of a million CubanAmericans (46% of all the Cuban Americans in the United States)resided in Florida, with 40% of all Cuban Americans living inGreater Miami alone. Another 29% of all Cuban Americans livein New York and New Jersey (see Table H-1).
The Cuban Americans are almost entirely uroan dwellers.Of all Cuban Americans, 98% live in cities, while ,Aly 73% ofthe entire U.S. population does.
Nativity
Barely 18% of the Cuban American population were born on U.S.soil. The proportion of U.S.-born Cuban Americans is even smallerin Florida (16%), where the more recent arrivals are concentrated.The majority of native-born Cuban Americans are still youngchildren (see Chart H-a), and 93% of all Cuban Americans whoare 18 years old or over are foreign born. Of these, overthreezquarters were still aliens in 1970.
012o

Table H-1
Population and Family Characteristics of the U.S. Total
and Cuban American Populations, 1970
Population Distribution
U.S. Total'
Cuban Americans
U. S.
Florida
New York &
Nflot Jersey
Total Population (3n 000s1
203,209
100%
544.6
100%
250.4
46%
157,6
29%
% of All Subgroup
Nationally
% of Group with Mother
Tongue Other Than
English
21
96%
NA
NA
% Urban
73
98
99
99
TaTiVity
95
g2
18
22
16
19
19
12
% Native Born
% Natives Born in
Different State
Age Distribution
g 9
32 6.4
31 8.0
32 5.3
% Under 18
------...34
% 65 and Over
Median Age:
Male
(Years)
Female
26.8
29.3
86
30.8
32.5
31.8
34.6
31.8
32.0
Family Characteristics
84
84
81
% Husband/ Wife Families
% Persons Under 16 Liv-
ing w/Both Parents
85
84
83
84
% Female-Headed Families
11
12
12
14
% Primary Individuals
20
11
10
14
% Families with 3 or More
Own Children Under 18
20
14
12
14
% Families with 5 or More
Persons
25
27
28
24
Source:
U.S. Bureau of the Census, 1970 Census of Population,
General Social and Economic Characteristics, United
States Summary( PC(1)-C1
Detailed Characteristics, United States Summary, PC(1)-D1
Subject Reports: Persons of Spanish Origin, PC(2)-1C

Numbers ofPersons
160,000
140,000
120,000
100,000
80,000
60,000
40,000
20,000
95
Chart H-a
NATIVITY OF CUBANS: 1970
II U. S. BornI I Foreign Born
Years of age 0-9 10-19 20-29 30-39 40-49 50-59 60-69 70 and above
Source: U.S. Bureau of the Census, 1970 Census of Population,Subject Reports: Persons of Spanish Origin, PC(2)-1C
U12

- 96
The proportion of adult U.S.-born Cuban Americans isfairly constant in all age groups, as Chart H-a illustrates.These persons represent earlier Cuban immigrants and theirdescendants who came to the U.S. in the decades prior to theCuban Revolution.
Mobility Within the U.S.
A comparison of the state of birth of the native-bornCuban American population reveals that much of the movementby Cuban Americans has been toward Florida and not away fromit. Despite efforts under the U.S. Government's Cuban RefugeeProgram to relocate the Cuban population to other states,Cubans have apparently been moving to Florida, in closerproximity to relatives and fellow Cuban Americans. Of allnative-born Cuban Americans in Florida,19% were born ina different state, three-quarters of these in the northeasternpart of the U.S. In contrast, in New York and New Jersey, 12%of all the native-born Cuban Americans came from another state,only one-third of them from the South (presumably Florida).The data indicate more Cuban Americans have moved to Florida:.roan the Northeast than have moved in the opposite direction.
Sex and Age Distribution
Throughout most of the recent decade of Cubanimmigration, more Cuban females than Cuban males havecome to the U.S. (see Table H-2). Because womenwere seen as of less immediate value to the Cuban govern-ment in terms of labor and military service, it waseasier for them to obtain permission to leave theIsland. As a result, 47% of today's Cuban Americanpopulation is male and 53% is female. As seen in TableH-3, women outnumber men, particularly in the 20-29year old age group (where they are 56% of the CubanAmerican population) and among the elderly 60 years oldand over (where they are 57% of the 60-69 year old agegroup and 63% of those 70 years old and above).
Unlike the other Spanish Origin groups, the medianage of the Cuban American population (about 32 years forboth men and women) is among the highest of any population.The median age of Mexican Americans and Puerto Ricans inthis country is less than 20 years. Indeed, young Cuban
012u

- 97
Table H-2
Sex of Cuban Immigrants, 1960-1973
Year ofImmigration
TotalNumber 1 Male % Female
1960 8,283 45% 55%1961 14,287 49 511962 16,254 54 461963 10,587 53 471964 15,808 49 511965 19,760 48 521966 17,355 46 541967 33,321 46 541968 99,312 45 551969 13,751 47 531970 16,334 47 531971 21,611 45 551972 20,045 46 541973 24,147 45 55
Source: U.S. Department of Justice, Immigration and Natural-ization Serivce, Annual Reports, 1960-1973.
rr
Table H-3
Sex of Cuban American Population, By Age: 1970
AteTotalNumber % Male % Female
0-9 97,392 51% 49%10-19 95,769 50 5020-29 64,205 44 5630-39 88,952 47 5340-49 85,911 49 5150-59 57,027 46 5460-69 36,242 43 5770 and over 19,102 36 63
Source: U.S. Bureau of the Census, 1970 Census of Population,Subject Reports: Persons of Spanish Origin, PC(2)-1C.
012

- 98
Americans (18 years old and under) comprise less than one-third of the total Cuban American population. This isslightly less than the proportion of young people in thetotal U.S. population and a far different profile thanthat found among Puerto Ricans and Mexican Americans inthis country, 47% of whose populations are under 18.
The median age of the Cuban immigrant has been get-ting progressively higher (see Chart H-b). In the latefifties and early sixties, young adults between 20 and 40years old were just under half the total immigrant popu-lation, but more recently almost half the Cuban immigrantsare middle-aged or elderly.
Of the total Cuban American population, 6% are 65 yearsold or older, a proportion smaller than for elderly in thetotal U.S. population (almost 10%), but larger than in theother Spanish Speaking populations (4% in the Mexican Americanpopulation and 2% among Puerto Ricans). With the increasingrate of older Cubans immigrating, the proportion of the CubanAmerican population that is elderly is likely to increase,requiring more attention to programs for the Cuban Americanelderly. The proportion of elderly (8%) is somewhat higheramong Cuban Americans in Florida.
Family Characteristics
The Cuban American family is one of the most stable. At84%, the proportion of families that includes both husband andwife is just under the average for the entire country (86%).Of all Cuban American children 18 years old and under, 84%live with both their parents, which is just under the ratefor the U.S. as a whole. The proportion of families headedby a female (12%) is only 1% above the national average.
There are only half as many Cuban Americans who live alone(primary individuals)(11%) as in the U.S. population as a whole(20%). As Cuban refugees immigrate to this country, they areapparently moving in with relatives who are already established.As a result, Cuban Americans have a very high incidence ofextended families. Cuban American families have fewer youngchildren than any other population group. While one-fifth ofall families in the U.S. have three or more children under 18,only 14% of the Cuban American families do. On the other hand,while a quarter of all families nationally contain five or moremembers, a larger proportion of Cuban American families (27%)have that many members. The differential between the proportion
012o

Chart H-b
AGE DISTRIBUTION OF CUBAN IMMIGRANTS AT TIME OF ENTRY
Age Group (year)
60 years old or over
III 40-59 years old20-39 years old
al 0-19 years old
- 99
1111 IC g 2 4 MI * III MI IIIpm a m ismmi IN al is . au 0 es - um ummi Ns as ... 1111 at ss ill IN...s
No im .illou El NI Mailloiliglimill IIII MIN Ma IIIIMMIIMIE
MI III
aese a*
g aeeae juge.
year 1158 1959 1960 1961 1962 1963 1964 1115 1961 1987 1168 1989 1120 1921 1972 1913
No, Immigrants: 13,000 7,000 9,000 14,000 16,000 11.000 11,000 20,000 17,000 33,000 99,000 14.000 16,000 22,000 20,000 24.000
Source: U.S. Department of Justice, Immigration and NaturalizationService, Annual Reports (for 1958-1973), Table 9
0 1.2
100%

r
- 100
of families with three or more children and five or moremembers of any age is an indication of the degree to whichfamilies contain other adult relatives (e.g., siblings andparents of the family head). In the Cuban American population,the differential between these two measures is 13%. In contrast,in the total population the differential is only 5% and theMexican American families' differential is 8%; suggrating afar greater tendency toward extended families among the CubanAmericans.
Education
The Cuban American population has just as high a percentageof persons without much education as other Spanish Speakingpopulations. While 44% of all Puerto Ricans and 47% of allMexican Americans have not gone beyond elementary school, 45%of all adult Cuban Americans have eight or fewer years ofeducation.
The percentage of Cuban Americans who have graduated fromhigh school (44%) is higher than among Puerto Ricans and MexicanAmericans (about 27% for both). However, the proportion ofCuban Americans who are high school graduates is still 11% belowthe average for the total U.S. population. Cuban Americansin the New York/New Jersey area are particularly undereducated.In those two states, only 38% of the adult Cuban Americanpopulation has a high school diploma (see Table H-4).
Whereas 35% of all 18-24 year old Cuban Americans inFlorida are enrolled in school, only 28% of 18-24 year oldCuban Americans in New York and New Jersey are enrolled. Theaverage for the total U.S. population is 32%.
Two major components of thebeen to provide the new arrivalsvocational training, which wouldin either the school enrolled or
Cuban Refugee Program havewith English language andnot necessarily be reflectedschool completed figures.
Of the total Cuban American population in 1970, 96% reportedSpanish as their mother tongue--an expectedly high percentage,given the very large proportion of Cuban Americans who areforeign born. The need for English language instruction hasobviously been critical.
At the same time, the efforts made to provide vocationaltraining to Cuban Americans have had an impact. Table H-5illustrates the percentages of Cuban Americans and others,without college degrees, who have completed a vocationaltraining program.

Table H-4
Socio-Economic Characteristics of the U.S. Total
and Cuban American Population, 1970
U.S. Total
Cub-. 4n-
U.S.
45%
Florida
48%
New York &
New Jersey
49%
Education
% 8 or Fewer Years School
Comleted (25
& Ov r
% H.S. Grass
Yrs. & Over
8%
- -Year 0 61
n Sc oo
13
22
28
17
% 18 -24 Year Olds in School
32
34
35
28
Labor Force
7741
84
51
8351
8653
% in Labor Force:
Male
(16 Yrs. or Over)Female
% Unemployed:
Male
3.9
Female
5.1
4.3
7.3
4.1
6.4
3.6
8.2
Income
15
17
19
14
% Families with Incomes
Under $4,000
% Families with Incomes
$10 000 and Over
34
4M
an Income
$9.590
S8.529
$7.833
$8.745
Poverty and Source of Income
11
13
15
12
% Families in Poverty
Female-Head Families
in Povert
32
25
% o
over
n over
% Fam
es on P
c Ass s ancet
517
18
15
% Families on Social Security
20
10
12
9
Source: U.S. Bureau of the Census, 1970 Census of Population,
General Social and Economic Characteristics, United
States Summary, PC(1)-C1
Detailed Characteristics, United States Summayi, PC(1)-D1
Subject Reports: Persons of Spanish Origin, PC(2)-1C

- 102
Table H-5
Vocational Training Completed*
U.S. Total Population 25%
Cuban Americans 23
Mexican Americans 16
Puerto Ricans 16
* By persons 16-64 years old with less than 3 years of collegeeducation.
Source: U.S. Bureau of the Census, 1970 Census of Population,General Social and Economic Characteristics, UnitedStates Summary, PC(1)-C1Subject Reports: Persons of Spanish Origin, PC(2)-1C
As the data show, the rate of training completed by theCuban American population is second only to the rate of trainingcompleted by the total population and far exceeds that of personsin other Spanish Speaking subgroups.
Positive efforts have also been made to establish pre-school programs for 3-4 year old Cuban Americans. With thehigh proportion of women in the wo' force, 1/ as well asthe language difficulties that the younger Cuban Americanchildren encounter as they enter the U.S. school sp3tem,such programs obviously fulfill a valuable need. Thecurrent enrollment rate for Cuban America:1 preschoolers(22%) far exceeds the average enrollment rate for all 3-4year olds in the country (13%). In Florida, the rate ofpreschool Cuban American enrollment (28%) is twice as highas the U.S. average.
Employment
In 1970, 84% of Can American males were in the laborforce, the highest rate of participation by any group in thecountry. (For all men in the U.S., the rate is only 77%.)The labor force participation rate of Cuban American women is alsoamong the highest (51%). The average for all women in thecountry is only 41%.) The rates for e'uban Americans are evenhigher in the Northeast, where 86% of the men and 53% of thewomen are in the work force.
Unemployment among Cuban American males (4.3%) is justover the U.S. average for men (3.9%), while the rate of un-employment among Cuban American women (7.3%) is 2% higher thanthe rate for all women in the country, though lower than
1/ See E. Employment Section.
013'4

- 103
the rates for both Mexican American and Puerto Rican women(close to 9%).
A quarter of all the Cubans immigrating between 1960 and1973 who had an occupation when they immigrated were inprofessional and managerial occupations. Another 15% werewhite-collar clerical workers (see Table H-6). Persons inthese predominantly middle-class, white-collar professionsrepresented a large portion of the refugee population.However, as Table H-6 illustrates, the proportion of immigrantswho are white-collar workers has decreased steadily sincethe mid-sixties. More recent immigrants are largely from blue-collar, semi-skilled and unskilled occupations. Since 1970,for example, half of all immigrants with occupations wereoperatives, service workers, and laborers. This trend towardincreased proportions of lower-status, blue-collar workerssuggests that the need for vocational training programs amongthe Cuban refugee populations will be a continuing one, as longas new immigrants continue to arrive.
Table H-7 provides a comparison of the current occu-pational distribution of employed Cuban Americans withemployed males and females in the total population. As thetable illustrates, the distribution of jobs among the CubanAmericans in the United States is more Treighted toward thelower skilled and unskilled occupations than in the totalpopulation. While 35% of all men in the U.S. are employed assemi-skilled operatives, low-skilled service workers andlaborers, 45% of the Cuban American males are.
The contrast in jobs between the Cuban American womenand women in the total population is even more marked. Whilea fifth of all women in the United States are in the pro-fessional and managerial occupations, less than half thatproportion of Cuban American women (10%) are in these higherstatus occupations. While over one-third of all females areemployed in the semi-skilled and unskilled occupations (asoperatives and service workers largely) well over half theCuban American women in the country (55%) are so employed.
Income
With the high proportion of persons in the work force,the average Cuban American family is able to generate a greater
01.3

Table H-6
Distribution of Occupations of Cuban Immigrants
Total
% Professional,
% Service
Year of
Number
Technical,
Immi-
Reporting
Managerial,
% Clerical
% Craftsmen
.% Oper-
Workers &
gration
Occupation
Workers
Workers
& Foremen
atives
Laborers
% Other
1960
3,404
31%
16%
11%
18%
158
98
1961
5,676
37
19
815
12
91962
8,045
42
18
711
12
10
1963
5,328
35
18
817
15
71964
7,408
41
16
714
14
81965
8,381
39
16
816
13
8CD
1966
7,111
40
16
815
13
81--1/4
1967
15,233
33
18
918
14
8CO
1968
45,299
19
16
11
28
18
84:
1969
6,031
24
17
17
22
15
51970
8,336
15
12
15
33
16
91971
10,229
14
13
12
33
22
61972
9,388
13
12
13
36
20
61973
11,074
13
12
12
37
21
5
Total
150,943
25%
15%
11%
25%
17%
78
Source: U.S. Department of Justice, Immigration
and Naturalization
Service, Annual Reports: 1960-1973,Washington, D.C.:
Government Printing Office.

Table H-7
Occupations of Cuban Americans: 1970
Cuban Americans
Total U.S.
Males
4
Females
Males
Females
Occupation
Category
(Persons 16
& Over)
% of all
Working
Males
% of all
Workilg
Fethales
% of all
Working
Males
% of all
Working
Females
Professional
& Managerial
Workers
20%
10%
26%
20%
Clerical
Workers
10
26
835
Craftsmen &
Foremen
18
121
2
Operatives
25
43
20
14
Service
Workers &
Laborers
20
12
15
22
Other
75
11
7
Source:
U.S. Bureau of the Census, 1970 Census of Population,
General Social and Economic Characteristics, United
States Summary, PC(1)-C1
Subject Reports:
Persons of Spanish Origin, PC(2)-1C

- 106
family income. Indeed, 60% of all Cuban American families havetwo or more earners, while only 51% of all U.S. families do.With 6% elderly and 32% under 18, the high proportion of workersamong the Cuban Americans is evident. Although higher thanfor other populations, the income level of Cuban Americanfamilies is still not up to the average forthe total popu-lation, despite the contribution of more earners. Of all CubanAmerican families, 17% are living on an income of less than$4,000 a year, compared to 15% of all families in the U.S. Ofall Cuban American families, 39% have an annual income of$10,000 or more, whereas the proportion is 47% for families inthe total porulation. The median income of the U.S. CubanAmerican family ($8,529) is about $1,000 less than the medianfor all families in the country. The median income of thosefamilies who immigrated to the U.S. between 1960 and 1964 isup to $9,813, while for families entering between 1965 and1970, it is only $7,047. 1/
Poverty Status
Currently, the rate of poverty among Cuban Americanfamilies, 13%,is just over the average for the country (11%).At 15%, it is higher among Cuban Americans in Florida. Thepoverty rate among Cuban families who immigrated to the U.S.between 1955 and 1965 is only 8%, but among families whohave immigrated since 1965, it is, at 22%,twice the U.S.average. 2/
Poverty among female-headed Cuban American families andelderly Cuban Americans is somewhat lower than for the countryas a whole, possibly because of the extended family structure,within which family members with limited means are assistedby relatives. However, if more elderly Cubans continue toimmigrate, it will be less likely that family members will beable to support them adequately. In Florida, 28% of all CubanAmerican elderly are poor, 2% above the U.S. average for povertyamong the elderly.
Under the Cuban Refugee Program, public assistance forthe Cuban American population has not been based solely onpoverty status and the percentage of Cuban American familiesreceiving public assistance (17%) is greater than the percentageof families in poverty (13%).
1/ U.S. Bureau of the Census, 1970 Census of Po ulation,zukarstjapandaae, PC 2)-1A.2/ Ibid.
013t

- 107
The Cuban American elderly, however, are not receivingSocial Security benefits at a rate comparable to elderly inthe rest of the population, probably because of their shortperiod of residence in the U.S. Only one-tenth of all CubanAmerican families are receiving Social Security benefits,half the proportion in the total U.S. population. In thetotal U.S. population, two famil.t.- receive Social Securityfor each elderly person in the population, but only 1.6 CubanAmerican families are receiving Social Security for eachelderly Cuban American.
013,
- 108
SPANISH ORIGIN GLOSSARY
Born in a Different State - see Nativity
Born in the United States - see Nativity
Employment - see Labor Force Participation
Ethnicity/Race: In 1970, Census obtained information on ethnicity/race primarily through self-classification by people accordingto the ethnicity/race with which they identified themselves.For persons of mixed parentage who were in doubt as to theirclassification, the ethnicity/race of the person's father wasused.
Group - In most cases, a term used to identify broadercategories of ethnic minority populations, includingPersons of Spanish Origin. Persons of different culturaland national origins are grouped into these broadercategories because they share certain common traits interms of language, continent of origin, community, history,and/or interests.
Subgroup - Term used to identify persons of specific cul-tural, national, or tribal origins under each of the abovegroups. Examples include Mexican Americans and PuertoRicans.
To some extent the terms "group" and "subgroup" have beenused interchangeably in the text.
Extended Family - see Family
Family - Consists of a household with a household head and oneor more other persons living in the same household who arerelated. (2 Household)
Female- Headed Family - A family in which a female isreported as head by its members. (However, if thehusband is present, he is considered the head byCensus.)
Note: Except where noted, these definitions are based onthose used by the U.S. Bureau of the Census in itsvarious documents of the 1970 Census.
0 ^ f-)i
- 109
Nuclear Family - A family group containing no more than afather, mother, and one or more children.
Extended Family- A family group that contains relativesbeyond the nuclear family unit, such as parents, grand-children, or siblings of the family head, etc.
Subfamily - A married couple with or without children, orone parent with one or more single children under 18 yearsold, living in a household and related to, but not including,the head of the household or his wife. Members of a sub-family are also included among the members of a family.The number of subfamilies, therefore, is not included in thenumber of families.
Female-Headed Family - see Family
Foreign Born - see Nativity
Group - see Ethnicity/Race
Household - One or more persons who occupy a group of rooms ora sing e room that constitutes a housing unit. (cf. Family)
Head of Household - One person in each household is desig-nated as the head. (cf. Family (Female-Headed Family))
Primary Individual - A household head living alone orwith nonrelatives only.
Unrelated Individual - One of the following: a householdhead living alone or with nonrelatives only; a householdmember who is not related to the head; or a person livingin a group situation who is not an inmate of an institution.(Unrelated Individuals who are household heads are PrimaryIndividuals.)
Income - The sum of amounts received as wages or salary beforedeductions; self-employment income (gross receipts minus ope-rating expenses) from business, farm or professional enter-prises and income other than earnings (interest, dividends,pensions, Social Security, public assistance, etc).
0

- 110
Intermarriage - Marriage between persons of different ethnic/racialgroups.
Labor Force Participation - Labor force participants are thosepersons, 16 years old and over, who reported.that during theweek prior to the Census count they were employed or.were notemployed but were seeking employment (also includes members ofthe Armed Forces).
Employed - Employed persons comprise all civilians, 16 yearsold or over: who have paid jobs,who have their own business,profession, or farm, or who have a job working 15 or more hoursas unpaid workers in a family farm or business. Excludedfrom the employed are persons whose only activity consistsof work around the house or volunteer work.
Unemployed - Persons are classified as unemployed if theyare civilians, 16 years old and over, and are without a jobduring the reference week, but have been looking for workin the past four weeks and are available to accept a job.
Not in Labor Force All persons 16 years old and over whoare not classified as members of the labor force (employedor seeking employment) are defined as "not in labor force."Examples include students, housewives, retired workers,seasonal workers enumerated in an "off" season who are notlooking for work, inmates of institutions, and disabledpersons.
Mean - see Median
Median - The middle value in a distribution, i.e., the mediandivides the distribution into two equal parts. One-half of thecases falls below the median and one-half exceeds the median.Where possible, we analyzed the median in preference to meanvalue (average of a set of values), because the latter isstrongly influenced by extremes in the distribution. The medianwhich is not affected by extreme values is,therefore,a bettermeasure than the mean when the population base is small.
Mother Tongue - Defined by the U.S. Bureau of the Census as thelanguage spoken in the person's home when he was a child. Ob-viously, this is not necessarily the tongue of the mother country,but rather the language an individual spoke to his parents. Themother tongue is not necessarily the language spoken in thehome now.
014u

Native Born - see Nativity
Nativity - Various identifiers used by U.S. Bureau of the Censusto categorize relevant circumstances of an individual's birthare:
Native Born - Persons born in the United States or itsoutlying areas, or born in foreign countries or at seato parents of U.S. citizenship.
Foreign Born - Persons born in a country other than the U.S.
Born in a Different State - Persons born in the U.S. (NativeBorn) are classified according to their state of birth(based on mother's state of residence, rather than loca-tion of actual birth, e.g., hospital). If the person nowresides in a different state than that of his birth (resi-dence implying where he lives most of the time), he isdesignated as Born in a Different State. Data on personsBorn in a Different State are taken as a percentage ofthe sum of all persons who reported they were born in thesame state and those who reported they were born in a dif-ferent state; but not as a percentage of all Native-Bornpersons, because the latter include persons who either didnot report the state of their birth or were born at sea.
Born in the United States - Used for persons born in theUnited States proper only. Puerto Ricans who were born inPuerto Rico were not born in the United States although theyare considered Native Born by Census.
Nuclear Family - see Family
Occupations - The system of classification of occupationsdeveloped for the 1970 Census consists of 441 specificoccupational groups. For purposes of the present analysis,the groups were reduced to nine (Transportation Operatives"was combined with "Other Operatives," "Farm Laborers" wascombined with "Farmers and Farm Managers," and "PrivateHousehold Workers" was combined with "Other Service Workers")and these nine were arranged into two major categories, "White-Collar Occupations" and "Blue-Collar Occupations." In thecase of blue-collar occupations, the Census classificationsystem differs from the U.S. Department of Labor's Dict:%onaryof Occupational Titles. Examples of specific occupations undereach of the nine categories listed in this report are:
0141

- 112
1. White-Collar Occupations:
a. High Status
Professional & Technical Workers: Engineers,Lawyers, Scientists, Physicians, Teachers,Journalists, Writers, Health Technicians,Registered Nurses, Social Workers, etc.
Managers and Administrators: Buyers, SalesManagers, Public Administrators, HealthAdministrators, Restaurant Managers, OfficeManagers, School Administrators, personsself-employed in own incorporated businesses,etc.
b. Low Status
Sales Workers: Salesmen, Sales Clerks, Brokers,etc.
Clerical Workers: Bookkeepers, Cashiers, Secre-taries, Bank Tellers, Key Punch Operators,Telephone Operators, Teacher's Aides, MailCarriers, Library Attendants, etc.
2. Blue Collar Occupations:
a. High Status
Craftsmen, Foremen and Kindred Workers:Carpenters, Plumbers, Electricians, Mechanics,Machinists, Construction Workers, Printers,Repairmen, etc.
b. Low Status
Operatives: Assemblers, Filers, Polishers,Sanders and Buffers, Dressmakers and Seamstress-es, Packers and Wrappers, Sewers and Stitchers,Graders and Sorters, Deliverymen, Bus Drivers,Truck Drivers.
Laborers, Except Farm: Construction Laborers;Freight, Stock, and Material Handlers; Fisher-men; Gardeners; Longshoremen.
Service Workers: Maids, Janitors, Waiters,Dishwashers, Nursing Aides, Porters, Hair-dressers, Porters, Policemen, etc.
Farm-Related Occupations: Farmers and FarmManagers, Farm Workers, etc.
014

- 113
Poverty - Families and unrelated individuals are classified asbeing above or below the poverty level according to a povertyindex adopted by a Federal Interagency Committee in 1969. Thisindex provides a range of income cutoffs or "poverty thresholds,"adjusted to take into account such factors as family size, sexand age of the family head, number of children, and farm/non-farm residence. These income cutoffs are updated every year toreflect the changes in the Consumer Price Index. In 1969, theaverage poverty threshold for a nonfarm family of four was$3,743. The population covered in the poverty statistics ex-cludes inmates of institutions, members of the Armed Forcesliving in barracks, college students living in dormitories,and unrelated individuals under 14 years old. In the tablesthat accompany this report, the following subheads are usedunder the poverty reading:
% Female-Headed Families in Poverty - Of all faffilieswith female heads, the percent whose total family incomefell below the poverty level in 1969.
Poverty Families, % Female Headed - Of all the familieswhose incomes fell below the poverty level in 1969, thepercent which had a woman as its head.
Primary Individual - see Household.
Puerto Ricans
Puerto Rican Birth or Parentage (Subject of PC(2)-1E, PnprtoRicans in the United States) includes persons who were born inPuerto Rico; whose parents were born in Puerto Rico; who hadone parent born in Puerto Rico and one parent born in the UnitedStates; or whose father was born in Puerto Rico and mother bornin an outlying area. However, a native of the United States whohad one parent born in Puerto Rico and the other in a foreigncountry was not classified as being of Puerto Rican origin.
Puerto Rican Origin (Included in PC(2)-1C, Persons of SpanishOrigin) Data for persons who identified themselves as of PuertoRican origin are not compa.:able with data for persons of PuertoRican birth or parentage. The former includes those who are ofthird and subsequent generations in the United States.
0146
I
- 114
Race - see Ethnicity/Race.
Region - The term, as used in this report, may have one of twomeanings: (1) The ten Standard Federal Regions of the UnitedStates, as recognized by the Department of Health, Education,and Welfare and certain other federal agencies; and (2) Thefour Census Regions into which the U.S. Bureau of the Censusdivides the country--West, South, North Central, and Northeast.
Rural- The population not classified as urban constitutes theTUFg.I population. (cf. Urban)
Sample Size - The Census statistics presented in this report arebased on a sample of the population. The sizes of the samplesvary: data from the PC(1)-C series, General Social and Eco-nomic Characteristics, and the PC(1)-D series, Detailed Charac-teristics, were derived from 20%, 15%, and 5% samples depending onsubject area; data on persons of Spanish Heritage were based on a20% sample. Most data on Mexican Americansf Puerto Ricans, andCubans were based on a 5% sample. Certain pieces of data on PuertoRicans were based on a 15% sample. Persons are advised to refer toindividual Census publications for details.
Schooling - The following terms are used:
Years of School Completed - Except for high school graduates,based on the highest grade of school completed. Personswho attended a foreign school system or were ntored areasked to report the approximate equivalent grade in astandard U.S. school system.
High School Graduates - Includes all persons who havecompleted high school whether or not they have hadadditional schooling.
School Enrollment - Persons were included as enrolled inschool for the 1970 Census if they reported attending a"regular" school or college at any time between February 1,1970 and the time of enumeration. Regular schooling isthat which may advance a person toward an elementary schoolcertificate, or high school diploma, or college, university,or professional degree. Persons were included as enrolledin nursery school only if the school included instructionas an important and integral phase of its program. School-ing generally regarded as not regular includes that givenin nursery schools that simply provide custodial care;specialized vocational, trade and business schools; on-the-job training; and correspondence courses.
01.44
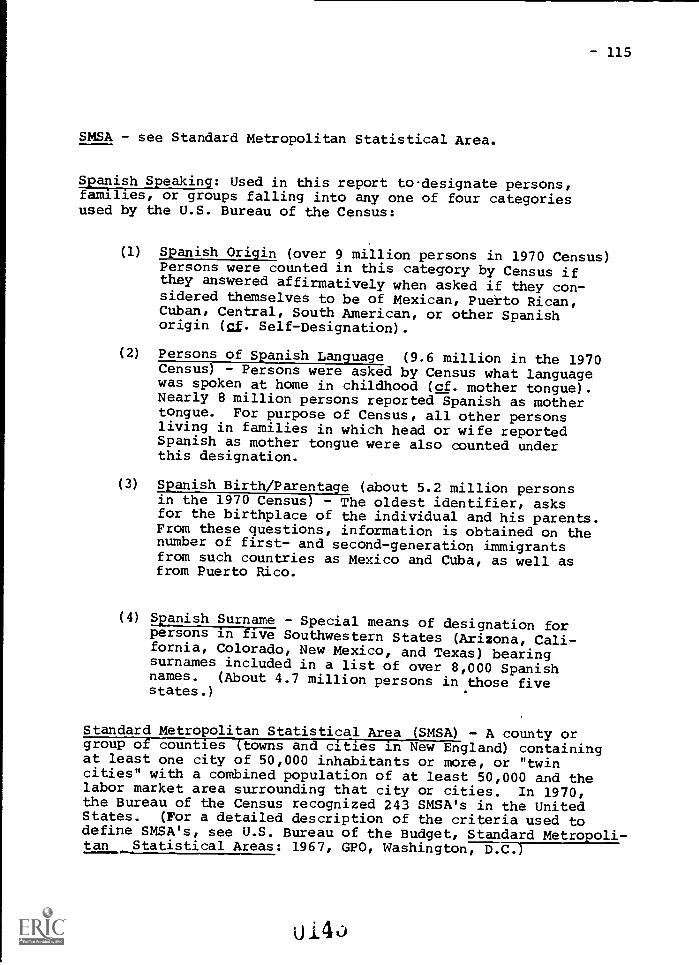
- 115
SMSA - see Standard Metropolitan Statistical Area.
Spanish Speaking: Used in this report to designate persons,families, or groups falling into any one of four categoriesused by the U.S. Bureau of the Census:
(1) Spanish Origin (over 9 million persons in 1970 Census)Persons were counted in this category by Census ifthey answered affirmatively when asked if they con-sidered themselves to be of Mexican, Puerto Rican,Cuban, Central, South American, or other Spanishorigin (cf. Self-Designation).
(2) Persons of Spanish Language (9.6 million in the 1970Census) - Persons were asked by Census what languagewas spoken at home in childhood (cf. mother tongue).Nearly 8 million persons reported Spanish as mothertongue. For purpose of Census, all other personsliving in families in which head or wife reportedSpanish as mother tongue were also counted underthis designation.
(3) Spanish Birth/Parentage (about 5.2 million personsin the 1970 Census) The oldest identifier, asksfor the birthplace of the individual and his parents.From these questions, information is obtained on thenumber of first- and second-generation immigrantsfrom such countries as Mexico and Cuba, as well asfrom Puerto Rico.
(4) Spanish Surname - Special means of designation forpersons in five Southwestern States (Arizona, Cali-fornia, Colorado, New Mexico, and Texas) bearingsurnames included in a list of over 8,000 Spanishnames. (About 4.7 million persons in those fivestates.)
Standard Metropolitan Statistical Area (SMSA) - A county orgroup of counties (towns and cities in New England) containingat least one city of 50,000 inhabitants or more, or "twincities" with a combined population of at least 50,000 and thelabor market area surrounding that city or cities. In 1970,the Bureau of the Census recognized 243 SMSA's in the UnitedStates. (For a detailed description of the criteria used todefine SMSA's, see U.S. Bureau of the Budget, Standard Metropoli-tan __Statistical Areas: 1967, GPO, Washington, D.C.)

- 116
Subfamily - see Family.
Subgroup - see Ethnicity/Race.
Unemployed -see Labor Force Participation.
Unrelated Individual - see Household.
Urban - Designates all persons living in incorporated or un-incorporated areas of 2,500 inhabitants or more, excludingpersons living in the rural portions of extended cities. Alsodesignates other territories included in urbanized areas.(A fuller definition appears in the Census PC(1)-A reports.)
014u

- 117
SOURCES ON PERSONS OF SPANISH ORIGIN
U. S. Bureau of the Census,1970 Census of Population:
Subject Reports: Persons of Spanish Origin, PC(2)-1C
Subject Reports: Persons of Spanish Surname,PC(2)-1D
Subject Reports: Puerto Ricans in the United States,PC(2)-1E
Subject Reports: National Origin and Language,PC(2)-1A
Additionally, many Census v.lblications based on the 1970Census provide separate columns of data on all personsof Spanish Heritage, Spanish Language, or Spanish SurnameThese include:
Detailed Characteristics PC(1)-D Series, U.S.Summary and by individual states
General Social and Economic Characteristics PC(1) -CSeries, U.S. Summary and by individual states
Census Tracts PHC(1), Socio-economic and housingcharacteristics by Census Tracts for 241 SMSA's
Subject Reports: Low-Income Areas in Large CitiesPC(2)-9B
Subject Reports: Family Composition, PC(2)-4A
Subject Reports: Marital Status, PC(2)-4C
Subject Reports: Vocational Training, PC(2)-5C
1960 Census of Population:
Subject Reports: Persons of Spanish Surname, PC(2)-1B
Subject Reports: Puerto Ricans in the United States, pC(2) -1D

- 118
Other Census Reports:
P-20, No. 250 Persons of Spanish Origin in the UnitedStates: March 1972 and 1971
P-20, No. 264 Persons of Spanish Origin in the UnitedStates: March 1973
P-20, No. 259 Advance Reports, Persons of Spanish Originin the United States: 1973
P-20, No. 238 Selected Characteristics of Persons ofMexican American, Puerto Rican and Other Spanish Oiin:March 1972
P-20, No. 195 Persons of Spanish Origin in the UnitedStates: November 1969
PC(SI)-30, Persons of Spanish Ancestry
U.S. Department of Justice,Immigration and Naturalization Service:
Annual Reports (by year) 1960-1973.
0148