Embed Size (px)
Citation preview

RD 056 090
DOCUMENT RESUME
24 TM 000 896
AUTHOR Green, Donald RossTITLE Racial and Ethnic Bias in Test Construction. Final
Report.INSTITUTION CTB/McGraw Hill, Monterey, Calif.SPONS AGENCY Office of Education (DHEW), Washington, D.C.BUREAU NO BR-0-1-033PUB DATE 24 Sep 71CONTRACT OEC-9-70-0058(057)NOTE 104p.
EDRS PRICE MF-$0.65 HC-$6.58DESCRIPTORS Achievement Tests; Caucasians; Data Analysis;
Disadvantaged Youth; Ethnic Groups; Grade 1; Grade 3;Grade 5; Grade 8; Grade 10; *Item Analysis; *MexicanAmericans; Minority Group Children; *Negroes; RacialDiscrimination; Rural Youth; Suburban Youth; *TestBias; *Test Construction; Test Reliability; TestValidity; Urban Youth
IDENTIFIERS Califoraia Achievement Tests
ABSTRACTTo determine if tryout samples typically used for
item selection contribute to test bias against minority groups, itemanalyses were made of the California Achievement Tests using sevensubgroups of the standardization sample: Northern White Suburban,Northern Black Urban, Southern White Suburban, Southern Black Rural,Southern White Rural, Southwestern Mexican Urban and SouthwesternAnglo-American Suburban. The best half of the items in each test wereselected for each group. Typically about 30% of the items in theupper half of the distribution of item-test corfelations for a groupon a test did not meet this criterion with another gre-- By thiscriterion minority groups were relatively simi' , the threesuburban groups. The resulting unique item tesl. .a correlatewell with each other. Scores of minority groups were relativelybetter on the selected items. Thus, standard item selectionprocedures produce tests best suited to groups like the majority ofthe tryout sample and are therefore biased against other groups tosome degree. This degree varies, ways to minimize this bias need tobe developed. (Author/MS)

F_nal Report
Project No. 0-1-033Contract No. OW-9-70-0058 (057)
Donald Ross GreenCTB/McGraw -HillDel Monte Research ParkMonterey, California 93940
RACIAL AND ETHNIC BIAS IN TEST CONSTRUCTION
September 24, 1971
U.S. ARTMENT OF HEALTH,E CATION & WELFAREOFFICE OF EDUCATION
THIS DOCUMENT HAS BEEN REPRO-DUCED EXACTLY AS RECEIVED FROMTHE PERSON OR ORGANIZATION ORIG-INATING IT. POINTS OF VIEW OR OPIN-IONS STATED DO NOT NECESSARILYREPRESENT OFFICIAL OFFICE OF EDU-CATION POSITION OR POLICY.
(7:0
C)51)J.S. DEPARTMENT OF HEALTH, EDUCATION, AND WELFARE
OFFICE OF EDUCATION
<=4 REGIONAL RESEARCH PROGRAM

ABSTRACT
Problem: Do the tryout samples typically used for itemselection contribute to test bias against minority groups?
Method: Item cnalyses were made of the California Achieve-ment Tests using seven subgroups of the standardization sample:Northern White Suburban, Northern Black Urban, Southern WhiteSubufban, Southern BlaA Rural, Southern White Rural, SouthwesternMexican Urban and Southwestern Anglo-American Suburban. The besthalf of the items in each test were selected for each group.
Results: Typically about 30% of the items in the upper halfof the distribution of item-test correlations for a group on atest did not meet this criterion with another group. By thiscriterion minority groups were relatively similar as were the threesuburban groups. The resulting unique item tests did not correlatewell with each other. Scores of minority groups were relativelybetter on the selected items.
Conclusions: Standard item selection procedures produce testsbest suited to groups like the majority of the tryout sample andare therefore biased against other groups to some degree. Thisdegree varies. Ways to minimize this bias need to be developed.

Final Report
Project No. 0-1-033Contract No. OEC-9-70-0058 (057)
Racial and Ethaic Bias in Test Construction
Donald Ross Green
CTB/McGraw-Hill
Monterey, California
September 24, 1971
-
The research reported herein was performed pursuant to a contractwith the Office of Education, U.S. Department of Health, Education,and Welfare. Contractors undertaking such proiects under Govern-ment sponsorship are encouraged to express freely their professionaljudgment in the conduct of the project. Points of view or opinionsstated do not, therefore, necessarily represent official Office ofEducation position or policy.
U.S. DEPARTMENT OFHEALTH, EDUCATION, AND WELFARE
Office of EducationRegional Research Program

TABLE OF CONTENTS
Page
Abstract .. OOOOOO .... OOOOOOO ii
Acknowledgements 00000000 OOOOOOO 000 VList of Tables O OOOO ...... OOOOOOOO .... vi
Problem and Objectives OOOOO OOOOO ..... 1
Problem . o oat° oo o oo **so oo o O ooo 1
Related Literature ,,..0.000 OOOOO . 2Objectives of the Study 4
Limitations 9 0009.0000 00000 OOOOOMethod. 93.
Sample 0? ea o 00 S *me oeopData Analysis 000090000 O O
4
4
7
Results 00 0.00 OOOOOOOO .410 OOOOO 0 8
Proportion of Unique Items . . OOOOOOOOOOOOO 8
Independence of Uniane Ttem Tes- ',1 r. . . 0 0 12
Changes in Test Characteristics . . . . . . . 0 . . 12
Changes in Test Scores ......... ... 21
COAClusions OOOOOOOOOOOOOOOOOOOOOOO 21
.-Icommendations . . OOOOOOOOOO . .. .23
Bibliography 24
Appendix OOOOO 0 . OOOOOO ..0., 27

ACKNOWLEDGMENTS
Special thanks are due to my colleague, Dr. George Burket,
who first suggested this use of item selection procedures and who
offered valuable advice throughout. I would also like to thank
Dr. Joseph L. Dionne who gave encouragement and who ensured that
CTB/McGraw-Hill provided the facilities and personnel needed at a
cost substantially in excess of that provided by the grant.
Finally, I would like to thank Lois Maclin who kept track c
entire project, made a number of statistical analyses, constructed
all the tables, and edited the entire report.
-v--
5.

LIST OF TABLES
Page
1. Characteristics of the sample groups. 6
2. Proportion of items selected which are unique for the fourpairs of groups by grade. 9
3. Median proportion of unique items by grade and test. 11
4. Median porportion of unique items for all possible pairs ofgroups. 11
5. Correlations between scores on unique item tests. 136. Estimated minimum proportion of unique item test variances
which are independent. 14
7. Frequencies of changes in reliability, whole test to half-test,showing greater gain (or less loss) than shown for the compari-son group. 16
8. Median item-test correlations for four tests. 179. Median item-test correlations of items selected for the original
whole test and for the resulting half-test. 1810. Frequencies of increases and decreases in point biserial cor-
relations for items selected for four tests. 2011. Frequencies of changes, whole test to half-test, in mean differ-
ences showing relatively higher scores for the comparison group. 2212. Frequencies of increases and decreases in relative differences
between unique item test means: majority test to minority test. 2213. Proportion of items selected which are unique for all possible
comparison groups for Grade 1.6. 2714. Proportion of items selected which are unique for all possible
comparison groups for Grade 3.6. 2815. Proportion of items selected which are unique for all possible
comparison groups for Grade 5.6. 2916. Proportion of items selected which are unique,for all possible
comparison groups for Grade 8.6., 3017. Proportion of items selected which are unique for all possible
comparison groups for Grade 10.o. 3118. Reliabilities and relationships between items unique to
Groups I & II, Grade 1.6. 3219. Reliabilities and relationships between items unique to
Groups I & II, Grade 3.6. 3320. Reliabilities and relationships between items unique to
Groups I & II, Grade 5.6. 3421. Reliabilities and relationships between items unique to
Groups I & II, Grade 8.6. 3522. Reliabilities and relationships between items unique to
Groups III & IV, Grade 1.6. 3623. Reliabilities and relationships between items unique to
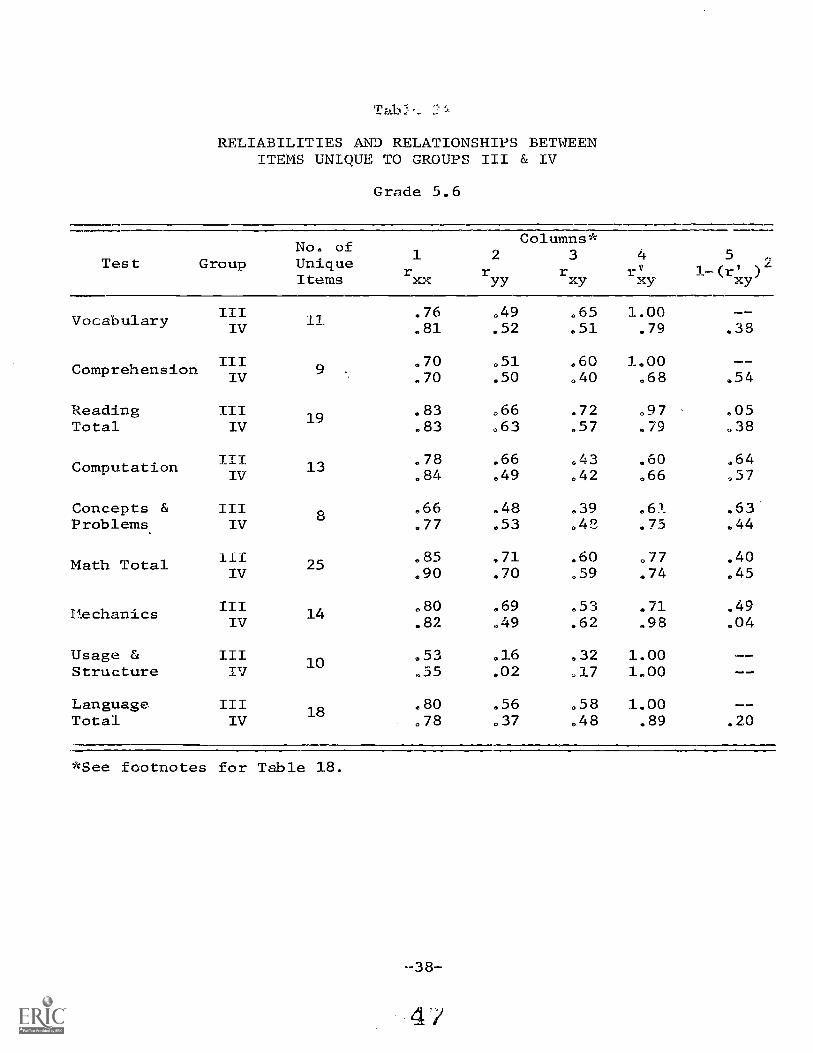
Groups III & IV, Grade 3.6. 3724. Reliabilities and relationships between items unique to
Groups III & IV, Grade 5.6. 38
-vi-

List of Tables (continued)
Page
25. Reliabilities and relationships between items unique to
Groups III & IV, Grade 8.6. 39
26. Reliabilities and relationships between items unique to
Groups III & IV, Grade 10.6. 40
27. Reliabilities and relationships between items unique to
Groups IV & V, Grade 1.6. 41
28. Reliabilities and relationships between items unique to
Groups IV & V, Grade 3.6. 42
29. Reliabilities and relationships between items unique to
Groups IV & V, Grade 5.6. 43
30. Reliabilities and relationships between items unique to
Groups IV & V, Grade 8.6. 44
31. Reliabilities and relationships between items unique to
Groups IV & V, Grade 10.6. 45
32. Reliabilities and relationships between items unique to
Groups VI & VII, Grade 1.6. 46
33. Reliabilities and relationships between items unique ti
Groups VI & VII, Grade 3.6. 47
34. Reliabilities and relationships between items unique to
Groups VI & VII, Grade 5.6. 48
35. Reliabilities and relationships between items unique to
Groups VI & VII, Grade 8.6, 49
36. Means and crossover means on unique item tests for
Groups I & II. 50
37. Means and crossover means on unique item tests for
Groups III & IV. 52
38. Means and crossover means on unique item tests for
Groups IV & V. 55
39. Means and crossover means on unique item tests for
Groups VI & VII.. 58
40. Means and standard deviations on the whole and half-tests for
northern white suburban versus northern black urban, Grade 1.6. 60
41. Means and standard deviations on-the whole and half-tests for
northern white suburban versus northern black urban, Grade 3.6. 61
42. Means and standard deviations on the whole and half-tests fornorthern white suburban versus northern black urban, Grade 5.6. 62
43. Means and standard deviations on the whole and half-tests for
northern white suburban versus northern black urban, Grade 8.6. 63
44. Means and standard deviations on the whole and half-tests forsouthern white suburban versus southern black urban, Grade 1.6. 64
45, Means and standard deviations on the whole and half-tests for
southern white suburban versus southern black rural, Grade 3.6. 65
46. Means and standard deviations on the whole and half-tests forsouthern white suburban versus southern black rural, Grade 5.6. 66
47. Means and standard deviations on the whole and half-tests forsouthern white suburban versus southern black rural, Grade 8.6. 67
-vii-

List of Tables (continued)
48. Means and standard deviations on thefor southern white suburban versus soGrade 10.6.
49. Means and standard deviations on thesouthern black rural versus southern
50. Means and standard deviations on thesouthern black rural versus southern
51. Means and standard deviations on thesouthern black rural versus southern
52. Means and standard deviations on thesouthern black rural versus southern
53. Means and standard deviations on thesouthern black rural versus southern
54. Means and standard deviations on thesouthwestern Mexican-American versusGrade 1.6.
55. Means and standard deviations on thesouthwestern Mexican-American versusGrade 3.6.
56. Means and standard deviations on thesouthwestern Mexican-American versusGrade 5.5.
57. Means and standard deviations on thesouthwestern Mexican-American versus
whole and half-testsuthern black rural,
Page
68whole and half-tests forwhite rural, Grade 1.6. 69whole and half-tests forwhite rural, Grade 3.6. 70whole and half-tests forwhite rural, Grade 5.6. 71whole and half-tests forwhite rural, Grade 8.6. 72whole and half-tests forwhite rural, Grade 10.6. 73whole and half-tests forsouthwestern Anglo-American,
74whole and half-tests forsouthwestern Anglo-American,
75
whole and half-tests forsouthwestern Anglo-American,
76whole and half-tests forsouthwestern Anglo-American.
Grade 8.6. 77
58. Reliability coefficients and standardized reliability coeffic-ients on the whole and half-tests for Groups I & II, Grade 1.6. 78
59. Reliability coefficients and standardized reliability coeffic-ients on the whole and half-tests for Groups I & II, Grade 3.6. 79
60. Reliability coefficients and standardized rel.iability coeffic-ients on the whole and half-tests for Groups I & II, Grade 5.6. 80
61. Reliability coefficients and standardized reliability coeffic-ients on the whole and half-tests for Groups I & II, Grade 8,6. 81
62. Reliability coefficients and standardized reliability coef-ficients on the whole and half-tests for Groups III & IV,Grade 1.6. 82
63. Reliability coefficients and standardized reliability coef-ficients on the whole and half-tests for Groups III & IV,Grade 3.6. 83
64. Reliability coefficients and standardized reliability coef-ficients on the w%ole and half-tests for Groups III & IV,Grade 5.6. 84
65. Reliability coefficients and standardized reliability coef-ficients on the whole and half-tests for Groups III & IV,Grade 8.6. 85

66.
67.
68.
69.
70,
71.
72.
73.
74.
75.
Reliabilityficients onGrade 10.6.Reliabilityficients onGrade 1.6.Reliabilityficients onGrade 3.6.Reliabilityficients onGrade 5.6.Reliabilityficients onGrade 8.6.11k_ iabilityficients onGrade 10.6.Reliabilityficients onGrade 1,6.Reliabilityficients onGrade 3.6.Reliabilityficients onGrade 5.6.Reliabilityficients onGrade 8.6.
List of Tables (continued)
coefficients a.rd standardized reliability coef-the whole and half-tests for Groups III & IV,
coefficients and standardized reliability coef-the whole and half-tests for Groups IV & V,
coefficients and standardized reliability coef-the whole and half-tests for Groups IV & V,
coefficients and standardized reliability coef-the whole and half-tests for Groups IV & V,
coefficients and standardized reliability coef-the whole and half-tests for Groups IV & V,
coefficients and standardized reliability coef-the whole and half-tests for Groups IV & V,
coefficients and standardized reliability coef-the whole and half-tests for Groups VI & VII,
coefficients and standardized reliability coef-the whole and half-tests for Groups VI & VII,
coefficients and standardized reliability coef-the whole and half-tests for Groups VI & VII,
coefficients and standardized reliability coef-the whole and half-tests for Groups VI & VII,
Page
86
87
88
89
90
91
92
93
94
95

PROBLEM AND OBJECTIVES
Problem
The standardized achievement and intelligence tests used in schoolsare often said to be biased against, and thus inappropriate for, childrenbelonging to disadvantaged racial and ethnic minorities. If this is sothere are two possible sources of such bias. The first may come from thepreconceptions and thought patterns of the test item writers. The secondmay come from the customary item selection procedures used in test con-struction. This second possible source of bias is the general topicinvestigated in this study.
The typical procedure in building standardized achievement andaptitude tests--essentially unchanged over many years (cf. Lord & Novick1968, Chapter 15; Ruch 1929, Chapter 2)-- is first to develop a pool ofitems meeting various specifications as to form and content. Next theseitems are given to a sample of individuals--the step in question here.Various item statistics, such as point biserial correlations (item vs.total score) , are calculated and the "best" items are then chosen, with"best" be:Ing characterized first and foremost by a high relationship ofthe item to the total score. Other characteristics such as difficultyand the effectiveness of distractors (in multiple choice tests) arealso considered. Most of these latter item characteristics are relatedto the item-test correlation to some degree. Therefore the items which"discriminate" best, i.e., show the highest relationship to total score,are the ones usually chosen. This in turn means that the characteristicsor attributes of the individuals in the tryout sample which are mostresponsible for differences in total score determine which items tendto be chosen and determine, in effect, what it is the test measureswithin the range of possibilities available in the item pool. That is,certain qualities, attitudes, knowledge or skills found in varyingdegrees in the tryout sample will have the largest differential effecton total score on the tryout test. The items most sensitive to theseattributes of the tryout sample then get selected.
Consequently, the possibi" ty exists that the items selected arebiased and discriminate against groups not adequately represented in thetryout samples. If there are traits of some atypical groups not foundin the tryout sample which interact more strongly with the items than dothe attributes they share with the majority, or if the group is uniformlylow on these latter common traits, but not on other equally relevantattributes, then in either case, one could say the resulting test isbiased. In the first instance it is biased because it measures differ-ent things for different groups unbeknownst to the users; in the secondinstance it measures only a portion of the relevant behaviors but istaken to measure them all.
If this is all true, then the use of "average" item tryout samplesmay result in the selection of item sets unsuited to one or more of the
-1-

various racial, ethnic, cultural minority groups in our schools. It maybe noted in passing that if all this is true it may also follow that nosingle tryout group can ever solve the problem--perhapi, only the con-struction of separate tests would do so although this has obviousdrawbacks. Another alternative might be to use the same test butdifferent item weights for different groups.
This study attempts to estimate how important the matter oftryout samples is. Specifically, would the use of samples drawn fromminority groups for item tryouts result in the selection of differentitems? It is customarily assumed that the choice of subjects for itemtryouts is not very important, although "atypical" groups (such as dis-advantaged children) are usually avoided. Some evidence for evaluatingthis assumption is presented in this report.
Related Literature
Prior work in this area does not seem to have dealt directly withthis particular issue. In fact, as far as achievement tests are con-cerned, very little work of any sort on the matter of bias appears to beavailable. The work on intelligence and aptitude is more extensive, butother aspects of the bias issue than the one considered here have domin-ated discussions. The present study concerns achievement tests, butsince the problem is essentially the same--as are the tests in many ways(Kelley 1927)--the intelligence test studies are relevant.
That children's intelligence test scores are related to their socialand economic status was reported by Binet and others almost 60 years agoand has been studied and argued about ever since. For a long time thesearguments largely stayed within the bounds of the much older and highlyemotional nature-nurture controversy, perhaps because many felt that thethen new tests could settle that argument (Terman 1916, pp. 19-20).Since the intensity of those arguments shows no sign of diminishing after50 years (Jensen 1969), that hope may be considered unreasonable. In
any case, the score differences favoring the more privileged elements ofsociety remain a fact (Coleman et al. 1966). It may be added that theaccusations of the misuse and the misinterpretation of scores (Hunter &Rogers 1967) are also factual in some, if not most, instances.
However, the issue here is the nature of the tests themselves.This has not been as widely studied as it might be. Apparently, thefirst serious attempt to examine test items for bias was led by AllisonDavis and his colleagues 20 years ago (Eells et al. 1951). They examinedseveral existing group intelligence tests and the items in them in anattempt to determine the factors built into the tests related to differ-ences in performance between cultural groups. They concluded: "Vari-ations in opportunity for familiar cultural words, objects, or pr,)cessesrequired for answering the test items seem . . . the most adequate
-2-
ri

general explanation. . .(Eells 1951, p. 68)." This sort of objection tostandard tests continues to be made (Wasserman 1969).
Interestingly, the subjects in the Eells study were all white anddrawn from the schools of "a western industrial city of about 100,000people." One result of the study was the publication of the Davis-EellsGames (1953) which was designed to eliminate this kind of cultural bias.Three things may be noted about this test. First, the test--now out ofprint--proved ,to yield as substantial differences between SES groups(Angelino & Shedd 1955) as other group intelligence tests. Second, theyeliminated the items that showed SES differences in difficulty providedthey could rationalize the difference as a consequence of opportunity.Lastly, they apparently did not look at the differences between SESgroups with respect to item discrimination. The common interpretationof the outcome of the Davis-Eells test and similar efforts by others ha;,been that the task of buila_ng a "culture free" or "culture fair" testmay be not only imposst.- inappropriate becauFe the test so madewould not be valid, as .eed was the case for the Davis-Eeils Games(e.g., Lorge 1966).
Anastasi (1968) pointE, Jt that while this conclusion is properthere is still the issue cf bias in prediction, anc in recent years theassertions that group intelligence tests discriminate against variousminority and disadvantaged groups in our society have tacreased innumber and vehemence. Some school systems (New York City, for example)have virtually abandoned the use of such tests (Gilbert 1966). Simi-larly some college personnel now argue that the various placement andability tests traditionally used are inappropriate (Brown & Russell 1964).Many of these arguments are sound, but those that claim the tests failto function among disadvantaged minority students in the way they do inother groups lack supporting evidence. A series of studies at both thehigh school and college levels show that academic aptitude tests predictgrades just as well in such groups as they do among more privilegedgroups (e.g., Stanley & Porter 1967; Temp 1971). Only the work of Greenand Farquhar (1965) points to a different conclusion among a half dozenor so studies on this issue. In fact some work even points the otherway, i.e., it suggests that some scholastic aptitude tests over-predictthe performance of lower class and Negro students in contrast to middleclass and white students (Hewer 1965; Cleary 1968). Data obtained byKennedy et al. (1963) show that the grandfather of them all, theStanford-Binet (Terman & Merrill 1960), produces equal or higheritem-test correlations for an all black southern sample than was reportedin either the 1937 or the 1960 standardization.
Still, there are racial and cultural differences in ability patternsas shown so clearly by Lesser, Fifer, & Clark (1965), and hence the pos-sibility continues to exist that tests based on items selected for aparticular group (such as black, ghetto children) would be less biasedand more useful for them. Bias in the sense of faulty prediction is nowbeginning to be studied extensively (Cleary & Hilton 1968; Linn & Werts1971) but bias in tests not designed to predict has not yet been reallyexplored.
-3-

Oblectives of the Study
A number of problems occur when trying to consider bias in achieve-ment tests because the criteria of bias are not crystal clear. Mostrecent writers (Cardall & Coffman 1964; Cleary & Hilton 1968; Potthoff1966; Messick and Anderson 1970; Green 1971) say something about testswhich measure different things when used with different groups.
Twt, ways in which this could occur as a consequence of the cus-tomary tryout samples and i -lection procedures were noted in thegeneral statement of the prot _ '_ove. This suggests that the charac-teristics of tryout samples ma- ITre !Inportant than usually acknow-ledged. To explore this possi_llit thi study compares the results ofusing three disadvantaged minorL_t: -roup. -northern urban olack, south-ern rural black, western Mexica -Arnrica---as tryout samples I_ contrastto white advantaged groups in t_ ne
The study attempts to determiTlead to the selection of differentdo the different items selected lethe resulting item sets selected "sense that they are more reliable(higher point biserial correlaticLin scores favoring majority groILpstryout group.
Limitations
(a) f these different groups wouldtems :om the item pool; if so, (b)ire Lfferent things; and (c) are:ter' for the minority groups in thehak&_ better functioning items(6 if the relative discrepancy
would ie reduced by using a minority
The major limitation of this study lies in the restricted natureof the item pool; all items come from an already published test. Theyare therefore preselected and may be limited in their possibility ofeliciting differential reactions from the sample groups. A pool of itemswritten with this purpose in mind'would have been better. Anotherlimitation is the somewhat uncontrolled natu,..e of the samples. Theset from which the schools were chosen was randomly selected but thespecific schools used were those appearing to meet certain criteriamost closely; in this sense the selection was arbitrary. Third itshould be noted that grade and test level are not independent; the testlevels were designed to be continuous and articulate well but they aredifferent tests. Thus the assumption made throughout the material belowthat grade differences are meaningful may not be justified. Finally,because of limitations of time and money not all relevant analyses ofthe data could be made.
METHOD
The basic data for this study were derived from that obtainedduring the standardization of the California Achievement Tests, 1970

Edition, (CTB McGraw-Hill 1970). The California Achievement Tests (CAT)have as their purpose the measurement of educational attainment and theprovision for analysis of learning difficulties. They are basicallysimilar to the 1957 edition and generally measure:
(1) the ability to understand the meaning of the content materialpresented,
(2) the performance of the student in applying rules, facts, con-cepts, conventions, and principles to solve probl -is in thebasic curricular material, and
(3) the level of performance of the student in using ti 1 tools ofreading, mathematics, and language in progressivel: morecomplicated situations.
CAT is a general achievement test battery with five overlappinglevels. The tests in the battery which were investigated in this studyare Reading Vocabulary, Reading Comprehension, Total Reading, Mathe-matics Computation, Mathematics Concepts and Problems, Total Mathematics,Language Mechanics, Language Usage and Structure, and Total Language.Total Reading, Total Mathematics, and Total Language were treated astests separate from their parts. The standardization took place earlyin 1970 and involved over 200,000 students in about 400 schools. Thesampling design called for obtaining a sample of school districts strati-fied by region (seven areas) , school district size (three categories byaverage enrollment per grade), community type (urban, town, rural ratedby density), and control (public or parochial). Within the districts,schools were chosen randomly for each test level, and all students inthe selected schools who were in appropriate grades took the test.
The items in the test came from a variety of sources but it is fairto say that they were written by and for "middle America." The tryoutsamples also fit this description. Thus the test should favor whitemiddle-class Americans if it favors any group.
Sample
All schools participating in this standardization of CAT answeredquestionnaires which provided information an the basic character of thearea served (e.g., residential suburb, inner part of a large city, etc.),the percentage of white students, the percentage of children from homeswhere another language is spoken, and the percentage of children infamilies falling in each of four SES groups defined by parental occu-pation (professional-managerial, white collar, skilled worker, unskilled).
From data on these questionnaires seven groups of schools weredrawn fol- this study from which four pairs were made for comparisons.The groups characteristics and sizes are shawn in Table 1. Thus thesamples used in this study are drawn from schools serving pupils highly
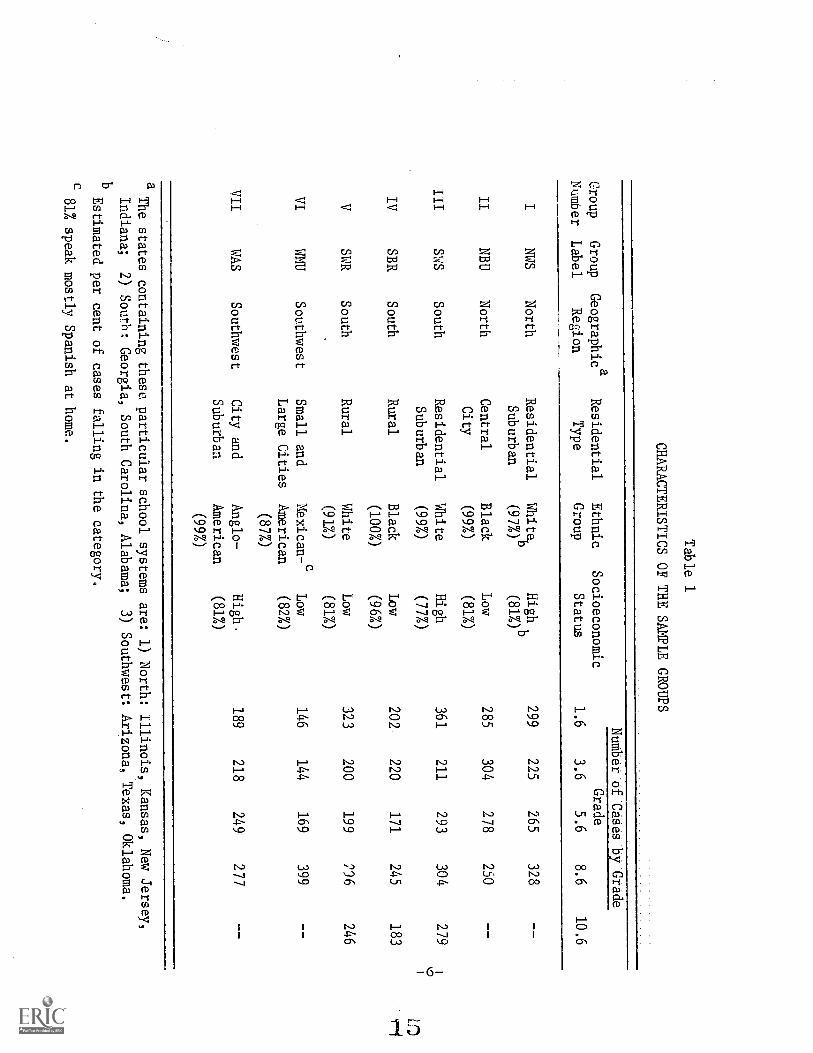
Table 1
CHARACTERISTICS OF THE SAMPLE GROUPS
Group
Number
Group
Label
Geographica
Region
Residential
Type
Ethnic
Group
Socioeconomic
Status
1.6
Number of Cases by Grade
10.6
Grade
3.6
5.6
8.6
INWS
North
Residential
Whiteb
High
299
225
265
328
Suburban
(97%)
(81%)
II
NBU
North
Central
Black
Low
285
304
278
250
City
(99%)
(81%)
III
SWS
South
Residential
White
High
361
211
293
304
279
1
Suburban
(997)
(77%)
1/4.o
1
IV
SBR
South
Rural
Black
Low
202
220
171
245
183
(100%)
(96%)
VSWR
South
Rural
White
Low
323
200
199
296
246
(91%)
(81%)
VI
WMU
Southwest
Small and
Mexican-c
Low
146
144
169
399
Large Cities
American
(82%)
(87%)
VII
WAS
Southwest
City and
Anglo-
High.
189
218
249
277
Suburban
American
(81%)
(99%)
aThe states containing these particular school systems are: 1) North: Illinois
Kansas, New Jersey,
Indiana;
2) South: Georgia, South Carolina, Alabama;
3) Southwest: Arizona, Texas, Oklahoma.
Estimated per cent of cases falling in the category.
c81% speak mostly Spanish at home.

homogc. ous with resrect to ethnic background and rather homogeneouwith re.3pect to socioeconomic status. Only at grade 10 was it notsible to always f-nd schools meeting these criteria in the standard-tion population; sufficiently segregated tenth grades were found or inthe So _u.
The groups were paired for comparisons as follc 3:
a.
b.c.
d.
Northern, black, central city (NBU) versussuburban (NWS).Southern black rural (SBR) versus SouthernSouthern black rural (SBR) versus SouthernSouthwestern Mexican-American (WMU) versusAmerican suburban (WAS).
1.orthern white
white suburban Cwhite rural (SWRSouthwestern Anc
Enough schools meeting the appropriate criteria to provide bet7geen150 and 300 students for each group at each of five grade levels wereselected. The grade levels are 1, 3, 5, 8 and 10 so that each of thefive levels of the CAT battery is included. Grade 10 comparisons we:made in the South only as noted above. Most comparisons were made f:each of the nine tests of the battery listed above.
DatA_Analmia
Four sorts o2 analyses were made.
(1) The basic procedure used for examining the data was an itemselection routine. Each of the seven groups was treated as a tryoutsample with the items in each test functioning as an item pool. The"best" half of the items for each group were identified by noting thoseitems with the highest item-test correlations within =he group covered.The number and per cent of items chosen for one member of a pair ofgroups but not the other was recorded. The number of these "unique"items indicate the degree to which diEferent groups interact in a uniquemanner with the test items. All 21 possible pairs of groups were com-pared this wa); all the remaining analyses were made only for the fourpairs listed above.
(2) Scores for each group in a pair were obtained on both sets ofunique items and the correlation between the two sets of scores wasfound; from these correlations, estimates of the variance not common tothe two unique item "tests" were made to judge how different the sets ofitems really are in what they measure. Thus this analysis supplementsthe first.
(3) Another analysis consisted of examiting and comparing wholetest and half-test KR 20 reliability estimates since differential reli-ability would be a f-arm of bias indicating that the test scores have alarger error component in one group than they do in another group.
-7-

(4) Finally, mean scores on whole, half, and unique tests wereexamined for changes in relative status of the groups as a result ofitem selection.
The identification of the items with the highest point biserialcorrelations was dene separately for each of the seuen groups on eachof the nine kinds of tests, each having five levels. Note that theTotal Reading, Mathematics, and Language tests were treated separatelyfrom their parts. Actually, there were only 274 separate analysesrather than the 315 possible ones (7 x 9 x 5) because of the missingGrade 10 data noted above and because no analyses were made of theTotal Language scores in grades 1, 5, and 8 for the NWS group, and ingrades 1 and 8 in the NBU group.
RESULTS
Proportion of Unique Items
The results of these analyses were a series of tests "best" foreach group, half as long as the original test--when N was odd theexpression (N4-1)/2 was used to determine the length of the half-test.The nc-xt step was to identify those items selected for only one of thetwo members of a pair. Obviously, the number of such items is thesame for both groups. This number as a proportion of the items inthese half-tests is an index of the degree to which the item selectionprocedure produces a different test for the two groups. Table 2exhibits these proportions for the four basic comparison groups.
The overall median proportion is approximately .30. The proportionsdo not appear to vary systematically by grade or test (see Table 3).However, certain groups appear considerably more like each other thanare others by the criterion of the relative size of these proportions.It can be readily seen from Table 2 that the WMU-WAS (VI vs. VII)groups differ more than do the other 3 pairs. Groups SBR (IV) and MdR(V) differ the least. These proportions of unique items for all 21comparisons can be found in Tables 13-17 in the Appendix.
The medians of these proportions for the various possible pairs areShown in Table 4. As expected, the white middle-class groups are con-sistently more like each other (these pairs have lower medians) thanthey are like the minority groups; The latter also have more in commonthan they share with the three majority groups. The SWR group (V) doesnot fully fit into this otherwise clear pattern. However, in generalthey appear more like the three minority groups than they resemble thethree suburban groups. Of course, economically they are undoubtedlymore disadvantaged than these three, albeit much less so than the south-ern black group.
-8-

Tab le 2
PROPORTION OF ITEMS SELECTED WHICH ARE UNIQUEFOR THE FOUR PAIRS OF GROUPS BY GRADE
Number of Groups ComparedGrade 1.6 Items Selected I & II III & IV IV & V VI & VII
Vocabulary 46 41 33 35 59Comprehension 12 25 58 31 42Reading Total 58 40 36 34 69Computation 20 15 25 40 25Concepts & Problems 24 42 38 42 58Math Total 44 16 25 23 41Mechanics 19 42 21 21 58Usage & Structure 10 30 30 40 40Language Total 37 24 27 54
Grade 3.6
Vocabulary 20 30 65 35 45Comprehension 23 22 26 22 35
Reading Total 43 28 42 28 33Computation 36 17 28 22 25Concepts & Problems 23 35 48 35 43Math Total 59 29 32 30 32Mechanics 33 48 42 30 45Usage & Structure 13 31 46 23 46Language Total 46 41 30 28 48
Grade 5.6
Vocdbulary 20 50 55 35 70Comprehension 21 48 43 29 52Reading Total 41 46 46 37 61Computation 34 41 38 21 41concepts & Problems 20 50 40 20 55Math Total 54 44 46 20 46Mechanics 40 45 35 25 53Usage & Structure 21 33 48 38 33Language Total 61 30 16 26

Table 2 Continued
Number of Groups ComparedGrade 8.6 Items Selected I & II III & IV IV & V VI &
Vocabulary 20 40 15 15 45
Comprehension 23 22 39 30 39
Reading Total 43 26 23 21 44
Computation 24 25 46 29 29
Concepts & Problems 25 36 40 36 28Math Total 49 29 49 35 29
Mechanics 36 42 33 42 39
Usage & Structure 25 36 56 32 16
Language Total 61 15 15 18
Grade 10.6
Vocabulary 20 55 40Comprehension 23 22 22Reading Total 43 42 30Computation 24 33 33Concepts & Problems 25 4G 32
Math Total 49 33 24Mechanics 40 38 35Usage & Structure 27 41 30Language Total 67 21 19
Median for all tests and all grades 35 38 30 43
VII

Table 3
MEDIAN PROPORTION OF UNIQUE ITEMS BY GRADE AND TEST
GradeTest 1.6 3.6 5.6 8.6 10.6 All Grades
Vocabulary. 33 40 45 25 40 35
Comprehension 42 26 33 30 22 30
Reading Total 36 30 41 26 30 33
Computation 25 25 29 29 33 25
Concepts & Probrems 38 35 35 28 32 35
Math Total 30 29 37 29 24 29
Mechanics 32 33 35 35 35 33
Usage & Structure 40 31 33 28 33 33
Language Total 30 30 21 18 19 24
ALL TESTS BY GRADE 33 30 35 29 30 30
Table 4
MEDIAN PROPORTION OF UNIQUE ITEMS FOR ALL POSSIBLE PAIRS OF GROUPS
GROUPGroup I II III IV V VI VII
I 36 26 35 30 38 26
II 36 33 26 25 25 41
III 26 33 38 30 33 27
IV 35 26 38 30 30 41
V 30 25 30 30 24 33
VI 38 25 33 30 24 -- 43
VII 26 41 27 41 33 43
-11-

Independence of the Unique Item Tests
All groups differ from each other and some of the differences appear
to be substantial. However, it is possible that these sets of "unique"
items still measure pretty much the same thing, To check out this pos-
sibility, scores for each individual were obtained on both sets of unique
items. This was possible since each individual answered all items. The
correlations between these two scores were obtained for each group on
each test (see Table 5). The number of unique items was very small in
many cases. Consequently, the rellabilities are low. Full data on these
unique item tests can be found in Tables 18 through 53 in the Appendix.
One way to avoid exaggerating the apparent lack of relationship
between the measures because of low reliability is to correct for
attenuation; the result is a figure (r' ) which is an index of thexY
maxJmum amount of relationship possible given completely reliable tests.
But we are interested in the degree to which scores on the pairs of uni-
que tests vary independently, that is, in their lack of relationship.
The square of the correlation (
variance and the difference between
then an estimate of the proportion o2occurs independently. Thus, (1-r'
xYportion of Independent variation in
r ) is an estimate of the commonxythat figure and one:(1-r2 ) isxyf the variance of these scores that
) is an estimate of the minimum pro-
the two sets of scores. Table 6
shows such estimates for the unique item tests. Since these are minimum
estimates, it clearly follows that in many instances they are measuring
quite different things and as a rule do so for both groups involved.
Changes in Test Characteristics
The data examined so far are concerned with the possibility of bias
stemming from items which measure different things when used with
different groups. A special case of this kind of bias occurs if the
test scores of one group contained substantially more error than they do
for another group. The reliabilities for each group by test can be
found In Tables 36 through 53 in the ,tppendix. The overall median
-12-
21

Table 5
CORRELATIONS BETWEEN SCORES ON UNIQUE ITEM TESTS
Tests 1.6 3.6Grades
5.6 8.6 10.6
VocabularyComprehensionReading TotalComputationConcepts & ProblemsMath TotalMechanicsUsage & StructureLanguage Total
I II I II I II I II
.34
.25
.42
.49
.48
.41
.46
.42
.37
.03
.38
.38
.53
.40
.41
.15
.40
.69
.79
.45
.64
.72
.62
.41
.65
.46
.55
.64
.50
.49
.63
.58
.33
.53
.49
.55
.60
.35
.35
.47
.50
.12
.25
.36
.34
.39-119
.51
.48
.20
.57
.43:51.51.51.66.47.19
.54
.27
.43
.44
.44
.54
.58
.16
III IV III IV III IV III IV III IV
Vocabulary .54 .77 .35 .57 .65 .51 .49 .33 .63 .35Comprehension .09 .72 .42 .61 .60 .40 .59 .29 .40 .19Reading Total .50 .78 .57 .76 .72 .57 .65 .46 .70 .34Computation .5,7 .77 .39 .43 .43 .42 .51 .20 .58 .66Concents & Ptoblems .5i, .76 .42 .76 .39 .48 .62 .49 .58 .36Math Total .62 .79 .60 .68 .60 .59 .68 .50 .64 .59Mechanics .33 .56 .67 .59 .53 .62 .64 .66 .62 .68Usage & Structure .27 .60 .34 .33 .32 .17 .18 .08 .35 .07Language Total .56 .79 .54 .48 .58 .48 .46 .43 .39 .40
IV V IV V IV V IV V IV V
Vocabulary .67 .63 .54 .62 .48 .61 .33 .44 .37 .47Comprehension .50 .30 .61 .55 .41 .52 .30 .35 .02 .28Reading Total .67 .65 .71 .74 .65 .73 .47 .55 .44 .56Computation .73 .67 .63 .68 .41 .42 .23 .54 .69 .67Concepts & Problems .77 .68 .71 .67 .37 .46 .44 .57 .27 .44Math Total .76 .69 .82 .81 .58 .58 .42 .65 .56 .58Mechanics .69 .24 .53 .59 .57 .62 .58 .60 .58 .54Usage & Structure .57 .39 .25 .49 .08 -.02 -.04 .14 .09 .29Language Total .69 .42 .57 .70 .42 .61 .37 .40 .43 .43
VI VII VI VII VI VII VI VII
Vocabulary .34 .46 .53 .47 .44 .66 .42 .44Comprehension .10 .61 .61 .64 ,32 .53 .49 .61Reading Total .20 .54 .53 .65 .51 .73 .58 .62Computation .32 .41 .50 .52 .37 .45 .39 .45Concepts & Problems .47 .68 .64 .44 .33 .34 .39 .40Math Total .58 .67 .52 .61 .35 .45 .50 .62Mechanics -.17 .64 .54 .63 .46 .59 .63 .61Usage & Structure .19 .50 .22 .37 -.08 .17 .06 .20Language Total .15 .60 .43 .60 .21 .48 .33 .39
-13-

Table 6
ESTIMATED MINIMUM PROPORTION OF UNIQUE ITEM TEST VARIANCESWHICH ARE INDEPENDENT
Tests 1.6 3.6Grades
5.6 8.6 10.6
Vocabulary .79 .77 .76 .55 .46 .84 .07 .20
Comprehension 1.00 .15 .27 .44 .56
Reading Total .67 .75 .02 .26 .38 .74 .35 .54
Computation .28 .68 -31 .54 .72 .70 .22 .45
Concepts & Problems .39 .31 .69 .49 .29 .18Math Total .55 .49 .06 .36 .60 .53 .12 .30
Mechanics .62 .61 .48 .39 .62 .55 .58 .47
Usage & Structure -- .43 .44 .55 .07 .33 .85
Language Total .42 .45
III IV III IV III IV III IV III IV
Vocabulary .37 .14 .78 .44 .38 .17 .13 .47
Comprehension .93 .13 .41 .54 .17 .31 .29
Reading Total .42 .19 .21 .06 .05 .38 .06 .05 .10 .51
Computation .20 .71 .73 .64 .57 .48 .88 .14 .20
Concepts & Problems .07 -- .03 .63 .44 .17 .06 .05 .64
Math Total .06 .14 .34 .40 .45 .45 .46 .29 .43
Mechanics .67 .21 .26 .48 .49 .04 .30 .24 .30 .34
Usage & Structure .55 .53 .85 .94
Language Total .47 .60 .20 .33 .33 .71 .62
IV V IV V IV V IV V IV V
Vocabulary .40 .36 .31 .28 .13 .06 .15 .17 .28
Comprehension .45 .45 .20 .23 .21 .60 .92 .38Reading Total .43 .32 .10 .03 .09 .04 .16 .15
Computation .27 .37 .22 .06 .52 .59 .65 .35 .14 .08
Concepts & Problems .05 .06 .04 .39 .17 .14 .73 .28Math Total .08 .14 .32 .38 .49 .27 .39 .30Mechanics .16 .74 .49 .42 .28 .29 .51 .42 .52 .55Usage & Structure .29 .50 .89 .98 .97 .61 .75 --Language Total .27 .44 .39 .15 .23 .51 .44 .54 .66
VI VII VI VII VI VII VI VII
Vocabulary .64 .65 .41 .54 .62 .15 .59 .60Comprehension -- .06 .09 .07 .66 .35 .18 .06Reading Total .90 .62 .49 .17 .52 .11 .40 .37Computation .80 .67 .46 .30 .69 .57 .70 .57Concepts & Problems .18 .09 .03 .22 .70 .60 .46 .27Math Total .28 .25 .58 .30 .80 .62 .51 .11Mechanics .91 .45 .33 .35 .55 .47 .32 .37Usage & Structure .86 .86 .39 .93 .67 .96 --Language Total .92 .42 .66 .45 .87 .48 .72 .66
-14-

KR 20's for groups I through VII are .91, .91, .91, .92, .93, .90, and.92 respectively. Obviously, there is little evidence of bias by thiscriterion, although a test-by-test comparison of these reliabilitiesshows that the figures are mostly higher for the majority group (97of 162 comparisons).
Another way of considering this matter is to examine the changes inreliability stemming from selecting the 'best" half of the items. Sincethe items chosen for these half-tests were those with the highest pointbiserial correlations for that group, the shorter tests should not beas relatively unreliable as one might otherwise expect. Because reli-ability is a function of the number of items, all the reliabilities onboth whole and half-tests were converted or standardized to what theywould become on 100 item tests (100-item-KR 20 = 100 r/[N + (100-N)r]where "r" is the original reliability and N is the original number ofitems).
These 100 item KR 20's are shown in Tables 58 through 75 in theAppendix. With few exceptions, they are high and adequate. However,the point of interest is the relative change in these figures for thecomparison groups when the "best" items for the respective groups areselected. If the original set contains much bias in the sense that itlacks reliability, one might expect that the half-test KR 20's wouldincrease more (or decrease less) relative to the figure for the fulltest for the group against which it is biased. Assessing these 100item KR 20's on this basis produces the data in Table 7. In general,the result favors a hypothesis of bias against the minority groups, butthis effect does not appear until Grade 5 for the white versus blackcomparisons. In Grades 1 and 3 the reverse tends to be true for thesepairs. While these changes in relative size do not appear to be attri-butable to chance, they are large in only a few instances and cannottherefore be treated as very important.
A related question is what happens to the individual items whenthey are part of a "best set." In particular, are the point biserialcorrelations (item-test correlations) better for the items when part ofthe half-test than when part of the whole test? When the CaliforniaAchievement Test was originally constructed, the minimum accepted pointbiserial for items included was 0.25; naturally, a number of itemsperformed less well for the groups in this study, and many of theseitem test correlations (about 10%) were less than 0.25. The mediancorrelations (and/or cutting points) for four of the tests are shown inTable 8.
The median point biserials for the best half of the items selectedfrom these tests are shown in Table 9 along with the medians for thesesame items when related to half-test scores. As Table 9 suggests, thesecorrelations in the half-tests do tend to improve modestly, about .02,indicating that the resulting half-tests are slightly better for thevarious groups after selection. Furthermore, this improvement occursfor most items in all groups at all grade levels in each of the fourtests checked, as can be seen iu Table 10. However, not only is the

Table 7
FREQUENCIES OF CHANGES
IN RELIABILITY, WHOLE TEST TO
HALF-TEST,a
SHOWING GREATER GAIN (OR LESS LOSS)
THAN SHOWN FOR THE COMPARISONGROUP
Grade
GroLisComareMinoriii
All Pairs
x2
1
oHI
nC\I
I vs. II
III vs.
Iv
VIV
VII vs. VI
1.6
3.6
5.6
8.6
10.8
All Grades
X2
53
54
17
26
13
20
1.5
NS
88000
99
3.8
NS
11999
16
81.;
411
26
1.1
NS
1,1
58R
19
276
09
36
323
11.1
.001.
23
12
21
15
530
629
117
56
103
13.9
.001
3.5
1.0
17.8
15.1
16.0
13.9
NS
NS
.001
.001
.001
.001
aAll reliabilities were standardized to
100-item length before differences were
bEqual changes were classified as favoring
the majority group

Table 8
MEDIAN ITEM-TEST CORRELATIONSFOR FOUR TESTS
Group. IV V VI VII
Grade 1.6
Vocabulary .323 .353 .394 .576 .434 .301 .395Comprehension .389 .323 .367 .593 .443 .197 .556Computation .549 .558 .520 .647 .614 .524 .572Mechanics .476 .526 .422 .653 .414 .247 .566
Grade 3.6
Vocabulary .594 .540 .452 .497 .537 .508 .524Comprehension .579 .474 .473 .522 .522 .463 .534Computation .451 .511 .370 .505 .483 .423 .433Mechanics .509 .420 .455 .476 .471 .416 .468
Grade 5.6
Vocabulary .448 .410 .463 .423 .475 .416 .453Comprehension .406 .385 .449 .401 .414 .352 .409Computation .353 .402 .394 .411 .442 .391 .342Mechanics .417 .375 .413 .419 .475 .336 .403
Grade 8.6
Vocabulary .388 .448 .501 .411 .490 .445 .445Comprehension .387 .334 .436 .304 .403 .371 .443Computation .450 .438 .459 .375 .481 .485 .458Mechanics .362 .444 .513 .477 .450 .449 .444
Grade 10.6
Vocabulary .438 .333 .376Comprehension .392 .277 .350Computation .440 .533 .489Mechanics .416 .508 .459

Table 9
MEDIAN ITEM-TEST CORRELATIONS OFITEMS SELECTED FOR THE ORIGINAL WHOLE TEST
AND FOR THE RESULTING HALF-TEST
Vocabulary
Whole Half
Comprehension
Whole Half
Computation
Whole Half
Mechanics
Nhole Half
Group I
Grade 1.6 .414 .450 .488 .508 .674 .685 .582 .649
Grade 3.6 .6-4 .733 .674 .688 .580 .617 .594 .584
Grade 5.6 .f-9 .535 .467 .499 . .472 .468 .=94 .479
Grade 8.6 L 9 .481 .A56 .490 .519 .549 .444 .42i;
Group IT
Grade 1.6 /35 .446 .408 .474 .624 .642 .580 .645
Grade 3.6 .584 .619 .592 .624 .617 .604 .510 .534
Grade 5.6 .469 .524 .440 .463 .519 .508 .499 .488
Grade 8.6 .524 .538 .417 .449 .549 .538 .543 .529
Group III
Grade 1.6 .429 .467 .424 .474 .621 .699 .599 .674
Grade 3.6 .519 .533 .570 .592 .508 .563 .594 .624
Grade 5.6 .499 .479 .524 .508 .474 .463 .466 .483
Grade 8.6 .574 .581 .481 .513 .549 .567 .558 .558
Grade 10.6 .517 .549 .433 .458 .521 .549 .486 .506
Group IV
Grade 1.6 .555 .578 .605 .674 .654 .724 .706 .735
Grade 3.6 .542 .563 .555 .583 .588 .580 .574 .563
Grade 5.6 .494 .517 .490 .547 .483 .508 .521 .505
Grade 8.6 .499 .513 .399 .385 .404 .467 .574 .556
Grade 10.6 .383 .449 .449 .474 .620 .645 .622 .617
Group V
Grade 1.6 .549 .538 .524 .574 .658 .688 .463 .481
Grade 3.6 .584 .608 .620 .604 .567 .574 .545 .565
Grade 5.6 .538 .569 .458 .524 .574 .599 .538 .569
Grade 8.6 .570 .599 .430 .499 .549 .534 .481 .510
Grade 10.6 .435 .499 .411 .433 .563 .590 .539 .530
-18-

Table 9 (Continued)
MEDIAN ITEM-TEST CORRELATIONS OFITEMS SELECTED FOR THE ORIGINAL WHOLE TEST
AND FOR THE RESULTING HALF-TEST
Vocapulary Comprehension ComprehenSion Mechanics
Whole Half Whole Half Whole Half Whole Half
Group VI
Grade 1.6 -1'86 .413 .288 .274 .583 .613 .308 .338
Grade 3.6 .540 .569 .511 .535 .563 .599 .513 .505
Grade 5.6 .496 .508 .467 .492 .495 .513 .436 .457
Grade 8.6 .542 .563 .449 .474 .511 .542 .492 .47?
Group VII
Grade 1.6 .-,81 .517 .613 .674 .688 .774 .699 .774
Grade 3.6 .608 .749 .599 .611 .539 .556 .543 .567
Gracie 5.6 .513 .506 .470 .454 .421 .413 .461 .485
Grade 8.6 .479 .549 .591 .517 .504 .538 .514 .540

Table 10
FREC.ZENCY OF INCREASES AND DECREASES IN POINT BISERIALC:JRRELATIONS FOR ITEMS SELECTED FOR FOUR TESTS
GroupIV V VI VII
Grade 1.(i I Da ID ID I.D IDID I D
--
Vocabulary 37 9 34 11 35 11 35 11 37 8 34 12 32 14
Comprehension 11 1 10 2 11 1 11 1 11 1 6 5 11 1
Computation 17 2 17 3 13 7 12 8 18. 2 15 5 16 4
Mechar_cs 14 5 17 2 15 4 14 5 15 4 11. 8 15 4
Grade 3,;
Vocabu2T 17 3 19 1 16 4 18 2 20 0 18 2 17 3
ComprehemFion 21 2 18 3 21 2 20 3 21 2 20 3 19 3
Computation 24 12 29 7 24 11 24 11 22 12 28 7 30 6
Mechanics 20 13 25 7 21 11 23 10 19 13 25 7 17 15
Grade 5.6
Vocabulary 15 5 18 2 18 1 13 7 16 4 17 3 16 4
Comprehension 17 3 18 3 16 4 18 3 15. 5 16 5 17 4
Computation 24 10 21 13 27 6 22 11 25 9 28 6 26 8
Mechanics 23 17 29 10 33 7 26 14 27 12 30 9 28 12
Grade 8.6
Vocabulary 17 3 20 0 20 0 18 2 18 2 20 - 18 2
Comprehension 20 3 20 3 22 1 18 5 19 4 21 1 22 -
Computation lb 8 20 1 18 6 19 4 21 3 17 7 19 5
Mechanics 25 11 24 12 24 12 27 9 29 7 32 4 25 10
Grade 10.6
Vocabulary 16 4 16 4 20 0Comprehension 22 1 21 2 20 3
Computation 20 4 19 5 22 1
Mechanics 27 13 31 9 23 11
a_ = IncreaseD = Decrease
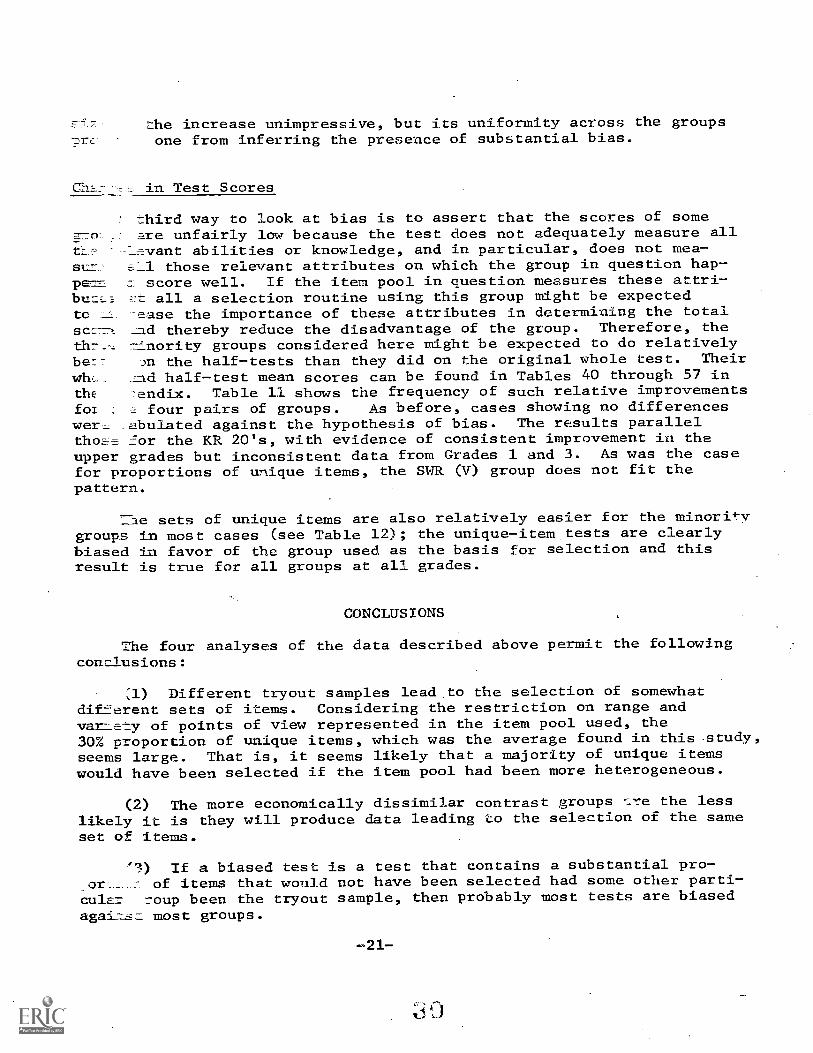
Lhe increase unimpressive, but its uniformity across the groupsone from inferring the presence of substantial bias.
in Test Scores
hird way to look at bias is to assert that the scores of someare unfairly law because the test does not adequately measure all
tL- Lavant abilities or knowledge, and In particular, does not mea-st= e_1 those relevant attributes on which the group in question hap-
score well. If the item pool in question measures these attri-bu:E_I all a selection routine using this group might be expectedto __ -ease the importance of these attributes in determining the totalsc:77-,, _ad thereby reduce the disadvantage of the group. Therefore, thethr,_ --:fnority groups considered here might be expected to do relativelybe:- pn the half-tests than they did on the original whole test. Theirwh_ ::ad half-test mean scores can be found in Tables 40 through 57 inthe -andix. Table 11 shows the frequency of such relative improvementsfom , four pairs of groups. As before, cases showing no differenceswer_ _abulated against the hypothesis of bias. The results parallelthose for the KR 20's, with evidence of consistent improvement la theupper grades but inconsistent data from Grades 1 and 3. As was the casefor proportions of unique items, the SWR (V) group does not fit thepattern.
The sets of unique items are also relatively easier for the minoritygroups in most cases (see Table 12); the unique-item.tests are clearlybiased tn favor of the group used as the basis for selection and thisresult is true for all groups at all grades.
CONCLUSIONS
The four analyses of the data described above permit the followingconclusions:
Different tryout samples lead to the selection of somewhatdifferent sets of items. Considering the restriction on range andvara-zy of points of view represented in the item pool used, the30% 'Proportion of unique items, which was the average found in this study,
seems large. That is, it seems likely that a majority of unique itemswould have been selected if the item pool had been more heterogeneous.
(2) The more economically dissimilar contrast groups e the lesslikely it is they will produce data leading o the selection of the sameset of items.
'3) If a biased test is a test that contains a substantial pro-or of items that would not have been selected had some other parti-cula= _coup been the tryout sample, then probably most tests are biasedagat:Ls.:: most groups.
-21-

Table 11
FREQUENCIES OF CHANGES, WHOLE TEST TO HALF-TEST, INMEAN DIFFERENCES SHOWING RELATIVELY HIGHER SCORES FOR THE
COMPARISON GROUP
Grade II & I IV
Comparison Groups
& VII All Pairs X2& III 'IV & V VI
1.6 7 1 1 8 2 7 7 2 17 18 0.1 NS3.6 2 7 8 1 4 5 4 5 18 17 0.1 NS5.6 7 1 8 1 1 8 8 1 24 11 4.8 .058.6 8 0 t6 3 6 3 6 3 32 9 12.6 .001
10.6 6 3 7 2 13 5 3.6 NSAllGrades 24 9 29 16 20 25 25 11 104 60 11.8 .001
X 6.8 3.8 0.6 5.4 31.8.01 .05 NS .02 .001
Table 12
FREQUENCY OF MEAN DIFFERENCES ON THE MINORITY GROUP UNIQUE ITEMTESTS WHICH FAVOR EACH COMPARISON GROUP WHEN CONTRASTED WITH MEAN
DIFFERENCES ON THE MAJORITY GROUP UNIQUE ITEM TESTa
Grade II & I
Comparison Groups
VI & VII All Pairs X2IV & III IV & V
1.6 5 3 6 3 8 1 8 1 27 8 10.3 .013.6 5 4 5 4 3 6 7 2 20 16 0.4 NS5.6 7 1 5 4 7 2 7 2 26 9 8.3 .018.6 8 0 9 0 6 3 5 4 28 7 12.6 .001
10.6 6 3 5 4 11 7 0.9 NSAllGrades 25 8 31 14 29 16 27 9 132 47
X7
8.8 6.4 3.8 9.0 26.6.01 ,02 .05 .01 .001
aLet XN = minority mean on minority test, im = majority mean on minc-f:ity test
YN = minority mean on majority test, Y = majority mean on majoty test
Then VeN-(ik-iiN)>0 favors minority, -127141-(5Eti-TeN).<0 favor- majority
-22-

(4) By this criterion of bias, the tests used here are more biasedagainst minority groups than against middle-class white children. Thisis probably true for most published batteries of standardized tests.
(5)criteriondifferentselectionuniformlygroup.
The proportion of unique items is a fairly good but unevenof bias since in most cases these unique item tests do measurethings. What is measured depends on which group is used forand which group is being tested. This conclusion is nottrue and varies widely according to test, grade, and tryout
(6) The general quality of the half-tests was improved only veryslightly by the item selection procedure, presumably because all theitems were already a product of an item selection procedure and becausethe pool is rather homogeneous in style and point of view.
(7) The half-tests did improve more over the whole test for theminority groups than for the majority groups, but this improvement issmall in both kinds of groups and suggests minimal bias of this sort inthese tests.
(8) The use of items particularly suited to a tryout group willimprove the chances of good scores among individuals from similargroups. This outcome is particularly likely in the upper grades.
(9) The amount of relative improvement in score that a minoritygroup can expect to gain by using tryout groups like itself is notvery large. This relative improvement is most unlikely to overcome anylarge discrepancy between typical scores in that group and those in morefavored groups.
(10) It should be possible to build tests somewhat biased in favorof any group by using a fair sample of that group for item selectiondata.
RECOMMENDATIONS
(1) Those engaged in test construction and publishing must consi-der carefully the nature of their tryout groups. Probably the use ofseveral identifiable vinority groups for separate data analyses isdesirable. Experience regarding the effects of variations in tryoutgroups is badly needed.
(2) Also needed are studies of the effects ofof view among those contributing to the item poolewriters produce items better for black children?
(3) More research should be undertaken on theand value of the various possible criteria of bias,possibilities not considered here.
-23-
variation in pointsWould black item
relative importanceincluding the
BIBLIOGRAPHY
Angelino, H., & Shedd, C. L. An initial report of a validationstudy of the Davis-Eells Test of General Intelligence orProblem-Solving Ability. Journal of Psychology, 1955, 40, 35-38.
Brown, W. M., & Russell, R. D. Limitations of admissions testingfor the disadvantaged (letter). The Personnel and GuidanceJournal, 1964, 43 (3), 301-304.
Cardall, C., & Coffman, W. E. A method for comparing the performanceof different groups on.the items in a test. College EntranceEthamination Board Research and Development Reports, 1964, RB 9.
Cleary, T. A. Test bias: prediction of grades of Negro and whitestudents in integrated colleges. Journal of EducationalMeasurement, Summer 1968, 5, 115-124.
Cleary, T. A., & Hilton, T. L. An investigation of item bias.Educational and Psychological Measurement, 1968, 28, 61-75.
Coleman, J. S., et al. Equality of Educational Opportunity. U. S.Dept. of Health, Education, & Welfare, 1966.
Eells, K., Davis, A., Havighurst, R. J., Herrick, V. E., Tyler,R. W. Intelligence and Cultural Differences. Chicago: Universityof Chicago Press, 1951.
Einhorn, H. J., & Bass, A. R. Methodological considerations relevantto discrimination in employment testing. Psychological Bulletin,1971, 75 (4), 261-269.
Gilbert, H. B. On the IQ ban. Teachers College Record, 1966, 67,282-285.
Green, D. R. Biased tests. 1971 (unpublished manuscript).
Green, R. L., & Farquhar, W. W. Negro academic motivation andscholastic achievement. Journal of Educational Psychology, 1965,56, 241-243.
Hewer, V. H. Are tests fair to college students from homes with lowsocio-economic status? Personnel and Guidance journal, 1965, 43,764-7o9.
Hunter, L. B., & Rogers, F. A. Testing: politics and pretense.The Urban Review, 1967, 2 (3), 5-6, 8, 25-26.
-24-
33

Jensen, A.Harvard
Kelley, T.N. Y.:
R. How much can we boost IQ and scholastic achievement?Educational Review, 1969, 39 (1), 1-123.
L. Interpretation of Educational Measurements. Yonkers,World Book, 1927.
Kennedy, W. A., Van De Reit, V. & White, J. C. A normative sampleof intelligence and achievement of Negro elementary schoolchildren in the southeastern United States. Monographs of theSociety fbr Research in Child Development, 1963, 28, No. 6.
Lesser, G. S., Fifer, C., & Clark, D. H. Mental abilities of childrenfrom different social-class and cultural groups. Monographs ofthe Society for Research in Child Development, 1965, 30 (4, WholeNo. 102).
Linn, R. L., & Werts, C. E. Considerations for studies of test bias.Journa'. of Educational Measurement, Spring 1971, 8 (1), 1-4.
Lord, F. M., & Novick, M. R. Statistical Theories of Mental TestScores. Reading, Mass.: Addison-Wesley, 1968.
Lorge, I. Difference or bias in tests of intelligence. InA. Anastasi (Ed.) Testing Problems in Perspective. Wash-ington, D.C.: American Council on Education, 1966, 456-471.
Messick, S., & Anderson, S. Educational testing, individual develop-ment, and social responsibility. The Counseling Psychologist,1970, 2 (2), 80-88.
Potthoff, R. F. Statistical aspects of the problem of biases inpsychological tests. University of North Carolina Institute ofStatistics Mimeo Series, 1966, No. 479.
Ruch, G. M. Irrie Objective or New-type Examination. Chicago:Scott, Foresman and Co., 1929.
Stanley, J. C., & Porter, A. C. Correlation of Scholastic AptitudeTest scores with college grades for Negroes -.7ersus whites.Journal of Educational Measurement, 1967, 4, 199-218.
Temp, G. Test bias: validity of the S.A.T. for blacks and whitesin thirteen integrated institutions. College Entrance Examina-tion Board _Research and Development Reports, 1971, RE. 712.
-25-

Terman, L. M. The Measurement of Intetlig2nce. Boston: HoughtonMifflin, 1916.
Terman, L. M., & Merrill, M. A. Stanfbrd-Binet Intelligence '-ale:Manual fbr the Third Revision, Form L-M, Boston: HoughtonMifflin, 1960.
Wasserman, M. Planting pansies on the roof. The Urban Review,1969, 3 (3), 30-35.

Table 13
PROPORTION OF ITEMS SELECTED WHICH ARE UNIQUEFOR ALL POSSIBLE PAIRS OF GROUPS FOR GRADE 1.6
PAIRS Vocab. Compr.TESTS
Read. Compu. Probs.Total
Math. Mech.Total
Usage Lang.Total
I & II 41 25 40 15 42 16 42 30
I & III 26 17 29 10 25 18 16 30 --
1 & IV 35 58 34 20 38 25 26 50 --
1 & V 41 25 40 35 25 18 32 20 --
I & Vi 48 50 47 25 42 30 58 20 --
I & VII 33 25 33 5 38 36 21 30
II & III 30 17 29 10 46 30 32 50
II & IV 26 58 3E 30 50 25 21 50
II & V 17 42 26 20 29 23 21 40 --
II & VI 30 42 26 25 33 20 37 20
II & VII 6? 42 64 15 42 36 32 50 --
III & IV 33 58 36 25 38 25 21 30 24
III & V 24 33 26 30 38 30 32 40 32
III & VI 33 58 28 25 50 36 53 40 51
III & VII 54 42 52 10 33 30 21 10 14
IV & V 35 33 34 40 42 23 21 40 27
IV & VI 33 58 40 30 38 30 53 50 51
IV & VII 43 98 41 15 54 39 21 30 22
V & VI 22 33 21 25 29 16 42 20 30
V & VII 59 42 62 30 33 43 26 40 32
VI & VII 59 42 69 25 58 41 58 40 54
-27-

Table 14
PROPORTION OF ITEMS SELECTED WHICH ARE UNIQUEFOR ALL POSSIBLE PI'LR.S OF GROUPS FOR GRADE 3.6
PAIRS Vocab. Compr.
TESTSRead. Compu. Probs. Math. Mech. UsageTot-,1 Total
Lang.Total
I & II 30 22 28 17 35 29 48 31 41
I & III 75 22 33 14 17 19 24 15 17
I & IV 25 26 30 25 35 29 42 31 37
I & V 40 17 19 25 35 29 30 15 30
I & VI 35 26 23 17 43 27 36 38 39
I & VII 25 26 26 19 22 24 24 23 22
II & III 55 30 40 25 43 29 52 46 39
II & IV 40 22 33 17 30 27 15 15 17
II & V 25 17 26 25 30 34 33 23 30
II & VI 30 26 26 22 22 3 21 15 15
II & VII 40 26 40 25 35 27 42 38 41
III & IV 65 26 42 28 48 32 42 46 30
III & V 50 26 37 28 48 ,34 33 23 26
III & VI 50 30 33 22 52 36 45 46 43
III & VII 75 17 30 17 26 24 21 31 17
IV & V 35 22 28 22 35 30 30 23 28
IV & VI 40 30 28 31 22 27 21 31 24
IV & VII 30 30 37 28 35 32 36 31 37
V & VI 30 22 21 25 30 25 33 23 37
V & VII 50 17 26 25 39 7/4 21 23 24
VI & VII 45 35 33 25 43 32 45 46 48
-28-
8?
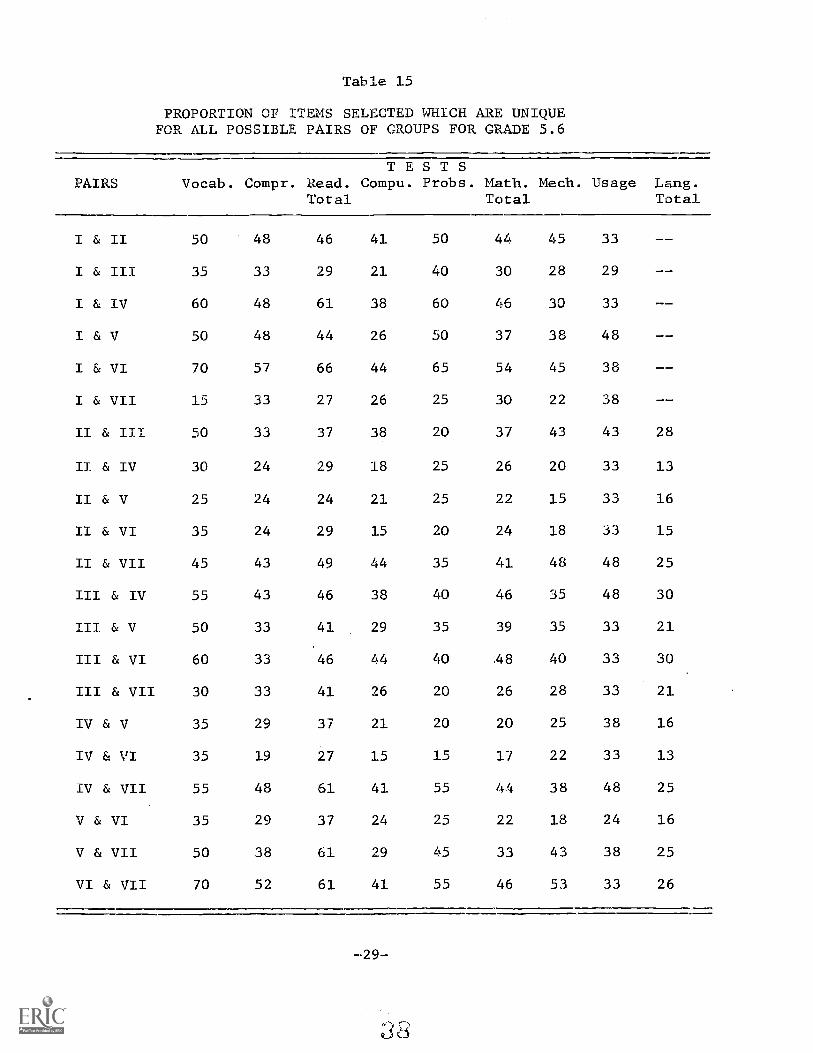
Table 15
PROPORTION OF ITEMS SELECTED WHICH ARE UNIQUEFOR ALL POSSIBLE PAIRS OF GROUPS FOR GRADE 5.6
PAIRS Vocab. Compr.TESTS
Read. Compu. Probs.Total
Math. Mech.Total
Usage Lang.Total
I & II 50 48 46 41 50 44 45 33
I & III 35 33 29 21 40 30 28 29
I & IV 60 48 61 38 60 46 30 33
I & V 50 48 44 26 50 37 38 48
I & VI 70 57 66 44 65 54 45 38
I & VII 15 33 27 26 25 30 22 38
II & III 50 33 37 38 20 37 43 43 28
II & IV 30 24 29 18 25 26 20 33 13
II & V 25 24 24 21 25 22 15 33 16
II & VI 35 24 29 15 20 24 18 33 15
II & VII 45 43 49 44 35 41 48 48 25
III & IV 55 43 46 38 40 46 35 48 30
III & V 50 33 41 29 35 39 35 33 21
III & VI 60 33 46 44 40 .48 40 33 30
III & VII 30 33 41 26 20 26 28 33 21
IV & V 35 29 37 21 20 20 25 38 16
IV & VI 35 19 27 15 15 17 22 33 13
IV & VII 55 48 61 41 55 44 38 48 25
V & VI 35 29 37 24 25 22 18 24 16
V & VII 50 38 61 29 45 33 43 38 25
VI & VII 70 52 61 41 55 46 53 33 26
-29-
9_33

Table 16
PROPOFIION OF ITEMS SELECTED WHICH ARE UNIQUEFOR ALL POSSIBLE PAIRS OF GROUPS FOR GRADE 8.6
PAIRS Vocab. Compr.TESTS
Read. Compu. Probs.Total
Math. Mech. UsageTotal
Lang.Total
I & II 40 22 26 25 36 29 42 36
I & III 35 22 30 25 28 20 36 32
I & IV 35 35 37 42 40 39 50 48
I & V 35 30 33 25 20 18 36 20
I & VI 35 17 26 33 24 22 39 20
I & VII 25 30 28 21 32 27 25 16
II & III 10 22 23 29 36 35 36 28
II & IV 10 30 21 33 24 33 25 36
II & V 15 26 21 17 28 22 28 24
II & VI 15 17 16 17 36 27 25 32
II & VII 55 35 37 25 48 35 44 40
III & IV 15 39 23 46 40 49 33 56 15
III & V 10 30 28 25 24 22 28 20 15
III & VI 10 26 19 33 20 29. 28 24 8
III & VII 45 26 37 21 28 27 39 28 21.
IV & V 15 30 21 29 36 35 42 32 15
IV & VI 20 30 23 29 32 29 33 40 20
IV & VII 50 52 51 54 56 49 56 44 28
V & VI 10 35 19 13 24 16 28 16 20
V & VII 40 35 42 29 32 29 36 24 23
VI & VII 45 39 44 29 28 29 39 16 18
-30-

Table 17
PROPORTION OF ITEMS SELECTED WHICH ARE UNIQUEFOR ALL POSSIBLE PAIRS OF GROUPS FOR GRADE 10.6
PAIRSTESTS
Vocab. Compr. Read. Compu. Probs. Math. Mech. Usage Lang.Total Tr _A' fotal
III & IV 55 22 42 33 40 33 38 41 21
III & V 35 22 30 25 24 16 20 33 13
IV & V 40 22 30 33 32 24 35 30 19

Table 18
RELIABILITIES AND RELATIOr7UTPS BETVITEMS UNIQUE TO GROUPS I & II
Grade 1,6
Columns*No. of
1 2 32
4 cTest Group Unique r ,
r r r 1-(ry )Items xx YY xy xy xy
Vocabulary
Comprehension
II
ReadingTotal II
Computation
Concepts &Problems
MathTotal II
MechanicsII
Usage &Structure Ii
19
3
23
3
10
7
8
3
.82 .68 .34 .46 .79
. 89 .68 .37 .48 .77
.51 .01 .25 1.00
.26 .24 .03 1.00
. 83 .65 .42 .57 .67
. 89 .65 .38 .50 .75
.74 45 .49 .85 .28
. 70 .65 .38 .57 .68
.68 .56 .48 .78 .39
. 62 .26 .53 1.00
. 67 .56 .41 .67 .55
. 65 .48 .40 .71 .49
. 79 .70 .46 .62 .62
.85 .51 .41 .62 .61
.49 .32 .42 1.00
. 33 -,12 .15 .75 .43
*Column 1: r is the KR 20 reliability for the unique test Chosen forxx the group Indicated.
*Column 2: r is the KR 20 reliability for the unique test which wasYY chosen for the comparison group.
*Column is the correlation of scores on the two sets of uniquexy items.
*ColuMn 4: r' is r corrected for attenuation. With such low rell-xy xY abilities, this correlation occasionally p7o-
duces a figure greater than 1, a meaninglessresult. These are all recorded as 1.00.
*Column 5: 1-(r' )2 2.s an estimate of the minimum proportion of the
xy variance which is independent.
-32-
41

Table 19
RELIABILITIES AND RELATIONSHIPS BETWEENITEMS UNIQUE TO GROUPS I & II
Grade 3.6
Test
Columns*No. of
1 2 3 4 5Croup Unique
r' 1-(r )2
Items xx YY xy xy xY
Vocabulary
Comprehension
II
ReadingTotal II
ComputationII
Concepts &Problems II
Math Total
Mechanics
Usage &Structure IT
LanguageTotal II
6
12
6
8
17
16
4
19
.82 .82 .40 .49 .76
.80 .59 .46 .67 .55
.73 .62 .69 1.00
. 67 .54 .55 .92 .15
.86 .74 .79 .99 .02
.83 .67 .64 .86 .26
.66 .45 .45 .83 .31
.83 .66 .50 .68 .54
. 78 .39 .64 1.00
.70 .50 .49 .83 .31
.87 .63 .72 .97 .06
.84 .74 .63 .80 .36
.90 .82 .62 .72 .48
.84 .66 .58 .78 .39
.63 .48 .41 .75 .44
.62 .38 .33 .67 .55
.90 .82 .65 .76 .42
.88 .60 .53 .74 .45
*See footnotes for Table 18.

Table 20
RELIABILITIES AND RELATIONSHIPS BETWEENITEMS UNIQUE TO GROUPS I & II
Grade 5.6
Test
Columns*No. of 1 2 3 4 5 2
Group UniqueJ_ r r r f 1-(r' )
Items xx YY xy xy xy
Vocabulary T1
Comprehension II
ReadingTotal II
Computation II
Concepts &Problems II
Math Total
Mechanics
Usage &Structure II
10
10
19
14
10
24
18
7
.83 .54 .49 .73 .46
.78 .51 .25 .40 .84
.71 .58 .55 .85 .27
.66 .35 .36 .75 .44
.86 .68 .60 .79 .38
. 81 .54 .34 .51 .74
079 .55 .35 053 .72
.83 .61 .39 .55 .70
.69 .58 .35 .56 .69
.69 .42 039 .71 .49
.84 .66 047 061 .60
. 86 .64 .51 069 .53
.85 .77 .50 .61 .62
.84 .61 .48 .67 .55
.36 .03 .12 1.00
.36 .12 .20 .96 .07
*See footnotes for Table 18.
-34-
43

Table 21
RELIABILITIES AND RELATIONSHIPS BETWEENITEMS UNIQUE TO GROUPS I & II
Grade 8.6
TestNo. of
Group UniqueItems
1rxx
VocabularyII
Comprehension
ReadingTotal II
ComputationII
Concepts &Problems II
Math Total
Mechanics
Usage &Structure II
8
3
11
6
9
14
15
9
Columns*2 3 4 5
r r r 1-(r' )YY xY xy xY
.65 .54 .57 .96 .07
.73 .50 .54 .89 .20
.50 .34 .43 1.00 --
.46 .36 .27 .66 .56
. 72 .56 .51 .81 .35
.74 54 43 .68 .54
.67 .50 .51 .88 .22
.69 .51 .44 .74 .45
. 70 .52 .51 .84 .29
. 62 .38 .44 .91 .18
.76 .65 .66 .94 .12
.74 .56 .54 .84 .30
.80 .65 .47 .65 .58
.85 .74 .58 .73 .47
.49 .11 .19 .82 .33
.51 .33 .16 .39 .85
*See footnotes for Table 18.

Table 22
RELIABILITIES AND RELATIONSHIPS BETWEENITEMS UNIQUE TO GROUPS III & IV
Grade 1.6
Columns*No. of
1 2 3 45 2
yyTest Group Unique vr r r r 1-(r' )
Items xx xy xy xy
VocabularyIIIIV
Comprehension IIIIV
Reading IIITotal IV
ComputationIIIIV
Concepts & IIIProblems IV
Math Total
Mechanics
IIIIV
IIIIV
Usage & IIIStructure IV
Language IIITotal IV
15
7
21
5
9
11
4
3
9
.76 .61 .54 .79 .37
.88 .78 .77 .93 .14
.58 .21 .09 .26 .93
.81 .74 .72 .93 .13
.75 .58 .50 .76 .42
.91 .83 .78 .90 .19
. 73 .56 .57 .89 .20
.79 .74 .77 100 -
.64 .49 .54 .96 .07
.82 ,70 .76 1.00
. 72 .50 .62 1.00
. 86 .77 .79 .97 .06
.58 .57 .33 .57 .67
.81 .49 .56 .89 .21
.48 .15 .27 1.00 -n-
.70 .46 .60 1.00
.67 .43 .56 1.00
. 85 .73 .79 1.00
*See footnotes for Table 18.
-36--
4C)
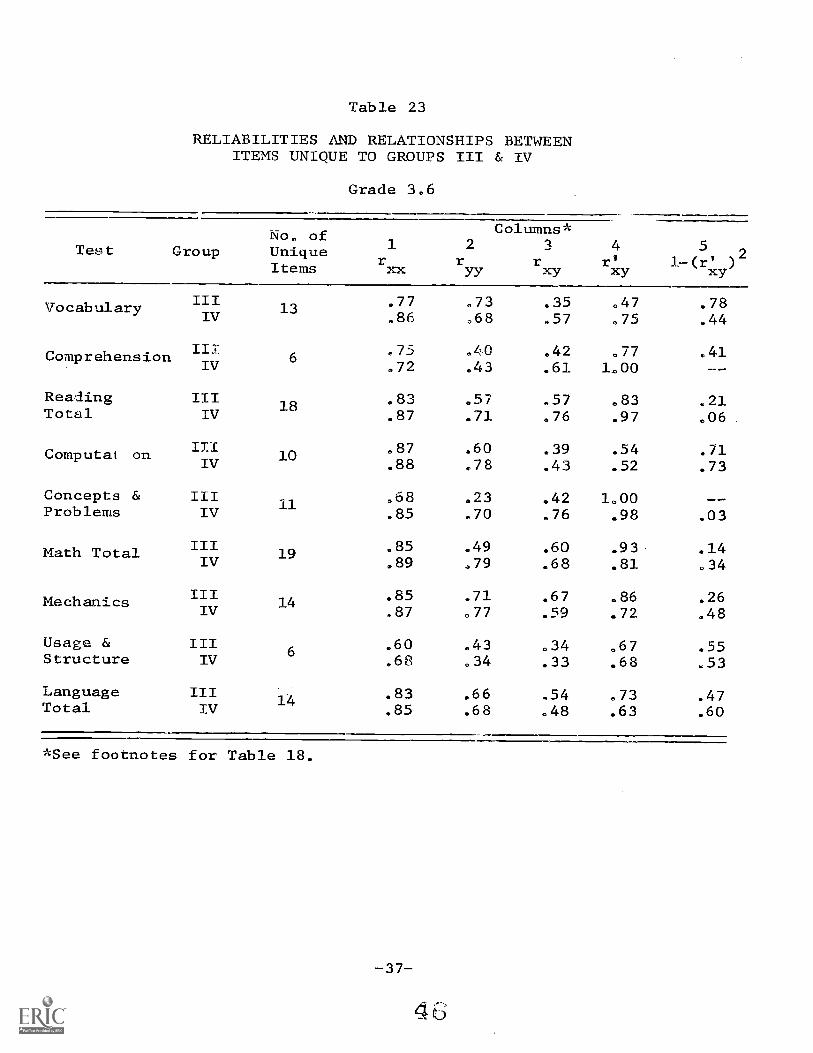
Table 23
RELIABILITIES AND RELATIONSHIPS BETWEENITEMS UNIQUE TO GROUPS III & IV
Grade 3.6
TestNo. of
Group UniqueItems
Columns*1 2 3 4
r'xx YY xy xy
52
1-(r' )xy
Vocabulary IIIIV
Comprehension ILLIV
Reading IIITotal IV
Computat on IIIIV
Concepts & IIIProblems IV
Math Total
Mechanics
IIIIV
IV
Usage & illStructure IV
Language IIITotal IV
13
6
18
10
11
19
14
6
14
.77 .73 .35 .47 .78
.86 .68 .57 .75 .44
.75 .40 .42 .77 .41
.72 .43 .61 1.00
.83 .57 .57 .83 .21
.87 .71 .76 .97 .06
.87 .60 .39 .54 .71
.88 .78 .43 .52 .73
.68 .23 .42 1.00
.85 .70 .76 .98 .03
.85 .49 .60 .93 .14
.89 .79 .68 .81 .34
.85 .71 .67 .86 .26
.87 .77 .59 .72 .48
.60 .43 .34 .67 .55
.68 .34 .33 .68 .53
.83 .66 .54 .73 .47
.85 .68 .48 .63 .60
*See footnotes for Table 18.
RELIABILITIES AND RELATIONSHIPS BETWEENITEMS UNIQUE TO GROUPS III & IV
Grade 5.6
No. ofTest Group Unique
Items
Columns*2 3 4 5 ,
r r 17' 1-(r' )yy xy
2xx xy xy
Vocabulary IIIIV
Comprehension IIIIV
Reading IIITotal IV
ComputationIV
Concepts & IIIProblems. IV
Math Total
Mechanics
iiiIV
Usage & IIIStructure IV
Language IIITotal IV
9
19
13
8
25
14
10
18
.76 .49 .65 1.00
.81 .52 .51 .79 .38
.70 .51 .60 1.00
.70 .50 .40 .68 .54
.83 .66 .72 .97 .05
.83 .63 .57 .79 .38
. 78 .66 "1 .60 .64,84 .49 .42 .66 .57
.66 .48 .39 .61 .63
. 77 .53 .42 .75 .44
.85 .71 .60 .77 .40
.90 .70 .59 .74 .45
.80 .69 .53 .71 .49
.82 .49 .62 .98 .04
.53 .16 .32 1.00
.55 .02 .17 1.00
.80 .56 .58 1.00
.78 .37 .48 .89 .20
*See footnotes for Table 18.
--38-
4 /

Table 25
RELIABILITIES AND RELATIONSHIPS BETWEENITEMS UNIQUE TO GROUPS III & IV
Grade 8.6
TestNo. of
1 2 3 4 5Group Unique
r r r r I 1-(r' )2
Items xx YY xy xy xy
Columns*
VocabularyIII ,50 .58 .49 .91 .17
3IV .46 .22 .33 1.00
III .70 .60 .59 .91 .17Comprehension 9
IV .61 .20 .29 .83 .31
Reading III10
.74. .61 .65 .97 .06Total IV .62 .36 .46 .98 .05
Computation III .02 .70 .51 .72 .48IV
11.72 .45 .20 .35 .88
Concepts & III10
.77 .60 .62 .91 .17Problems IV .64 .40 .49 .97 .06
Math Total
Mechanics
III .89 .80 .68 .81 045IV .83 .56 .50 .73. .46
IIIIV 12
.85 .69 .64 .84 .30
.80 .72 .66 . .87 .24
Usage & III8
.44 .03 .18 1.00 --Structure IV .30 .14 .08 .39 .85
Language III 75 .42 .46 .82 .339Total IV .67 .41 .43 .82 .33
*See footnotes for Table 18.

Table 26
RELIABILITIES AND RELATIONSHIPSITEMS UNIQUE TO GROUPS III
Grade 10.6
BETWEEN& V
No. ofTest Group Unique
Items
1
xx
2
YY
Columns*3
xy
4r°xy
5
1-(r' )xy
IIIVocabularyIV
ComprehensionIIIIV
Reading IIITotal IV
IIIComputationIV
Concepts & IIIProblems IV
IIIMath Total
IV
IIIMechanics
rv
Usage & IIIStructure IV
Language IIITotal IV
11
5
18
8
10
16
15
11
14
.80
.64
.55
.46
.85
.74
.69
.80
.74
.75
.81
.87
.83
.90
.51
.35
.81
.86
.57
.36
.41
.02
.64
.32
.57
.68
.4804P
.71
.70
.68
.78
.18
.24
.64
.49
.63
.35
.40
.19
.70
.34
.58
.66
.58
.36
.64
.59
.62
.68
.35
.07
.39p40
.93
.76
.84LJ
.95
.70
.93
.89
.97
.60
.84
.75
.84
.81
1.00.25
.54
.88
.13
.47
.29
.10051
,14.90
.05
.64
.29
.43
.30
.34
--.94
.71
.62
*See footnotes for Table 18.
-40-
4
2
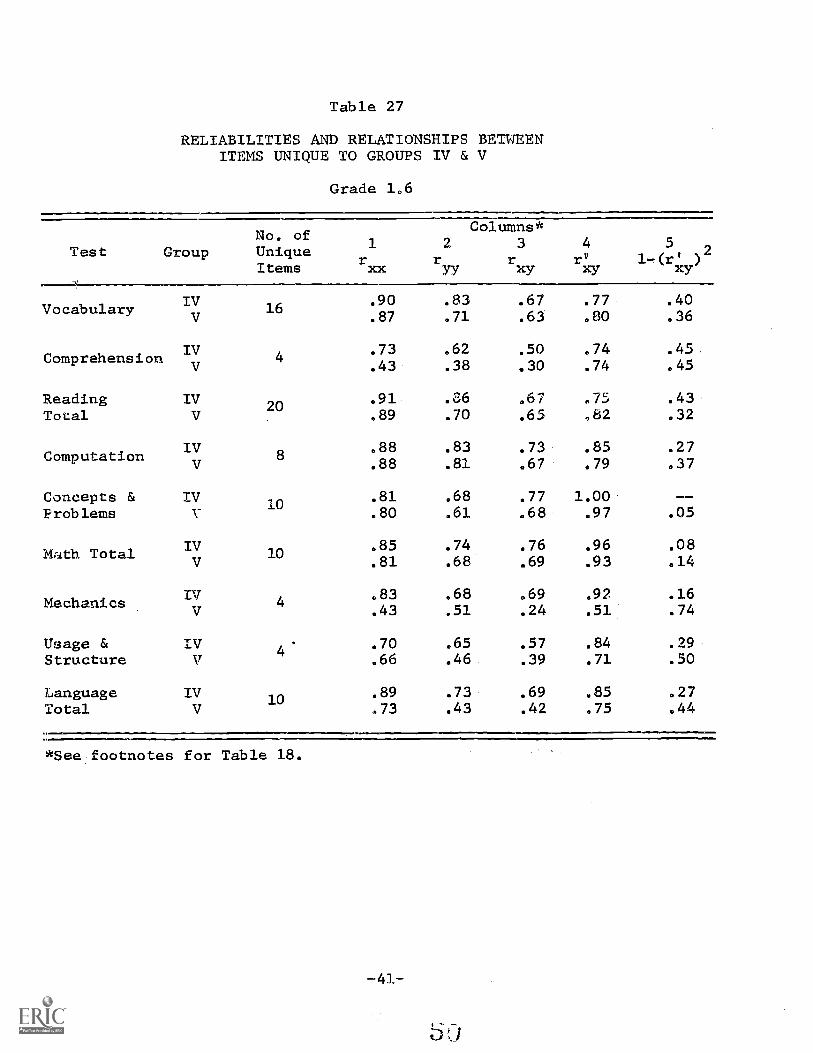
Table 27
RELIABILITIES AND RELATIONSHIPS BETWEENITEMS UNIQUE TO GROUPS IV & V
Grade 1.6
TestNo. of
Group UniqueItems xx
Columns*2 3
YY xy
4
xy
5
1-(r' )2
xy
Vocabulary IV
Comprehension IVV
Reading IVTotal V
ComputationIV
Concepts & TvProblems V
Mrith Total
Mechanics
Usage &Structure
LanguageTotal
IV
V
IV
16
4
20
8
10
10
4
4
10
.90 .83 .67 .77 .40
.87 .71 .63 .80 .36
. 73 .62 .50 .74
.43 .38 .30 .74
75.89 .70 .65 ,82
. 45
.45
. 43
.32
.88 .83 .73 .85 .27
. 88 .81 .67 .79 .37
.81 .68 .77 1.00
.80 .61 .68 .97 .05
. 85 .74 .76 .96 .08
.81 .68 .69 .93 .14
,83 .68 .69 .92 .16.43 .51 .24 .51 .74
.70 .65 .57 .84 .29
.66 .46 .39 .71 .50
.89 .73 .69 .85 .27
.73 .43 .42 .75 .44
*See footnotes for Table 18.

Table 28
RELIABILITIES AND RELATIONSHIPS BETWEENITEMS UNIQUE TO GROUPS IV & V
Grade 3.6
Columns*No. of
1 2 3 42Test Group Unique 1-(r r
yyr r°
5r' )
Items xx xy xi/ xY
IVVocabulary 7
V
IVComprehension 5
V
Reading IV12
Total V
IVComputation 8
V
Concepts & IV8
Problems V
IVMath Total 18
V
IVMechanics 10
V
Usage & IV3
Structure V
Language13
-TotalIVV
.71 .60 .54 .83 .31
.79 .68 .62 .85 .28
.68 .49 .61 1.00070 .54 .55 .89 .20
.81 .69 071 .95 .10
.83 .68 .74 .98 .03
.76 .67 .63 .88 022
.76 .65 .68 .97 .06
.76 .61 071 .97 006
.77 .61 067 .98 .04
.87 .77 .82 1.00
.86 075 081 1.00
.81 068 .53 .71 .49
.79 .76 059 .76 042
.46 .12 .25 1.00
.50 .22 .49 1.00
.82 .65 .57 .78
.80 .72 .70 .92.39.15
*See footnotes for Table 18,,
-42-
51

Table 29
RELIABILITIES AND RELATIONSHIPS BETWEENITEMS UNIQUE TO GROUPS IV & V
Grade 5.6
No. ofTest Group Unique
Items xx
Columns*2
YY xy
4r!xy
51-(r' )
xy
Vocabulary
Comprehension
ReadingTotal
Computation
Concepts &Problems
Math Total
Mechanics
Usage &Structure
LanguageTotal
IV
IV
IVV
IV
IVV
IVV
IVV
IVV
IVV
7
6
15
7
4
11
10
8
10
.63
.72
.64
.60
077.81
.74
.73
.62
.53
.76
.82
.76
.79
.51
.44
.57
.70
.42
.55
.34
.42
.60073
.47
.59
.36
.48
.65
.66
.59
.69
.11
.06
.40
.48
.48
.61
.41
.52
.65
.73
.41
.42
.37946
.58
.58
.57
.62
.08-,02
.42
.61
.93
.97
.881.00
.95
.98
.69
.64
.78..91
.82
.79
.85..84
.33
.881.00
.13
.06
.23
.09
.04
.52
.59
.39
.17
.32
.38
.28
.29
.89
.98
.23
*See footnotes for Table 18.
2

Table 30
RELIABILITIES AND RELATIONSHIPS BETWEENITEMS UNIQUE TO GROUPS IV & V
Grade 8.6
TestNo. of
Group UniqueItems
1 2
ryyxx
Columns*
xy
4 5
r' 1-(r' )2
xy xy
Vocabulary IV .46 .28 .33 .92 .15V .54 .43 .44 .91 .17
IVComprehension V
Reading IVTotal V
IVComputation V
Concepts & IVProblems V
Math TotalIVV
IVMechanics
V
Usage & IVStructure V
Language IVTotal V
7
9
7
9
17
15
8
9
. 52 ." .30 .89 .21
.61 .35 .63 .60
. 59 .32 .47 1.00
. 67 .54 .55 .92 .16
.60 .25 .23 .59 .65
.74 .61 .54 .81 .35
. 66 .34 .44 .93 .14
.70 .45 .5- 1.00
. 79 .44 .42 .71 .49
.82 .71 .65 .85 .27
. 85 .81 .58 .70 .51
. 86 .72 .60 .76 .42
,34 .18 7.04 .17 .97. 50 .10 .14 .62 .61
. 68 .41 .37 .70 .51
. 64 .45 .40 .75 .44
*See footnotes for Table 18.
-44-

Table 31
RELIABILITIES AND RELATIONSHIPS BETWEEN'ITEMS UNIQUE TO GROUPS IV & V
Grade 10.6
No. ofColumns*
1 2 3 4 5Test UniqueGroup
r' 1-(r' )2
Items xx YY xY xy xy
TV .63 .15 .37 1.00Vocabulary V
8.63 .49 .47 .85 .28
IV .29 .05 .02 .17 .92Comprehension 5V .47 .25 .28 .79 .38
Reading IV13
.62 .25 .44 1.00Total V .72 .51 .56 .92 .15
IV .80 .69 .69 .93 .14Computatior 8V .80 .61 .67 .96 .08
Concepts & IV8
.66 .41 .27 .52 .73Problems V . .69 .39 .44 .85 .28
IV .82 .63 .56 .78 .39Math Total 12V .78 .62 .58 .84 )
Mechanics
Usage &.Structure
LanguageTotal
IVV
IV
IV
14
8
13
. 90 .78 .58 .69 .52
.86 .75 .54 ,67 .55
.25 -.13 .09 .50 .75
.39 -.003 .29
. 86 .47 .43 .68 .54
.79 .68 .43 .58 .66
*See footnotes for Table 18.

Table 32
RELIABILITIES AND RELATIONSHIPS BETWEENITEMS UNIQUE TO GROUPS VI & VII
Grade 1.6
Columns*No. of
1 2 3 4 5Group Unique
r/
r r r 1-(r' )2
Items xx YY xy xy xy
VocabularyVI
VII
VIComprehensionVII
Reading VITotal VII
Computation
Concepts &Problems
Math Total
Mechanics
Usage &Strucutre
VIVII
VIVII
VIVII
VIVII
VIVII
Language VITotal VII
27
5
40
5
14
18
11
4
20
.88 .37 .34 .60 .64
90 .67 .46 .59 .65
. 18 -.01 .10 1.00
.76 ,52 .61 ,97
.89 .44 ,20 .32 .90
.94 .81 .54 .62 .62
.70 073 .32 .45 .80
.90 .56 .41 .57 .67
.77 .35 .91 .18
.81 .63 .68 .95 .09
.86 .54 .58 .85 .28
. 85 .70 .67 .86 .25
.74 .45 -.17 .30 .91
.92 .81 .64 .74 .45
.56 .45 .19 .37 .86
.56 .42 050 1.00
.73 .40 .15 .28 .92
. 92 .67 .60 .76 .42
*Sea footnotes for Table 18.

Table 33
RELIABILITIES AND RELATIONSHIPS BETWEENITEMS UNIQUE TO GROUPS VI & VII
Grade 3.6
Columns*No. of
2 3 4 5Test Group Unique
r,
1-(r' )2
Items xx YY xy xy xy
VocabularyVIVII
VICompreh,-nsion VII
Reading VITotal VII
ComputationVI
VII
Concepts & VIProblems VII
Math Total
Mechanics
VIVII
VIVII
Usage & VIStrucutre VII
Language VITotal VII
9
8
14
9
10
19
15
6
22
. 81 .59 .53 .77 .41
.85 .56 ,4/ .68 .54
.76 .54 .61 .95 .09
. 75 .59 .64 .96 .07
.85 .65 .53 .71 .49
. 83 .61 .65 .91 .17
.70 .66 .50 .73 .46
. 81 .48 .52 .84 .30
.80 .53 .64 .98 .03
.65 .38 .44 .88 .22
.86 .74 .52 .65 .58
.85 .63 .61 .84 .30
. 87 .50 .34 .82 .33
. 85 .72 .63 .81 .35
.72 .47 .22 .37 .86
.61 .37 .37 .78 .39
.90 .61 .43 .58 .66
. 88 .73 .60 .74 .45
*See footnotes for Table 18.
-47-
56

Table 34
RELIABILITIES AND RELATIONSHIPS BETWEENITEMS UNIQUE TO GROUPS VI & VII
Grade 5.6
TestNo. of
1 2 3 45Group Unique 2
r Ir r r 1-(r` )
Items xx YY xy xy xy
Columns*
VoCabularyVI
14.83 .61 .44 .62 .62
VII .83 .62 .66 .92 .15
VI .75 .40 .32 .58 .66Comprehension 11
V1I .73 .59 .53 .81 .35
Reading VI25
.87 .62 .51 .69 .52
Total VII .86 .70 .73 .94 .11
Computation VI .83 .53 .37 .56 .6914
VII .75 .63 .45 .66 .57
Concepts & VI11
.81 .45 .33 .55 .70
Problems VII .76 .38 .34 .63 .60
Math Total
Mechanics
VI .89 .70 .35 .45 .809iVII 084 .63 .45 .62 .62
VI .85 .55 .46 .67 .5521
VII .87 .75 .59 .73 .47
Usage & VI .25 .37 -.08 .26 .937
Structure VII .42 .21 .17 .57 .67
Language VITotal VII
17.74 .47 .21 .36 .87
.83 .53 .48 .72 .48
*Sea footnotes for Table 18.
-48-
57(

Table 35
RELIABILITIES AND RELATIONSHIPS BETWEENITEMS UNIQUE TO GROUPS VI & VIj
Grade 8.6
TestNo. of
Group UniqueItems
Columns*2
YY xy
4
r'xy
1
1-5
xy
VocabularyVI
VII
VIComprehension VII
Reading VITotal VII
ComputationVIVII
Concepts & VIProblems VII
Math Total
Mechanics
VTVII
VIVII
Usage & VIStructure VII
LanguageTotal
VIVII
9
9
19
7
14
14
4
11
.76
.75
.65
.71
.84
.84
.77
.77
.70
.63
.82
.73
.81
.84
.94
.31
.74
.73
.57
.65
.45
.56
.67
.73
.66
.61
.40
.35
.62
.59
.72
.70
.09
.10
.52
.61
.42
.44
.49
.61
.58
.62
.39
.45
.39
.40
.50
.62
.63
.61
.06
.20
.33
.39
.64
.63
.91
.97
.77
.79
.55
.66
.73
.85
.70
.94
.82
.79
.201.00
.53
.58
.59
.60
.18
.06
.40
.37
.70
.57
.46
.27
.51
.11
.37
.96
.72
.66
*See footnotes for Table 18.

Table 36
MEiN' AND CROSSOVER MEANS ON UNIQUE ITEM TESTSFOR GROUPS I & II
GRADE 1.6 GRADE 3.6
TESTNo. of Cross-
GROUP Unique Mean overa
Items Mean
No. of Cross-Unique Mean overaItems Mean
VocabularyII
ComprehensionII
Reading TotalII
ComputationII
Concepts &Problems II
Math TotalII
MechanicsII
Usage &Structure II
Language Total I
II
19
23
10
10.5 17.113.7 6.6
0.7 0.90.7 0.4
9.5 19.515.4 6.5
1.4 2.31.9 0.9
5.8 7.95.4 3.3
3.7 6.03.8 2.4
3.2 5.33.5 1.5
2.0 1.80.9 0.7
6
5
12
5.3 5.53.5 4.0
4.0 3.82.4 2.5
9.4 10.37.0 5.1
6 3.3 5.44.5 2.5
17
16
4
19
6.0 7.05.2 3.2
13.2 13.210.0 8.4
6.2 11.66.1 2.0
2.7 3.62.6 1.4
8.4 15.29.4 3.2
aA crossover mean is the mean of the group on the unique Itemtest selected for the group with which It is being compared.
53

Table 36 (Continued)
MEANS AND CROSSOVER MEANS ON UNIQUE ITEM TESTSFOR GROUPS I & II
GRADE 5.6 GRADE 8.6
TESTNo. of Cross-
GROUP Unique Mean overaItems Mean
No. of Cross-Unique Mean averaItems Mean
Vocabulary
Comprehension
Reading Total
Computation
Concepts 0,Problems
10 6.1 9.06.4 2.7
106.2 8.7
II 6.1 3.5
11.3 16.9II
19 12.1 5.7
5
11
5.2 6.95.5 3.8
2.5 3.72.7 1.6
6.6 9.37.5 4.7
I 7.5 12.46
2.7 3.414
II 10.8 4.2 2.6 1.9
I 104.5 8.9 4.1 6.5
9II 6.6 1.7 5.3 2.5
Math Total I 13.2 21.024 14
17.6 7.0
Mechanics 8.5 14.6ii
18 9.3 3.615
6.6 10.18.1 4.3
5.9 11.79.1 3.1
Usage & I 3.9 4.3 3.9 6.17 9
Structure II 3.7 2.8 5.7 2.5
Language TotalII
Z.6
aA crossover mean is the mean of the group on the unique item, test selected for the group with which it is being compared.
-51-

Table 37
MEANS AND CROSSOVER MEANS ON UNIQUE ITEM iTSTSFOR GROUPS III & IV
TEST
GRADE 1.6 GRADE 3.6
No. of Cross- No. of Cross-GROUP Unique Mean over Unique Mean
Meanaovera
Items Items Mean
Vocabulary IIIIV
Comprehension IIIIV
Reading Total IIIIV
15
7
13.3 8.87.7 10.5
3.4 1.62.3 3.3
13
6
11.0 12.79.0 6.5
4.9 4.92.7 2.8
2116.9 8.9 14.9 16.5
188.7 13.8 10.6 9.1
Computation III 4.0 3.7 107.0 9.5
5IV 2.1 2.1 7.3 4.5
Concepts & III 5.3 6.6 119.0 10.5
9Problems IV 4.6 4.3 7.8 6.2
Matii Total IIIIV
MechanicsIV
Usage & IIIStructure IV
Language Total IIIIV
11
4
3
9
6.3 7.7 14.4 17.95.1 4.7
19 13.4 9.7
1.7 2.41.4 1.6
2.3 2.01.4 1.2
4.5 3.32.6 3.3
14
6
14
5.2 10.95.1 1.4
5.43.4 1,7
5.9 12.67.5 1.8
aA crossover mean is the mean of the group on the unique itemtest selected for the group with which it Is being compared.
6 1

Table 37 (Continued)
MEAL_S AND CROSSOVER MEANS ON UNIQUE ITEM TESTSFOR GROUPS III & IV
GRADE 5.6 GRADE 8.6
TESTNo. of Cross- No. of Cross-
GROUP Unique Mean over Unique Mean over_Items Meana Items Meana
Vocabul ry IIIIV 11 7.8 9.6
5.5 3.4
Comprehension III9
6.5 7.7IV 4.5 2.8
Reading Total III 13.6 16.519 10
IV 9.2 5.9
9
2.3 2.61.7 1.3
5.0 7.05.5 3.0
6.3 7.95.1 3.5
Computation III 5.9 11.6 5.7 8.313 11IV 8.4 3.0 4.5 1.4
Concepts & ii 5-3 7.210
5.9 7-5Problems IV 4.8 2.4 5.2 3.2
Math TotalIV
Mechanics
Usage & IIIStructure IV
Language Total IIIIV
13.0 22.0 13.0 18.61
25 244-8 6.2 12.3 5,0
14
10
6.6 10.86.2 2.9
7.0 4.84.0 5.1
125-4 8 35.6 2.4
4.1 4 24.2 2.6
7.5 13.5 4.2 5.618 99.2 3.5 4.7 1.8
a A crossover-mean is the mean of the,group on the unique itemtest selected for the group with which it ts being compared.

Table 37 (Continued)
MEANS AND CROSSOVER MEANS ON UNIQUE ITEM TESTSFOR GROUPS III & IV
GRADE 10.6
TEST GROUPNo. ofUniqueItems
MeanCross-overaMean-
Vocabulary
Comprehension
Readlng Total
Computation
ConcepLs &Problems
Math Total
IV
IV
Mechanics IIIIV
Usage & IIIStructure IV
Language Total IIIIV
11
18
10
16
15
11
14
5.95.8
3.02.4
9.29.9
5.43.6
4.74.8
8.17.1
9.29.3
5.65.2
7.09.8
9.22.9
3.61.6
14.14.4
5.92.8
7.71.9
12.23 .6
12.94.3
6.63.7
12.43.4
aA crossover mean is the mean of the group on the unique itemtest selected for the group with which it is being compared.
-54-
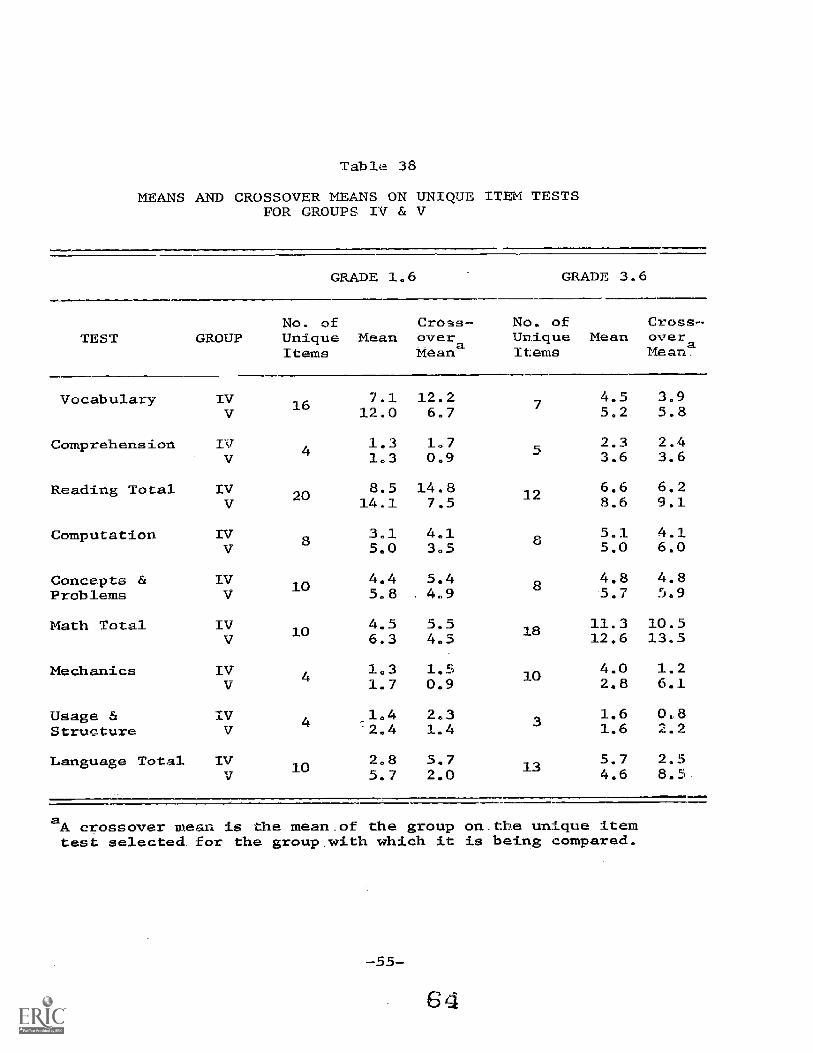
Table 38
MEANS AND CROSSOVER MEANS ON UNIQUE ITEM TESTSFOR GROUPS IV & V
GRADE 1.6 GRADE 3.6
TESTNo. of Cross- No. of Cross-
GROUP Unique Mean over Unique Mean overaItems Meana Items Mean
Vocabulary IVV
Comprehension IVV
Reading Total IVV
Computation IVV
Concepts & IVProblems V
Math Total IVV
Mechanics IV
Usage & IVStructure V
Language Total IVV
16
4
20
8
10
10
4
4
10
7.1 12.212.0 6.7
1.3 1.71.3 0.9
8.5 14.814.1 7.5
3.1 4.15.0 3.5
4.4 5.45.8 4.9
4.5 5.56.3 4.5
1.3 1.51.7 0.9
1.4-2.4
2.31.4
2.8 5.75.7 2.0
7
5
12
10
13
4.5 3.95.2 5.8
2.3 2.43.6 3.6
6.6 6.28.6 9.1
5.1 4.15.0 6.0
4.8 4.85. 5.9
11.3 10.512.6 13.5
4 0 1.22.8 6.1
1.6 0.81.6 2.2
5.7 2.54.6 8.5
aA crossover mean is the mean.of the group on.the unique itemtest selected for the group,with which it is being compared.

Table 38 (Continued)
MEANS AND CROSSOVER MEANS ON UNIQUE ITEM TESTSFOR GROUPS IV & V
GRADE 5.6 ckADE 8.6
TESTNo. of Cross- No. of Cross-
GROUP Unique Mean over Unique Mean overa
Items Mean Items Meana
Vocabulary IVV
Comprehension IVV
Reading Total IVV
Computation IVV
Concepts & IVProblems V
Math Total IVV
Mechanics Iv
Usage & IV
Structure V
Language Total IVV
7
6
15
7
4
11
10
10
2.6 2.43.9 3.7
2.9 1.72.7 4.1
6,7 5.27.7 9.4
4.7 2.64.1 5.7
1.9 1.32.4 2.7
6.2 3.96.5 8,4
3.7 4.36.8 6.0
3.2 4.25.1 3.3
4.6 2.54.5 5.5
9
7
9
17
3_5
9
1.7 1.01.6 2.4
4.3 2.63.3 5.0
5.6 3.74.9 7.2
3.8 1.13.5 5.1
4.9 2.74.5 6.4
9.6 3.88.3 12.6
7.8 2.86.1 10.2
4.7 2.33.2 5.0
5.1 1.53.0 6.2
aA crossover mean Is the mean of the group on the unique item
test selected for the group with which It is being campared.
-56-
6 5

Table 38 (Continued)
MEANS AND CaOSSOVER MEANS ON UNIQUE ITEM TESTSFOR CROUPS IV & V
GRADE 10.6
TEST GROUPNo. ofUniqueitems
MeanCross-overMeana
Vocabulary
Comprehension
Reading Total
Computation
Concepts &Problems
Math Total
Mechanics
Usage &Structure
Language Total
IV
IVV
IVV
IVV
IVV
V
IVV
IVV
IVV
5
13
12
14
13
4,53.5
2.32.5
6.86.0
3.54.7
4.02.7
5.55.0
9.17.5
3.84.6
8.94.6
2.56.0
1.82.8
4.28.5
2.35.9
1.75.9
2.88.9
4.311.8
3.54.1
2.511.0
aA crossover mean Is the mean of the group on the unique,Itemtest selected for the group ylth wh dh it is being compared.

Table 39
MEAW AND CROSSOVER MEANS ON UNIQUE ITEM TESTSFOR CROUPS VI & VII
GRADE 1.6 GRADE 3.6
TESTNo. of
GROUP UniqueItems
MeanCross- No. ofover UniqueMeana Items
MeanCross-over_Me4na
Vocabulary
Comprehension
Reading Total
Computation
Concepts &Problems
Math Total
Mechanics
Usage &Structure
Language Total
Vi27VII
VI5VII
VT 40VII
VI5VII
VI14VII
VI18VII
VI11VII
VI4VII
VI20VII
16.516.6
1.22.4
23.521.4
2.63.4
6.08.8
9.511.2
3.05.8
1.72.6
6.410.2
7.125.7
0.92.1
9.637.5
1.14.3
4.110.4
4.815.3
1.76.6
1.0
3.213.0
9
8
14
9
10
19
15
6
22
3.98.4
?.46.7
6.911.6
5.97.4
5.88.2
11.116.0
6.96.7
3.33.8
11.59.7
6.38.3
3.26.8
5.312.6
3.68.3
4.29.6
9.017.8
3.110.3
1.55.3
4.117.7
aA crossover mean is the mean of the grouptest selected for the group with which It
on the unique itemis being compared.
-58-
7

Table 39 (Continued)MEANS AND CROSSOVER MEANS ON UNIQUE ITEM TESTS
FOR GROUPS VI & VII
GRADE 5.6 GRADE 8.6
No. of Cross- No. of Cross-
TEST GROUP Unique Mean overa
Unique Mean over_
Items Mean Items Meana
Vocabulary VIVII
Comprehension ViVII
Reading Total VIVII
Computation VIVII
Concepts & VIProblems VII
Math Total
Mechanics
VIVII
VIVII
Usage & VIStructure VII
Language Total VIVII
14
11
7.7 4.19.5 12.6
6.8 3.26.9 9.8
9
9
5.5 2.95.8 8.5
5.3 3.35.3 7,7
15.0 7.5 11.4 6.325 16.5 22.3 11.3 17.5
14
11
25
21
7
17
10.3 4.07.3 12.6
7.7 2.36.2 10.4
17.4 5.913.6 22.6
10.8 3.99.6 17.1
3.2 2.93.9 3.8
9.1 3.26.8 12.9
7
7
14
14
4
11
3.9 2.-6
4.8 5,7
4.2 2.14.1 5.9
8.4 5.09.0 11.6
10.1 5.29.0 11.6
1.8 2.32.3 2.0
7.8 4.46.5 9.0
aA crossover mean is the mean of the group on the onique itemtest selected for the group with which it is being compared.
68

Table 40
MEANS AND STANDARD DEVIATIONS ON THE WHOLE AND HALF-TESTS FORNORTHERN WHITE SUBURBAN VERSUS NORTHERN BLACK URBAN
Grade 1.6
Test
Vocabulary
Comprehension
Reading Total
Computation'
Whole Test alf-Test
Group Mean* SD Mean* SD
67.7 10.6 32.6 8.2
II 48.7 15.0 26.3 10.0
7.8 4.2 4 4 2:9
II 5.9 3,4 3.6 2.4
75.6 13.5 35.8 10.1II 56.5 16.8 31.8 12.2
22.9 10.0 10.7 6.7
ii 16.3 10.1 8.3 152
Concepts & I 31.5 7.5 15.7 5.1
Problems II 21.1 7.4 12.2 5.1
Math Total
Mechanics
Usage &Structure
LanguageTotal
54.4 15.4 26,6 10.8II 37.6 15.5 20.2 11.0
16.0 7.9 8.4 5.69.6 7.5 6.7 5.4
12.7 3.8 7.7 2.3
II 6.4 3.6 3.9 2:6
38.8 14.7II 23.9 11.1
*The mean on the whole test for Reading, Mathematics, and LanguageTotals are equal to the sum of ehe means of the subtests. This isnot true of the half-test means, since the items for each test wereselected separately.

ble 41
MEANS AND STANDARD DEVIATIONS ON THE WHOLE AND HALF-TESTS FORNORTHERN WRITE SUBURBAN VERSUS NORTHERN BLACK URBAN
Grade 3.6
Test GroupWhole Test_ Half-Test
Mean* SD Mean* SD
Vocabulary
Comprehension
Reading Total
Computation
Concepts &Problems
Math Total
Mechanics
Usage &Structure
Language Tota1
II
II
II
III
II
II
II
I
II
II
34.826.8
33.523.5
68.550.4
56.852.5
35.827.2
92.680.5
32.316.0
17.913.6
50.230.2
7.39.0
10.09.9
16.017.4
12.315.0
6.97.6
18.220.0
15.011.0
4.64.7
18.414.0
19.712.7
18.811.1
36.024.0
25.421.4
18.513.4
44.233.4
16.410.1
10.27.2
24.816.5
4.35.8
6.06.7
9.611.8
9.410.8
4.95.5
13.315.5
9.27.7
3.23.6
12.110.0
*See footnote for Table 40.
-61-
0

Table 42
MEANS AND STANDARD DEVIATIONS ON THE WHOLE AND HALF-TESTS FORNORTHERN WHITE SUBURBAN VERSUS NORTHERN BLACKJIRBAN
Grade 5.6
Test GroupWhole Test Half-Test
Mean* SD Mean* SD
Vocabulary
Comprehension
Reading Total
Computation
Concepts &Problems
Math Total
Mechanics
Usage &Structure
LanguageTotal
ii
II
11
II
I]T
II
II
III
II
30.517.5
30.018.7
60.636.4
46.734.9
29.719,9
76.555.1
50.127.2
24.319.1
74.446.7
6.o6.7
6.76.4
12.711.8
9.311.0
5,86.6
14.31F.1
14.412.5
4.14.5
16.915.1
14.110.2
15,111.3
28.921.2
23.121.1
12.711.3
36.833.0
24.617.4
13.811.1
26.5
4.84.7
4.34.7
8.68.4
6.77.9
4.14.6
10.011.2
9.19.2
3.33.4
11.9
*See footnote for Table 40.
-62
71
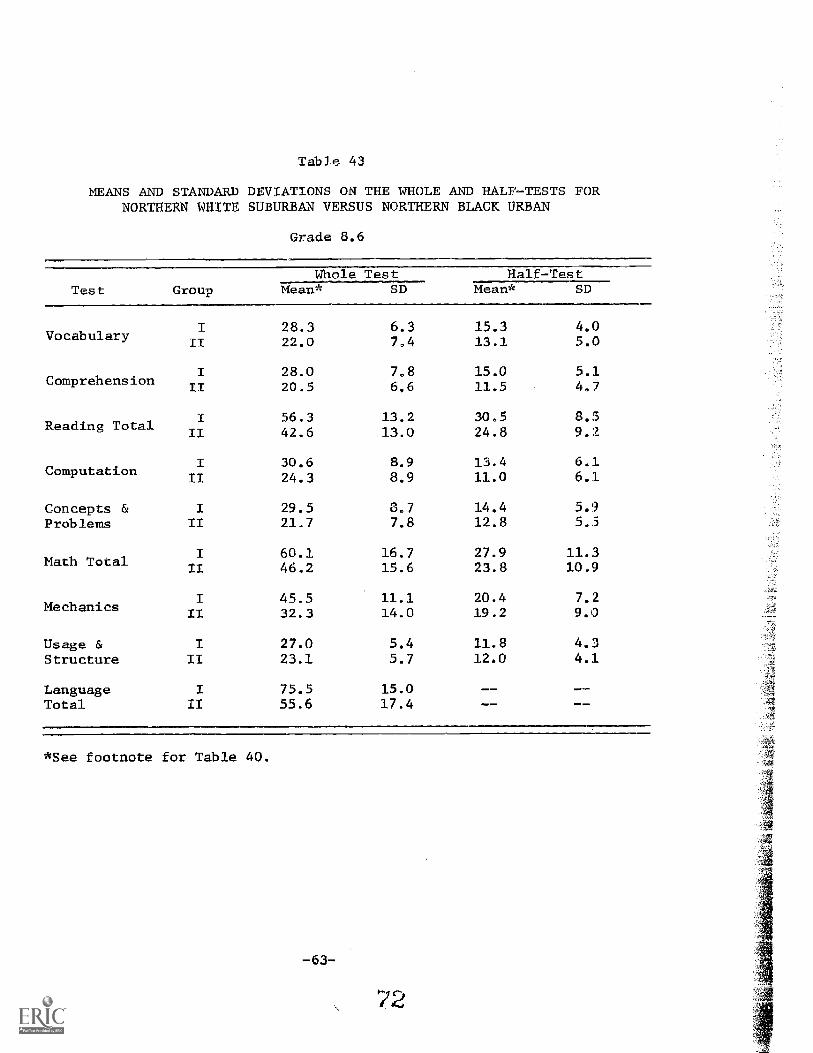
Table
MEANS AND STANDARD DEVIATIONS ON THE WHOLE AND HALF-TESTS FORNORTHERN WHITE SUBURBAN VERSUS NORTHERN BLACK URBAN
Grade 8.6
Test GroupWhole Test Half-Test
Mean* SD Mean* SD
Vocabulary
Comprehension
Reading Total
Computation
Concepts &Problems
Math Total
Mechanics
Usage &Structure
LanguageTotal
II
it
II
II
I
II
II
II
II
28.322.0
28.020.5
56.342.6
30.624.3
29.521.7
60.146.2
45.532.3
27.023.1
75.555.6
6.37.4
7.86.6
13.213.0
8.98.9
3.77.8
16.715.6
11.114.0
5.45.7
15.017.4
15.313.1
15.011.5
30,524.8
13.411.0
14.412.8
27.923.8
20.419.2
11.812.0
4.05.0
5.14.7
8.59.2
6,16.1
5.95.5
11.310.9
7.29.0
4.34.1
*See footnote for Table 40.
-63-

Table 44
MEANS AND STANDARD DEVIATIONS ON THE WHOLE AND HALF-TESTS FORSOUTHERN WHTTE SUBURBAN VERSUS SOUTHERN BLACK RURAL
Grade
Test
Vocabulary
Comprehension
Reading Total
Computation
Concepts & IIIProblems IV
GroupWhole Test
Mean* SDHalf-Test
Mean* SD
UIIV
ITTIV
IIIIV
IIIIV
Math'Total
Mechanics
67.556.1 20.0
8.1 3.69.0 6.6
75.865.3 25.2
28.0 8.517..1 12.0
32.0 7.524.3 11.6
38.2 7.325.5 13.0
5.1 2.74.0 3.8
44.9 9.029.0 16.1
14.4 5.68.0 6.8
14.411.7
III 60.1 14.2 30.0IV 41.6 22.8 19.7
5.27.0
9.513.7
III 18.0 7.7 9.7 5.5
IV 12.2 11.1 6.5 6.8
Usage & III 14.3 3.1
Structure IV
Language Total IV
8.0
42.029.6
5.5
10.918.6
8.0 2.23.7 3.3
22.612.5
8.111.8
*See footnote for Table 40.
-64-
73

Table 45
MEANS AND STANDARD DEVIATIONS ON THE WHOLE AND HALF-TESTS FORSOUTHERN WHITE SUBURBAN VERSUS SOUTHERN BLACK RURAL
Grade
Test
Vocabulary
Comprehension
Reading Total
Computation
Whole Test Half-TesGroup Mean* SD Mean* SD
III -6.6 4.3 17.4 3.3IV 23.6 8.7 12.6 5.4
III 36.3 7.5 19.7 4.6IV 22.8 10.4 11.9
III 72.7 11.0 36.8 7.6IV 46.4 18.3 23.9 11.5
III 62.5 9.7 28.7 7.9IV 45.8 15.R 21.3 10.4
Concepts & III 38.1 5.1 19.0 3.8Problems IV 26.8 10.3 14.1 6.3
Math Total
Mechanics
III 100.5 13.8 48.0 10.7IV 72.6 24.8 35.1 15.8
III 35.0 13.5 17.9 8.9IV 15.9 11.7 11.6 8.4
Usage & III 18.5 10.1 2.7Structure IV 10.1 4.6 6.4 3.3
LanguageTotal
III 53.5 16.0 26.0 11.4IV 26.0 15.3 16.5 10.9
*See footnote for Table 40.

Table 46
MEANS AND STANDARD DEVIATIONS ON THE WHOLE AND HALF-TESTS FORSOUTHERN WHITE SUBURBAN VERSUS SOUTHERN BLACK RURAL
Grade 5.6
Test GroupWhole Test $alf-Tet
an* SD Mean* SD
Vocabulary
Comprehension
Reading Total
Computation
Concepts &Problems
Math Total
Mechanics
Usage &Structure
LanguageTotal
IIIIV
IIIIV
IIIIV
IIIIV
IIIIV
IIIIV
IIIIV
IIIIV
IIIIV
31.115.1
29.816.0
60.931.2
44.527.7
28.716.6
73.244.3
48.124.4
24.719.5
72.844.0
6.57.6
7.17.3
12.813.7
10.411.4
5.67.8
15.018.4
14.213.8
4.64.5
17.316.3
14.98.4
16.710.0
32.018.5
21.116.1
15.610.3
35.326.3
24.514.4
15.010.0
36.823.2
4.35.0
4.35.3
7.89.5
7.28.3
3.75.5
10.413.0
8.99.7
3.33.4
12.313.0
*See foornate for Table 40.
-66-
'7 5

Table 47
MEANS AND STANDARD DEVIATIONS ON THE WHOLE AND HALF-TESTS FORSOUTHERN WHITE SUBURBAN VERSUS SOUTHERN BLACK RURAL
Grade 8.6
TestWhole Test
Group Mean* SDHalf-Tea
Mean SD
Vocabulary
Comprehension
Reading Total
Computation
Concepts &Problems
Math Total
Mechanics
Usage &Structure
LanguageTotal
III 29.3 7.1IV 14.9 6.7
III 26.2 8.9IV 16.5 6.0
III 55.6 14.9IV 31.4 11.8
III 31.6 9.7IV 16.1 6.3
III 30.0 9.6IV 17.2 7.3
III 61.7 18.3IV 33.4 12.6
16.98.4
13.910.6
32.319.0
14.58.1
16.010.1
29.619.1
4.35.0
5.74.1
9.18.6
6.34.7
6.05.1
11.89.1
III 43.5 15.0 23.7 8.7IV 27.5 14.1 18.3 9.6
III 25.2 5.3IV 21.5 5.0
III 68.7 18.8IV 48.9 17.3
12.5117
37.726.0
4.03.8
13.713.3
footnote for Table 40.

Tabla 48
MEANS AND STANDARD DEVIATIONS ON THE WHOLE AND HALF-TESTS FORSOUTHERN WHITE SUBURBAN VERSUS SOUTHERN BLACK RURAL
Grade 10.6
Test
Vocabulary
Comprehension
Reading Total
Computation
Whole Test Half-TestGroup Mean* SD Mean SD
III 27.1 7.5 12.8 4.9IV 15.3 5.5 9.2 4.2
III 28.0 7.7 15.5 5.0IV 18.8 6.3 10.7 4.9
III 55.1 14.5 27.5 9.2IV 34.1 11.0 20.4 8.6
III 34.0 8.9 15.7 5.9IV 21.3 11.0 9.0 7.1
Concepts & III 30.2 9.2 14.0 6.0Problems IV 15.9 8.1 8.7 5.9
Math Total
Mechanics
III 64.2 17.1 29.3 11.3IV 37.3 18.4 17.4 12.8
III 58.6 12.8 30.0 8.4IV 36.7 17.5 22.0 11.6
Usage & III 0.2 6.2 14.4 5.1Structure IV 23.5 4.7 11.0 4.0
LanguageTotal
III 88.7 17.3 48.0 12.6IV 60.4 20.7 34.3 16.8
*See footnote for Table 40.
-68-

Table 49
MEANS AND STANDARD DEVIATIONS ON THE WHOLE AND HALF-TESTS FORSOUTHERN BLACK RURAL VERSUS SOUTHERN WHITE RURAL
Grade 1.6
Test GroupTes Half-Test
Mean* SD Mean* SD
Vocabulary
Comprehension
Reading Total
Computation
Concepts &Problems
Math Total
Mechanics
Usage &Structure
LanguageTotal
TVV
IVV
IVV
IVV
IVV
IVV
IVV
IVV
IVV
56.155.1
9.07.5
65.362.7
17.119.8
24.326.5
41.646.7
12.211.0
8.08.7
29.628.4
20.017.2
6.64.7
25.220.3
12.011.5
11.610.1
22.820.5
11.16.1
5.54.3
18.611.4
25.531.0
4.03.6
29.035.3
8.011.0
11.713.7
19.724.9
6.57.0
3.75.5
12.516.4
13.011.7
3,83.0
16.113.6
6.86.8
7.06.4
13.712.9
6.74.4
3.32.9
11.88.0
*See footnote for Table 40.
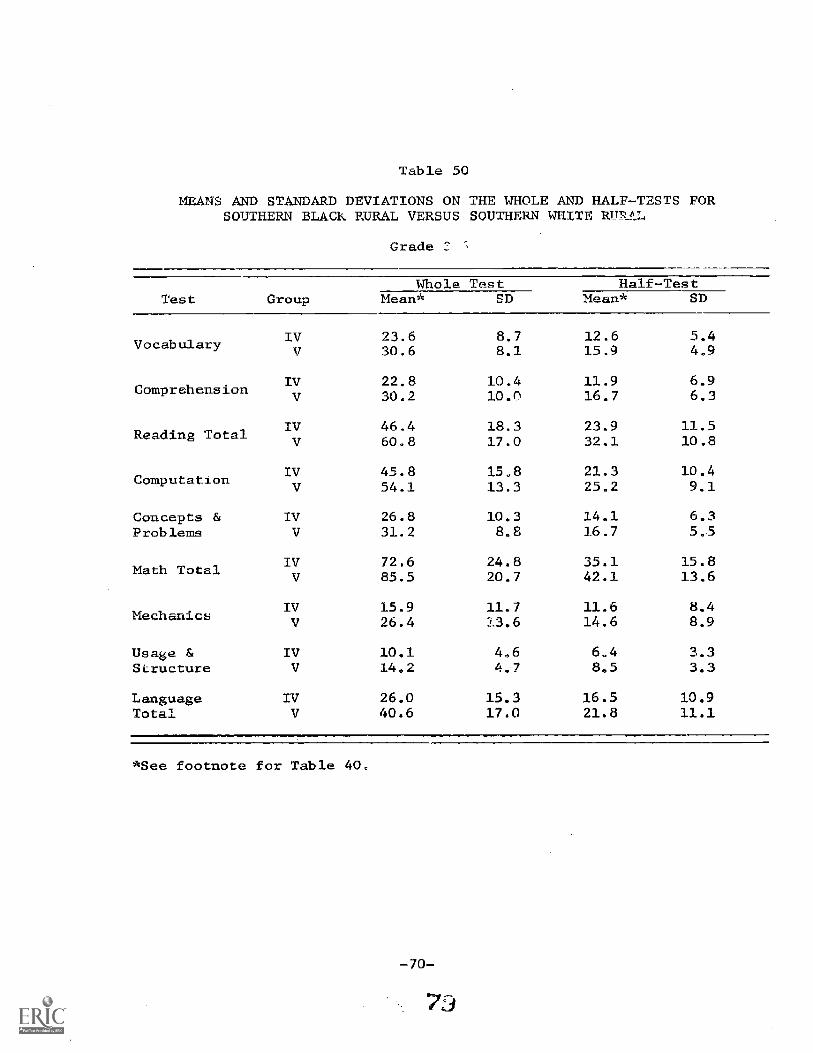
Table 50
MEANS AND STANDARD DEVIATIONS ON THE WHOLE AND HALF-TESTS FORSOUTHERN BLACK RURAL VERSUS SOUTHERN WHITE RUPA,L
Grade 2
Test GroupWhole Test Half-Test
Mean* SD Mean* SD
Vocabulary
Comprehension
Reading Total
Computation
Concepts &Problens
Math Total
Mechanics
Usage &SLructure
LanguageTotal
IVV
IVV
IVV
IVV
IVV
IVV
IVV
IVV
IVV
23.630.6
22.830.2
46.460.8
45.854.1
26.831.2
72,685.5
15.926.4
10.114.2
26.040.6
8.78.1
10.410.0
18.317.0
15.813.3
10.38.8
24.820.7
11.713.6
4.64.1
15.317.0
12.615.9
11.916.7
23.932.1
21.325.2
14.116.7
35.142.1
11.614.6
6.48.5
16.521.8
5.44.9
6.96.3
11.510.8
10.49.1
6.35.5
15.813.6
8.48.9
3.33.3
10.911.1
*See footno e for Table 40.
-70-

Table 51
MEANS AND STANDARD DEVIATIONS ON THE WHOLE AND HALF-TESTS FORSOUTHERN BLACK RURAL VERSUS SOUTHERN WHITE RURAL
Grade 5.6
Test
Vocabulary
Comprehension
Reading Total
Computation
Group
IVV
IV
V
IV
IV
Whole Testean* SD
Half-TestMean* SD
15.1 7.6 8.4 5.0
22.1 8.7 12.6 5.1
16.0 7.122.2 7.5
31.2 13.744.3 15.4
27.7 11.440.6 11.7
10.0 5.312.7 4.9
18.5 9.525.1 9.5
16.1 8.323.2 8.6
Concepts & IV 16.6 7.8 10.3 5.5
Problems V 24.5 7.5 14.6 4.8
Math Total
Mechanics
IV 44.3 18.4 26.3 13.0
V 65.2 18.2 38.2 12.6
IV 24.4 13.8 14.4 9.7
V 42.4 16.3 26.3 10.2
Usage & IV 19.5 4.5 10.0 3.4
Structure V 21.7 4.2 13.0 3.6
LanguageTotal
IV 44.064.0
16.319.2
23.2 13.036.9 14.2
*See foo_note f r Table 40.

Table 52
MEANS AND STANDARD DEVIATIONS ON THE WHOLE AND HALF-TESTS FORSOUTHERN BLACK RURAL VERSUS SOUTHERN WHITE RURAL
Grade 8.6
TestWhole Test Half-Test
Group Mean* SD Mean* SD
Vocabulary
Comprehension
Reading Total
Computation
IV 14.9 6.7 8.4 5.0
24.0 8.0 13.6 5.3
IV 16.5 6.0 10.6 4.123.5 8.1 13.0 5.2
IV 31.4 11.8 19.0 8.647.5 15.1 27.4 9.8
IV 16.1 6.3 8.1 4.727.7 9.8 13.0 6.3
Concepts & IV 17.2 7.3 10.1 5 1
Problems V 26.2 8.6 13.5 5.7
IV 33.4 12.6 19.1 9.1Math Total
54.0 17.5 40./ 11.6
MechrLics
Usage &Structure
LanguageTotal
IV 27.5 14.1 1&.3 9.640.0 13.5 20.7 8.4
IV 21.5 5.0 11.7 3.825.5 5.6 12.2 4.2
IV 48.9 17.3 26.0 13.365.6 17.3 33.6 12.5
*See footnote for Table 40.
-72-
1

Table 53
MEANS AND STANDARD DEVIATIONS ON THE WHOLE AND HALF-TESTS FORSOUTHERN BLACK RURAL VERSUS SOUTHERN WHITE RURAL
Grade 10.6
Test GroupWhole Test Half-Test
Mean- SD Mean* SD
Vocabulary
Comprehension
Reading Total
Computation
Concepts &Problems
Math Total
Mechanins
Usage 6,Structure
LanguageTotal
IVV
IVV
IVV
IVV.
IVV
IVV
IV
IVV
TVV
15.321.1
18.823.3
34.1444
21.332.6
15.925.3
37.357.9
36.753.4
23.527.6
60.481.1
5.56.7
6.37.0
11.012.8
11.09.9
8.18.8
18.417.6
17.514.8
4.76.2
20.719.2
9.210.7
10.713.6
20.424.9
9.014.5
8.711.7
17.427.1
22.027.3
11.014.3
34.342.8
4.24.6
4.94.9
8.68.6
7.16.7
5.96.0
12.812.1
11.69.6
4.04.9
16.814.1
*See footnote for Table 40.

Table 54
MEANS AND STANDARD DEVIATIONS ON THE WHOLE AND HALF-TESTS FOR
SOUTHWESTERN MEXICAN-AMERICAN VERSUS SOUTHWESTERN ANGLO-AMERICAN
Grade 1.6
Test
Wh le Test Half-Te
Group Mean* SD Mean* SD
Vocabulary
Comprehension
Reading Total
Computation
VI 42.8 12.4 23.4 9.4
VII 75.5 11.7 32.7 9,4
VI 5.7 2.5 3.2 2.1
VII 10.9 6.0 6.0 3.8
VI 48.8 13.0 29.0 10.7
VII 86.4 16.7 35.4 13.5
VI 14.9 9.2 7.9 5.9
VII 29.7 8.9 15.1 6.1
Concepts & VI 18.6 7.7 9.8 5.6
Problems VII 33.3 8.1 16.3 5.3
Math Total
Mechanics
VI 33.4 15.2 18.4 10.7
VII 63.0 15.1 30.8 10.4
VI 7.0 3.9 4.7 3.4
VII 19.1 10.0 10.7 6.5
Usage & VI 6.5 3.1 3.6 2.4
Structure VII 13.4 3.8 7.3 2.6
LanguageTotal
VI 18.8 7.3 11-3 6.2
VII 44.3 14.3 22.1 10.3
*See footnote for Table 40
-74-

Table 55
MEANS AND STANDARD DEVIATIONS ON THE WHOLE AND HALF-TESTS FORSOUTWESTERN MEXICAN-AMERICAN VERSUS SCUTHWESTERN ANGLO-AMERICAN
Grade 3.6
Test GroupWhole Test Half-Test
Mean* SD Mean* SD
Vocabulary
Comprehension
Reading Total
Computation
Concepts &Problems
Math Total
Mechanics
Usage &Structure
LanguageTotal
VIVII
\TT
VII
VI
VII
VIVII
VIVII
VIVII
VIVII
VIVII
VIVII
21.736.7
16.536.1
38.472.7
48.066.1
22.637.8
70.6103.8
18.834.2
10.618.4
29.552.6
8.44.9
9.07.9
15,911.5
12.98.0
8.85.0
19.611.7
10.613.0
5.13.8
14.415.6
10.618.8
9.119.7
19.237.6
22.132.5
11.919.4
34.352.2
13.418.3
6.69.9
20.725.6
5.63.1
6.14.8
11.07.4
9.85.7
6.23.7
14.48.4
8.18.5
3.92.7
11.210.7
*See footnote for Table 40.

Table 56
MEANS AND STANDARD DEVIATIONS ON THE WHOLE AND HALF-TESTS FORSOUTHWESTERN MEXICAN-AMERICAN VERSUS SOUTHWESTERN ANGLO-AMERICAN
Grade 5.6
Test GroupWhole Te t Half-Test
ean* SD Mean* SD
Vocabulary
Comprehension
Reading Total
Computation
Concepts &Problems
Math Total
Mechanics
&
Structure
LanguageTotal
VIVII
VTVII
ViVII
VIVII
VIVII
VTVII
VIVII
VIVII
VIVII
15.830.7
18.230.2
34.060.9
33.945.7
18.329.3
52.245.0
27.346.5
19.323.8
46.670.4
7.16.8
6.16.6
12.212.6
10.18.7
6.65.4
15.913.1
11.914.2
4.04.8
9
16.8
9.413.9
12.015.2
21.629.3
21.823.0
12.013.5
34.137.5
18.622.0
11.014.6
26.336.2
4.94.7
4.84.2
9.08.2
7.66.2
4.94.1
12.19.4
9.29.2
3.63.6
11.712.2
*See footnote for Table 40.

Table 57
MEANS AND STANDARD DEVIATIONS ON THE WHOLE AND HALF-TESTS FORSOUTHWESTERN MEXICAN-AMERICAN VERSUS SOUTHWESTERN ANGLO-AMERICAN
Grade 8.6
Test
Vocabulary
Comprehension
Whole Test Half7Test_Group Mean* SD Mean* SD
VI 19.9 7.9 11.4 5.4VII 31.9 5.8 15.6 4.1
VI 21.1 7.4 11.4 5.0VII 31.0 8.0 15.4 5.3
VIReading Total
VII
Computation
41.0 14.6 23.6 10.162.9 13.1 30.9 8.8
VI 25.5 9.4 11.6 6.3VII 36.9 8.7 17.8 5.7
Concepts & VI 23.1 9.3 11.3 6.2Problems VII 36.5 7.7 17.3 5.4
Math Total
Mechanics
VI 48.7 17.7 23.8 11.9VII 73.5 15.2 35.7 10.3
VI 40.1 13.0 22.1 7.8VII 52.7 12.6 25.6 8.4
Usage & VI 24.2 5.4 10.4 4.1Structure VII 29.2 6.3 14.3 4.9
LanguageTotal
VIVII
64.4 16.8 33.1 11.981.9 17.5 42.7 12.6
*See footnote for Table 40.

Table 58
RELIABILITY COEFFICIENTS AND STANDARDIZED RELIABILITY COEFFICIENTSON THE WHOLE AND HALF-TESTS FOR
NORTHERN WHITE SUBURBAN VERSUS NORTHERN BLACK URBAN
Grade 2 4
Test GroupWhole_Tes Half-Test
KR 20 100-Item KR 20 KR 20 100-Item KR 20
Vocabulary
Comprehension
Reading Total
Computation
.906 .913 .908 .914II .931 .937 .925 .931
.749 .926 .764 .931
.668 .893 .639 .884
.916 .904 .916 .904II .930 .920 .933 .923
.938 .974 .939 .975II .938 .974 .924 .968
Concepts & I .866 .932 .840 .918Problems II .836 .916 .820 .906
Math Total
Mechanics
Usage &Structure
LanguageTotal
.939 .947 .941 .949II .934 .942 .938 .946
.905 .962 .904 .962II .911 .964 .910 .964
.760 .941 .784 .948II .728 .931 .734 .933
.911 .933II .902 .926

Table 59
RELIABILITY COEFFICIENTS KND STANDARDIZED RELIABILITY COEFFICIENTSON THE WIIOLE AND HALF-TESTS FOR
NORTHERN METE SUBURBAN VERSUS NORTHERN BLACK URBKN
Grade 3.6
TestWhole Test
Group KR 20 100-Item KR -Half-Test
KR 20 100-Item KR 20
Vocabulary
Comprehension
Reading Total
Computation
.944 .977 .945 .977
II .925 .969 .912 .963
.944 .974 .947 .975IT .917 .961 .919 .962
.965 .970 .960 .966
II .951 .958 .950 .957
.949 .982 .950 .963II .959 .970 .958 .970
Concepts & I .897 .951 .897 .951
Problems II .873 .939 .869 .936
I. .961 .954 .960 .953Math Total
II .958 .951 .961 .954
I .957 .972 .945 .963Mechanics
II .932 .954 .920 .946
Usage & I .841 .955 .864 .962
Structure II .804 .943 .828 .871
LanguageTotal
.960 .964 .954 958TI .934 .940 .931 .937

Table 60
RELIABILITY COEFFICIENTS AND STANDARDIZED RELIABILITY COEFFICIENTSON THE WHOLE AND HALF-TESTS FOR
NORTHERN WHITE SUBURBAN VERSUS NORTHERN BLACK URBAN
Grade 5.6
Test GroupWhole Te Half-Teat
KR 20 100-Item 20 KR 20 100-Item KR 20
Vocabulary
Comprehension
Reading Total
Computation
Concepts &Problems
Math Total
Mechanics
Usage &Structure
LanguageTotal
II
IT
IT
II
I
II
II
II
III
II
.888
.837
.866
.802
.930
.888
.895
.916
.847
.856
.930
.936
.937
.914
.556
.591
.927
.904
.952
.925
.939
.906
.942
.906
.927
.941
.933
.937
.924
.931
.949
.930
.753
.779
.913
.886
.380
.842
.831
.823
.917
.893
.884
.920
.811
.841
.919
.934
.922
.917
.675
.632
.923
.948
.930
.921
.918
.931
.910
.918
.945
.914
.929
.914
.929
.937
.933
.835
.826
.908

Table 61
RELIABILITY COEFFICIENTS AND STANDARDIZED RELIABILITY COEFFICIENTSON THE WHOLE AND HALF-TESTS FOR
NORTHERN WHITE SUBURBAN VERSUS NORTHERN BLACK URBAN
Grade 8.6
Test GroupWhole Test
KR 20 100-Item KR 20 KR 20Half-Test100-Item KR 20
Vocabulary
Comprehension
Reading Total
Computati n
Concepts &Problens
Math Total
Mechanics
Usage &Structure
LanguageTotal
II
IT
II
II
I
II
II
IT
I
II
I
II
.863
.868
.874
.805
.924
.907
.906
.902
.887
.850
.942
.930
.907
.943
.656
.716
.902
.930
.940
.942
.939
.901
.934
.920
.953
.950
.940
.924
.943
.931
.931
.958
.792
.834
.883
.916
.841
.875
.856
.798
.912
.910
.898
.896
.876
.847
.934
.928
.891
.933
.731
.724
.930
.929
.946
.929
.898
.924
.922
.948
.947
.934
.917
.935
.929
.920
.951
.844
.840

Table 62
RELIABILITY COEFFICIENTS AND STANDARDIZED RELIABILITY COEFFICIENTSON THE WHOLE AND HALF-TESTS FOR
SOUTHERN WHITE SUBURBAN VERSUS SOUTHERN BLACK FERAL
Grade 1.6
Test GroupWhole Test Half-Test
KR 20 100-Item KR 20 KR 20 100-Item KR 20
Vocabulary
Comprehension
Reading Total
Computation
III .913 .919 .915 .921IV .965 .968 .960 .963
III .650 .886 .686 .901IV .911 .977 .890 .971
III .907 .894 .913 .900IV .971 .967 .966 .961
III .920 .966 .926 .969IV .960 .984 .947 .978
Concepts & III .869 .934 .835 .915Problems IV .941 .971 .921 .961
III .932 .940 .924 .933Math Total IV .973 .976 .966 .970
III .897 .958 .896 .958Mechanics
IV .961 .985 .958 .984
Usage & IIIStructure IV
LanguageTotal
.702 .922 .759 .940
.900 .978 .876 .972
.899 .924 .906 .930
.968 .976 .968 .976

--
Table 63
RELIABILITY COEFFICIENTS AND STANDARDIZED RELIABILITY COEFFICIENTSON THE WHOLE AND HALF-TESTS FOR
SOUTHERN WHITE SUBURBAN VERSUS SOUTHERN BLACK RURAL
Grade 3.6
Test
Vocabulary
Comprehension
Reading Total
Computation
GroupWhole Test
KR 20 100-Item KR 20 KR 20 100-Item 1CR 20Half-Test
IIIIV
IIIIV
IIIIV
.875
.904.946.959
.858
.895.938.955
.906 .955 .909 .957
.922 .963 .924 .964
.935 .944 .936 .945
.953 .960 .947 .955
III .936 .953 .940 .956
IV .956 .968 .952 ,965
Concepts & III .843 .923 .842 .922
Ploblems IV .930 .967 .913 .959
Math Total
Mechanics
IV
Usage & IIIStructure IV
LanguageTotal
.946 .937 .946 .937
.969 .964 .964 .958
.947 .964 .941 .960
.942 .961 .933 .955
.768 .930 .780 .934
.786 .936 .797 .940
.948
.946
.952
.951.947.944
.952
.949

Table 64
RELIABILITY COEFFICIENTS AND STANDARDIZED RELIABILITY COEFFICIENTSON THE WHOLE AND HALF-TESTS FOR
SOUTHERN WHITE SUBURBAN VERSUS SOUTHERN BLACK RURAL
Grade 5.6
Test GroupWhole Test Half-Test
20 100-Item KR 20 KR 20 100-Item KR 20
Vocabulary
Comprehension
Reading Total
Computation
III .882 .949 .860 .939
IV .875 .946 .863 .940
III .881 .946 .865 .938
IV .840 .926 .863 .937
III .932 .944 .918 .932
IV .918 .932 .919 .933
III .911 .938 .897 .928
IV .917 .942 .923 .946
Concepts & III .840 .929 .827 .923
Problems IV .889 .952 .889 .952
Math Total
Mechanic-
Usage &Structure
LanguageTotal
III .934 .929 .924 .918IV .948 .944 .948 .944
III .936 .948 .920 .935IV .934 .946 .933 .946
III .658 .824 .708 .855
IV .587 .776 .666 .829
III .931 .918 .934 .921
IV .919 .904 .941 .929

Table 65
RELIABILITY COEFFICIENTS AND STANDARDIZED RELIABILITY COEFFICIENTSON THE WHOLE AND HALF-TESTS FOR
SOUTHERN WHITE SUBURBAN VERSUS SOUTHERN BLACK RURAL
Grade 8.6
Test GroupWhole Test Half-_Test
KR 20 100-Item KR 20 KR 20 100-Item KR 20
Vocabulary
Comprehension
Reading Total
Computation
III .901 .959 .906 .960
IV .836 .927 .856 .937
III .902 .953 .882 .943
IV .776 .885 .753 .871
III .941 .950 .935 .944
IV .888 .903 .892 .907
III ,920 .960 .904 .951
IV .842 .917 .836 .914
Concepts & III .911 .953 .895 .945
Problems IV .849 .918 .843 .915
III .953 .954 .943 .944Math Total
IV .909 .911 .907 .909
III .952 .965 .939 .955Mechanics
IV .947 .961 .941 .957
Usage & III .659 .794 .715 .834
Structure IV .625 .769 .694 .819
LanguageTotal
III .940 .928 .954 .944
IV .932 .918 .949 .938

Table 66
RELIABILITY COEFFICIENTS AND STANDARDIZED RELIABILITY COEFFICIENTSON THE WHOLE AND HALF-TESTS FOR
SOUTHERN WHITE SUBURBAN VERSUS SOUTHERN BLACK RURAL
Grade 10.6
Test GroupWholejast Half-Test
KR 20 100-Iem KR 20 KR 20 100-item KR 20
Vocabulary
Comprehension
Reading Total
Computation
Concepts &Problems
Math Total
Mechanics
Usage &Structure
LanguageTotal
IIIIv
IIIIV
IIIIV
IIIIV
IIIIV
IIIIV
IIIIV
IIIIV
IIIIV
.894
.754
.861
.766
.931
.859
.906
.939
.899
.878
.944
.953
.937
.960
.741
.524
.931
.945
.955
.885
.932
.879
.941
.878
.953
.970
.947
.935
.945
.954
.949
.968
.841
.671
.910
.928
.871
.785
.846
.808
.919
.883
.886
.933
.880
.889
.934
.955
.928
.957
.807
.675
.941
.964
.944
.901
.924
.903
.930
.899
.942
.967
.936
.941
.935
.956
.942
.965
.886
.794
.922
.952
-86-
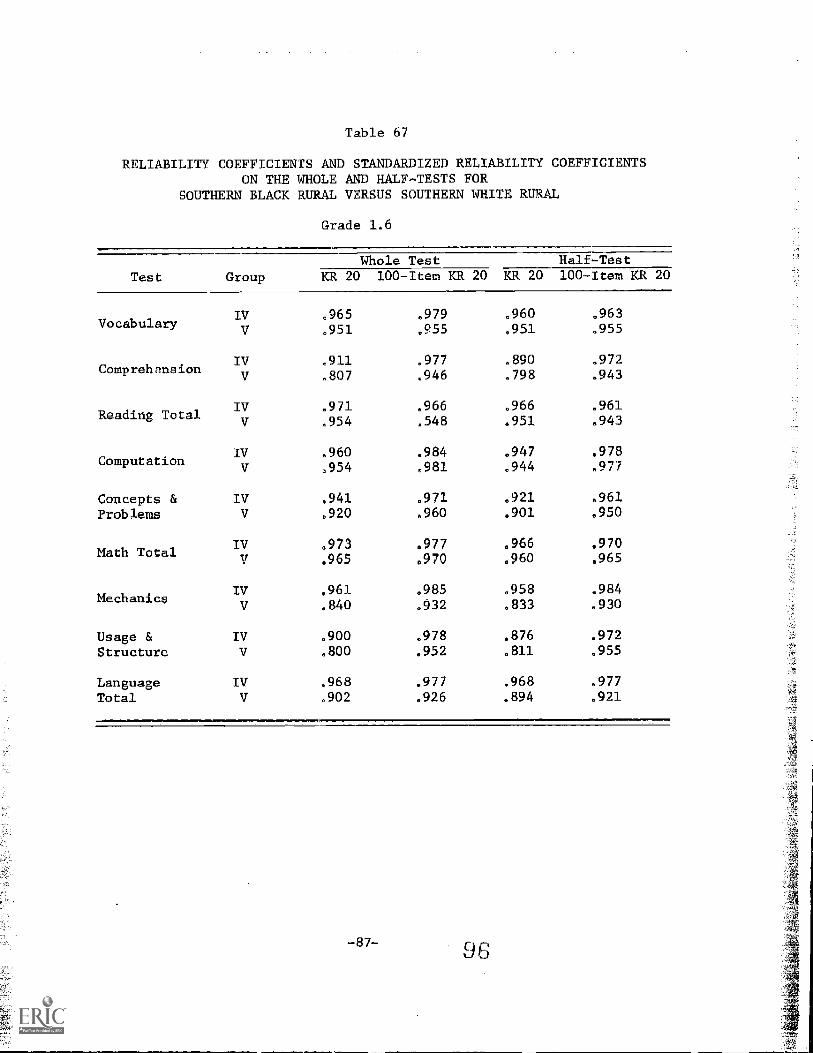
Table 67
RELIABILITY COEFFICIENTS AND STANDARDIZED RELIABILITY COEFFICIENTSON THE WHOLE AND HALF-TESTS FOR
SOUTHERN BLACK RURAL VERSUS SOUTHERN WHITE RURAL
Grade 1.6
Test GroupWhole Test Half-Test
KR 20 100-Item KR 20 KR 20 100-Item KR 20
Vocabulary
Comprehmsion
Reading Total
Computation
IV .965
.951
IV .911.807
IV .971.954
IV .960.954
Concepts & IV .941
Problems V .920
Math Total
Mechanics
IV .973.965
IV .961.840
Usage & IV .900Structure V .800
LanguageTotal
IV .968
.902
.979 .960 .963
.955 .951 .955
.977 .890 .972
.946 .798 .943
.966 .966 .961
.548 .951 .943
.984 .947 .978
.981 .944 .977
.971 .921 .961
.960 .901 .950
.977 .966 .970
.970 .960 .965
.985 .958 .984
.932 .833 .930
.978 .876 .972
.952 .811 .955
.977 .968 .977
.926 .894 .921
-87- 96

Table68
RELIABILITY COEFFICIENTS AND STANDARDIZED RELIABILITY COEFFICIENTSON THE WHOLE AND HALF-TESTS FOR
SOUTHERN BLACK RURAL VERSUS SOUTHERN WHITE RURAL
Grade 3.6
TestWhole Test
Group KR 20 100-Item KR 20 KR 2Half-Test100-Item KR 20
Vocabulary
Comprehension
Reading Total
Computation
IV .904.926
IV .922.929
IV .953.957
IV .956.952
Concepts & Tv .930
Problems V .915
Math TotalIV .969
.964
IV .942Mechanics
V .945
Usage & IV .786
Structu e V .812
LanguageTotal
IV .946.949
.960 .895 .955
.969 .916 .964
.963 .924 .965
.967 .930 .967
.960 .947 .954_
.963 .954 .961
.968 .952 .965
.965 .944 .959
.967 .913 .959
.960 .901 .952
.964 .964 .958
.961 .958 .951
.964 .933 .955
.961 .934 .955
.936
.945.797.828
.940
.951
.951 .944 .949
.954 .941 .946
9 ";) -88-

Table 69
RELIABILITY COEFFICIENTS AND STANDARDIZED RELIABILITY COEFFICIENTSON THE WHOLE AND HALF-TESTS FOR
SOUTHERN BLACK RURAL VERSUS SOUTHERN WHITE RURAL
Grade 5.6
Test GroupWhole Test _Half-Test
KR 20 100-Item KR 20 KR 20 100-Item KR 20
Vocabulary
Comprehension
Reading Total
Computation
IV .85 .946 .863 .940.911 .962 .886 .951
IV .840 .926 .863 .937.861 .937 .849 .931
IV .918 .932 .919 .933V .938 .948 .927 .939
IV .917 .971 .923 .947.927 .949 .938 .957
Concepts & IV .889 .953 .889 .953Problems V .892 .954 .889
Math To al
Mechanics
Usage &Structure
IV .948 .944 .948 .944.951 .947 .954 .950
IV .934 .946 .933 .945.951 '.961 .942 .953
IVV
.587 .776 .666 .829
.547 .746 .702 .852
Language IV .919 .904 .941 .929Total V .941 .951
-89-
98

Table 70
RELIABILITY CIEFFICIENTS AND STANDARDIZED RELIABILITY COEFFICIENTS
ON THE WHOLE AND HALF-TESTS FOR
SOUTHERN BLACK RURAL VERSUS SOUTHERN WRITE RURAL
Grade 8.6
Test
Vocabulary
Comprehension
Reading Total
Computation
Group 1)
IVV
IVV
IV
. 836
. 898
. 776
.876
.888935
IV .842.917
Concepts & IV .849
Problems V .883
Math Total
Mechanics
IV .909.945
IV .947.938
Usage & IV
Structure V
LanguageTotal
IV
.625
.689
.932
.928
Whole Test Half-Test100-Item KR 20 KR 20 100-Item KR 20
.927 .856 .937
.956 .898 .956
.885 .753 .872
.940 .852 .927
.903 .892 .907
.944 .928 .938
.917 .836 .914
.958 .898 0948
.918 .843 .914
.937 .869 .929
.911 .907 .909
.946 .937 .938
.961 .941 .957
.954 .925 .945
.770 .694 .819
.815 .728 .843
.949 '0939
.913 0939 .927
-90-

Table 71
RELIABILITY COEFFICIENTS AND STANDARDIZED RELIABILITY COEFFICIENTSON THE WHOLE AND HAIF-TFSTS FOR
SOUTHERN BLACK RURAL VERSUS SOUTHERN WHITE RURAL
Grade.10.6
Test GroupWhole Test Half-Test
KR 20 100-Item KR 20 KR 20 100-Item KR 20
Vocabulary
Camp rehension
Reading Total
Computation
Concepts &Problems
Math Total
Mechanics
Usage &Structure
LanguageTotal
IVV
IVV
IVV
IVV
IVV
IVV
IVV
IVV
IVV
.754
.843
.766
.814
.859
.901
.939
.923
.878
.891
.953
.947
.961
.950
.524
.728
.945
.940
.884
.930
.879
.906
.877
.915
.970
.961
.935
.942
.954
.948
.969
.960
.670
.832
.927
.921
.785
.826
.808
.819
.883
.895
.933
.916
.889
.881
.955
.944
.957
.940
.675
.792
.964
.951
.901
.922
.904
.910
.899
.910
.967
.958.
.941
.936
.956
.945
.965
.951
.793
.875
.952
.935
-91-
100

Table 72
RELIABI.JTY COEFFICIENTS AND STANDARDIZED RELIABILITY COEFFICIENTSON THE WHOLE AND HALF-TESTS FOR
SOUTHWESTERN MEXICAN-AMERICAN VERSUS SOUTHWESTERN ANGLO-AMERICAN
Grade 1.6
Test GroupWhole Test Half-Test
KR 20 100-item KR 20 KR 20 100-Item KR 20
Vocabulary
Comprehension
Reading Total
Computation
VI .895 .903 .909 .916VII .935 .940 .934 .941
VI .333 .675 .533 .826VII .883 .969 .875 .967
VI .880 .863 .910 .897VII .952 .945 .953 .946
Vi .926 .969 .916 .965VII .939 .975 .952 .980
Concepts & Vi .853 .925 .857 .927Problems VII .890 .945 .864 .931
Math Total
Mechanics
Usage &Structure
LanguageTotal
VI .934 .942 .936 .944VII .945 .952 .942 .949
VI .675 .845 .767 .897VII .946 .979 .941 .977
VT .582 .874 .703 .922VII .786 .948 .803 .953
VT .786 .834VII .944 .958
.843
.949.880.962

Table 73
RELIABILITY COEFFICIENTS AND STANDARDIZED RELIABILITY COEFFICIENTSON THE WHOLE AND HALF-TESTS FOR
SOUTHWESTERN MEXICAN-AMERICAN VERSUS SOUTHWESTERN ANGLO-AMERICAN
Grade 3.6
TestWhole Test Half-Test
Group KR 20 100-Item KR 20 KR 20 100-Item KR 20
Vocabulary
Comprehension
Reading Total
Computation
VI .900 .957 .897 .956
VII .910 .962 .936 .973
VI ,896 .950 .895 .950VII .916 .960 .921 .963
VI .938 .947 .939 .948VII ,942 .950 .941 .949
VI .938 .955 .944 .959
VII .933 .951 .932 .950
Concepts & VI .898 .951 .900 .952Problems VII .831 .916 .830 .916
VI .951 .943 .954 .947Math Total
VII .936 .926 .936 .926
VI .917 .944 .920 .946Mechanics
VII .938 .958 .930 .953
Usage & VI .829 .951 .864 .962Structure VII .779 .934 .780 .934
Language VI .932 .938 .938 .943Total VII .942 .947 .938 .943
-93-
1
.2
1

Table 74
RELIABILITY COEFFICIENTS AND STANDARDIZED RELIABILITY COEFFICIENTSON THE WHOLE AND HALF-TESTS FOR
SOUTHWESTERN MEXICAN-AMERICAN VERSUS SOUTHWESTERN ANGLO-AMERICAN
Grade 5.6
Test GroupWh_ le Tes
20 100-Item KR 20Half-Test
_R 20 100-Item KR 20
VIVocabulary VII
VI .779 .894 .834 .923Comprehension VII .863 .937 .827 .919
VI .896 .913 .909 .924Reading Total VII .929 .941 .911 .926
.859 .938 .856 .937
.392 .954 .869 .943
VI .897 .928 .912 .938Ccmputation VII .878 .914 .863 .903
Concepts & VI .853 .936 .869 .943
Problems VII .824 .921 .824 .921
VI .932 .927 .941 .937Math Total VII .915 .909 .909 .902
Mechanics
Usage &Structure
LanguageTotal
VI .903 .921 .913 .929
VII .935 .947 .921 .936
VI .467 .681 .652 .820
VII .686 .842 .737 .872
VIVII
.882 .861 .916 .900
.926 .912 .933 .920
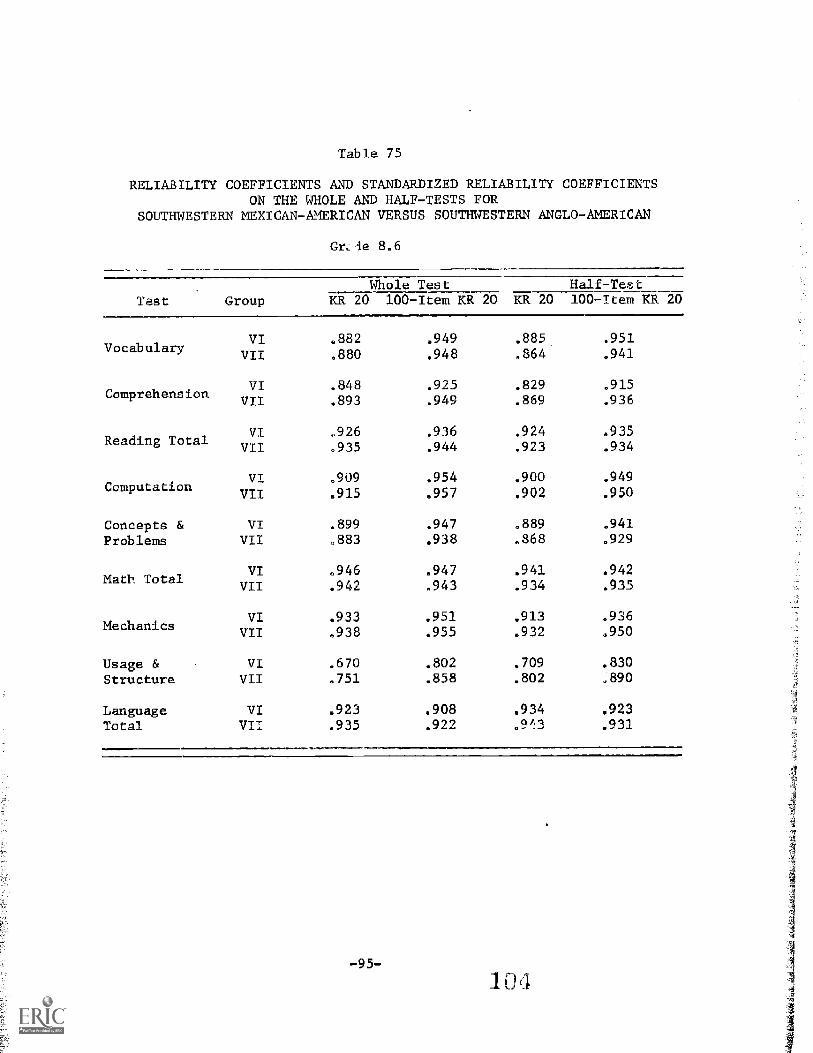
Table 75
RELIABILITY COEFFICIENTS AND STANDARDIZED RELIABILITY COEFFICIENTSON THE WHOLE AND HALF-TESTS FOR
SOUTHWESTERN MEXICAN-AMERICAN VERSUS SOUTHWESTERN ANGLO-AMERICAN
Or, le 8.6
Test GroupWhole Test. Half-Test
KR 20 100-Item KR 20 KR 20 100-Item KR 20
Vocabulary
Comprehension
Reading Total
Computation
Concepts &Problems
Math Total
Mechanics
Usage &Structure
LanguageTotal
VIVII
VIVII
VIVII
VI
VII
VIVII
VIVII
VIVII
VIVII
VIVII
.882
.880
.848
.893
.926
.935
.909
.915
.899e883
.946
.942
.933
.938
.670
.751
.923
.935
.949
.948
.925
.949
.936
.944
.954
.957
.947
.938
.947
.943
.951
.955
.802
.858
.908
.922
.885
.864
.829
.869
.924
.923
.900
.902
.889
.868
.941
.934
.913
.932
.709
.802
.934
.9/:3
.951
.941
.915
.936
.935
.934
.949
.950
.941
.929
.942
.935
.936
.950
.830J190
.923
.931
-95-