Embed Size (px)
Citation preview

DOCUMENT RESUME
ED 066 882 EM 010 171
AUTHOR Pearce, AlanTITLE The Economics of Network Children's Television
Programming.INSTITUTION Federal Communications Commission, Washington,
D.C.PUB DATE 72NarE 73p.
EDRS PRICE MF-$0.65 HC-$3.29DESCRIPTORS Broadcast Industry; Childhood Interests; *Children;
*Commercial Television; Costs; Economics; *FinancialSupport; *Programing (Broadcast); *Television
IDENTIFIERS ACT; *Action for Childrens Television
ABSTRACTAction for Children's Television has petitioned
the Federal Communications Commission (FCC) that networks be allowedto schedule no commercials on children's programs and also thatnetworks schedule programs directed toward specific children's agegroups. An analysis of network revenues from children's programsshows that networks could still make a substantial profit if sevencommercial minutes, rather than the present eight, were allowed, andthat they could probably still make profit if they presentedage-specific programs. Included in the analysis are an explanation ofhow program ratings determine advertising rates, a list of the majoradvertisers on children's television and the extent of theirfinancial support of network children's shows, the revenues fornetwork children's shows in 1970 and the ratings of those shows inFall 1971. 019

b
0
0
FILMED FROM BEST AVAILABLE COPY
U.S. DEPARTMENT OF HEALTH,EDUCATION 8 WELFAREOFFICE Or EDUCATION
THIS DOCUMENT HAS BEEN REPRO.DUCED EXACTLY AS RECEIVED FROMTHE PERSON OR ORGANIZATION ORIGIMiNG IT POINTS OF VIEW OR OPINIONS STATED DO NOT NECESSARILYREPRESENT OFFICIAL OFFICE OF EDUCATION POSITION OR POLICY
he Economics of Network Children's Television Programming
A report by Alan Pearce
This report was prepared for consideration in the proceeding onchildren's television. Any views or conclusions in the report are thoseof the author and do not, in any way, represent FCC views or conclusionsthat may be reached in the Inquiry.
1
4

TABLE OF CONTENTS
Page
3
6
8
10
1. BROADCAST ECONOMICSStructure of TV Broadcasting
2. ADVERTISING iN NETWORK CHILDREN'S PROGRAMS
3. COSTS AND REVENUES OF NETWORK CHILDREN'S PROGRAMMING(a) Costs of Programs : Introduction 10
Costs of Programs at CTW 11
Costs of Prime-Time Children's Programs 12
Costs of Saturday Morning Programs 13
(b) Revenues 14
ABC Television Weekend Children's Shows, 1970 16
ABC Television Children's Specials , 1970 18
CBS Television Weekend Children's Shows, 1970 19
CBS Children's Specials, 1970 22
NBC Television Weekend Children's Shows, 1970 24
NBC Children's Specials, 1970 26
4. IMPACT ON PROFITS OF A REDUCTION OF COMMERCIAL TIME ONNETWORK CHILDREN'S PROGRAMMIN( 29
Profit contributions of children's television programs 33Effect of reducing commercial time 34
The Ratings AlUnprofitable children's programs .44
A new program for pre-schoolers 49Profits from children's programs 51
5. THE ECONOMIC IMPLICATIONS TO THE NETWORKS OF THE ACTPETITION 56
Amount of " hildren's programming 56Loss of revenue 58
Underwriting and Institutional Advertising 59Age specific programming 60
'T1MMARY 66
LIST OF PEOPLE INTERVIEWED 68

- 3 -
The purposes of this presentation are:
1. To give a brief outline of a basic economic law governing
the broadcast industry.
2. To list the major advertisers in children's programming and
the extent of their financial support of network children's shows.
3. To outline the costs and revenues of children's programming.
4. To xplore the financial impact on the networks of a reduc-
tion of commercial time in children's weekend programming.
5. To'examine the broad economic implications to the networks
of the ACT petition on children's programming.
1. BROADCAST ECONOMICS
In the broadcasting business, ratings determine revenues. The
bigger a network's audience, the more it can charge for the time it
sells to advertisers. From an advertiser's point of view, what
matters is the size of the audience watching the program surrounding
the commercial minutes. The ratings points, which express the ab-
solute numbers of television homes tuned in to a particular program,
are, in effect, the only way broadcasLers have yet figured out to
price their merchandise, which is the time the public spends
watching television. The demographic make-up of the audience has
begun to play a more important role in the pricing mechanism of
television commercials, but generally speaking, ratings still
determine revenues.
Audience measurement ratings equate with circulation (or
readership) in the print media, with one important economic difference.
This difference concerns unit costs--copies of newspapers or magazines
in the print media, and numbers of homes tuned in to a program in
broadcasting.

- 4 -
If a newspaper publisher has a newspaper operation that costs $1
million a day, with a daily circulation of 1 million and advertising
revenue of $500,000 daily, he has to sell, his newspapers for 50 cents
each in order to break even. If his circulation increases to 2
million copies a day and his advertising revenue doubles to $1
million, he might have to charge a high price per copy because
some of his costs increase. He might need more presses, more metal
for type, and more ink; more pages to carry his advertising which
means higher newsprint costs, and possibly more labor to handle the
extra circulation and advertising; or even more vehicles and man-
power to handle distribution of his product. In fact, if a
newspaper or magazine becomes really popular, and if advertising
revenue does not keep pace because the readership is not attractive
to advertisers, then unit costs may actually begin to rise and this
can result in uneconomic publishing. This was part of the reason
for the deaths of The Saturday Evening Post and Look.
The broadcasting industry, on the other hand, is not beset
by the threat of increases in per unit costs; indeed the reverse
is true, for as more people or more homes watch or listen to a
program, per unit costs fall quite dramatically. If a broadcaster
has a product--a children's television special for example--that
costs $1 million to produce and sell at a profit, and he has an
audience of a million households, it costs him $1 for each house-
hold in the audience and he attempts to fix the rates for his
commercial minutes accordingly. If the audience for the show
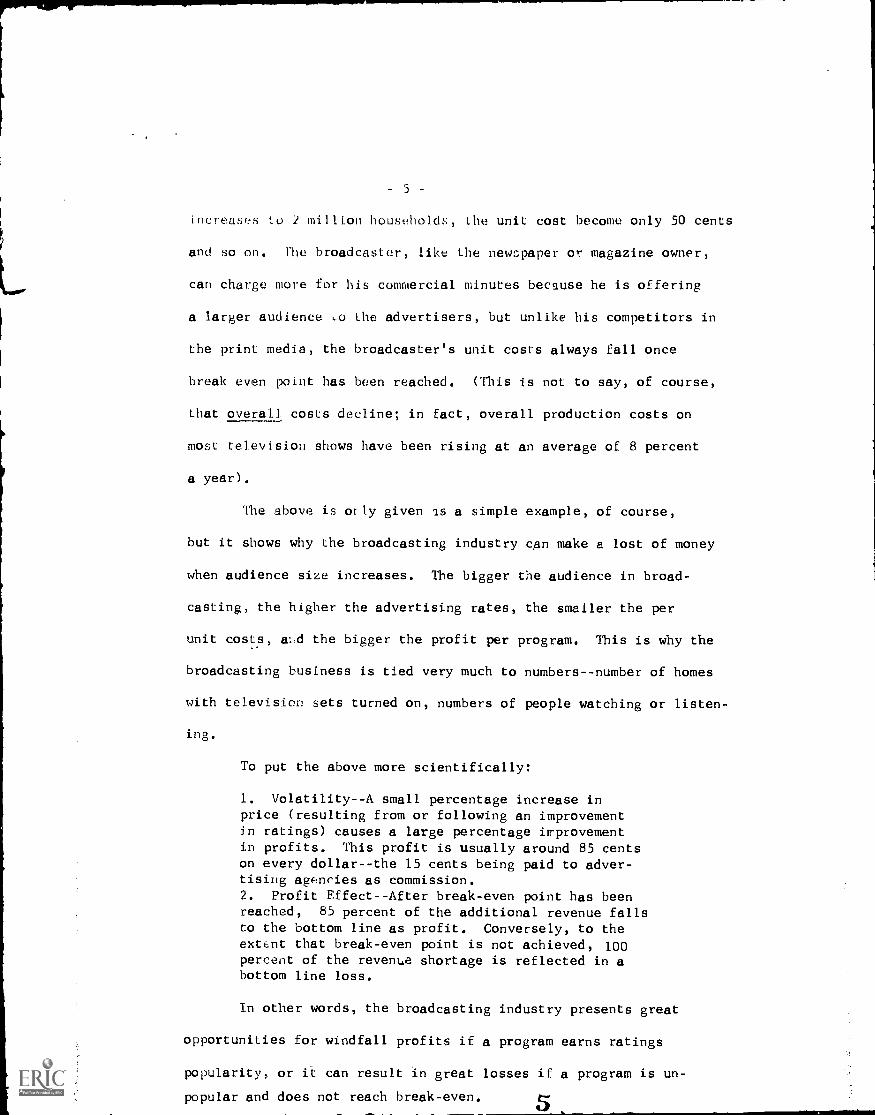
- 5 -
increases Li) 2 million households, Lhe unit cost become only 50 cents
and so on. The broadcaster, like the newspaper or magazine owner,
can charge more for his commercial minutes because he is offering
a larger audience Lo the advertisers, but unlike his competitors in
the print media, the broadcaster's unit costs always fall once
break even point has been reached. (This is not to say, of course,
that overall costs decline; in fact, overall production costs on
most television shows have been rising at an average of 8 percent
a year).
The above is orly given as a simple example, of course,
but it shows why the broadcasting industry can make a lost of money
when audience size increases. The bigger the audience in broad-
casting, the higher the advertising rates, the smaller the per
unit costs, atli the bigger the profit per program. This is why the
broadcasting business is tied very much to numbers--number of homes
with television sets turned on, numbers of people watching or listen-
ing.
To put the above more scientifically:
1. Volatility--A small percentage increase inprice (resulting from or following an improvementin ratings) causes a large percentage irprovementin profits. This profit is usually around 85 centson every dollar--the 15 cents being paid to adver-tising agencies as commission.2. Profit Effect- -After break-even point has beenreached, 85 percent of the additional revenue fallsto the bottom line as profit. Conversely, to theextent that break-even point is not achieved, 100
percent of the revenue shortage is reflected in abottom line loss.
In other words, the broadcasting industry presents great
opportunities for windfall profits if a program earns ratings
popularity, or it can result in great losses if a program is un-
popular and does not reach break-even.

- 6 -
All of this can be expressed grt,111.cally:
4 Poi 000
(&rotas %volute,7 AA tic hp iwpmemosiw We tn.'s(' Am
XXXXXxX x x
xc AAXX X X 7SX X XX X
,L.053
Millions of homes tuned in....
STRUCTURE OF TELEVISION BROADCASTING
In order to put the system of network television into
perspective for the purposes of this study, the following chart
might prove helpful:
Non. Assliejcosts ,.e.
'617 44 prsrimQ4m,n;stfirrooi.Costs s+4*.iph
(.0 IN. i sgtngt,

Parent Company
Subsidiary
Network
- 7 -
THE TELEVISION NETWORKS
American Columbia RadioBroadcasting Broadcasting CorporationCompanies System of
(includes Awerica (RCA)UnitedParamountTheatres)
NationalBroadcastingCompany
ABC CBS NBCTelevision Television TelevisionNetwork Network Network
0 & 0's(5 VHF)
Cleveland WKYC-tvChicago WLS-tv WBBM-tv WMAQ-tvDetroit WXYZ-tvLos Angeles KABC-tv KNXT-tv KNBC-tvNew York WABC-tv WCBS-tv WNBC-tvPhiladelphia WCAU-tvSt. Louis KM0X-tl-
San Francisco KGO-tvWashington, D.C. WRC-tv
Number ofAffiliates(1971) 168 primary 192 primary 219
118 secondary* 3 also available
Number ofCommercialIndependents(1971 Estimate) 29 VHF
48 UHF
* A secondary affiliate carries less programming thana primary affiliate and might also have an affiliationwith another network. Consequently, there isdouble counting of affiliates. All told, there areabout 600 affiliates.
Compiled by Alan Pearce from data collected from the networks,from Broadcasting Yearbook 1971, and from Television Factbook,1970-71 Edition /No. 40.

- 8 -
2. ADVERTISERS IN NETWORK CHILDREN'S PROGRAMS
According to Broadcast Advertisers Reports, an estimated
$74,664,400 was spent by advertisers in 1970 on network weekend
children's television shows. This was divided among the networks
as follows:
ABC Television Network: $20,206,300, or 27.06 percent of the total;
CBS Television Network: $39,878,400, or 53.41 percent of the total;
NBC Television Network: $14,579,700, or 19.52 percent of the total.
The three leading advertisers in network children's tele-
vision programs--Kellogg, Mattel, and General Mills--account for almost 30
percent of total revenues from children's shows:
Kellogg Company, which spent a total of $8,902,800on network weekend children's shows in 1970. Nearly62 percent of this, or over $5k million, was spentwith CBS; about 38 percent,or roughly $3k million,was spent with NBC; and less than lk percent, or$125,000, was spent with ABC.Mattel Inc., which spent a total of $7,837,200 innetwork weekend children's programs in 1970. Alittle over 65 percent of this, or nearly$5,100,000, went to CBS; 18 percent, or just over$1.4 million, went to ABC; and nearly 17 percent,or roughly $1.3 million, went to NBC.General Mills Inc., which spent $7,097,500 onnetwork weekend children's programs in 1970. Over65 percent of this, almost $5,100,000,was spentwith the CBS Network; over 25 percent, or $1.8million, with ABC; and nearly 9 percent, or$634,000, with NBC.
The next five advertisers in children's weekend programs
on the networks--General Foods Corporation, DeLuxe Topper Toys,
Quaker Oats, Miles Laboratories, and Mars--account for a further
25 percent of gross revenues:

(.)
Parent Company
Total Est.10:,C.
Est. Rev.
"4 of CBSEst. Rev.
"'., of NBCRevenue(in 000's) Rev. Rev. Est. Rev.
General Foods $6,034.7 $1,647.7 2./.30 $4,035.2 66.86 $ 351.8
DeLuxe Topper 4,005.1 220.8 5.51 3,210.0 80.14 574.3 14.3
Ove.,cer Oats 3,782.4 655.9 17.34 2,162.1 57.16 964.4 25.4
v4:ec Labs 2,639.0 738.7 27.99 1,332.4 50.48 567.9 21.5
mays Inc. 2,275.3 1,237.6 54.39 4.2 .18 1,033.5 45.4.
Scurce: BAR.
Another 15 companies--Milton Bradley, Bristol-Myers, Ideal
Toy, Hasbro, Louis Marx, IT&T, Nabisco, Borden, Nestle, American Home
Products, Pepsico, Campbell Soups, Norton Simon, McDonalds, and Kecbler--
acceu.7t for a further 25 percent of gross revenues. These companies
spent from $2,168,900 down to $721,400 on network children's weekend
trAPvision in 1970. A further 57 companies accounted for the last 20
percent of gross revenues.
Thus children's programming at the network level is characterized
by a situation where relatively few advertisers are competing for
commercial space offered by 3 suppliers. As we have seen, the top
3 advertisers account for 30 percent of gross revenue; the top 8
advertisers account for 55 percent; and the top 23 advertisers
account fox 80 percent of the gross revenue derived from network
weekend children's programming.
Children's programming is further characterized by the
business nature of the top 23 advertisers (with some overlap because
of the diversified nature of some of the companies):
9

- 10 -
Cereal: Kellogg ($8.9 million spent on advertising it weekend netoorkchildren's shows in 1970); General Mills ($7 million); General Foods($6 million); Quaker ($3.8 million).
Toys: Mattel ($7.8 million); Deluxe Topper'($4 million); Milton Bradley($2.2 million); Ideal ($1.75 million); Hasbro ($1.55 million);Louis Marx ($1.55 million).
Vitamins/Non-Piescription Drugs: Miles ($2.6 million); Bristol-Myers($1.9 million); American Home Products ($1 million).
Food/Oandy/Beverages: Mars ($2.3 million); IT&T ($1.5 million);Nabisco ($1.3 million); Borden ($1.25 million); Nestle ($1.25 million);Pepsico ($.9 million); Campbell Soup ($.85 million); Norton Simon($.8 million); McDonalds Corporation ($.75 million); Keebler ($.7million).
NB: General Mills, although listed as a cereal manufacturer, has asubstantial interest in toys through its subsidiaries, Kenner Productsand Parker Brothers (manufacturers of Monopoly, the world's mostpopular board game). Quaker, another cereal manufacturer, ownsFisher-Price Toys.
3. COSTS AND REVENUES OF NETWORK CHILDREN'S PROGRAMMING
(a) Costs of Programs: Introduction
Natarally enough, the costs of children's programs very
enormously; Captain Kan_aroo, for example, produced by CBS as a
weekday program for pre-schoolers from 8-9 a.m. Monday through Friday,
has a weekly production budget in the region of $75,000, or $15,000
a show. This figure excludes certain development overheads aid
administrative costs that are sustained by CBS. Show budgets do not
normally reflect their shares of top administration salaries, or of
the costs of selling the commercial time in the program, or the
costs of press and publicity, and other services. These costs
are absorbed by the networks producing or presenting the shows, and
are eventually deducted from the total profit contribution made by
the program departments. We shall return to this question of profit
10

- 11 -
contributioA inter. Captain Kangaroo, in fact, is an expensive show
for daytime television- -The Today Show on NBC cost $100,000 a wook
in 1970 and for that NBC was able to provide 10 hours of adult t4ews-
magazine type programming. Generally speaking, the cartoon fare
that complisos most of what is known as children's weekend television- -
shows like Scooby-Doo Where Are You?, Sabrina the Teenage Witch,
Funky Phantom, and The Pink Panther Meets the Ant and the Ardvark,
cost en average of between $10,000 and $11,000 per half hour, as
compared with 7,500 for captain 1..angaroo. The networks pay
$1,054,000 for 17 original negatives which they buy from the leading
suppliers of cartoons; thus each negative costs the network $62,000,
and it is played a total of 6 times over a 2-year period at a cost
of just over $10,000 a showing, before ownership reverts to the
cartoon producer for syndication sale. Consequently, each showing
costs the network an average of $10,333, but this does not include
editing and reprint costs.
Costs of Program at CTW
Other children's programming is similarly expensive. For
example, The rlectric Company, produced by Children's Television
for Public Television, cost around $8 million for the first 160
half hour shows. At first glance, this seems to be prohibitively
expensive and, as one NBC network executive said, Bonanza, a top
rated prime-time adult show, can be bought for less than that. The
fact is, however, that the costs of The Electric Company, and other
shows that have been described as "quality" children's programs,
can be amortized over a great many years. If each episode of
11

- 12 -
The Electric Company was shown only once, then it
would cost $50,000 per half hour--wel1 below the average cost of
$62,000 per negative for cartoons. But like the cartoons, The
Electric Company is shown several times, so if each program is aired
at least five times, the actual cost per half hour is only $10,000.
In addition, a program like The Electric Company can be shown to
successive generations of children with equal interest, so the
final cost per half hour can be reduced substantially. Finally,
unlike the networks, CTW includes all of its costs in its program
budgets, so The Electric Company includes costs of research and
administration, which tend to inflate the overall costs of pro-
duction. Sesame Street, the other program produced by CTW, costs
roughly $5 million for 160 1-hour shows--an average cost of $31,250
per hour. Here again, the program costs can be written off over
several aiKings, so that the actual cost is much lower. Incidentally,
the reason that The Electric Company is so much more expensive than
Sesame Street is because of the use of animation, which costs CTW
$4,000 a minute; the networks, hpwever, pay less for their anima-
tion because they buy in bulk and also because they often cut costs
on animation by ordering fewer frames per second. Sesame Street uses
very little animation, producing jumpy movement.
Costs of Prime-Time Chile,..en's Programs
NBC is the only network that regularly programs for children
in prime-time with its Wonderful World of Disney on Sunday evenings
from 7:30 to 8:30 p.m. The Disney Company has, of course, a long
12

- 13 -
.Jstablished record in the field of children's entertainment, The
Disney contract with NBC stipulates that the network payeDisney
$250,000 for each of 20 original programs in a season. The rest
of the programs that fill the scheu...e are repeats from previous
seasons with a price tag of between $30,000 and $40.000 a showing.
Usually Cie network buys about 48 hours of television from Disney over
the year--20 originals and 28 repeats, down from 26 originals and
26 repeats a few seasons ago. The change was made for reasons of
economy. Disney material, and children's prime-time evening
specials, are usually very expensive programs. A National
Geographic, special costs $350,000 for an hour, with a $100,000 fee
if the program is repeated by the network--a total cost of $450,000
for 2 hours of prime-time television. CBS Television Network paid
over $400,000 for a 1-hour special, JT, a dramatic presentation about
a Black child.
Costs of Saturday Morning Programs
For the current Saturday morning season, all 3 networks
tried to diversify their programming somewhat by introducing some-
thing other than cartoons. CBS introduced You Are There, a half-hour
which costs $65,000 for one episode that will be repeated at least
once; Children's Film Festival, a 1-hour program which costs
$35,000 for two runs; and In- the -News, periodic 2-minute .-.2ws
segments put into the Saturday morning children's schedule at
an annual cost of around $500,000. ABC introduced Curiosity Shop,
an entertainment-information program which costs $130,000 for each
13

- 14 -
1-hour program. The original plan ^s to produce 17 original
shows, costing $130,000 each for a total cost of $2,210,000 and then
repeat each show 6 times for an average cost of nearly $22,000 per
hour, per showing, which means that the show costs roughly what a
cartoon costs. NBC introduced Barrier Reef, a half-hour Australian
live-action adventure series with a lot of underwater filming and
an ecology theme, which costs $20,000 for 3 showings--below the usual
average cost. In addition, the network introduced Take a Giant Step a one-
hour entertainment-information program budgeted at $30,000 a show.
NBC plans to produce at least 26 original shows, and possibly 30,
then repeat the best of them. So the average cost per showing will
be $15,000--or $7,500 per half hour, considerably lower than the
average cost of children's Saturday morning programming.
The program cost figure to bear in mind therefore is an
average of $10,000 or $11,000 per half hour per showing for weekend
children's programming at the network level, with programming costs
of around $250,000 per hour for first showings of network Prime-time
children's television.
(b) Revenues
Although the costs of programs listed above are current
costs, i.e. 71-72 season, the revenues listed below are for the
1970 calendar year. The data were derived from Broadcast
Advertisers Reports Inc., in New York. As we have seen, total gross
revenues from network weekend children's shows for 1970 were
14
- 15 -
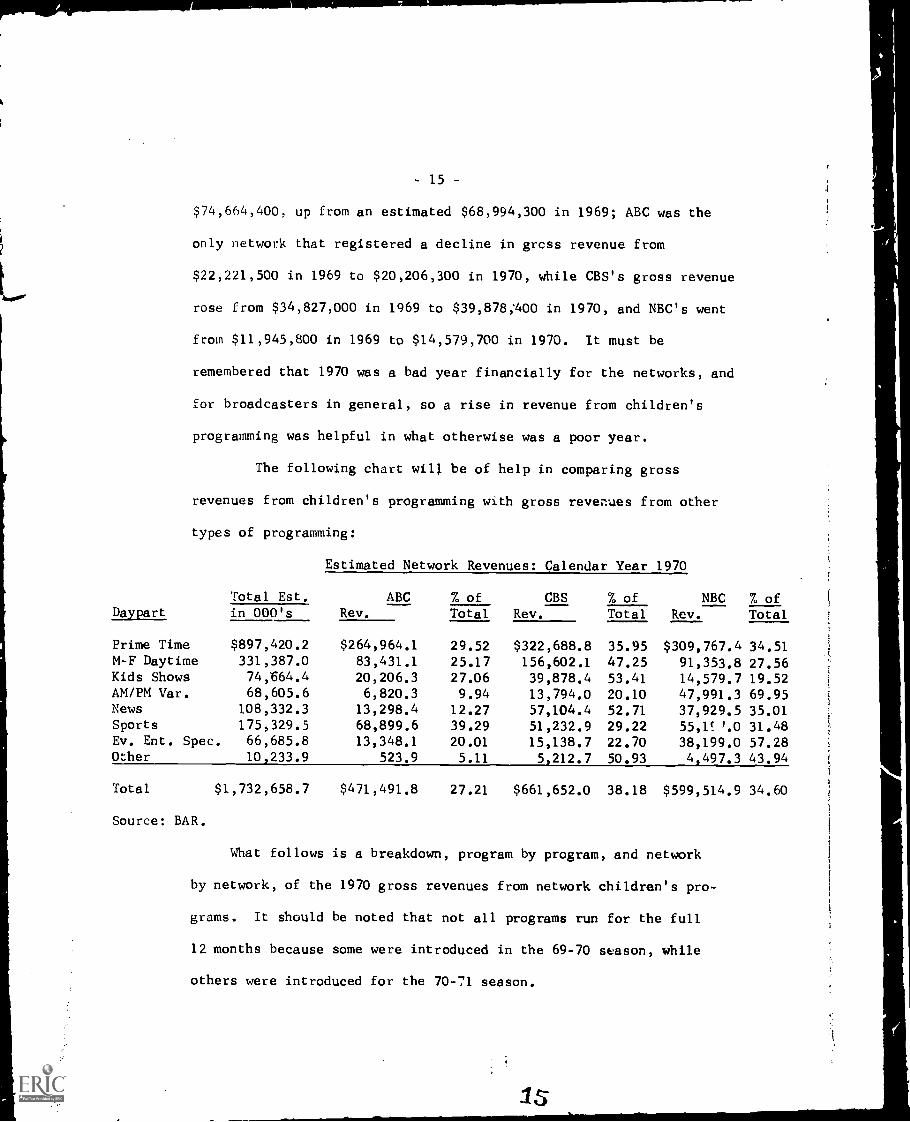
$74,664,400, up from an estimated $68,994,300 in 1969; ABC was the
only network that registered a decline in grcss revenue from
$22,221,500 in 1969 to $20,206,300 in 1970, while CBS's gross revenue
rose from $34,827,000 in 1969 to $39,878;400 in 1970, and NBC's went
from $11,945,800 in 1969 to $14,579,700 in 1970. It must be
remembered that 1970 was a bad year financially for the networks, and
for broadcasters in general, so a rise in revenue from children's
programming was helpful in what otherwise was a poor year.
The following chart will be of help in comparing gross
revenues from children's programming with gross revenues from other
types of programming:
Estimated Network Revenues: Calendar Year 1970
DaypartTotal Est. ABC % of CBS % of NBC % ofin 000's Rev. Total Rev. Total Rev. Total
Prime Time $897,420.2 $264,964.1 29.52 $322,688.8 35.95 $309,767.4 34.51M-F Daytime 331,387.0 83,431.1 25.17 156,602.1 47.25 91,353.8 27.56Kids Shows 74;664.4 20,206.3 27.06 39,878.4 53.41 14,579.7 19.52AM/PM Var. 68,605.6 6,820.3 9.94 13,794.0 20.10 47,991.3 69.95News 108,332.3 13,298.4 12.27 57,104.4 52.71 37,929.5 35.01Sports 175,329.5 68,899.6 39.29 51,232.9 29.22 55,1' Y.0 31.48Ev. Ent. Spec. 66,685.8 13,348.1 20.01 15,138.7 22.70 38,199.0 57.28Other 10,233.9 523.9 5.11 5,212.7 50.93 4,497.3 43.94
Total $1,732,658.7 $471,491.8 27.21 $661,652.0 38.18 $599,514.9 34.60
Source: BAR.
What follows is a breakdown, program by program, and network
by network, of the 1970 gross revenues from network children's pro-
grams. It should be noted that not all programs run for the full
12 months because some were introduced in the 69-70 season, while
others were introduced for the 70-71 season.

- 16 -
ABC Television Weekend Children's Shows: 1970.
Adventures of Gulliver grossed $323,200 in 9 months from 100minutes of advertising, an average of $3,232 per minute. Biggestadvertiser: General Foods - $58,000 for 19 minutes of advertising.
Bullwinkle grossed $1,373,200 in 12 months from 267 minutes ofadvertising, an average of $5,143 per minute. Biggest advertiser:General Mills - $528,300 for 103 minutes.
Cattanooga Cats I grossed $1,348,700 in 12 months from 250 minutesand 45 seconds of advertising, an average of $5,373 per minute.Biggest advertisers: Ralston Purina Company - $98,100; Marx -$92,800.
Cattanooga Cats II grossed $983,600 in 9 months from 181 minutesof advertising, an average of $5,434 per minute. Biggestadverstiser: General Foods - $155,800 for 31 minutes.
Dudley Do-Right grossed $463,200 in 10 months from 147 minutesof advertising, an average of $3.151 per minute. Biggestadvertiser: General Mills - $182,200 for 58 minutes.
Fantastic 4/Fantastic Voyage grossed $656,600 in 12 months from15q -,inutes of advertising, an average of $4,291 per minute.
advertisers: Mattel - $110,700; General Foods - $58,000
George of the Jungle grossed $711,100 in 9 months from 143minutes of advertising, an average of $4,972 per minute.Biggest advertisers: General Mills - $149,200; General Foods -$84,000.
Hardy Boys grossed $1,665,100 in 12 months from 280 minutes ofadvertising, an average of $5,946 per minute. Biggest advertisers:Mars -$202,200; General Foods- $182,400; General Mills - $143,700;Mattel - $140,700.
Here Come the Double-Deckers grossed $866,000 in 4 months from 94minutes of advertising, an average of $9,212 per minute.Biggest: advertiser: General Mills - $147,200 for 16 mir.ites.
Hot Wheels grossed $1,697,600 in 12 months from 265 minutes ofadvertising, an average of $6,406 per minute. Biggest advertisers:Mars - $255,800; Mattel - $224,000; General Foods - $134,800.
Jonny Quest grossed $439,200 in 4 months from 91 minutes of advertising,an average of $4,826 per minute. Biggest advertisers: General Mills -$116,700: Quaker - $67,000.
16

- 17 -
Lancelot Link Chimps I grossed $712,400 in 4 months from 91 minutesand 30 seconds of advertising, an average of $7,828 per minutes.Biggest advertisers: General Mills - $116,700; Quaker - $67,000.
Lancelot Link Chimps II grossed $783,200 in 4 months from 89 minutesof advertising, an average of $8,800 per minute. Biggest advertisers:
Eldon Industries - $123,200; Mattel - $96,800; Marx - $70,400.
Motor House grossed $394,200 in 4 months from 79 minutes of advertising,an average of $4,989 per minute.
Reluctant Dragon - Mr. Toad grossed $253,000 in 4 months from 73 minutesof advertising, an average of $3,465 per minute. Biggest advertisers:
General Mills - $57,600; General Foods - $36,000.
Sky Hawks grossed $1,316,700 in 12 months from 249 minutes of advertising,an average of $5,287 per minute. Biggest advertisers: Mars- $184,800;General Foods - $173,700; Ideal Toy - $112,600; Quaker - $111,900.
Smokey Bear Show grossed $889,700 in 12 months from 225 minutes ofadvertising, an average of $3,954 per minute. Biggest advertisers:General Foods - $122,800; General Mills - $113,500.
Spiderman grossed $264,700 in 3 months from 63 minutes of advertising,an average of $4,201' per minute. Biggest advertisers: Mattel - $66,600;Remco - $39,000; Tootsie Roll - $33,400.
Will Jerrry Lewis Sit Down grossed $872,100 in 4 months from 93 minutesof advertising, an average of $9,377 per minute. Biggest advertisers:Ideal Toy - $139,600; General Mills - $112,700.
knerican Bandstand grossed $2,841,800 in 12 months from 464 minutesadvertising, an average of $6,124 per minute.
Together, all the programs listed above grossed $18,974,800 in 1970,with a total of 3,411 minutes of advertising, an average of $5,562per minute.

- 18 -
ABC Television Children's Specilds broadcast in 1970:
Santa Claus, a one-hour show brcadcast in pece-her, grossed $298,800from 6 minutes of advertising, an average of $49,800 per minute.Advertisers: American Home, Bristol-Myers, Campbell, Norton Simon,Polaroid, and RCA - all 1 minute.
The Animals Talked, a half-four show broadcast in December, grossed$194,400 from 3 minutes of advertising, paid for by Norton Simon,at an average of $64,800 per minute.
Tales of Muppetland, broadcast in April, grossed $763,200 from 15mThutes of advertising, an average of $50,880 per minute. ReynoldsIndustries bought 6 minutes for $270,000, an average of $45,000 perminute.
Animal World, a series of six one-hour specials broadcast monthly,grossed $1,501,100 from 63 minutes of advertising, an average of$23,826 per minute
With These Hands, a one-hour show broadcast in May, grossed $297,000from 6 minutes of advertising, an average of $49,500 per minute. Thesponsor was S.C. Johnson.
In addition, ABC carried the following series of special interest Lochildren:
Undersea World of Jacques Cousteau grossed $2,916,000 from 54 minutesof advertising, an average of $54,000 per minute. There were 9 showsduring 1970. Biggest advertisers: DuPont - $1,248,000; HartfordInsurance Company - $1,248,000; Armstrong Cork - $420,000.
3M Specials grossed $1,757,300 from 39 minutes of advertising, anaverage of $45,058 per minute. 3M was the sole sponsor.
is

- 19 -
CBS Television Weekend Children's Shows: 1970.
Wacky Races grossed $1,600,600 in 9 months, selling 199 minutes ofadvertising, an average per minute cost of $8,043. Biggestadvertisers: General Foods - $274,300; General Mills - $238,200;Mattel - $213,200; Quaker - $166,500; Topper $139,400.
Tom and Gerry grossed $1,431,000 in 12 months, selling 279 minutesof advertising, an average per minute cost of $5,129. Biggestadvertisers: General Mills - $413,200; Topper - $153,400; Mattel -$139,800; Kellogg - $75,700; Bristol -Myers - $69,600; Miles Labs -$68,300; General Foods - $56,600.
Superman grossed $1,155,000 in 9 months, selling 182 minutes ofadvertising, an average per minute cost of $6,346. Biggestadvertisers: General Mills - $307,700; Mattel - $177,400; GeneralFoods - $17,700; Topper - $88,800; Pepsico - $51,500; Quaker - $43,200.
Scooby Doo Where Are You? grossed $3,200,500 in 12 months, selling307 minutes of advertising, an average per minute cost of $10,425.Biggest advertisers: Mattel - $569,900; General Foods - $515,200;Quaker - $391,200; Kellogg - $394,300; Topper - $165,800; GeneralMills - $159,100; Bradley Milton - $117,800; Borden - $116,100.
Sabrina Groovie Goolies grossed $2,200,300 in 4 months, selling 176minutes of advertising, an average per minute cost of $12,501.Biggest advertisers: Mattel - $227,700; General Foods - $184,600;General Mills - $179,800; Marx - $179,800; Topper - $179,600;Ralston Purina - $119,800; Quaker - $92,600; Nestle"- $92,400;Bristol-Myers - $92,400.
The Monkees grossed $2.954,800 in 12 months, selling 286 minutesof advertising, an average per minute cost of $10,331. Biggestadvertisers: General Foods - $675,900; Mattel - $671,000; Topper -$320,200; General Mills - $198,600; Nabisco - $183,600; Kellogg -$161,600; Nestle - $119,600.
Perils of Penelope Pitstop grossed $2,234,100 in 12 months,selling 290 minutes of advertising, an average of $7,703 per minute.Biggest advertisers: General Mills - $583,900; Mattel - $29,900;Topper - $259,700; General Foods - $203,400; Quaker - $164,900;Kellogg - $112,400.
Josie and the Pussycats grossed $1,172,700 in 4 months, selling 94minutes of advertising, an average of $12,475 per minute. Biggestadvertisers: Kellogg - $597,100; Mattel - $565,400.
- 20 -
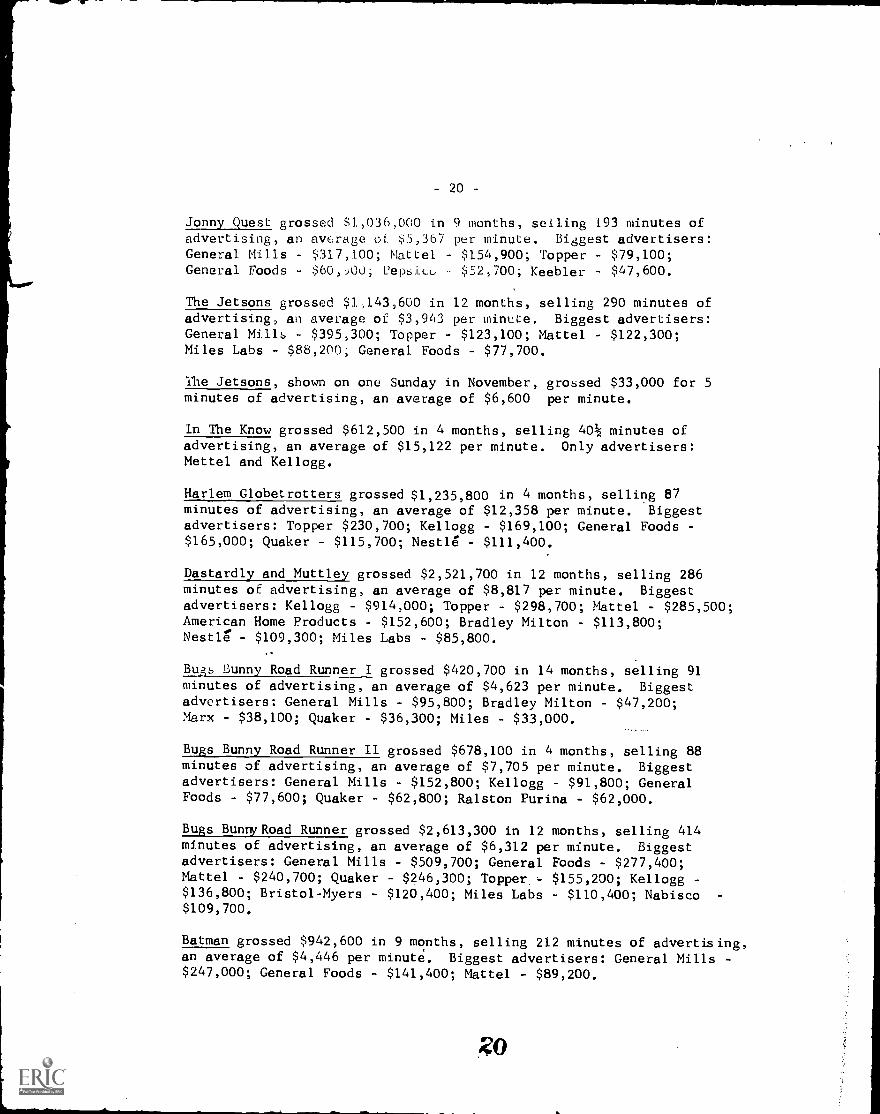
Jonny Quest grossed $1,036,000 in 9 months, selling 193 minutes ofadvertising, an average of. $5,367 per minute. Biggest advertisers:General. Mills - $317,100; Mattel $154,900; Topper - $79,100;General Foods - $60,)00; Peptiicu $52,700; Keebler - $47,600.
The Jetsons grossed $1,143,600 in 12 months, selling 290 minutes ofadvertising, an average of $3,943 per minute. Biggest advertisers:General Mills - $395,300; Topper - $123,100; Mattel - $122,300;Miles Labs - $88,200; General Foods - $77,700.
The Jetsons, shown on one Sunday in November, grossed $33,000 for 5minutes of advertising, an average of $6,600 per minute.
In The Know grossed $612,500 in 4 months, selling 401/2 minutes ofadvertising, an average of $15,122 per minute. Only advertisers:Mettel and Kellogg.
Harlem Globetrotters grossed $1,235,800 in 4 months, selling 87minutes of advertising, an average of $12,358 per minute. Biggestadvertisers: Topper $230,700; Kellogg - $169,100; General Foods -$165,000; Quaker - $115,700; Nestle - $111,400.
Dastardly and Muttley grossed $2,521,700 in 12 months, selling 286minutes of advertising, an average of $8,817 per minute. Biggestadvertisers: Kellogg - $914,000; Topper - $298,700; Mattel - $285,500;American Home Products - $152,600; Bradley Milton - $113,800;Nestle - $109,300; Miles Labs - $85,800.
Bu1, Bunny Road Runner I grossed $420,700 in 14 months, selling 91minutes of advertising, an average of $4,623 per minute. Biggestadvertisers: General Mills - $95,800; Bradley Milton - $47,200;Marx - $38,100; Quaker - $36,300; Miles - $33,000.
Bugs Bunny Road Runner II grossed $678,100 in 4 months, selling 88minutes of advertising, an average of $7,705 per minute. Biggestadvertisers: General Mills - $152,800; Kellogg - $91,800; GeneralFoods - $77,600; Quaker - $62,800; Ralston Purina - $62,000.
Bugs Bunny Road Runner grossed $2,613,300 in 12 months, selling 414minutes of advertising, an average of $6,312 per minute. Biggestadvertisers: General Mills - $509,700; General Foods - $277,400;Mattel - $240,700; Quaker - $246,300; Topper .= $155,200; Kellogg -
$136,800; Bristol-Myers - $120,400; Miles Labs - $110,400; Nabisco$109,700.
Batman grossed $942,600 in 9 months, selling 212 minutes of advertising,an average of $4,446 per minute. Biggest advertisers: General Mills -$247,000; General Foods - $141,400; Mattel - $89,200.
.?0

- zl -
Archie's Fun House grossed 52,4314,200 in 4 months, selling 181minutes of advertising, an average of $13,448 per minute. Biggest
advertisers: Mattel - $656,500; Quaker - $322,500; General Foods -$224,300; Topper - $205,700; Kellogg - $161,800; Ideal Toy - $123,000.
Archie Comedy Hour grossed $3,832,300 in 9 months, selling 495minutes of advertising, an average of $9,462 per minute. Biggest
advertisers: General Foods - $811,400; Topper - $417,300; Quaker -$351,000; Mattel - $336,300; General Mills - $269,400; Kellogg -$210,400; Miles Labs - ';;180,600; Nabisco - $176,000; Nestlg - $175,503;Bristol-Myers - $167,200; Borden - $125,000.
Together, all the programs listed above grossed $33,452,800 in 1970,with a total of 4,105 minutes of advertising, an average of $8,149per minute.
In addition, CBS presented Captain Kangaroo from 8 to 9 a.m.daily, Monday through Friday for pre-schoolers as part of its regu-lar children's television schedule. In 1970, the show grossed anestimated $6,591,800, carrying a total of 2,010 minutes of advertising,at an average of $3,379 per minute. The biggest advertisers were:Kellogg - $1,912,400; General Mills - $531,200; Colgate-Palmolive -$491,800; Bradley Milton - $447,500; Bristol - Myers - $416,200;ITT - $312,500.

- 22 -
CBS Children's Specials broadcast in 1970:
You're in Love Charlie Brown, a half-hour show, carried 3 minutes ofadvertising for which Coca-Cola paid $88,200, an average of $29,400per minute.
Short Summer Charlie Brown, a half-hour show, carried 3 minutes ofadvertising shared between Coca-Cola and Interstate, for which theypaid $175,400, an average of $87,700 per minute.
He's Your Dog Charlie Brown, a half-hour show broadcast in March,carried 3 minutes of advertising shared between Coca-Cola andInterstate Brands, for which they paid $140,600, an average of$46,866 per minute.
Charlie Brown's Christmas, a half-hour show broadcast in December,carried 3 minutes of advertising for which Coca-Cola paid $168,900,an average of $56,300 per minute.
Charlie Brown's All- Stars, a half-hour show, carried 3 minutes ofadvertising shared between Coca-Cola and Interstate Brands, forwhich they paid $112,000, an average of $37,333 per minute.
It's a Great Pumpkin, a half-hour show broadcast in October, carried3 minutes of advertising shared between Coca-Cola and InterstateBrands, for which they paid $175,400, an average of $87,700 perminute.
How Grinch Stole Christmas, a half-hour show broadcast in Decenber,carried 3 minutes of advertising - 1 minute each from Eastman-Kodak,Singer, and Swift, for which they paid a total of $243,000, anaverage of $81,000 a minute.
Frosty the Snowman, a half-hour show broadcast in December, carried3 minutes of advertising paid for by Pillsbury to gross $224,600 inadvertising revenue for CBS, an average of $75,200 per minute.
Dr. Seuss, a half-hour program broadcast in March, carried 3 minutesof advertising for which Nabisco paid $374,800, an average of $124,933per minute.
Cinderella, a lk hour show broadcast in April, carried 9 minutes ofadvertising to gross $349,200, an average of $38,800 per minute.Borden, Bristol-Myers, ITT, Miles Labs, Pillsbury, Proctor andGamble, and the RCA Corporation, all bought a minute.
Archie and His Pals, a half-hour show broadcast in March, carried3 minutes of advertising to gross $72,000, an average of $24,000per minute. liristol-Myers bought 2 minutes and Coca-Cola 1 minute.

- 23
Tales Washington Irving, broadcast in October, carried 8 minutesof advertising, for which General Mills paid $123,100, an averageof $15,387 per minute.
Christmas Carol, broadcast in November, carried 10 minutes ofadvertising paid for by General Mills, to gross $120,000, an averageof $12,000 per minute.
CBS Children's Film Festival, a show broadcast in March, carried 7minutes of advertising to gm!, $46,900, an average of $6,700 perminute. General Foods bought 3 minutes for $20,400, with GeneralMills, Keebler, Kellogg, and Health Tex each buying a minute.
CBS Children's Hour, broadcast in prime-time in November, carried6 minutes of advertising to gross $217,400, an average of $36,233per minute. Health Tex bought 2 minutes, with Campbell, KentuckyFried Chicken, Nestle, and Richardson-Merrell buying 1 minute each.
CBS Children's Hour, broadcast at various times throughout the season,carried a total of 28 minutes of advertising to gross $521,700, anaverage of $18,632 per minute. Reynolds Metals bought 8 minutes for$149,200, Health Tex bought 7 minutes for $13,800, Topper bought 4minutes for $77,400, General Foods bought 4 minutes for $69,700, andCampbell bought 2 minutes for $48,800.
Yankee at King Arthur's Court, shown in November, carried 14 minutesof advertising to gross $139,900, an average of $11,421 per minute.General Mills was the biggest backer, buying 10 minutes for $114,100.
Where's Huddles, broadcast in July, carried 3 minutes of advertising,for which Coca-Cola paid $62,000, an average of $20,666 per minute.
The specials listed above earned a total gross revenue of $3,376,100in 1970, and carried a total of 115 minutes of advertising, toaverage $29,357 per minute.
Altogether, including specials and Captain Kangaroo, CRS earned$43,420,700 from programs directed towards children in All ofthese programs carried a total of 6,230 minutes of advertising.

- 24 -
NBC Television Weekend Children's Shows: 1970.
Banana Splits grossed $1,927,500 in 9 months, selling 315 minutesof advertising, an average of $6,119 per minute. Splits is a one-
hour show. Biggest advertiser was Kellogg which spent $1,226,300on 201 minutes.
The Bugaloos grossed $784,600 in 4 months, selling 90 minutes ofadvertising, an average of $8,717 per minute. Biggest advertisers:Mattel - $202,400; Quaker - $138,700; Kellogg - $137,500.
The Flintstones grossed $678,600 in 9 months, selling 150 minutesof advertising, an average of $4,524 per minute. Biggest advertiserwas General Foods which spent $146,900 on 32 minutes.
Further Adventures of Dr. Doolittle grossed $838,500 in 4 months,selling 86 minutes of advertising, an average of $9,750 a minute.Biggest advertisers: Mattel - $294,200; Quaker - $154,700; Kellogg -$124,200.
H.R. Pufnstuf grossed $2,235,100 in 12 months, selling 294 minutesof advertising, an average of $7,602 per minute. Biggest advertisers:Kellogg - $791,700; Hasbro - $701,200; Topper - $167,200.
Heckle and Jeckle grossed $534,800 in 12 months, selling 190 minutesof advertising, an average of $2,814 per minute. Biggest advertisers:General Foods - $59,500; Miles Labs - $50,400; ITT - $44,200. This
,roadCast at 8 a.m.
Heckle and Jeckle grossed $619,100 in 9 months, selling 183 minutesof advertising, an average of $3,383 per minute. Biggest advertisers:Kellogg - $121,300; Quaker - $73,400. This show broadcast at 8:30 a.m.
Here Comes the Grump grossed $1,584,600 in 12 months, selling 279minutes of advertising, an average of $5,715 per minute. Biggestadvertiters: Mars - $294,600; Kellogg - $177,500; Bristol-Myers -$149,900; Miles Labs - $141,600.
Hot Dog grossed $410,400 in 4 months, selling 76 minutes ofadvertising, an average of $5,400 per minute. Biggest advertiser:Mattel - $210,600 for 39 minutes.
Jambo grossed $667,500 in 12 months, selling 168 minutes of advertising,an average of $3,973 per minute. Biggest advertiser: Mars - $166,800for 41 minutes.
NBC Children's Theatre grossed $254,300 from 3 one-hour shown inOctober, November, and December, selling 30 minutes of advertising,an average of $8,476 per minute. Biggest advertiser: Mattel, whichbought all 30 minutes for $254,300.
24

- 25 -
Pink Panther grossed $2,084,300 in 12 months, selling 296 minutesof advertising, an average of $7,041 per minute. Biggest advertisers:Kellogg - $376,500; American Home Products - $3E3,100; Quaker - $284,000;Mattel - $265,500; Mars - $226,000.
Tom Foolery Show grossed $658,900 in 4 months, selling 90 minutes ofadvertising, an average of $7,321 per minute. Biggest advertisers:Topper - $163,200; Kellogg - $115,300; Quaker - $94,200.
Underdog grossed $523,1900 in 9 months, selling 130 minutes ofadvertising, an average of $4,023 per minute.
Woody Woodpecker grossed $447,800 in 4 alonths, selling 93 minutesof advertising, an average of $4,815 per minute.
Together, all the programs listed above grossed $14,269,300 in 1970,with a total of 2,470 minutes of advertising, an average of $5,777per minute.

- 26 -
NBC Children's Specials broadest im 1970:
House on the Mayflow!r, a one-hour program, was shown in Novemberand carried 8 minutep of edveriisig for whic!1 Idi:al Toy paid$235,500, an average of $29,437 per minute.
The American Rainbow Series, a 6 one-hour programsover a period of6 months, carried 48 minutes of advertising for which Howard Johnsonpaid $570,400, an average of $11,883 per minute.
Coldilocks, a half-hour show, was shown twice - in March and inNovember. In March, Armstrong Cork naid $397,200 for 3 minutes ofadvertising, an average of $132,400 per minute. In November,Su" Maid pair $207,200 for 3 minutes of advertising, an average of$69,066 per minute.
Hans Brinker, shown in December, carried 12 minutes of advertisingduring the 1-hour program. This grossed $639,600, an average of$53,300 per minute. The show was sponsored by FloristsTransworld.
Hey, Hey, Hey Fat Albert, a half-hour program shown in April, grossed$76,800 for 3 minutes of advertising, an average of $25,600 parminute. Mattel was the sponsor.
Little Drummer Boy grossed $166,000 fnxm 3 minutes of advertising,an average of $55,333 per minute. The sponsor was American GasAssociation.
Pogo Birthday Special, broadcast in February, carried 3 minutes ofadvertising for $176,400, an average of $58,800 per minute. Proctorand Gamble was the sponsor.
Rudol h the Red Nose Reindeer, broadcast in December, carried 6minutes of advertising in a 1-hour show to gross $401,900, anaverage of $66,983 per minute. The sponsors were General Electric(3 minutes) and Ideal Toy (3 minutes).
Uncle Sam Magoo, a one-hour show broadcast in February, grossed$309,900 from 6 minutes of advertising, an average of $51,650 perminute. The sponsor was General Foods.
Winnie the Pooh Blustery Day, a half-hour show broadcast inNovember, grossed $344,400 from 3 minutes of advertising, anaverage of $114,800 per minute. The sponsor was Sears Roebuck.
Winnie the Pooh Honey Tree, a half-hour show,,carried 3 minutes ofadvertising and grossed $399,000, an average of $133,000 per minute.Sears Roebuck was the sponsor.
- 27 -
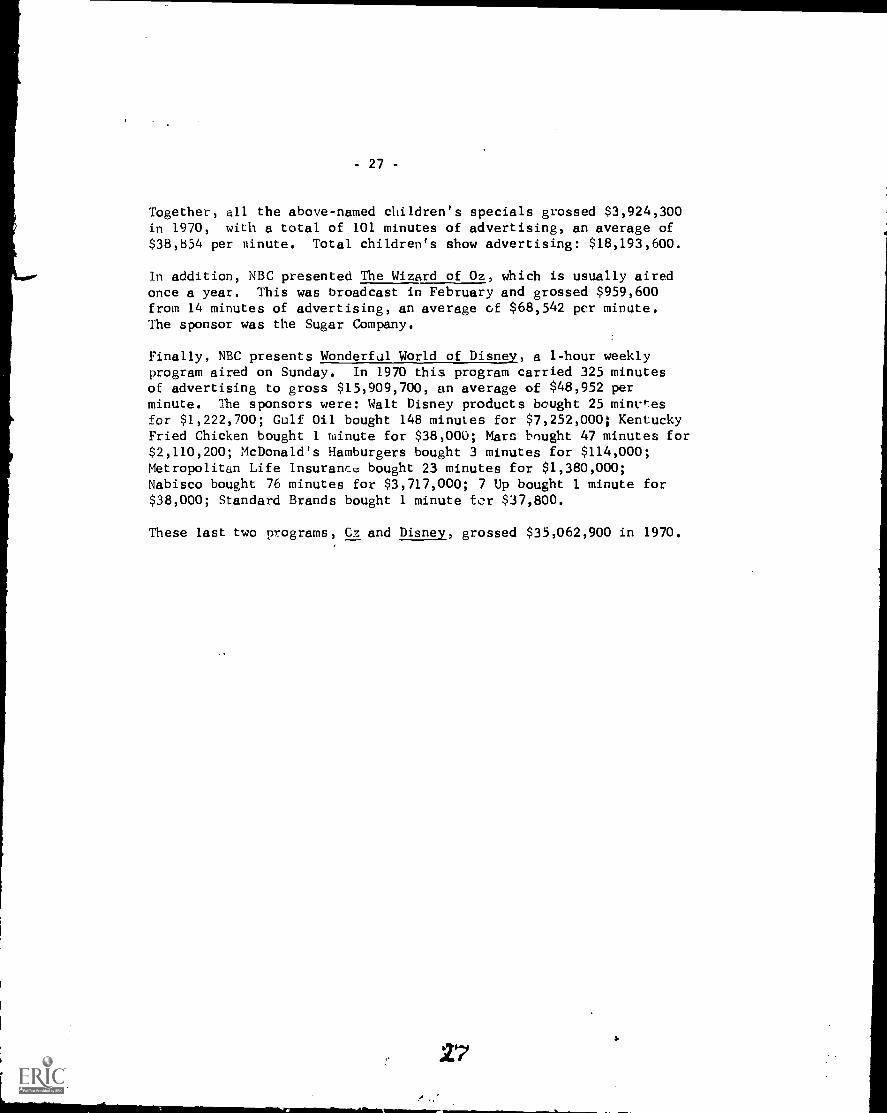
Together, all the above-named children's specials grossed $3,924,300in 1970, with a total of 101 minutes of advertising, an average of$38,854 per ninute. Total children's show advertising: $18,193,600.
In addition, NBC presented The Wizard of Oz, which is usually airedonce a year. This was broadcast in February and grossed $959,600from 14 minutes of advertising, an average of $68,542 per minute.The sponsor was the Sugar Company.
Finally, NBC presents Wonderful World of Disney, a 1-hour weeklyprogram aired on Sunday. In 1970 this program carried 325 minutesof advertising to gross $15,909,700, an average of $48,952 perminute. The sponsors were: Walt Disney products bought 25 mint.tesfor $1,222,700; Gulf Oil bought 148 minutes for $7,252,000; KentuckyFried Chicken bought 1 minute for $38,000; Mars bought 47 minutes for$2,110,200; McDonald's Hamburgers bought 3 minutes for $114,000;Metropolitan Life Insurance bought 23 minutes for $1,380,000;Nabisco bought 76 minutes for $3,717,000; 7 Up bought 1 minute for$38,000; Standard Brands bought 1 minute for $37,800.
These last two programs, Cz and Disney, grossed $35,062,900 in 1970.
27

- 28 -
The BAR figures outlined above are probably overstated by up to
7 percent, but they are generally accepted as being "reason-
ably accurate" I:, Lhc 3 nolwo,ks. The breakdown
figures do not tally exactly with the total figures supplied by
Broadcast Advertisers Reports because only those children's
specials aired at weekends would be included in the weekend totals
for network children's television. In addition, it should be
stressed that some children's specials are advertiser-owned in which
case the advertiser pays the network a flat fee for networking the
special and the advertiser can sell time in that program to other
advertisers. However, the revenue earned by the network presenting
the program probably results in the same amount of profit since a
pre-packaged special with proved appeal is usually willingly
accepted for networking.
Looking at the above advertising figures for the 3 networks by
categories results in the following breakdown:
CHILDREN'S PGM CATEGORY ABC TV NET. CBS TV NET. NBC TV NET.
Reg. scheduled weekendprogramming $18,974,800 $33,452,800 $14,269,300
Specials, incl.weekends 3,054,500 3,376,100 3,924,300
Reg. scheduledweekdayprogramming 6,591,800(Capt. Kangaroo)
Other programs 4,673,300 16,869,300with childinterest
(Cousteau/
3M specials)(Disney/Oz)
TOTALS $26,702,600 $43,420,700 $35,062,900
- 29 -
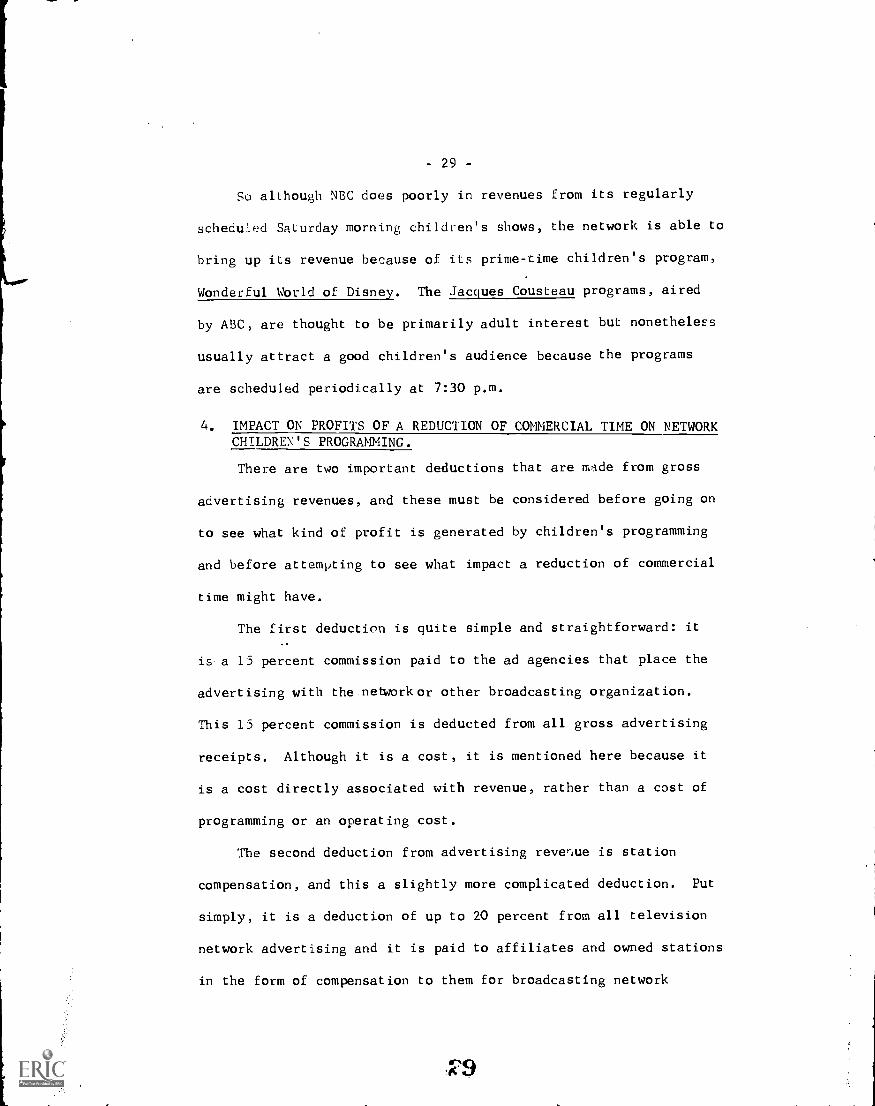
So although NBC does poorly in revenues from its regularly
scheduled Saturday morning children's shows, the network is able to
bring up its revenue because of its prime-time children's program,
Wonderful World of Disney. The Jacques Cousteau programs, aired
by ABC, are thought to be primarily adult interest but nonetheless
usually attract a good children's audience because the programs
are scheduled periodically at 7:30 p.m.
4. IMPACT ON PROFITS OF A REDUCTION OF COMMERCIAL TIME ON NETWORKCHILDREN'S PROGRAMMING.
There are two important deductions that are made from gross
advertising revenues, and these must be considered before going on
to see what kind of profit is generated by children's programming
and before attempting to see what impact a reduction of commercial
time might have.
The first deduction is quite simple and straightforward: it
is a 15 percent commission paid to the ad agencies that place the
advertising with the network or other broadcasting organization.
This 15 percent commission is deducted from all gross advertising
receipts. Although it is a cost, it is mentioned here because it
is a cost directly associated with revenue, rather than a cost of
programming or an operating cost.
The second deduction from advertising revenue is station
compensation, and this a slightly more complicated deduction. Put
simply, it is a deduction of up to 20 percent from all television
network advertising and it is paid to affiliates and owned stations
in the form of compensation to them for broadcasting network
.W9

- 30 -
programs and network advertising.
A special station compensation formula is used to compute the
payments made to affiliates, including the owned stations, for each
hour of network programming the stations clear. The hours are
weighted in proportion to approximate audience levels at different
time periods:
Name Hours Days Weighting
A-Hour 6-11 p.m. Mon-Sun 100 percent
C-Hour 5-6 p.m. Mon-Fri) 50 percent4-6 p.m. Sat-Sun)
E-Hour 10 a.m.-5 p.m. Mon-Fri) 35 percent8 a.m.-1 p.m. Sat-Sun)
NB: Special compensation arrangements are made for time periodsnot listed above.
After a month of programming network material has passed, the
number of hours of each type is added up, multiplied by its weighting
factor and converted to what are known as "equivalent A-Hours." The
amount paid to a particular station in compensation depends upon the
multiplication of these equivalent A-Hours by a factor which is
approximately one-third the A-Hour rate. The A-Hour rate is a price
per hour established by the network for each affiliate. The price
approximates to the rate the station could get if the station were
selling the air-time locally. This rate depends upon the prime-time
audience the local station has managed to obtain. If the station
were selling the air-time locally, however, the station would incur
program and selling costs. To reflect the reduced costs and risks,
affiliates and owned stations are compensated at one-third
of their A-Hour rate. The rates are published annually by the net-
works in their rate guides. For the 1970-71 season, the NBC Television
";13(7)

- 31 -
Network Rate Guide listed WNI3C -TV in New York City, a wholly owned
station, as having an A-Hour rate of $10,000, while WBZ-TV in Boston
was assessed at $3,450, WFBM-TV in Indianapolis was $1,625, and
KMOT-TV in Minot, North Dakota, was $125. The total for all 217
NBC affiliates was nearly $166,000.
Supposing that an affiliate's A-Hour rate is $1,500, and it
clears the following hours in a given month:
Name Cleared Factor Equivalent A-Hours
A-Hours 80 100 % 80C-Hours 10 50 7 5
E-Hours 100 35 % 35
TOTAL : 120 A-Hours Cleared
Station compensation is then worked out according to the following
formula:
Equivalent A-Hours Cleared X A-Hour Rate X 1/3 = Total Compensation.
This becomes :
120 x $1,500 x 1 = $60,000 a month, or more simply:3
120 x $500 = $60,000.
Because the television network pays AT&T for inter-connection
and feeding the program by lines to the affiliates transmitter, most
affiliates agree to forego the first 24 A-Hours of compensation.
If the affiliate provides its own inter-connection and line
facilities, it is fully compensated. Continuing with the above
example, the affiliate, assuming that it was fed by AT&T land line
paid for by the network, would be assessed at $12,000 a month for
this service and would receive $48,000 in compensation for trans-
mitting the network's programs and advertisements. Beginning in 1970,
31
- 32 -
however, the affiliates receiving signals from AT&T had a further
6.5 percent subtracted 'rum the!r total compensation to help the
networks offset increased AT&T line costs.
So the basic station compensation formula and the one used
for the owned stations is:
93.5 percent of Equivalent A-Hours - 24 A-Hours x A-Hour Rate x 1
ARC, rather than complicate the compensation formula, decidedto reduce the affiliates hourly rates rather than deduct ele6.5 percent land lines price increase from the station compen-sation formula.
Station compensation and clearances are the twin examples of
the intangible nature of a network. A network exists as a result
of its contracts with its owned stations and affiliatq. Without the
affiliates and without network program clearances, there is no network.
Withoi, affiliate clearances, programs cannot attain large audiences.
Without large audiences, network programs cannot be sold.
For the purposes of the computations that follow, and for the
of simplicity, station compensation for network children's
progrrs.ms will be assessed at 10 percent of gross revenues. This
is probably somewhat high, but it brings total deductions from gross
advertising receipts to 25 percent--15 percent agency commission and
10 percent station compensation--and makes things easier to under-
stand. However, fully 20 percent of the total amount paid in
station compensation goes to the 5 owned stations that belong to
the broadcast groups of the 3 networks, so a fifth of the compensa-
tion money stays within the family.
32

- 33 -
Profit contributions of children's television programs
The reason for having a maximum of 16 minutes per hour (12 minutes
for the networks and 4 minutes for affiliate sold commercials, station
ID's and billboards, with 8 commercial interruptions in each hour) of
non-program material in children's television is because it has not
hitherto been treated as a separate programming segment, but has
been lumped together with daytime television. Historically, daytime
television has had much more advertising per hour than prime-time
television. Generally speaking, however, few children's programs
carry the maximum number of advertising minutes throughout the year.
The familiar pattern that has developed is that the programs tend to
be fully booked by advertisers during the fourth quarter--October
through December--and 80 percent booked for the rest of the year.
Public service announcements and/or promotional material usually
fill unsold commercial minutes.
Bearing all of this in mind, the profit effects of a number
of well known children's programs will be examined:
Captain Kangaroo, a one-hour program presented by CBS TV network
from 8-9 a.m. Monday through Friday, grossed $6,591,800 in 1970 from
a total of 2,010 minutes of advertising. Thus the average price
per minute was $3,279, and the average number of network advertis-
ing minutes per show was 8--considerably fewer than the 12 network
minutes that will be allowed starting January, 1973. In addition, the
show carried local commercials sold by the affiliates carrrying the
show. The weekly show budget for Captain Kangaroo in 1970 was
$75,000, or $3,900,000 for the year. The profit contribution of
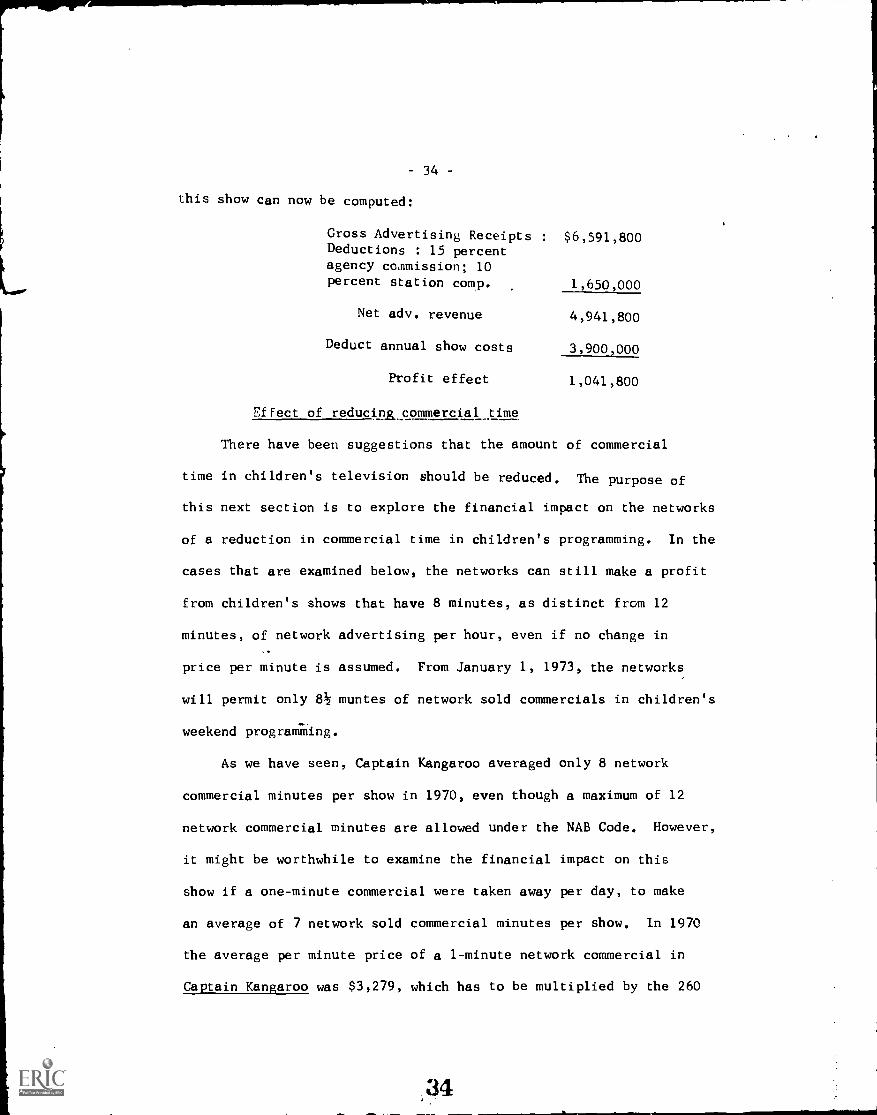
- 34 -
this show can now be computed:
Gross Advertising Receipts:
Deductions : 15 percentagency commission; 10percent station comp.
$6,591,800
1,650,000
Net adv. revenue 4,941,800
Deduct annual show costs 3,900,000
Profit effect 1,041,800
Effect of reduciag commercial time
There have been suggestions that the amount of commercial
time in children's television should be reduced. The purpose of
this next section is to explore the financial impact on the networks
of a reduction in commercial time in children's programming. In the
cases that are examined below, the networks can still make a profit
from children's shows that have 8 minutes, as distinct from 12
minutes, of network advertising per hour, even if no change in
price per minute is assumed. From January 1, 1973, the networks
will permit only 8k muntes of network sold commercials in children's
weekend programling.
As we have seen, Captain Kangaroo averaged only 8 network
commercial minutes per show in 1970, even though a maximum of 12
network commercial minutes are allowed under the NAB Code. However,
it might be worthwhile to examine the financial impact on this
show if a one-minute commercial were taken away per day, to make
an average of 7 network sold commercial minutes per show. In 1970
the average per minute price of a 1-minute network commercial in
Captain Kangaroo was $3,279, which has to be multiplied by the 260
34

- 35 -
weekday programs in the year, to give a total of $852,540. We can
now measure the financial impact of this situation as follows:
Gross advertising receipts in 1970 : $6,591,800Less cost of 1-minute commercialper day for 260 days 852,540
$5,739,260
Deductions: 15 percent agencyCommission: 10 percent stationcompensation 12434,814
Net advertising revenue $4,304,445
Deduct annual show costs 3,900,000
Profit effect $ 404,445
If two minutes of advertising were taken away from the program
and making the same assumption about price, theoretically Captain
Kangaroo would go into a loss position.
However, the assumption that advertising prices would remain
the same if the number of advertising minutes were reduced is
probably an unrealistic assumption. It is much more likely that
there would be some upward movement in price since advertisers
would be willing to pay more for greater relative exposure due
to a reduction of advertising clutter. It is assumed that clutter
reduces advertising prices, so less clutter should increase prices.
CBS has threatened to terminate production on Captain Kangaroo
more than once because of claims that the show was losing money.

- 36 -
The show certainly made money in 1970 and probably made money in
1971 because of its reputation,among advertisers, asa "quality"Fmogram for
young children. Captain Kangaroo was probably put into its particular
time-slot by CBS because of NBC's leadership in the ratings at that
time of day with its long running news magazine program, The Today
Show. Consequently CBS programmed alternative viewing for the pre-
schoolers, a group that is normally ignored I)), the commercial network
on weekdays. Even so, if CBS programmed a re-run of a show like
Lucy in the 8 to 9 a.m. slot, the network would probably make a far
higher profit contribution than it does from Captain Kangaroo.
A number of popular cartoon programs from all 3 networks, will
now be examined:
Hot Wheels, a half-hour Saturday morning cartoon on ABC,
grossed $1,697,600 in 1970 from 265 minutes of advertising. The
aver ,e price per minute was $6,406, and there were an average of
5 network commercial minutes per show.
The profit contribution of this cartoon show can be computed
as follows:
Gross adv. receipts : $1,697,600Less 25 percentdeductions 424,500
Net adv. revenue 1,273,100
Deduct ann. showcosts (11,000 x 52) 572,000
Profit effect 701,100
The contribution to ABC profits of this show in 1970 was
$701,100. Consequently there is room to give up 1-minute of

37 -
advertising per half-hour, even if the average price per minute
remains the same:
Gross advertising receipts in 1970 : $1,697,600
Minus cost of reduction in commer-cial time assuming price perminute remains the same($6,406 x 52)
Deductions: 15 percent agencyCommission: 10 percent stationcompensation
Net advertising revenueDeduct annual show costs
Profit effect
333,112
$1,364,488
341,122
$1,023,366572,000
$ 451,366
CBS, as we shill see later, has traditionally been the winner
of the contest to attract vast numbers of child viewers on Saturday
morning and much of its 1970 schedule for children remains intact in
the current season. One of the favorites, Scooby Doo Where Are You?
attracted gross advertising revenue of $3,200,500 in 1970 from a
total of 307 minutes of advertising. The average price per minute
of commercial in this half-hour cartoon cost $10,425 in 1970, and
the show carried an average of almost 6 minutes of network commercials
.,:or each screening:
Gross advertising receipts : $3,200,500Less duductions of 25% 800,125
Net advertising revenue 2,400,375
Less annual show costs 572,000
($11,000 x 52)
Annual profit contribution : 1,838,375

- 38 -
If two minutes of commercials were deducted for every week
during the year, and assuming no change in average price per minute,
the profit contribution of the show would he as follows:
Gross advertising receipts in 1970 : $3,200,500Minus cost of reduction in commer-cial 2 minutes per week for 52weeks ($10,425 x 52) 1 084 200
$2,116,300
Deductions: 15 percent agencyCommission: 10 percent stationcompensation 529,075
Net advertising revenue $1,587,225Deduct annual show costs 572,000
Profit effect $1,015,225
NBC has done poorly in the weekend children's television
ratings in recent years. One cf the network's most profitable
shows in 1970 was H.R. Pufnstuf, a half-hour cartoon that grossed
$2,235,100 from 294 minutes of advertising. The average price per
minute was $9,750, and the network carried an average of 51/2 minutes of
advertising per show:
Gross adv. receipts : $2,235,10CLess deductions of 25% 558,775
Net advertising revenue 1,676,325
Less annual show costs 572,000($11,000 x 52)
Annual profit contribution 1,104,325

- 39 -
If one-and-a-half minutes of advertising were deducted for
every week during the year--in order to bring the amount of
advertising down to 4 minutes per half-hour--and assuming no
change in average price per minute, the profit contribution of the
show would be as follows:
Gross advertising receipts in 1970 : $2,235,100Deduct lk minutes per week for52 weeks--$14,625 x 52 760,500
1,474,600Deductions of 25 percent 368,650
Net advertising revenue 1,105,950Less annual show costs 572,950
Profit effect. 533,000
American Bandstand, presented by ABC, is a 1-hour or half-hour
pop record show hosted and produced by Dick Clark. ABC has a contract
with Dick Clark to buy 10 half-hour shows (when the program has to
be cut short due to the Saturday afternoon football games), and 36
one-hour programs at a current cost of $17,000 per hour. Thus the
total cost of the program for the season is $697,000. In 1970 the

-
program grossed $2,841,800 from 464 minutes of advertising. The
average price per minute was $6.124, and there were an average of
just ov r 11 minutes of network commercial time per hour:
Gross advertising receipts : $2,841,800Less deductions of 25Z 710,450
Net advertising revenue. 2,131,350
Less annual show costs 697,000(41 x $17,000)
Profit effect 1,434,350
Assuming no change in average price per minute, this would
be the impact on profit of a 3 minute reduction of commercials:
Gross advertising receipts in 1970 : $2,841,800Deduct 3 minutes per hour for41 hours ($6,124 x 3 x 41) 753,252
Deductions of 25 percent (stationcompensation and ad agency com-mission
Net advertising revenueLess annual show costs
2,088,548
522,137
1,566,411697,000
Profit effect 869,411
It might be interesting to look at the profit effect of the
only regularly scheduled prime-time program aimed directly at children.
Wonderful World of Disney, presented by NBC from 7:30 to 8:30 p.m. on
Sunday. NBC buys 48 hours of programming from Disney, 20 originals at
$250,000 each, and 28 re-runs at between $30,000 and $40,000 each.
The total contract, therefore, is in the region of $6,120,000 for the
year. In 1970 Wonderful World of Disney grossed 015,909,700 in
revnue from 325 minutes of commercials. The average price per
minute was $48,952 and the program carried an average of 6 minutes
of advertising--in prime time the networks usually carry 6 minutes of
40

- 41 -
networr advertising per hour, or 7 minutes it
triout]on of this program in 1970 was:
J:ies. The profit con-
Gross advertising receipts $15,909,700*Less deduct:mns of 339 5,303,233
Net advertising revenue 10,606,467
Less annual show costs 6,120,000
Profit effect 4,484,467
*Higher deductions because the program is in prime-time when stationcompensation :rxreases.
While it is generally agreed that the networks can make money
on cartoon shows, which have a broad appeal among 2 to 12 year olds,
the networks fear that they might lose money if they attempt to
diversify programming or attempt to program for a specific age
group, say the 6 to 9 year old, or the 12 to 14 year olds. This
clearly relates to the point made earlier that ratings determine
revenues, and it might be helpful to take a look at the latest
census data dealing wit:, the number of television households and
the number e: children under 12 in such households:
Total U.S.
Household Size1-2
3-4
5 or more
Presence ofNon-AdultNoneunder 18Any under 18Any under 12Any under 6Any aged 6-11Any aged 12-17
Estimates of U.S....Households
TV Households
September 1, 1971
Total Households TV Households000's % 000's % in % of Total
Households
64,850 100 62,100 100 96
28,090 45
20,870 34
13,14C 21
32,260 52
29,840 48
22,990 37
14,530 23
15,320 25
15,400 25
'41

- 42 -
The economics of network television tend to lead a network
into a programming policy of trying Lu attract the maximum number
of people to as much of the programming as possible. Naturally
there are certain exceptions like news and public affairs which the
networks and the licensees feel that they must program in order to
fulfill their public interest obligations. The table above shows
that there is a child under 6 in 1 in 4 television households which
means that if a network decides to program for pre-school ers the
audience is fragmented. One in 3 television households have one or
more children under the age of 12, so far from being a desirable
audience commercially the children tend to get their programs on
Saturday and Sunday mornings, when adults don't want to watch anyway,
with some all-family shows in the early evening, when parents will
usually allow their children to watch for awhile before going to bed.
By programming for all the family, a network hopes to keep the
parents as viewers once the children have gone to bed.
Because children are not regarded as consumers in the fu:.
sense of the term--that is having the financial power to buy a ,ooc.
that is advertised, many leading companies prefer not to advertise
to children at all. Those that do advertise do so in the belief
that the child has some influence over the buying habits of his or
her parents. Because children are not regarded as full consumers,
advertising space in children's television is sold cheaply--from
$1.25 to $2 per thousand homes, against a price of $3.50 to $4.50 per
thousand in prime-time television, and up to $7 for a national
football game.
42

- G3 -
All of these factors militate against diversified programming
for children and the result has been the weekend diet of cartoon
material
The Ratings
A glance at some of this season's program ratings for network
children's shows will tell us what programs children are watching:

8:00 AM
8:30 AM
9:00 AM
9:30 AM
10:00 AM
10:30 AM
11:00 AM
11:30 AM
12:00 PM
12:30 PM
1:00 PM
1:30 PM
NBC
- 46 -
FALL 1971 THREE NETWORK SATURDAY DAYTIME SCHEDULE
CBS AEC
DR. DOOLITTLE
RATING: 1.8 SHARE: 24
BUGS BUNNY 1
RATING: 4.4 SHARE: 46
JERRY LEWIS
RATING: 1.6 SHARE: 21
WOODY WOODPECKER
RATING: 2.1 SHARE: 7
SCOOBY DUO
RATING: 8.0 SHARE: 55
ROAD RUNNER
RATING: 3.2 SHARE
DEPUTY DAWG GLOBETROTTERS
RATING: 3.6 SHARE: 19 RATING: 8.6 SHARE:43
FUNKY PHANTOM
RATING: 6.1 SHARE: 32
PINK PANTHER HELP!
RATING: 6.3 SHARE: 26 RATING: 9.0 SHARE: 37
JACKSON 5
'.TING: 8.2 SHARE: 34
BARRIER REEF PEBBLES AND BAM BAM BEWITCHED
RATING: 4 0 SHARE* tA .1. t 1 .1
TAKE A GIANTSTEP
RATING: 2_1 SHARE: 9
ARCHIE LIDSVILLE
RATING: 13.4 SHARE:490ATING: 9.1 SHARE:
SABRINA
RATING: 14 SHARE: 51
r.
CURIOSITY SHOP
THE BUGALOOS JOSIE
RATING: 4.0 SHARE: 16 ING: 11.2 SI-lAP :1 . .l:
MR. WIZARD
RATING: 3.4 SHARE: 14
MONKEES
RATING: 10.8 SHARE:4
JONNY QUEST
RATING: 5.7 SHARE:A
THE JETSONS
TING: 6.3 SHARE: 24
YOU ARE THERE
RATING: 6.3 SHARE:24,,
LANCELOT LINK,SECRET CHIMP HOUR
RATING: 5.3 SHARE:22
LOCAL TIME CBS CHILDREN'SFILM FESTIVAL
RATING: 5.7 SHARE:21
3.
44SOURCE: Nielsen

- 45 -
For the fourth quarter of 1971, the following viewing pattern
emerged:
NBC
10:00 a.m. Barrier ReefAv. Share : 14
10:30 a.m. Take a GiantStep
Av. Share : 12
11:00 a.m.
CBS
Pebbles and Bam BamAv. Share : 35
Archie's TV FunniesAv. Share : 47
Sabrina The TeenageWitch
Av. Share : 54
11:30 a.m. The Bugaloos Josie and theAv. Share : 13 Pussycats
Av. Share : 47
12:00 p.m. Mr. WizardAv. Share : 15
12:30 p.m. The JetsonsAv. Share : 23
1:00 p.m. Local Time
The MonkeesAv. Share : 40
You Are ThereAv. Share : 28
CBS Children'sFilm FestivalAv. Share : 28
ABC
BewitchedAv. Share : 36
LidsvilleAv. Share : 32
CuriosityShop
Av. Share : 24
Jonny QuestAv. Share : 24
Lancelot Link,Secret Chimp HourAv. Share : 22
AmericanBandstand
Av. Share : 27
Source : Nielsen Seasonal Average Shares/Nielsen Nationals.

- 46 -
Two of the networks, ABC and CBS, program for children on
Sunday mornings, but not competitively:
SUNDAY DAYTIME/NIELSEN NATIONAL, 9/12/71 through 10/10/71.
Time Program(5-week
Rating
ABC
Homes
CBS
(5-week average)Rating Share Homes
average)Share
(000) (000)
9:00 a.m. Tom and 3.8 29 2,360Gerry
9:30 a.m. Sabrinaand the
4.8 26 2,980
Coolies10:00 a.m. Red 5.0 27 3,110
Dragon
10!30 a.m. Double-deckers
5.9 29 3,660
11:00 a.m. Bullwinkle 5.7 27 3,540
11:30 a.m. Make a 5.8 27 3,600Wish
The tables above are a good indication of what children have been
watching. One rating point equals 600,000 homes, so if a network
gets a rating of 10.00 that translates to 6 million homes tuned in
to that particular program. If the program is being sold at $2 per
thousand homes the advertising rate for a 1 minute commercial would
be $12,000. The share the percentage of the homes where the
television is turned on that are tuned in to your particular net-
work. Therefore if you have a share of 55 it means that 55 percent
of the homes with a set in use at that particular time are tuned in
to your program.

- 47 -
We can see from the ratings tables that the live programs
introduced this season in order to diversify the regular children's
television diet of cartoons, namely Take a Giant Step on NBC and
Curiosity Shop on ABC, fare badly against the cartoon competition
of Archie, Sabrina, and Josie on CBS, which become the most popular
programs for children along with Pebbles and Bam Bam, another CBS
offering. When CBS moves to live or diversified (some would say
"quality") programming at 12:30 p.m. with You Are There and CBS
Children's Film Festival, both shares and ratings fall dramatically.
This viewing trend has led to the belief by some network executives
that children's television suffers from Gresham's Law, i.e. that
bad programming drives out good programming. However, it is
possible to argue that Curiosity Shop, with 3.6 million homes tuned
in, and You Are There, with an even higher rating, have proved to
be successful diversified and age specific programs, but some have
not.
Some unprofitable diversified children's programming.
We can now take a took at how some of the diversified
programming fared financially on one of the networks, NBC, which
claims to be the first television network to attempt diversifica-
tion in its children's schedule.
Hot Dos, a half-hour live - action and animated show presented
for children on the NBC Television Network in the 1970-71, was an
informational type program which asked and answered the questions
why or how. For example, the program asked and answered such
questions as how toothpaste got into tubes, and why a lead pencil
47

- 48 -
writes. The.show featured such celebrities as Woody Allen, and
a number of the Laugh-In cast; it won critical acclaim and was
awarded a Peabody. However, the show was a disaster financially
and never attracted sufficient viewers to attract significant
advertiser support. As a result, NBC sustained a loss of
$431,000 on this program for the season:
HOT DOG
1970 - 1971 SEASON
QUARTER PLAYS 7 SOLD (LOSS)(000)
1970 FALL START 3 100 (9)
1970 4TH QTR 10 97 (25).
1971 1ST QTR 11 40 (158)
1971 2ND QTR 13 58 (160)
1971 SUMMER 9 75 (79)
TOTAL SEASON 46 68 $(431)
Total Program Cost For The Series $697,000.
The per minute advertising rate for Hot Dog was between $5,400
and $5,900 in the fall of 1970, between $4,200 and $4,700 during the
winter (first quarter of 1971), down to between $3,200 and $4,200 in
the spring, and sinking to between $2,600 and $3,200 for the summer.
The program never got more than a 26 percent share of the audience
and sank as low as 10; its average share was around 18 to 20.
Anything significantly below a 30 percent share usually loses money
when the advertisers begin to switch their buying into the more
48

- 149 -
popular programs.
This season's disaster on NBC seems to be Take a Giant Step,
and network executives estimate that the show will lose $635,000
by the time the 1971-72 season ends:
TAKE A GIANT STEP
1971-72
QUARTER PLAYS % SOLD (LOSS)
(000)
1971 - FALL START 3 68 9
1971 - 4TH QTR 12 86 77
1972 - 1ST QTR 9 60 (250)
1972 - 2ND QTR 11 80 (337)
1972 - SUMMER 5 78 (134)
TOTAL SEASON 40 76 $(635)
Total Program Cost For the Series: Originals $1,070,000Repeats 10,000
$1,080,000
In addition to the series program cost, the network spent $69,000in development costs.
49

- 50 -
In addition to these losses, NBC has been losing money in
recent years on its Saturday morning children's specials:
NBC CHILDREN'S SPECIALS
1969-70Program
Plays Costs Profit/(Loss)
CHRISTOPER DISCOVERSAMERICA
CHILDREN'S FESTIVAL
(000) (000)
AT LINCOLN CENTER 1
THE BOSTON SPY PARTY 1
HOT DOG 1
THE INSIDE WORLD OFOUTER SPACE 1
WILDERNESS ROAD 1
A KID'S EYE VIEW OFWASHINGTON 1
TOTAL 7 $525 $(413)
1970-71
FOR THE LOVE OF FRED 2
THE WONDERFUL WORLD OFJONATHAN WINTERS 2
PETS ALLOWED 1
RAPPING WITH BRINKLEY 1
SUPER PLASTIC ELASTICGOGGLES 1
CIRCUSTOWN 1
A DAY WITH BILL COSBY 2
THE SOUNDS OF CHILDREN
TOTAL 11 $584 $(63)
50

At Zirst glance these losses sound horrendous, anc should
perhaps be placed in some kind of broader context. Diversified and
age specific programs are not always financial disasters, as can be
seen from the ratings of such programs as Curiosity Shop, You Are
There, and CBS Children's Film Festival. Also, if age specific and
diversified programs are placed into the cartoon programming
schedule for children, then it is possible to carry some programming
that breaks even, or loses money, because most cartoons make a high
return on investment. In addition, there has been no long-term
commitment so far to diversified and age specific programming by any
of the commercial networks. Many programs take some time to win
public acceptance, and other programs die because of the strong
cartoon competition placed against them at a particular time period.
All of these factors should be considered before reaching easy and
general conclusions about the costs of age specific and diversified
programs.
This problem of the economics of age specific and diversified
programming for children will be examined again in the section of the
report dealing with the economic implications of the ACT petition.
A new program for pre-schoolers
Beginning in February, 1972, NBC introduced a new half-hour
program for pre-schoolers entitled Watch Your Child/The Me Too Show,
to be shown Monday through Friday. Gross costs for the first 29
51

weeks of programs come to $1,152,500, broken ddwn as follows:
Original run--20 weeks at $2,000 a week = $1,040,000Repeat run--9 weeks at $12,500 a week 112,500
Total cost 1,152,500
This new project is being organized as a special service to
the NBC Television Network, and each program will be fed on network
lines at 1 p.m. to 1:30 p.m. in order that each station can tape
the program for local broadcast at a suitable time. NBC is under-
writing the costs of production and is also taking on the job of
distributing the programs nationally to owned stations and all
affiliates (assuming that they agree to take the program). Each
of the NBC owned stations is committed to take the program, but
affiliate response has been slow--by Friday, February 11, 1972,
just 3 days before the first airing of the show, only 19 stations
had agreed to program it : Five NBC Owned Stations, WNBC, New York;
WMAQ, Chicago; KNBC, Los Angeles; WRC, Washington, D.C.; WKYC,
Cleveland; and 14 affiliates in Hartford, Connecticut; Philadelphia;
Pittsburgh; Providence, Rhode Island; Wheeling, West Virginia; Fort
Wayne, Indiana; Lexington, Kentucky; Jackson, Michigan; Clarksburg,
West Virginia; North Platte, Nebraska; Parkersburg, Virginia; Paducah,
Kentucky; Tucson, Arizona; Fort Worth, Texas. Unfortunately, this
program seems doomed since it is not offered during network time.
The fee for this children's program is 30 percent of the
station's network hourly rate for two-and-a-half hours of programming
a week, which is thought to be modest. If hale. the network affiliates
agree to carry the program--about 100 stations-- then the network will
cover its costs. If not, NBC will lose, and the amount will
52

- 53 -depend on the degree of acceptance. The network will not sell com-mercials in the show, but the affiliates can sell 4 minutes of
commeccials--2 at the beginning of the program and 2 at the end.
Profits from children's programming.
Having gone into some depth in this section to explain the
possible profits and possible losses to networks in the area of
children's programming, it might be useful to sum up by discussing,
in very general terms, the overall profits made by the networks in
1970 in the area of children's programming, and to attempt to
assess the overall impact of a reduction of commercial time in
such programming.
The only network to make a filing on the amount spent on
children's programming in a given season was ABC. This network,
in its filing on the ACT petition, claimed that it would spend
$7 million ,n weekend children's programming in the 1971-72
season. Because BAR provides the estimated gross revenue of
weekend children's television shows, it is possible to generate
the overall profit effect of children's programming on ABC, a
company that has lost money on its network operations for the last
10 years, although it has been profitable on its overall broadcast
operations because of the highly profitable 5 owned and operated
television stations. Excluding children's specials, ABC's gross
revenues from children's weekend programming in 1970 amounted to
$18,974,800. After agency commission and station compensation,
the net revenues came to an estimated $14,231,100. If program
exe, ses in that year are taken at ABC's admitted current level of
$7 million, tlien the network made a profit contribution of
53

s4 -
$7,231,100 in 1970.
However, when these figures were put to ABC business affairs
executives, they said that they did not include the program costs
for American Bandstand and Make a Wish in the filing to the FCC,
but even with these included a considerable profit was still made
by ABC from weekend children's programming in 1970, even though the
network as a whole lost money. ABC executives did, incidentally,
admit that the network made a profit on children's programming.
In 1970 ABC carried 3,411 minutes of advertising at an
average price of $5,562 per minute. If this commercial content
were reduced by one-quarter, or 852 minutes, and assuming no change
in the price per minute of commercial time, the gross advertising
reduction to ABC would amount to $4,738,824, or a net reduction of
$3,554,118 (making allowances for station compensation and advertising
agency commission), leaving the network with a profit contribution
in the region of $3.5 million.
Making an estimate of CBS's weekend programming costs for
children should not be difficult since it is oossible to use ABC's
costs as a guideline. Because CBS claims to use more expensive
animation techniques than ABC, an estimate of between $8 million and
$8,500,000 might be what CBS pays for its weekend programming for
children. Again this excludes specials and it also excludes
Captain Kangaroo, which has been examined separately. In 1970,
CBS grossed $33,452,800 from 4,105 minutes of advertising, an
average price of $8,149 per minute. After deductions, CBS netted

- 55-
$25,089,600. When program expenses are taken away from this figure,
the network is left with a handsome profit contribution of over
$16.5 million--perhaps a Lat higher rate of profit than the network
makes on other types of programming.
Again assuming a 25 percent reductionin commercial content,
and further assuming no change in average price, CBS would lose
1,026 minutes of advertising for a grdisR reduction of $8,360,874,
which would result in a net reduction of $6,270,656. But this
would not impair the network's overall profitability in the area
of children's programming because CBS would be left with an overall
profit contribution of $10 million.
NBC's weekend r...ildren's programming probably
costsaround $7,000,000 but NBC's gross advertising revenues, again
excluding specials, amounted to $14,269,300. After deduction for
agency commission and station compensation, estimated net advertising
revenues of $10,701,975 remained. Consequently, a profit effect of
just over $3.7million was returned by NBC's weekend children's
programming in 1970, but after administrative expenses the overall
profit was probably very small. NBC executives admitted that the
network made a small profit from children's programming in 1970,
but claim that profits have fallen since because of losses with
programs like Hot Dog and Take a Giant taa, and some of the
Saturday morning children's specials. In 1970, NBC's average minute
on Saturday morning cost $5,777, and the network carried a total
of 2,470 minutes of advertising. If this were reduced by a quarter,
the network would lose a total of 617 minutes of advertising at a

- 56 -
gross cost to the network of $3,564,409, or $2,673,307 after deductions.
So NBC's profit would be reduced to $1 million, assuming that price per
commercial minute remained the same and there was no change in its rela-
tive competitive position. With admini3tretive costs 1!*.e network would
Odrely Oresic even.
Throughout the computations above, an unrealistic assumption
has been made--that is, that price per minute would remain the same
if the amount of commercial content in children's programming
were reduced. As we have seen, relatively few advertisers account
for most of the advertising revenue derived from children's
programming, and these advertisers have a fairly inelasticthat
is a reasonably fixed--demand for the available commercial positions
in children's programming. For example, the top 3 advertisers- -
Kellogg, Mattel, and General Mills--account for 30 percent of the
total revenue; the top 8 advertisers account for 50 percent of the
revenue; and the top 23 advertisers account for 75 percent of the
revenue derived from children's programming. Consequently, in
an oligopolistic situation where relatively few advertisers are
competing for time offered by 3 suppliers, prices will increase
if a situation of scarcity is created. Ratings still determine
revenues, and the leader of the ratings race will continue to attract
more advertising revenue. There might be some benefits for the
less popular programs, like Take a Giant Step: those advertisers
who are forced out of the most popular shows when prices go up as
the number of commercial minutes is reduced might elect to buy into
low rated programs rather than be forced out of children's network
television completely.

- 57 -
CBS, the most profitable network so far as children's pro-
gramming is concerned, has expressed doubts about the plan to
reduce the non-programming content in children's television from
16 to 12 minutes from January 1, 1973. Of these 12 minutes, 81:i
will be sold as network commercials, the other 31 will be divided
between affiliate sold commercials, station ID's, and billboards.
CBS's main fear seems to be that the two opposition networks, ABC
and NBC, will pick up some of the revenue that CBS feels it is going
to lose. Alternatively, CBS feels that unless the commercial time
reduction is applied across the board, and not just at weekends,
there will be some revenue seepage out of network children's tele-
vision into spot children's television, and particularly into the
hands of the independents, whom, many network executives feel, make
a high profit out of old and often tasteless cartoon shows that they
program in the mid to late afternoons.
Although this is a distinct possibility, the commercial
viability of children's programming looks secure after the reduc-
tion in commercial time is put into effect January 1, 1973, when the
networks will be selling 81/2 commercial minutes an hour instead of
the current 12, especially since for 2 of the 3 networks children's
television provides a particularly high rate of return.
A possible second stage is to reduce the amount of commercial
content in all children's programming, Sunday through Saturday, that
is if the definitional problem of what exactly is children's program-
ming can be sorted out.
Finally, regarding the reduction of commercial time in weekend
children's programming it seems probable that the networks will
suffer no appreciable loss of revenue
7in the short to medium term.
5

- 58 -
There might be a fallback when the rule becomes effective, but
this will be quickly made up as advertising prices rise to a new
level. Most major advertisers will remain in children's television
for the simple reason that they have no other place where they can
advertise as cheaply and as effectively. Furthermore, if the
networks are to real* minimize the effects of this self-imposed
reduction of commercial time, they have got to sell children's
programming more effectively and persuasively.
5. THE ECONOMIC IMPLICATIONS TO THE NETWORKS OF THE ACT PETITION
The petition from Action for Children's Television
specifically states: (a) That there shall be no sponsorship and
no commercials on children's programs; and (b) that each station
shall provide daily programming for children, and in no case shall
this be less than 14 hours a week as part of its public service
requirement. In addition, the petition further states that
programming shall be divided into three child viewing groups:
aged 2-5; aged 6-9; and aged 10-12.
Amount of children's programming.
Using the current television season, and counting only those
children's programs presented by the networks, ABC presents 6 hours
of children's programs on Saturday and 2 hours on Sunday; CBS
presents 6 hours of children's programs on Saturday, 1 hour on
Sunday, and 5 hours Monday through Friday; NBC presents 5 hours of
children's television on Saturday, 1 hour on Sunday (Wonderful
World of Disney), and VI hours during the week. These are
58
- 59 -
regularly scheduled programs and exclude specials and occasional
children's programs. Therefore the bulk of regularly scheduled
network children's television comes from CBS with a tetalof 12
hours a week, followed by NBC with 8 hours, and ABC with 8 hours.
To ask all 3 networks to increase their programming to 14 hours
a week would require additional annual expenditure of something
like $2.5 million for CBS; $4.3 million for NBC; and $5 million for
ABC. This assumes that the new programming would be original and
not merely re-runs of old cartoons.
For each and every station, both independents and affiliates, addi-
tional programming would involve them in additional expenditure with little
chance to recoup programming expenses, since the current market
situation in weekday children's television does not make economic sense
if all stations are competing for the same audience at the same
time periods. A system has developed whereby one station in one
market becomes known as the "children's station" by programming
cartoons in the afternoons, and often in the mornings. Stations
that program for children are often the independents--WPIX in New
York, and WTTG in Washington, D.C.--and these stations often make
a handsome profit from programming to children--programming that
consists mostly of cartoons. Stations like WPIX and WTTG program
more than 14 hours a week to children, although ACT would hardly
approve of the program content because it lacks diversity and
probably represents what they consider to be the worst type of
television.
59

- 60-
Although the ACT petition's request for 14 hours of programming
per week from each station would have an immediate and costly impact,
it must again be stressed that children's programming can be a
long-term investment in the sense that the same programs--like Sesame
Street and The Electric Company for example--can be shown many times
as the child population is renewed, and thus costs can be amortized
over the long-term. Disney proved that an investment in so-called
quality films for children had a long-term payoff because many of his
early films make a handsome profit every time they are released on
the cinema circuit. It is for this reason that the Disney Company
refuses to sell the rights to its films to the networks, all of whom
would be only too interested in buying them. Disney's movie
executives figure that their primary audience turns over every 7
years; as each crop of children grows up, a new one is ripe for
the same movies.
Loss of revenue
If there were no sponsorship of children's programs whatsoever
it would result in a serious financial loss to all 3 networks. In
1970, as we have seen, the 3 networks earned between them gross weekend
revenues of almost $75 million from children's programming--or
$56,250,000 net. If this amount of money were wiped out, the
networks would have serious problems in recouping. The only way
they could do this would be to increase the prices in prime-time
and daytime television in order to sustain the losses in
children's television, or alternatively drop children's programming
completely. Unlike the ban on cigarette advertising, a ban on
60

- 61 -
commercials in 14 hours of children's programming every week would
be a total loss of advertising time, since the commercial minutes
available in children's television would be taken away from the
networks completely, whereas in the case of cigarette advertising
one source of revenue was taken away but the supply of commercial
minutes was not reduced--in other words, the time previously sold
to cigarette advertisers could be (and was) sold to other buyers.
Underwriting and Insitutional Advertising
Two alternatives to the commercialism that currently exists
in children's television are: 1. the possibility of underwriting the
costs of children's television; and, 2. only allowing image or
institutional advertising (not advertising that aims to sell a
product) in children's programs.
If underwriting the costs of children's programs were to be
encouraged, then presumably the big U.S. Corporations would be
directly involved. Any companies wishing to reduce the commercialism
in children's programming would help support the costs of such
programming in return for a credit that would simply say: "This
program has been brought to you with the help of grants from the
following companies and foundations..." Although underwriting is
?art o, ,n increasing trend in broadcasting, the trend has not
reached the stage where it promises to reduce the amount of ad-
vertising aimed at children.
Currently, a very small percentage of any large company's
total advertising budget is devoted to the second alternative,
institutional advertising. One firm that spends all of its
61

- 62 -
advertising on institutional advertising is Health Tex Inc the
clothing manufacturer, of New York City. This company spends $1
million a year in promoting its corporate image, and is one of the
very few such business concerns that does this. The company's
position is that it wishes to engender in the minds of parents a
feeling that Health Tex is a responsible manufacturer of pre-
schoolers clothing. Accordingly, it sponsored a children's special,
Babar Comes to America, in prime-time on the NBC Television Network
on Sunday, February 27, 1972, by spending $250,000 on advertising a
moral theme. For example, one ad asked and answered the question:
Why do we go to war? It ended by saying that it would be nice if
we were all friendly towards each other. Although image advertising,
like underwriting, is part of an increasing trend, normally no more
than 5 percent of a company's total advertising budget is devoted
to the promotion of a company image. Because of this, and lacking
any encouragement, institutional advertising and/or underwriting,
seem to provide no easy or simple answers to the problem of paying
for children's television programs that have fewer commercials or are
commercial-free.

- 63 -
Age specific programming
In addition to asking the networks and other television
companies to give up a total of 112 minutes of advertising per
week (this assumes that each hour of children's programming carries
only 8 minutes per hour and currently the figure is much higher
than this), ACT also asks that such programming be age specific.
This means that children's programming would no longer be attrac-
tive as lead-in programming because the child audience would be
fragmented. As we have seen, the latest U.S Census shows that
37 percent of the total TV households in this country have
children under the age of 12; and 23 percent of the TV households
have children under the age of 6. The economics of

- 64 -
commercial broadcasting system are geared to a mass audience- -
advertising revenues increase as more viewers tune-in, so any
attempt to fragment an audience would have a serious impact on
revenues, say the networks. One of the main reasons why much
children's television lacks diversity,according to
network executives, is because for any program to be economically
viable it must attract viewers from 2-12 and treat them as a
homogeneous group. In fact, children are a heterogeneous group.
However, in a commercial system where numbers of viewers have to
be supplied or sold to advertisers, the networks or program
suppliers tend to maximize profits by lumping together several
different audiences in an attempt to get a mass audience that
is sufficiently attractive to advertisers that all commercial
time is fully sold.
In order to ascertain what kind of financial impact age
specific programming would have, itis possible to make certain
assumptions and to calculate the revenue from programs directed
towards fragmented audiences.
Assumptions:
1. That the network will provide age specific programs to the
3 age groups outlined in the ACT petition and that such age specific
programming will not be in direct competition, for example ABC's
programming for pre-schoolers will not be shown at the same time that
CBS's and NBC's programming for this age group.

- 65 -
2. That such age specific programming will have fully sold
commercial sponsorship of 6 minutes per hour.
3. That the bulk of children's programming from the networks
continues to be shown on Saturday morning when a large number of
children are available, and that the networks continue to have
roughly the same audience rankings that they did in the 1971-72
season, i.e. CBS first, ABC second, NBC third.
4. That because age specific programs seem to be less popular
than cartoons, there will be some audience loss--at least in the
short run.
Unfortunately the above assumptions do not completely
describe the real world. For example, many families have several
children whose ages range from 2 to 12, and usually the older
children dictate what the younger children will watch. This fact
poses a threat to any age specific programming directed to pre-
schoolers outside of school hours when an older brother or sister
can demand that all the children watch something else. However,
we have seen that Captain Kangaroo, a program for pre-schoolers,
did make money for the CBS Television Network in 1970.
For the sake of the following analysis, children's Saturday
programming is assumed to be the time period from 8 a.m. to 2 p.m. --
a 6-hour ?eiod which is an extension of the current time schedule
devoted to children's programming. Because of the assumption
that there would be no competition between the networks for age

- 66 '-
specific audiences, this reduces seepage to a minimum:
ABC
8:00 a.m. Pre-schc-1 r'ogrnmEst. rating : 1.5
8:30 a.m.
9:00 a.m.
9:30 a.m.
10:00 a.m.
10:30 a.m.
11:00 a.m.
11:30 a.m.
12
12:30 p.m.
1:00 p.m.
1:30 p.m.
Pre - school.
Est. rating : 3.0
Pre-schoolEst. rating : 5.0
Pre-schoolEst. rating : 7.0
6-9
Est. rating : 2.0
6-9
Est. rating : 6.0
6-9
Est. rating : 6.0
6-9
Est. rating : 5.0
10-12
Est. rating : 5.0
10-12
Est. rating : 5.0
10-12
CBS
C-9 programEst. rating : 4.0
6-9
Est. rating : 7.0
6-9
Est. rating : 8.0
6-9
Est. rating : 9.0
10-12Est. rating : 10.0
10-12Est. rating : 10.0
10-12Est. rating : 10.0
10-12
Est. rating : 11.0
Pre-schoolEst. rating : 6.0
NBC
10-12 programEst. rating : 1.5
10-12Est. rating : 2.0
10-12Est. rating : 3.0
10-12Est. rating : 5.0
Pre-schoolEst. rating : 3.0
Pre-schoolEst. rating : 3.0
PreschoolEst. rating : 3.0
Pre-schoolEst. rating : 3.0
6-9
Est. rating : 4.0
Pre-school 6-9
Est. rating : 5.0 Est. rating : 5.0
Pre-school 6-9Est. rating : 5.0 Est. rating : 5.0 Est. rating : 5.0
10-12 Pre-school 6-9Est. rating : 5.0 Est. rating : 5.0 Est. rating : 5.0
The average ratings for the above are : CBS 7.5; ABC 4.6; NBC 3.5.
We will now further assume that the above programs are sold
at a cost of $2 per thousand homes. We have already seen that a
rating of 1.0 equals 600,000 homes, so the above average ratings
equate to the following: CBS 4,500,000 homes; ABC 2,760,000 homes;
NBC 2,100,000 homes. At a cost of $2 per thousand homes, the average
per minute advertising rate for the 3 networks would be: CBS $9,000;
66

- 67 -
ABC $5,520; NBC $4,200. The gross advertising receipts for the 3
networks for an average Saturday morning would be: Average per
minute advertising rate X number of minutes per hour X number of
hours of programming. This would result in the following for
CBS: $9,000 X 6 X 6 = $324,000 gross receipts for each Saturday
morning, or $16,848,000 for the year. For ABC: $5,520 X 6 X 6 =
$198,720 gross for each Saturday morning, or $10,333,440 for the
year. For NBC: $4,200 X 6 X 6 = $151,200 gross for each Saturday
morning, or $7,862,400 for the year. After payments for station
compensation and advertising agency commission, these figures would
net out at: CBS $12,636,000; ABC $7,750,080; NBC $6,000,000.
Since the above assumptions are reasonably conservative, in
all probability CBS and ABC would make a profit, though NBC would
lose, assuming that each network spent around $7 million a year,
or less, on Saturday morning programming. However, 20 percent of
the total amount paid in station compensation, is paid to the
owned and operated television stations that belong to thesame
companies as do the networks, so even for NBC the loss would be
minimal. If there were more than 6 minutes of commercials sold in
age specific programming, and if such commercial minutes were sold
at a cost of above $2 per thousand homes, then all 3 networks could
then expect to make a fair return on investment in children's
programming. Again, if such age specific programming were divided
into 2 groups as distinct from 3 groups, say from 2 to 7 and from
8 to 12, then an even higher return could be expected.
The purpose of this discussion has been to show that it might
be possible to program to age specific groups and also make money.
In addition, it might behoove the' networks and other broadcasting
67

- 68
organizations to attempt to convince advertisers that they ought
to support such age specific programming so as to expose children
to new ideas and to new experiences.
Currently Public Broadcasting seems to be attempting to fill
the breach caused by commercial broadcasting's lack of
diversity in children's programming by airing such programs as
Mister Roger's Neighborhood for young children, Sesame Street for
pre-schoolders, and The Electric Company for the 6-9 year olds.
Altogether Public Television provides 2 hours of programming for
children Monday through Friday (ignoring repeats) for a total of
10 hours. There is also a k hour program Zoom, aired on Sundays
at 7 p.m.
6S

- 69-
SUMMARY
This report has concentrated on analysing the situation as it
exists, ol as it is seen to exist in the minds of network executives.
Later in this presentation a number of alternative actions will be
explored and the economic implications of those alternatives willbe
analysed.
It shoula be said that it has never been contended that every
segment of network programming should be profitable in and of itself;
for ,axample, many documentary programs lose money for the
networks. Maybe some children's programming cught to be treated in
this way. The networks have always been charged with a responsibility
to present a diversified programming schedule, within the limitations
of overall commercial viability, The networks claim that they need
a fairly high rate of return on their capital if they are to be
adventurous or experimental in their programming, especially in the
areas of news and minority appeal programming (and perhaps age-
specific children's programming is minority appeal programming).
Traditionally profits from prograTs such as The Tonight Show, with
host Johnny Carson, have been used to finance non-vofitable pro-
gramming, especially some of the ambitious coverage of moonshots
and other costly public affairs specials that attract relatively
little or no advertising revenue. In 1970, The Tonight Show earned gross
advertising revenue of $31,451,600 from its 2,194 minutes of
network advertising. After deductions of 15 percent agency
commission and around 10 percent station .:ompensation, the program
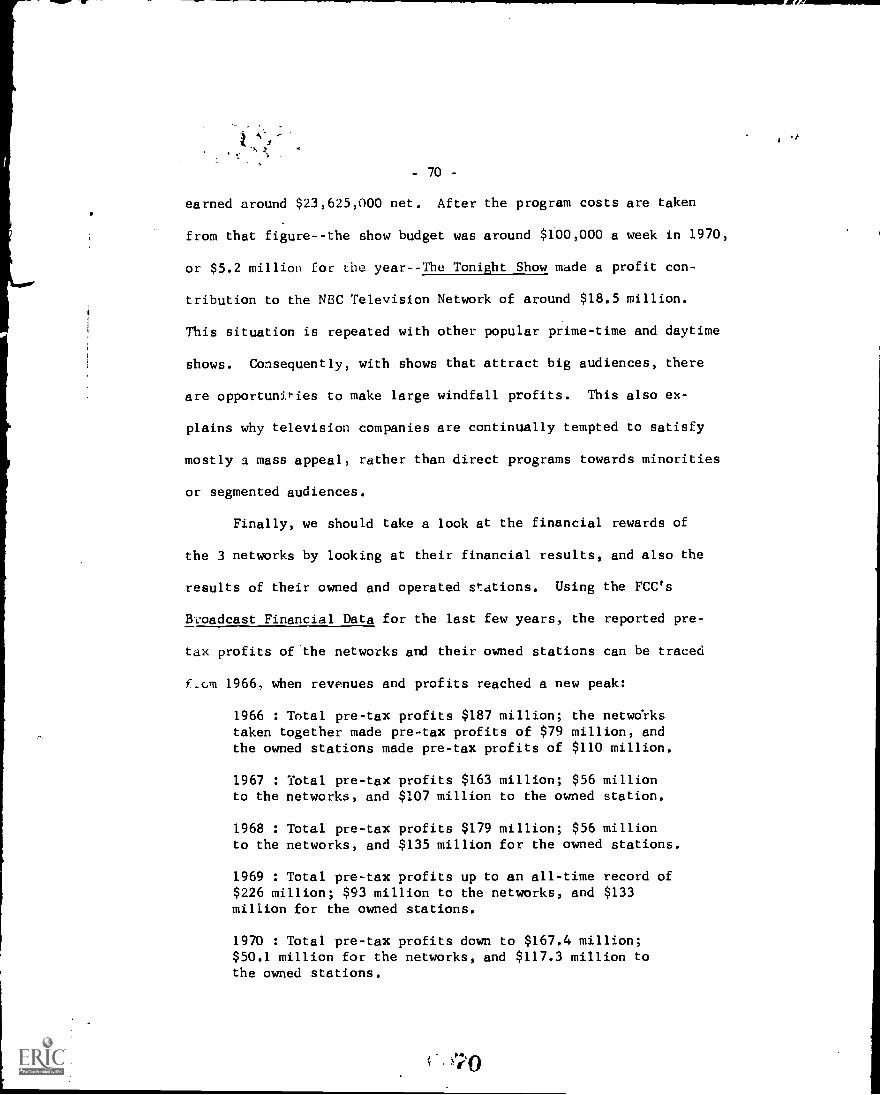
- 70 -
earned around $23,625,000 net. After the program costs are taken
from that figure--the show budget was around $100,000 a week in 1970,
or $5.2 million for the year--The Tonight Show made a profit con-
tribution to the NBC Television Network of around $18.5 million.
This situation is repeated with other popular prime-time and daytime
shows. Consequently, with shows that attract big audiences, there
are opportunities to make large windfall profits. This also ex-
plains why television companies are continually tempted to satisfy
mostly a mass appeal, rather than direct programs towards minorities
or segmented audiences.
Finally, we should take a look at the financial rewards of
the 3 networks by looking at their financial results, and also the
results of their owned and operated stations. Using the FCC's
&Loadcast Financial Data for the last few years, the reported pre-
tax profits of 'the networks and their owned stations can be traced
f.ca 1966, when revenues and profits reached a new peak:
1966 : Total pre-tax profits $187 million; the networkstaken together made pre-tax profits of $79 million, andthe owned stations made pre-tax profits of $110 million.
1967 : Total pre-tax profits $163 million; $56 millionto the networks, and $107 million to the owned station.
1968 : Total pre-tax profits $179 million; $56 millionto the networks, and $135 million for the owned stations.
1969 : Total pre-tax profits up to an all-time record of$226 million; $93 million to the networks, and $133million for the owned stations.
1970 : Total pre-tax profits down to $167.4 million;$50.1 million for the networks, and $117.3 million tothe owned stations.

- 71 -
The ABC Television Network has been losing money quite
heavily since 1963, but this has been made up by profits from its
5 owned and operated stations, and the network claims to have
"turned the corner" financially in 1971.
List of people interviewed
The following people have been interviewed in connection with
the economic analysis of children's television:
Action for Children's Television
Peggy CharrenEvelyn Sarson
Boston University
Dr. Earle BarcusDr. Hy Goldin
Harvard Business School
Dr. Scott Ward
Columbia University Graduate School of Business
Dr. Donald Lehmann
Children's Television Workshop
Dave Connell, Executive Producer, formerly CBS Producer ofCaptain Kangaroo
Tom Kenneay, Vice President, FinanceRichard DeFelice, Director, Financial PlanningDr. Edward L. Palmer, Vice President, Research
ABC Broadcast Group
James Duffy, President, ABC TV NetworkMark Cohen, Vice President, Planning/Business Analysis, ABCMichael Eisner, Vice 1:'esident, Daytime Programming, ABC
CBS Broadcast Group
Dr. Frank Stanton, Vice Chairman of the BoardJack Schneider, President, CBS Broadcast DivisionRobert Wood, President, CBS TV Network

-72 -
Bill Tankersley, former Vice President, Rules and StandardsOscar Katz, Vice President, ProgrammingAllen Ducovny, Director, Children's ProgrammingDr. David Blank, Vice President, Economics and ResearchDavid Wilkovsky,CBS EconomistMartin Ewenstein, CBS EconomistNorman Morris, CBS News and author of book on children's televisionRichard Jencks, CBS, Washington, D.C,Sarge Carleton, CBS, Washington, D.C.
NBC
Julian Goodman, President, NBC, Inc.Tom Ervin, Executive Vice PresidentDon Durgin, President, NBC TV NetworkCorrie Dunham, Vice President, Legal ServicesLarry White, Vice President, East Coast ProgrammingDon Carswell, Vice President, NBC Business AffairsBill Dannhauser, Director, Business AffairsJerry Wexler, Director, Sales PricingMike Weinblatt, Vice President, Talent and Program AdministrationGeorge Heinemann, Vice President, Children's ProgrammingHoward Monderer, NBC, Washington,D.C.
NAB
Stockton Helffrich, Director, NAB Code AuthorityJerome Lansner, Assistant Director
Television Information Office
Roy Danish
Federal Trade Commission
Dr. James Meehan, Economist
Broadcast Advertisers Reports
Pro Sherman, Vice President
National Institute of Mental Health
Dr. Eli Rubinstein and others
Office of Child Development, HEW
Lillian Ambrosino
Community Relations Service, Department of Justice
Mike Hernandez

- 73 -
Television Stations
Leavitt Pope, Vice President, WPIX-TV, New York CityRay Hubbard, Vice President, Programming and Production, WTOP, Wash., D.C.Daniel Gold, General Manager, WTOP-TV, Washington, D.C.G. Richard Shafto, Ex-President, Cosmos Broadcasting CorporationHarry L. Francis, Vice President, Meredith Broadcasting
Romper Room Enterprises
John H. Claster, Vice President
Advertising Agencies and Advertisers in Children's TV Shows
Al Fields, Vice President of Merchandising, Advertising, and Promotion,Health-Tex Inc.Jack Jones, Senior Vice President, Marketing, Topper CorporationSeymour Banks, Vice President, Leo Burnett Inc.Steve Campbell, Vice President, General FoodsArch Knowlton, Director, Media Services, General FoodsFrank Charlton, General Foods LawyerRichard A. Aszling Vice President, Public Relations/Public AffairsGeneral FoodsVernon Kanner, Vice President, Benton and BowlesLes Towne, Vice President, Helfgott and PartnersDonald B. Miller, Chairman of the Board, Rumrill-Hoyt Inc.Joseph M. White, M.D., Miles Laboratories
Newsweek
Lee Weston, Assistant to the Publisher
Grocery Manufacturers of America
Bart O'HaraCharles Saffron
Toy Manufacturers Association
Aaron Locker
Communications Lawyers
Vic Ferrall, of Koteen, BurtBruce McDonald, of Kirkland, EllisErwin Krasnow, of Kirkland, EllisKenneth Cox, of Haley, Bader and Potts
73