Embed Size (px)
Citation preview
DOCUMENT RESUME
ED 394 978 SP 036 694
TITLE The Implementation of Performance Assessment inKentucky Classrooms.
INSTITUTION Louisville Univ., Ky. School of Education.SPONS AGENCY Kentucky Inst. for Education Research, Frankfort.PUB DATE Aug 95NOTE 105p.; For related documents, see SP 036 685-694.PUB TYPE Reports Evaluative/Feasibility (142)
EDRS PRICE MF01/PC05 Plus Postage.DESCRIPTORS *Educational Assessment; Elementary Secondary
Education; *Performance Based Assessment; ProgramEvaluation; Program Implementation; Public SchoolTeachers; School Restructuring; State Departments ofEducation; State Standards; Teacher Attitudes;*Teacher Response; Teaching Experience
IDENTIFIERS *Kentucky; *Kentucky Education Reform Act 1990
ABSTRACTThis report describes what schools and educators
across Kentucky are doing to implement school reform in performanceassessment based on the Kentucky Education Reform Act of 1990 (KERA).It provides research-based suggestions about how implementation ofprograms can be enhanced and how the benefits of reform increased forthe Kentucky youth. Thirty-two schools from arou.nd the state wererandomly selected to participate; they included two elementaryschools, one middle school, and one high school from each region ofthe State. All teachers from the disciplines of language arts,mathematics, science, and social studies completed a performanceassessment survey; six teachers from each school were randomlyselected for personal interviews using the Performance AssessmentComponent Configuration (PACC) Map. A total of 500 surveys wereanalyzed. It was concluded that the extent to which performanceassessment is occurring in the classrooms of the teachers selectedvaried considerably, both within and across schools, in terms of theunderstanding of what is required of a particular type of assessmentand how it should be implemented. KERA support documents are beingused by 7 out of 10 teachers surveyed as are multiple forms ofassessment, including oral and written open-ended questions,performance events, portfolio assignments, skills tests, andconferencing. In addition, new teachers reported using moreperformance assessment in instruction than more experienced teachers.Appendices provide: a glossary of terms; the performance assessmentcomponent configuration map; performance assessment surveyquestionnaire; and 14 pages of tables displaying statistical resultsfrom the survey. OGOO
****************************u******************************************
Reproductions supplied by EDRS are the best that can be madefrom the original document.
***********************************************************************

. ' KET\TINJECKYINSTITUTEFOR
EDUCATIONRESEARCH
e Implementation of Performancessessment in Kentucky Classrooms
0.111. DEPARTMENT OF EDUCATION,4 Mc. c Educaoonal nucleon and Improvement
EDUCATIOfAL IESOURCES INFORMATIONJENTER (ERIC)
1 0 This 6ocumont has been reproduced asMewed from the Person or orgenizationoriginating it.
0 Minor Chnges have been mad to improverobrOductron quality
Sfornts of view or Oprsons stated in this docu-mint do not necessarily represent officialOERI poltroon or policy
;
y
A Report of Researchconducted by
Tlie School of EducationUniversity of Louisville
for theKentucky Institute for Education Research
146 Consumer Lane, Frankfort, Kentucky 40601
PERMISSION TO REPRODUCE ANDDISSEMINATE THIS MATERIAL
HAS BEEN GRANTED BY
4P-
TO THE EDUCATIONAL RESOURCESINFORMATION CENTER (ERIC)
August 1995
BEST COPY AVAILABLE
2

BOARD OF DIRECTORSChairBen RichmondUrban League of Louisville1535 West BroadwayLouisville, KY 40203-3516
Vice ChairGary DoddCM Management Services698 Perimeter Drive, Suite 200Lexington, KY 40517
SecretaryRobert F. SextonThe Prichard Committee
for Academic ExcellenceP. 0. Box 1658Lexington, KY 40592
TreasurerDoug KuelpmanUnited Parcel Service1400 North Hurstbourne ParkwayLouisville, KY 40223
Lila BellandoChurchill WeaversP. 0. Box 30Berea, KY 40403
Barbara DeebWKYU-TV1 Big Red WayBowling Green, KY 42101
Jane Joplin Evans515 North Main StreetSomerset, KY 42501
Blaine Hudson439 Strickler HallUniversity of LouisvilleLouisville, KY 40292
Ernie W. StamperAshland Petroleum Co.P. O. Box 391Ashland, KY 41114
Fred D. Williams70 Pentland PlaceFt. Thomas, KY 41075
Amy Helm WilsonMurray Ledger & Times1001 Whitnell AvenueMurray, KY 42071
Joe WrightStar RouteHarned, KY 40144
Executive DirectorRoger S. Pankratz, Ph.D.KY Institute for Education Research146 Consumer LaneFrankfort, KY 40601
KEIITIJECKYINSTITUTE
EDUFCOATIONRESEARCH
146 Consumer Lane Frankfort, Kentucky 40601 502-227-9014 Fax 502-227-8976
.3

The Implementation of Performance Assessmentin Kentucky Classrooms
A Report of ResearchConducted by
The School of EducationUniversity of Louisville
Principal InvestigatorBradley A. Matthews
August 1995
Supported With Funds FromThe Kentucky Institute for Education Research
4

PREFACE
This research project is one of six studies conducted in the.spring of 1995 to determine the extentschools and educators across Kentucky had implemented Educational Technology, High SchoolRestructuring, the Primary Program, Professional Development, Performance Assessment andSchool-Based Decision Making.
The studies were sponsored by the Kentucky Institute for Education Research, supported byfunding from The Annie E. Casey Foundation. Each of the research projects was contracted to aKentucky university that managed the research and employed the services of a team ofresearchers/field observers, mostly from higher education institutions across the state.
Each study was designed to collect data from a random set of schools across the eight stateeducational regions. All studies used a research tool developed especially for studying theprogress of program implementation called an Innovation Component Configuration Map. TheConfiguration Map enables researchers to judge the level of implementation of different programcomponents based on a common set of standards and guidelines.
Collectively, through these six studies, more than fifty trained researchers visited 189 schoolsacross the Commonwealth conducting interviews, observing classrooms, training sessions andschool council meetings, and reviewing documents and collecting artifacts. To date this researchrepresents the single most comprehensive effort to gage the level of implementation of programsinitiated through the Kentucky Education Reform Act of 1990 (KERA).
The Kentucky Institute for Education Research is proud to be able to sponsor these projects andhighly commends the members of the research teams and the universities for the excellent workof data collection and analysis they conducted under difficult conditions and a limited budget.On behalf of the Institute, I want to personally express my sincere appreciation to each of theprincipal investigators for their professional commitment to this statewide effort, their manyhours of work beyond those budgeted in the contract and their perseverance to produce a highquality research report.
This report not only describes what schools and educators across the state are doing to implementschool reform, it also provides research-based, thoughtful suggestions about how implementationof programs can be enhanced and the benefits of reform increased for the youth of Kentucky.
I sincerely hope you will find the contents of this report both informative and helpful.
Roger Pankratz, Executive DirectorKentucky Institute for Education Research

ACKNOWLEDGMENTS
This study of the implementation of performance assessment in classrooms acrossKentucky could not have been completed without the cooperation and contributions of numerouseducators in Kentucky. We would like to thank them.
First, we would like to thank the principals and teachers who allowed the field observers
to come into their schools and classrooms during a very busy late Winter and early Spring. Snowdays and KIRIS testing schedules created a challenge for some of the site visits. The willingnessof principals to allow site visits and of teachers to complete survey instruments and participate ininterviews is a testimony to the professionalism displayed in these schools.
Second, we would like to thank the field observers who made time in their busy schedules
to be trained in the use of the Innovation Configuration Component Map and to travel to schools
to survey faculties and conduct focused interviews with randomly selected teachers. Theobservers are listed on the following page.
We would also like to thank Dr. Gene Hall, University of Northern Colorado, and Caro lee
Hayes, Douglas County School District in Colorado, for their assistance in the development ofthe Innovation Configuration Component Map (ICCM) and their helpful suggestions on thegeneral design and implementation of the study. Dr. Archie George, University of Idaho,
analyzed the ICCM data and assisted with the interpretation of the Cluster Analysis procedure. Iwould also like to thank Dr. Carol David, research consultant, for herassistance with analyzingthe Performance Assessment Surveys that were completed by the faculties of all participating
schools.
I would like to further express my appreciation to Dr. Roger Pankratz, Executive Director
of the Kentucky Institute for Education Research, for his tireless effort to pursue relevantevaluation methods such as the ICCM and to help fellow educators with assessing the progress of
major strands of the Kentucky Education Reform Act. His guidance, support and encouragement
during this study were greatly appreciated.
Finally, I want to express my sincere appreciation to Diane Gossett for her much needed
assistance in handling the details of administering the grant and providing helpful assistance on
printing and mailing issues.
Brad Matthews, Ed.D.Director of Curriculum and AssessmentJCPS Gheens Professional Development Aci.demy

FIELD OBSERVERS
Dr. Jim CraigWestern Kentucky University
Dr. Lin DoakEastern Kentucky University
Dr. Chelate GrindstaffMorehead State University
Dr. John GuytonMurray State University
Dr. Willis JohnsonMurray State University
Dr. Jane Lind leUniversity of Kentucky
Dr. Ben MalphrusMorehead State University
Dr. Tony NormanWestern Kentuck-y University
Dr. Dan OchsUniversity of Louisville
Dr. Mary Jo PooleAlice Lloyd College
Dr. Linda SheffieldNorthern Kentucky University
Dr. Ed SwanEastern Kentucky University
Dr. Connie WidmerNorthern Kentucky University
iv
7

TABLE OF CONTENTS
EXECUTIVE SUMMARY AND RECOMMENDATIONS ix
The Purpose of the Study ix
The Statewide Sample ix
The Data Collection Process ix
Defining the Innovation: Performance Assessment x
Conclusions Based on Data Analysis xi
Recommendations xiii
Suggestions for Further Research xiv
PURPOSE OF THE STUDY 1
Background of the Study 1
Observations from the 1994 KIER Study on the Primary Program 1
Purposes of the 1995 Performance Assessment Implementation Study 2
DATA COLLECTION PROCEDURES 2
Study Sample. 2
Observer Training 3
Protocols 4
Defining the Innovation: Performance Assessment. 4
Development of the Innovation Component Configuration Map 4
Development of the Performance Assessment Survey 5
Artifacts 6
Analysis of the Data 6
RESULTS OF THE INTERVIEWS AND SURVEYS 7
A General Pattern of Implementation 7
Extent and Patterns of Implementation Based on the Configuration Map Data 8
A. Frequency of Use of Different Types of Assessment 8
B. Content Focus 10
C. Quality of Performance Assessments 11
D. Relationship of Assessment to Instruction 13
E. Teacher Role in Performance Assessment 14
F. Student Role in Performance Assessment 15
G. Performance Standards 16
H. Evaluation and Feedback 17
Comparison of High and Low Implementors 20
Teachers with Similar Patterns of Implementation 21
Results of the Teacher Surveys 25
Findings Related to School Level 25
Findings Related to Primary vs. Intermediate Level 26
Findings Related to Subject Area Taught 26
v
s

TABLE OF CONTENTS (cont.)
Findings Related to Years of Teaching Experience 27
Preliminary Analysis of Classroom Assessment Artifacts 27
CONCLUSIONS BASED ON THE ANALYSIS OF THE CONFIGURATION
MAP AND TEACHER SURVEY DATA 28
RECOMMENDATIONS 31
SUGGESTIONS FOR FURTHER RESEARCH 33
REFERENCES 34
vi
9

TABLE 1.
TABLE 2.
TABLE 3.
TABLE 4.
TABLE 5.
TABLE 6.
TABLE 7.
TABLE 8.
TABLE 9.
TABLE 10.
TABLES
Percent of Teachers Judged to be ImplementingNine Types of Assessment at
Various Levels of Use 9
Percent of Teachers Judged to be Implementing Performance Assessment
at Various Levels of Content Focus 10
Percent of Teachers Judged to be Implementing Performance Assessment
at Various Levels of Quality 12
Percent of Teachers Judged to be Implementing Performance Assessment
at Various Levels of Relationship to Instruction 14
Percent of Teachers Judged to be Using Different Roles to Implement
Performance Assessment 15
Percent of Teachers Judged to be Utilizing Different Student Roles in
Implementing Performance Assessment 15
Percent of Teachers Judged to be Implementing Performance Standards
at Different Levels of Clarity, Congruence, and Relationship to Learning 16
Percent of Teachers Judged to be Implementing Different Types of Evaluation
and Feedback at Different Levels of Use 18
Spearman Rank-Order Correlations: Overall Average With Items on the
Performance Assessment Component Configuration Map 20
Cluster Analysis of Performance Assessment Component Configuration Map . . 23
APPENDIX A35
Glossary of Terms 36
APPENDIX B39
Performance Assessment Component Configuration Map . 40
APPENDIX C50
Performance Assessment Survey 51
APPENDIX DTable D. 1Table D. 2Table D. 3Table D. 4Table D. 5Table D. 6Table D. 7Table D. 8Table D. 9
53
Frequency of Use of Open-ended Questions (Oral) by School Level . . 54
Frequency of Use of Open-ended Questions (Written) by School Level 54
Frequency of Use of Performance Event Tasks by School Level. 55
Frequency of Use of Portfolio Tasks by School Level 55
Frequency of Use of Culminating Performances by School Level 56
Frequency of Use of Projects by School Level 56
Frequency of Use ol Conferences by School Level 57
Frequency of Use of Anecdotal Comments by School Level 57
Percent of Teachers by School Level Using Selected Support
Documents 58
Frequency of Using Technology for Assessment by School Level 59
Frequency of Using Hands-on Techniques for Assessment by
School Level 59
Table D.10Table D.11

TABLES (cont.)
Table D.12 Frequency of Providing Students with Standards in Advance bySchool Level 60
Table D.13 Frequency of Providing Students with Rubrics by School Level 60
APPENDIX E 61Table E. 1
Table E. 2
Table E. 3Table E. 4
Table E. 5
Table E. 6
Table E. 7
Table E. 8
Table E. 9
Table E.10
APPENDIX FTable F. 1Table F. 2Table F. 3Table F. 4Table F. 5Table F. 6Table F. 7
Requency of Use of Open-ended Questions (Written) by Primary andIntermediate Levels . 62Frequency of Use of Performance Event Tasks by Primary andIntermediate Levels .62Frequency of Use of Projects by Primary and Intermediate Levels 63Frequency of Use of Anecdotal Comments by Primary andIntermediate Levels 63Frequency of Use of Selected Resource Documents by Primary andIntermediate Levels 64Frequency of Providing Students with Standards in Advance by Primaryand Intermediate Levels 64Frequency of Use of Technology in Assessment by Primary andIntermediate Levels 65Frequency of Use of Hands-on Strategies in Assessment by Primary andIntermediate Levels 65Frequency of Students Auditing Other Student Work by Primary andIntermediate Levels 66Frequency of Student Work Displayed by Primary and IntermediateLevels 66
67Frequency of Use of Open-ended Questions (Oral) by Subject Area 68Frequency of Use of Performance Event Tasks by Subject Area 68Frequency of Use of Portfolio Tasks by Subject Area 69Frequency of Use of Culminating Performances by Subject Area 69Frequency of Use of Conferences by Subject Area 70Frequency of displaying Student Work by Subject Area .71Frequency of Using Technology for Assessment by Subject Area 71
APPENDIX G 72Table G. 1 Frequency of Use of Performance Event Tasks by Years of Experience 73Table G. 2 Frequency of Use of Support Documents by Years of Experience 74
APPENDDC H 75T able H. 1 Distribution of Collected Performance Assessment Artifacts by
Subject Area. 76
viii
1. 1

THE IMPLEMENTATION OF PERFORMANCEASSESSMENT INKENTUCKY CLASSROOMS
EXECUTWE SUMMARY AND RECOMMENDATIONS
The Purpose of the Study
The Kentucky Education Reform Act (KERA) of 1990 required the Kentucky Department
of Education to develop a new statewide assessment system that was "primarily performance
based" and to hold schools accountable for student learning. The new school reform law also
adopted six Kentucky Learning Goals and required the Council on School PerformanceStandards to define the six Kentucky Learning Goals in measurable terms. In addition, the State
Joard for Elementary and Secondary Education was charged with developing a modelcurriculum framework to guide the design of performance-based learning and to assist schools inusing performance assessments in regular instructional programs.
It was the purpose of this study to: (a) determine the extent to which performance
assessment was being implemented in the classrooms of selected teachers in 32 randomlyselected schools across the state, (b) identify successful implementation patterns and the factors
influencing successful practice, (c) develop reconunendations for embedding performanceassessment in instruction; and (d) refine the Performance Assessment Configuration Component(PACC) Map for performance assessment based on the initial study and suggest ways of using
the instrument for self-assessment and as a tool for further research.
The Statewide Sample
Thirty-two schools, four in each of the eight Regional Service Center regions across the
state, were randomly selected for this study. A stratified random sampling technique was used toobtain two elementary schools, one middle school, and one high school from each region. Six
teachers from the disciplines of Language Arts, Mathematics, Science, and Social Studies were
randomly selected at each school for personal interviews using the PACC Map. Additionally, allLanguage Arts, Math, Science, and Social Studies teachers at each of the schools, includinginterviewed teachers, were asked to complete a performance assessment survey. One-hundred-ninety-two teachers were interviewed using the PACC Map. While return rates varied from
school to school, a total of 500 surveys were analyzed for this study. While the study sample
may not be completely representative of the use of performance assessment in classrooms acrossKentucky, it is the most complete effort to date to define the components of implementation and
to collect data on their use by teachers across Kentucky.
The Data Collection Process
A team of 12 field observers recruited from state colleges and universities was trained to
collect information on the implementation of specific components of performance assessment
using the PACC Map. The observers conducted focused interviews with each teacher selected
ix
12

for the study and completed a PACC Map on each. Each interviewed teacher also filled out a
survey on performance assessment practices. Principals were requested to distribute theperformance assessment surveys to all teachers in their building who taught one of the four core
subjects used for this study. Of approximately 600 surveys returned, 500 were considered usable
for this study.
The PACC Map contained descriptions of different levels of implementation for 13components that define the attributes of performance assessment. These components weredeveloped during the Spring of 1994 by a team of school teachers, school administrators, andcollege professors with an interest and expertise in performance assessment. Early versions of
the PACC Map were field tested and subsequent revisionsmade through the Fall of 1994.
Data collected for analysis included completed PACC Map, notes from the focusedinterviews, summary observations from the field observers, and artifacts that included sampleassessment tasks, rubrics, scoring guides, open-ended questions, and other forms of evaluation.More than 300 artifacts were voluntarily submitted by teachers who were interviewed.
Defining the Innovation: Performance Assessment
Performance assessment, unlike traditional forms of evaluation, focuses not only on what
student should know, but also on what they can do with what they know and in more realisticsituations or contex6. To be effectively implemented, teachers must examine and, in many
instances, change the way they assess student performance in their classrooms. Moving fromtraditional standardized evaluations to new standard-setting evaluations is a major change instudent evaluation. Teachers must not only be knowledgeable about how to use the different
types of assessments that are available to them, they must also think about how this form ofassessment changes the role that students play in the teaching and learning process.
In assessing the extent of implementation of performance assessment across Kentucky,
the research team identified different types of performance assessment, quality issues associatedwith those performances, and the roles played by the teacher and the student. Eight majorcomponents were defined for the study and are listed below:
1. Frequency of Use2. Content Focus3. Quality of Performance Assessments4. Relationship of Assessment to Instruction5. Teacher Role in Performance Assessment6. Student Role in Performance Assessment7. Performance Standards8. Evaluation and Feedback
13

Conclusions Based on the Data Analysis
1. The extent to which performance assessment is occurring in the classrooms of theteachers selected for this study varies considerably both within and across schools.Observers found a range of differences in terms of understanding what is required of aparticular type of assessment and how it should be implemented. Understanding andutilization of specific innovation components varied from teacher to teacher. There isconfusion about the meaning of terms used to describe different types of performanceassessment. Terms such as "performance task," "portfolio task," and "culminatingperformance" are often used interchangeably.
2. KERA support documents such as Transformations, Kentucky Department of EducationContent Guidelines, The Kentucky Instructional Results Information System (KIRIS)released, open-response items, and KIRIS Assessment Curriculum Reports are reportedbeing used by at least seven of ten teachers surveyed. How these documents are usedvaries by individual teacher.
3. KIRIS is having a major impact on the use of performance assessment in the classroomsof teachers at the selected schools. However, the use of performance assessment formany teachers is primarily in preparation for KIRIS tests rather than as an integral part oftheir daily instruction.
4. Multiple forms of assessment including oral ahd written open-ended questions,performance events, portfolio assignments, skills tests, and conferencing are used byseven of ten teachers surveyed. More than half used some type of open-ended questionswithin the scope of an instructional unit.
5. Nine of ten teachers reported using oral and written, open-ended questions on a regularbasis and eight of ten teachers reported using portfolio tasks within units of instruction.
6. Seven of ten teachers surveyed reported that they used the KIRIS Assessment CurriculumReport, but a number of interviewed teachers reported that they used only one report at atime and were not able to discuss changes in performance over time. Some teachersconfused the KIRIS Assessment Curriculum Report with other KIRIS reports.
7. There is evidence that accountability-grade (non K-3) teachers make more extensive useof performance assessments. Comparing primary teachers (K-3) with intermediateteachers (4-5), intermediate level teachers report:
Greater use of open-ended questions and performance events on a daily and weeklybasisMore often providing students with standards in advance of instructionMore frequent use of the instructional strategy where students audit other students.:work
xi
14

8. There were differences in reported use of performance assessments among teachers ofLanguage Arts, Mathematics, Science, and Social Studies:
Language Arts and Mathematics teachers use portfolio tasks more extensivelyLanguage Arts teachers use student feedback conferences more frequentlyMathematics teachers make greater use of national standardsScience (eachers use performance event tasks and hands-on strategies more frequentlySocial Studies teachers used textbook materials more for assessment
9. There were differences in reported use of performance assessment among teachers atelementary, middle, and high schools:
Primary and intermediate level teachers reported a more frequent use of open-endedoral questions, portfolio assignments, culminating performances, projects, studentconferences, anecdotal comments, and use of hands-on assessment activitiesPrimary and intermediate level teachers are more likely to divide instructional timebetween giving information, coaching students and providing feedback, and tend toprovide feedback more on a daily basis than the middle and high school teachersIntermediate level teachers reported a more frequent use of written, open-endedquestions and performance events than primary teachersIntermediate level teachers reported a more frequent use of the textbook, KIRIS open-response, released items, and the KIRIS Assessment Curriculum Reports more-frequently than primary teachersMiddle and high school teachers reported using KIRIS open-response items morefrequently than primary or intermediate level teachersHigh school teachers reported using open-ended written questions, performanceevents, and technology for assessment activities more than all other levels
10. Differences in the setting of standards for performance assessment were observed amongelementary, middle, and high school levels. Elementary teachers display student workmost frequently as a standard-setting mechanism. High school teachers are the mostlikely to provide students with standards in advance and to use scoring rubrics onassessments.
11. High implementors of performance assessment use assessment to drive instruction, usetechnology and hands-on manipulatives more frequently, provide challenging andengaging assessments, and provide content that covers multiple Kentucky Learning Goalsand Academic Expectations. These areas are the greatest predictors for implementation.
12. High implementors of performance assessment use open-ended, written questions andportfolios tasks more frequently. However, types of assessments tend to varyindependently of the other components that were measured and by themselves are notgood predictors of effective implementation.
xii
15

13. New teachers report higher uses of performance assessment in instruction than moreexperienced teachers. For example, 95 percent of teachers with one to five years'experience report using performance events within units of study. The extent of use ofperformance events drops to 70 percent for teachers in the range of six to ten years and to50 percent for teachers with more than ten years of teaching experience.
14. Teachers who use KIRIS released items are significantly different from non-users inseveral ways. They used open-ended written questions and portfolio assignments morefrequently than non-users. They also used rubrics for student work and assessment morefrequently. Teachers who used KIR1S released items displayed student work morefrequently, used the content guidelines more frequently, and used real world examples forstudent assessment more frequently than non-users.
Recommendations
1. Resource documents should be produced that define the types of assessment and providerich examples of each type.
2. Professional development should be provided in a variety of areas related to curriculumand assessment. Key areas include:
a. Design and use of different types of performance assessments that challenge studentsto perform at higher levels and engage them with meaningful tasks
b. Design of performance standards and scoring rubrics that elicit quality work
c. Use of portfolios in more subject areas and as a method for encouraging higher levelsof performance for all students through assessment of work in progress
d. Design and implementation of a standards-based curriculum
e. Development of quality tasks that can be used to organize and drive instruction
3. Good model lessons, performance assessment tasks, and the methods for developing themshould be made available to every teacher.
4. A bank of quality performance assessments should be established by academicexpectation and subject area and made available through the Kentucky EducationalTelevision network. Each event or task should also be accompanied by samples ofstudent work that serve as benchmarks for quality.
16

5. Transformations: Kentucky's Curriculum Framework should be updated to incorporatecurrent information in various national standards documents. The AcademicExpectations need to be further defined by content standards in order to provide clarity towhat students are expected to know and be able to do.
6. Schools need to explore ways of having more of the faculty involved in preparingstudents at every grade level for the KIRIS assessments.
7. Schools need to develop a multi-year MIS Assessment Curriculum Report profile toidentify both areas of growth and improvement as well as reporting categories in need ofimprovement.
8. The Kentucky Department of Education in cooperation with local school districts shouldidentify classrooms and teachers where performance assessment is being used to improvethe quality of student work. These teachers and schools should serve as model sites forvisits and be involved in the professional development of others.
9. The PACC Map needs to be revised and a training module developed for using the mapas a self-assessment tool.
Suggestions for Further Research
Studies need to be conducted to:
1. Replicate the present study findings by having a more extensive implementation studythat includes:
a. A more representative sample of schools and teachers,b. Arts and Humanities teachers, andc. A comparison of schools meeting or exceeding their thresholds with schools not
meeting their thresholds.
2. Identify methods for challenging and engaging students in assigned tasks and studentwillingness to persist with the assigned task.
3. Identify the extent of implementation within schools and across schools. Factors need tobe identified that increase the likelihood of high implementation of performanceassessment for all teachers in a school.
4. Identify the effects of professional development associated with the use of performanceassessment.
5. Identify the effects of school leadership in promoting the use of performance assessmentfor instruction.
xiv
17

THE IMPLEMENTATION OF PERFORMANCE ASSESSMENTIN KENTUCKY CLASSROOMS
PURPOSE OF THE STUDY
Background of the Study
In June, 1990, the Kentucky legislature passed the Kentucky Education Reform Act(KERA) mandating a complete overhaul of the Kentucky educational system in the areas offinance, governance, and curriculum. Six Kentucky Learning Goals were adopted as a part of
that legislation and the Council on School Performance Standards was charged with defining thesix goals in measurable terms. That work resulted in the identification of 68 "ValuedOutcomes" across the six Kentucky Learning Goals.
Simultaneously, the Kentucky Department of Education was charged with overseeing thedevelopment of a performance-based assessr,:ent system that would require students todemonstrate what they know and what they are able to do with the knowledge that they have
gained. The beginning phases of the Kentucky Instructional Results Information System (KIRIS)
were begun during the 1991-92 school year. In 1994, the legislature revised the scope of KIRISto include only four of the six Kentucky Learning Goals and required the Kentucky Departmentof Education to refine the 68 outcomes. Fifty-seven Academic Expectations are the result of
that revision.
Observations from the 1994 KIER Study on the Primary Program
During the Spring of 1994, the Kentucky Institute for Education Research (KIER)contracted with the Institute on Education Reform at the University of Kentucky to study the
patterns and extent of implementation of the Primary Program that had been mandated by KERA.Elements of performance assessment were studied in sixteen different components of the primary
program. While more detailed comparisons will be made later in the paper, overall indications
are that primary teachers continue to struggle with the same performance assessment issuesidentified in the earlier study.
An earlier KIER study on the implementation of the Primary Program in Kentucky(Bridge, 1994) reported that teachers were beginning to use a variety of performance assessments
but rarely involved students in self-assessment strategies. Most activities were teacher-initiatedand students were actively involved in only about one-half of the classrooms that were observed.
Few examples of student work were observed on display.
When compared with middle and high school teachers on these same issues, however,
elementary teachers, including primary teachers, generally reported a more frequent effort toimplement many practices related to performance assessment. Differences were observed,however, between primary (P 1-P4) and intermediate (4-5) teachers. The 1994 research effort
studied only primary teachers.
Is

Purposes of the 1995 Performance Assessment Implementation Study
The purpose of this study was to provide an initial picture of the patterns and extent of
implementation of performance assessment in classrooms across Kentucky. Specifically, the
purposes of the research were:
1. To determine the extent to which performance assessment was being implemented in the
classrooms of teachers in thirty-two randomly selected schools geographically distributed
across Kentucky
2. To identify successful implementation patterns and the factors influencing successful
practice
3. To develop recommendations for further embedding performance assessment in the
instructional process
4. To refine the Performance Assessment Configuration Component (PACC) Map for
performance assessment based on the initial gudy and suggest ways of using theinstrument for self-assessment and as a tool for further research
DATA COLLECTION PROCEDURES
Study Sample
During March and April, 1995, trained observers visited 32 schools across the eight
Regional Service Center Regions of Kentucky. A stratified random sampling technique was used
to select two elementary schools, one middle school, and one high school from each region.Because KIRIS testing had focused in the early phase on Language Arts, Mathematics, Science,
and Social Studies, six teachers from those disciplines were randomly selected at each middle
and high school for personal interviews. Three primary and three intermediate teachers were
selected from each of the participating elementary schools for personal interviews. Additionally,
all Language Arts, Mathematics, Science, and Social Studies teachers at the selected middle and
high schools, including interviewed teachers, were asked to complete a performance assessment
survey. All grade level teachers in the selected elementary schools were-asked to complete the
same survey. The survey contained both demographic questions as well as questions from the
PACC Map.
One hundred ninety-two teachers were interviewed and a PACC Map was completed for
each teacher. Three hundred and eight additional teachers in the same 32 schools were surveyed
using a questionnaire along with the interviewed teachers. A total of 500 surveys were analyzed.
Fifty percent of the 192 teachers interviewed were elementary, 25 percent middle school,
and 25 percent high school. Size differences between school levels and the return rates yielded a
2
19

and 25 percent high school. Size differences between school levels and the return rates yielded amore even distribution for the questionnaire data. Of the 500 teachers surveyed, approximately37 percent were elementary teachers, 31 percent middle school teachers, and 32 percent highschool teachers.
Comparisons by subject were made for this study. Of the 500 teachers surveyed,approximately 66 percent indicated that they taught a single subject, 28 percent taught more thanone subject, and 6 percent gave no response. For those responding teachers where a specificsubject area was taught, approximately 21 percent taught Language Arts, 17 percent taughtMathematics, 14 percent taught Science, and 14 percent taught Social Studies.
Teaching experience was represented by a fairly even distribution. Approximately 97percent of the teachers fell within the 1-30 years of service range. The distribution remainedfairly constant, declining slightly in five-year increments until the 25-30 years of service range.The percentage of teachers represented dropped sharply at 26 years of service and beyond.
While return rates varied from school to school, 308 additional, usable surveys werecollected from other teachers at these schools, providing a total of 500 surveys for analysis. Dataobtained from the survey allowed the researchers to make comparisons between self reports andobserver judgements obtained from interviews and allowed a broader comparison acrossdisciplines and levels.
Observer Training
A team of 12 field observers was assembled and trained to collect information on theimplementation of specific components of performance assessment using the PACC Map.Nearly all observers were professors from regional universities or colleges in Kentucky. Allobservers were familiar with performance assessment as an integral part of KERA.
The training of observers occurred during a two-day session in which they reviewed theinstrument, refined focused interview questions, and practiced using the PACC Map. Raterdifferences were discussed in order to gain better insight into what was being described in eachcomponent. Finally, research and site visitation protocols were reviewed for the study. Follow-up sessions were conducted with members missing the initial training.
Observers were instructed to make a decision on all components of the map and to recordtheir impressions and anecdotal comments on the map. Each observer was also asked to developa summary of impressions on the implementation of performance assessment based on theschools they visited and recommendations for improving the PACC Map.
3
20

Protocols
Site visit and data collection protocols were developed to ensure uniformity of thesampling process. The superintendent of the district and principal of each randomly selectedschool were notified by letter from the Kentucky Institute for Education Research requestingpermission to schedule site visits. The field observers contacted their selected schools to confirmparticipation in the study and established the times for visitation and interviews. Six of theoriginal 32 schools declined to participate. Alternate sites were selected from a list randomlygenerated.
Principals were asked to provide the observer with a listing of faculty members, thesubjects they taught, and their planning period. Where possible, the six teachers to beinterviewed were selected by the observer from that list. Principals were also asked to provideall appropriate staff members (interviewed and non-interviewed) with a copy of the performanceassessment survey prior to the site visit. The observer picked up_the surveys at the beginning ofeach interview and at the end of the site visit. A coding information sheetwas attached to eachPACC Map and survey to collect demographic information and to ensure confidentiality.Observers also collected voluntarily submitted samples of performance assessments and relatedartifacts that included sample assessment tasks, rubrics, scoring guides, open-ended questions,and other forms of evaluation. More than 300 artifacts were collected from the interviewedteachers.
Defining the Innovation: Performance Assessment
Performance assessment, unlike traditional forms of evaluation, focuses not only on whatstudent should know, but also on what they can do with what they know and in more realisticsituations or contexts. To effectively implement performance assessment, teachersmust examinenot only the way they assess student performance in their classrooms, but also the nature andquality of the performance expected (Hart, 1994; Schlechty, 1990; Wiggins, 1987, 1989, 1993).Moving from traditional standardized evaluations to new standard-setting evaluations is a majorchange in student evaluation. Teachers must not only be knowledgeable about how to use thedifferent types of assessments that are available to them, they must also think about how thisform of assessment changes the role that students play in the teaching and learningprocess.Analyzing a performance is more about learning than testing (Wiggins, 1993).
Development of the Performance Assessment Component Configuration Map
The primary research instrument used in this study was developed from a sharedconceptual framework for understanding the change process known as the Concerns BasedAdoption Model (CBAM). More than twenty years of research on the CBAM model centersaround three diagnostic dimensions of the change process: (a) stages of concern, (b) levels of useof the innovation, and (c) innovation configurations. Innovation configurations, as defined byHall and Hord (1987), focus on the extent to which a new program or practice resembles theintent or ideal of the developer.
4
21

The PACC Map was the instrument used in this study to assess the extent to whichcomponents of performance assessment have been implemented as proposed by the designers of
the Kentucky Education Reform Act (See Appendix A). An initial draft of the instrument wasdeveloped in the Spring of 1994 during a week of training and development by a team of school
teachers, school administrators, and college professors with an interest and expertise inperformance assessment. Early versions of the PACC Map were field-tested, revised, and
provided to more than 1,300 elementary, middle, and high schools across Kentucky for review
and comment. Feedback from practitioners was used in the Fall of 1994 to revise theimplementation maps in preparation for this study.
The PACC Map contains descriptions of different levels of implementation for eightmajor components. Five of those components have two or more sub-components. The eight
major components are:
1. Frequency of Use: How often students have an opportunity to use different types ofassessment. Nine types of assessment are identified
2. Content Focus: Contains two sub-components that describe linkage to standards and
breadth of content covered3. Quality of Peifonnance Assessments: Contains three sub-components of authenticity,
challenge and developmental appropriateness, and assessment materials4. Relationship of Assessment to Instruction: Defined in terms of the degree to which
assessment drives instruction and instruction drives assessment
5. Teacher Role in Petformance Assessment: Defines facilitation of learning and
interaction with students6. Student Role in Peiformance Assessment: Defines the extent of active engagement
students have in the assessment process7. Peiformance Standards: Contains three sub-components of communication to
students, congruence with KIRIS, and the relationship of standards to student
evaluation8. Evaluation and Feedback: Defines how often students have an opportunity to
experience or use different types of evaluation and feedback
Interview questions were developed for each component and sub-component of the
PACC Map to probe the teacher's understanding of the concepts represented and to facilitate the
observer's determination of the extent of implementation on a given component.
Development of the Performance Assessment Survey
The Performance Assessment Survey was developed from specific components of the
PACC Map (See Appendix B for survey). It was added as a data collection instrument to: (a)gather certain information quickly so that more time could be spent on components requiringfollow-up questions, (b) clarify and isolate sub-components not separated on the map, (c) collect
additional information not found on the map, and (d) increase the number of teachers analyzed in
5
22

the study. Comparison of interviewed and non-interviewed teachers allowed the researchers toevaluate the reliability of the sample obtained for the interview process.
In addition to demographic data, questions related to the use of resource documentsparticular to Kentucky provided helpful information on the extent to which support material wasaffecting the implementation of performance assessment in classrooms across the state. Somecomponents such as use of technology and hands-on manipulatives were separated to assess theextent to which each was used in performance assessment. Specific instructional strategies, suchas the use of rubrics, were identified and isolated to probe the extent of implementation of aparticular component.
Artifacts
Nearly three hundred artifacts related to performance assessment were collected duringthe site visits. While the extent of voluntary participation varied from school to school andteacher to teacher, an array of samples was collected including 55 performance tasks, 36 rubricsor scoring guides, 31 tests, and 73 open-ended questions. These data were used to estimate thequality of assessments being used as well as to learn more about their purpose, structure, andoriginality.
Analysis of the Data
Several statistical procedures were employed to analyze the PACC Map data obtainedfrom the interviews. An item analysis was done using the Spearman Rank-Order Correlation todetermine which items had high correlations with the overall average. High correlation ratingson specific items helped to determine which items contributed to high implementation of theinnovation.
Cluster analyses were performed to identify groups of interviewed teachers whoresponded similarly on certain items. Eight different clusters were identified. Discriminantanalysis procedures were used to identify high and low fidelity users of the innovation as well asfactors which distinguished high groups and low groups. Using group membership as theindependent variable and PACC Map item rating as the dependent variable, tests of significancewere used to identify items which best discriminated between the groups.
Cross-tabulations of item ratings were conducted on the PACC Map and survey data.The additional demographic data and additional questions on the survey provided informationuseful in explaining observed differences among clusters, groups, and levels.
6
23

RESULTS OF THE INTERVIEWS
A General Pattern of Implementation
Based on the results of the configuration map, the interview notes, and the survey, the
description of the status of current implementation of performance assessment was developed. It
is important to note that this study pulls together the observations of many people and at three
different school levels. The teachers who were interviewed and surveyed varied considerably in
their understanding and implementation of this innovation. The profiles, therefore, are not
indicative of any one classroom or school.
Performance assessment appears to be a complex innovation with several critical
components. At this stage of statewide implementation, patterns are more observable at the
classroom level rather than schoolwide. Teachers within the same school can vary considerably
in their understanding and use of performance assessment. Use of the innovation does not
guarantee quality or complete mastery of essential elements. Understanding and using the
structures of performance assessment appear to precede the transformation of student learning
and evaluation that can result from understanding and embracing a performance-based approach
to teaching and learning.
Not surprisingly, KIRIS testing is having an impact on the use of performance
assessments in classrooms across the state. More than 60 percent of the teachers interviewed
appeared to be using performance assessment on a regular basis. These teachers report using a
variety of assessment strategies, but particularly the use of open-ended questions and portfolio
tasks or prompts. Performance Event Tasks are often used although less frequently. There is,
however, a confusion about the meaning of terms used to describe different types of performance
assessment. Terms such as "performance task," "portfolio task," and "culminating performance"
were often used interchangeably by interviewed teachers as they described the types of
assessment that they were using in their classrooms.
Many teachers still separate the preparation for KIRIS testing from the assessment
strategies that are normally used in their classrooms and focus more intently on specific types of
tests and strategies for taking the test. Some schools alter the school day to give students more
exposure to open-ended questions. Other schools, elementary in particular, have identified an
individual teacher who provides students with practice in performance event tasks. Teachers at
grade levels where KIRIS testing occurs appear to be engaging in performance assessment more
than teachers at grade levels where KIRIS testing does not directly affect them. This seems
particularly true at the elementary level. Primary teachers are far less likely to engage in
performance assessment activities than their intei ,dediate (grades 4-5) counterparts.
Progress toward the implementation of performance assessment varies considerably on
many of the individual innovation components. There is a wide range in the depth of
understanding of what certain components require to be effectively implemented. For example,
identifying the standards for a particular performance is a critical component of performance
7
24

assessment. For this type of assessment approach to be effectively implementegl, students shouldknow, in advance, what is expected of them and what good work in this area looks like. While amajority of the teachers interviewed and surveyed indicatedthat they developed standards forperformance, many teachers preferred to explain them orally and did not provide the studentswith any written description of the standards. When pressed for an explanation, several teacherssaid that they were not sure if they were supposed to be that specific. One teacher cited KIRIStesting as the reason, saying that the standards were not known in advance or during the testing
process.
Although frwre are few studies with which to compare the classroom useof assessmentstrategies since the implementation of KERA, performance assessment appears to be a
component of KERA that is taken seriously and is being implemented to some degree in mostKentucky classrooms. The differences reported are matters of degree rather than implementation
or non-implementation. The extent of implementation and the differences observed are reportedin this study by high implementors and low implementors of performance assessmentcomponents, grade level, subject area taught, and years of experience. The results of theinterviews and survey are organized around the eight major components of the PACC Map.
Extent and Patterns of Implementation Based on the Configuration Map Data
Based on the data obtained and knowledge about what is required for implementation ofperformance assessment, a dotted line was placed on each component of the configuration map to
separate adequate implementation from implementation efforts perceived to be inadequate.Tables 1 to 8 show the percent of teachers judged to be implementing agiven component ofperfOrmance assessment at various levels. Teachers who were rated to the left of the dotted line
were perceived to be adequately implementing that component of performance assessment.Teachers who were rated to the right of the dotted line were judged not to be implementing thatcomponent of performance assessment in an adequate manner. In many instances, variation A(the first column) has been judged to be the ideal. This is not true in all cases, however, and thereader is cautioned to consider the reality of the statement. For example, in studying thefrequency of different types of assessments, the first variation for this study was "daily." It is notreasonable to expect, however, that teachers or students would be involved with "culminatingperformances" or "projects" on a "daily" basis or that daily would be the most desirablebehavior. For this initial study, the ideal behavior has not been identified.
The following descriptions of results for each component of the configuration map are based onteacher's comments during the interviews and observer ratings of perceived performance levels
based on those interviews.
Frequency of Use of Different Types of Assessment. Table 1 presents the data on the
frequency of use of nine different types of assessment. They are: (a) open-ended questions(oral),(b) open-ended questions (written), (c) performance event tasks, (d) portfolio tasks or prompts,
(e) culminating performance, (f) projects, (g) traditional assessment of discrete skills,
8
25

TABLE 1
Percent of Teachers Judged to be Implementing Nine Types of Assessmentat Various Levels of Use
Open-Ended Ouestions (Oral)C D
End of Unit Once or twice a year5% 5%
ENo Response
7%
A B
Daily Weekly49% 34%
Open-Ended OuestionslWrittenlC D
End of Unit Once or Twice a year28% 5%
ENo Response
5%
A B
Daily Weekly13% 50%
Performance_ExentIacks (On demand. one-hour tasks)D
Once or Twice a year22%
ENo Response
15%
A B C
Daily Weekly End of Unit
1% 22% 40%
Patictlisaaki.41-ELQM1211A B C
Daily Weekly End of Unit
16% 22% 40%
DOnce or Twice a year
22%
ENo Response
15%
Culminating PerformanceA
Daily0%
B CWeekly End of Unit
5% 62%
. DOnce or Twice a year
10%
ENo Response
23%
projectsA
Daily3%
B CWeekly End of Unit
15% 50%
DOnce or Twice a year
20%
ENo Response
14%
Traditional Assessment of Discrete Ski 11RC
End of Unit32%
DOnce or Twice a year
7%
ENo Response
10%
A B
Daily Weekly11% 41%
ConferencingA
Daily26%
B C
Weekly End of Unit34% 16%
DOnce or Twice a year
14%
ENo Response
9%
Anecdojal RecordsB C
Weekly End of Unit22% 21%
DOnce or Twice a year
14%
ENo Response
34%
ADaily
9%
9
26

(h) conferencing, and (i) anecdotal comments. The frequency of occurrence was identified asdaily, weekly, end of unit, and once or twice a year. The dotted line is a judgement by theresearchers regarding an acceptable level of implementation at this stage of performanceassessment use across the state.
While the threshold for implementation versus non-implementation varied by the type ofassessment, more than half of the teaChers interviewed reported using one or more of theassessment types at or above the frequency considered crucial for implementation. During thistime period, 84 percent of the interviewed teachers reported using traditional assessment ofdiscrete skills, 76 percent used conferencing strategies, 68 percent used projects, 67 percent usedculminating performances, 63 percent used performance event tasks, and 52 percent usedanecdotal records.
Content Focus. Table 2 shows the percent of teachers judged to be implementingperformance assessment in their classrooms with respect to the content focus of the performanceassessment used. Linkage of tasks to Kentucky's Academic Expectations and covering a broadrange of content were two sub-components of content focus.
TABLE 2
Percent of Teachers Judged to be Implementing Performance Assessmentat Various Levels of Content Focus
Linkage to SiandarthA
All tasks have a clear linkto Academic Expectations
18%
Most tasks have a clear linkto Academic Expectations
47%
Some tasks have a clear linkto Academic Expectations
25%
Almost no tasks have a clearlink to Academic Expectations
10%
Breadth of Content
AAssessment tasks address abroad range of content acrossAcademic Expectations inseveral Learning Goals
Assessment tasks mostlyaddress a range of contentacross Academic Expectationsunder one Learning Goal
Assessment tasks address alimited range of content andfocus on only a few AcademicExpectations
Assessment tasks address avery narrow range of contentand focus on one or twoAcademic Expectations
50% 24% 19% 8%
What content is covered and how content is selected is a major decision for teachers. Thiscomponent considers the extent to which teachers use the Academic Expectations, ContentGuidelines, and national standards documents to shape the scope of the content. While the
10
27

Academic Expectations provide a framework for making curriculum decisions, many teacherscontinue to struggle with what will be taught and what will be left out during the course of aschool year. Based on the comments of interviewed teachers, it appears that some teachers areusing the Academic Expectations to fundamentally rethink what it is that they will teach and theirstudents will learn. In these instances, the Transformations document appears to be a valuableresource for planning and developing the curriculum. Other teachers may refer occasionally toTransformations but are more likely to use the state content guidelines as a means of aligningtheir current curriculum.
Two specific areas were studied under the Content Focus component: (a) Linkage toStandards defined the extent to which teachers were linking their assessments to the AcademicExpectations, and (b) Breadth of Content defined the extent to which the content covered andassessed was related to one or more KERA Kentucky Learning Goals and AcademicExpectations.
Linkage to Standards. Teachers are generally familiar with the Academic Expectations,especially in their content area. The change from valued outcomes to learner outcomes toAcademic Expectations, however, has created some confusion. The extent of linkage ofexpectations to assessments varies, but 65 percent of the teachers interviewed report thatmost activities and assessments have a clear link to the Academic Expectations. Someteachers connect every activity in class to an academic expectation. Others use theexpectations to organize themes or units of study. Ten percent of the interviewed teachers,however, state that almost none of the assessments that they use have a clear link to theexpectations. Transfornwtions: Kentucky's Curriculum Framework is the primary sourcefor gaining information about the Academic Expectations and correspondingdemonstrators. Some districts and schoOls have also provided short lists, quick referenceguides, or lesson plan outlines that contain these expectations. There are still teachers,however, who report that they do not possess a personal copy of the Transformationsdocument or a copy of the Academic Expectations.
Breadth of Content: The nature of the KERA Learning Goals and Academic Expectationsmakes it possible to develop assessment strategies that cover more than one learning goal orAcademic Expectation. For example, a subject area assessed in Goal LI might beaccomplished in such a way as to require students to use problem-solving strategies(Goal V) or to demonstrate an ability to consider multiple perspectives (Goal VIcomponent). Fifty percent of all interviewed teachers report that they use assessments thataddress a broad range of content across Academic Expectations and more than one learninggoal. An additional 24 percent of the interviewed teachers address a range of contentacross Academic Expectations under one Learning Goal.
Quality of Performance Assessments. Table 3 presents the percent of teachers usingperformance assessments with respect to different levels of quality. Quality was definedby: (a) the linkage of the tasks to the real world of the student, (b) the developmental
11
28

appropriateness of the task for the learning level of the student, and (c) the use oftechnology and/or "hands-on" manipulatives where possible.
TABLE 3
Percent of Teachers Judged to be Implementing Performance Assessmentat Various Levels of Quality
Authenticity(content link to the real world
AAll assessments presentproblems and challenges thathave a direct link to the realworld of the student.
of the student)
Most assessments presentproblems and challengesrelated to the real world ofof the student.
10% 49%
Some assessments presentreal-life applications; howevermany assessments come fromtextbook material that presentshypothetical or contrivedsituations.
36%
Assessments are mostlycontrived situations that havelittle relationship to thestudent's world of experience
5%
Challenge and Developmental Appropriateness(challenging, engaging, developmentally appropriate)
ANearly all assessments are Most assessments arechallenging and engaging to challenging and engaging.each student. Assessments Some assessments appearstretch the student's to be too advanced or tooperformance without requiring elementary to engage themore than can be expected. student.
22% 50%
Some assessments arechallenging and engaging:however, most assessmentsappear like end-of-chapterquestions or activities.
25%
Most assessments do notappear to be challenging orengaging to the student.Many seem too advanced ortoo elementary for the student
3%
Assessment Materials(use of technology and/or hands-on
manipulatives)A
Most assessments in-volve the use of tech-nology and/or hands-on manipulatives thatengage the student inactive learning.
21%
Some assessments in-volve the use of tech-nology and/or manipulatives that engage thestudent in activelearning.
33%
Occasionally, assessmentsrequire the use of tech-nology and/or manipu-latives. Most assessmentsrequire only paper andpencils to complete tasks.
Assessments generally The student has little ordo not require the use no opportunity to useof technology or man- performance assessmentipulatives. Textbooks, materials.paper, and pencils arethe standard materialsneeded for assessment.
26% 19% 2%
Developing quality performance assessments requires not only a thorough understanding ofa performance-based approach to evaluation, but also an ability to incorporate essential elements
12
29

that motivate the learner. Three specific areas were studied under this component. Authenticitydescribed the extent to which the content taught was linked to the real world of the student.Challenge and Developmental Appropriateness described the extent to which assessment taskswere both challenging and engaging as well as developmentally appropriate. AssessmentMaterials described the extent of use of various forms of technology and/or manipulatives.
Authenticity. A majority of the teachers interviewed reported that they made an effort todevelop authentic assessments. Nearly 60 percent indicated that most of the problems orassessment tasks they developed were related to the real world of the student. A variety ofexamples were given and many centered around writing or math assignments. Science labswere also given as examples. Understanding of the term "authenticity" appears to vary andsimulations are considered by many teachers to be an appropriate example.
Challenge and Developmental Appropriateness. Most teachers reported that they weresensitive to the need for making assessments challenging and engaging as well asdeveloping them at an appropriate level of difficulty. Many also acknowledged, however,that they relied on traditional forms of assessment. Several methods for accomplishingeach of these goals were described. Developmental appropriateness was most oftenachieved through selecting tasks that allowed for varying ability levels or using higher leveltasks and then requiring different levels of performance for different students. Interviewedteachers often defined "challenge" in terms of accountability for a grade or use of higherlevel materials. Student engagement was approached through the use of hands-onactivities, various forms of technology, and a general effort to select topics and subjects thatteachers perceived were of interest to students.
Assessment Materials. Over half of all interviewed teachers indicated that at least some oftheir assessment of student performance required some form of technology or hands-onmanipulatives. Computer technology was most often used for writing or math portfolioassignments. Access appears to be a problem for some teachers. They report that manycomputer labs are being used extensively for Language Arts, specifically the writingportfolio. When the labs are available, teachers use them for both assessment and non-assessment activities including typing the results of performance events, drill and practiceactivities, and games. High school teachers are more likely to use technology forassessment activities than elementary or middle school teachers. The use of hands-onmanipulatives for assessment varies considerably. Elementary teachers are more likely touse hands-on matenals in assessment than middle school or high school teachers. Scienceteachers are also more likely to use these materials than teachers of other subject areas.
Relationship of Assessment to Instruction. Table 4 presents the percent of teachers using
performance assessment with respect to the degree of relationship between assessment and
instruction.

TABLE 4
Percent of Teachers Judged to be Implementing Performance Assessmentat Various Levels of Relationship to Instruction
ATeachers always useassessment to drivesubsequent instruction,and instruction alwaysdrives subsequentassessment.
15%
Teachers largely useassessment to drivesubsequent instruction,and instruction largelydrives subsequentassessment.
38%
Teachers sometimes useassessment to drive sub-sequent instruction, andinstruction sometimesdrives subsequentassessment.
28%
Teachers infrequentlyuse assessment to drivesubsequent instruction,and instruction infre-quently drives sub-sequent assessment.
17%
Teachers never useassessment to drive sub-sequent instruction, andinstruction never drivessubsequent assessment.
3%
While KERA stresses the interconnection of curriculum, instruction, and assessment, the
degree to which that occurs varied widely among interviewed teachers. Over half of the teachersinterviewed indicated that they largely used assessment to drive subsequent instruction and
instruction to drive subsequent assessment. KIRIS testing, however, has caused many teachers toview assessment as driving instruction. Few examples were given that showed how instructionmight drive subsequent assessment. Some teachers indicated that poor student results on aparticular assessment might cause them to reteach the content, but they were also likely to note
changes for next year as opposed to taking the time to reteach.
The KIRIS Assessment Curriculum Report provided by the Kentucky Department of
Education in the Fall of each year offers the most relevant information for assessing studentperformance on the Academic Expectations. While the document is familiar to seven of tenteachers, fewer teachers indicated that they actually used the data to assess areas of strength andweakness. Seldom were the data on subject area reporting categories compared across two or
more years to analyze changes in performance.
Teacher Role in Performance Assessments. Table 5 presents the percentof teachers
performing different roles as they interact with students during performance assessment in their
classrooms. The various interactive roles include motivating, challenging, facilitating, coaching,
giving feedback, and dispensing information. Many teachers are playing multiple roles as they
work with students on assessment issues. Facilitatorand coach were used to describe teacher
roles almost as much as a monitor. Two-thirds of the interviewed teachers indicated that they
spent most of their time interacting with students by motivating, challenging, encouraging,inviting reflection, and giving feedback during part or all of the assessment process. Ontraditional forms of assessment, however, teachers still assumed the monitor function andprovided students with very little assistance. Teachers appear to be examining their role in the
assessment process and opting for more interactk

TABLE 5
Percent of Teachers Judged to be Using Different Rolesto Implement Performance Assessment
AThe teacher interacts with thestudent by motivating, chal-lenging, encouraging, invitingreflection and giving feedback.
23%
Most of the time theteacher interacts with thestudent by motivating,challenging, encouraging,inviting, reflection andgiving feedback.
43%
Some of the time the teacherinteracts with the student bymotivating, challenging, en-couraging, inviting, reflectionand giving feedback.
25%
Little interaction between theteacher and the student ;teacher is dispenser of know-ledge/giver of tests.
9%
Student Role in Performance Assessments. Table 6 represents the percent of teachersestablishing different student roles as a means for implementing performance assessment. Theroles represent a range of active involvement and responsibility for the student.
TABLE 6
Percent of Teachers Judged to be Utilizing Different Student Rolesin Implementing Performance Assessment
AThe student is a problem-giver,a team-maker, a producer ofknowledge, an investigator, andand a user of resources.
32%
The student is supervised by theteacher as a knowledge workerand is viewed as a completer oftasks.
54%
The student is a passive "test-taker"and a completer of assessment items.
13%
A number of teachers reported that students were involved in group work and oftenassumed roles of team leader, recorder, or project manager. A third of the teachers interviewedindicated that they had their students involved in real problem solving and investigative roles.Over half of the teachers reported that students were involved with completing assessment tasks.A small number of teachers (i.e., -13 percent) viewed students as only passive takers of tests.Based on teacher comments during the interview, students appear to be more actively involved inassessment activities. The work assigned, however, is predominantly teacher generated and moststudents i more likely to be completers of tasks than problem generators or investigators.
15
32

Performance Standards. Table 7 represents the percent of teachers judged to beimplementing performance assessment in their classrooms with respect to several issues relatedto standards. Standards used were defined by three factors: (a) the communication ofperformance standards to students, (b) the congruence of performance standards with KIRISmodels, and (c) the relationship of the performance standards to student evaluation.
TA,BLE 7
Percent of Teachers Judged to be Implementing Performance Standardsat Different Levels of Clarity, Congruence, and Relationship to Learning
Standards of Communication to(clarity, examples)
AStandards of performance areclearly explained and activelycommunicated to the studentin advance of assessments. Avariety of examples showingdifferent levels of performanceare on display for the student.
36%
Students
Standards of performanceare developed and stated,but, there are few, if any,indicators or examples ofstudent performancegiving feedback.
36%
Standards of performance arenot fully developed or clearlystated. Performance is judgedby the teacher and is mostlysubjective.
24%
Standards of performancefor student work in schoolhave not been developed.
4%
Standards of Congruence with_KIRIS(degree of congruence)
APerformance standards used inthe classroom are completelycongruent with standards used inKIRIS scoring guides.
15%
Performance standards used inthe classroom have somerelationship to the standards usedIn KIRIS scoring guides.
54%
Performance standards used in theclassroom have little or no relation-ship to standards used in KIRISscoring guides.
30%
Relationship of Performance Standards to Student Evaluation(degree of relationship)
AThe student's work on Perform- The student's work on Perform-ance Assessment is the dominant ance Assessment is a contributingevaluating factor in reporting factor in evaluating and reportingstudent learning progress. student progress.
26% 65%
The student's work on PerformanceAssessment contributes little ornothing to evaluation of the learningprogress.
9%
Well-developed performance assessments not only specify what is to be accomplished, theyalso define how well the work must be accomplished. The standards are "clearly articulated andcompelling" (Schlechty, 1990), contain examples of quality work, and are known in advance byeveryone. Three specific areas were studied under this component. Standards ofCommunication to Students described the extent to which performance standards were
16
33

developed, known in advance, and supported by samples of quality work. Standards ofCongruence identified the degree of congruence between the teacher's standards and those used
in the KIRIS scoring guides. Relationships ofPerformance Standards to Student Evaluation
described the degree to which students' work on performance assessments determined the report
on their progress.
Standards of Communication to Students. Most teachers recognized a need forcommunicating performance expectations to students. Nearly three-fourths of all the
teachers interviewed indicated that they developed and stated performance standards forstudent work. A third of those same teachers reported that they provided examples of whatgood student work looked like. Many teachers are learning about or are using rubrics as a
way of communicating performance expectations. Some teachers also report a reluctance
to provide students with direct examples for fear that they will mimic the work presentedand not do their own thinking. Many teacher examples of standards are course or unitexpectations of performance rather than standards for specific performance tasks. A gooddeal of communicating of standards is still done orally as opposed to providing students
with hard copy.
Standards of Congruence with KIRIS. Over half of the teachers interviewed indicated that
they had referred to the performance standards outlined in the KIRIS scoring guides, butonly 15 percent reported using them on a regular basis. When specific use was mentioned,
the open response scoring guides and writing portfolio scoring guides were the most
frequently mentioned.
Relationship &Performance Standards to Student Evaluation. Nine out of ten teachersinterviewed indicated that students' work on performance assessments was at least a
contributing factor in evaluating and reporting their progress. A fourth of those same
teachers indicated that it was the dominating factor in reporting student learning progress.
There appears to be a blending of old and new practices as teachers explore new ways toevaluate student performance. Point systems and grade averages exist alongside of student
exhibitions of mastery as teachers try to accommodate new forms of evaluation.
Evaluation and Feedback. Table 8 presents the data on the frequency of use of five types
of evaluation and feedback: (a) the extent to which students evaluate or reflect on their own
work, (b) the extent to which students audit other students' work. (c) the extent to which teachers
evaluate work and give feedback, (d) the extent to which teachers cooperate with the student in
the evaluation of student work, and (e) the extent to which teachers display student work.
When performance assessment is properly implemented, evaluation and feedback occur in
several ways. The teacher and the student differentiate between work in progress and finished
17
34

TABLE 8
Percent of Teachers Judged to be Implementing Different Types of Evaluation
. and Feedback at Different Levels of Use
Students evaluate and reflect on own work
C D EEnd of Unit End of Grading No Response
Period9% 3% 5%
A B
Daily Weekly
42% 41%
Students audit other students' work
CEnd of Unit
21%
D EEnd of Grading No Response
Period
5% 13%
A B
Daily Weekly
11% 51%
Teacher evaluates or audits student work
C D E
End of Unit End of Grading No ResponsePeriod
8% I% 0%
Ang gives feedback
A B
Daily Weekly
61% 30%
Evaluation is a cooperative effort between teacher and student
A B C
Daily Weekly End of Unit
28% 35% 17%
D EEnd of Grading No Response
Period
7% 12%
Student work is displayed
A B C
Daily Weekly End of Unit
12% 42% 30%
D EEnd of Grading No Response
Period
9% 7%
18
35

work and the evaluation or feedback provides the student with both bearing and direction. The
type and frequency of five specific types of evaluation and feedback were studied.
Student Self-Evaluation and Reflection. Based on the interviews, most teachers allow
or encourage students to evaluate and reflect on their own work. Eighty-three percent of
the teachers interviewed indicated that they used this approach on a daily or weekly basis.
The type of self evaluation varies and may include grading one's own paper, checking
against a rubric, proofreading, asking students to write an evaluation of their own work,
or correcting work based on comments from other students or the teacher.
Students' Audit Other Students Work. Many teachers are encouraging or requiringstudents to audit other students' work. More that 60 percent of the teachers interviewedindicated that they used peer review on a daily or weekly basis. Over 80 percentindicated that they used peer review within a unit of study. Much of this peer auditing
occurs around writing assignments. In addition to students checking other students'work, a number of teachers are having students work in pairs to read each other's work or
to ask each other focusing questions. This occurs more frequently above the primary
level.
Teacher Evaluation and Feedback. Nine out of ten teachers who were interviewed
provide students with some form of evaluation and/or feedback on a daily or weekly
basis. In addition to routine grading of papers, many teachers are taking the time to write
comments to students and conference with students about their work. Interviewedelementary teachers are using conferencing strategies more frequently than either middle
school or high school teachers.
Evaluation as a Cooperative Effort. Many of the interviewed teachers report that they
conference with the student about the student's work. While most teachers seem to make
the final decision about a student's grade, some teachers did report that they might allow
the conference to change their position on a particular evaluation. Elementary and middle
school teachers used this strategy more frequently than high school teachers.
Display of Student Work. Eight out of ten interviewed teachers reported that they had
displayed some student work. The display often tended to be more for total classroom
and less as a strategy for providing exemplary models. Some teachers expresseddiscomfort with publicly identifying and singling out individual work of students they
were presently teaching. Others indicated that they would do so anonymously and often
only with other classes. Few teachers indicated that they had saved exemplary work from
previous years to use as models. Finally, elementary teachers displayed student work
more frequently than middle or high school teachers.
19
36

Comparison of High and Low Implementors
In an effort to identify which sub-components of performance assessment were most
critical to high implementation, Spearman Rank-Order Correlation Coefficients were computed
for each of the 25 sub-components on the PACC Map. These are presented in Table 9. Those
components with higher correlation coefficients were the most indicative of overall high
implementation. In other words, those items with high correlation were the sub-components that
separated high implementors from low implementors. Sub-components with low correlation
coefficients were poor predictors of high implementation.
TABLE 9
Spearman Rank-Order Correlations: Overall Average With Itemson the Performance Assessment Component Configuration Map
Component/Sub-component
CorrelationCoefficient Probability
Relationship of Assessment to Instruction 0.66861 0.0001
Assessment Materials 0.63599 0.0001
Challenge and Developmental Appropriateness 0.62899 0.0001
Breadth of Content 0.62251 0.0001
Teacher Role in Performance Assessment 0.59265 0.0001
Authenticity 0.58608 0.0001
Student Role in Performance Assessment 0.58411 0.0001
Linkage to Standards 0.56552 0.0001
Performance Standards 0.53768 0.0001
Evaluation is a Cooperative Effort 0.53342 0.0001
Standards of Congruence with KIRIS 0.51686 0.0001
Conferencing 0.48625 0.0001
Portfolio tasks/Prompts 0.48377 0.0001
Teacher Evaluates/Audits and Gives Feedback 0.42865 0.0001
Open-ended Questions (Written) 0.40682 0.0001
Relationship of Performance Stds. to Student Evaluation 0.38627 0.0001
Performance Event Tasks (one-hour on-demand tasks) 0.37744 0.0001
Student work is displayed 0.36441 0.0001
Anecdotal Comments 0.36170 0.0001
Open-ended Questions (Oral) 0.35578 0.0001
Students Audit Other Students' Work 0.29540 0.0001
Projects 0.29321 0.0001
Students Evaluate/Reflect on Own Work 0.28592 0.0001
Traditional Assessment of Discrete Skills 0.23306 0.0011
Culminating Events 0.13623 0.0595
n=192
20
37

From Table 9, it is evident that Relationship of Assessment to Instruction, Assessment
Materials, Challenge and Developmental Appropriateness, and Breadth of Content are the most
critical to high implementation and are the mast used by teachers leading the study sample in
overall implementation. Challenge 6:nd Developmental Appropriateness and Assessment
Materials are two sub-components of Quality of Peifonnance Assessments. Breadth of Content is
a sub-component of Content Focus. It should also be noted that Authenticity, a third sub-
component related to quality, along with Teacher Role and Student Role in performanceassessment were found to be toward the high end of the rank order correlation as well. Types of
assessment and evaluation and feedback items showed the least relatiorWlip with any other item.
Interestingly, the use of different types of performance assessment is no predictor of highimplementation. Low implementors are just as likely to usevarious performance assessment
strategies on a frequent basis as high implementors. This suggests that many teachers are
beginning to use a variety of performance assessments but not necessarily attending to the other
critical components that can make performance assessment a powerful tool for learning. They
are experimenting with the structural aspects of using a performance-based approach for
evaluation, but may be struggling with ways to link assessments directly to real-world issues.
Preliminary analysis of the artifacts submitted indicates a variety of assessment types are being
used; the quality of those assessments also varies considerably.
Teachers With Similar Patterns of Implementation
In an effort to group teachers according to similar patterns of implementation, a Cluster
Analysis was used. In this analysis, teachers were grouped into clusters based on two factors: (a)
similarity of overall implementation scores, and (b) similarity of patterns of high and low
implementation of the various sub-components. The 192 teachers were grouped into Clusters 1
through 7, with Cluster 0 containing a group of outliers that did not fit any of the other clusters.
Table 10 shows the percent of teachers "successfully" implementing each of the 25 sub-
components for each of the Clusters 0-7. Some general characteristics of each cluster follow:
Cluster 0- Teacher practices related to performance assessment in this group tend to bescattered across non-critical components and to be low on the components that are
represented by high implementation. All three school levels are represented, but
the percent of high school teachers exceeds their percent of representation in the
study sample.
Cluster 1- Teacher practices related to performance assessment in this group are most
characteristic of low implementation. As a group they are least likely to be
concerned about issues of challenge and developmental appropriateness,relationship of assessment to instruction, and linkage to standards. They have the
fewest percent of teachers successfully implementing 19 of the 25 subcomponents
of performance assessment. All three school levels are represented, but the
percent of middle school teachers is higher than their percent of representation in
the study sample while elementary teachers are under-represented.
21
38

Cluster 2- Teacher practices related to performance assessment in this group are mostly thecharacteristic of high implementation. As a group they are more likely to beconcerned about issues of challenge and developmental appropriateness,relationship of assessment to instruction, and linkage to standards. All threeschool levels are represented, but the percent of elementary school teachersexceeds their percent of representation in the study sample and middle schoolteachers are under-represented.
Cluster 3- Teacher practices related to performance assessment in this group have varyingcharacteristics of high implementation, but as a group correlate less strongly withitems such as portfolio tasks and prompts and evaluation and feedback issues. Allthree school levels are represented, but the percent of elementary school teachersexceeds their percent of representation in the study sample while high schoolteachers are under-represented.
Cluster 4- Teacher practices related to performance assessment in this group have varyingcharacteristics of low implementation, and as a group correlate less strongly withitems such as portfolio tasks and prompts and evaluation and feedback issues. Nomiddle schools are represented; consequently, elementary and high schoolteachers exceed their percent of representation in the study sample.
Cluster 5- Teacher practices related to performance assessment in this group have fairlystrong characteristics of high implementation, but as a group correlate the leastwith items such as portfolio tasks and prompts and evaluation and feedbackissues. Elementary school teachers are the dominant population of this group withan under-representation of middle school teachers and no high schools teachers.
Cluster 6- Teacher practices related to performance assessment in this group have varyingcharacteristics of low implementation, but as a group correlate more strongly withitems such as portfolio tasks and prompts and evaluation and feedback issues. Allthree school levels are represented, but the percent of middle school teachersexceeds their representation in the study sample with elementary teachers beingunder-represented in the population.
Cluster 7- Teacher practices related to performance assessment in this group represent themid-range of implementation, but as a group correlate highly with items such asportfolio tasks and prompts and evaluation and feedback issues. All three schoollevels are represented, but the percent of high school teachers exceeds theirrepresentation in the study sample with elementary teachers being under-represented.
22
39

TA
BL
E 1
0
Clu
ster
Ana
lysi
s of
Per
form
ance
Ass
essm
ent C
ompo
nent
Con
figu
ratio
n M
apPe
rcen
t of
Tea
cher
s Su
cces
sful
ly I
mpl
emen
ting
Perf
orm
ance
Ass
essm
ent C
ompo
nent
COMPONENT
CLUSTER 0
CLUSTER 1
CLUSTER 2
CLUSTER 3
CLUSTER 4
CLUSTER 5
CLUSTER 6
CLUSTER 7
OP
EN
-EN
DE
D Q
UE
ST
ION
S (
OR
AL)
69
69
97
90
100
100
89
74
OP
EN
-EN
DE
D Q
UE
ST
ION
S (
WR
ITT
EN
)32
34
92
84
71
76
84
42
PE
RF
OR
MA
NC
E E
VE
NT
TA
SK
S42
48
78
68
29
71
84
72
PO
RT
FO
LIO
TA
SK
S/P
RO
MP
TS
84
79
93
99
100
92
94
79
CU
LMIN
AT
ING
PE
RF
OR
MA
NC
E58
45
74
79
100
62
89
63
PR
OJE
CT
S53
48
78
73
85
38
84
84
TR
AD
. AS
SE
SS
Dis
cret
e S
KIL
LS85
83
73
79
100
85
84
94
CO
NF
ER
EN
CIN
G43
76
86
95
100
92
72
69
AN
EC
DO
TA
L C
OM
ME
NT
S32
41
67
69
47
46
56
47
LIN
KA
GE
TO
ST
AN
DA
RD
S26
24
100
74
43
77
89
84
BR
EA
DT
H O
F C
ON
TE
NT
42
24
100
68
100
100
94
100
AU
TH
EN
TIC
ITY
(R
EA
L W
OR
LD)
42
14
100
58
57
62
50
94
CH
ALL
EN
GE
/DE
VE
LOP
AP
PR
OP
RIA
TE
43
31
100
85
71
84
83
90
AS
SE
SS
ME
NT
MA
TE
RIA
LS27
13
93
74
58
46
44
79
RE
LAT
ION
SH
IP A
SS
ES
S/IN
ST
RU
CT
43
10
88
63
14
62
44
79
TE
AC
HE
R R
OLE
IN P
ER
F. A
SS
ES
S.
42
17
89
73
29
92
95
90
ST
UD
EN
T R
OLE
IN P
ER
E A
SS
ES
S.
63
62
86
92
100
100
100
95
23
4041

TA
BL
E 1
0 (c
ontin
ued)
Clu
ster
Ana
lysi
s of
Per
form
ance
Ass
essm
ent C
ompo
nent
Con
figu
ratio
n M
apPe
rcen
t of
Tea
cher
s Su
cces
sful
ly I
mpl
emen
ting
Perf
orm
ance
Ass
essm
ent C
ompo
nent
COMPONENT
CLUSTER 0
CLUSTER 1
CLUSTER 2
CLUSTER 3
CLUSTER 4
CLUSTER 5
CLUSTER 6
CLUSTER 7
PE
RF
OR
MA
NC
E S
TA
ND
AR
DS
48
52
100
95
57
54
78
79
SID
S O
F C
ON
GR
UE
NC
E W
ITH
IOR
IS37
38
93
95
43
84
95
68
RE
L P
ER
E. S
IDS
. TO
ST
UD
EN
T E
VA
L.79
69
100
95
100
100
100
100
ST
UD
EN
TS
EV
AU
RE
FLE
CT
OW
N W
OR
K68
65
96
95
100
100
83
73
ST
UD
EN
TS
AU
DIT
OT
HE
RS
WO
RK
47
79
93
94
100
85
89
85
TC
HR
EV
AU
GIV
FS
FE
ED
BA
CK
74
93
100
100
100
100
78
89
EV
AL
IS C
OO
PE
RA
TIV
E E
FF
OR
T37
76
94
95
99
92
61
95
ST
UD
EN
T'S
WO
RK
IS D
ISP
LAY
ED
67
67
93
100
100
92
67
100
24
4243

A comparison of Cluster 2 (high implementors) with Cluster 1 (low implementors)highlights, again, the areas that distinguish successful implementation of performanceassessment. It would appear that higher implementors are teachers who view curriculum,instruction, and assessment as interconnected are thinking through the deeper issues ofperformance assessment. They are more likely to think about how to assess a range of LearningGoals and Academic Expectations and how to use a variety of materials to engage and challengestudents. Use of a type of assessment strategy is not seen as an end in itself, but rather as ameans by which students explore the richness of their discipline and make connections betweenwhat is taught and the real world. They are experimenting with new roles and relationshipsbetween the teacher and the student and expecting students to be more actively involved in thelearning process. While teachers in Cluster 2 are outperforming teachers in Cluster 1 in everycomponent but one (traditional assessment of discrete skills), there is less difference betweenthese two groups when comparing the frequency of use of performance assessments and types ofevaluation and feedback. These two areas provide the least information in determining successfulimplementation.
RESULTS OF THE TEACHER SURVEYS
Primary and grade level teachers in elementary schools and Language Arts, Mathematics,Science and Social Studies teachers in middle and high schools selected for this study were askedto complete a 28-item Performance Assessment Survey (see Appendix B). Usable completedsurveys were obtained from all 192 teachers interviewed and 308 teachers not interviewed.Tables C.1 to C.14 in Appendix C present the significant findings of the self-reported results ofthese surveys with respect to: (a) school level, (b) primary and intermediate level, (c) subjectarea taught, and (d) years of teaching experience. These results are based on completed surveysfrom 188 elementary. teachers, 148 middle school teachers, and 164 high school teachers.
Findings Related to School Level (Appendix D)
1. Elementary teachers report using oral, open-ended questions significantly more frequentlythan middle or high school teachers.
2. High school teachers report using open-ended, written assignments significantly moreoften than middle or elementary school teachers.
3. More than half of all teachers report using performance events within units of instructionwith high school teachers reporting a higher level of use than elementary or middle schoolteachers.
4. At least 80 percent of all teachers report using some type of portfolio task within abroadunit of instruction. However, elementary teachers lead their colleagues in middle andhigh school in the use of portfolio assignments as well as in culminating projects.
25
44

S. Four of five elementary teachers report using student conferences as a feedback toolwithin an instructional unit compared to only two of three middle and high schoolteachers reporting the use of this strategy.
6. High school teachers report more use of educational technology for assessment thanelementary or middle school teachers.
7. Four of five elementary teachers report frequent use of hands-on techniques in theassessment of learning compared to only one of two middle and high school teachersreporting frequent use of this assessment strategy.
8. High school teachers are more likely to provide students with standards and scoringrubrics in advance of assessment tasks than middle school teachers. Middle schoolteachers are more likely to provide standards and rubrics in advance of assessment thanelementary teachers.
9. Nineteen of twenty elementary teachers report displaying of student work sometimeduring a unit of study. Seven of ten middle school teachers and une of two high schoolteachers report using this practice.
Findings Related to the non-accountability Grades P1-P4 of the Primary Level vs. theaccountability Grade 4 and 5 of the Intermediate Level (Appendix E)
10. Intermediate teachers report using different types of assessment including written, open-ended questions, and performance event more frequently than primary teachers.
11. Intermediate teachers report they provide their students with standards for quality of workexpected more frequently than primary teachers.
12. Intermediate teachers have students audit other students' work as a feedback techniquefor assessment more frequently than primary teachers.
Findings Related to Subject Area Taught (Appendix F)
13. Language Arts teachers report using portfolio assignments, culminating performances,and student conferences to a greater extent than Math, Science, or Social Studies teachers.
14. Science teachers report using performance events to a greater extent than Language Arts,Math, or Social Studies teachers.
15. Language Arts and Mathematics teachers are more likely to use technology forassessment purposes than Science and Social Studies teachers.
26
45

16. Science teachers use hands-on techniques for assessment more frequently than LanguageArts, Mathematics, and Social Studies teachers.
17. Language Arts teachers display student work more frequently than Math, Science, or
Social Studies teachers. .00
Findings Related to Years of Teaching Experience (Appendix G)
18. Teachers who have entered the workforce since KERA use performance assessments to agreater extent than teachers who were teaching before the law was enacted. Nineteen oftwenty teachers with one to five years of experience report using various types ofperformance assessment. For teachers with six to ten years of experience, seven of tenteachers report use of performance assessments. For teachers with more than ten years ofexperience, the use of performance assessments in instruction drops to one in twoteachers.
19. Recently trained teachers with few years of experience are more likely to refer students topublished national standards than more experienced teachers. As years of teachingexperience increases, teachers report they are less likely to reference national standards.
Preliminary Analysis of Classroom Assessment Artifacts
During the interview process, teachers were asked if they would be willing to share anyassessment related items such as open-ended questions, performance events, tests, rubrics, workguidelines, or grading criteria. Three hundred and twenty-four assessment-related items werecollected and analyzed as a result of that request. Due to the voluntary nature of the collectionprocess, the artifacts do not represent a cross section of the interviewed teachers; most items arefrom the middle or high school level. Some teachers shared more information than others. Theobservations that follow are intended only as descriptions of what has been collected and do notnecessarily represent a complete picture of the quality of assessment that is occurring inclassrooms across the state.
In assessing the different types of material collected, it was necessary to combine several
category types. Unless the teacher was very specific, the researchers could not always separateopen-ended questions from portfolio writing prompts or assessment tasks from portfolio tasks.Culminating performance examples were also combined with project examples. Table 0.1 inAppendix G provides a specific breakdown on the frequency of assessment types collected andtheir representation within the four disciplines of Language Arts, Mathematics, Science, and
Social Studies.
The researchers collected 73 open-ended questions, 55 performarce tasks, 31 tests (short
answer or multiple choice), 15 portfolio prompts, 14 projects/culminating performances, and 136scoring rubrics or work guidelines. While the number of items varied in each category by subject
27
46

area, all subject areas had examples in each area except portfolio tasks/prompts. All 15 examplesin this area were in Mathematics because of being specifically labeled as portfolio items.
The quality and complexity of the collected items vary considerably. The assessment-related items seem to reflect different levels of understanding as to what constitutes a particulartype of assessment. Both commercially prepared items and tasks were submitted as well asteacher-developed items and tasks. Open-ended questions were presented more frequently thanother forms of assessment and their quality tends to be fairly high. Simple word problems andessay questions were also submitted as examples of open-ended questions. Tasks tended to varyin length from one-hour, on-demand tasks to tasks that would require several days to a week.Some tasks were open-ended while others were lab exercises from textbooks or workbooks.
A variety of rubrics and work guidelines were collected. They varied considerably in theway they were structured and the amount of information that they provided the student. Thedegree of information provided to the student ranged from very specific levels of performancewith exacting descriptions of quality to general ranges of behavior. Guidelines for work werealso submitted that provided some descriptions of quality and time frames for work completion.
CONCLUSIONS
1. Performance assessment is occurring in the classrooms of the teachers selected for thisstudy. Many teachers are using various types of performance assessment strategies. Theextent to which these forms of assessment are occurring, however, varies considerablyboth within and across schools. Many teachers are working on the structural designissues nerformance assessment, but few teachers understand how to use performanceassess' .- to improve the teaching/learning process. There still remains confusion aboutterms such as "performance task," "portfolio task," and "culminating performance."Teachers often use them interchangeably.
2. KERA support documents such as Transformations, KDE Content Guidelines, KIRISreleased, open-response items, and KIRIS Assessment Curriculum Reports are reportedbeing used by at least seven of ten teachers surveyed. How these documents are usedvaries by individual teacher.
28
47

3. KIRIS directly influences the way performance assessment is being used in theclassrooms of teachers at the selected schools. Open-ended questions and portfolioprompts and tasks are used in many classrooms. Preparation for the KIRIS test is still
seen as a separate issue by many teachers rather than as an integral part of their daily
instruction.
4. Multiple forms of assessment including oral and written open-ended questions,performance events, portfolio assignments, skills tests, and conferencing are used by
seven of ten teachers surveyed. More than half used some type of assessment within thescope of an instructional unit.
5. Nine of ten teachers report using oral and written open-ended questions on a regular basis
and eight of ten teachers report using portfolio tasks within units of instruction.
6. Seven of ten teachers surveyed reported that they used the KIM Assessment CurriculumReport. A number of interviewed teachers reported that they used only one report at atime and were not able to discuss changes in performance over time. Some teachersconfused the KIRIS Assessment Curriculum Report with other KIRIS reports.
7. There is evidence that accountability grade teachers make more extensive use ofperformance assessments. Comparing primary teachers (K-3) with intermediate teachers
(4-5), intermediate level teachers report:
Greater use of open-ended questions and performance events on a daily and weekly
basisMore often providing students with standards in advance of instructionMore frequent use of the instructional strategy where students audit other students'
work
8. There were differences in reported use of performance assessments among teachers ofLanguage Arts, Mathematics, Science, and Social Studies.
Language Arts and Mathematics teachers use portfolio tasks more extensivelyLanguage Arts teachers use student feedback conferences more frequentlyMathematics teachers make greater use of national standardsScience teachers use performance event tasks and hands-on strategies more frequentlySocial Studies teachers used textbook materials more fix- assessment
29
48

9. There were differences in reported use of performance assessment among teachers atelementary, middle, and high schools.
Primary and intermediate level teachers report a more frequent use of open-ended oralquestions, portfolio assignments, culminating performances, projects, studentconferences, anecdotal comments, and use of hands-on assessment activitiesPrimary and intermediate level teachers are more likely to divide instructional timebetween giving information, coaching students and providing feedback, and tend toprovide feedback more on a daily basis than the middle and high school teachersIntermediate level teachers report a more frequent use of written, open-endedquestions and performance events than primary teachersIntermediate level teachers report a more frequent use of the textbook KIRIS open-response released items and the KIRIS Assessment Curriculum Reports than primaryteachersMiddle and high school teachers report using KIRIS open-response items morefrequently than primary or intermediate level teachersHigh school teachers report using open-ended written questions, performance events,and technology for assessment activities more than all other levels
10. Differences in the setting of standards for performance assessment were observed amongelementary, middle, and high school levels. Elementary teachers display student workmost frequently as a standard-setting mechanism. High school teachers are the mostlikely to provide students with standards in advance and to use scoring rubrics onassessments.
11. High implementors of performance assessment use assessment to drive instruction, usetechnology and hands-on manipulatives more frequently, provide challenging andengaging assessments, and provide content that cover multiple Kentucky Learning Goalsand Academic Expectations. These areas are the greatest predictors for implementation.
12. High implementors of performance assessment use open-ended written questions andportfolio tasks more frequently. However, types of assessments tend to varyindependently of the other components that were measured and by themselves are notgood predictors of effective implementation.
13. New teachers report higher uses of performance assessment in instruction than moreexperienced teachers. For example, 95 percent of teachers with one to five years'experience report using performance events within units of study. The extent of use ofperformance events drops to 70 percent for teachers in the range of six to ten years and to50 percent for teachers with more than ten years of teaching experience.
14. Teachers who use KIRIS released items are significantly different from nonusers inseveral ways. They use open-ended written questions and portfolio assignments morefrequently than nonusers. They also use rubrics for student work and assessment more
30
49

frequently. Teachers who use KMIS released items displayed student work morefrequently, use the content guidelines more frequently, and use real worldexamples for
student assessment more frequently than nonusers.
RECOMMENDATIONS
1. Greater clarity needs to be provided in the use and meaning of different types ofperformance assessment. Resource documents should be produced or recommended thatdefine the types of assessment and provide rich examples of each type.
2. Professional development is needed in a variety of areas related to curriculum andassessment. Key areas include:
a. Design and use of different types of performance assessments that challenge studentsto perform at higher levels and engage them with meaningful tasks
b. Design of performance standards and scoring rubrics that elicit quality work and serve
as guidelines for work in progress
c. Use of portfolios in more subject areas and as a method for encouraging higher levelsof performance for all students through assessment of work in progress
d. Design and implementation of a standards-based curriculum and strategies forevaluating the current curriculum against those standards
e. Development of quality tasks that can be used to organize and drive instruction
3. Teachers need good model lessons, performance assessment tasks, and methods fordeveloping them. These resources need to be made available to every teacher. (TheKentucky Department of Education has been reviewing and building a pool of exemplarylessons and units and is in the process of completing a handbook on designing
performance tasks.)4. A bank of quality performance assessments should be established by academic
expectation and subject area and made available through the Kentucky EducationalTelevision network. Each event or task should also be accompaniedby samples of
student work that serve as benchmarks for quality.
5. Transformations: Kentucky's Curriculum Framework needs to be updated to incorporate
current information in various national standards documents. The AcademicExpectations need to be further defined by content standards to provide clarity as to whatstudents are expected to know and be able to do.

6. Schools need to explore ways of having more of the faculty involved in preparingstudents at every grade level for the KIMS assessments.
7. Schools need to develop a multi-year K1MS Assessment Curriculum Report profile to
identify both areas of growth and improvement as well as reporting categories in need of
improvement.
8. The Kentucky Department of Education in cooperation with local school districts shouldidentify classrooms and teachers where performance assessment is being used to improve
the quality of student work. These teachers and schools should serve as model visitation
sites and be involved in the professional development of others.
9. The PACC Map needs to be revised and a training module developed for using the map
as a self-assessment tool.
32
51

SUGGESTIONS FOR FURTHER RESEARCH
1. Replicate the present study findings by having a more extensive implementation study
that includes:
a. A more representative sample of schools and teachers
b. Arts and Humanities teachersc. A comparison of schools meeting or exceeding their thresholds with schools not
meeting their thresholds
2. Conduct studies with teachers who are high users of performance assessment to better
understuid the issues of student challenge and engagement, the ways in which assessment
drives instruction and instruction drives assessment and the use of technology and hands-
on materials that contribute to student willingness to persist with the task.
3. Conduct studies that explore the extent of implementation within schools and across
schools. Factors need to be identified that increase the likelihood of high implementation
of performance assessment for all teachers in a school.
4. Conduct studies of the effects of professional development associated with the use of
performance assessment. How do structures such as year-long, in-service, collegial
support groups, and action research techniques affect the implementation process?
5. Conduct studies of the effects of school leadership in promoting the use of performance
assessment for instruction. In what roles can the principal, department chair, team leader
and/or instructional coordinator make the greatest contribution toward increasing the use
of performance assessment as an integral part of the instruction process?
33
52

REFERENCES
Bridge, C. A. (1994). The implementation of Kentucky's primary program, Frankfort,KY: Kentucky Institute for Education Research.
Hall, G. E., & Hord, S. M. (1987). I I IGO I ' I
York: State of New York University Press.
Hart, D. (1994). Authentic assessment: A handbook for educatora. New York:Addison-Wesley Publishing Company.
New
Schlechty, P. C. (1990). Schools for the twenty-first_century_LLeadership imperatives foreducationsefsum. San Francisco: Jossey-Bass Publishers.
Wiggins, G. P. (1987). Creating a thought-provoking curriculum. American Educator,11(4), 10-17.
Wiggins, G. P. (1989). Teaching to the authentic test. Educational Leadership, 4(7),41-47.
Wiggins, G. P. (1993). Assessing student performance: Exploring the purpose andlimits of testing. San Francisco: Jossey-Bass Publishers.
34
53

APPENDIX A
35
54

Glossary of Terms
Frequency of Use defines how often students have an opportunity to use differenttypes of performance assessment. The nine Types of Assessment listed are open-ended(oral), open-ended (written), performance event tasks, portfolio tasks or prompts,culminating performances, projects, traditional assessment of discrete skills,conferencing, and anecdotal records. They are defined as:
Open-ended questions (oral and written) are stimulating prompts or questions that requirestudents to use higher order thinking and allow the use of multiple approaches tosolutions.
Pelfonnance event tasks are usually short-term tasks (one-hour) that require the studentto apply knowledge to a given problem or situation.
Porolio tasks are tasks or prompts that require a longer period of time to complete andshow work in progress documenting learning over time.
Culminating petformances are major, end-of-unit or end-of-course performances thatrequire students to demonstrate a thorough mastery of the content presented and anintegration of that knowledge across multiple goals.
Projects zTe usually long-term tasks that serve as the focal point for a unit of study.
Skills tests are short (one hour or less) examinations that test for understanding andapplication of discrete skills within a discipline.
Conferences are one-on-one conversations between the teacher and student that allow forprobing the extent to which a student understands a concept, problem, or issue.
Anecdotal Records are narrative descriptions of a student's behavior or performance inprogress.
Content Focus contains two subcomponents that describe linkage to standards andthe breadth of the content covered.
Linkage to Standards defines the extent to which assessment tasks are linked to theAcademic Expectations.
Breadth of Content defines the extent to which the content of the assessment covers oneor more of the six Kentucky Learning Goals established in KERA as well as the numberof Academic Expectations.
36
55

Quality of Performance Assessments is defined through the three sub-componentsof Authenticity, Challenge and Developmental Appropriateness, and AssessmentMaterials.Authenticity defines the extent to which the content has been linked to real worldexperiences.
Challenge and Development Appropriateness defines the extent to which the assessmentsare viewed as challenging and engaging for the student.
Assessment Materials defines the extent of use of technology and/or hands-onmanipulatives.
Relationship of Assessment to Instruction is defined in terms of the degree to whichassessment drives instruction and instruction drives subsequent assessment.
Teacher Role in Performance Assessments is defined in terms of facilitation andinteraction as a range of possibilities from dispenser of knowledge to serving asmotivator, encourager and giver of feedback.
Student Role in Performance Assessments focuses on the extent of activeengagement from passive test taker to investigator and producer of knowledge.
Performance Standards is defined through the three components of standards ofcommunication to students, congruence with MIS, and relationship of performancestandards to student evaluation.
Standards of Communication to Students defines the extent to which performancestandards are clearly explained in advance of the performance
Standards of Congruence with KIRIS defines the degree of congruence of performanceasessments used with the KIRIS scoring guides.
Relationship of Peiformance Standards to Student Evaluation defines the extent to whichstudent work on performance assessment determines a student's evaluation.
Evaluation and Feedback defines how often students have an opportunity toexperience or use different types of evaluation and feedback. The five Types ofEvaluation and Feedback listed are: student evaluates and reflects on own work, studentaudits other student work, teacher evaluation of student work, cooperative effort betweenstudent and teacher, and display of student work.
37
56

Student Evaluates and Reflects on Own Work defines the frequency with which a student
uses self reflection, assessment, editing or rewrites of personal work.
Students Audit Other Students' Work defines the frequency with which students assist
other students as reviewers and friendly critics. It is not limited to the grading of another
student's paper.
Teacher Evaluates or Audits Students' Work and Gives Feedback defines the frequency
with which the teacher reviews work in progress as well as completed, final work
assignments. It is not limited to the grading of papers.
Evaluation is a Cooperative Effort Between Students and Teachers defines the frequency
with which the teacher allows the student to actively participate in the evaluation process
defending positions, offering alternative explanations, demonstrating an understanding of
the performance standards associated with the work assigned.
Student's Work is Displayed defines the frequency with which the teacher displays
exemplary work that serves as models of whatmeeting the standards looks like. It is not
limited to the routine display of classwork regardless of performance level.
38
57

APPENDIX B
Performance Assessment Component Configuration Map
39
58

irstA
An
Inno
vatio
n C
ompo
nent
Con
figur
atio
nM
ap fo
r P
e:im
am A
sses
smen
t
Sch
ool:
Obs
erve
r:D
ate:
Tot
al N
umbe
r of
Tea
cher
s:T
otal
Num
ber
of S
tude
nts:
Ple
ase
note
:
Thi
s do
cum
ent w
as d
evel
oped
by
the
Ken
tuck
y In
stitu
te fo
r E
duca
tion
Res
earc
h fo
r th
e pu
rpos
e
of s
tudy
ing
the
impl
emen
tatio
n of
Per
form
ance
Ass
essm
ent a
nd Is
not
to b
e us
ed a
s an
eva
lua-
tion
Inst
rum
ent.
Whi
le It
Was
des
igne
d es
a r
esea
rch
tool
, thi
s do
cum
ent c
an b
e us
ed fo
r pl
an-
ning
and
sel
f-as
sess
men
t of l
ocal
pat
tern
s of
impl
emen
tatio
n.
Thi
s do
cum
ent i
mow
n es
a C
ompo
nent
Con
figur
atio
n M
ap, I
dent
ifies
key
com
pone
nts
of P
erfo
r-
man
ce A
sses
smen
t and
des
crib
es w
riatio
ns In
pra
ctic
e on
e w
ould
exp
ect t
o fin
d ac
ross
the
sist
a T
he v
aria
tions
fart
hest
to th
e le
ft er
e co
nsid
ered
by
Ken
tuck
y pr
actit
ione
rs, r
esea
rche
rs,
and
deve
lope
rs to
be
the
emer
ging
pra
ctic
e ad
voca
ted
In th
e K
ER
A (
Ken
tuck
y E
duca
tion
Ref
orm
Act
) in
itiat
ive.
Det
erm
inin
g w
hich
is th
e m
ost e
ffect
ive
or e
ffici
ent v
aria
tion
of p
ract
ice
will
be
the
chal
leng
e of
ong
oing
res
earc
h.
The
dev
elop
ers
of th
is In
nova
tion
Com
pone
nt C
onfig
urat
ion
Map
are
per
iodi
caly
rev
iew
ing
and
revi
sing
this
inst
rum
ent t
o im
prov
e Its
use
fuln
ess
and
Its a
bilit
y to
Iden
titY
Impo
rtan
t var
iatio
ns
in p
ract
ice.
Pla
ne s
end
all c
omm
ents
and
sug
gest
ions
to R
oger
Pan
krat
z ex
ecut
ive
dire
ctor
,
Ken
tuck
y In
stitu
te fo
r E
duca
tion
Res
earc
h, 1
48 C
onsu
mer
Lan
e, F
rank
fort
, Ken
tuck
y 40
601,
or
fax
to (
502)
227
-897
8.
&W
NW
by
Me
a**
WN
W lo
t Mal
lon
Mar
ch (
KIE
R).
10 M
R M
IMI O
ft M
UN
I =M
IT P
ER
M=
FIK
I1
59
TA
BLE
OF
CO
NT
EN
TS
A. F
requ
ency
of U
se2
B. C
onte
nt F
ocus
3
1. L
inka
ge to
Sta
ndar
ds3
2. B
read
th o
f Con
tent
4
C. Q
ualit
y of
Per
form
ance
Ass
essm
ents
5
1. A
uthe
ntic
ity5
2. C
halle
nge
and
Dev
elop
men
t App
ropr
iate
ness
5
3. A
sses
smen
t Mat
eria
lsD
. Rel
atio
nshi
p of
Ass
essm
ent t
o in
stru
ctio
nE
. Tea
cher
Rol
e In
Per
form
ance
Ass
essm
ents
7
F. S
tude
nt R
ole
In P
erfo
rman
ce A
sses
smen
ts7
G. P
erfo
rman
ce S
tand
ards
1. S
tand
ards
of C
omm
unic
atio
n to
Stu
dent
s8
2. S
tand
ards
of C
ongr
uenc
e w
ith K
IRIS
9
3. R
elat
ions
hip
of P
erfo
rman
ce S
tand
ards
to S
tude
nt E
valu
atio
n9
H. E
valu
atio
n an
d F
eedb
ack
10
60

PE
RF
OR
MA
NC
E A
SS
ES
SM
EN
TIn
nova
tion
Com
pone
nt C
onfig
urat
ion
((C
C)
Map
:
A. F
requ
ency
of
Use
Now
ono
do
stud
ents
hav
e an
opp
ortu
nity
to p
ract
ia?)
Not
e th
e ty
pe(s
) of
ass
essm
ent f
or e
ach
time
perio
d in
bot
h co
lum
ns a
nd r
ows.
I II
I SI
MM
ON
S(a
) lia
lly(b
Wee
k(c
) E
nd e
l Uni
t(I
) O
nce
er T
wic
e s
Yea
r
1. O
pen-
End
ed W
estin
, (O
ral)
2. O
w-E
nded
Que
stio
ns (
Writ
ten)
3. P
erfo
rman
ce E
vent
Tas
ks (
On
dem
and,
one-
hour
task
s)
4. P
ortfo
lio T
asks
or
Pro
mpt
s
S. C
ulm
inat
ing
Per
form
ance
S. P
role
cts
7. T
radi
tiona
l Ass
essm
ent o
f Dis
cret
e S
kills
IL C
onfe
rend
ng
9. A
necd
otal
Rec
ords
,
10. O
ther
(sp
ecik
):
Min
im ti
eest
ien(
s) (
Thl
s in
form
atio
n M
ay a
lso
be ta
ken
from
the
Sur
vey
Inst
rum
ent:
Que
stio
ns 1
-10.
)
Now
do
you
dete
rmin
e w
hat y
ou w
ant s
tude
nts
to k
now
and
do
in y
our
clas
s?
Now
are
you
usi
ng P
erfo
rman
ce A
sses
smen
t in
your
cla
ssro
om?
How
do
you
deve
lop
aues
smea
r 4:
1NIti
es fo
r yo
ur s
tude
nts?
&W
ood
by m
eK
MPA
CV
IRSU
IVIO
for
Mai
m R
tsur
chW
in90
34
MO
NO
OR
IIM
OIR
I MO
OT
PO
RA
IIMO
N IR
OP
I
61
BE
ST C
OPY
AV
AIL
AB
LE
62
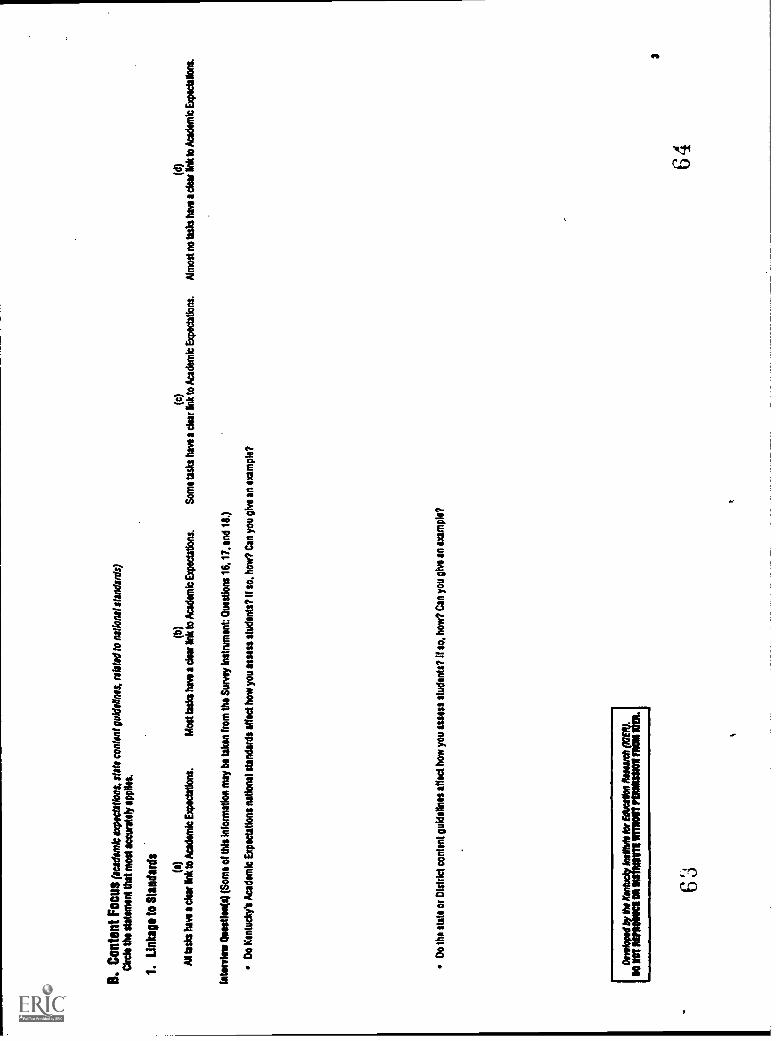
B. C
onte
nt F
ocus
(aca
dem
ie e
xpec
tatio
ns, s
tate
con
tent
gut
s:18
1ln*
rel
ated
to n
atio
nal s
tand
ards
)C
ircle
the
stat
emen
t tha
t mos
t acc
urat
ely
appl
ies.
1. L
inka
ge to
Sta
ndar
ds (I)
(b)
(c)
(d)
All
task
s ha
ys a
dea
r In
k to
Aca
dem
ic E
xpec
tatio
ns.
Mos
t tas
ks h
ave
a de
ar li
nk to
Aca
dem
ic E
xpec
tatio
ns.
Som
e ta
sks
have
a d
ear
Ink
to A
cade
mic
Exp
ecta
tion
Alm
ost n
o ta
sks
have
a d
eer
Ink
to A
cede
mt E
xpec
tatk
3ns.
Inte
niew
Thr
eetle
e(s)
(S
ome
of th
is In
form
atio
n m
ay b
e ta
ken
from
the
Sur
vey
Inst
rum
ent:
Que
stio
ns 1
6. 1
1. a
nd 1
8)
Do
Ken
tuck
y% A
cade
mic
Exp
ecta
tions
nat
iona
l sta
ndar
ds a
ffect
how
you
ass
ess
stud
ents
? II
so. h
ow?
Can
you
give
an
exam
ple?
Do
the
stat
e or
Dis
tric
t con
tent
gui
delin
es a
ffect
how
you
aue
ss s
tude
nts?
It s
o, h
ow?
Can
you
giv
e an
exa
mpl
e?
Dee
stop
pl b
y te
e W
e,*
WM
* ex
WN
W R
enar
d;M
EM
NO
IOT
WM
ICI 1
M M
MIV
TI 1
1110
01T
PM
UM
1110
1 F
EN
PM
64

B. C
onte
nt F
ocus
(co
ntin
ued)
(A
cade
mic
&pc
:idio
m s
td. c
onte
nt g
uide
lines
. IO
W to
',eo
ns, s
tinda
nis)
arde
the
stat
emen
t tha
t mos
t acc
urat
ely
appl
es.
2. B
read
th o
f Con
tent (1
1)(b
)(c
)(d
)
Ass
essm
ent t
asks
add
ress
a b
road
ran
ge o
f con
tent
Ass
essm
ent t
asb
mos
tly a
ddre
ss a
ran
ge o
f con
tent
Ass
essm
ent t
asks
add
ress
a li
mite
d ra
nge
of c
onte
ntA
sses
smen
t tas
ks a
ddre
ss a
ver
y na
rrow
ran
ge o
f con
tent
acro
ss A
cade
mic
Exp
ecta
tions
in s
ever
al tu
rnin
g G
oats
.ac
ross
Aca
dem
ic Il
mec
tstIo
ns u
nder
one
Lea
rnin
g G
oal.
and
focu
s on
onl
y a
few
Aca
dem
ic E
xpec
tatio
ns.
and
focu
s on
one
or
two
Aca
dem
ic E
xpec
tetk
ons.
Inte
rvie
w O
sest
len(
s) (
Par
t of t
his
Info
rmat
ion
may
be
take
n fr
om th
e S
urve
y In
stnu
nent
Que
stio
n 19
.)
How
do
you
use
Tra
nsfo
rmat
ions
: Kon
tmly
s C
urric
ulum
Pra
ms/
oda
(See
als
o ba
ckgr
ound
Info
rmat
ion
on s
urve
y.)
Hav
e yo
u us
ed a
ny o
f the
KIR
IS, c
omm
on-r
sies
sed
item
s fr
om p
revi
ous
year
s to
ass
ist y
ou w
ith d
evel
opin
g P
erfo
rman
ce A
sses
smen
ts?
If so
, how
? (S
ee a
lso
back
grou
ndIn
torm
atku
t on
Sur
vey.
)
Wha
t rol
e do
es th
e te
xtbo
ok p
lay
In y
our
deve
lopm
ent o
f stu
dent
Per
form
ance
Ass
essm
ents
?
&W
ooed
by
gm O
no*
galfW
k lo
t Waf
t Ifn
ewel
t ME
M.
110
NO
T M
AM
MO
N M
OM
MO
W M
IMI M
N M
EN
.
65B
EST
CO
PY A
VA
ILA
BL
E
664

C. Q
ualit
y of
Per
form
ance
Ass
essm
ents
Ckc
ie th
s st
atem
ent t
hat m
ost a
ccur
stek
appk
s.
1. A
uthe
ntic
ity (
cont
ent l
lnk
to th
e N
M w
orld
of t
he s
tude
nt)
(b)
(C)
(d)
AN
ass
essm
ents
pre
sent
pro
blem
s an
d cb
sile
nges
that
Mos
t ass
essm
ents
pre
sent
pro
blem
s an
d ch
alle
nges
Som
e as
sess
men
ts p
rese
nt r
ul-N
le a
pplic
atio
ns;
have
a d
irect
link
to th
e re
al w
orld
of t
he s
tude
ntre
late
d to
the
real
wor
ld o
f the
stu
dent
.ho
wev
er, m
any
asse
ssm
ents
com
e fr
om te
xtbo
okm
ated
al th
at p
rese
nts
hypo
thet
ical
or
cont
dved
situ
atio
ns.
Mad
re O
entie
n(s)
How
do
your
ass
essm
ents
mod
el r
eal-w
orld
exp
eden
os fo
r yo
ur s
tude
nts?
(S
ee a
lso
Sur
vey
Que
stio
ns 2
0-21
.)
Ass
essm
ents
are
mos
tly c
ontr
ived
situ
atio
ns th
at h
ave
NU
N r
eist
Ions
hip
to th
e st
uden
t's w
orld
ol e
xper
ienc
e.
2. C
halle
nge
and
Dev
elop
men
t App
ropr
iate
ness
(ch
alle
ngin
g, e
ngag
ing,
dev
elop
men
tally
app
ropr
iate
)
(b)
(c)
(d)
Nea
rly a
il as
sess
men
ts a
rs c
halle
ngin
g an
d en
gagi
ng to
Mos
t ass
essm
ents
are
cha
lleng
ing
and
enga
ging
. Som
eS
ome
asse
ssm
ents
are
cha
lleng
ing
and
enga
ging
;M
ost a
sses
smen
ts d
o no
t app
ear
to b
e di
alog
ing
or
each
stu
dent
. Ass
essm
ents
str
etch
the
stud
ent%
asse
ssm
ents
app
ear
to b
e to
o ad
vanc
ed o
r to
o el
emen
-ho
wev
er, m
ost a
sses
smen
ts a
ppea
r lik
e en
d-of
-cha
pter
enga
ging
to th
e st
uden
t. M
arl s
eem
too
ahem
* or
palo
min
o w
fthou
t req
ukin
g M
ON
than
can
be
expe
cted
.ta
ry to
eng
age
the
stud
ent.
ques
tions
or
activ
ities
.to
o el
emec
hry
to e
ngas
the
stal
est
Inte
rvie
w O
seet
ten(
s)
How
do
you
inak
e P
erfo
rman
ce A
sses
smen
ts c
halle
ngin
g fo
r yo
ur s
tude
nts?
How
do
you
mak
e P
erfo
rman
ce A
sses
smen
ts e
ngag
ing
for
your
stu
dent
s?
r"--
-D
mio
etd
by O
w K
who
Wni
ffiv
leA
KW
ON
Raw
* (K
IER
).N
NO
T IN
VIN
NC
E O
N II
SIN
NII
IMN
FIN
T P
ININ
NU
NIN
MO
M M
IN.
68

C. Q
ualit
y of
Per
form
ance
Ass
essm
ents
(co
ntin
ued)
Circ
le th
o *W
ent t
hat m
ost a
ccur
st*
appl
ies.
3. A
sses
smen
t Mat
eria
ls (
use
of te
chno
logy
and
/or
man
ipul
ativ
e, w
hen
appr
opria
te)
(1)
Mos
t ass
essm
ents
kw
olve
tbe
use
ofte
chno
logy
and
/or
hand
s-on
mtn
ipul
ativ
ssth
at e
ngag
e th
e st
uden
t ki a
ctiv
e le
arni
ng.
00S
ome
asso
ssm
ents
Invo
lve
the
use
ofte
chno
logy
and
lor
man
ipul
atIv
es th
aten
gage
the
stud
ent i
n ec
tke
Oct
asio
nak
asse
ssm
ents
req
uire
the
use
of te
chno
logy
and
/or
man
ipul
atIv
es. M
ost
asse
ssm
ents
req
uire
onY
pap
er a
nd p
enci
lsto
com
plet
e ta
sks.
Mer
vin
tlees
tlen(
s) (
Info
rmat
ion
may
als
o be
talo
n fr
om th
e S
urve
y In
sbum
ent:
Que
stio
ns 1
4-15
.)
How
do
you
use
tech
nolo
gy o
r ha
ndso
n m
anip
ulat
ive:
In th
e as
sess
men
t of s
tude
nt p
erfo
rman
ce
D. R
elat
ions
hip
of A
sses
smen
t to
Inst
ruct
ion
(*gr
im o
f Int
ogra
tion
WM
inst
ruct
ion)
Clic
is th
e st
atem
ent t
hat m
ost a
ccur
atsl
y ap
plie
s.
(2)
Tea
cher
s at
op u
se a
sses
smen
t to
driv
esu
bseq
uent
inst
ruct
ion.
and
Inst
ruct
ion
atw
ris d
rives
sub
sequ
ant a
ssts
smen
t
(b)
Tea
cher
s lu
g* u
se a
sses
smen
t to
drIv
ssu
bseq
uent
inst
ruct
ion,
and
Inst
ruct
ion
larg
ely
driv
ss s
ubse
quen
t ass
essm
ent
(d)
Ass
essm
ents
gen
eral
ly d
o no
t req
uire
the
use
of te
chno
logy
or
man
ipul
atIv
ss.
Tex
tboo
ks, p
aper
, and
pen
cils
are
the
stan
dard
mat
eria
ls n
eade
d fo
r as
sess
men
ts.
(c)
(0)
Tea
cher
s so
met
imes
use
ass
essm
ent t
o dr
Ivs
Tea
cher
s in
freu
uent
ly u
se a
sses
smen
t to
subs
eque
nt In
stru
ctio
n, a
nd In
stru
ctio
ndr
ive
subs
eque
nt In
stru
ctio
n, a
nd In
stru
ctio
nso
met
imes
chi
ves
subs
equr
nt a
sses
smen
tin
freq
uent
ly d
rives
sub
sequ
ent a
sses
smen
t
(0)
The
stu
dent
has
littl
e or
no
oppo
rtun
ity to
use
Psr
form
ance
Ass
essm
ent M
ated
*.
(a)
Tea
cher
s ne
w u
se a
sses
smen
t to
chiv
esu
bseq
uent
inst
ruct
ion.
and
Inst
ruct
ion
neve
r dr
his
subs
oque
nt a
sses
smen
t.
Inte
rvie
w tl
eest
len(
s)
How
do
you
usa
the
KIR
IS A
sses
smen
t Cur
ricul
um R
epor
t for
you
r sc
hool
to g
uide
inst
ruct
ion
and
asse
smsn
t In
your
sub
ject
are
a? (
Su
also
bac
kgro
und
info
rmat
ion
on th
e S
urve
y an
d Q
uest
ion
22.)
How
do
stud
ent r
esut
ts o
n ci
assr
oom
Per
form
ance
Ass
n:m
eats
Influ
ence
Inst
ruct
iona
l dec
isio
ns?
Der
tiopi
lK
staW
nsffu
le to
r W
aft R
owed
) P
MN
O N
ff P
RIM
O (
*MO
NT
I =N
OV
mom
RO
N D
M
69B
EST
CO
PY A
VA
ILA
BL
E70

E. T
each
er R
ole
In P
erfo
rman
ce A
sses
smen
ts(lu
dilla
tion,
inte
nt:d
on)
Circ
le th
e st
atem
ent t
hat m
ost a
ccur
st*
appl
ies.
(a)
PO
(c)
(d)
AI l
each
ers
Inte
ract
with
the
stud
ent b
y m
otiv
elIn
g,M
ost o
f the
the
teak
s In
tera
ct w
fth th
e st
uden
t by
Som
e of
the
time
teac
hers
Inte
ract
with
the
stud
ent b
ytit
tle In
tera
ctio
n be
twee
n th
e te
ache
r an
d th
e st
uden
tch
alle
ngin
g, o
ncou
ragf
ng. I
nviti
ng r
efle
ctio
n an
d gi
ving
mot
ivat
ing,
cha
hngi
ng, e
ncou
ragi
ng, l
inki
ng r
efle
ctIo
n,m
otiv
atin
g, c
halle
ngin
g, e
ncou
ragi
ng, I
nviti
ng r
efle
ctio
n,te
ache
r Is
dis
pens
er o
f kno
wle
dge/
give
r of
test
s.fe
edba
ck.
and
ghin
g fe
edba
ck,
and
givi
ng fe
edba
ck.
Inte
rvie
w tl
eest
lee(
s) (
See
als
o S
urve
y Q
uest
ion
23.)
As
stud
ents
are
eng
aged
In a
Per
form
ance
Ass
essm
ent.
wha
t do
you
do?
Wha
t kin
ds o
f Int
erac
tion
do y
ou h
ave
wtth
stu
dent
s du
ring
the
asse
ssm
ent o
f per
form
ance
?
Wha
t typ
es o
f Per
form
ance
Ass
essm
ent h
ave
been
the
rnos
t use
ful f
or y
ou in
ass
essi
ng s
tude
nt p
erfo
rman
ce?
Wha
t typ
e of
Per
form
ance
Ass
essm
ent k
the
mos
t diff
icul
t for
you
? W
hy?
F. S
tude
nt R
ole
In P
erfo
rman
Ce
Ass
essm
ents
(ad
o en
gsgu
rnon
t)C
lick
the
stat
emen
t tha
t mos
t acc
urst
* ap
plie
s.
(b)
(c)
The
stv
dnl I
s a
Pro
hlan
liktt
a lo
onlil
lake
l. 1
The
stu
dent
k s
uper
vise
d by
the
teac
her
es a
kno
wle
dge
The
stu
dent
Is a
pas
sive
lost
-tak
er a
nd a
com
plet
erpr
oduc
er o
f kno
wle
dge.
an
Inve
stig
ator
and
aw
orke
r an
d Is
vi,w
al a
s a
cow
' ler
of t
asks
,of
ass
essm
ent I
tem
s.us
er o
f res
ourc
es.
kten
lew
Que
stle
Ms)
Wha
t are
som
e ro
les
that
you
r st
uden
ts p
erfo
rm in
cla
ssro
om a
sses
smen
t act
iviti
es?
deno
loW
by O
M*
WS
W to
r M
ahn
Baw
d (1
0M).
10 N
OT
MIW
IIU O
Nm
art 1
1110
1.10
1 M
al M
IL
7172

G. P
erfo
rman
ce S
tznd
erds
Circ
le th
e st
atem
ent t
hat m
ost K
en*
appl
ies.
1. S
tand
ards
of C
omm
unic
atio
n to
Stu
dont
s
(8)
Sta
ndar
ds o
f per
form
ance
are
dea
rty
expl
aine
d an
dac
tiveV
am
mon
iate
d to
the
stud
ent h
i adv
ance
of
asse
ssm
ents
. A v
arie
ty o
f exa
mpl
es s
how
ing
diffe
rent
leve
ls o
f per
form
ance
are
on
disp
lay
for
the
stud
y&
(def
y, a
mig
os)
(b)
Sta
ndar
ds o
f per
form
ance
an
deve
F3p
ed a
nd s
tate
d, b
utth
ere
are
few
, if a
ny, I
ndic
aton
Of e
xam
ples
of s
tude
nt
perf
orm
ance
ava
lbbl
e.
(c)
Sta
ndar
ds o
f per
form
ance
are
not
fully
dev
elop
ed O
f(d
ead/
sta
ted.
Per
form
ance
is J
udge
d by
the
teac
her
and
Is m
ostly
sub
fect
ive.
Mai
n gu
st le
n(s)
(S
ee a
lso
Sur
vey
Cau
tions
11,
12,
and
13.
)
How
do
you
com
mun
icat
e th
e P
erfo
rman
ce S
tand
ards
exp
ecte
d on
the
Per
form
ance
Ass
essm
ents
that
you
use?
Hav
e yo
u ev
er u
sed
form
er s
tude
nt w
ork
as b
ench
mar
ks fo
r cu
rren
t stu
dent
wor
k In
you
r cl
assr
oom
? H
ww
was
that
str
uctu
red?
Do
you
have
a r
ubrI
c O
f Set
of P
srlo
man
ce S
tand
ards
you
hav
e us
ed r
ecen
tly?
How
did
you
use
them
?
Dev
eopa
1 b
y en
hon
ey M
ON
O to
r *W
m A
suar
ch (
EM
).N
NT
NU
MM
I a M
UM
=N
V M
N=
ThO
M IM
L
BE
ST C
OPY
AV
AIL
AB
LE
(d)
Sta
ndar
ds o
f ped
orm
ance
for
stud
ent w
ork
in s
choo
lha
ve n
ot b
een
deve
lope
d.
74

G. P
erfo
rman
ce S
tand
ards
(con
tinue
d)C
kde
the
Mim
ed th
st m
ost e
ccat
ey a
ppin
.
2. S
tand
ards
of C
ongr
uent
. WM
SIM
S (
darn
of c
onvo
nce)
(1)
Ped
antic
§ S
tand
ards
mid
to a
sses
sman
ts In
the
clas
sroo
m a
re c
ompi
dsly
com
ma
wN
hst
anda
tds
used
in K
IRIS
sco
ring
Ode
s.
(b)
Pal
os/B
anco
Sta
ndar
ds u
sed
M th
e cl
assr
oom
hav
eso
ms
rsis
tIons
hip
to s
tand
ards
use
d M
KIM
sco
ring
guid
es.
Inte
rvie
w Q
uest
ion(
s) (
See
als
o S
unny
Que
stio
ns 1
1 an
d 13
.)
HU
I you
ero
r us
sd ti
n P
erfo
rman
ce S
tAnd
ards
out
lined
M th
e IN
NS
sco
ring
guid
es?
If so
, how
?
3. R
elat
ions
hip
of P
olor
man
ce S
tand
ards
to S
tude
nt E
valu
atio
n (d
ome
of is
latio
nshI
N
(8)
The
stu
dent
's w
ork
on P
sdor
man
cs A
sses
smen
t is
the
dom
inan
t eva
luat
ing
fact
or In
rep
ottin
g st
uden
t lam
ing
prog
ram
.
(b)
The
stu
dent
's w
ork
on M
arm
ite A
sses
smen
tis
$ c
ontr
ibut
ing
!KW
in e
valu
atin
g an
d re
port
ing
stvd
snt p
rogr
am.
!Mai
ms
ttres
tles(
s)
How
is s
tude
nt w
ork
eval
uate
d In
you
r cl
assr
oom
? H
ow a
re y
our
grad
ing
crite
ria &
twin
ed?
awro
Wbf
, ire
trae
kW*
lor
Mag
og M
um*
MIE
RA
IS N
OT
nU
woh
ucs
MI M
OM
Men
MO
M P
RO
M IM
M.
7
(c)
Paf
orm
ance
Sta
ndar
ds u
sed
M th
e cl
assr
oom
hue
NM
* or
no
rela
tions
hip
to s
tand
ards
use
d In
KIR
IS n
otin
g gu
idts
.
(c)
The
stu
dent
's w
odc
on P
stfo
rman
ce A
sses
smen
tco
ntrib
utes
Md.
or
noth
ing
to e
valu
atio
n of
the
lear
ning
Foa
m
76

H. E
valu
atio
n an
d F
eedb
ack
ppm
): ty
po( M
AIS
UO
ft, a
fld
Wal
ed)
Tip
s et
ast
essm
ents
(Nel
l Ike
lype
(s)
el r
etin
as n
od f
eedb
ack
obse
rved
le s
ub N
oe p
eded
la b
ilk a
lma
old
rot)
(a)
Dai
ly(k
) W
eekl
y(e
) E
nd e
l Uni
tM
Ed
el O
men
Pul
ed
I. S
tude
nts
eval
uele
and
rel
ied
ea o
wn
wor
t
2. S
tude
nts
NO
oth
er s
tude
nW w
ork
$. T
each
er e
velu
ates
or
Nes
*W
eds'
wor
k en
d
ghee
fee
dbac
k
4. E
valu
atio
n le
a c
oope
rativ
e N
od b
etw
een
leac
hers
and
ste
dent
&
5. S
tude
nts'
wor
k Is
dis
play
ed.
Men
lo, Q
uesd
en(s
)In
form
adon
may
be
take
n fr
om th
e Su
rvey
Que
stio
ns 2
4211
.)
Wha
t opp
ortu
nitie
s do
you
pro
vide
for
you
r st
uden
ts to
rec
eive
eva
luat
ion
and
feed
back
?
Wha
t typ
es o
f fe
edba
ck d
o yo
u gi
ve to
you
r st
uden
ts?
kfils
ebW
hat t
ypes
of
perf
orm
ance
task
s ha
ve y
ou u
sed
this
yea
r or
iast
yea
r th
at y
ou w
oull
be w
iling
to s
hare
with
the
Ken
tuck
y In
stitu
te f
orE
duca
tiona
l Res
earc
h?(E
xam
ples
Inc
lude
task
s, n
ifid
es, p
rom
pts,
sco
dng
guid
es, p
lann
ing
map
, cul
min
atin
g ev
ent,
etc.
)
Orm
ieW
by
Me
Kei
NO
S kr
Man
Raw
at O
nEW
N I
IS?
Wuh
ucili
MIN
N I
NIN
NT
MO
M=
MO
M P
M
Ti
76
11

APPENDIX C
50
?ci

PERFORMANCE ASSESSMENT SURVEY
The purpose of this questionnaire is to assess the degree of implementation of performance assessment that is occurring
iu &sumps moss the Commuuwealth of Kentucky- tialabidmilualbsumanadnuaushatommarium'rill be made. Please read each statement earthily. Fill in the blank check, or circle the answer that most accuratelyreflects your degree of practice or implementation.
Section L Background (Check all appropriate Items and fill in appropriate blanks)
Primary Intermediate (4-5) heddle/Junior }Ugh High Sdiool
Teaching Experience: 1.-5 yrs.__ 6-10 yrs. 11-15 yrs. 16-20 yrs.21-25 yrs. 26-30 yrs. 31 plus yrs.
Subject(s) Taught
Have You referred to Irlasfamaii2uriZzasuaktit CilaigIthallariMeMi this year? _yes noHave you referred to any national stsndards developed in your subject area this year? _yes noHave you referred to state or district content guidelines for your subject area this your? _yes _noHave you referred to any common released items from earlier KMIS assessments this year? _yes noHave you referred to the KIRIS ASIOCSIIMCIlt Curriculum Report for your school this year? _yes _no
Section IL Performance Assessment Survey (Check all appropriate items)
How often do you use the following types of performance assessment in your classroom?(Chock appropriate time period for each question)
once or have notInmsfAssasonal flax Itssidx saigfuna Ili&JUSIE
I. Open ended questions (oral) _2. Open aided questions (written)3. Performance Event Tasks
(on demand one hr. tasks)4. Portfolio tasks or prompts _ _ _5. Culminating Performance _ _ _6. Projects _ _7. Testing of discrete skills _ _ _8. conferencing9. Anecdotal Records
-
10. Other (specific)-- - - - -
How often have you used the following strategies in your classroom this year?(Check appropriate time period for each question)
kill319Bililtalnlita11. Students are given the performance standards
in advance of a wit, project, or topic.
12. Samples of exanplary performance areshown to students or placed on display.
13. A rubric is used to evaluate snident work
14. Technology is used in assessment process.
AbmAn FreQuently DSCIBOU114 liatisi,IOl
1 =11
80
_.111111, -01 -

IOSILUCtigniatitecasetimsd)15. Hands-as manipulative are used in a
of a peon:lance asseasment.
Alma Ersoacollx Diallai20111X Nat_XciaiMMINe. =11111110
Complete the following sentences by selecting the answer that most accurately reflectsyour practice.
16. student tasks and assusments in my classroom are linked to Kentucky's academic =pectinous?a All b. Most c.. Scene d. Few e. No
17. student tasks and UsCSSIDCULI in my classroom are linked to a set of national contest standards?a All b. Most c.. Some d. Few e. No
18. gliding tasks and assessments in my classroom are linked to-the state content guidelines?a. All b. Most c.. Some d. Few e. No
19. Student performance assessments in my classroom
a cover a broad range of content across academic expectations in several learning goals.b. address a range of academic expectations under one learning goal.c. address a limited range of content and focus on a few academic acpectations.el_ address a narrow range of content and focus on one or two academic expectances.e. address =tent only without regard to any acadanic =pectinous.
16. student performance assessments in my clusroom present problems and challenges thatare based inreal world experiences.
a All b. Most c. Some d. few e. No
17. student perfosmance assessments in my classrocm come from textbook-related material presented inhypothetical or simulated situations.
a. All b. Most c. Some d. few e. No
18. instructiooal decisices I make in the classroom are directly related to information gained from theKIRIS Assessment Curricuhim Report of my school.
a All b. Most c. Some d. few e. No
-19. I spend most of the instructional time in my claw=
a disseminating information, covering the content, importing knowledge.b. mostly disseminating knowledge and content, some coaching, some motivating.c. split between imparting knowledge, motivating and challenging students.
d. mostly catching, providing feedback, challenging and motivating students.
How often do the following types devaluation and feedbacknear in your classroom?(Check appropriate time period fee each question)
end of end of notIrmaarligatigasulbark day zakix gradiausti2d don
21. Students evaluate and reflect on own work Ms220 Students audit other gudents work23. Teacher evaluates or audits student work and
gives feedback24. Evaluation is cooperative effort between
student and Lather25. Stucknt's work is displayed
BEST COPY AVAILABLE
81
01,

APPENDIX D
53
82

TABLE D.1
FREQUENCY OF USE OF OPEN.ENDED QUESTIONS (ORAL)PERCENT OF TEACHERS BY SCHOOL LEVEL
Daily Weekly End of Unit Once/Twice Not Yet
Elem. Schooln=183
61.7 30.1 5.5 1.1 1.6
Middle Schooln=147
33.3 44.2 6.8 4.1 11.6
High School
n=163
42.9 37.4 7.4 4.9 7.4
Chi-Square
Mantel-HaenszelValue4.77100
TABLE D.2
Signifiranca.00001
FREQUENCY OF USE OF OPEN-ENDED QUESTIONS (WRITTEN)PERCENT OF TEACHERS BY SCHOOL LEVEL
Daily Weekly End of Unit Once/Twice Not Yet
Elem. Schooln=181
16.0 45.3 21.5 7.2 9.9
Middle Schooln=148
3.4 54.7 37.8 2.7 1.4
High Schooln=164
-,
6.7 62.2 25.6 4.9 0.0
Chi-SquareMantel-Haenszel
yalil:3.58447
54
83
D_E
1
Significance.05832

TABLE D.3
FREQUENCY OF USE OF PERFORMANCE EVENT TASKSPERCENT OF TEACHERS BY SCHOOL LEVEL
Daily Weekly End of Unit Once/Twice Not Yet
Elem. Schooln=184
3.8 18.5 40.2 16.3 21.2
Middle Schooln=146
0.7 15.1 38.4 23.3 22.6
High Schooln=163
6.7 30.7 27.6 27.6 7.4
_.
Chi-SquareMantel-Haenszel
yalim4.68725
TABLE D.4
Significance.03039
FREQUENCY OF USE OF PORTFOLIO TASKSPERCENT OF TEACIFERS BY SCHOOL LEVEL
Daily Weekly End of Unit Once/Twice Not Yet
Elem. Schooln=184
13.6 47.8 26.6 7.6 4.3
Middle Schooln=148
7.6 35.1 37.8 14.9 4.7
High Schooln=163
3.1 40.5 42.3 11.7 2.5
Chi-SquareMantel-Haenszel
Value10.63992
55
84
la1
Significanat.00111
1

TABLE D.5
FREQUENCY OF USE OF CULMINATING PERFORMANCESPERCENT OF TEACHERS BY SCHOOL LEVEL
- Daily Weekly End of Unit Once/Twice Not Yet
Elem. Schooln=178
3.4 12.4 65.7 7.9 10.7
Middle School
n=145
-0.7
-6.2 50.3 20.7 22.1
High Schooln=159
1.3 11.3 39.0 17.6 30.8
Chi-SquareMantel-Haenszel
Value29.83968
TABLE D.6
DE1
Significance.00000
FREQUENCY OF USE OF PROJECTSPERCENT OF TEACHERS BY SCHOOL LEVEL
Daily Weekly End of Unit Oncet Twice Not Yet
Elem. Schooln=181
1.7 18.2 61.9 14.4 3.9
Middle Schooln=145
3.4 13.1 37.2 34.5 11.7
High Schooln=160
3.8 11.9 36.9 33.1 14.4
Chi-SquareMantel-Haenszel
Value20.31025
56
85
1
Significance.00001

TABLE D.7
FREQUENCY OF USE OF CONFERENCESPERCENT OF TEACHERS BY SCHOOL LEVEL
Daily Weekly End of Unit Once/Twice Not Yet
Elem. Schooln=181
24.3 44.8 13.3 13.3
_
4.4
Middle Schooln=144
15.3 31.9 18.8 18.8 15.3
High Schooln=161
16.8 32.9 15.5 19.9 14.9
Chi-SquareMantel-Haenszel
Value19.31319
TABLE D.8
Significant&
.00001
FREQUEN CX OF USE OF ANECDOTAL COMMENTSPERCENT OF TEACHERS BY SCHOOL LEVEL
Daily Weekly End of Unit Once/Twice Not Yet
Elem. Schooln=181
23.2 29.8 18.8 8.8 19.3
Middle Schooln=141
8.5 15.6 9.9 15.6 50.4
High Schooln=156
5.1 14.1 9.6 11.5 59.6
Chi-SquareMantel-Haenszel
Value76.03184
57
86
Significance.00000

TABLE D.9
PERCENT OF TEACHERS BY SCHOOL LEVELUSING SELECTED SUPPORT DOCUMENTS
TransformationsKY Framework
NationalStandards
ContentGuidelines
KIRIS Open-Response Items
KIRIS Assess.Curriculum Rpt
Elem. Schooln=180
87.2 55.6 83.9 76.1* 68.9
Middle Schooln=147
90.5 56.5 87.8 89.1* 76.2
High Schooln=163
90.8 60.7 85.3 91.4* 71.6
Chi-Square* Likelihood Ratio
yaluc17.93399
58
87
Significance.00013

TABLE D.10
FREQUENCY OF USING TECHNOLOGY FOR ASSESSMENTPERCENT OF TEACHERS BY SCHOOL LEVEL
Always Frequently Occasionally Not Yet
Elem. Schooln=184
9.8 31.0 27.2 32.1
Middle Schooln=146
4.8 27.4 46.6 21.2
High Schooln=161
10.6 40.4 37.9 11.2
Chi-SquareMantel-Haenszel
Value7.67991
DE1
TABLE D.11
Significance.00558
FREQUENCY OF USING HANDS-ON TECHNIQUES FOR ASSESSMENTPERCENT OF TEACHERS BY SCHOOL LEVEL
Always Frequently Occasionally Not Yet
Elem. Schooln=183
20.2 57.9
.20.2
,
1.6
Middle Schooln=140
9.3 42.9 32.9 15.0
High Schooln=162
9.3 37.0 42.0 11.7
Chi-SquareMantel-Haenszel
yahic41.94918
DE1
59
88
Significanc&.00000

TABLE D.12
FREQUENCY OF PROVIDING STUDENTS WITH STANDARDS IN ADVANCEPERCENT OF TEACHERS BY SCHOOL LEVEL
Always Frequently Occasionally Not Yet
Elem. Schooln=182
18.7 34.1 30.2 17.0
Middle Schooln=144
24.3 44.4 25.0 6.3
High Schooln=163
39.3 38.7 19.0 3.1
Chi-SquareMantel-Haenszel
Value35.02914
DE1
TABLE D.13
Significance.00000
FREQUENCY OF PROVIDING STUDENTS WITH RUBRICSPERCENT OF TEACHERS BY SCHOOL LEVEL
Always Frequently Occasionally Not Yet
Elem. Schooln=182
9.9 32.4 35.7 22.0
MiddleSchooln=144
17.6 42.6 31.1 8.8
High Schooln=163
34.4 36.8 26.4 2.5
Chi-Squarelantel-Haenszel
Value51.95993
60
89
i gni fi c an c e
.00000

APPENDIX E
61
90

TABLE E.1
_
FREQUENCY OF USE OF OPEN-ENDED (WRITTEN) TASKSPERCENT OF TEACHERS BY PRIMARY AND INTERMEDIATE LEVELS
Daily Weekly End of Unit Once orTwice aYr.
,
Not Done
Primaryn=114
13.2 36.8 23.7 11.4 14.9
Intermediaten=67
20.9 59.7 17.9 0.01
1.5
Chi-SquareMantel-HaenszelContingency Coefficient
Value18.77474
.33172
TABLE E.2
Significance.00001.00017
FREQUENCY OF USE OF PERFORMANCE EVENT TASKSPERCENT OF TEACHERS BY PRIMARY AND INTERMEDIATE LEVELS
Daily Weekly End of Unit Once orTwice aYr.
Not Done
,
Primaryn=117
9.4 38.5 36.8 11.1 4.3
Intarmediaten=67
20.9 64.2 9.0 1.5 4.5
Chi-SquareMantel-HaenszelContingency Coefficient
Value18.77474
.33172
62
91
Significanct.00001.00017

TABLE E.3
FREQUENCY OF USE OF PROJECTSPERCENT OF TEACHERS BY PRIMARY AND INTERMEDIATE LEVELS
Daily Weekly End of Unit Once orTwice aYr.
Not Done
Primaryn=116
1.7 25.0 58.6
-
12.1 2.6
Intermediaten=65
1.5 6.2 67.7-
18.5 6.2
Chi-SquareMantel-HaenszelContingency Coefficient
Value8.12183
.33172
TABLE E.4
Significance.00437.02406
FREQUENCY OF USE OF ANECDOTAL COMMENTSPERCENT OF TEACHERS BY PRIMARY AND INTERMEDIATE LEVELS
Daily Weekly End of Unit Once orTwice aYr.
Not Done
Primaryn=116
25.0 34.5 21.6 6.0 12.9
Intermediaten=65
20.0 21.5 13.8 13.8 30.8
Chi-SquareMantel-HaenszelContingency Coefficient
yaluc9.11476
.26648
63
92
DE1
Significance.00254.00784

TABLE E.5
FREQUENCY OF USE OF SELECTED RESOURCE DOCUMENTS
_PERCENT OF TEACHERS BY PRIMARY AND INTERMEDIATE LEVELS
TransformationsKY Framework
NationalStandards
ContentGuidelines
KIRIS Open-Response Items
*
KIRIS Assess.Curriculum Rpt
*
Primaryn=113
87.6 56.6 85.8 69.0 64.6
Intermediaten=67
86.6 53.7
.,
80.6 88.1 76.1
Chi-Square Value 12E Significance
* Likelihood Rado 9.04940 1 .00263
* Phi .21577 .00379
TABLE E.6
FREQUENCY OF PROVIDING STUDENTS WITH STANDARDS IN ADVANCEPERCENT OF TEACHERS BY PRIMARY AND INTERMEDIATE LEVELS
Always Frequently Occasionally Not Yet
Primaryn=116
14.7 27.6 36.2 21.6
Intermediaten=66
25.8 45.5 19.7 9.1
Chi-SquareMantel-HaenszelContingency Coefficient
Value11.99730
.27032
64
93
Significance.00053.01162

TABLE E.7
FREQUENCY OF THE USE OF TECHNOLOGY IN ASSESSMENTPERCENT OF TEACHERS BY PRIMARY AND INTERMEDIATE LEVELS
Always Frequently Occasionally Not Yet
Primaryn=117
12.8 28.2 24.8 34.2
Intermediaten=67
4.5 35.8 31.3 28.4
Chi-SquareMantel-HaenszelContingency Coefficient
Value0.04504
.16193
TABLE E.8
Significance.83193.17516
FREQUENCY OF THE USE OF HANDS-ON STRATEGIES IN ASSESSMENTPERCENT OF TEACHERS BY PRIMARY AND INTERMEDIATE LEVELS
Always Frequently Occasionally Not Yet-
Primaryn=116
...
25.9 62.1 11.2 0.9
Intermediaten=67
10.4 50.7 35.8 3.0
Chi-SquareMantel-HaenszelContingency Coefficient
Value.17.65847
.31264
65
94
Significance.00003.00018

TABLE E.9
FREQUENCY OF STUDENTS AUDITING OTHER STUDENT WORKPERCENT OF TEACHERS BY PRIMARY AND INTERMEDIATE LEVELS
Daily Weekly End of Unit End of GradingPer.
Not Done
Primaryn=112
12.5 28.6 17.9 5.4
_
35.7
Intermediaten=64
17.2 51.6 20.3 0.0 10.9
Chi-SquareMantel-HaenszelContingency Coefficient
Va ue15.17664
.31495
TABLE E.10
la1
Significance.00010.00066
FREQUENCY OF STUDENT WORK DISPLAYEDPERCENT OF TEACHERS BY PRIMARY AND INTERMEDIATE LEVELS
Daily Weekly End of Unit End of GradingPer.
Not Done
Primaryn=115
.
27.8 51.3 18.3 1.7
-0.9
Intermediaten=65
15.4
,
35.4 40.0 4.6 4.6
Chi-Square Value 12E SignificanceMantel-Haenszel 13 80916 1 .00020Contingency Coefficient .28929 .00248
66
95

APPENDIX F
67
96

TABLE F.1
FREQUENCY OF USE OF OPEN-ENDED QUESTIONS (ORAL)PERCENT OF TEACHERS BY SUBJECT AREA
Daily Weekly End of Unit Once/Twice Not Yet
Language Artsn=107
50.5 38.3 2.8 3.7 4.7
Mathematicsn=85
41.2 32.9 11.8 3.5 10.6
Sciencen=68
36.8 47.1 5.9 5.9 4.4
Social Studiesn=66
34.8 43.9 4.5 3.0 13.6
Chi-SquareMantel-Haenszel
Value4.40007
TABLE F.2
Significance.03594
FREQUENCY OF USE OF PERFORMANCE EVENT TASKSPERCENT OF TEACHERS BY SUBJECT AREA
Daily Weekly End of Unit Once/Twice Not Yet
Language Artsn=107
3.7 15.9 30.8 26.2 23.4
Mathematicsn=86
1.2 25.6 30.2 29.1 14.0
Sciencen=68
8.8 32.4 38.2 13.2 7.4
Social Studiesn=66
,
4.5 27.3 28.8 33.3 6.1
Chi:higUa[CMantel-Haenszel
Value11.63413
68
97
DE1
Significance.00065

TABLE F.3
FREQUENCY OF USE OF PORTFOLIO TASKSPERCENT OF TEACHERS BY SUBJECT AREA
Daily Weekly End of Unit Once/Twice Not Yet
Language Artsn=107
12.1 55.1 22.4 8.4 1.9
Mathematicsn=86
5.8 30.2 54.7 5.8 3.5
Sciencen=67
0.0 29.9 34.3 28.4 7.5
Social Studiesn=66
1.5 32.4 48.5_
13.2 4.4
Chi-SquareMantel-Haenszel
Value24.35730
TABLE F.4
1
Significance.00000
FREQUENCY OF USE OF CULMINATING PERFORMANCESPERCENT OF TEACHERS BY SUBJECT AREA
Daily Weekly End of Unit Once/Twice Not Yet
Language Artsn=106
0.9 10.4 58.5 15.1 15.1
Mathematicsn=83
2.4 6.0 39.8 18.1 33.7
Sciencen=67
0.0 9.0 44.8 14.9
_
31.3
Social Studiesn=63
0.0 7.9 46.0 19.0 27.0
Chi-SquareMantel-Haenszel
yalua4.62910
69
98
DE1
Significance.03143

TABLE F.5
FREQUENCY OF USE OF CONFERENCESPERCENT OF TEACHERS BY SUBJECT AREA
Daily Weekly End of Unit Once/Twice Not Yet
Language Artsn=106
18.9 47.2 14.2 12.3 7.5
Mathematicsn=83
17.4 20.9 24.4 25.6 11.6
Sciencen=67
13.8 32.3 9.2 20.0 24.6
Social Studiesn=63
10.6 37.9 15.2 24.2 12.1
Chi-SquareMantel-Haenszel
Value7.64552
70
99
DE1
Significanaa.00569

TABLE F.6
FREQUENCY OF DISPLAYING STUDENT WORKPERCENT OF TEACHERS BY SUBJECT AREA
Always Frequently Occasionally Not Yet-Language Artsn=107
24.3 44.9 27.1
_3.7
Mathematicsn=85
12.9 28.2 44.7 14.1
Sciencen=67
7.5 49.3 31.3 11.9
Social Studiesn=68
10.3 44.1 44.1 1.5
Chi-SquareMantel-Haenszel
Valut4.53660
TABLE F.7
Significance.03318
FREQUENCY OF USING TECHNOLOGY FOR ASSESSMENTPERCENT OF TEACHERS BY SUBJECT AREA
Always Frequently Occasionally Not Yet
Language Artsn=105
9.5 41.0 31.4 18.1
Mathematicsn=84
8.3
,39.3 35.7
_16.7
.
Sciencen=68
11.8 26.5 47.1 14.7
Social Studiesn=67
3.0 23.9 55.2 17.9
Chi-SquareMantel-Haenszel
Value4.45212
DE
71
100
Significance.03486

APPENDIX G
72
1. 0 1

TABLE G.1
FREQUENCY OF USE OF PERFORMANCE EVENT TASKSPERCENT OF TEACHERS BY TEACHING EXPERIENCE
Daily Weekly End of Unit End ofGrading Per.
Not Done
-_1-5 Yearsnt=111
23.3 45.6 26.1.
2.8 2.2
6-10 Yearsn=105
7.9 31.4 32.9 9.3 18.6
11-15 Yearsn=76
-5.2 16.8 29.0 12.9 36.1
16-20 Yearsn=71
0.0 12.7 39.4 26.8 21.1
21-25Yearsn=93
1.1 25.8 24t.7 25.8 22.6
26-30 Yearsn=30
0.0 14.4 28.6 14.3 0.0
Chi-SquareMantel-Haenszel
Value11.83280
73
102
D.E1
Significance.00058

TABLE G.2
FREQUENCY OF USE OF SUPPORT DOCUMENTSPERCENT OF TEACHERS BY TEACHING EXPERIENCE
TransformationsKY Framework
NationalStandards
ContentGuidelines
KIRIS Open-Response Items
KIRIS Assess.Curriculum Rpt
1-5 Yearsn=111
81.1 64.0* 88.3 84.7 67.6
6-10 Yearsn=105
91.4 58.1* 76.2 82.9 60.0
11-15 Yearsn=76
90.8 539* 88.2 85.5 81.6
16-20 Yearsn=71
95.8 577* 78.9 85.9 81.7
21-25Yearsn=93
88.2 577* 88.2 86.0 75.3
26-30 Yearsn=30
90.0 43.3* 96.7 76.7 66.7
Chi-Square* Maruel-Haenszel
Yam6.93735
74
103
a1
Significance.00844

APPENDIX H
75
104

1
TABLE H-1
Distribution of Collected Performance Assessment Artifacts by Subject Area
Artifact TypeWriting/Language Arts Mathematics Science Social Studies
Open-EndedQuestions 12 15 27 19
PerformanceTasks 5 14
_
32
.
4
TraditionalTests 8 5 13 5
PortfolioPrompts/Tasks 0 15 0 0
Culminating Per-formance/Projects 2 0 5 7
Scoring Rubrics/Work Guides 31 16 15 19
76
105