Embed Size (px)
Citation preview

DOCUMENT RESUME
ED 368 237 HE 027 171
TITLE Utah System of Higher Education Data Book (Supplementto Operating Budget Request) 1993-94.
INSTITUTION Utah State Board of Higher Education, Salt LakeCity.
PUB DATE Dec 92NOTE 439p.; For the 1994-95 databook, see HE 027 172; for
an earlier data book, see ED 362 076.PUB TYPE Statistical Data (110)
EDRS PRICE MF01/PC18 Plus Postage.DESCRIPTORS Academic Libraries; Budgeting; Comparative Analysis;
*Degrees (Academic); Educational Finance; *EnrollmentTrends; *Higher Education; Salaries; Student Costs;Tables (Data); Teacher Salaries; TechnologyEducation; *Trend Analysis; Tuition
IDENTIFIERS *State College and University Systems; *Utah
ABSTRACTThe Utah system of higher education data book for
1993-94 offers an executive summary and 12 sections of detailedsupporting data and information. The executive summary notes majorfindings including: awarding of 13,576 degrees in 1991-92; enrollmentof 100,200 students in the fall of 1992; growth of noncreditcustomized training; increased importance of student financial aid ascosts have increased faster than family income; decline in thepercentage of state funds allocated to higher education; averagedirect costs of almost $3,000 per full time equivalent student;ezistence of faculty and staff compensation gaps when compared tocomparison institutions; and library collections which are notkeeping pace with needs. Individual sections then provide data on thefollowing: degrees and awards granted including those awarded atnon-public institutions; enrollment projections and enrollmentdetail; vocational education; tuition and fees; student financialaid; system financial information; budget history; a cost study;staffing costs; salary and compensation; individual financialindicator profiles comparing Utah institutions to comparisoninstitutions; and system libraries. (JB)
***********************************************************************
Reproductions supplied by EDRS are the best that can be madefrom the original document.
***********************************************************************

UTAH SYSTEM OF HIGHER EDUCATION
Box Eider
1,551
Tooele
920
Cacho
6,517Logan
Rich
Brigham City86
WeberOgden r 4
Dam Morgan
Layton S2809,199 (
Tooele
Juab
189
Salt Lake34,256
Utah
Nephi
Millard
Delta
662
Fillmore
Beaver
161
1993-94DATA BOOK
Summit629
Wasatch
Heber
Provo
3229,413
Duchesne
Roosevelt
658
Daggett 35
_J-N'N/"\s.Uintah
Sanpete
1,085
Ephraim
Sevier
Richfield
719
Iron
1,850
Cedar City
2,787
St George
Piute
63
Gailietd
Carbon1,522
Price
Vernal
833
Errery
665
Grand
291
Moab
Wayne
106
139
Panguitch
Kane
Kanab187
San Juan
Bland.ng
Fall 1992 Enrollment by County
BEST COPY AVAILABLE 2
605"PERMISSION TO REPRODUCE THISMATERIAL HAS BEEN GRANTED BY
Utah System of
Higher Education
TO THE EDUCATIONAL RESOURCESINFORMATION CENTER fERICI."
U.S. DEPARTMENT Of EDUCATIONOetce of Educational ReSarCh and improvement
EDUCATIONAL RESOURCES INFORMATIONCENTER (ERIC)
CI This document nas Peen reproduced esreceived from the person or organitafionoriginating itMmor changes nave been made 10 improvereproduCtiOn Qulirly
Points ol view of Opinions staled in pus document do nOt neCessafily represent officialOERI position Or pohCy

UTAH SYSTEM OF HIGHER EDUCATIONFall 1992 Budget-Related and Self-Supporting Headcount Enrollment
By Residency
RESIDENTSCounty UofU USU WSU SUU Snow Dixie CEU UVCC SLCC Total
Box Elder 108 946 394 22 21 19 6 21 14 1,551
Cache 142 6,090 149 26 44 13 6 24 23 6,517
Daggett 1 21 7 2 0 0 1 2 1 35
Davis 1,858 1,001 4,916 88 98 57 27 101 1,053 9,199
Duchesne 32 468 26 8 27 5 13 69 10 658
Morgan 12 44 200 4 7 3 0 3 7 280
Rich 3 66 11 2 0 2 1 1 0 86
Salt Lake 14,083 2,134 1,113 384 478 211 135 397 15,321 34,256
Summit 280 64 71 21 18 16 1 24 134 629
Tooele 109 394 53 39 49 16 9 33 208 920
nintah 26 623 54 14 21 3 16 62 14 833
Utah 1,346 836 485 186 232 107 95 5,843 -283 9,413
Wasatch 50 38 21 9 30 19 . 8 112 35 322
Weber 526 669 6,062 16 17 43 5 27 159 7,524
TOTAL NORTHERN 18,576 13,394 13,572 821 1,042 514 323 6,719 17,262 72,223
Beaver 6 18 12 101 2 7 1 8 6 161
Carbon 85 162 31 22 4 1 1,197 6 12 1,522
Emery 23 83 13 18 39 7 459 15 8 665
Garfield 4 10 13 82 7 13 0 8 2 139
Grand 28 126 12 21 7 2 86 6 3 291
Iron 57 88 43 1,609 2 26 8 15 1,850
Juab 17 20 12 14 62 1 1 59 3 189
Kane 9 18 7 105 5 19 2 19 3 187
Millard 31 96 21 155 238 20 8 85 8 662
Piute 2 13 0 34 9 1 0 3 1 63
San Juan 16 52 44 46 19 5 379 30 14 605
Sanpete 51 194 51 57 665 6 6 49 6 1,085
Sevier 36 97 21 150 328 13 4 60 10 719
Washington 153 152 100 415 17 1,891 5 35 19 2,787
Wayne 5 33 6 32 5 4 3 13 5 106
TOTAL SOUTHERN 523 1,162 386 2,861 1,409 2,018 2,159 411 102 11,031
NATIVE AMERICANS * 0 0 2 3 0 16 68 0 0 89
OTHER @ 4,523 0 276 384 4 114 128 1,322 8 6,759
TOTAL RESIDENTS 23,622 14,556 14,236 4,069 2,455 2,662 2,678 8,452 17,372 90,102
NONRESIDENTSOther U.S. 1,907 1,558 461 341 151 166 42 900 196 5,722
Foreign 1,270 1,000 296 24 213 40 26 271 199 3,339
TOTAL NONRESIDENTS 3,177 2,558 757 365 364 206 68 1,171 395 9,061n
TOTAL ENROLLMENT 26,799 17,114 14,993 4,434 2,819 2,868 2,746 9,623 17,767 99,163
* Native American students who are classified as residents for tuition assessment according to state law,but do not have Utah as their state residence.
@ Includes Undetermined, Military, Job Corps. For UofU includes Off-Campus Residents; Off-Carmus Nonresidents
included in Other U.S.
NOTE: This table corresponds to the data included on the cover of the 1993-94 Data Book.
:3
BEST COPY AVAILABLE

UTAH SYSTEM OF HIGHER EDUCATION
DATA BOOK
(Supplement to Operating Budget Request)
1993-94
Submitted to
THE HON. NORMAN H. BANGERTER, GOVERNORand THE GOVERNOR-ELECT MICHAEL 0. LEAVITT
and the
50TH LEGISLATURE OF THE STATE OF UTAH
GENERAL SESSION 1993
UTAH STATE BOARD OF REGENTSPUBLISHED BY THEOFFICE OF THE COMMISSIONER OF HIGHER EDUCATION
DECEMBER 1992

TABLE OF CONTENTS
I I
Description of the Utah System of Higher Education i
Organizational Listing of Names ii
Boards of Trustees iii
Presidents of Member Institutions iv
Executive Summary TAB A
Degrees and Awards TAB B
Enrollments TAB C
Vocational Education TAB D
Tuition and Fees TAB E
Student Financial Aid TAB F
Financial Information TAB G
Budget History TAB H
Cost Study TAB I
Staffing TAB J
Salary and Compensation TAB K
Comparisons TAB L
Libraries TAB M

TDESCRIPTION OF THEUTAH SYSTEM OF
HIGHER EDUCATION
The Utah System of Higher Education consists of nine public colleges and universitiesgoverned by the State Board of Regents, assisted by local Boards of Trustees. The systemincludes two major research/teaching universities, two metropolitan/regional universities, andfive community colleges. The basic missions of these nine institutions are described below.
UNIVERSITY OF UTAH
The mission of the University of Utah is that of a major urban state university withsignificant programs of sponsored research and of graduate, professional, and undergraduate
education in some 15 colleges and professional schools and their authorized degree programs.
UTAH STATE UNIVERSITY
Utah State University serves as the state's land-grant institution under state and federal
legislation and is a primary center of university research and of graduate, profeasional, andundergraduate education in numerous authorized fields of study.
WEBER STATE UNIVERSITY
Weber State University has the mission of a large comprehensive undergraduateinstitution seeking to develop and refine programs and achieve distinction within that mission.Any new graduate programs authorized for the institution will not be oriented toward traditional
basic research.
SOUTHERN UTAH UNIVERSITY
Southern Utah University has the mission of a four-year undergraduate teachinginstitution meeting the baccalaureate and assigned vocational training needs of Southern Utah.
COMMUNITY COLLEGES
Snow College, Dixie College, the College of Eastern Utah, Utah Valley CommunityCollege, and Salt Lake Community College have similar missions as open-accesscomprehensive community colleges addressing area needs with programs of vocational-technical training, transfer and general education, continuing education for personalenrichment or career counseling, developmental remedial studies, and placement. Programofferings and areas of emphasis among these institutions will differ according to various needsand demands of the students and communities served.

ORGANIZATIONALLISTING OF NAMES
Kenneth G. AndertonAileen H. ClydeLany D. CoxIan M. CummingDouglas S. Foxley, ChairmanJohn B. GoddardRobert D. HalesL Brent Hoggan
Douglas S. Foxley
Ececufwe COMMIlleeDouglas a Foxley, ChairmanSteven E Snow, Vice ChairmanClifford S. LeFevrePaul S. RopersFred H. StringhamDale 0. Zabriskie
Budget and FaienceFred H. Stringham, ChairmanJohn B. Goddard, Vice ChairmanL Brent HogganNchael 0. LeavittSteven E. Snow
UTAH STATE BOARD OF REGENTS
SHIVSEE Lawn Commitiee
Clifford S. LeFevre
STANDING CCAMITTEES
OFFICE OF 71-E CONSAISSIONERUtah System of ligher Education
355 West No Temple, 3 Triad Suite 550Satt Lake City, Utah 84180-1205 (801) 538-5247
Karen H. HuntsmanMichael 0. LeaviffEvetyn B. LeeClifford S. LeFevrePaul S. RogersSteven E Snow, Wm ChairmanFred H. StringhamDale 0. Zabriskie
Evetyn B. Lee
Pcadarnic ind Vocational EducaianClifford S. LeRwre, ChairmanDale 0. Zabriskie, Vice ChairmanAileen H. ClydeLarry D. CoxEvelyn B. Lee
Planning and FacilitiesPaul S. Rogers, ChairmanIan M. Cumming, Vice ChairmanKenneth G. AndertonFbbert D. HalesKaren H. Huntsman
Wiliam Rotfe Kell, CommissionerDon A. Carpenter, Associate Commirsioner for Planning and FacilitiesCecelia H. Foxley, Deputy Commissioner for Higher EducationDale C. Hatch, Associate Commissioner for Budget and RnanceChalmers Gail Norris, Associate Commissioner for Student Rnancial AidHarden FL Ewing, Executive Assistant to the CommissionerRchard 0. Davis, Assistant Commissioner for Student Loan RnanceDavid A Feltz, Assistant Commissioner for Student Financial AldMax S. Lowe, Assistant Commissioner for Vocational EducationSterling R. Provost, Assistant Commissioner for Veterans Education and Proprietary SchoolsMark H. Spencer, Assistant Commissioner for Academic AffairsJerry H. Fullmer, Director of hformation SystemsBarbara S. Gitlins, Director of Business Affairs
i i

Louis H. Canister, Vice ChairmanCleone P. EcclesG. Donald Gale (Alumni Pres.)Robert H. GarffJames S. Jardine, Chairman
J. Clark BallardJames W. Bingham, Mee ChairmanLee H. BurkeKeith Johnaon (Student Body Pres.)Bruce L Jorgensen (Alumni Pres.)
Fred S. Ball, Vice ChairmanErnest DurbanoBryce C. RammMorris HansenJohn A. Undquist
Jerald Bybee (Alumni Pres.)R Don CashHans ChamberlainJames HoyleLois hierson, Vice Chairman
Newlin Bagnall (Student Body Pres.)Gary L Carlston, ChairmanJanet GreenhalghDavid W. ligharn (Alumni Pres.)Fermi D. Huntsman
Bette 0. ArialSrdney J. AtkinMaureen H. BoothReed M. GardnerDale J. Lambert, Vice Chairman
Univerarlya Utah
Utah Stage University
Weber Stele Unkanity
Southern Utah Univeraly
Snow College
Elsie Canoga
Callow of Eastern UtahMike DalpiazMargaret DaytonJames JensenMark Justice (Student Body Pres.)Scott McArthur, Chairman & (Alumni Pres.)
Alan C. Mhton, Mee ChairmanJoseph A. CannonLawrence A. HainesRay M. Harding, Jr., ChairmanNancy M. Houston
Julie BarrettPolka BoieyJoan Bumside, ChairpersonDavid Carlson (Student Body Pres.)M. Dale Ensign
Utah Valey Community College
Silt Lake Community Coiege
Leonard J. LewisNancy K. PaceJohn PriceReed T. SearleTerms E Taylor (Sknent Body Pres.)
'Am D. LaubFrank Maughan, Jr.Bonnie F. Nielsen, ChairmanJed H. PitcherMelanie P. RaymondC. Booth Wallentine
Rchard E Myers, ChairmanShaun Myers (Alumni Pres.)Carolyn Rich NebekerMeinda L lbylence (Slud. Bcdy Pies.)John E Ulibarri
Sandy Lord (Student Body Pres.)Jacque MarthantSteve MarshallKL Mciff, ChairmanA Lear Thorpe
LaMar MonroeRchard R. Olaon, Vice ChairmanAlva C. SnowRuth TempestThorpe Wirklingham
Scott S. Lovell (Alumni Pres.)G. LaMont RchardsMem Ea Walley (Slud. Body Res.)Robert F. WeyherRandy W. Wlkinson, Chairman
Mck SampinosDoug SonntagRobert Swinbume, Moe ChairmanAdrian TaylorManuel Torres
Gregory S. Nelson (Alumni Pres.)Delance W. SquireBeth TolbertPaul John VonStraii (Stud Bcdy Pres)Mary Anne Q. Wood
Randy Foote (Alumni Pres.)Thomas W. ForsgrenMayne JohnsonMichael N. MartinezF Warren Nierrneyer, Vce Chairman

I
PRESIDENTSOF MEMBER INSTITUTIONS
I
Arthur K. SmithUniversity of UtahSalt Lake City, Utah 84112
Gerald R. SherrattSouthern Utah UniversityCedar City, Utah 84720
Michael A. PetersenCollege of Eastern UtahPrice, Utah 84501
Paul H. ThompsonWeber State University
Ogden, Utah 84408
Douglas D. AlderDixie College
St. George, Utah 84770
Frank W. BuddSalt Lake Community College
Salt Lake City, Utah 84130
iv 9
George H. EmertUtah State UniversityLogan, Utah 84322
Gerald J. DaySnow CollegeEphraim, Utah 84627
Kerry D. RomesburgUtah Valley Community CollegeOrem, Utah 84058

UTAH SYSTEM OF HIGHER EDUCATIONSTATE BOARD OF REGENTS
1993-94 DATA BOOK(Supplement to Operating Budget Request)
EXECUTIVE SUMMARY
This Executive Summary has been prepared to familiarize the reader with key pieces ofinfomiation contained in this Data Book. Each item is followed by a reference where greaterdetail and analysis can be found.
13,576 degrees and awards were conferred by Higher Educations Public Institutions in
1991-92 as follows:
Certificates/Diplomas of < 1 year 560
Certificates/Diplomas of > 1 year 605
Associate Degrees 4,070
Bachelor Degrees 6,390
Master Degrees 1,450
Doctorate Degrees 280
First Professional Degrees
Li Total Pali& lastketi6v,- - , :_ , '-, ' - - '221
-13416 1
For more information on Degrees and Awards Conferred, see page of Tab B.
The growth in the number of students enrolled by the Utah System of Higher Education
has gone from approximately 57,200 students (approximately 47,600 full time equivalent(FTE) students) in the fall of 1977 to 100,200 students in the fall of 1992 (77,100 FTE).By 2001-02 there are projected to be 144,180 students (109,077 FTE):
Year
- FALL. I-OCT +FALL FTE *AC FTE AY FTE
For more information on USHE Enrollment Levels, see page 3 of Tab C.BEST COPY AVM! A F

Noncredit customized training will continue to be a substantial growth area in the future,particularly if job markets continue to increase and/or a significant need for retainingexists. In 1991-92, the USHE system total headcount for noncredit training was 32,650.Enrollment in credit programs also increased again this year. The Fall Quarter/Semesterof 1992-93, the USHE system total headcount for credit Applied Technology Educationis 19,023 (or 12,678 FTE). This is the fifth strait year of growth in credit-offeringapplied technology education programs in higher education.
For more information on Vocational Education, see page 1 & 2 of Tab D.
Tuition and Fees continue to play a larger role in Higher Education.tuition and fccs for each institution for an academic year FTE:
Following are the
Vaiveriity4Vt*
Resident
Nonresident
$2,104.50
$6,075.00
Resident
Nonresident
$1,497.00
$4,143.00
Resident
Nonresident
$1,084.50
$3,082.50
UteliStaaillniv
Resident
Nonresident
$1,821.00
$4,983.00
Resident
Nonresident
Mile College
$1,068.00
$3,903.00
Resident $1,323.50
Nonresident $3,711.00
1 Saltlike Commit, Ca Ilegit,'Weber Stage Thilieksliti:
Resident
Nonresident
$1,542.00
$4,332.00
Resident
Nonresident
$1,243.20
$3,802.80
Resident $1,317.00
Nonresident $3,780.00
For more information on Tuition and Fees, see page 10 of Tab E.
Student financial aid based on student and family income has become increasinglyimportant as costs of attendance increase faster than family income.
Campus Based Grants & Loans
199192":1;:f
Total USHE funded by Federal & State Appropriations(less Pell Grants)
$16,006,484
USHE Federal Pell Grants (based on financial need ) $45,696,215
Program Based Student Financial Aidw
199192.
Western Interstate Commission for Higher Ed. (WICHE) $939,100
Paul Douglas Teacher Scholarship Program $90,000
Utah Career Teaching Scholarship (UCTS) Program $758,116
The Utah Student Loan Programs, administered by the State Board of Regents (SBR),include the Utah Higher Assistance Authority (UHEAA), the designated state loanguarantee agency for Federal Family Education Loans, reinsured by the U.S. Departmentof EtlilatiOlVand the SBR Loan Purchase Program (LPP), providing a secondary market
BEST COPY AVAILABLE2

and local servicing for UHEAA-guaranteed loans. At June 30, 1992. LPP's portfolioincluded 55,347 individual borrowers with outstanding loan balances totaling
$234,717,681.
Utah Student Loan Programs. . .
14Z Cu'tivit Mita',..
UHEAA guaranteed Federal Reinsured Student Loans $123,509,969 $806,912,571
LPP purchased Guaranteed Student Loans $54,168,658 $454,398,998
LPP originated Consolidation Loans $7,012,094 $23,643,735 I
For more information on Student Financial Aid, see pages 3-5, 10 & 19 Tab F.
The percentage of State General and Uniform School Funds allocated to Higher Education
has declined. In 1986-87 Higher Educations distribution of State General and UniformSchool Funds was 19.05% of the State Budget. In 1992-93 it is 17.78%.
For more information on General and Uniform School Fund percentage distribution, see page 10 of Tab G.
The Tax Fund Appropriations per FTE have decreased over the last 15 years afteradjustments for inflation (constant dollars). The 1991-92 is 12.08% lower than 1976-77.
For more information on the constant dollar expenditures of State Tax Funds, see page 49 of Tab H.
The 1991-92 Appropriated Direct Cost per FlE Student were as follows:
Appropriated Direct Costs per FTE Student (Total all fields and disciplines)
Non-SchGrntg
SchGrntg
LowerDiv
UpperDiv
BasicGrad
AdvanceGrad
Total AllLevels
Costs per FTE Student $4,603 $2,832 $1,613 $4,130 $6,864 $16,569 $2,903
FTE Student/Faculty Ratio 9..'. 16.4 273 15.5 11.5 5.3 19.2
For more information on Appropriated direct costs, see page 7 & 9 of Tab I.
Following is a summary of the E & G salaried personnel FTE positions budgeted for
1992-93 for the USHE.
Position FTE % of total
Regular Faculty 2,835.70 35.22%
Wage Rated Faculty 777.30 9.66%
Teaching Assistants 266.70 3.31%
Executive Staff 276.60 3.44%
Staff 3,894,40 48.37%
Total 11,060.60 100.00%
For more information on E & G salaried FTE positions, see page 2 of Tab .1.
3(...."1
BEST COPY AVAILABLE

Great effort is continually made to recruit and retain quality personnel. All USHEinstitutions, however, suffer sigpificant compensation gaps when compared to theircomparison institutions. The following table summarizes the percent differentials:
-3.88% -11.13%
-12.93% -5.80%
-1.12% -1138%
-13.69% -8.91%
-25.74% 2.70%
-21.92% -4.24%
College of Eastern Utah -2635% -.87%
Utah Valley Community College -20.09% -3.42%
Salt Lake Community College -22.91% 1.12%
For more information on Compensation Gaps, see pages 33 and 53 of Tab K.
The following table shows a comparison of Tax Funds Appropriations per FTE m 1984-85 and 1989-90 of USHE institutions as a percentage of the average tax fundappropriations of comparison institutions:
. ..- .:
gi..
University of Utah 86.27% 80.36%
Utah State University 92.26% 75.22%
Weber State University 97.78% 77.83%
Southern Utah University 101.79% 82.66%
Snow College 125.12% 100.10%
Dixie College 88.28% 8239%
College of Eastern Utah 127.84% 9739%
Utah Valley Community College 6559% 60.66%
Salt Lake Community College 78.85% 71.28%
For more information on Tax Fund Appropriation Comparisons, see pages 9 and 10 of Tab L.
Although the USHE as a whole added 164,177 book volumes to the library collectionsduring the 1991-92 fiscal year, library collections, especially books and serials are a majorconcern among all the USHE institutions. This number of additions, when weighedagainst volumes dropped or significantly reduced, leave all the institutions below desiredlevels.
For more information on library collections, see page 1 of Tab M.
4
BEST COPY AVAILABLE

B. D
egre
es a
nd A
war
ds
! 1
1 5

L TAB BDEGREES & AWARDS
The Degrees & Awards included in Tab B represent Information from institutionstraditionally listed in previous years. This includes all degrees and awards of the nine publicinstitutions in the Utah System of Higher Education and for comparative information, degreGsand awards of traditional non-public institutions: Brigham Young University, WestminsterCollege, and Latter-Day Saints Business College. Not included are awards by otherprivate/proprietary institutions and postsecondary award s by the applied technology centers.
Tables 1 through 8 include Public and Private Institutions1982-83 through 1991-92
TABLE 1 Total Degrees and Awards 1
FIGURE 1 Total Degrees and Awards 1
TABLE 2 Postsecondary Certificates and Diplomas of Less Than One Year .. 2
TABLE 3 Postsecondary Certificates and Diplomas of Greater Than One Yearbut Less Than Four Years 2
TABLE 4 Associate Degrees 3
TABLE 5 Bachelor Degrees 3
TABLE 6 Master Degrees 4
TABLE 7 Doctorate Degrees 4
TABLE 8 First Professional Degrees 5
FIGURE 2 Total Degrees and Awards by Public and Private Institutions 5
TABLE 9 USHE Degrees and Awards by Gender for 1991-92 6
FIGURE 3 1991-92 USHE Distribution of Degrees and Awards 6
FIGURE 4 1991-92 USHE Degrees and Awards by Gender 6
1 1;

TABLE 1Utah Higher Education
Degrees and Awards Conferred by Public and Private Institutions *1982-83 through 1991-92
Year1991-92% Change
over
PercentTotalAwards
Degree or Award 82-83 83-84 84-85 85-86 86-87 87-88 88-89 89-90 90-91 91-92 1990-91 1991-92
Certif/Diploeas of < 1 yrPublic Institutions 478 733 355 381 434 289 307 349 425 560 31.76% 2.70%Private Institutions 0 37 0 27 0 0 0 0 0 0 -- 0.00%Totals 478 770 355 408 434 289 307 349 425 560 31.76% 2.70%
Certif/Diplomes of > 1 yr*Public Institutions 1,189 959 957 938 937 937 935 794 638 605 -5.17% 2.91%Private Institutions 90 25 59 14 54 40 26 11 73 53 -27.40% 0.26%
Totals 1,279 984 1,016 952 991 977 961 805 711 658 -7.45% 3.17%
Associate DegreesPublic Institutions 2,368 2.317 2.426 2,584 2,741 3,097 3,086 3,290 3,596 4,070 13.18% 19.59%Private Institutions 504 523 357 308 250 245 240 169 198 195 -1.52% 0.94%Totals 2.872 2,840 2.783 2,892 2,991 3,342 3.326 3,459 3.794 4,265 12.41% 20.53%
Bachelor DegreesPublic Institutions 5,201 5,315 5,264 5,573 5,707 5,794 5,713 5,892 6,090 6,390 4.93% 30.76%Private Institutions 4,676 4,944 4,897 5,097 5,378 5,025 4,969 5,015 5,251 5,604 6.72% 26.97%
Totals 9,877 10,259 10.161 10.670 11,085 10,819 10,682 10,907 11.341 11,994 5.76% 57.73%
Master DegreesPublic Institutions 1,221 1,186 1,280 1,240 1,326 1,499 1,379 1,427 1,400 1,450 3.57% 6.98%Private Institutions 1,142 1,052 1,114 1,048 1,075 1,074 966 1,052 1,062 1,100 3.58% 5.29%Totals 2.363 2,238 2,394 2,288 2,401 2,573 2,345 2,479 2,462 2,550 3.57% 12.27%
Doctorate DegreesPublic Institutions 239 242 244 248 247 296 249 271 262 280 6.87% 1.35%Private Institutions 132 129 116 123 107 131 118 90 94 98 4.26% 0.47%Totals 371 371 360 371 354 427 367 361 356 378 6.18% 1.82%
First Professional DegreesPublic Institutions 238 230 236 232 217 236 225 222 234 221 -5.56% 1.06%Private Institutions 137 159 143 129 129 142 151 158 149 150 0.67% 0.72%
Totals 375 389 379 361 346 378 376 380 383 371 -3.13% 1.79%
Total Degrees & AwardsPublic Institutions 10,934 10,982 10,762 11,196 11,609 12,148 11.894 12,245 12,645 13,576 7.36% 65.34%Private Institutions 6,681 6,869 6,686 6,746 6,993 6,657 6,470 6,495 6,827 7,200 5.46% 34.66%Totals 17,615 17,851 17,448 17,942 18,602 18,805 18,364 18.740 19,472 20,776 6.70% 100.00%
MM .111111.10Sources: HEGIS Reports, 1982-83 through 1985-86, and IPEDS 1986-87 through 1991-92.
* Private institutions include: BYO, Westminster, and LDS Business College.* Postsec. Certs. & Dip.> 1 yr includes; 1<2 yrs; 2<4 yrs; Post Bachelor's Degrees; Post Master's Degrees
Figure 11991-92 Degrees & Awards ConferredBy Utah's Public & Private Institutions
Associate 21%
Isinnumma..11111111111111111111111111116.
11111111111111111111111NPV.
111111110571041"
Bachelor 58%
1 7
Cert >1 Yr 3%Cert <1 Yr 3%Eirst Prof _2%iuocta
Master 12%

TABLE 2Postsecondary Certificates and Diplomas of Less Than One Year
for Public and Private Institutions1982-83 through 1991-92
Year1991-92% Change
over
PercentTotalAwards
Institutions 82-83 83-84 84-85 85-86 86-87 87-88 88-89 89-90 90-91 91-92 1990-91 1991-92
PUBLIC
University of Utah O 0 0 0 0 0 0.00%Utah State University 0 0 0 0 0 0 0.00%Weber State University 0 0 0 0 0 0 0.00%Southern Utah University 0 0 0 0 0 0 0.00%Snow College 10 0 2 4 9 0 -- 0.00%Dixie College 0 302 0 44 0 0 0 140 250 78.57% 44.64%College of Eastern UtahUtah Valley Community College
0
270
15 1
027
3414
0
21
038
041
036
034 -5.;i*
0.0046.07%
Salt Lake Community College 441 416 352 338 259 269 3 249 276 10.84% 49.29%
TOTAL PUBLIC 478 733 355 381 434 289 307 349 425 560 31.76% 100.00%
PRIVATE
Brigham Young University 0 0 0 0 0 0.004Westminster CollegeLDS Business College
0
00
370 0
0 270
0 00.00%0.00%
TOTAL PRIVATE 0 37 0 27 0 0 0 0 0 0 0.00%
TOTAL PUBLIC & PRIVATE 478 770 355 408 434 289 307 349 425 560 31.76% 100.00%
MMIN.INNSMINIMIIIRMI.M.1111M1411111
TABLE 3Pos'secondary Certificates and Diplomas of Greater Than One Year but Less Than Four Years *
for Public and Private Institutions1982-83 through 1991-92
Year1991-92% Change
over
PercentTotalAwards
Institutions 82-83 83-84 84-85 85-86 86-87 87-88 88-89 89-90 90-91 91-92 199n-91 1991-92
PUBLIC
University of Utah 51 0 66 62 0 93 105 110 94 104 10.64% 15.81%Utah State University 144 119 92 73 88 61 34 52 29 32 10.34% 4.86%Weber State University 99 82 97 93 105 41 32 34 41 38 -7.32% 5.78%Southern Utah University 77 50 31 34 31 15 15 7 16 9 -43.75% 1.37%Snow College 40 24 35 19 16 4 10 11 11 17 54.55% 2.584Dixie College 170 90 127 111 118 266 279 189 61 79 29.51% 12.01%College of Eastern Utah 22 71 57 53 43 58 64 51 66 71 7.58% 10.79%Utah Valley Community College 491 416 373 361 358 282 292 265 240 191 -20.42% 29.03%Salt Lake Community College 95 107 79 132 178 117 104 75 80 64 -20.00% 9.73%
TOTAL PUBLIC 1.189 959 957 938 937 937 935 794 638 605 -5.17% 91.95%
PRIVATE
Brigham Young University 0 0 0 5 0 0 0 0 0 0 -- 0.004Westminster College 0 0 0 0 0 0 0 0 46 28 -39.13% 4.26%LDS Business College 90 25 59 9 54 40 26 11 27 25 -7.41% 3.804
TOTAL PRIVATE 90 25 59 14 54 40 26 11 73 53 -27.40% 8.05%
TOTAL PUBLIC & PRIVATE 1,279 984 1,016 952 991 977 961 805 711 658 -7.45% 100.004
Sources: HEGIS Reports, 1982-83 through 1985-86, and IPEDS 1986-87 through 1991-92.* Postsec. Certs. & Dip.> 1 yr includes: 1<2 yrs; 2<4 yrs; Post Bachelor's Degrees; Post Master's Degrees
1 82

TABLE 4Associate Degrees for Public and Private Institutions
1982-83 through 1991-92
Institutions
Year1991-92 Percent4 Change Totalover Awards
82-83 83-84 84-85 85-86 86-87 87-88 88-89 89-90 90-91 91-92 1990-91 1991-92
PUBLIC
University of Utah 3 5 1 1 0 0 1 0 0 0 0.004Utah State University 0 0 1 3 1 2 43 45 42 55 30.9-5.4 1.29%Weber State University 686 678 691 695 681 739 887 855 985 1,022 3.764 23.964Southern Utah University 34 42 62 57 77 78 61 77 52 66 26.92% 1.55%Snow College 263 177 236 261 252 270 268 339 339 403 18.88* 9.45%Dixie College 327 310 264 305 374 390 431 428 455 507 11.43* 11.89%College of Eastern Utah 117 128 140 138 145 170 187 227 222 270 21.62% 6.33%Utah Valley Community College 529 508 410 545 627 584 569 649 587 733 24.87% 17.19%Salt Lake Community College 409 469 621 579 584 864 639 670 914 1,014 10.94% 23.77%
TOTAL PUBLIC 2,368 2.317 2,426 2,584 2,741 3,097 3,086 3,290 3,596 4,070 13.18* 95.43%
PRIVATE
Brigham Young University 383 419 265 194 86 97 95 51 35 30 -14.29% 0.70%Westminster College 0 0 0 0 0 0 0 0 0 0 0.004LDS Business College 121 104 92 114 164 148 145 118 163 165 1.234 3.87%
TOTAL PRIVATE 504 523 357 308 250 245 240 169 198 195 -1.52% 4.57%
TOTAL PUBLIC & PRIVATE 2,872 2,840 2,783 2,892 2,991 3,342 3,326 3,459 3,794 4,265 12.41% 100.00%
101. ION=IMILINIINAMMIr= 13111=1111MI
TABLE 5Bachelor Degrees for Public and Private Institutions
1982-83 through 1991-92
IMMON
Institutions
1991-92 PercentYear % Change Total
over Awards82-83 83-84 84-85 85-86 86-87 87-88 88-89 89-90 90-91 91-92 1990-91 1991-92
PUBLIC
University of Utah 2,47Utah State University 1,42Weber State University 1,00Southern Utah University 30Snow CollegeDixie CollegeCollege of Eastern UtahUtah Valley Community CollegeSalt Lake Community College
2,547 2,431,473 1,49
987 99308 33
0
0
0
0
0
2,65 2,639 2,806 2,806 2,830 2,818 2,999 6.42% 25.00%1,46 1,576 1,476 1,348 1,437 1,501 1,653 10.13% 13.78%1,104 1,044 1,071 1,117 1,155 1,244 1,153 -7.32% 9.61%
35 448 441 442 470 527 585 11.01% 4.8840 0 0 0 0 0 -- 0.00%0 0 0 0 0 0 0.0040 0 0 0 0 0 0.00%0 0 0 0 0 0 0.00%0 0 0 0 0 0 0.00%
TOTAL PUBLIC 5,201 5,315 5,264 5,573 5,707 5,794 5,713 5,892 6,090 6,390 4.93% 53.28%
PRIVATE
Brigham Young University 4,502 4,769 4,732 4,918 5,150 4,769 4,729 4,757 4,962 5,326 7.34% 44.41%Westminster College 174 175 165 179 228 256 240 258 289 278 -3.81% 2.32%LDS Business College 0 0 0 0 0 0 0 0 0 0 -- 0.00%
TOTAL PRIVATE 4,676 4,944 4,897 5,097 5,378 5,025 4,969 5,015 5,251 5,604 6.72% 46.72%
TOTAL PUBLIC & PRIVATE 9,877 10,259 10,161 10,670 11,085 10,819 10,682 10,907 11,341 11,994 5.76% 100.00%
Sources: HEGIS Reports, 1982-83 through 1985-86, and IPEDS 1986-87 through 1991-92.

TABLE 6Master Degrees for Public and Private Institutions
1982-83 through 1991-92
Year1991-92% Changeover
PercentTotalAwards
Institutions 82-83 83-84 84-85 85-86 86-87 87-88 88-89 89-90 90-91 91-92 1990-91 1991-92
PUBLIC
University of Utah 758 72 798 768 808 842 74 792 793 76 -3.28% 30.084Utah State University 429 43 460 438 475 597 58 572 530 61 15.47* 24.004Weber State University 34 3 22 32 39 51 4 47 56 4 -12.50% 1.92%Southern Utah University 0 0 2 4 9 16 21 2 4.76% 0.86%Snow College 0 0 0 0 0 0 0 0.00%Dixie College 0 0 0 0 0 0 0 0.00%College of Eastern Utah 0 0 0 0 0 0 0 0.00%Utah Valley Community College 0 0 0 0 0 0 0 0.00%Salt Lake Community College 0 0 0 0 0 0 0 0.00%
TOTAL PUBLIC 1.221 1,186 1,280 1,240 1,326 1,499 1,379 1,427 1,400 1,450 3.57% 56.86%
PRIVATE
Brigham Young University 1,103 1,012 1,092 1,013 1,040 1,033 902 979 973 994 2.16% 38.98%Westminster College 39 40 22 35 35 41 64 73 89 106 19.10% 4.16%LDS Business College 0 0 0 0 0 0 0 0 0 0 -- 0.00%
TOTAL PRIVATE 1,142 1,05? 1,114 1.048 1,075 1,074 966 1,052 1.052 1,100 3.58% 43.14*
TOTAL PUBLIC & PRIVATE 2,363 2,238 2,394 2,208 2,401 2,573 2,345 2,479 2,462 2,550 3.57% 100.00*
TABLE 7Doctorate Degrees for Public and Private Institutions
1982-83 through 1991-92
1990-91 PercentYear % Change Total
over AwardsInstitutions 82-83 83-84 84-85 85-86 86-87 87-88 88-89 89-90 90-91 91-92 1990-91 1991-92
PUBLIC
University of Utah 168 162 17 188 17 21 17 19 20 21 5.45* 56.35%Utah State University 71 80 6 60 7 7 7 7 6 6 11.67% 17.72%Weber State University 0 0 0.00%Southern Utah University 0 0 0.004Snow College 0 0 0.004Dixie College 0 0 0.00%College of Eastern Utah 0 0 0.00*Utah Valley Community College 0 0 0.00%Salt Lake Community College 0 0 0.00%
TOTAL PUBLIC 239 242 244 248 247 296 249 271 262 280 6.87* 74.07%
PRIVATE
Brigham Young University 132 129 116 123 107 131 118 90 94 98 4.26% 25.93%Westminster College 0 0 0 0 0 0 0 0 0 0 0.00%LDS Business College 0 0 0 0 0 0 0 0 0 0 0.004
TOTAL PRIVATE 132 129 116 123 107 131 118 90 94 98 4.26* 25.93%
TOTAL PUBLIC & PRIVATE 371 371 360 371 354 427 367 361 356 378 6.184 100.00%
Sources: HEGIS Reports, 1982-83 through 1985-86, and IPEDS 1986-87 through 1991-92.
204

TABLE 8First Professional Degrees for Public and Private Institutions
1982-83 through 1991-92
Year1990-91% Change
ov,:e
PercentTotal
AwardsInstitutions 82-83 83-84 84-85 85-86 86-87 87-88 88-89 89-90 90-91 91-92 1990-91 1991-92
PUBLIC
University of UtahLaw (J.D.) 128 125 128 122 111 120 120 123 11S 119 0.00% 32.08%Medicine (M.D.) 105 101 99 101 98 100 99 96 105 95 -9.52% 25.61%Pharmacy (D. Pharm.) 5 4 9 9 8 16 6 3 10 7 -30.00% 1.89%
TOTAL PUBLIC 238 230 236 232 217 236 225 222 234 221 -5.56% 59.57%
PRIVATE
Brigham Young UniversityLaw (J.D.) 137 159 143 129 129 142 151 158 149 150 0.67% 40.43%
TOTAL PRIVATE 137 159 143 129 129 142 151 158 149 150 0.67% 40.43%
TOTAL PUBLIC & PRIVATE 375 389 379 361 346 378 376 380 383 371 -3.13% 100.00%1141Itarft =1W atININIMOMMOMIN itEM.IMMIIVELIMM110-11:11,1Mail4111.1
Sources: HEGIS Reports, 1982-83 through 1985-86, and IPEDS 1986-87 through 1991-92.
Figure 21991-92 Degrees & Awards ConferredBy Utah's Public & Privt te Institutions
Type of Award
Cert. <1 Y
Cert. >1 Y
Associate
Bachelor
Master
Doctorate
1st Prof
IMIIMIMINI.10=1111
FA%
raissmin or-
Publip E Private
0 1,000 2,000 3,000 4,000 5,000 6,000 7,000
Source: 1991.92 IPEDS CompletIons Data

TABLE 9Utah System of Higher Education
Degrees and Awards by Gender for 1991-92
Type of Degree or Award
Certificates/Diplomas of <
UofU
1 yr
USU WSU
Institutions
SUU Snow Dixie CEU UVCC SLCC
TOTAL
No. Percent
Male 0 0 0 0 0 165 0 25 76 266 47.50%Female 0 0 0 0 0 85 0 9 200 294 52.50%Total 0 0 0 0 0 250 0 34 276 560 100.00%
Certificates/Diplomas of > 1 yr*
Male 59 30 17 4 9 40 18 46 49 272 44.96%Female 45 2 21 5 8 39 53 145 15 333 55.04%Total 104 32 38 9 17 79 71 191 64 605 100.004
Associate DegreesMale 0 11 324 31 140 247 131 383 519 1,786 43.884Female 0 44 698 35 263 260 139 350 495 2.284 56.12%Total 0 55 1,022 66 403 507 270 733 1,014 4,070 100.00%
Bachelor DegreesMale 1.699 851 636 282 0 0 0 0 0 3,468 54.27%Female 1,292 802 517 303 0 0 0 0 0 2,914 45.60%Unknown 8 0 0 0 0 0 0 0 0 8Total 2,999 1,653 1,153 585 0 0 0 0 0 6,390 99.87%
Master DegreesMale 386 372 24 16 0 0 0 0 0 798 55.034Female 372 240 25 6 0 0 0 0 0 643 44.344Unknown 9 0 0 0 0 0 0 0 0 9
Total 767 612 49 22 0 0 0 0 0 1,450 99.38%
Doctorate DegreesKale 141 55 0 0 0 0 0 0 0 196 70.00%Female 67 12 0 0 0 0 0 0 0 79 28.21%Unknown 5 0 0 0 0 0 0 0 0 5Total 213 67 0 0 0 0 0 0 0 280 98.21%
First Professional DegreesKale 145 0 0 0 0 0 0 0 0 145 65.61%Female 67 0 0 0 0 0 0 0 0 67 30.32%Unknown 9 0 0 0 0 0 0 0 0 9Total 221 0 0 0 0 0 0 0 0 221 95.93%
Total Degrees & AwardsMale 2,430 1,319 1,001 333 149 452 149 454 644 6,931 51.05%Female 1,843 1,100 1,261 349 271 384 192 504 710 6,614 48.72%Unknwn 31 0 0 0 0 0 0 0 0 31 0.23%Total 4,304 2,419 2,262 682 420 836 341 958 1.354 13,576 99.77%
Institutional PercentDegrees and Awards Total 31.70% 17.82% 16.664 5.02% 3.09% 6.16% 2.51% 7.064 9.97%100.004
MIINNiMMIMMIONN11111.111111Sources: HEGIS Reports, 1982-83 through 1985-86, and IPEDS 1986-87 through 1991-92.* Postsec. Certs. & Dip.> 1 yr includes; 1<2 yrs; 2<4 yrs; Post Bachelor's Degrees; Post Master's Degrees
Figure 31991-92 USHE Distribution
Of Degrees & Awards
UoIU 32%
6
Figure 41991-92 USHE Degrees & Awards
By Gender
Male
51%
Female
49%

C. E
nrol
lmen
ts
2 4

I
TAB7-1ENROLLMENTS
TABLES 1 and 2FIGURES 1 and 2
TABLES 3 thru 8FIGURES 3 and 4
TABLES 9 thru 13FIGURES 5 and 6
TABLES 14 and 15FIGURES 7 and 8
TABLES 16 and 17FIGURES 9 and 10
TABLES 18 and 19FIGURES 11 and 12
TABLES 20 and 21FIGURES 13 and 14
TABLES 22 thru 25FIGURES 15 and 16
TABLE 26 and 27FIGURES 17 and 18
TABLES 28 and 29FIGURES 19 and 20
FIGURES 1 and 2
FIGURES 3 and 4
FIGURES 5 and 6
ENROLLMENT PROJECTIONS
System Totals 1
University of Utah 4
Utah State University 11
Weber State University 17
Southern Utah University 20
Snow College 23
Dixie College 26
College of Eastern Utah 29
Utah Valley Community College 34
Set Lake Community Collego 37
ENROLLMENT DETAIL
Academic and Vocational Fall Quarter FTE and Headcount ao
Fall Quarter Headcount Enrollment by Age and by Gender 41
Fall Quarter Headcount Enrollment by Full-Time/Part-limeStatus and by Residency 42

TAB CENROLLMENTSContinued--
TABLE 1 15-Year History of Academic-General arid Vocationai-Technical Fall Quarter FTE's 43
TABLE 2 4-Year History of Fall Quarter Headcount Enrollmentby Age and Gender 44
TABLE 3 4-Year History of Full-Time and Part-Time FallQuarter Headcount Enrollment by Class Standing 4
TABLE 4 4-Year History of Fall Quarter Headcount Enrollmentby Class Standing and Residency 47
TABLE 5 4-Year History of Fall Quarter FIE Enrollment by ClassStanding and Residency 48
TABLE 6 4-Year History of Fall Quarter Headcount Enrollment byResidency 49
TABLE 7 5-Year History of Academic-General and Vocational-Technical Fall Quarter Headcount 51
1
1
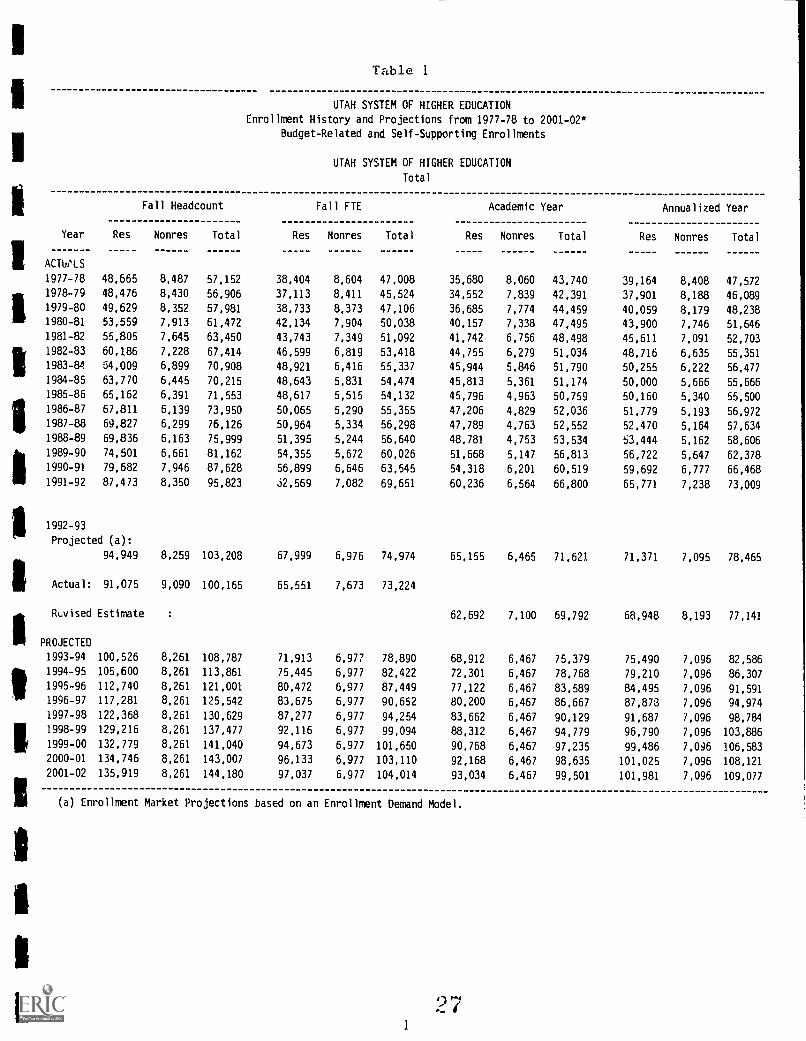
Table 1
UTAH SYSTEM OF HIGHER EDUCATION
Enrollment History and Projections from 1977-78 to 2001-02*
Budget-Related and Self-Supporting Enrollments
UTAH SYSTEM OF HIGHER EDUCATION
Total
Fall Headcount
Year Res Nonres Total
ACTVLS
Res
Fall FTE
Nonres Total Res
Academic Year
Nonres Total Res
Annualized Year
Nonres Total
1977-78 48,665 8,487 57,152 38,404 8,604 47,008 35,680 8,060 43,740 39,164 8,408 47,5721978-79 48,476 8,430 56,906 37,113 8,411 45,524 34,552 7,839 42,391 37,901 8,188 46,089
1979-80 49,629 8,352 57,981 38,733 8,373 47,106 36,685 7,774 44,459 40,059 8,179 48,2381980-81 53,559 7,913 61,472 42,134 7,904 50,038 40,157 7,338 47,495 43,900 7,746 51,646
1981-82 55,805 7,645 63,450 43,743 7,349 51,092 41,742 6,756 48,498 45,611 7,091 52,703
1982-83 60,186 7,228 67,414 46,599 6,819 53,418 44,755 6,279 51,034 48,716 6,635 55,351
1983-84 54,009 6,899 70,908 48,921 6,416 55,337 45,944 5,846 51,790 50,255 6,222 56,477
1984-85 63,770 6,445 70,215 48,643 5,831 54,474 45,813 5,361 51,174 50,000 5,666 55,666
1985-86 65,162 6,391 71,553 48,617 5,515 54,132 45,796 4,963 50,759 50,160 5,340 55,500
1986-87 67,811 6,139 73,950 50,065 5,290 55,355 47,206 4,829 52,036 51,779 5,193 56,972
1987-88 69,827 6,299 76,126 50,964 5,334 56,298 47,789 4,763 52,552 52,470 5,164 57,634
1988-89 69,836 6,163 75,999 51,395 5,244 56,640 48,781 4,753 53,534 63,444 5,162 58,6061989-90 74,501 6,661 81,162 54,355 5,672 60,026 51,668 5,147 56,813 56,722 5,647 62,378
1990-91 79,682 7,946 87,628 56,899 6,646 63,545 54,318 6,201 60,519 59,692 6,777 66,468
1991-92 87,473 8,350 95,823 52,569 7,082 69,651 60,236 6,564 66,800 65,771 7,238 73,009
1992-93
Projected (a):
94,949 8,259 103,208 67,999 6,976 74,974 65,155 6,465 71,621 71,371 7,095 78,465
Actual: 91,075 9,090 100,165 65,551 7,673 73,224
Rt.vised Estimate 62,692 7,100 69,792 68,948 8,193 77,141
PROJECTED
1993-94 100,526 8,261 108,787 71,913 6,977 78,890 68,912 6,467 75,379 75,490 7,096 82,5861994-95 105,600 8,261 113,861 75,445 6,977 82,422 72,301 6,467 78,768 79,210 7,096 86,3071995-96 112,740 8,261 121,001 80,472 6,977 87,449 77,122 6,467 83,589 84,495 7,096 91,5911996-97 117,281 8,261 125,542 83,675 6,977 90,652 80,200 6,467 86,667 87,878 7,096 94,974
1997-98 122,368 8,261 130,629 87,277 6,977 94,254 83,662 6,467 90,129 91,687 7,096 98,784
1998-99 129,216 8,261 137,477 92,116 6,977 99,094 88,312 6,467 94,779 96,790 7,096 103,886
1999-00 132,779 8,261 141,040 94,673 6,977 101,650 90,768 6,467 97,235 99,486 7,096 106,5832000-01 134,746 8,261 143,007 96,133 6,977 103,110 92,168 6,467 98,635 101,025 7,096 108,1212001-02 135,919 8,261 144,180 97,037 6,977 104,014 93,034 6,467 99,501 101,981 7,096 109,077
(a) Enrollment Market Projections based on an Enrollment Demand Model.
1
27

Figures 1 and 2
USHE Enrollment History and ProjectionsCumulative Enrollment Levels
160
140
120
-ow 100
580
1.-"c 60
40
20
0
=0:1:441011,49:4111:cN94. \?:41/4244:445:rYe a r
--FALL HDCT ±FALL FTE *AC FTE la' AY FTE
USHE Enrollment History and ProjectionsAnnual Growth Rates (FTE)
-5%
10% 111IIIIIIIIe41; 4.cp i3O) el ofle;`.,:sr 0 0 iv c)
44 44 44 44 44 N 44 44 N 44 44 N 44 44 44 44 44 44 44 44 44 44 44 re
Ye a r
9 8
2

IITable 2
UTAH SYSTEM OF HIGHER EDUCATION
IEnrollment History and Projections from 1991-92 to 2001-02
UTAH SYSTEM OF HIGHER EDUCATION
Budget-Related Total
IAcademic Year Annualized Year
Year Res Nonres Total F.es Nonres Total
IACTUALS
1
111
I
1
I1
III
1991-92 59,158 6,448 65,607 64,688 7,118 71,806
1992-93
Projected (a):
64,011 6,365 70,376 70,221 6,995 77,215
Revised Estimate (b):
I60,791 6,929 67,720 66,258 7,859 74,117
PROJECTED
Il1993-94 67,696 6,366 74,062 74,267 6,996 81,263
1994-95 71,018 6,366 77,384 77,921 6,996 84,917
1995-96 75,755 6,366 82,121 83,120 6,996 90,116
1996-97 78,772 6,366 85,138 86,443 6,996 93,439
1997-98 82,168 6,366 88,535 90,185 6,996 97,182
1998-99 86,731 6,366 93,097 95,200 6,996 102,196
1999-00 89,142 6,366 95,508 97,852 6,996 104,848
i2000-01 90,519 6,366 96,886 99,368 6,996 106,364
2001-02 91,372 6,366 97,739 100,309 6,996 107,305
I 3

Table 3
UTAH SYSTEM OF HIGHER EDUCATION
Enrollment History and Projections from 1977-78 to 2001-02*
Budget-Related and Self-Supporting Enrollments
-- University of Utah --
Total Institution
Fall Headcount Fall FTE Academic Year Annualized Year
Year Res Nonres Total Res Nonres Total Res Nonres Total Res Nonres Total I
ACTUALS
1977-78 18,762 3,118 21,880 15,648 3,083 18,731 14,575 2,869 17,444 15,987 3,1061978-79 18,431 3,013 21,444 15,095 2.979 18,074 14,102 2,774 16,876 15,394 2,9801979-80 19,059 2,933 21,992 15,405 2,858 18,263 14,690 2,634 17,324 15,966 2,8531980-81 20,449 2,521 22,970 16,336 2,383 18,719 15,418 2,196 17,614 16,778 2,3781981-82 20,898 2,475 23,373 16,693 2,272 18,965 15,758 2,037 17,795 17,049 2,1811982-83 22,068 2,296 24,364 17,200 2.096 19,296 16,450 1,933 18,383 17,771 2,0841983-84 22.652 2,259 24,911 17,530 2,060 19,590 16,483 1,934 18,417 17.803 2,0941984-85 22,759 2,127 24,886 17,610 1,894 19,504 16,567 1,786 18,353 17,919 1,9221985-86 22,899 2,261 25,160 17,477 1,933 19,410 16,258 1,815 18,073 17,695 2,0111986-87 22,886 2,276 25,162 17,211 1,918 19,129 16,056 1,818 17,874 17,446 1,9931987-88 22,169 2,442 24,611 17,076 2,110 19,186 15,918 1,910 17,828 17,348 2,1191988-89 21,601 2,445 24,046 16,684 2,122 18,806 15,623 1,944 17,567 17,058 2,1591989-90 21,865 2,567 24,432 16,867 2,134 19,001 15,915 1.950 17,865 17,420 2,2101990-91 22,369 3,056 25,425 17,350 2,562 19,912 16,446 2,275 18,721 17,929 2,5211991-92 23,649 2,988 26,637 18,107 2,468 20,575 17,189 2,304 19,493 18,750 2,601
1992-93
Projected (a):
25,288 2,992 28,280 19,443 2,476 21,920 18,423 2,264 20,687 20,103 2,542
Actual: 23,622 3,177 26,799 18,337 2,634 20,971
Revised Estimate17,377 2,411 19,788 19,047 2,752
PROJECTED
1993-94 26,115 2,992 29,107 20,068 2,476 22,544 19,016 2,264 21,280 20,752 2,5421994-95 27,228 2,992 30,220 20,909 2,476 23,385 19,815 2,264 22,079 21,625 2,5421995-96 29,368 2,992 32,360 22,526 2,476 25,002 21,350 2,264 23,614 23,304 2,5421996-97 30,498 2,992 33,490 23.379 2,476 25,856 22,160 2,264 24,424 24,190 2,5421997-98 31,861 2,992 34,853 24,409 2,476 26,885 23,138 2,264 25,402 25,260 2,5421998-99 33,430 2,992 36,422 25,594 2,476 28,071 24,263 2,264 26,528 26,490 2,5421999-00 34,419 2,992 37,411 26,341 2,476 28,818 24,973 2,264 27,237 27,266 2.5422000-01 35,243 2,992 38,235 26,964 2,476 29,440 25,564 2,264 27,828 27,913 2,5422001-02 35,921 2,992 38,913 27,476 2,476 29,952 26,050 2,264 28,314 28,444 2,542
19,093
18,374 I18,818
19,156
19,230
19,855
)1119,897
19,841
19,706
19,439 I19,467
19,217
19,629
20,450
21,351
22,645
21,799
23,294
24,167
25,846
26,732
27,801
29,032
29,808
30,454
30,986
(a) Enrollment Market Projections based on an Enrollment Demand Model.
JO
4
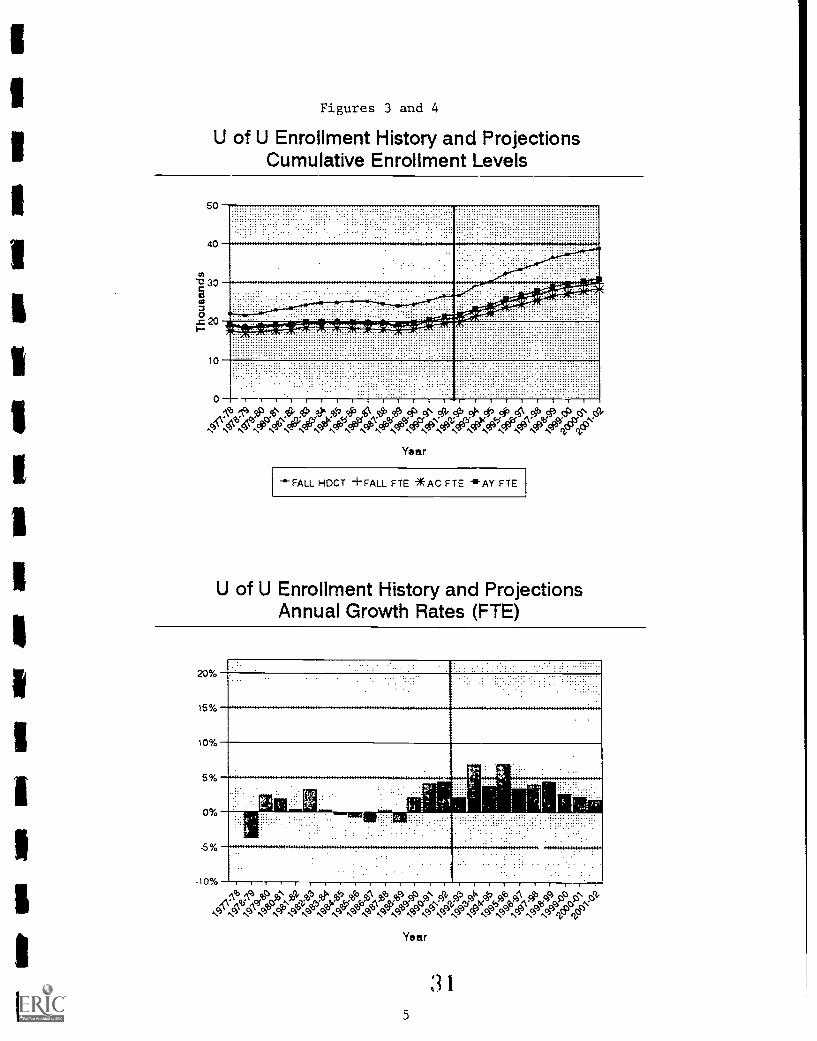
Figures 3 and 4
U of U Enrollment History and ProjectionsCumulative Enrollment Levels
50
40
i30
s 20
10
04-
49)s N4cbAcKcib.....r. N.°3". NT. AT N.°P. Nc",.°5*. Ncf)NATNcYliNvYOb4.:°Cr)79,
Year
FALL HDCT +FALL FTE *AC FTE -AY FTE
U of U Enrollment History and ProjectionsAnnual Growth Rates (FTE)
-10% 111111 ITT 111111
Year
5
:31

Univ of Utah Budget-Related and Self-Supporting ProjectionsEducation & General
Table 4
Univ of Utah Budget-Related and Self-Supporting ProjectionsMedical School (MD)
Academic Year
Bud-Rel Self-Sup Total
Annualized Year
Bud-Rel Self-Sup Total
Academic Year
Bud-Rel Self-Sup Total
Annualized Year
Bud-Rel Self-Sup Total
199.-92 18,649 148 18,797 20,489 148 20,637 1991-92 395 395 395 395
1992-93 18,935 128 19,063 20,784 261 21,045 1992-93 394 394 394 3941993-94 20,455 162 20,617 22,460 162 22,622 1993-94 400 400 400 4001994-95 21,247 169 21,416 23,.27 168 23,495 1994-95 400 400 400 4001995-96 22,770 181 22,951 24,993 181 25,174 1995-96 400 400 400 4001996-97 23,574 187 23,761 25,873 187 26,060 1996-97 400 400 400 4001997-98 24,544 195 24,739 26,934 195 27,129 1997-98 400 400 400 4001998-99 25,661 204 25,865 28,157 203 28,360 1998-99 400 400 400 4001999-00 26,365 209 26,574 28,927 209 29,136 1999-00 400 400 400 4002000-01 26,951 214 27,165 29,568 214 29,782 2000-01 400 400 400 4002001-02 27,433 218 27,651 30,097 217 30,314 2001-02 400 400 400 400
Univ of Utah Budget-Related and Self-Supporting ProjectionsMedical School (Non MD)
Academic Year Annualized Year
Bud-Rel Self-Sup Total Bud-Rel Self-Sup Total
Univ of Utah Budget-Related and Self-Supporting ProjectionsTotal Institution
Academic Year Annualized Year
Bud-Rel Self-Sup Total Bud-Rel Self-Sup Total
1991-92 263 263 272 272 1991-92 19,307 186 19,493 21,156 195 21,351
1992-93 291 4 331 312 4 360 1992-93 19,620 168 19,788 21,490 309 21,7991993-94 263 263 272 272 1993-94 21,118 162 21,280 23,132 162 23,2941994-95 263 263 272 272 1994-95 21,910 169 22,079 23,999 168 24,1671995-96 263 263 272 272 1995-96 23,433 181 23,614 25,665 181 25,8461996-97 263 263 272 272 1996-97 24,237 187 24,424 26,545 187 26,7321997-98 263 263 272 272 1997-98 25,207 195 25,402 27,606 195 27,8011998-99 263 263 272 272 1998-99 26,324 204 26,528 28,829 203 29,0321999-00 263 263 272 272 1999-00 27,028 209 27,237 29,599 209 29,8082000-01 263 263 272 272 2000-01 27,614 214 27,828 30,240 214 30,4542001-02 263 263 272 272 2001-02 28,096 218 28,314 30,769 217 30,986
University of Utah Budget-Related Projections University of Utah Budget-Related ProjectionsEducation & General Medical School (MD)
Academic Year Annualized Year Academic Year Annualized Year
Res Nonres Total Res Nonres Total Res Nonres Total Res Nonres Total
1991-92 16,501 2,148 18,649 18,051 2,438 20,489 1991-92 345 50 395 345 50 395
1992-93 16,681 2,254 18,935 18,201 2,583 20,784 1992-93 349 45 394 349 45 3941993-94 18,339 2,115 20,455 20,070 2,389 22,460 1993-94 345 55 400 345 55 4001994-95 19,132 2,115 21,247 20,937 2,389 23,327 1994-95 345 55 400 345 55 4001995-96 20,655 2,115 22,770 22,604 2,389 24,993 1995-96 345 55 400 345 55 4001996-97 21,459 2,115 23,574 23,484 2,389 25,873 1996-97 345 55 400 345 55 4001997-98 22,429 2,115 24,544 24,545 2,389 26,934 1997-98 345 55 400 345 55 4001998-99 23,546 2,115 25,661 25,767 2,389 28,157 1998-99 345 55 400 345 55 4001999-00 24,250 2,115 26,365 26,538 2,389 28,927 1999-00 345 55 400 345 55 4002000-01 24,836 2,115 26,951 27,179 2,389 29,568 2000-01 345 55 400 345 55 4002001-02 25,318 2,115 27,433 27,707 2,389 30,097 2001-02 345 55 400 345 55 400
University of Utah Budget-Related Projections University of Utah Budget-Related ProjectionsMedical School (Non MD) Total Institution
Academic Year Annualized Year Academic Year Annualized Year
Res Nonres Total Res Nonres Total Res Nonres Total Res Nonres Total
1991-92 186 77 263 192 80 272 1991-92 17,032 2,275 19,307 18,588 2,568 21,156
1992-93 192 98 290 205 107 312 1992-93 17,222 2,397 19,619 18,755 2,735 21,4901993-94 186 77 263 192 80 272 1993-94 18,870 2,247 21,118 20,607 2,524 23,1321994-95 186 77 263 192 80 272 1994-95 19,663 2,247 21,910 21,474 2,524 23,9991995-96 186 77 263 192 80 272 1995-96 21,186 2,247 23,433 23,141 2,524 25,6651996-97 186 77 263 192 80 272 1996-97 21,990 2,247 24,237 24,021 2,524 26,5451997-98 186 77 263 192 80 272 1997-98 22,960 2,247 25,207 25,082 2,524 27,6061998-99 186 77 263 192 80 272 1998-99 24,077 2,247 26,324 26,304 2,524 28,8291999-00 186 77 263 192 80 272 1999-00 24,781 2,247 27,028 27,075 2,524 29,5992000-01 186 77 263 192 80 272 2000-01 25,367 2,247 27,614 27,716 2,524 30,2402001-02 186 77 263 192 80 272 2001-02 25,849 2,247 28,096 28,244 2,524 30,769
326

1
Table 5
UTAH SYSTEM OF HIGHER EDUCATION
Enrollment History and Projections from 1977-78 to 2001-02
Budget-Related and Self-Supporting Enrollments
-- University of Utah --
Education and General
Fall Headcount Fall FTE
Year
ACTUALS
Res
1977-78 18,427
1978-79 18,101
1979-80 18,742
1980-81 20,122
1981-82 20,572
1982-83 21,735
1983-84 22,310
1984-85 22,426
1985-86 22,567
1986-87 22,561
1987-88 21,837
1988-89 21,269
1989-90 21,527
1990-91 22,017
1991-92 23,305
1992-93
Projected (a):
24,943
Actual: 23,273
Revised Estimate
PROJECTED
1993-94 25,770
1994-95 26,883
1995-96 29,023
1996-97 30,153
1997-98 31,516
1998-99 33,085
1999-00 34,074
2000-01 34,898
2001-02 35,576
Academic Year Annualized Year
Nonres Total Res Nonres Total Res Nonres Total Res Nonres Total
3,060 21,487 15,313 3,025 18,338 14,240 2,811 17,051 15,652 3,048 18,7002,944 21,045 14,765 2,910 17,675 13,772 2,705 16,477 15,064 2,911 17,9752,861 21,603 15,088 2,786 17,874 14,373 2,562 16,935 15,649 2,781 18,4292,460 22,582 16,009 2,322 18,331 15,091 2,135 17,226 16,451 2,317 18,7682,404 22,976 16,367 2,201 18,568 15,432 1,966 17,398 16,723 2,110 18,8332,228 23,963 16,867 2,028 18,895 16,117 1,865 17,982 17,438 2,016 19,4542,196 24,506 17,188 1,997 19,185 16,141 1,871 18,012 17,461 2,031 19,4922,064 24,490 17,277 1,831 19,108 16,234 1,723 17,957 17,586 1,859 19,4452,198 24,765 16,999 1,813 18,812 15,825 1,702 17,527 17,257 1,896 19,1532,212 24,773 16,755 1,811 18,566 15,623 1,712 17,335 17,008 1,884 18,8922,374 24,211 16,593 1,989 18,582 15,471 1,792 17,263 16,896 2,000 18,8962,379 23,648 16,184 1,992 18,176 15,154 1,829 16,983 16,584 2,038 18,6222,507 24,034 16,334 1,993 18,327 15,421 1,822 17,243 16,917 2,079 18,9963,003 25,020 16,782 2,416 19,198 15,924 2,129 18,053 17,398 2,371 19,7692,937 26,242 17,475 2,315 19,790 16,632 2,165 18,797 18,181 2,456 20,637
2,937 27,880 18,843 2,334 21,178 17,892 2,132 20,024 19,566 2,407 21,973
3,132 26,405 17,703 2,467 20,170
16,809 2,254 19,063 18,462 2,583 21,045
2,937 28,707 19,468 2,334 21,802 18,485 2,132 20,617 20,215 2,407 22,6222,937 29,820 20,309 2,334 22,643 19,284 2,132 21,416 21,088 2,407 23,4952,937 31,960 21,926 2,334 24,260 20,819 2,132 22,951 22,767 2,407 25,1742,937 33,090 22,779 2,334 25,114 21,629 2,132 23,761 23,653 2,407 26,0602,937 34,453 23,809 2,334 26,143 22,607 2,132 24,739 24,723 2,407 27,1292,937 36,022 24,994 2,334 27,329 23,732 2,132 25,865 25,953 2,407 28,3602,937 37,011 25,741 2,334 28,076 24,442 2,132 26,574 26,729 2,407 29,1362,937 37,835 26,364 2,334 28,698 25,033 2,132 27,165 27,376 2,407 29,7822,937 38,513 26,876 2,334 29,210 25,519 2,132 27,651 27,907 2,407 30,314
(a) Enrollment Market Projections based on an Enrollment Demand Model.
7

Table 6
UTAH SYSTEM OF HIGHER EDUCATION
Enrollment History and Projections from 1977-78 to 2001-02
Budget-Related and Self-Supporting Enrollments
-- University of Utah --
Medical School (MD)
Fall Headcount Fall FTE Academic Year Annualized Year
Year Res Nonres Total Res Nonres Total Res Nonres Total Res Nonres Total
ACTUALS
1977-78 335 58 393 335 58 393 335 58 393 335 581978-79 330 69 399 330 69 399 330 69 399 330 691979-80 317 72 389 317 72 389 317 72 389 317 721980-81 327 61 388 327 61 388 327 61 388 327 611981-82 326 71 397 326 71 397 326 71 397 326 711982-83 333 68 401 333 68 401 333 68 401 333 681983-84 342 63 405 342 63 405 342 63 405 342 631984-85 333 63 396 333 63 396 333 63 396 333 631985-86 332 63 395 332 63 395 332 63 395 332 631986-87 325 64 389 325 64 389 325 64 389 325 641987-88 332 68 400 332 68 400 334 67 401 334 671988-89 332 66 398 332 66 398 333 60 393 333 631989-90 338 60 398 338 60 398 339 57 396 340 571990-91 352 53 405 352 53 405 348 52 400 349 521991-92 344 51 395 344 51 395 345 50 395 345 50
1992-93
Projected (a):
345 55 400 345 55 400 345 55 400 345 55
Actual: 349 45 394 349 45 394
Revised Estimate 349 45 394 349 45
PROJECTED
1993-94 345 55 400 345 55 400 345 55 400 345 551994-95 345 55 400 345 55 400 345 55 400 345 551995-96 345 55 400 345 55 400 345 55 400 345 551996-97 345 55 400 345 55 400 345 55 400 345 551997-98 345 55 400 345 55 400 345 55 400 345 551998-99 345 55 400 345 55 400 345 55 400 345 551999-00 345 55 400 345 55 400 345 55 400 345 552000-01 345 55 400 345 55 400 345 55 400 345 552001-02 345 55 400 345 55 400 345 55 400 345 55
393
399
389
388
397
401
405
396
395
389
401
396
397
401
395
400
394
400
400
400
400
400
400
400
400
400
(a) Enrollment Market Projections based on an Enrollment Demand Model.
34
8
1

1
1
Table 7
UTAH SYSTEM OF HIGHER EDUCATION
Enrollment History and Projections from 1977-78 to 2001-02
Budget-Related and Self-Supporting Enrollments
-- University of Utah --
Medical School (Non MD)
Fall Headcount Fall FTE Academic Year Annualized Year
Year Res Nonres Total Res Nonres Total Res Nonres Total Res Nonres Total
ACTUALS
1977-78
1978-79
1979-80
1980-81
1981-82
1982-83
1983-84
1984-85
1985-86
1986-87
1987-88
1988-89
1989-90
1990-91
1991-92
1992-93
Projected (a):
Actual:
Revised Estimate
PROJECTED
1993-94
1994-95
1995-96
1996-97
1997-98
1998-99
1999-00
2000-01
2001-02
146 57 203 101 50 151 106 52 158
131 43 174 108 43 151 113 45 158
151 53 204 113 51 164 118 52 170
157 58 215 127 50 176 132 53 184
172 70 243 136 62 198 142 64 205
191 81 272 153 EA 237 158 86 244
255 87 342 186 77 263 192 80 272
255 87 342 186 77 263 192 80 272
250 107 357
192 98 290 205 107 312
255 87 342 186 77 263 192 80 272
255 87 342 186 77 263 192 80 272
255 87 342 186 77 263 192 80 272255 87 342 186 77 263 192 80 272255 87 342 186 77 263 192 80 272
255 87 342 186 77 263 192 80 272
255 87 342 186 77 263 192 80 272
255 87 342 186 77 263 192 80 272
255 87 342 186 77 263 192 80 272
(a) Enrollment Market Projections based on an Enrollment Demand Model.
a
3 5

Table 8
UTAH SYSTEM OF HIGHER EDUCATION
Enrollment History and Projections from 1977-78 to 2001-02
Budget-Related and Self-Supporting Enrollments
-- University of Utah --
Medical School (Physician's Assistant)
Fall Headcount
Year Res Nonres Total
ACTUALS
Res
Fall FTE
Nonres Total Res
Academic Year
Nonres Total Res
Annualized Year
Nonres Total
1977-78
1978-79
1979-80
1980-81
1981-82
1982-83
1983-84
1984-85
1985-86
1986-87
1987-88
1988-89 11 6 17 9 5 15 9 5 151989-90 23 11 33 19 9 28 21 10 311990-91 25 12 37 21 10 31 24 12 361991-92 33 15 48 26 12 38 32 15 47
1992-93
Projected (a):
Actual: 35 15 50
Revised Estimate 27 14 41 31 17 48
PROJECTED
1993-94
1994-95
1995-96
1996-97
1997-98
1998-99
1999-00
2000-01
2001-02
(a) Enrollment Market Projections based on an Enrollment Demand Model.
NOTE: Physician's Assistant program is currently supported solely by the tuition of participating students.
10

Table 9
UTAH SYSTEM OF HIGHER EDUCATION
Enrollment History and Projections from 1977-78 to 2001-02*
Budget-Related and Self-Supporting Enrollments
-- Utah State University --
ITotal Institution
1
1
Year
ACTUALS
Res
1977-78 6,596
1978-79 6,619
1979-80 6,801
1980-81 7,495
1981-82 7,945
1982-83 8,938
1983-84 11,227
1984-85 10,828
1985-86 10,992
1986-87 11,342
1987-88 11,968
1988-89 12,248
1989-90 12,312
1990-91 13,253
1991-92 13,906
1992-93
Projected (a):
15,348
Actual: 14,566
Fall Headcount Fall FTE
Revised Estimate
PROJECTED
1993-94 16,218
1994-95 16,771
1995-96 17,248
1996-97 17,757
1997-98 18,468
1998-99 19,385
1999-00 19,978
2000-01 20,390
2001-02 20,760
Academic Year Annualized Year
Nonres Total Res Nonres Total Res Nonres Total Res Nonres Total
3,456 10,052 5,965 3,575 9,540 5,586 3,379 8,965 6,350 3,379 9,729
3,224 9,843 5,812 3,243 9,055 5,398 3,022 8,420 6,134 3,022 9,156
3,074 9,875 6,136 3,110 9,246 5,861 2,947 8,808 6,615 2,947 9,562
3,085 10,580 6,720 3,143 9,863 6,524 2,982 9,506 7,377 2,982 10,359
3,001 10,946 7,014 2,894 9,908 6,721 2,752 9,473 7,613 2,752 10,365
2,866 11,804 7,408 2,649 10,057 7,200 2,489 9,689 8,064 2,489 10,553
2,673 13.900 8,272 2,400 10,672 7,751 2,198 9,949 8,791 2,198 10,989
2,400 13,23 8,034 2,120 10,154 7,697 1,961 9,658 8,702 1,961 10,663
2,145 13,137 7,953 1,792 9,745 7,709 1,616 9,325 8,690 1,616 10,306
2,000 13,342 8,113 1,687 9,800 7,715 1,573 9,288 8,780 1,573 10,353
1,953 13,921 8,209 1,604 9,813 7,831 1,501 9,332 8,896 1,501 10,397
1,988 14,236 8,441 1,645 10,086 8,057 1,530 9,587 9,101 1,530 10,631
2,049 14,361 8,832 1,729 10,561 8,544 1,595 10,139 9,610 1,595 11,205
2,319 15,572 9,560 1,953 11,513 9,182 1,871 11,053 10,355 1,871 12,226
2,624 16,530 10,474 2,258 12,732 10,229 2,023 12,252 11,296 2,023 13,319
2,624 17,972 11,335 2,236 13,571 10,997 2,060 13,057 12,263 2,060 14,322
2,558 17,124 10,942 2,179 13,121
10,615 2,002 12,617 11,778 2,291 14,069
2,624 18,842 11,993 2,236 14,229 11,639 2,060 13,699 12,978 2,060 15,038
2,624 19,395 12,411 2,236 14,647 12,047 2,060 14,106 13,433 2,060 15,493
2,624 19,872 12,772 2,236 15,008 12,398 2,060 14,458 13,825 2,060 15,885
2,624 20,381 13,157 2,236 15,393 12,774 2,060 14,833 14,244 2,060 16,304
2,624 21,092 13,694 2,236 15,930 13,298 2,060 15,358 14,829 2,060 16,888
2,624 22,009 14,388 2,236 16,624 13,974 2,060 16,034 15,583 2,060 17,643
2,624 22,602 14,836 2,236 17,072 14,412 2,060 16,471 16,071 2,060 18,130
2,624 23,014 15,148 2,236 17,384 14,715 2,060 16,775 16,409 2,060 18,469
2,624 23,384 15,428 2,236 17,664 14,988 2,060 17,048 16,714 2,060 18,773
(a) Enrollment Market Projections based on an Enrollment Demand Model.
:3 7
11

Figures 5 and 6
USU Enrollment History and ProjectionsCumulative Enrollment Levels
;1%A°) eP 4L',G, ;1347 Ri% csN 41' cc' ck Fi° 5g1/4 OF,P55:11,
.3',.(5kt;N`S\cNcf)%1;:":"Ne.°P",,,,,eseAcP.,cf"1:441:.`fs",°031)% "ert59159.
Ye ar
E-- FALL HDCT +FALL FTE *AC FTE -.AY FTE
USU Enrollment History and ProjectionsAnnual Growth Rates (FTE)
20%
15%
10%
5%
0%
-5%
-10%
RP' ,P oP 4t' 41' 4:" 47 0 4' 47 07 $::;\ 4'1PC04ealOY;414j:00P40CAIACA0040e0OCOY00ileee
Ye ar
38
12

Table 10
II/USU Budget-Related and Self-Supporting Projections USU Budget-Related and Self-Supporting Projections
Education & General Southeastern Utah Center
III1991-92
11193-94
92-93
94-951995-961996-97
98-9999-00
2000-01li01-02
Academic Year
Bud-Rel Self-Sup Total
Annualized Year
Bud-Rel Self-Sup Total
11,461 247 11,708 12,470 247 12,717
11,722 331 12,053 12,722 713 13,43512,878 278 13,156 14,157 280 14,43713,277 286 13,563 14,603 289 14,89213,621 294 13,915 14,987 297 15,28413,989 301 14,290 15,398 305 15,70314,502 313 14,815 15,971 316 16,28715,164 327 15,491 16,711 331 17,04215,592 336 15,928 17,189 340 17,52915,890 342 16,232 17,521 347 17,86816,157 348 16,505 17,819 353 18,172
Academic Year Annualized Year
Bud-Rel Self-Sup Total Bud-Rel Self-Sup Total
1991-92 91 0 91 101
1992-93 78 4 82 881993-94 91 0 91 1011994-95 91 0 91 1011995-96 91 0 91 1011996-97 91 0 91 1011997-98 91 0 91 1011998-99 91 0 91 1011999-00 91 0 91 1012000-01 91 0 91 1012001-02 91 0 91 101
USU Budget-Related and Self-Supporting Projections USU Budget-Related and Self-Supporting Projections
1191-92
92-931993-941994-9511195-96
97-9896-97
1998-99
01-0200-01
Uintah Basin Center
Academic Year Annualized
Bud-Rel Self-Sup Total Bud-Rel Self-Sup
444 8 452 492
452 29 481 503 3444 8 452 492444 8 452 492444 452 492444 4928 452444
8
8 452 492444 8 452 492444 8 452 492444 492
8452
4448
452 492
Year
Total
500
535500500500500500500500500500
Total Institution
Academic Year Annualized Year
101
97
101
101
101
101
101
101
101
101
101
Bud-Rel Self-Sup Total Bud-Rel Self-Sup Total
1991-92 11,996 255 12,251 13,063 255 13,318
1992-93 12,252 364 12,616 13,313 754 14,0671993-94 13,413 286 13,699 14,750 288 15,0381994-95 13,812 294 14,106 15,196 297 15,4931995-96 14,156 302 14,458 15,580 305 15,8851996-97 14,524 309 14,833 15,991 313 16,3041997-98 15,037 321 15,358 16,564 324 16,8881998-99 15,699 335 16,034 17,304 339 17,6431999-00 16,127 344 16,471 17,782 348 18,1302000-01 16,425 350 16,775 18,114 355 18,4692001-02 16,692 356 17,048 18,412 361 18,773
11191-92
992-93It93-94
94-95. 5-961996-9797-988-999-0000-01
2001-02
111
i1991-92
1112-93
3-941994-95
1115-96
6-977-988-99
1999-00
111
0-01
1-02
USU Budget-Related Projections USU Budget-Related ProjectionsEducation & General Southeastern Utah Center
Academic Year
Res Nonres Total
Annualized Year
Res Nonres Total
9,506 1,955 11,461 10,515 1,955 12,470
9,776 1,945 11,721 10,549 2,173 12,72210,887 1,991 12,878 12,165 1,991 14,15711,286 1,991 13,277 12,612 1,991 14,60311,630 1,991 13,621 12,996 1,991 14,98711,997 1,991 13,989 13,407 1,991 15,39812,511 1,991 14,502 13,979 1,991 15,97113,173 1,991 15,164 14,720 1,991 16,71113,601 1,991 15,592 15,197 1,991 17,18913,898 1,991 15,890 15,530 1,991 17,52114,166 1,991 16,157 15,828 1,991 17,819
Academic Year Annualized Year
Res Nonres Total Res Nonres Total
1991-92 86 5 91 96 5 101
1992-93 74 4 78 83 5 881993-94 86 5 91 96 5 1011994-95 86 5 91 96 5 1011995-96 86 5 91 96 5 1011996-97 85 5 91 96 5 1011997-98 86 5 91 96 5 1011998-99 86 5 91 96 5 1011999-00 86 5 91 96 5 1012000-01 86 5 91 96 5 1012001-02 86 5 91 96 5 101
USU Budget-Related Projections USU Budget-Related Projectionsuintah Basin Center Total Institution
Academic Year
Res Nonres Total
Annualized Year
Res Nonres Total
425 18 443 473 18 491
432 20 452 481 22 503426 18 444 474 18 492426 18 444 474 18 492426 18 444 474 18 492426 18 444 474 18 492426 18 444 474 18 492426 18 444 474 18 492426 18 444 474 18 492426 18 444 474 18 492426 18 444 474 18 492
1 3
Academic Year Annualized Year
Res Nonres Total Res Nonres Total
1991-92 10,017 1,978 11,995 11,084 1,978 13,062
1992-93 10,282 1,969 12,251 11,113 2,200 13,3131993-94 11,399 2,014 13,413 12,735 2,014 14,7501994-95 11,798 2,014 13,812 13,182 2,014 15,1961995-96 12,142 2,014 14,156 13,566 2,014 15,5801996-97 12,509 2,014 14,524 13,977 2,014 15,9911997-98 13,023 2,014 15,037 14,549 2,014 16,5641998-99 13,685 2,014 15,699 15,290 2,014 17,3041999-00 14,113 2,014 16,127 15,767 2,014 17,7822000-01 14,410 2,014 16,425 16,100 2,014 18,1142001-02 14,678 2,014 16,69? 16,398 2,014 18,412
35

Table 11 1UTAH SYSTEM OF HIGHER EDUCATION
Enrollment History and Projections from 1977-78 to 2001-02*
Budget-Related and Self-Supporting Enrollments
-- Utah State University --
Education and General
Fall Headcount Fall FTE Academic Year Annualized Year
Year Res Nonres Total Res Nonres Total Res Nonres Total Res Nonres Total
ACTUALS
1977-78 5,980 3,456 9,436 5,710 3,575 9,285 5,339 3,379 8,718 6,068 3,3791978-79 6,004 3,224 9.228 5,570 3,243 8,813 5.161 3,022 8,183 5,861 3,0221979-80 6,192 3,074 9,266 5,872 3,110 8,982 5,612 2,947 8,559 6,323 2,9471980-81 6,854 3,085 9,939 6,417 3,143 9,560 6,261 2,982 9,243 7,058 2,9821981-82 7,289 3,001 10,290 6,714 2,894 9,608 6,442 2,752 9,194 7,284 2,7521982-83 8,246 2,866 11,112 7,094 2,649 9,743 6,914 2,489 9,403 7,739 2,4891983-84 10,505 2,673 13,178 7,952 2,400 10,352 7,456 2,198 9,654 8,462 2,1981984-85 10,147 2,400 12,547 7,692 2,120 9,812 7,399 1,961 9,360 8,369 1,9611985-86 10,225 2.145 12,370 7,607 1,792 9,399 7,406 1,616 9,022 8,355 1,6161986-87 10,555 2,000 12,555 7,744 1,687 9,431 7,379 1,573 8,952 8,401 1,5731987-88 11,049 1,947 12,996 7,813 1,600 9,413 7,460 1,497 8,957 8,479 1,4971988-89 11,274 1,980 13,254 8,004 1,641 9,645 7,643 1,525 9,168 8,641 1,5251989-90 11,343 2,047 13,390 8,342 1,727 10,069 8,097 1,594 9,691 9,104 1,5941990-91 12,206 2,300 14,506 9,029 1,943 10,972 8,722 1,864 10,586 9,845 1,8641991-92 12,767 2,591 15,358 9,885 2,232 12,117 9,710 1,999 11,709 10,719 1,999
1992-93
Projected (a):
14,209 2,591 16,800 10,746 2,210 12,956 10,478 2,036 12,514 11,686 2,036
Actual: 13,479 2,507 15,986 10,340 2,141 12,481
Revised Estimate 10,081 1,973 12,054 11,177 2,256
PROJECTED
1993-94 15,079 2,591 17,670 11,404 2,210 13,614 11,120 2,036 13,156 12,401 2,0361994-95 15,632 2,591 18,223 11,822 2,210 14,032 11,528 2,036 13,563 12,856 2,0361995-96 16,109 2,591 18,700 12,183 2,210 14,393 11,879 2,036 13,915 13,248 2,0361996-97 16,618 2,591 19.209 12,568 2,210 14,778 12,255 2,036 14,290 13,667 2,0361997-98 17,329 2,591 19,920 13,105 2,210 15,315 12,779 2,036 14,815 14,252 2,0361998-99 18,246 2,591 20,837 13,799 2,210 16,009 13,455 2,036 15,491 15,006 2,0361999-00 18,839 2,591 21,430 14,247 2,210 16,457 13,893 2,036 15,928 15,494 2,0362000-01 19,251 2,591 21,842 14,559 2,210 16,769 14,196 2,036 16,232 15,832 2,0362001-02 19,621 2,591 22,212 14,839 2,210 17,049 14,469 2,036 16,505 16,137 2,036
9,447
8,883
9,270
10,040
10,036
10,228 s
10,660
10,330
9,971
9,974
9,976
10,166
10,698
11,709
12,718
13,721
13,435
a14,437
14,892
15,284
15,703
16,287
17.042
17,529
17,868
18,172
(a) Enrollment Market Projections based on an Enrollment Demand Model.
I
4 0
14

1
Table 12
UTAH SYSTEM OF HIGHER EDUCATION
Enrollment History and Projections from 1977-78 to 2001-02*
Budget-Related and Self-Supporting Enrollments
-- Utah State University --
Southeastern Utah Center only
Fall Headcount
Year Res Nonres ";otal
ACTUALS
Res
Fall FTE
Nonres Total Res
Academic Year
Nonres Total Res
Annualized Year
Nonres Total
1977-78 141 0 141 51 0 51 58 0 58 65 0 651978-79 202 0 202 60 0 60 49 0 49 57 0 57
1979-80 193 0 193 59 0 59 58 0 58 67 0 67
1980-81 205 0 205 59 0 59 60 0 60 67 0 67
1981-82 195 0 195 49 0 49 51 0 51 61 0 61
1982-83 209 0 209 59 0 59 62 0 62 67 0 671983-84 196 0 196 70 0 70 73 0 73 74 0 74
1984-85 184 0 184 85 0 85 80 0 80 84 0 84
1985-86 247 0 247 90 0 90 78 0 78 82 0 82
1986-87 272 0 272 97 0 97 79 0 79 85 0 851987-88 291 0 291 81 0 81 84 0 84 91 0 91
1988-89 319 3 322 109 2 111 102 2 104 112 2 1141989-90 257 0 257 120 0 120 97 0 97 109 0 109
1990-91 289 6 295 121 3 124 87 2 89 100 2 102
1991-92 215 5 220 99 3 102 86 5 91 96 5 101
1992-93
Projected (a):
215 5 220 99 3 102 86 5 91 96 5 101
Actual: 203 7 210 97 4 101
Revised Estimate 78 4 82 93 5 98
PROJECTED
1993-94 215 5 220 99 3 102 86 5 91 96 5 101
1994-95 215 5 220 99 3 102 86 5 91 96 5 101
1995-96 215 5 220 99 3 102 86 5 91 96 5 101
1996-97 215 5 220 99 3 102 86 5 91 96 5 1011997-98 215 5 220 99 3 102 86 5 91 96 5 101
1998-99 215 5 220 99 3 102 86 5 91 96 5 101
1999-00 215 5 220 99 3 102 86 5 91 96 5 101
2000-01 215 5 220 99 3 102 86 5 91 96 5 101
2001-02 215 5 220 99 3 102 86 5 91 96 5 101
(a) Enrollment Market Projections based on an Enrollment Demand Model.

Table 13UTAH SYSTEM OF HIGHER EDUCATION
Enrollment History and Projections from 1977-78 to 2001-02*
Budget-Related and Self-Supporting Enrollments
-- Utah State University --
Uintah Center only
Fall Headcount
Year Res Nonres Total
ACTUALS
Res
Fall FTE
Nonres Total Res
Academic Year
Nonres Total Res
Annualized Year
Nonres Total
1977-78 475 0 475 204 0 204 189 0 189 217 0 217
1978-79 413 0 413 182 0 182 188 0 188 216 0 216
1979-80 416 o 416 205 0 205 191 0 191 225 0 225
1980-81 436 0 436 244 0 244 203 0 203 252 0 252
1981-82 461 0 461 251 0 251 228 0 228 268 0 268
1982-83 483 0 483 255 0 255 224 0 224 258 0 258
1983-84 526 0 526 250 0 250 222 0 222 255 0 255
1984-85 497 0 497 257 0 257 218 0 218 249 0 249
1985-86 520 0 520 256 0 256 225 0 225 253 0 253
1986-87 515 0 515 272 O. 272 257 0 257 294 0 294
II/1987-88 628 6 634 315 4 319 287 4 291 326 4 330
1988-89 655 5 660 328 2 330 312 3 315 348 3 351
1989-90 712 2 714 370 2 372 350 1 351 397 1
1990-91 758 13 771 410 7 417 373 5 378 410 5 415
1991-92 924 28 952 490 23 513 433 19 452 481 19 500
1992-93
Projected (a):
924 28 952 490 23 513 433 19 452 481 19 500
Actual: 884 44 928 505 34 539
Revised Estimete 456 25 481 508 28 536
PROJECTED
1993-94 924 28 952 490 23 513 433 19 452 481 19 500
1994-95 924 28 952 490 23 513 433 19 452 481 19 500
1995-96 924
1996-97 924
28
28
952
952
490
490
23
23
513
513
433
433
19
19
452
452
481
481
19
19
500 III
500
1997-98 924 28 952 490 23 513 433 19 452 481 19 500
1998-99 924 28 952 490 23 513 433 19 452 481 19 500
1999-00 924
2000-01 924
28
28
952
952
490
490
23
23
513
513
433
433
19
19
452
452
481
481
19
19
500 111
500
2001-02 924 28 952 490 23 513 433 19 452 481 19 500
(a) Enrollment Market Projections based on an Enrollment Demand Model.
16

Table 14
UTAH SYSTEM OF HIGHER EDUCATION
111
Enrollment History and Projections from 1977-78 to 2001-02*
Budget-Related and Self-Supporting Enrollments
-- Weber State University --
IFall Headcount Fall FTE Academic Year Annualized Year
111ACTUALS:
1977-78 9,161
/II
1978-79 9,082
1979-80 9,664
1980-81 10,212
1981-82 10,353
111
1982-83 10,347
1S83-84 10,199
1984-85 10,074
1985-86 10,830
I1986-87 11,205
1987-88 11,935
1988-89 12,187
1989-90 13,043
III
1990-91 13,392
1991-92 14,601
III
1992-93
Projected (a):
15,870
IIIActual: 15,199
Revised Estimate
IIIPROJECTED
1993-94 16,506
1994-95 16,905
11995-96 18,012
1996-97
1997-98
18,863
19,758
1998-99 20,810
II/
1999-00 21,290
2000-01
2001-02
21,718
22,077
Year Res Nonres Total Res Nonres Total Res Nonres Total Res Nonres Total
534
730
840
822
766
701
672
643
659
572
614
543
607
646
731
636
786
636
636
636
636
636
636
636
636
636
9,695
9,812
10,504
11,034
11,119
11.048
10,871
10,717
11,489
11,777
12,549
12,730
13,650
14,038
15,332
16,506
15,985
17,142
17,541
18,648
19,499
20,394
21,446
21,926
22,354
22,713
6,688
6,526
6,955
7,507
7,654
7,863
7,918
7,684
7,755
8,072
8,388
8,650
9,065
9,476
9,967
10,998
10,484
11,439
11,715
12,482
13,072
13,692
14,422
14,754
15,051
15,300
507
709
865
850
789
703
651
603
543
481
459
426
504
551
599
529
644
529
529
529
529
529
529
529
529
529
7,195
7,235
7,820
8,357
8,443
8,566
8,569
8,287
8,298
8,553
8,847
9,077
9,569
10,027
10,566
11,527
11,128
11,968
12,245
13,012
13,602
14,222
14,951
15,284
15,580
15,829
6,268
6,110
6,631
7,284
7,359
7,592
7,415
7,209
7,338
7,764
8,036
8,324
8,713
8,938
9,722
10,581
10,089
11,005
11,271
12,009
12,577
13,173
13,875
14,195
14,480
14,719
488
681
782
787
746
656
599
547
488
445
414
383
463
496
569
491
598
491
491
491
491
491
491
491
491
491
6,756
6,791
7,413
8,071
8,105
8,248
8,014
7,756
7,826
8,209
8,450
8,707
9,176
9,434
10,291
11,072
10,687
11,496
11,762
12,500
13,068
13,664
14,366
14,686
14,971
15,211
6,931
6,741
7,255
8,018
8,086
8,255
8,126
7,851
8,023
8,520
8,816
9,049
9,513
9,779
10,550
11,525
11,031
11,987
12,277
13,081
13,699
14,349
15.113
15,462
15,772
16,033
519
739
861
901
838
755
696
616
556
507
463
426
521
583
659
569
703
569
569
569
569
569
569
569
569
569
7,450
7,480
8,116
8,919
8,924
9,010
8,822
8,467
8,579
9,027
9,279
9,475
10,034
10,362
11,209
12,094
11,734
12,556
12,846
13,650
14,268
14,918
15,682
16,031
16,341
16,602
I(a) Enrollment Market Projections based on an Enrollment Demand Model.

Figures 7 and 8WSU Enrollment History and Projections
Cumulative Enrollment Levels
AA'"l% 'RP '6\ cer:t6,4i' tfr4543ftenecittrci\ 4?,' 992 Os !:04311.4, FP" Fg'
47b N.41::eNcKS.N..17,4V N°S°N.°P +03 N.45 4611:AeseNcfb 4:55 "4:P 9,61:1,
Year
FALL HE/CT +FALL FTE *AC FTE *AY FTE
WSU Enrollment History and ProjectionsAnnual Growth Rates (FTE)
20%
15%
10%
5%
0%
-5%
, +14441.114..
.10% f 1 I
4F5 4;5 ,g)4F5 4F5 4F5 4;5 4:5 4F5N 4F5 4;5 N N q,
I
Ye ar
4 418

Table 15
WSU Budget-Related and Self-Supporting Projections
II1992-931993-941994-95
11
1995-961996-971997-981998-99I1999-002000-012001-02
Academic Year
Bud-Rel Self-Sup Total
Annualized Year
Bud-Rel Self-Sup Total
10,018 273 10,291 10,936 273 11,209
10,172 515 10,687 11,120 612 11,73211,191 305 11,496 12,250 306 12,55611,450 312 11,762 12,533 313 12,84612,168 332 12,500 13,318 332 13,65012,721 347 13,068 13,920 348 14,26813,302 362 13,664 14,555 363 14,91813,985 381 14,366 15,300 382 15,68214,296 390 14,686 15,641 390 16,03114,574 397 14,971 15,943 398 16,34114,807 404 15,211 16,198 404 16,602
1991-92
I! 1992-931993-941994-95II1995-961996-971997-981998-99
11
1999-002000-012001-02
VSU Budget-Related Projections
Academic Year Annualized Year
Res Nonres Total Res Nonres Total
9,464 554 10,018 10,292 643 10,936
9,646 526 10,172 10,516 605 11,12110,713 478 11,191 11,695 555 12,25010,972 478 11,450 11,978 555 12,53311,690 478 12,168 12,762 555 13,31812,243 478 12,721 13,365 555 13,92012,823 478 13,302 13,999 555 14,55513,507 478 13,985 14,745 555 15,30013,818 478 14,296 15,085 555 15,64114,096 478 14,574 15,388 555 15,94314,329 478 14,807 15,642 555 16,198
19
4 5
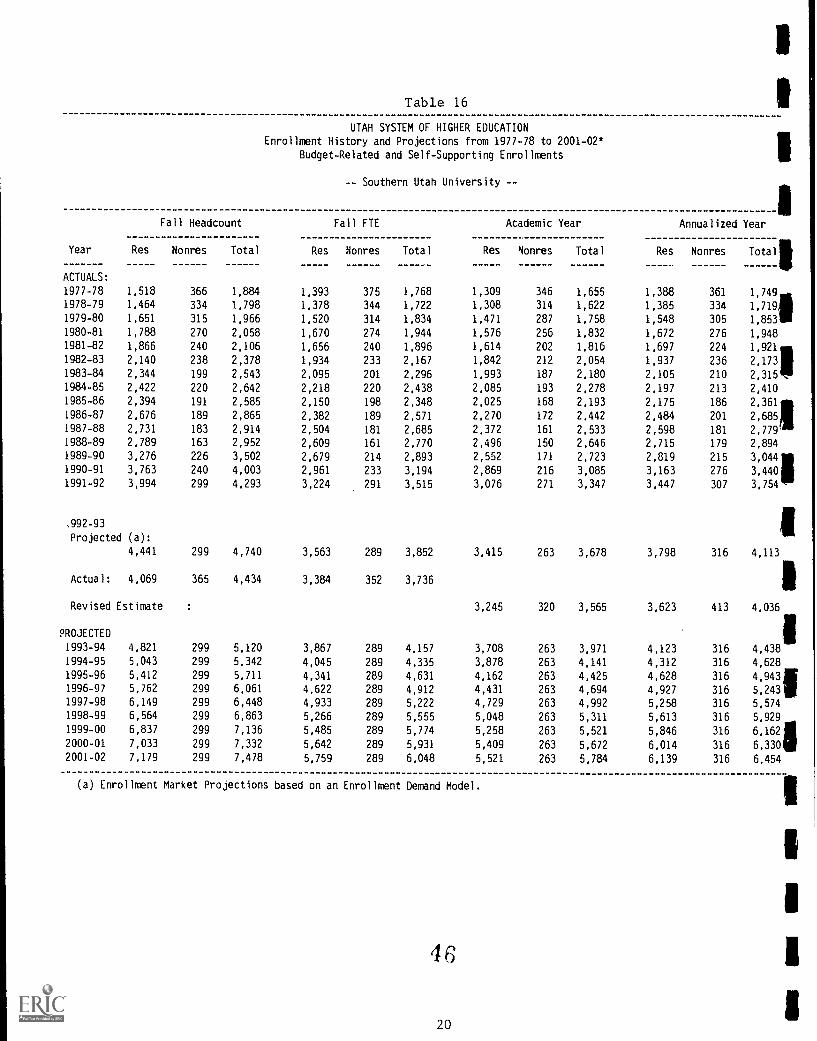
Table 16 1
Fall Headcount
UTAH SYSTEM OF HIGHER EDUCATION
Enrollment History and Projections from 1977-78 to 2001-02*
1Budget-Related and Self-Supporting Enrollments
-- Southern Utah University --
Fall FTE Academic Year Annualized Year
Year Res Nonres Total Res Nonres Total Res Honres Total Res Nonres Total
ACTUALS:
1977-78 1,518 366 1,884 1,393 375 1,768 1.309 346 1.655 1,388 361
1978-79 1,464 334 1,798 1,378 344 1,722 1,308 314 1,622 1,385 334
1979-80 1,651 315 1,966 1,520 314 1,834 1,471 287 1,758 1,548 305
1980-81 1,788 270 2,058 1,670 274 1,944 1,576 256 1,832 1,672 276
1981-82 1,866 240 2,106 1,656 240 1.896 1,614 202 1,816 1,697 224
1982-83 2,140 238 2,378 1,934 233 2,167 1,842 212 2,054 1,937 236
1983-84 2,344 199 2,543 2,095 201 2,296 1,993 187 2,180 2,105 210
1984-85 2,422 220 2,642 2,218 220 2,438 2,085 193 2,278 2,197 213
1985-86 2,394 191 2,585 2,150 198 2,348 2,025 168 2,193 2,175 186
1986-87 2,676 189 2,865 2,382 189 2,571 2,270 172 2.442 2,484 201
1987-88 2,731 183 2,914 2,504 181 2,685 2,372 161 2,533 2,598 181
1988-89 2,789 163 2,952 2,609 161 2,770 2,496 150 2,646 2,715 179
1989-90 3,276 226 3,502 2,679 214 2,893 2,552 171 2,723 2,819 215
1990-91 3,763 240 4,003 2,961 233 3,194 2,869 216 3,085 3,163 276
1991-92 3,994 299 4,293 3,224 291 3,515 3,076 271 3,347 3,447 307
,992-93
Projected (a):
4,441 299 4,740 3,563 289 3,852 3,415 263 3,678 3,798 316
Actual: 4,069 365 4,434 3,384 352 3,736
Revised Estimate 3,245 320 3,565 3,623 413
PROJECTED
1993-94 4,821 299 5,120 3,867 289 4,157 3,708 263 3,971 4,123 316
1994-95 5,043 299 5,342 4,045 289 4,335 3,878 263 4,141 4,312 316
1995-96 5,412 299 5,711 4,341 289 4,631 4,162 263 4,425 4,628 316
1996-97 5,762 299 6,061 4,622 289 4,912 4,431 263 4,694 4,927 3161997-98 6,149 299 6,448 4,933 289 5,222 4,729 263 4,992 5,258 316
1998-99 6,564 299 6,863 5,266 289 5,555 5,048 263 5,311 5,613 316
1999-00 6,837 299 7,136 5,485 289 5,774 5,258 263 5,521 5,846 316
2000-01 7,033 299 7,332 5,642 289 5,931 5,409 263 5,672 6,014 316
2001-02 7,179 299 7,478 5,759 289 6,048 5,521 263 5,784 6,139 316
1,749
1,719
1,853
1,948
1,921
2,173
2,315
2,410
2,361
2,685
2,779
2,894
3,044
3,440
3,754
III
4,113
14,036
114,438
4,628
4,943
5,243
5,574
5,929
6,162
6,330
6,454
(a) Enrollment Market Projections based on an Enrollment Demand Model.
1
4 6
20

IIIII
.6.
I 14g
1
Figures 9 and 10SUU Enrollment History and Projections
Cumulative Enrollment Levels
II1
IIIa
IIII1
...(1) fl tP 1,N egt, eg, 9). ,c6., tfo ;i:, 0 !6') + 5;\ 4' 59, # 0 cf3 4 01) c0 5C, ci` cit.
Year
- FALL HDCT +FALL FTE *AC FTE 11-AY FTE
SUU Enrollment History and ProjectionsAnnual Growth Rates (FTE)
-10% 1 f 1 11,1 1111,1111TA'\93AC)SCPR)..04309.)CbbC)t"i)CPC;\°P47)5i1,,,,eicp$0.,,,,,,.rn ,,,,,.,,,b 0 ig,4,41,civec,vc§scov,iticpe. 6., Nc, , Nc, Nc, ,.:,. c,,c) c,,c,,,,,
Ye ar
2 1
4 7

Table 17SUU Budget-Related and Self-Supporting Projections
Academic Year
Bud-Rel Self-Sup Total
Annualized Year
Bud-Rel Self-Sup Total
1991-92 3,292 56 3,348 3,698 56 3,754
1992-93 3,516 48 3,564 3,823 213 4,0361993-94 3,905 66 3,971 4,372 66 4,4381994-95 4,072 69 4,141 4,559 69 4,6281995-96 4,351 74 4,425 4,869 74 4,9431996-97 4,615 79 4,694 5,165 78 5,2431997-98 4,909 83 4,992 5,491 83 5,5741998-99 5,222 89 5,311 5,841 88 5,9291999-00 5,429 92 5,521 6,070 92 6,1622000-01 5,577 95 5,672 6,236 94 6,3302001-02 5,687 97 5,784 6,358 96 6,454
SUU Budget-Related Projections
Academic Year Annualized Year
Res Nonres Total Res Nonres Total
1991-92 3,022 270 3,292 3,392 306 3,698
1992-93 3,202 314 3,516 3,477 345 3,8221993-94 3,643 262 3,905 4,057 315 4,3721994-95 3,810 262 4,072 4,244 315 4,5591995-96 4,089 262 4,351 4,554 315 4,8691996-97 4,353 262 4,615 4,850 315 5,1651997-98 4,646 262 4,909 5,176 315 5,4911998-99 4,960 262 5,222 5,526 315 5,8411999-00 5,167 262 5,429 5,755 315 6,0702000-01 5,315 262 5,577 5,921 315 6,2362001-02 5,425 262 5,687 6,043 315 6,358
43

Table 18
UTAH SYSTEM OF HIGHER EDUCATION
Enrollment History and Projections from 1977-78 to 2001-02*
Budget-Related and Self-Supporting Enrollments
-- Snow College --
Fall Headcount
Year Res Nonres Total
ACTUALS:
Res
Fall FTE
Nonres Total Res
Academic Year
Nonres Total Res
Annualized Year
Nonres Total
1977-78 857 151 1,008 860 158 1,018 784 131 915 784 131 9151978-79 842 141 983 835 138 973 778 119 897 778 119 8971979-80 946 181 1,127 943 160 1,103 835 163 998 836 166 1,0021980-81 1,071 212 1,283 979 216 1,195 886 204 1,090 893 215 1,1081981-82 1,179 209 1,388 989 220 1,209 887 203 1,090 906 226 1,1321982-83 1,230 181 1,411 961 182 1,143 878 147 1,025 878 147 1,0251983-84 1,128 178 1,306 1,038 178 1,216 969 147 1,116 985 161 1,1461984-85 1,174 145 1,319 1,079 150 1,229 968 127 1,095 989 141 1,1301985-86 1,096 163 1,259 1,028 166 1,194 962 142 1,104 988 154 1,1421986-87 1,239 157 1,396 1,176 164 1,340 1,078 146 1,224 1,112 153 1,2651987-88 1,188 181 1,369 1,126 188 1,314 1,043 158 1,201 1,067 177 1,2441988-89 1,356 188 1,544 1,224 197 1,421 1,128 186 1,314 1,156 219 1,3751989-90 1,480 254 1,734 1,362 259 1,621 1,277 262 1,539 1,312 304 1,6161990-91 1,540 332 1,872 1,447 351 1,798 1,359 329 1,688 1,387 381 1,7681991-92 2,215 338 2,553 1,845 353 2,198 1,664 319 1,983 1,705 384 2,089
1992-93
Projected (a):
2,337 338 2,675 2,064 353 2,417 1,901 329 2,231 1,946 389 2,335
Actual: 2,455 364 2,819 2,061 391 2,452
Revised Estimate 1,897 365 2,262 1,957 424 2,381
PROJECTED
1993-94 2,501 338 2,839 2,209 353 2,562 2,035 329 2,364 2,083 389 2,4721994-95 2,657 338 2,995 2,346 353 2,699 2,162 329 2,491 2,213 389 2,6021995-96 2,770 338 3,108 2,446 353 2,799 2,254 329 2,583 2,307 389 2,6961996-97 2,833 338 3,171 2,502 353 2,855 2,305 329 2,634 2,359 389 2,7481997-98 2,889 338 3,227 2,551 353 2,904 2,350 329 2,680 2,406 389 2,7951998-99 3,049 338 3,387 2,692 353 3,046 2,481 329 2,810 2,539 389 2,9281999-00 3,131 338 3,469 2,765 353 3,118 2,547 329 2,877 2,608 389 2,9962000-01 3,139 338 3,477 2,772 353 3,125 2,554 329 2,883 2,614 389 3,0032001-02 3,116 338 3,454 2,752 353 3,105 2,535 329 2,864 2,595 389 2,984
(a) Enrollment Market Projections based on an Enrollment Demand Model.

1977-781978-791979-801980-811981-821982-831983-841984-851985-861986-571987-881988-891989-901990-911991-92
at.
1992-931993-941994-951995-961996-971997-981998-991999-002000-012001-02
o:cbc%s.
Ctit.4c""/>,s,
1977-781978-791979-801980-811981-821982-831983-841984-851985-861986-871987-881988-891989-901990-911991-92
.0.
1992-931993-941994-951995-961996-971997-981998-991999-002000-012001-02
</ '';'4"04_7;5
01, qx,iseecle,

Table 19
Snow College Budget-Related and Self-Supporting Projections
1991-92
II1992-931993-941994-95
11
1995-961996-971997-981998-99II1999-002000-012001-02
Academic Year
Bud-Rel Self-Sup Total
Annualized Year
Bud-Rel Self-Sup Total
1,884 99 1,983 1,990 99 2,089
2,053 208 2,261 2,169 212 2,3812,246 118 2,364 2,355 117 2,4722,367 124 2,491 2,479 123 2,6022,454 129 2,583 2,568 128 2,6962,502 132 2,634 2,618 130 2,7482,546 134 2,680 2,663 132 2,7952,670 140 2,810 2,789 139 2,9282,733 144 2,877 2,854 142 2,9962,739 144 2,883 2,861 142 3,0032,721 143 2,864 2,843 141 2,984
1991-92
II 1992-931993-941994-95I1995-961996-971997-981998-99II1999-002000-012001-02
Snow College Budget-Related Projections
Academic Year
Res Nonres Total
Annualized Year
Res Nonres Total
1,565 319 1,884 1,606 384 1,990
1,690 363 2,053 1,747 422 2,1691,917 329 2,246 1,966 389 2,3552,038 329 2,367 2,090 389 2,4792,125 329 2,454 2,179 389 2,5682,173 329 2,502 2,229 389 2,6182,217 329 2,546 2,274 389 2,6632,341 329 2,670 2,400 389 2,7892,404 329 2,733 2,465 389 2,8542,410 329 2,739 2,472 389 2,8612,392 329 2,721 2,454 389 2,843
51

Table 20UTAH SYSTEM OF HIGHER EDUCATION
Enrollment History and Projections from 1977-78 to 2001-02*
IBudget-Related and Self-Supporting Enrollments
--Dixie College --
iFall Headcount Fall FTE Academic Year Annualized Year
Year Res Nonres Total Res Nonres Total Res Nonres Total Res Nonres Total
ACTUALS
1977-78 1,096 296 1,392 901 300 1,201 847 268 1,115 868 281
1978-79 1,162 312 1,474 892 300 1,192 801 266 1,067 819 273
1979-80 1,354 225 1,589 950 225 1,175 910 211 1,121 524 217
1980-81 1,533 257 1,790 1,201 256 1,457 1,088 228 1,316 1,096 228
1981-82 1,672 232 1,904 1,288 233 1,521 1,181 199 1,380 1,181 199
1982-83 1,800 210 2,010 1,417 217 1,634 1,249 187 1,436 1,249 187
1983-84 1,694 171 1,865 1,404 178 1,582 1,277 160 1,437 1,289 160
1984-85 1,728 176 1,904 1,408 175 1,583 1,308 156 1,464 1,324 159
1985-86 2,025 207 2,232 1,533 204 1,737 1,427 179 1,606 1,459 187
1986-87 2,137 193 2,330 1,802 190 1,992 1,628 150 1,778 1,685 158
1987-8- 2,037 174 2,211 1,715 174 1,889 1,596 150 1,746 1,655 157
1988-89 2,066 162 2,228 1,713 160 1,873 1,595 133 1,728 1,659 143
1989-90 2,203 178 2,381 1,877 174 2,051 1,756 147 1,903 1,835 157
1990-91 2,354 174 2,528 1,982 176 2,158 1,908 158 2,066 1,985 171
1991-92 2,778 185 2,963 2,216 182 2,398 2,036 146 2,182 2,135 163
1992-93
Projected (a):
2,899 185 3,084 2,382 184 2,565 2,231 154 2,385 2,331 169
Actual: 2,662 206 2,868 2,194 208 2,402
Revised Estimate 2,054 175 2,229 2,177 187
PROJECTED
1993-94 3,158 185 3,343 2,594 184 2,778 2,430 154 2,584 2,540 169
1994-95 3,375 185 3,560 2,773 184 2,956 2,597 154 2,751
2
169
1995-96 3,625 185 3,810 2,978 184 3,161 2,789 154 2,944 2:79145 169
1996-97 3,730 185 3,915 3,064 184 3,248 2,870 154 3,025 3,000 169
1997-98 3,811 185 3,996 3,131 184 3,314 2,932 154 3,087 3,065 169
1998-99 4,027 185 4,212 3,308 184 3,492 3,099 154 3,253 3,238 169
1999-00 4,123 185 4,308 3,387 184 3,571 3,173 154 3,327 3,316 169
2000-01 4,133 185 4,318 3,395 184 3,579 3,180 154 3,335 3,324 169
2001-02 4,098 185 4,283 3,367 184 3,550 3,153 154 3,308 3,296 169
1,149
I1,092
1,141
1,325
1.380
1,436 i1,449
1,483
1,646
1,843 I1,812
1,102
1,992
2,156 I2,298
2,501
12,364
I2,709
2,883
3,084
3,169 I3,234
3,408
3,485 I3,493
3,465
(a) Enrollment Market Projections based on an Enrollment Demand Model.
5 2
26
1
1
1

Figures 13 and 14
Dixie Enrollment History and ProjectionsCumulative Enrollment Levels
5
4
0,f) 4P c51, 4P cd* cbc) cP. c9, 4'0 ok 4b 41/4 0 sA 6\ 67,
x.NAGY 90Q3' r?;,Bonj 1>: 4i 4:3 41'1 ,b01cfp" cp\ "cpri:cpry 0'0 ctiVcfp' cs,.<
.3.<3 :" 43 43q) 4")cb 439' 43tb ":3 Ne) 1 1 1 1 1 1 1 1 rt,
r--Year
-- FALL HDCT +FALL F TE *AC FTE AY FTE
Dixie Enrollment History and ProjectionsAnnual Growth Rates (FTE)
,33
T.
''ele.0:',1;\(e.ged.ge441NP.edeeeeecOY4PecO'cP.
Year
27
5 3

Table 21
Dixie College Budget-Related and Self-Supporting Projections
Academic Year Annualized Year
Bud-Rel Self-Sup Total Bud-Rel Self-Sup Total
1991-92 2,181 1 2,182 2,297 1 2,298
1992-93 2,220 9 2,229 2,354 9 2,3631993-94 2,583 1 2,584 2,708 1 2,7091994-95 2,750 1 2,751 2,882 1 2,8831995-96 2,943 1 2,944 3,083 1 3,0841996-97 3,024 1 3,025 3,168 1 3,1691997-98 3,086 1 3,087 3,233 1 3,2341998-99 3,252 1 3,253 3,407 1 3,4081999-00 3,325 2 3,327 3,483 2 3,4852000-01 3,333 2 3,335 3,491 2 3,4932001-02 3,306 2 3,308 3,463 2 3,465
Dixie College Budget-Related Projections
Academic Year Annualized Year
Res Nonres Total Res Nonres Total
1991-92 2,035 146 2,181 2,134 163 2,297
1992-93 2,046 174 2,220 2,168 186 2,3541993-94 2,429 154 2,583 2,539 169 2,7081994-95 2,596 154 2,750 2,713 169 2,8821995-96 2,789 154 2,943 2,914 169 3,0831996-97 2,870 154 3,024 2,999 169 3,1681997-98 2,932 154 3,086 3,064 169 3,2331998-99 3,098 154 3,252 3,238 169 3,4071999-00 3,171 154 3,325 3,314 169 3,4832000-01 3,179 154 3,333 3,322 169 3,4912001-02 3,152 154 3,306 3,294 169 3,463
54

1
Table 22
UTAH SYSTEM OF HIGHER EDUCATION
Enrollffent History and Projections from 1977-78 to 2001-02*
Budget-Related and Self-Supporting Enrollments
--College of Eastern Utah--
Total Institution
Fall Headcount
Year Res Nonres Total
ACTUALS
Res
Fall FTE
Nonres Total Res
Academic Year
Nonres Total Res
Annualized Year
Nonres Total
1977-78 946 39 985 644 36 680 589 42 631 606 44 650
1978-79 1,044 31 1,075 658 29 687 606 33 639 626 34 660
1979-80 902 48 950 629 47 676 548 44 592 580 45 625
1980-81 1,174 44 1,218 700 50 750 654 43 697 709 44 753
1981-82 1,255 35 1,290 824 39 863 728 33 761 795 34 829
1982-83 1,252 46 1,298 829 45 874 846 35 881 886 36 922
1983-84 1,294 65 1,359 926 70 996 943 44 988 1,020 45 1,065
1984-85 1,359 53 1,412 1,067 54 1,121 1,018 40 1,058 1,121 41 1,162
1985-86 1,318 53 1,371 1,005 54 1,059 1,021 44 1,065 1,097 44 1,141
1986-87 1,688 83 1,771 1,186 82 1,268 1,158 48 1,206 1,260 49 1,309
1987-88 2,079 68 2,147 1,231 65 1,296 1,138 43 1,181 1,237 44 1,281
1988-89 1,986 77 2,063 1,357 38 1,395 1,249 27 1,276 1,325 29 1,354
1989-90 2,304 37 2,341 1,494 31 1,525 1,295 31 1,325 1,386 34 1,420
1990-91 2,851 109 2,960 1,734 66 1,800 1,526 55 1,581 1,620 64 1,683
1991-92 2,703 63 2,766 1,773 60 1,833 1,542 58 1,600 1,630 63 1,693
1992-93
Projected (a):
2,996 63 3,059 1,920 51 1,971 1,665 48 1,713 1,768 53 1,821
Actual: 2,678 68 2,746 1,802 73 1,875
Revised Estimate 1,577 68 1,645 1,652 74 1,726
PROJECTED
1993-94 3,311 65 3,376 2,121 53 2,174 1,842 50 1,892 1,954 55 2,009
1994-95 3,492 65 3,557 2,236 53 2,289 1,944 50 1,994 2,061 55 2,116
1995-96 3,705 65 3,770 2,372 53 2,425 2,064 50 2,114 2,187 55 2,242
1996-97 3,789 65 3,854 2,426 53 2,479 2,112 50 2,161 2,237 55 2,292
1997-98 3,855 65 3,920 2,468 53 2,521 2,149 50 2,199 2,276 55 2,331
1998-99 4,045 65 4,110 2,590 53 2,643 2,256 50 2,306 2,388 55 2,443
1999-00 4,120 65 4,185 2,637 53 2,691 2,298 50 2,348 2,433 55 2,488
2000-01 4,126 65 4,191 2,641 53 2,694 2,302 50 2,351 2,436 55 2,491
7001-02 4,096 65 4,161 2,622 53 2,675 2,285 50 2,334 2,418 55 2,473
(a) Enrollment Market Projections based on an Enrollment Demand Model.
29
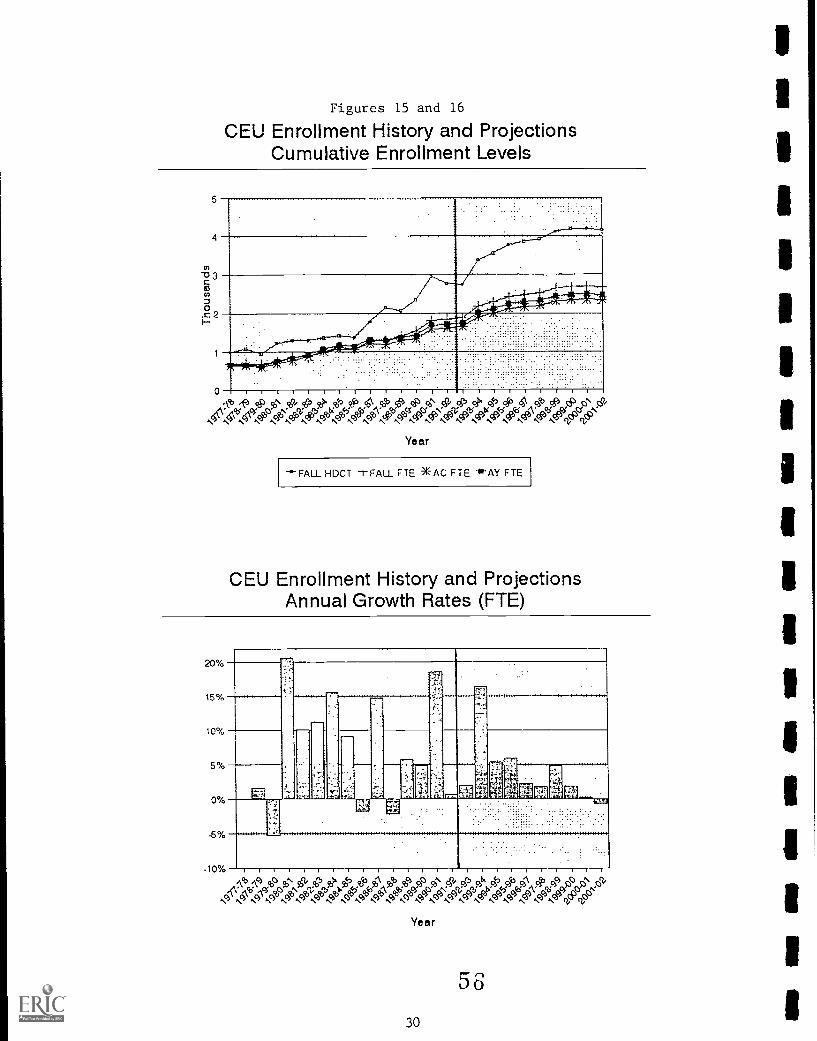
Figures 15 and 16CEU Enrollment History and Projections
Cumulative Enrollment Levels
5
4
-a 3
co
.= 2
0 1IIII5tP 5';` # q7, 0 40 OP F; # 0 0 FP 0 FP sP Fi
,\NNNNNN.eee0PCPOP:COP*45 RVCOYee04'eee4g)COICOCOb
Ye n r
FALL HDCT rFALL FTE *AC FTE -11-AY FTE
CEU Enrollment History and ProjectionsAnnual Growth Rates (FTE)
20%
15%
10%
5%
0%
-5%
g7-1
771
11,'
r--
TO,
I I 1 I I I 1 1
\b ACS ?J.% 5§. Qi5 cbt 4:1) cbC'' 9P 0 CP <8\ FP FP 41 FP ,C3A PP FP A.\ 6'
Ye a r
30

Table 23
CEU Budget-Related and Self-Supporting Projections CEU Budget-Related and Self-Supporting Projections
Education & General San Juan Center
1991-92
111992-93993-94994-951995-96
111
996-97997-98998-99999-00
2000-01
Academic Year
Bud-Rel Self-Sup Total
Annualized Year
Bud-Rel Self-Sup Total
Academic Year
Bud-Rel Self-Sup Total
Annualized Year
Bud-Rel Self-Sup Total
1,310 1,310 1,369 0 1,369 1991-92 290 0 290 324 324
1,393 1,393 1,448 1 1,449 1992-93 251 1 252 276 277
1,602 1,602 1,685 0 1,685 1993-94 290 290 324 324
1,704 1,704 1,792 0 1,792 1994-95 290 290 324 324
1,824 1,824 1,918 0 1,918 1995-96 290 290 324 324
1,871 1,871 1,968 0 1,968 1996-97 290 290 324 324
1,909 1,909 2,007 0 2,007 1997-98 290 290 324 324
2,016 2,016 2,119 0 2,119 1998-99 290 290 324 324
2,058 2,058 2,164 0 2,164 1999-00 290 290 324 324
2,061 2,061 2,167 0 2,167 2000-01 290 290 324 324
2,044 2,044 2,149 0 2,149 2001-02 290 290 324 324
CEU Budget-Related and Self-Supporting ProjectionsTotal Institution
11
991-92
992-931993-941994-9511995-96
996-97997-98
1998-991999-0011000-01
001-02
Academic Year
Bud-Rel Self-Sup
1,600 0
1,644 1
1,892 0
1,994 0
2,114 0
2.161 0
2,199 0
2.306 0
2,348 0
2,351 0
2,334 0
Total
1,600
1,6451,8921,9942,1142,1612,1992,3062,3482,3512,334
Annualized Year
Bud-Rel Self-Sup Total
1,693
1,7242,0092,1162,2422,2922,3312,4432,4882,4912,473
1,693
1,7262,0092,1162,2422,2922,3312,4432,4882,4912,473
College of Eastern Utah Budget-Related Projections College of Eastern Utah Budget-Related Projections
Education & General San Juan Center
Academic Year Annualized Year
Res Nonres Total Res Nonres Total
1111991-92 1,252 58 1,310 1,306 63 1,369
1992-93 1,327 66 1,393 1,376 72 1,448
11993-94 1,552 50 1,602 1,630 55 1,685
1994-95 1,654 50 1,704 1,737 55 1,792
1995-96 1,774 50 1,824 1,863 55 1,918
1996-97 1,822 50 1,872 1,913 55 1,968
1997-98 1,859 50 1,909 1,952 55 2,007
111998-99 1,966 50 2,016 2,064 55 2,119
1999-00 2,008 50 2,058 2,109 55 2,164
2000-01 2.012 50 2,062 2,112 55 2,167
2001-02 1,995 50 2,045 2,094 55 2,149
College of Eastern Utah Budget-Related ProjectionsTotal Institution
Academic Year Annualized Year
IIIRes Nonres Total Res Nonres Total
1991-92 1,542 58 1,600 1,630 63 1,693
1111992-93 1,576 68 1,644 1,650 74 1,724
1993-94 1,842 50 1,892 1,954 55 2,009
1994-95 1,944 50 1,994 2,061 55 2,116
1995-96 2,064 50 2,114 2,187 55 2,242
1996-97 2,112 50 2,162 2,237 55 2,292
1111991-98 2,149 50 2,199 2,276 55 2,331
1998-99 2,256 50 2,306 2,388 55 2,443
1999-00 2,298 50 2,348 2,433 55 2,488
2000-01 2,302 50 2,352 2,436 55 2,491
12001-02 2,285 50 2,335 2,418 55 2,473
31
Academic Year
Res Nonres Total
Annualized Year
Res Nonres Total
1991-92 290 290 324 0 324
1992-93 249 251 274 2 276
1993-94 290 290 324 0 324
1994-95 290 290 324 0 324
1995-96 290 290 324 0 324
1996-97 290 290 324 0 324
1997-98 290 290 324 0 324
1998-99 290 290 324 0 324
1999-00 290 290 324 0 324
2000-01 290 290 324 0 324
2001-02 290 290 324 0 324
5 7

Table 24UTAH SYSTEM OF HIGHER EDUCATION
Enrollment History and Projections from 1977-78 to 2001-02*
Budget-Related and Self-Supporting Enrollments
--College of Eastern Utah--
Education and General
Fall Headcount
Year Res Nonres Total
ACTUALS
Res
Fall FTE
Nonres Total Res
Academic Year
Nonres Total Res
Annualized Year
Nonres Total
1977-78 880 39 919 605 36 641 540 42 582 557 44 601
1978-79 938 31 969 583 29 612 525 33 558 546 34 580
1979-80 803 48 851 575 47 622 512 44 556 530 45 575
1980-81 1,059 44 1,103 631 50 681 586 43 629 610 44 654
1981-82 1,099 35 1,134 727 39 766 633 33 666 682 34 716
1982-83 1,061 46 1,107 715 45 760 696 35 731 719 36 755
1983-84 1,011 63 1,074 734 69 803 733 44 777 784 45 829
1984-85 1,060 53 1,113 848 54 902 790 40 830 866 41 907
1985-86 1,079 53 1,132 817 54 871 804 44 848 861 44 905
1986-87 1,320 83 1,403 897 82 979 890 48 939 952 49 1,001
1987-88 1,807 68 1,875 1,040 65 1,105 917 43 960 982 44 1,026
1988-89 1,624 77 1,701 1,111 38 1,149 1,008 27 1,035 1,052 29 1,081
1989-90 1,932 37 1,969 1,233 31 1,264 1,052 31 1,082 1,110 34 1,144
1990-91 2,201 108 2,309 1,344 65 1,409 1,196 54 1,250 1,266 63 1,328
1991-92 2,147 63 2,210 1,412 60 1,472 1,252 58 1,310 1,306 63 1,369
1992-93
Projected (a):
2,440 63 2,503 1,559 51 1,610 1,375 48 1,423 1,444 53 1,497
Actual: 2,242 65 2,307 1,504 71 1,575
Revised Estimate 1,327 66 1,393 1,377 72 1,449
PROJECTED
1993-94 2,755 65 2,820 1,760 53 1,813 1,552 50 1,602 1,630 55 1,685
1994-95 2,936 65 3,001 1,875 53 1,928 1,654 50 1,704 1,737 55 1,792
1995-96 3,149 65 3,214 2,011 53 2,064 1,774 50 1,824 1,863 55 1,918
1996-97 3,233 65 3,298 2,065 53 2,118 1,822 50 1,871 1,913 55 1,968
1997-98 3,299 65 3,364 2,107 53 2,160 1,859 50 1,909 1,952 55 2,007
1998-99 3,489 65 3,554 2,229 53 2,282 1,966 50 2,016 2,064 55 2,119
1999-00 3,564 65 3,629 2,276 53 2,330 2,008 50 2,058 2,109 55 2,164
2000-01 3,570 65 3,635 2,280 53 2,333 2,012 50 2,061 2,112 55 2,167
2001-02 3,540 65 3,605 2,261 53 2,314 1,995 50 2,044 2,094 55 2,149
(a) Enrollment Market Projections based on an Enrollment Demand Model.
32

Table 25UTAH SYSTEM OF HIGHER EDUCATION
III
Enrollment History and Projections from 1977-78 to 2001-02*
Budget-Related and Self-Supporting Enrollments
--College of Eastern Utah--
ISan Juan Center
Fall Headcount Fall FTE Academic Year Annualized Year
Year Res Nonres Total Res Nonres Total Res Nonres Total Res Nonres TotalI ACTUALS
1977-78 66
I 1978-79 106
1979-80 99
1980-81 115
1981-82 156
I 1982-83 191
1983-84 283
1984-85 299
1985-86 239
I 1986-87 368
1987-88 272
1988-89 362
1989-90 372
I 1990-91 650
1991-92 556
I1992-93
Projected (a):
556
iActual: 436
Revised Estimate
IPROJECTED
1993-94 556
1994-95 556
1995-96 556
I1996-97 556
1997-98 556
1998-99 556
1999-00 556
I 2000-01 556
2001-02 556
0 66 39 0 39 49 0 49 49 0 49
0 106 75 0 75 81 0 81 80 0 80
o 99 54 0 54 36 o 36 50 o 50
0 115 69 0 69 68 0 68 99 0 99
0 156 97 0 97 95 0 95 113 0 113
0 191 114 o 114 150 o 150 167 0 167
2 285 192 1 193 210 o 211 236 0 236
0 299 219 0 219 228 0 228 255 0 255
0 239 188 0 188 217 0 217 236 0 236
0 368 289 0 289 268 0 268 308 0 308
0 272 191 0 191 221 0 221 255 0 255
o 362 246 0 246 241 0 241 273 0 273
0 372 261 o 261 243 0 243 276 0 276
1 651 390 1 391 330 1 331 354 1 355
0 556 361 0 361 290 0 290 324 0 324
0 556 361 0 361 290 0 290 324 0 324
3 439 298 2 300
250 2 252 275 2 277
0 556 361 0 361 290 0 290 324 0 324
0 556 361 0 361 290 0 290 324 0 324
0 556 361 0 361 290 0 290 324 0 324
0 556 361 0 361 290 0 290 324 0 324
0 556 361 o 361 290 o 290 324 o 324
0 556 361 0 361 290 o 290 324 0 324
0 556 361 0 361 290 0 290 324 0 324
0 556 361 0 361 290 0 290 324 0 324
0 556 361 0 361 290 0 290 324 0 324
I(a) Enrollment Market Projections based on an Enrollment Demand Model.
1 0 9
1 33

Table 26
UTAH SYSTEM OF HIGHER EDUCATION
Enrollment History and Projections from 1977-78 to 2001-02*
Budget-Related and Self-Supporting Enrollments
--Utah Valley Community College--
Fall Headcount Fall FTE Academic Year Annualized Year
Year Res Nonres Total Res Nonres Total Res Nonres Total Res Nonres Total
ACTUALS
1977-78 3,398 395 3,793 2,462 434 2,896 2,244 416 2,660 2,413 450
1978-79 3,473 517 3,990 2,333 536 2,869 2,150 493 2,643 2,354 543
1979-80 3,520 610 4,130 2,557 655 3,212 2,403 570 2,973 2,614 636
1980-81 3,984 618 4,602 3,037 641 3,678 3,000 549 3,549 3,238 602
1981-82 4,324 617 4,941 3,537 589 4,126 3,461 518 3,979 3,778 571
1982-83 4,966 627 5,593 4,134 634 4,768 3,994 566 4,560 4,402 633
1983-84 5,473 620 6,093 4,611 629 5,240 4,228 539 4,767 4,662 610
1984-85 5,184 634 5,818 4,263 578 4,841 4,018 518 4,536 4,377 570
1985-86 5,365 648 6,013 4,314 572 4,886 3,998 465 4,463 4,367 532
1986-87 5,882 610 6,492 4,612 536 5,148 4,369 433 4,802 4,704 502
1987-88 6,331 637 6,968 4,907 513 5,420 4,445 390 4,835 4,826 476
1988-89 6,309 524 6,833 4,877 442 5,319 4,545 351 4,896 4,911 418
1989-90 7,118 640 7,758 5,446 541 5,987 4,968 438 5,406 5,347 507
1990-91 7,132 754 7,886 4,644 581 5,225 4,692 620 5,312 5,093 695
1991-92 7,988 789 8,777 5,430 637 6,067 5,510 629 6,139 6,001 738
1992-93
Projected (a):
8,670 789 9,459 5,934 632 6,567 5,900 621 6,521 6,406 716
Actual: 8,452 1,171 9,623 5,679 907 6,586
Revised Estimate 5,581 869 6,450 6,168 991
PROJECTED
1993-94 9,168 789 9,957 6,275 632 6,907 6,239 621 6,860 6,774 716
1994-95 9,594 789 10,383 6,567 632 7,199 6,529 621 7,150 7,089 716
1995-96 10,204 789 10,993 6,984 632 7,616 6,944 621 7,565 7,539 716
1996-97 10,471 789 11,260 7,167 632 7,799 7,126 621 7,746 7,737 716
1997-98 10,722 789 11,511 7,339 632 7,971 7,296 621 7,917 7,922 716
1998-99 11,328 789 12,117 7,753 632 8,386 7,709 621 8,330 8,370 716
1999-00 11,579 789 12,368 7,925 632 8,558 7,880 621 8,500 8,555 716
2000 ,i 11,609 789 12,398 7,946 632 8,578 7,900 621 8,521 8,577 716
200'-02 11,497 789 12,286 7,869 632 8,501 7,824 621 8,445 8,495 716
2,863
2,897
3,250
3,840
4,349
5,035
5,272
4,947
4,899
5,206
5,302
5,329
5,854
5,787
6,739
7,122
7,159
I7,489
7,804
8,255
8,452
I8,638
9,085
9,271
9,293
I9,210
(a) Enrollment Market Projections based on an Enrollment Demand Model.
I
GO
34

IP0 v/>o//
Qr.oeiy.
'4'45
.4k04,
AIA\
9/*%et
1977-781978-791979-801980-811981-821982-831983-841984-851985-861986-971987-881988-891989-901990-91
1-
1991-92
Itto,..
1992-931993-941994-951995-961996-971997-981998-991999-002030-012001-02
197-781978-791979-801980-811981-821982-831983-841984-851985-861986-871987-881988-891989-901990-91
J.-
1991-92
ett,,
1992-931993-941994-951995-961996-971997-981998-991999-002000-012001-02

Table 27UVCC Budget-Related and
Academic Year
Bud-Rel Self-Sup
Self-Supporting Projections
Annualized Year
Total Bud-Rel Self-Sup Total
1991-92 6,132 7 6,139 6,732 7 6,739
1992-93 6,441 9 6,450 7,148 11 7,1591993-94 6,852 8 6,860 7,481 8 7,4891994-95 7,142 8 7,150 7,796 8 7,8041995-96 7,556 9 7,565 8,246 9 8,2551996-97 7,737 9 7,746 8,443 9 8,4521997-98 7,908 9 7,917 8,629 9 8,6381998-99 8,321 9 8,330 9,076 9 9,0851999-00 8,490 10 8,500 9,261 10 9,2712000-01 8,511 10 8,521 9,283 10 9,2932001-02 8,435 10 8,445 9,200 10 9,210
Utah Valley Community College Budget-Related Projections
Academic Year Annualized Year
Res Nonres Total Res Nonres Total
1991-92 5,504 629 6,132 5,994 738 6,732
1992-93 5,572 869 6,441 6,157 991 7,1481993-94 6,231 621 6,852 6,765 716 7,4811994-95 6,521 621 7,142 7,080 716 7,7961995-96 6,935 621 7,556 7,530 716 8,2461996-97 7,116 621 7,737 7,727 716 8,4431997-98 7,287 621 7,908 7,913 716 8,6291998-99 7,700 621 8,321 8,360 716 9,0761999-00 7,869 621 8,490 8,545 716 9,2612000-01 7,890 621 8,511 8,567 716 9,2832001-02 7,814 621 8,435 8,484 716 9,200
62

1
1
Table 28UTAH SYSTEM OF HIGHER EDUCATION
Enrollment History and Projections from 1977-78 to 2001-02*
Budget-Related and Self-Supporting Enrollments
Salt Lake Community College
Total Institution
Fall Headcount Fall FTE Academic Year Annualized Year
Year Res Nonres Total Res Nonres Total Res Nonres Total Res Nonres Total
ACTUALS
1977-78 6,331
1978-79 6,359
1979-80 5,722
1980-81 5,853
1981-82 6,313
1982-83 7,445
1983-84 7,998
1984-85 8,242
1985-86 8,243
1986-87 8,756
1987-88 9,389
1988-89 9,294
1989-90 10,900
1990-91 13,028
1991-92 15,639
1992-93
Projected (a):
17,100
Actual: 17,372
Revised Estimate
PROJECTED
1993-94 18,728
1994-95 20,535
1995-96 22,396
1996-97 23,578
1997-98 24,855
1998-99 26,578
1999-00 27,302
2000-01 27,355
2001-02 27,175
132 6,463 3,843 136 3,979 3,478 121 3,599 3,837 137 3,974
128 6.487 3,584 133 3,717 3,299 137 3,436 3,670 144 3,814
126 5,848 3,638 139 3,777 3,336 136 3,472 3,721 149 3,870
84 5,937 3,984 91 4,075 3,727 93 3,820 4,118 119 4,237
70 6,383 4,088 73 4,161 4,033 66 4,099 4,507 66 4,573
63 7,508 4,853 60 4,913 4,704 54 4,758 5,273 68 5,341
62 8,060 5,127 49 5,176 4,884 38 4,922 5,474 48 5,522
47 8,289 5,280 37 5,317 4,943 33 4,976 5,520 43 5,563
64 8,307 5,402 53 5,455 5,058 46 5,104 5,666 54 5,720
59 8,815 5,511 43 5,554 5,168 43 5,211 5,788 57 5,845
47 9,436 5,808 40 5,848 5,410 35 5,445 6,027 46 6,073
73 9,367 5,840 53 5,893 5,764 49 5,813 6,471 59 6,530
103 11,003 6,733 86 6,819 6,648 90 6,737 7,480 104 7,584
316 13,344 7,745 173 7,918 7,398 181 7,579 8,381 215 8,596
333 15,972 9,533 234 9,767 9,268 245 9,513 10,257 300 10,557
333 17,433 10,361 224 10,585 10,042 235 10,276 11,230 282 11,512
395 17,767 10,668 285 10,953
10,257 292 10,549 11,515 358 11,873
333 19,061 11,347 224 11,571 10,998 235 11,233 12,299 282 12,581
333 20,868 12,442 224 12,666 12,059 235 12,294 13,486 282 13,768
333 22,729 13,569 224 13,794 13,152 235 13,387 14,708 282 14,990
333 23,911 14,286 224 14,510 13,846 235 14,081 15,485 282 15,766
333 25,188 15,059 224 15,283 14,596 235 14,831 16,323 282 16,605
333 26,911 16,103 224 16,327 15,608 235 15,842 17,455 282 17,736
333 27,635 16,542 224 16,766 16,033 235 16,268 17,930 282 18,212
333 27,688 16,574 224 16,798 16,064 235 16,299 17,965 282 18,247
333 27,508 16,465 224 16,689 15,958 235 16,193 17,847 282 18,128
(a) Enrollment Market Projections based on an Enrollment Demand Model.
37
63

ISZ/L'1".6
e>/.042
7,/,"/>100,4%
%% %17-43.50-(;),% 0
%4S
'160
.78
1 1985.
7
18743
9
12 1,
1
419,990-9,
92
0,.1
, -
1u992
94
11.
1 1996-96
4:;`"
.,..,
.),
_...,/
1 ...,s7
n9
1u.98-u
0
1999-°
1
190-0
2
2031-0
200
0
c3,
9
197197s7.79
.78
1979.80 9825
1n3- 81u
4- I1 198881i u
1
19-96
I-01991_92
le.
1993_94 1996-97
199997-981
,.-
1u9-uu
1
203

II
Table 29SLCC Budget-Related and Self-Supporting Projections
1991-92
II 1992-931993-941994-951995-961996-971997-981998-991999-00II2000-012001-02
II
Academic Year
Bud-Rel Self-Sup Total
Annualized Year
Bud-Rel Self-Sup Total
9,198 314 9,512 10,243 314 10,557
9,804 746 10,550 10,975 898 11,87310,862 371 11,233 12,207 374 12,58111,888 406 12,294 13,358 410 13,76812,945 442 13,387 14,544 446 14,99013,616 465 14,081 15,297 469 15,76614,341 490 14,831 16,111 494 16,60515,319 523 15,842 17,208 528 17,73615,731 537 16,268 17,670 542 18,21215,761 538 16,299 17,704 543 18,24715,658 535 16,193 17,589 539 18,128
Salt Lake Community College Budget-Related Projections
1991-92
II1992-931993-941994-95II1995-961996-971997-981998-991999-00II2000-012001-02
IIIII1
II1
Academic Year
Res Nonres Total
Annualized Year
Res Nonres Total
8,978 220 9,198 9,967 275 10,243
9,555 249 9,804 10,675 301 10,97610,651 211 10,862 11,948 259 12,20711,677 211 11,888 13,100 259 13,35812,734 211 12,945 14,286 259 14,54413,405 211 13,616 15,039 259 15,29714,130 211 14,341 15,853 259 16,11115,108 211 15,319 16,950 259 17,20815,520 211 15,731 17,412 259 17,67015,550 211 15,761 17,446 259 17,70415,447 211 15,658 17,330 259 17,589
6 5
39

Figures 1 and 2
USHE Academic and Vocational Fall Quarter FTE's15-Year History
60
50
40
30
20
Thousands
:
Table 1
Undergrad +Graduate Vocational
USHE Academic and Vocational Fall Quarter Headcount5-Year History
Thousands80
60
40
2)47
\ (le CP(2) Cb CS1;
Table 7
BEST COPY AVAILABLE
Undergrad +Graduate -*Vocational]
66

Figures 3 and 4
USHE Fall Quarter Headcount Enrollment by Age4-Year History
Thousands60
50
40
30
20
10
Table 2
Under 18 18-24 25-34 35-49
1989 In1990 01991 E1992
Over 50
USHE Fall Quarter Headcount Enrollment by Gender4-Year History
120,000
100,000
80,000
60,000
40,000
20,000
01989 1990 1991 1992
Female % 47.83 48.52 48.41 48.76Male % 52.16 51.47 51.58 51.23
El Male WI Female
Table 2
BEST COPY AVAILABLE
4 1

Figures 5 and 6
USHE Fall Quarter HeadcountBy Full-Time and Part-Time Status
120,000
100,000
80,000 r
60,000 -t
40,000
20,000
1989 1990 1991 1992
Part-Time % 42.30242 43.87981 43.52887 42.88451
Full-Time % 57.69758 56.12019 56.47113 57.11549
Full-Time Part-Time
Table 3
USHE Fall Quarter HeadcountBy Residency
120,000
100,000
80,000
60,000
40,000
20,000
01989
IZ:Z:ZZ2 IEZ:=4
1990 1991 1992
Resident % 91.79419 90.95071 91.23477 90.86252 1
Non-Res % 8.205811 9.049289 8.765234 9.137481
Table 4IEl
Resident Non-Resident
4 2
68

TABLE 2 (Page 1)
UTAH SYSTEM OF HIGHER EDUCATION
4-Year History of Fall Quarter Headcount Enrollment by Age and Gender
Under
Fall 1989
Over Un- Under
Fall 1990
Over Un-
Inst. 18 18-19 20-21 22-24 25-29 30-34 35-49 50-64 64 known Total 18 18-19 20-21 22-24 25-29 30-34 35-49 50-64 64 known Total
U OF U
Male 50 1,743 1,803 3,611 3,285 1,362 1,072 78 65 9 13,078 66 1,699 2,046 3,765 3,522 1,368 1,277 86 74 12 13,915
Female 35 1,842 1,992 1,951 1,523 1,013 1,539 221 61 16 10,193 49 1,881 2,197 2,153 1,686 989 1,746 218 70 15 11,004
Unknown 43 13 15 44 76 30 39 5 4 889 1,161 15 25 12 41 66 31 32 5 3 276 506
Total 128 3,598 3,810 5,606 4,884 2,405 2,650 304 130 914 24,432 130 3,605 4,255 5,959 5,274 2,388 3,055 309 147 303 25,425
USU
Kale 241 1,168 888 2,002 1,586 726 816 76 51 0 7,554 194 1,162 1,058 2,095 1,772 773 812 96 31 0 7,993
Female 266 1,777 1,263 907 712 517 1,116 191 58 0 6,807 ,278 1,897 1,524 1,008 789 550 1,278 207 48 0 7,579
Total 507 2,945 2,151 2,909 2,298 1,243 1,932 267 109 0 14,361 472 3,059 2,582 3,103 2,561 1,323 2,090 303 79 0 15,572
HSU*
Male 72 991 797 1,584 1,535 744 716 85 6 47 6,577 97 972 867 1,667 1,506 740 766 91 8 45 6,759
Female 136 1,566 1,156 941 886 749 1,376 168 14 77 7,069 165 1,524 1,308 1,037 910 758 1,349 149 8 71 7,278
Unknomn 0 0 0 0 0 0 0 0 0 4 4 0 0 0 0 0 0 0 0 0 1 1
Total 208 2,557 1,953 2,525 2,421 1,493 2,092 253 20 128 13 650 262 2,495 2,175 2,704 2,416 1,498 2,115 240 16 117 14,038
SUU
Mall 17 304 234 413 257 76 129 21 135 1 1,587 8 289 292 484 289 69 109 21 202 5 1,768
Female 23 475 422 216 126 116 286 53 198 0 1,915 5 576 474 298 119 126 286 64 281 6 2,235
Total 41 779 655 629 383 192 415 74 333 1 3,502 13 865 766 782 408 195 395 85 483 11 4,003
SNOWmale 12 390 127 111 30 17 27 2 2 0 718 9 378 172 128 30 14 25 2 1 0 759
Fem,le 13 598 138 39 51 59 101 16 1 0 1,016 17 632 206 38 41 52 115 11 1 0 1,113
Total 25 988 265 150 81 76 128 18 3 0 1,734 26 1,010 378 166 71 66 140 13 2 0 1,872
DIXIE
Male 105 474 195 209 52 35 35 6 12 1 1,124 127 480 212 230 89 43 51 4 7 7 1,250
Female 76 631 147 53 68 82 130 43 23 6 1,259 81 657 193 57 52 65 123 26 14 10 1,278
Total 181 1,105 342 261 120 117 165 49 35 7 2,382 208 1,137 405 287 141 108 174 30 21 17 2,528
CEU*
Male 123 258 98 71 113 156 257 57 12 0 1,145 247 287 127 100 121 154 262 50 16 1 1,365
Female 151 319 107 67 125 140 240 32 13 0 1,194 378 340 133 69 145 144 268 53 16 3 1,549
Unknown 0 0 0 0 0 0 0 0 2 0 2 0 2 2 0 2 1 1 0 38 0 46
Total 274 577 205 138 238 296 497 89 27 0 2,341 625 629 262 169 268 299 531 103 70 4 2,960
UVCC
Male 115 768 586 1,337 767 264 264 37 14 1 4,153 131 808 580 1,331 753 295 270 34 15 1 4,218
Female 87 1,207 795 422 389 262 388 44 8 3 3,605 85 1,245 795 463 365 259 404 40 5 2 3,663
Unknown 0 0 0 0 0 0 0 0 0 0 0 0 0 0 0 2 0 0 0 3 0 5
Total 202 1,975 1,381 1,759 1,156 526 652 81 22 4 7,758 216 2,053 1,375 1,794 1,120 554 674 74 23 3 7,886
SLCC
Kale 50 794 835 1,199 1,130 686 848 107 137 2 5,788 66 852 1,018 1,444 1,257 828 977 113 233 3 6,791
Female 82 988 734 592 825 681 1,107 135 56 3 5,203 98 1,131 1,047 769 917 801 1,411 170 198 2 6,544
Unknown 0 0 1 1 2 2 3 0 3 0 12 0 3 1 0 3 0 1 0 1 0 9
Total 132 1,782 1,570 1,792 1,957 1,369 1,958 242 196 5 11,003 164 1,986 2,066 2,213 2.177 1,629 2,389 283 432 5 13,344
SYSTEMWIDE
Male 786 6,890 5,562 10,537 8,755 4,066 4,164 469 434 61 41,724 945 6,927 6,372 11,244 9,339 4,284 4,549 497 587 74 44,818
Female 869 9,403 6,754 5,188 4,705 3,619 6,283 903 432 105 38,260 1,156 9,883 7,877 5,892 5,024 3,744 6,980 938 641 109 42,243
Unknown 43
Total 1,697
13
16,306
16
12,332
45 78
15,770 13,5SZ
32
7.715
42
10,4e9
5
1,377
9 893
875 1,059
1,179
81,163
15
2,116
30
16,839
15
14,264
41
17,177
73
14,436
32
8,060
34
11,563
5
1,440
45 276 566
1,273 460 87,628
*WSU and CEU Unduplicated beginning Fall 1991 II
70
44
BEST COPY AVAILABLE 1
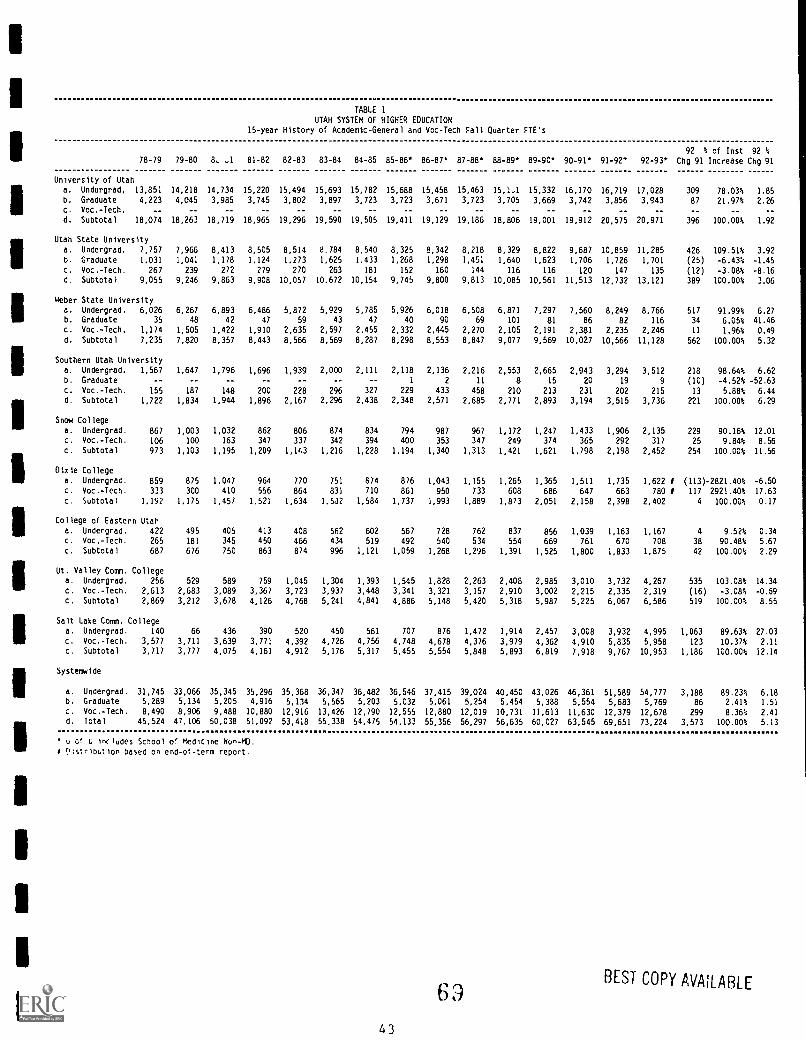
TABLE 1
UTAH SYSTEM OF HIGHER EDUCATION
15-year History of Academic-General and Voc-Tech Fall Quarter FTE's
92 % of Inst 92 h78-79 79-80 8, 31 81-82 82-83 83-84 84-85 85-86* 86-87* 87-88* 88-89* 89-90* 90-91* 91-92* 92-93* Chg 91 Increase Chg 91
University of Utah
a. Undergrad. 13,851 14,218 14,734 15,220 15,494 15,693 15,782 15,688 15,458 15,463 15,1.1 15,332 16,170 16,719 17,028 309 78,03% 1.85
b. Graduate 4,223 4,045 3,985 3,745 3,802 3,897 3,723 3,723 3,671 3,723 3,705 3,669 3,742 3,856 3,943 87 21.97% 2.26c. Voc.-Tech. -- -- -- -- -- -- -- -- -- -- -- -- -- -- -- -- -- --
d. Subtotal 18,074 18,263 18,719 18,965 19,296 19,590 19,505 19,411 19,129 19,186 18,806 19,001 19,912 20,575 20,971 396 100.00% 1.92
Utah State University
a. Undergrad. 7,757 7,966 8,413 8,505 8,514 8,784 8,540 8,325 8,342 8,218 8,329 8,822 9,687 10,859 11,285 426 109.51% 3.92
D. Graduate 1,031 1,041 1,178 1,124 1,273 1,625 1,433 1,268 1,298 1,451 1,640 1,623 1,706 1,726 1,701 (25) -6.43% -1.45
c. Voc.-Tech. 267 239 272 279 270 263 181 152 160 144 116 116 120 147 135 (12) -3.08% -8.164. Subtotal 9,055 9,246 9,863 9,908 10,057 10,672 10,154 9,745 9,800 9,813 10,085 10,561 11,513 12,732 13,121 389 100.00% 3.06
Weber State University
a. Undergrad. 6,026 6,267 6,893 6,486 5,872 5,929 5,785 5,926 6,018 6,508 6,871 7,297 7,560 8,249 8,766 517 91.99% 6.27b. Graduate 35 aa 42 47 59 43 47 40 90 69 101 81 86 82 116 34 6.05% 41.46
C. voc.-Tech. 1,174 1,505 1,422 1,910 2,635 2,597 2,455 2,332 2,445 2,270 2,105 2,191 2,381 2,235 2,246 11 1.96% 0.49
4. Subtotal 7,235 7,820 8,357 8,443 8,566 8,569 8,287 8,298 8,553 8,847 9,077 9,569 10,027 10,566 11,128 562 100.00% 5.32
Southern Utah University
a. Undergrad. 1,567 1,647 1,796 1,696 1,939 2,000 2,111 2,118 2,136 2,216 2,553 2,665 2,943 3,294 3,512 218 98.645; 6.62b. Graduate -- -- -- -- -- -- 1 2 11 8 15 20 19 9 (10) -4.52k -52.63
c. Voc.-Tech. 155 187 148 200 228 296 327 229 433 458 210 213 231 202 215 13 5.88% 6.44
4. Subtotal 1,722 1,834 1,944 1,896 2,167 2,296 2,438 2,348 2,571 2,685 2,771 2,893 3,194 3,515 3,736 221 100.00% 6.29
Snow College
a. Undergrad. 867 1,003 1,032 862 806 874 834 794 987 967 1,172 1,247 1,433 1,906 2,135 229 90.16% 12.01
c. Vac.-Tech. 106 100 163 347 337 342 394 400 353 347 249 374 365 292 317 25 9.84% 8.56
c. Subtotal 973 1,103 1,195 1,209 1,163 1,216 1,228 1,194 1,340 1,313 1,421 1,621 1,798 2,198 2,452 254 100.00% 11.56
Dixie College
a. Undergrad. 859 875 1.047 964 770 751 874 876 1,043 1,155 1,265 1,365 1,511 1,735 1,622 if (113)-2821.40% -6.50c. Voc.-Tech. 333 300 410 556 864 831 710 861 950 733 608 686 647 663 780 I 117 2921.40% 17.63
c. Subtotal 1,192 1.175 1,457 1.521 1,634 1.532 1,584 1,737 1,993 1,889 1,873 2,051 2,158 2,398 2,402 4 100.00% 0.17
College of Eastern Utah
a. unaergrad. 422 495 405 413 408 562 602 567 728 762 837 856 1,039 1,163 1,167 4 9.52% 0.34c. Voc.-Tech. 265 181 345 450 466 434 519 492 540 534 554 669 761 670 708 38 90.48% 5.67
c. Subtotal 687 676 750 863 874 996 1,121 1,059 1,268 1,296 1,391 1,525 1,800 1,833 1,875 42 100.00% 2.29
Ut. Valley Comm. College
a. Undergrad. 256 529 589 759 1,045 1,304 1,393 1,545 1,828 2,263 2,408 2,985 3,010 3,732 4,267 535 103.08% 14.34
c. Voc.-Tech. 2,613 2,683 3,089 3,367 3,723 3,937 3,448 3,341 3,321 3,157 2,910 3,002 2,215 2,335 2,319 (16) -3.08% -0.69
c. Subtotal 2,869 3,212 3,678 4,126 4,768 5,241 4,841 4,886 5,148 5,420 5,318 5,987 5,225 6,067 6,586 519 100.00% 8.55
Salt Lake Comm. College
a. Undergrad. 140 66 436 390 520 450 561 707 876 1,472 1,914 2,457 3,008 3,932 4,995 1,063 89.63% 27.03
c. Voc.-Tech. 3,577 3,711 3,639 3,771 4,392 4,726 4,756 4,748 4,678 4,376 3,979 4,362 4,910 5,835 5,958 123 10.37% 2.11
c. Subtotal 3,717 3,777 4,075 4,161 4,912 5,176 5,317 5,455 5,554 5,848 5,893 6,819 7,918 9,767 10,953 1,186 100.00% 12.14
Systemalde
a. Undergrad. 31,745 33,066 35,345 35,296 35,368 36,347 36,482 36,546 37,415 39,024 40,450 43,026 46,361 51,589 54,777 3,188 89.23% 6.18b. Graduate 5,289 5,134 5,205 4,916 5,134 5,565 5,203 5,032 5,061 5.254 5,454 5,388 5,554 5,683 5,769 86 2.41% 1.51
c. Voc.-Tech. 8,490 8,906 9,488 10,880 12,916 13,426 12,790 12,555 12,880 12,019 10,731 11,613 11,630 12,379 12,678 299 8.36% 2.414. Total 45,524 47,106 50,038 51.092 53,418 55,338 54,475 54,133 55,356 56,297 56,635 60,027 63,545 69,651 73,224 3,573 100.00% 5.13
u of U Includes School of Medicine Nom-MD.
0:stribution Dasea on end-of-term report.
4 3
63BEST COPY AVAILABLE

TABLE 3
UTAH SYSTEM OF HIGHER EDUCATION
4-Year History of Full-Time and Part-Time Fall Quarter Headcount Enrollment
By Class Standing
Institution
U OF U +
Full
Time
Fall Iggg
Part PT as %
Time Total Of Total
Full
Time
Fall 1990
Part PT as ½
Time Total Of Total
Full
Time
Fall 1991
Part PT as %
Time Total Of Total
Full
Time
Fall 1992
Part PT as %
Time Total Of Total
Lower Division 6,358 3,060 9,418 32.49% 6,798 3,782 10,580 35.75% 6,745 4,099 10,844 37.80% 6,545 3,498 10,043 34.83%
Upper 6,168 3,618 9,786 36.97% 6,595 3,834 10,429 36.76% 7,033 4,163 11,196 37.18% 7,675 4,318 11,993 36.00%
Beg. Grad 1,458 1,177 2,635 44.67% 1,435 1,209 2,644 45.73% 1,456 1,328 2,784 47.70% 1,537 1,330 2,867 46.39%
Adv. Grad 987 717 1,704 42.08% 1,041 731 1,772 41.25% 1,096 717 1,813 39.55% 1,100 796 1,896 41.98%
Academic/Gen Subtotal 14,971 8,572 23,543 36.41% 15,869 9,556 25,425 37.59% 16,330 10,307 26,637 38.69% 16,857 9,942 26,799 37.10%
Vocational/Technical 0 0 0 -- 0 0 0 -- 0 0 0 -- 0 0 0 --
TOTAL 14,971 8,572 23 543 36.41% 15,869 9,556 25,425 37.59% 16,330 10,307 26,637 38.69% 16,857 9,942 26,799 37.10%
USU
Lower Division 4,305 2,636 6,941 37.98% 4,838 2,594 7,432 34.90% 5,260 2,791 8,051 34.67% 5,175 2,925 8,100 36.11%
Upper 3,461 1,047 4,508 23.23% 3,711 1,340 5,051 26.53% 4,157 1,464 5,621 26.05% 4,524 1,419 5,943 23.88%
Beg. Grad 597 1,912 2,509 76.21% 634 2,041 2,675 76.30% 652 1,761 2,413 72.98% 635 1,964 2,599 75.57%
Adv. Grad 157 246 403 61.04% 161 253 414 61.11% 152 294 446 65.86% 165 307 472 65.04%
Academic/Gen Subtotal 8,520 5,841 14,361 40.67% 9,344 6,228 15,572 39.99% 10,221 6,310 16,531 38.17% 10,499 6,615 17,114 38.65%
Vocational/TechnicalTOTAL 8,520 5,841 14,361 40.67% 9,344 6,228 15,572 39.99% 10,221 6,310 16,531 38.17% 10,499 6,615 17,114 38.65%
WSu
Lower Division 4,508 3,377 7.885 42.83% 4,711 3,312 8,023 41.28% 4,885 3,255 8,140 39.98% 5,097 3,129 8,226 38.04%
Uppt- 2.762 2,863 5,625 50.90% 3,021 2,857 5,878 48.60% 3,374 2,794 6,168 45.29% 3,717 2,894 6,611 43.78%
Beg. Grad 24 116 140 82.86% 28 109 137 79.56% 41 83 124 66.94% 67 89 156 57.05%
Academic/Gen Subtotal 7,294 6,356 13,650 46.56% 7,760 6,278 14,038 44.72% 8,301 6,131 14,432 42.48% 8,881 6,112 14,993 40.77%
Vocational/TechnicalTOTAL 7,294 6,356 13,650 46.56% 7,760 6,278 14,038 44.72% 8,301 6,131 14,432 42.48% 8,881 6,112 14,993 40.77%
SUU
First Time Freshmen 349 23 372 6.18% 607 45 652 6.90% 956 104 1,060 9.81% 822 60 882 6.80%
Other Lower Division 1,085 680 1,765 38.53% 1,012 751 1,763 42.60% 886 669 1,535 43.58% 1,186 700 1,886 37.12%
Lipper 854 266 1,120 23.75% 1,054 257 1,311 19.60% 1,214 248 1,462 16.96% 1,226 199 1,425 13.96%
Beg. Grad 14 4 18 22.84% 16 8 24 33.33% 11 7 18 38.89% 3 8 11 72.73%
Academic/Gen Subtotal 2,302 973 3,275 29.71% 2,689 1,061 3,750 28.29% 3,047 1,028 4.075 25.23% 3,237 967 4,204 23.00%
vocational/Technical 196 31 227 13.66% 193 60 253 23.72% 191 27 218 12.39% 198 32 230 13.91%
TOTAL 2,498 1,004 3,502 28.67% 2,882 1,121 4,003 28.00% 3,238 1,055 4,293 24.57% 3,435 999 4,434 22.53%
SNOW
Academic & GeneralFirst Time Freshmen 601 96 697 13.77% 647 69 716 9.54% 850 139 989 14.05% 939 60 999 6.01%
Other Lower Division 507 152 659 23.07% 626 181 807 22.43% 746 518 1,264 40.98% 863 636 1,499 42.43%
Subtotal 1,108 248 1,356 18.29% 1,273 250 1,523 16.41% 1,596 657 2,253 29.16% 1,802 696 2,498 27.86%
Vocational/Technical 335 43 378 11.38% 326 23 349 6.59% 256 44 300 14.67% 289 32 321 9.97%
TOTAL 1,443 291 1,734 16.78% 1,599 273 1,872 14.58% 1,852 701 2,553 27.46% 2,091 728 2,819 25.82%
DIXIE
first Time Freshmen 607 225 832 27.04% 642 268 910 29.45% 708 133 841 15.81% 582 93 675 13.81%
Other Lower Division 539 226 765 29.54% 632 233 865 26.94% 746 637 1,383 46.06% 776 427 1,203 35.47%
Academic/Gen Subtotal 1,146 451 1,597 28.24% 1,274 501 1,775 28.23% 1,454 770 2,224 34.62% 1,358 520 1,878 27.68%
Vocational/Technical 576 208 784 26.53% 524 229 753 30.41% 567 172 739 23.27% 560 430 990 43.40%
TOTAL 1,722 659 2,381 27.68% 1,798 730 2,528 28.88% 2,021 942 2,963 31.79% 1,918 950 2,868 33.11%
CEU
First Time Freshmen 188 89 277 32.13% 223 381 604 63.08% 395 336 731 45.94% 379 303 682 44.43%
Other Lower Olvision 435 569 1,004 56.67% 430 742 1,172 63.31% 430 563 992 56.72% 496 424 920 46.09%
Academic/Gen Subtotal 623 658 1,281 51.37% 653 1,123 1,776 63.23% 825 899 1,724 52.15% 875 727 1,602 45.38%
vocational/Technical 493 566 1,059 53.45% 548 636 1,184 53.72% 496 474 970 48.90% 559 585 1,144 51.14%TOTAL 1,116 1,224 2,340 52.31% 1,201 1,759 2,960 59.43% 1,321 1,373 2,694 50.98% 1,434 1,312 2,746 47.78%
UVCC
First Time Freshmen 839 455 1,294 35.16% 857 656 1,513 43.36% 936 610 1,546 39.45% 842 835 1,677 49.79%
Other Lower Division 1,407 1,189 2,596 45.80% 1,374 1,626 3,000 54.20% 1,895 1,837 3.732 49.21% 2,270 2,251 4,521 49.79%
Academic/Gen Subtotal 2,246 1,644 3,890 42.26% 2,231 2,282 4,513 50.57% 2,831 2,447 5,278 46.36% 3,112 3,086 6,196 49.80%
Vocational/Technical 2,260 1,608 3,868 41.57% 1.576 1,797 3,373 53.28% 1,500 1,999 3,499 57.13% 1,721 1,706 3,427 49.79%
TOTAL 4,506 3.252 7.758 41.92% 3,807 4,079 7,886 51.72% 4,331 4,446 8,777 50.65% 4,832 4,791 9,623 49.79%
StaFirst Time Freshmen 491 601 1,092 55.04% 515 628 1,143 54.94% 963 1.747 2,710 64.48% 822 1,644 2,466 66.67%
Other Lower Division 1,133 1.628 2,761 58 96% 1,476 2,060 3,536 58.26% 1,485 2,182 3,667 59.50% 2,231 3,507 5,738 61.12%
Academic/Gen Subtotal 1,624 2,229 3,853 57.85% 1,991 2,688 4,679 57.45% 2,448 3,929 6,377 61.61% 3,053 5,151 8,204 62.79%vocattonal/Tecnnical 2,621 4,529 7,150 63.34% 2,926 5,739 8,665 66.23% 3,501 6,094 9,595 63.51% 3,637 5,926 9,563 61.97%
TOTAL 4,245 6,758 11,003 61.42% 4,917 8,427 13,344 Fj.15% 5,949 10.023 15,972 62.75% 6,690 11,077 17,767 67.35%
SYSTEMWIDE
First Time Freshmen 3,075 1,489 4,564 32.62% 3,491 2,047 5,538 36.96% 4,808 3,069 7,877 38.96% 4,386 2,995 7,381 40.58%
Other Lower Division 20,277 13,517 33,794 40.00% 21,897 15,281 37,178 41.10% 23,059 16,550 39,609 41.78% 24,639 17,497 42,136 41.52%Open 13,245 7.794 21,039 37.05% 14,381 8,288 22,669 36.56% 15,778 8,669 24.447 35.46% 17,142 8,830 25,972 34.00%
Beg. Crad 2,093 3,209 5,302 60.53% 2,113 3,367 5,480 61.44% 2,160 3,179 5,339 59.54% 2,242 3,391 5,633 60.20%Adv. Grad 1,144 963 2,107 45.70% 1,202 984 2,186 45.01% 1,248 1,011 2,259 44.74% 1,265 1,103 2,368 46.58%Arademic/Gen Subtotal 39,834 26.972 66,806 40.37% 43,084 29,967 73,051 41.02% 47,053 32,477 79,531 40.84% 49,674 33,816 83,490 40.50%
Vccationalliecnnical 6,481 6.985 13,466 51.87% 6,093 8,484 14,577 58.20% 6,511 8,811 15,321 57.51% 6,964 8,711 15,675 55.57%701AL 46,315 33,957 80,272 42.30% 49,177 38,451 87,628 43.88% 53,564 41,288 94,852 43.53% 56,638 42,526 99,165 42.88%
fall 1989 figures do not include off campus for the U of U.
4 6
72BEST COPY AVAILABLE
1

1
1
TABLE 2 (Page 2)
UTAH SYSTEM OF HIGHER EDUCATION
4-Year History of Fall Quarter Headcount Enrollment by Age and Gender
Under
Fall 1991
Over Un- Under
Fall 1992
Over Un-Inst. 18 18-19 20-21 22-24 25-29 30-34 35-49 50-64 64 known Total 18 18-19 20-21 22-24 25-29 30-34 35-49 50-64 64 known Total
U OF U
Male 159 1,642 1,983 4,170 3,614 1,481 1,287 94 99 15 14,544 39 1,589 1,885 4,348 3,797 1,405 1,264 103 106 5 14,541Female 180 1,874 2,302 2,254 1,778 997 1,857 240 80 39 11,601 65 1,973 2,185 2,459 1,777 1,042 1,829 257 94 15 11,696Unknown 20 32 11 33 63 29 34 5 5 260 492 16 24 31 69 82 40 58 7 5 230 562Total 359 3,548 4,296 6,457 5,455 2,507 3,178 339 184 314 26,637 120 3,586 4,101 6,876 5,656 2,487 3,151 367 205 250 26,799
USU
Male 225 1,285 1,131 2,358 1,818 777 838 67 36 0 8,535 146 1,054 981 2,679 1,940 821 851 84 34 0 8,590Female 249 2,100 1,818 1,166 748 549 1,136 189 41 0 7,996 226 1,971 1,906 1,414 822 545 1,333 238 69 0 8,524Total 474 3,385 2,949 3,524 2,566 1,326 1,974 256 77 0 1C,531 372 3,025 2,887 4,093 2,762 1,366 2.184 322 103 0 17,114
WSU*Male 169 950 1,081 1,713 1,354 711 854 100 99 16 7,047 80 1,044 894 1,901 1,516 667 839 82 16 70 7,109Female 251 1,603 1,356 1,008 855 713 1,335 148 73 34 7,376 207 1,752 1,434 1,184 896 747 1,398 155 21 83 7,877Unknown 0 0 1 0 1 0 1 0 6 0 9 0 o 1 1 2 0 0 0 0 3 7
Total 420 2,553 2,438 2,721 2,210 1,424 2,190 248 178 50 14,432 287 2,796 2,329 3,086 2,414 1,414 2,237 237 37 156 14,993
SUU
Male 11 373 295 539 287 62 120 12 193 2 1,894 23 427 304 612 278 81 98 22 140 0 1,985Female 14 674 503 335 125 117 303 47 275 6 2,399 18 742 547 348 130 121 283 58 202 0 2,449
Total 25 1,047 798 874 412 179 423 59 468 8 4,293 41 1,169 851 960 408 202 381 80 342 0 4,434
SNOW
Male 142 482 189 169 42 29 43 5 0 0 1,101 147 537 199 170 39 24 37 6 5 0 1,164Female 212 711 202 55 48 56 153 13 2 0 1,452 268 894 192 73 44 47 120 12 5 0 1,655
Total 354 1,193 391 224 90 85 196 18 2 0 2,553 415 1,431 391 243 83 71 157 18 10 0 2,819
DIXIE
Male 122 516 250 261 97 54 76 17 26 4 1,423 150 456 248 285 98 49 60 14 10 1 1,371
Female 58 663 240 100 79 87 210 52 45 6 1,540 110 637 240 96 95 72 191 32 21 3 1,497Total 180 1,179 490 361 176 141 286 69 71 10 2,963 260 1,093 488 381 193 121 251 46 31 4 2,868
CEU*
Male 283 321 142 107 79 108 215 34 16 2 1,307 274 335 148 105 74 101 290 82 16 0 1,425Female 388 362 126 76 100 114 194 25 42 1 1,428 270 411 128 81 91 119 181 22 16 2 1,321Unknown 2 4 1 1 2 1 1 2 9 (64) (41) 0 0 0 0 0 0 0 0 0 0 0
Total 673 687 269 184 181 223 410 61 67 (61) 2,694 544 746 276 186 165 220 471 104 32 2 2,746
UYCC
Male 165 868 689 1,522 832 331 303 37 15 2 4,764 157 971 812 1,616 878 334 341 46 14 4 5,173
Female 99 1,271 929 563 393 298 411 41 5 2 4,012 87 1,583 953 611 433 288 428 49 6 5 4,443Unknown 0 0 0 0 0 0 0 0 1 0 1 3 1 0 1 o o o 0 2 0 7
Total 264 2,139 1,618 2,085 1.225 629 714 78 21 4 8,777 247 2,555 1,765 2,228 1,311 622 769 95 22 9 9,623
SLCC
male 280 1,079 1,202 1,747 1,429 890 1,155 142 125 14 8,063 380 1,233 1,227 2,111 1,548 1,023 1,317 177 132 2 9,150Female 307 1,435 1,282 966 1,021 935 1,649 208 75 10 7,888 480 1,624 1,399 1,117 999 1,010 1,685 213 81 8 8,616Unknown 1 0 1 3 0 1 4 0 0 11 21 0 0 0 o o o 0 0 1 0 1
Total 588 2,514 2,485 2,716 2,450 1,826 2,808 350 200 35 15,972 860 2,857 2,626 3,228 2,547 2,033 3,002 390 214 10 17,767
SYSTEMWIDE
Male 1.556 7,516 6,962 12,586 9,552 4,443 4,891 508 609 55 48,678 1,396 7,646 6,698 13,827 10,168 4,505 5,097 616 473 82 50,508Female 1.758 10,693 8.758 6,523 5,147 3,866 7,248 963 638 98 45,692 1,731 11,587 8,984 7,383 5,287 3,991 7,448 1,036 515 116 48,078Unknown 23 36 13 37 65 31 39 7 15 207 473 19 25 31 70 82 40 58 7 8 230 570Total 3,337 18,245 15,734 19,146 14,765 8,340 12,179 1,478 1,268 360 94,852 3,146 19,258 15,714 21,281 15,539 8,536 12,603 1,659 996 431 99,163
*WSu and CEU Unduplicated beginning Fall 1991
4 5
71BEST COPY AVAILABLE

TABLE 4
UTAH SYSTEM OF HIGHER EDUCATION
4-Year History of Fall Quarter Headcount EnrollmentBy Class Standing and Residency
Institution
UNIVERSITY OF UTAH
Academic & General
Fall 1989
Res- Nonres-
ident ident Total
NR as %
Of Total
Fall 1990
Res- Nonres-
ident ident Total
NR as h
Of Total
Fall 1991
Res- Nonres-
ident ident Total
NR as 4
Of Total
Fall 1992
Res- Nonres-
ident ident Total
NR as %
Of Total
Lower Division 9,147 900 10,047 8.96% 9,236 1,343 10,579 12.69% 9,658 1,186 10,844 10.944 8,797 1,247 10,044 12.42%
Upper Division 9,491 519 10,010 5.18% 9,899 531 10,430 5.094 10,579 617 11,196 5.51% 11,323 669 11,992 5.58%
Graduate 3,227 1,148 4,375 26.24% 3.234 1,182 4,416 26.77% 3,412 1,185 4,597 25.78% 3,502 1,261 4,763 26.47%
Vocational/Technical 0 o o -- o 0 0 -- 0 0 0 -- o o o --
TOTAL 21,865 2,567 24,432 10.51% 22,369 3,056 25,425 12.02% 23,649 2,988 26,637 11.22% 23,622 3,177 26,799 11.85%
UTAH STATE UNIVERSITY
Academic & General
Lower Division 5,994 826 6,820 12.11% 6,251 1,054 7,305 14.43% 6,681 1,228 7,908 15.52% 6,812 1,141 7,953 14.35%
Upper Division 4,018 431 4,449 9.69% 4,556 446 5,002 8.92% 4,990 569 5,560 10.24% 5,291 605 5,896 10.26%
Graduate 2,134 778 2,912 26.724 2,292 797 3,089 25.80% 2,050 809 2,859 28.29% 2,274 797 3,071 25.95%
Vocational/Technical 167 13 180 7.22% 154 22 176 12.50% 185 19 204 9.18% 179 15 194 7.73%
TOTAL 12,313 2,048 14,361 14.26% 13,253 2,319 15,572 14.894 13,906 2,625 16,531 15.88% 14,556 2,558 17,114 14.95%
WEBER STATE UNIVERSITY
Academic & GeneralLower Division 5,743 309 6,052 5.11% 5,820 290 6,110 4.75% 6,085 368 6,453 5.70% 6,160 349 6,509 5.364
Upper Division 4,134 171 4,305 3.97% 4,237 160 4,397 3.64% 4,544 181 4,725 3.83% 4,949 225 5,174 4.35%
Graduate 138 2 140 1.43% 138 0 138 0.00% 122 2 124 1.61% 143 13 156 8.33%
Vocational/Technical 3,028 125 3,153 3.96% 3,197 196 3,393 5.78% 2,985 145 3,130 4.63% 2,984 170 3,154 5.39%
TOTAL 13,043 607 13,650 4.45% 13,392 646 14,038 4.60% 13,736 696 14,432 4.82% 14,236 757 14,993 5.05%
SOUTHERN UTAH UNIVERSITY
Academic & General
Lower Division 1,962 175 2,137 8.19% 2.218 197 2,415 8.16% 2,368 227 2,595 8.75% 2,482 286 2,768 10.33%
Upper Division 1,073 47 1,120 4.20% 1,273 38 1,311 2.90% 1,397 65 1,462 4.45% 1,355 70 1,425 4.91%
Graduate 18 0 18 0.00% 23 1 24 4.17% 18 0 18 0.00% 11 0 11 0.00%
Vocational/Technical 223 4 227 1.76% 249 4 253 1.58% 211 7 218 3.21% 221 9 230 3.91%
TOTAL 3,276 226 3,502 6.45% 3.763 240 4,003 6.00% 3,994 299 4,293 6.96% 4,069 365 4,434 8.23%
SNOW COLLEGE
Academic & General
Lower Division 1,133 223 1,356 16.45% 1,240 283 1,523 18.58% 1,947 306 2,253 13.58% 2,165 333 2,498 13.33%
Vocational/Technical 347 3! 378 8.20% 300 49 349 14.04% 268 32 300 10.67% 290 31 321 9.66%
TOTAL 1,480 254 1,734 14.65% 1,540 332 1,872 17.74% 2,215 338 2,553 13.244 2,455 364 2,819 12.91%
DIXIE COLLEGE
Academic & General
Lower Division 1,461 136 1,597 8.52% 1,651 124 1,775 6.99% 2,087 137 2,224 6.16% 1,743 135 1,878 7.18%
Vocational/Technical 742 42 784 5.36% 703 50 753 6.64% 691 48 739 6.504 919 71 990 7.18%
TOTAL 2,203 178 2,381 7.48% 2,354 174 2,528 6.884 2,778 185 2,963 6.244 2,662 206 2,868 7.18%
COLLEGE OF EASTERN UTAH
Academic & General
Lower Division 1,264 18 1,282 1.40% 1,707 69 1,776 3.89% 1,686 38 1,724 2.20% 1,547 55 1,602 3.43%
Vocational/Technical 1,040 19 1,059 1.79% 1,144 40 1,184 3.38% 947 23 970 2.39% 1,731 13 1,144 1.14%
TOTAL 2,304 37 2,341 1.58% 2,861 109 2,960 3.68%. 2,633 61 2,694 2.27% 2,678 68 2,746 2.48%
U VALLEY COMM COLLEGE
Academ,c & General
Lower Division 3,492 398 3,890 Vi.23% 3,946 567 4.513 12.56% 4,674 604 6,278 11.44% 5,442 754 6,196 12.174
vocational/Technical 3,626 242 3,868 6.26% 3,166 187 3,373 5.54% 3,314 185 3,499 5.294 3,010 417 3,427 12.17%
TOTAL 7,118 640 7,758 8.25% 7,132 754 7,886 9.56% 7,988 789 8,777 8.99% 8,452 1,171 9,623 12.17%
SALT LAKE COMM COLLEGE
Academic & General
Lower Division 3,808 45 3,853 1.17% 4,603 76 4,679 1.62% 6,258 118 6,376 1.85% 8,009 195 8,204 2.38%
Vocational/Technical 7,092 58 7,150 0.81% 8,425 240 8,665 2.774 9,381 215 9,596 2.24% 9,363 200 9,563 2.09%
TOTAL 10,900 103 11,003 0.944 13,028 316 13,344 2.374 15,639 333 15,972 2.08% 17,372 395 17,767 2.22%
SYSTEMWIDE
Academic & General
Lower Division 34,004 3,030 37,034 8.18% 36,672 4,003 40,675 9.84% 41,443 4,212 45,655 9.22% 43,157 4,495 47,652 9.43%
11pnar Division 18.716 1,168 19,884 5.87% 19,965 1,175 21,140 5.56% 21,511 1,432 22,943 6.244 22,918 1,569 24,487 6.41%
Graduate 5,517 1,928 7,445 25.90% 5,687 1,980 7,667 25.82% 5,602 1,996 7,598 26.27% 5,930 2,071 8,001 25.88%
Vocational/Technical 16,265 534 16,799 3.18% 17,358 788 18,146 4.34% 17,982 674 18,656 3.614 18,097 926 19,023 4.87%
TOTAL 74,502 6,660 81,162 8.21% 79,682 7,946 87.628 9.07% 86,538 8,314 94,852 8.77% 90,102 9,061 99,163 9.14%
UST COPY AVAIL ABLE
4 7

Institution
TABLE 5
UTAH SYSTEM OF HIGHER EDUCATION
4-Year History of Fall Quarter FTE Enrollment
By Class Standing and Residency
Fall 1989 Fall 1990 Fall 1991 Fall 1992
Res- Nonres- NR as % Res- Nonres- NR as 6 Res- Nonres_ NR as % Res- Nonres-
ident ident Total Of Total ident ident Total Of Total ident ident Total Of Total ident ident Total
UNIVERSITY OF UTAH
Academic & General
Lower Division 6,855 783 7,638 10.25% 6,919 1,136 8,055 14.10% 7,079 961 8,040 11.95% 6,640 1,029 7,669
Upper Division 7,251 444 7,695 5.77% 7,644 471 8,115 5.80% 8,136 543 8,679 6.26% 8,765 593 9,358
Graduate 2,762 906 3,668 24.70% 2,787 955 3,742 25.52% 2,892 964 3,856 25.00% 2,932 1,012 3,944
Vocational/Technical 0 0 0 0 0 0 0 0 0 0 0 0
TOTAL 15,868 2,133 19,001 11.23% 17,350 2,562 19,912 12.87% 18,107 2,468 20,575 12.00: 18,337 2,634 20,971
UTAh STATE UNIVERSITY
Academic & General
Lower Division 4,269 753 5,022 14.99% 4,577 954 5,531 17.25% 4,993 1,131 6,124 18.47% 5,128 1,075 6,203
Upper Division 3,413 388 3,801 10.21% 3,760 396 4,156 9.53% 4,220 515 4,735 10.88% 4,531 551 5,082
Graduate 1,044 578 1,622 35.64% 1,120 586 1,706 34.35% 1,130 596 1,726 34.53% 1,161 540 1,701
Vocational/Technical 106 10 116 8.62% 103 17 120 14.17% 131 16 147 10.88% 122 13 135
TOTAL 8,832 1,729 10,561 16.37% 9,560 1,953 11,513 16.96% 10,474 2,258 12,732 17.73% 10,942 2,179 13,121
WEBER STATE UNIVERSITY
Academic & GeneralOther Lower Division 4,036 284 4.320 6.57% 4,180 248 4,428 5 60% 4,438 318 4,756 6.69% 4,571 310 4,881
Upper 2,859 118 2,977 3.96% 3,008 124 3,132 3.96% 3,337 156 3,493 4.47% 3,698 187 3,885
Graduate 79 2 81 2.47% 86 0 86 0.00% 79 3 82 3.66% 106 10 116
vocational/Tecnnical 2,090 101 2,191 4.61% 2,202 179 2,381 7.52% 2,113 122 2,235 5.46% 2,109 137 2,246
TOTAL 9,064 505 9,569 5.28% 9,476 551 10,027 5.50% 9,967 599 10,566 5.67% 10,484 644 11,128
SOUTHERN UTAH UNIVERSITY
Academic & General
Lower Division 1,377 173 1,550 11.16% 1,543 192 1,735 11.07% 1,693 223 1,916 11.64% 1,868 271 2,139
Upper Division 1,078 37 1,115 3.32% 1,172 36 1,208 2.98% 1,316 62 1,378 4.50% 1,301 72 1,373
Graduate 15 0 15 0.00% 19 1 20 5.00% 19 0 19 0.00% 9 0 9
Vocational/Technical 209 4 213 1.88% 227 4 231 1.73% 196 6 202 2.97% 206 9 215
TOTAL 2,679 214 2,893 7.40% 2,961 233 3,194 7.29% 3,224 291 3,515 8.28% 3,384 352 3,736
SNOW COLLEGE
Academic & General
Lower Division 1,020 227 1,247 18.20% 1,133 300 1,433 20.94% 1,587 319 1,906 16.74% 1,776 359 2,135
Vocational/Technical 342 32 374 8.56% 314 51 365 13.97% 258 34 292 11.64% 285 32 317
TOTAL 1,362 259 1,621 15.98% 1,447 351 1,798 19.52% 1,845 353 2,198 16.06% 2,061 391 2,452
DIXIE COLLEGE
Academic & General
Lower Division 1,232 133 1,365 9.74% 1,387 124 1,511 8.21% 1,603 132 1,735 7.61% 1,482 140 1,622
vocational/Technical 645 41 686 5.98% 595 52 647 8.04% 613 50 663 7.54% 712 68 780
TOTAL 1.877 174 2,051 8.48% 1,982 176 2,158 8.16% 2,216 182 2,398 7.59% 2,194 208 2,402
COLLEGE OF EASTERN UTAH
Academ.c & General
Lower Division 835 21 856 2.45% 994 45 1,039 4.33% 1,118 45 1,163 3.87% 1,107 59 1,166
Vocational/Technical 659 10 669 1.49% 740 21 761 2.76% 655 15 670 2.24% 695 14 709
TOTAL 1,494 31 1,525 2.03% 1,734 66 1,800 3.67% 1,773 60 1,833 3.27% 1,802 73 1,875
UT VALLEY COMM COLLEGE
Academic & General
Lower Division 2,650 335 2,985 11.22% 2,576 434 3,010 14.42% 3,254 478 3,732 12.81% 3,679 588 4,267
vocaticnal/Technical 2.796 206 3,002 6.86% 2,068 147 2,215 6.64% 2,176 159 2,335 6.81% 2,000 319 2,319
TOTAL 5,446 541 5,987 9.04% 4,644 581 5,225 11.12% 5,430 637 6,067 10.50% 5,679 907 6,586
SALT LAKE COMM COLLEGE
Academic & General
Othee Lower Division 2,418 39 2,457 1.59% 2,945 64 3,009 2.13% 3,837 95 3,932 2.42% 4,853 142 4,995
Vocational/Technical 4,315 47 4,362 1.08% 4,800 109 4,909 2.22% 5,696 139 5,835 2.38% 5,815 143 5,958
TOTAL 6,733 86 6,819 1.26% 7,745 173 7,918 2.18% 9,533 234 9,767 2.40% 10,668 285 10,953
sysTEMWIDE
Academic & General
Other Lowe, Division 24,692 2,748 27.440 10.01% 26.254 3.497 29,751 11.75% 29,602 3,70? 33,304 11.12% 31,104 3,973 35,077
.;oper 14.601 987 15,588 6.33% 15,584 1,027 16,611 6.18% 17,009 1,276 18,285 6.98% 18,295 1,403 19,698
Beg. Grad 3,900 1,486 5,386 27.59% 4,012 1.542 5,554 27.76% 4,120 1,563 5,683 27.50% 4,208 1,562 5.770
vaational/Technical 11,162 451 11,613 3.88% 11.049 580 11.629 4.99% 11,838 541 12,379 4.37% 11,944 735 12,679
TOTAL 54,355 :.,672 60.027 9.45% 56,899 5,646 63.545 10.46% 62,569 7.082 69,651 10.17% 65 551 7,673 73,224
NR as % Ill
Of Total
13.42%
6.34%
25.66%
17.33%
10.84%
31.75%
9.63%
16.61%
6.35%
4.81%
8.62%
6.10%
5.79%
12.67%
5.24%
0.00%
4.19%
9.42%
16.81:
10.09%
15.95%
8.66%
8.66%
8.66%
III5.06%
1.97%
3.89%
13.77%
13.77%
13.77%
2.84%
2.40%
2.60%
11.33%
7.12%
27.07%
5.80%
10.44%
74
BEST COPY AVAILABLE
4 8

1
TABLE 6 (Page 1)
UTAH SYSTEM OF HIGHER EDUCATION4-Year History of Fall Quarter Headcount Enrollment
By Residency
County
RESIDENTS
UofU USU WSU SUU
Fall 1989
Snow Dixie CEU UVCC SLCC Total UofU USU WSU SUU
Fall 1990
Snow Dixie CEU UVCC SLCC Total
Box Elder 82 840 399 17 10 21 3 15 10 1,397 84 902 431 24 17 23 1 21 10 1,513Cache 131 5,022 121 12 22 23 4 21 9 5,365 133 5,589 126 12 20 13 3 16 17 5,929Daggett 3 17 7 2 o 1 o 3 1 34 2 17 5 2 0 o o 1 1 28Davis 1,720 802 4,155 49 5( 76 7 105 549 7,513 1,720 764 4,426 50 62 85 16 78 501 7,702Duchesne 37 402 16 10 15 20 25 66 11 602 34 410 29 14 12 17 14 56 7 593Morgan 8 68 179 4 3 14 1 4 2 283 9 40 176 1 2 7 0 6 1 242Rich 2 65 7 3 I o 0 2 0 80 2 66 5 4 3 0 0 1 1 82Salt Lake 13,699 1,809 1,149 300 349 279 48 292 9,847 27,772 13,987 1,981 1,036 333 372 228 97 286 12,039 30,359Summit 235 84 68 9 142 10 9 25 66 648 249 76 65 11 156 9 5 29 72 672Tooele 139 433 75 28 57 17 10 23 91 873 125 403 68 36 41 18 15 30 97 833Llintan 30 526 43 24 12 10 25 58 19 747 16 559 51 22 18 3 18 48 9 744Utah 864 521 308 128 181 138 108 5,245 145 7,638 1,023 648 364 157 182 106 59 5,142 129 7,810Wasatch 46 49 24 9 2 11 12 116 15 284 57 36 28 6 6 17 10 90 20 270Weber 593 689 5,711 18 28 60 7 25 39 7,170 568 678 5,838 17 26 49 4 28 53 7,261TOTAL NORTH 17,589 11,327 12,262 613 872 680 259 6,000 10,804 60,406 18,009 12,169 12,648 689 917 575 242 5,832 12,957 64,038
Beaver 9 13 14 120 4 6 3 23 6 198 8 13 16 79 3 5 0 18 7 149Carbon 96 173 19 33 4 1 1,100 20 9 1,455 101 173 25 32 1 3 1,164 22 9 1,530Emery 21 113 17 23 16 2 380 15 8 595 20 128 15 24 28 3 361 15 5 599Garfield 7 15 10 71 0 16 0 9 1 129 8 15 12 57 3 18 0 12 0 125Grand 32 99 11 18 9 3 31 4 1 271 31 119 10 18 7 7 64 8 3 267Iron 53 93 22 1,569 3 38 2 8 5 1,793 52 75 40 1,372 1 28 2 9 3 1,582Juab 13 31 14 26 16 0 5 45 3 153 14 28 8 23 21 2 1 51 4 152Kane a 8 4 82 0 13 0 13 1 129 6 13 1 84 2 15 0 28 5 154Millard 34 66 24 85 88 16 3 61 12 389 34 82 29 121 81 26 4 73 3 453Piute 2 6 1 20 16 0 0 5 1 51 1 7 0 20 14 4 o 8 1 55San Juan 27 38 36 40 29 18 280 46 11 525 26 37 32 49 25 15 458 35 14 691Sanpete 54 121 32 38 399 7 19 40 5 715 49 136 32 48 396 9 22 44 3 739Sevier 33 84 28 168 5 17 7 53 8 403 34 86 18 162 8 23 12 49 5 397Washington 118 110 94 413 4 1,358 3 47 6 2,153 112 150 139 410 9 1,565 6 33 5 2,429Wayne 2 15 9 23 9 I 1 23 3 86 6 22 8 28 22 3 1 17 1 108TOTAL SOUTH 509 985 335 2,729 602 1,496 1,897 412 80 9,045 502 1,084 385 2,527 621 1,726 2,095 422 68 9,430
NAT AMERICANS 0 0 6 37 4 I 127 o 0 175 0 0 8 37 2 6 226 0 0 279OTHER 8 3.767 0 440 0 2 26 21 706 16 4,978 3,858 0 351 510 0 47 288 878 3 5,935
TOTAL RES 21,865 12,312 13,043 3,276 1,480 2,203 2,304 7,118 10,900 74,501 22,369 13,253 13,392 3,763 1,540 2,354 2,851 7,132 13,028 79,682
NONRESIDENTS
Other U.S. 1,540 1,076 400 237 89 154 36 512 57 4,101 1,972 1,292 391 222 117 133 81 624 125 4,957Foreign 1,027 973 207 13 165 24 1 128 46 2,584 1,084 1,027 255 18 215 41 28 130 191 2,989
TOTAL NONRES 2,567 2,049 607 226 254 178 37 640 103 6,661 3,056 2,319 646 240 332 174 109 754 316 7,946
TOTAL ENR 24,432 14,361 13,650 3,502 1,734 2,381 2,341 7,758 11,003 81,162 25,425 15,572 14,038 4,003 1,872 2,528 2,960 7,886 13,344 87,628
' Native American students who are classified as residents for tuition assessment according to state law, but do not have Utah as their state residence.fi Includes Undetermined, Military, Job Corps. For UofU includes Off-Campus.
4 9
7 5Hrt;T COPY AVAIL AB( E

TABLE 6 (Page 2)UTAH SYSTEM OF HIGHER EUCATION
4-Year History of Fall Quarter Headcount Enrollment
By Residency
County
RESIDENTS
UofU USU WSU SUU
Fall 1991
Snow Dixie CEU UVCC SLCC Total UofU USW WSU SUU
Fall 1992
Snow Dixie CEU UVCC SLCC Total
Box Elder 79 955 450 13 15 26 6 23 11 1,578 106 946 394 22 21 19 6 21 14 1,551
Cache 128 5,652 172 17 33 11 13 13 28 6,067 142 6,090 149 26 44 13 6 24 23 6,517
Daggett 2 30 8 6 0 0 0 2 1 49 1 21 7 2 0 0 1 2 1 35
Davis 1,827 967 4,474 71 63 65 23 87 633 8,211 1,858 1,001 4,916 88 98 57 27 101 1,053 9,199
Duchesne 32 453 34 13 19 14 12 22 11 665 32 468 26 8 27 5 13 69 10 658
Morgan 14 46 169 2 1 4 2 4 5 248 12 44 200 4 7 3 0 3 7 280
Rich 1 62 7 3 2 3 0 1 1 80 3 66 11 2 0 2 1 1 0 86
Salt Lake 14,423 2,024 1,014 368 419 265 148 464 14,352 33,476 14,083 2,134 1,113 384 478 211 135 397 15,321 34,256
Summit 275 61 64 24 16 8 5 27 113 593 280 64 71 21 18 16 1 24 134 629
Tooele 117 382 72 58 35 13 19 22 157 875 109 394 63 39 49 16 9 33 208 920
Uintah 33 674 60 18 19 2 28 51 12 897 26 623 54 14 21 3 16 62 14 833
Utah 1,241 769 407 217 186 116 76 5,623 167 8,803 1,346 836 485 186 232 107 95 5,843 283 9,413
Wasatch 53 38 21 16 34 13 13 104 22 314 50 38 21 9 30 19 8 112 35 322
weber 571 678 6,147 24 IL 42 13 21 44 7,550 526 669 6,062 16 17 43 5 27 159 7,524
TOTAL NORTH 18,796 12,791 13,10., 860 852 582 363 6,514 15,557 69,405 18,576 13,394 13,572 821 1,042 514 323 6,719 17,262 72,223
Beaver 8 22 10 139 1 7 2 15 0 204 6 18 12 101 2 7 1 8 6 161
Carbon 90 138 23 37 4 5 1,023 15 18 1,353 85 162 31 22 4 3 1,197 6 12 1,522
Emery 19 67 15 27 40 6 428 14 6 622 23 83 13 18 39 7 459 15 8 665
Garfield 4 10 10 71 3 12 1 7 2 120 4 10 13 82 7 13 0 8 2 139
Grand 29 146 9 18 12 6 81 12 2 315 28 126 12 21 7 2 86 6 3 291
Iron 50 93 33 1,676 3 35 11 6 2 1,909 57 88 43 1,609 2 26 8 15 2 1,850
Juab 17 24 10 19 46 7 4 51 2 180 17 20 12 14 62 1 1 59 3 189
Kane 9 17 2 86 3 18 1 21 3 160 9 18 7 105 5 19 2 19 3 187
Millard 28 84 26 158 207 27 8 613 5 611 31 96 21 155 238 20 8 85 8 662
Piute 2 7 0 27 12 5 J 5 1 59 2 13 0 34 9 1 0 3 1 63
San Juan 18 54 60 53 19 13 391 53 17 678 16 52 44 4F 19 5 379 30 14 605
Sanoete 58 174 47 49 696 11 17 33 7 1,092 51 194 51 57 665 6 6 49 6 1,085
Sevier 34 100 21 202 289 13 14 55 8 736 36 97 21 150 328 13 4 60 10 719
Washington 132 155 95 438 19 1,971 8 21 5 2,843 153 152 100 415 17 1,891 5 35 19 2,787
Wayne 5 26 7 35 9 3 2 12 4 103 5 33 6 32 5 4 3 13
TOTAL SOUTH 503 1,115 368 3,035 1,363 2,139 1,989 388 82 10,981 523 1,162 386 2,861 1,409 2,018 2,159 411 102 11,031
NAT AMERICANS 0 0 5 0 0 19 181 0 0 205 0 0 2 3 0 16 68 0 0 89
OTHER @ 4,350 0 264 109 0 38 97 1,086 0 5,945 4,523 0 276 384 4 114 128 1,322 8 6,759
TOTAL RES 23,649 13.906 13,73f. 3,994 2,215 2,778 2,631 7,988 15,639 86,536 23,622 14,556 14,236 4,069 2,455 2,662 2,678 8,452 17,372 90,102
NONRESIDENTS
O,ne^ U.S. 1,844 1,499 401 278 135 137 36 670 199 5,199 1,907 1,558 461 341 151 166 42 900 196 5,722
Foreign 1,144 1,126 295 21 203 48 27 119 134 3,117 1,270 1,000 296 24 213 40 26 271 199 3,339
TOTAL NONRES 2,988 2,625 696 299 338 185 63 789 333 8,316 3,177 2,558 757 365 364 206 68 1,171 395 9,061
TOTAL ENR 26,637 16,531 14,432 4,293 2,553 2,963 2,694 8,777 15,972 94,853 26,799 17,114 14,993 4,434 2,819 2,868 2,746 9,623 17,767 99,163
50

TABLE 7
UTAH SYSTEM OF HIGHER EDUCATION
5-Year History of Academic-General and Vocational-TechnicalFall Quarter Headcount
Institutions
University of Utah
Course/Level
a. Undergraduate
b. GraduateC. Voc/Tech
d. Total
Utah State University a. Undergraduate
b. Graduate
c. Voc/Tech
d. Total
weber State University* a. Undergraduate
b. Graduate
C. hoc/Tech
d. Total
Southern Utah University a. Undergraduate
b. Graduate
c. Voc/Tech
d. Total
Snow College a. Undergraduate
5. Voc/Tech
c. Total
Dixie College a. Undergraduate
b. hoc/Tech
c. Total
College of Eastern Utah* a. Undergraduate
b. Voc/Tech
c. Total
Utan valley Comm. College a. undergraduate
b. Voc/TechC. Tctal
Salt Lake Comm. College a. undergraduate
b. Voc/Tech
c. Total
Systemwide a. Undergraduate
b. Graduate
c. Voc/Tech
O. Total
WSU and CEU Unduplicated beginning in 1991-92.
**Distribution based on end-of-term report.
'92 Diff 92 % Diff
1988-89 1989-90 1990-91 1991-92 1992-93 From '91 From '91
19,772 20,057 21,009 22,040 22,036 (4) -0.02%
4,274 4,375 4,416 4,597 4,763 166 3.61%
0 0 0 0 0 0 0.00%
24,046 24,432 25,425 26,637 26,799 162 0.61%
10,892 11,269 12,307 13,468 13,849 381 2.83%
3,187 2,912 3,089 2,859 3,071 212 7.41%
157 180 176 204 194 (10) -4.87%
14,236 14,361 15,572 16.531 17,114 583 3.53%
9,565 10,357 10,508 11,178 11,683 505 4.52%
150 140 137 124 156 32 25.81%
3,015 3,153 3,393 3,130 3,154 24 0.77h
12,730 13,650 14,038 14,432 14,993 561 3.89%
2,715 3,257 3,726 4,057 4,193 136 3.35%
9 18 24 18 11 (7) -38.89%
228 227 253 218 230 12 5.50%
2,952 3,502 4,003 4,293 4,434 141 3.28%
1,303 1,356 1,523 2,253 2,498 245 10.87%
241 378 349 300 321 21 7.00%
1,544 1,734 1,872 2,553 2,819 266 10.42%
1,511 1,597 1,775 2,224 1,878 ** (346) -15.57h
717 784 753 739 990 ** 251 34.00%
2.228 2,381 2,528 2,963 2,868 (95) -3.21%
1,142 1,282 1,776 1,724 1,602 (122) -7.08%
921 1,059 1,184 970 1,144 174 17.94%
2.063 2,341 2,960 2,694 2,746 52 1.93%
3,166 3,890 4,513 5,278 6,196 918 17.39%
3.667 3,868 3,373 3,499 3,427 (72) -2.06%
6,833 7.758 7,886 8,777 9,623 846 9.64%
2.943 3,853 4,679 6,376 8,204 1,828 28.67%
6,424 7,150 8,665 9,596 9,563 (33) -0.34%
9,367 11,003 13,344 15,972 17,767 1,795 11 24%
53,009 56,918 61,816 68,598 72,139 3,541 5.16%
7,620 7,445 7,666 7,598 8,001 403 5.30%
15,370 16,799 18,146 18,656 19,023 367 1.97%
75,999 81,162 87,628 94,852 99,163 4,311 4.54%

D.VocaUonal
Education
TABDVOCATIONAL EDUCATION
SUPPORT & MONITORING OF APPLIED TECHNOLOGY EDUCATION . 1
TABLE 1 Annual Non-credit Headcount 1
TABLE 2 Fall Quarter/Semester Applied Technology Education FTE's 2
TABLE 3 Fall Quarter/Semester Applied Technology Education Headcount 2
TABLE 4 1991-92 Vocational Concurrent Enrollment-Headcount 4
TABLE 5 1991-92 Maintenance of Effort Target & Actual Expenditures 4
ADDITIONAL MAJOR EFFORTS IN APPLIED TECHNOLOGYEDUCATION 5
COMPANIES PARTICIPATING IN CUSTOMIZED TRAINING 8

I
I1
I
II
I
I
I
II
II
I
I
I
II
I
SUPPORT AND MONITORING OF APPLIED TECHNOLOGY EDUCATION--1991-92 REPORT
Enrollment
Noncredit Enrollments
Again this year, tailoring programs specifically (customizing) to meetbusiness and industry needs enjoyed the greatest growth. As Table 1 belowillustrates, noncredit training programs increased by over 2500 enrollments, toreach a new total of 32,650 enrollments (an 8.5% increase over the previousyear), and represents 937 programs with training lengths varying from 1/2 weekto 26 1/2 weeks. While this is a significant increase, it is slower than theprevious year's growth. A couple of factors may contribute to this slow-down.One certainly is the economy; the state's job market did not grow as fast thispast year as the previous year. Secondly, the state appropriated monies forcustom fit training and STIT training were quickly utilized in the first five orsix months of the training year, and brakes had to be applied to both systems inorder to stay within budget constraints. The shortage of funds will be magnifiednext year as most of the surpluses carried forward in previous years will havebeen expended. There is no projected funding increase in the STIT area. Thereis, however, an increase requested for Custom Fit funds for 1993-94.
At the end of this report is a listing of over 350 companies that eitherparticipated directly with this customized noncredit training system or hiredrecipients of that training. It is of note that much of this training is self-funded, paid for either by tuition or by the business/industry desiring thetraining.
Noncredit customized training will continue to be a substantial growth areain the future, particularly if job markets continue to increase and/or a
significant need for retraining exists.
Table 1
Annual Noncredit Enrollments - Headcount
Institution 1988-89 1989-90 1990-91 1991-92
WSU 3,205 2,421 4,526 3,549
SUU 152 389 379 523
SNOW 234 257 234 388
DIXIE 300 515 988 1,180
CEU 819 2,387 1,096 1,336
UVCC 8,682 11,204 14,578 15,089
SLCC* 5,036 5,006 8,298 10,585
System Total 18,428 22,179 30,099 32,650(8.5% Increase)
* nc u es Skills Center.
1 bi

Credit Enrollments
Enrollment in credit programs increased again this past year. This is thefifth straight year of growth in credit-offering applied technology educationprograms in higher education. However, this year's Fall Quarter growth in
headcount is less that 2 percent, while the average growth rate over the lastfive years has been 4.7 percent. This is compared to a 19.3 percent averageincrease over the past four. years in noncredit enrollments. While it is
difficult to compare the noncredit enrollments with an unduplicated Fall Quartercredit headcount, it would be safe to say that there are more studentsparticipating in the noncredit customized kinds of training in the system ofhigher education than there are students participating in the credit trainingprograms.
Table 2
Fall Quarter/Semester Applied Technology Education FTE's
Institution 1988-89 1989-90 1990-91 1991-92 1992-93
USU 116 116 120 147 135
WSU 2,105 2,191 2,381 2,235 2,246
SUU 210 213 231 202 215
SNOW 249 374 365 292 317
DIXIE 608 686 647 663 780
CEU 554 669 761 670 708
UVCC 2,910 3,002 2,215 2,335 2,319
SLCC 3,979 4,362 4,910 5,835 5,958
System Total 10,731 11,613 11,630 12,379 12,678(+2.4%)
Table 3
Fall Quarter/Semester Applied
1989-90
Technology Education
1990-91
Headcount
1991-92 1992-93Institution 1988-89
USU 157 180 176 204 194
WSU 3,015 3,153 3,393 3,338 3,154
SUU 228 227 253 218 230
SNOW 241 378 349 300 321
DIXIE 717 784 753 739 990
CEU 921 1,059 1,184 996 1,144
UVCC 3,667 3,868 3,373 3,499 3,427
SLCC 6,424 7,150 8,665 9,596 9,563
System Total 15,370 16,799 18,146 18,890 19,023(+199)
2
1

This five-year growth in credit enrollments and FTE has taken place throughoutall of the eight institutions involved in applied technology education with theexception of Utah Valley Community College which has reported a 6.5 percentdecline in headcount and'a 20 percent decline in FTEs over that same five-yearperiod. At first, it appeared that the semester calendar change had created adramatic decrease in the Fall Quarter/Semester enrollment and that it wouldbounce back. UVCC did stabilize and begin to grow last fall; however, creditenrollments for Fall Semester remained approximately static this year. It isinteresting to note that on an annualized academic year basis UVCC's vocationalFTE declined 4.6 percent over the five-year period (1987-92), but has actuallyhad a 9 percent increase during the last two years (1989-92) of that five-yearperiod.
The slow-down in the credit enrollment growth this past year is probablymore impacted by the attitude of students than the noncredit system. Generally,in noncredit training, the student is interested in a specific area or it issomehow tied to his/her job, and there are direct links between the needs of theprogram and students. Whereas, in credit training programs, the reward or jobplacement is much further away, sometimes extending out to two years.Consequently, students are making a much longer commitment for training.Additionally, the link to a specific job in that training becomes more ambiguous.And there is still the prevailing attitude that in order to get ahead you musthave a baccalaureate degree. So, while more money is being spent to supportapplied technology education in the system (see maintenance of effort reportbelow), the growth in the credit enrollments is very gradual.
There are openings in most of the vocational programs in the state, and theenrollment crunch that higher education is suffering throughout the system, isnot as evident in applied technology education credit program. In fact, therehave been several new credit applied technology programs started this year. All
of the institutions have agreed that even though enrollment limitations are inplace at each institution, if vocational students express an interest, and thereare vacancies in that program, they will work to admit them.
To the best of our knowledge, no vocational students were turned awaybecause of the increased entrance requirements placed on the various institutionsthis past year. There were, however, approximately 30 students who missed theregistration deadline at Weber State University who were interested in appliedtechnology education. To our knowledge, these 30 students reflect approximately20 percent of the number of students who found themselves in this category at WSUand every effort was made to make sure that they were able to either enroll incontinuing education or in the class this coming quarter. All other institutionsreported that no students desiring to enter applied technology education wereknowingly turned away.
If we are desirous of maximizing our physical facilities and instructionalcapabilities in vocational-technical education, major efforts need to beundertaken to help the public understand the job and career opportunitiesavailable to them in other thaa baccalaureate-level programs.

Concurrent Enrollment
A new area included in this year's report is vocational concurrent
enrollment. While these are credit-producing students, they are high schoolstudents enrolled in college-level programs, receiving college credit. Quite
often we think of concurrent enrollment only taking place in the area of generaleducation; however, as the report indicates, 4813 high school enrollments werein concurrent programs directly associated with applied technology education atUSHE colleges and universities.
Table 41991-92 Vocational concurrent Enrollment-Headcount
1991-92 Vocational Concurrent Enrollment-Headcount
USU WSU SUU SNOW DIXIE CEU UVCC SLCC TOTAL
0 1,778 31 0 0 0 1,330 1,674 4,813
Maintenance of Effort
In April of 1989, the Regents adopted a policy for support and maintenanceof applied technology. The policy is an affirmation to the Legislature and theapplied technology community of higher education's commitment to applied technol-ogy education, and evolved through a series of discussions by the Commissioner
and staff with the Funding Mechanism Task Force, Chief Academic Officers, BudgetOfficers, and the Council of Presidents.
The Regents developed specific target levels based on agreed-upon formulasto track applied technology education efforts and automatically adjust each yearas new monies are distributed. Again this year, the system exceeded the targeted
amounts by some $3.9 million, which indicates the major efforts the institutionsare expending to improve applied technology education in the State of Utah. The
report also specifically identifies other areas in which the institutions arepromoting applied technology education, which may or may not involve expenditure
of funds.
Table 5
1991-92 Maintenance of Effort Target and Actual Expenditures
Institution jarget Actual
1,013,013USU 735,876
WSU 7,220,584 7,736,212
SUU 1,293,971 1,775,154
SNOW 1,057,809 1,102,611
DIXIE 1,234,481 1,459,417
CEU 1,406,179 1,711,337
UVCC 6,956,038 7,026,809
SLCC 11,487,983 13,467,555
SYSTEM TOTAL 31,392,912 35,292,108
4 b4
1
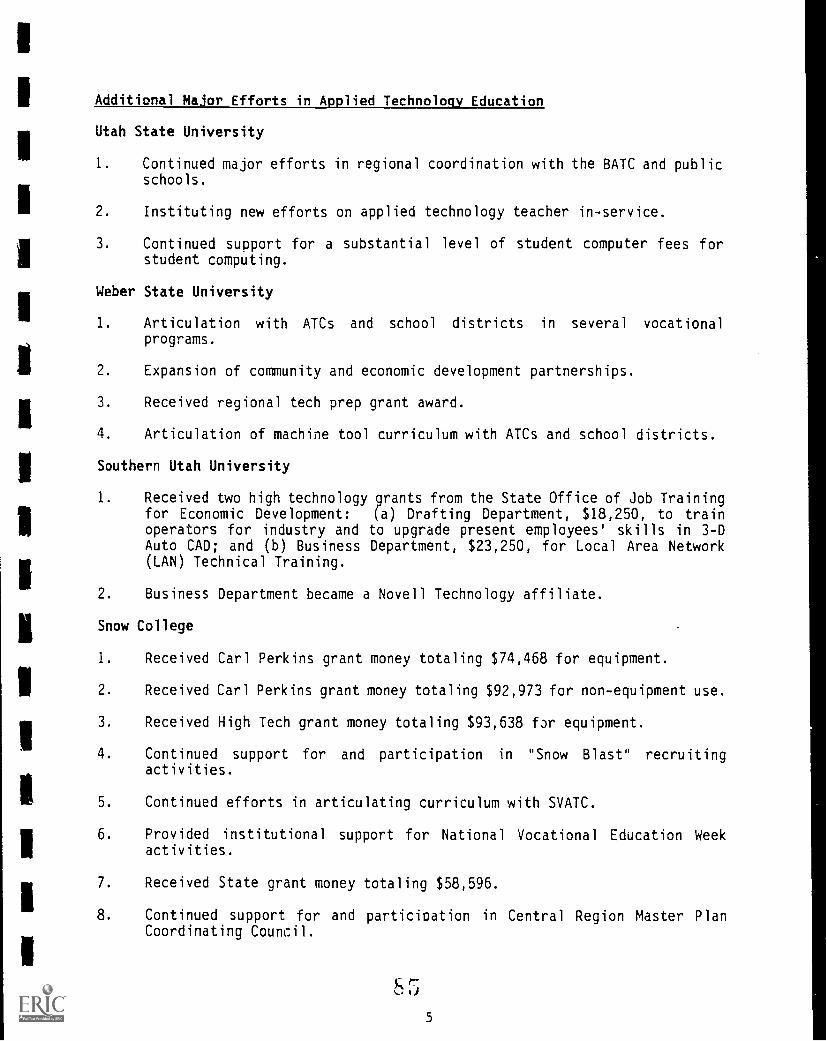
Additional Major Efforts in Applied Technology Education
Utah State University
1. Continued major efforts in regional coordination with the BATC and publicschools.
2. Instituting new efforts on applied technology teacher in-service.
3. Continued support for a substantial level of student computer fees forstudent computing.
Weber State University
1. Articulation with ATCs and school districts in several vocationalprograms.
2. Expansion of community and economic development partnerships.
3. Received regional tech prep grant award.
4. Articulation of machine tool curriculum with ATCs and school districts.
Southern Utah University
1. Received two high technology grants from the State Office of Job Trainingfor Economic Development: (a) Drafting Department, $18,250, to trainoperators for industry and to upgrade present employees' skills in 3-DAuto CAD; and (b) Business Department, $23,250, for Local Area Network(LAN) Technical Training.
2. Business Department became a Novell Technology affiliate.
Snow College
1. Received Carl Perkins grant money totaling $74,468 for equipment.
2. Received Carl Perkins grant money totaling $92,973 for non-equipment use.
3. Received High Tech grant money totaling $93,638 for equipment.
4. Continued support for and participation in "Snow Blast" recruitingactivities.
5. Continued efforts in articulating curriculum with SVATC.
6. Provided institutional support for National Vocational Education Weekactivities.
7. Received State grant money totaling $58,596.
8. Continued support for and participation in Central Region Master PlanCoordinating Council.
S:s1/4, 0
5

9. Provided institutional support and financial backing for Home BuildingConstruction project and scholarships.
10. Provided Vocational scholarships.
11. Received JOBS funding totaling $9,024.
Dixie College
1. Purchased equipment for business labs, drafting lab, and graphic arts lab.
2. Hired a full-time instructor for ASE Automotive Electronics.
3. Encouraged vocational program instructors to be aware of additionalfunding that is available to support vocational training.
College of Eastern Utah
1. Satisfactorily completed the institutional self-study process andreaccreditation by the Northwest Association of Schools and Colleges.
2. Federal Title III grant provided faculty course development projects forbusiness, diesel, nursing, electronics and welding faculty members.
3. State-of-the-art diesel testing equipment was purchased and installed inthe diesel shop.
4. An additional clinical training area where students can be videotaped ina clinical setting for training and assessment was developed by theNursing Department.
5. Vocational articulation agreements allowing a seamless transition forvocational students from high school through college between CEU, Carbonand Emery School Districts were signed.
Utah Valley Comunity College
1. Continued implementation of recommendations from vocational accreditation.
2. Institutional Advisory Committee was strengthened and interface with craftadvisory committees and A-TECC has improved.
3. Established a learning assistance lab (an extension of the LEC) the TradesBuilding to serve students.
4. Enhanced services to special population applied technology students.
5. Additional short-term training programs were added to the MATC.
6. Experienced significant growth in business and industry outreach.
7. Curriculum Committee finalized and approved curriculum for the BuildingInspection Program.
S 6
6

8. Submitted a request for designation of an expanded Center forEnvironmental Studies.
9. On-campus Fire Science Degree Program experienced significant growth andexpansion.
10. Initial development of Technology Management B.S. Degree.
Salt Lake Community College
1. Ties with Utah State Economic development Office, local schools, industry,the Wasatch Front South Vocational Regional Planning Committee, Salt LakeCommunity College Advisory Council, vocational directors, etc. werestrengthened through improved communications, marketing, involvement, etc.
2. Efforts made to communicate with high school students resulted inapproximately 20,000 personal telephone contacts from SLCC regardingApplied Technology Center program opp)rt6nities.
3. High school faculty and administrative representation from the WasatchFront South Region was enhanced to strengthen the regional advisorycommittee function of SLCC Advisory Committees.
4. Expenditures for equipment a'most doubled from 1991-90 to 1992-93. Theseexpenditures we:e a result of institutional priorities and had a
significant effect on the direct cost per FTE.
5. Seven vocational faculty were hired into new positions in support of newand existing programs.
6. Replacement position dollars were increased to accommodate higher levelcredentials of replacement faculty.
7. Outdated computers were replaced.
8. Partnerships with Utah State Prison officials were greatly improved.
9. Tech-Prep and Two plus Two projects were piloted. An Academy ofTechnology was begun.
Future Areas of Emphasis
1. Expand apprentice-type training with the secondary school system.
2. Expand Tech-Prep training with the secondary school system.
3. Continue coordination at both state and local levels.
4. Increase marketing of the opportunities in applied technology education
5. Increase business involvement in curriculum, placement and in-service.
6. Continue support of customized noncredit training.
7. Replace outdated equipment.
COMPANIES PARTICIPATING INCUSTOMIZED TRAINING
101 Rancho3 Day BlindsA-Plus BenefitsAbbacom, IncAbout Face SalonAcademyAdvance Service AutoAeorTransAgronauticsAir Cont TransportAll Makes Off SystemAllen CommAlpine HealthAlta HealthAmerican GeneralAmerican Stores Prop. Inc.American AziteAmerican GraphicsApplied Manufactoring TechAptusArrowhead DentalAspen DistributionAtkinsonAuto Trim DesignAutomated Building CorpAutomated ArchivesAutoMeter ProductsAvanceAvtechB C RecyclingBanksBase Two DevelopmentBeaver Dam LodgeBeckon DickinsonBen Franklin Day PlannerBeneficial InternationalBenson Bolt CoBig 0 TiresBlankenship & BartonConstructionBLMBP ExcavatingBracket Plastery & StuccoBranding Iron RestaurantBrian Head HotelBryce Way Motel Restaurant
3
Bull CinchBulloch BrothersBulloch Brothers EngineeringButtrey Food & DrugBYU P.D.Cacique Inc.Callies and AssociatesCarol Sapp BookkeepingCaselle, Inc.Cedar High SchoolCedar City CorporationCentury 21Challenge MachineChapter 11ChromoloxCities and CountiesCitywide ComputersColdwell Banker PremierColor Country Dental LabComp HealthComputer AssistantsConstant PrecisionCox TransportCozzen's CabinetsCrusty's Restaurant/BakeryCUCFCurateck Laboratories Inc.Daco Enterprise IncDaw TechnologiesDefense Depot OgdenDepartment of Public SafetyDesert Bloom WholesaleDesign VinylDGA ComputersDigital TechnologyDiscover CardDixie Component SystemDMG ManagementDoctors/MerchDoug's PlaceDr. AlbrechtDr. Allen HiltonDriftwood LodgeDuck InnEagles LodgeEast Signs

Easton AluminumEimcoEmployee LeasingManagementEntre Inc.EnvirosearchEphraim City CorporationERA RealtyEWP EngineeringFabri-neticsFamily Nurturing CenterFamily Dvlpmnt Rsrc, Inc.FastsignsFields SoftwareFife BuildingFire DepartmentsFlanigan's InnFleming FoodsFlying M CafeFoundation SystemsFourMatFowler CompanyFrehner-Larkin, Inc.G.W. Johansen ConstructionGibson Dental LaboratoryGlenwood MillGlobal IntegratedGlobal CoatingsGM Larsen Design GroupGMAC Captial CorpGoer ManufacturingGreat BeginningsGreen Valley CabinetsGull LaboratoriesGunnison City CorporationGWI/Redwood AssnHager AlignmentHales-AllenHalotronHammond ComputerHands ElectricHerculesHeritage Home FurnishingsHermansen's MillHi Tech CareerHigh-Tech of UtahHill Air Force BaseHoskins ConstructionHospitalsHuish ChemicalIndustrial Gasket
9
InsurQuoteIntrmountain Aerial SurveyIntermountain ElectronicsInternational Voice 4INX/SpectrumIOMED IncIron County School DistJ & J BuildersJapanese AutoJHCH ArchitectsJob ServiceJolley's RanchwearJones PaintJTP/AirspaceK-TECKanab Custom MeatsKay EnterprisesKids Can SewLaidlaw ConstructionLifetime ProductsLightspeed DealerLindharot RefrigLogs UnlimitedLongview FibreLowry OverheadLucas WesternLynn Wilson FoodsMaca SupplyMacrotech/PolysealMajectic Mountain RealtyManagement PlusMarriottMartin DoorsMastercraft HomesMastertechMatco MfgMatol
McArthur JewelersMcDonnell DouglasMed One FinancialMerit MedicalMetalcraft Tech, Inc.MidState ConsultingMom's FabricsMorton InternationalMotel 6Mountainwest FinancialMoxtekNational Semi ConductorNational Medi-VansNational Microcomputers

Nature's SunshineNewby-Holt OilNordstromN Summit School DistrictN Sanpete School DistrictNuskinOrem City P.D.Orton ExcavatingOsborn Sewing SpecPacific LinenPanachrom CorpPanguitch Lake ResortPaper CalmesonParke Cox TruckingPaula's RestaurantPeriheral SystemsPermanent SolutionPersonal ImpressionsPeterson Plumbing SupplyPhillips 66 CorporationPhoenix MutualPicture ItPine View Middle SchoolPines RestaurantPink CliffsPiper ImpactPitt-Des Moines Steel Inc.Platt and Plant EngnrPleasant Grove P.D.Porter's Nursing HomePOST Training/Agency PoliceOfficers*Pre Press ServicesPrime MachinePro Tech BlindcleanPro Data SystemsProgressive ComputerProgressive PlantsProperty ConnectionProvo City P.D.Pura, Inc.
Quail Lake Stop ShopRAM CompanyRed Rock PediatricksReliable TTL/ESCRWRemed Tech CrpResort Center LodgeRetail StoresRockwell InternationalRockwell International
10
Rocky Mountain HelicopterRuby's InnS & S Steel FabSaddle Seat CoversSafeliteSalesest MarketingSanpete Valley RealtySavage ManufacturingSherwin WilliamsShoney'sShopkoSignature SignsSigneticsSkyline MineSorenson TowingS Summitt School DistrictS Sanpete School DistrictSouthern Utah UniversitySouthwest PlumbingSpire TechnologiesSpringdale Fruit CompanySpringville City P.D.St. George CityStandard CommunicationState of UtahStatz EntertainmentStouffer Foods CorpStrataSummit CountySunbelt MarketingSunnyside MineSunset RailSutoconSystems ConnectionT R WTel ElectronicsTennecoTesco WilliamsenTGI Friday'sThe Edge RestaurantThe Praxis GroupThera-TechTheratech CorpThiokolTierra DevelopmentTimpanogas MetalsTMW ManagementTNT EngineeringTomax TechTooele DepotTourism Business
4°)'

Toys R UsTrade West ConstructionTraffic Mntrng TechTrails West TruckingTravelersTri-Corp Health CareTriteck CorporationTW Services - Bryce CanyonTW Service - Zion's CanyonU.S. SyntheticUltradent ProductsUMAUnishipper AssnUnisysUnited Parcel ServicesUniversal Campus Credit UnionUppercrust CafeUS Soil ConservationUS Forest ServiceUSPCIUtah ScientificUtah State Tax CommissionUtah Peer ReviewUtah Tool & DieUtah Power and LightUtah Dept of TransportnUtah County SheriffUtah Dept of Public SafetyUtah Pacifc Bridge & SteelUtah Power and LightValcom ComputerVarian Power GridVarianViewpoint AnimationVocational Rehabilitation*W.R. WhiteWal-MartWashington County WaterConservatoryWashington Cnty Schl DistWatson EngineeringWeccoWEPCOWestern Roch ProductsWestern WatsWestern ChasisWestern WattsWestern FoodWestern Food ProcessingWhitewater Whirlpool Tubs &Systems Inc.
11
Williams-SonomaWordPerfect PublishingXecoZinc SoftwareZion PlumbingZions Health Care Complex

E. T
uitio
n an
d F
ees
(1 ,3

TAB ETUITION & FEES
Tables 1 through 4 represent Undergraduate Full-Time Student Tuitionand Fees per Academic Year for the institution or institutions listed and
their Peer Comparison Groups including Resident and NonResident Rates
TABLE 1 University of Utah 1
TABLE 2 Utah State University 2
TABLE 3 Weber State University and Southern Utah University 3
TABLE 4 Two-Year Colleges 4
FIGURE 1 1992-93 Undergraduate Resident Tuition & Fee Levelsas a Percent of Peer Group Averages 5
TABLE 5 USHE 1992-93 Tuition by Quarter Credit Hour Load for ResidentUndergraduate Students 6
TABLE 6 USHE 1992-93 Tuition & Fees by Quarter Credit Hour Loadfor Resident Undergraduate Students 6
Figures 2 and 3 represent USHE Four Year InstitutionsFigures 4 and 5 represent USHE Two Year Institutions
FIGURE 2 USHE 1992-93 Tuition by Credit Load for ResidentUndergraduate Students 7
FIGURE 3 USHE 1992-93 Tuition & Fees by Credit Load for ResidentUndergraduate Students 7
FIGURE 4 USHE 1992-93 Tuition by Credit Load for ResidentUndergraduate Students 8
FIGURE 5 USHE 1992-93 Tuition & Fees by Credit Load for ResidentUndergraduate Students 8
TABLE 7 USHE Summary of Undergraduate Tuition & Fees 9
9 4
L TAB ETUITION & FEES
Continued- 1
Figures 6 and 7 represent USHE Four Year institutionsFigures 8 and 9 represent USHE Two Year institutions
FIGURE 6 Tuition & Fees History for Resident Undergraduate Students . 11
FIGURE 7 Tuition & Fees in constant dollars for Resident UndergraduateStudents 11
FIGURE 8 Tuition & Fees History for Resident Undergraduate Students ... 12
FIGURE 9 Tuition & Fees in constant dollars for Resident UndergraduateStudents 12
TABLE 8 USHE Undergraduate Tuition In Actual and Real Dollars 13
Figures 10 through 18 represent Tuition Trends Based onResident Undergraduate Tuition for the Institution Listed
FIGURE 10 University of Utah 14
FIGURE 11 Utah State University 14
FIGURE 12 Weber State University 15
FIGURE 13 Southern Utah University 15
FIGURE 14 Snow College 16
FIGURE 15 Dixie College 16
FIGURE 16 College of Eastern Utah 17
FIGURE 17 Utah Valley Community College 17
FIGURE 18 Salt Lake Community College 18
TABLE 9 USHE Undergraduate Student Tuition & Fees for 1992-93 19

TABLE 1
UNDERGRADUATE TUITION AND FFES FOR FULL-TIME STUDENTS PER ACADEMIC YEARUNIVERSITY OF UTAH AND PEER COMPARISON GROUP
Resident Students
Change
1 1992-93 1991-92 Amount Percent
(1)
II
1. University of Virginia $3,890
2. University of Cincinnati $3,372
I3. U of California, Los Angeles $2,904
4. University of Colorado, Boulder# $2,540
5. Purdue University $2,520
6. University of Washington# $2,253
17. university cf Iowa* $2,228
11UNIVERSITY OF UTAH $2,105
University of Florida $1,649
10. University of Arizona $1,590
1111. U of North Carolina, Chapel Hill $1,261
UNWEIGHTED AVERAGE/Incl Utah: $2,392
Univ. of Utah Difference from Ave. ($287)-12.004
UNWEIGHTED AVERAGE/Excl Utah: $2,421
(2) (3) (4)
$3,354 $536 16.0%
$3,096 $276 8.9%
$2,336 $568 24.3%
$2,415 $125 5.2%
$2,324 $196 8.4%
$2,178 $75 3.4%
$2,072 $156 7.5%
$1,982 $123 6.2%
$1,473 $176 11.9%
$1,590 $0 0.0%
$1,213 $48 4.0%
$2,185 $207 9.5%
($203)
-9.284
$2,205 $216 9.8%
Univ. of Utah Difference from Ave. ($316) ($223)-13.04% -10.12%
Data from the 10/21/92 Chronicle of Higher Education*Information provided by the Institution or System Office#From WICHE Tuition and Fees Draft 12/5/92
Nonresident Students
ChangeRatio:
Nonres./Resident
1992-93 1991-92 Amount Percent 1992-93 1991-92
(5) (6) (7) (8) (9) (10)
$10,1326 $9,564 $1,262 13.2% 2.78 2.85
$8,049 $7,860 $189 2.4% 2.39 2.54
$10,603 $10,035 $568 5.7% 3.65 4.30
$11,332 $10,343 $989 9.6% 4.46 4.28
$8,192 $7,440 $752 10.1% 3.25 3.20
$6,345 $6,075 $270 4.4% 2.82 2.79
$7,192 $6,083 $1,109 18.2% 3.23 2.94
$6,076 $5,619 $457 8.1% 2.89 2.84
$6,409 $5,611 $798 14.2% 3.89 3.81
$6,996 $6,996 $0 0.0% 4.40 4.40
$7,845 $7,081 $764 10.8% 6.22 5.84
$8,170 $7,519 $651 8.7% 3.42 3.44
($2,094) ($1,900)-25.63% -25.27%
$8,379 $7,709 $670 8.7% 3.46 3.50
($2,303) ($2,090)-27.484 -27.11%

TABLE 2
UNDERGRADUATE TUITION AND FFES FOR FULL-TIME STUDENTS PER ACADEMIC YEARUTAH STATE UNIVERSITY AND PEER COMPARISON GROUP
Resident Students
Change
Nonresident Students
ChangeRatio:
Nonresident/Reside
1992-93 1991-92 Amount Percent 1992-93 1991-92 Amount Percent 1992-93 1991-92
(1) (2) (3) (4) (5) (6) (7) (8) (9) (10)
1. Virginia Technical University $3,538 $3,304 $234 7.1% $8,986 $8,152 $834 10.2% 2.54 2.47
2. University of California, Davis $2,980 $2,430 $550 22.6% $10,679 $10,129 $550 5.4% 3.58 4.17
3. Univ. of Maryland, College Park $2,778 $2,573 $205 8.0% $8,382 $7,807 $575 7.4% 3.02 3.03
4. Oregon State University $2,691 $2,505 $186 7.4% $6,972 $6,516 $456 7.0% 2.59 2.60
5. Colorado State Universityl $2,505 $2,356 $149 6.3% $7,671 $7,059 $612 8.7% 3.06 3.00
6. Washington State Universityi $2,253 $2,178 $75 3.4% $6,345 $6,075 $270 4.4% 2.82 2.79
7. Iowa State University* $2,228 $2,072 $156 7.5% $6,996 $6,526 $470 7.2% 3.14 3.15
8. UTAH STATE UNIVERSITY $1,776 $1,680 $96 5.7% $4.938 $4,662 $276 5.9% 2.78 2.78
9. New Mexico State U., Main Campus $1,756 $1,594 $162 10.2% $5,686 $5,290 $396 7.5% 3.24 3.32
10. Texas A & M University $1,465 $1,324 $141 10.6% $5,605 $4,564 $1,041 22.84 3.83 3.45
11. North Carolina State U., Raleigh $1,302 $1,254 $48 3.84 $7,886 $7,122 $764 10.7% 6.06 5.68
UNWEIGHTED AVERAGE/Incl Utah: $2,297 $2,115 $182 8.6% $7,286 $6,718 $568 8.4% 3.17 3.18
Utah State Difference from Ave. ($521) ($435) ($2,348) ($2,056)-22.70% -20.584 -32.23% -30.61%
UNWEIGHTED AVERAGE/Excl Utah: $2,350 $2,159 $191 8.8% $7,521 $6,924 $597 8.6% 3.20 3.21
Utah State Difference from Ave. ($574) ($479) ($2,583) ($2,262)-24.41% -22.19% -34.34% -32.67%
Data from the 10/21/92 Chronicle of Higher Education.*Information provided by the Institution.#From WICHE Tuition and Fees Draft 12/5/92.
2
1
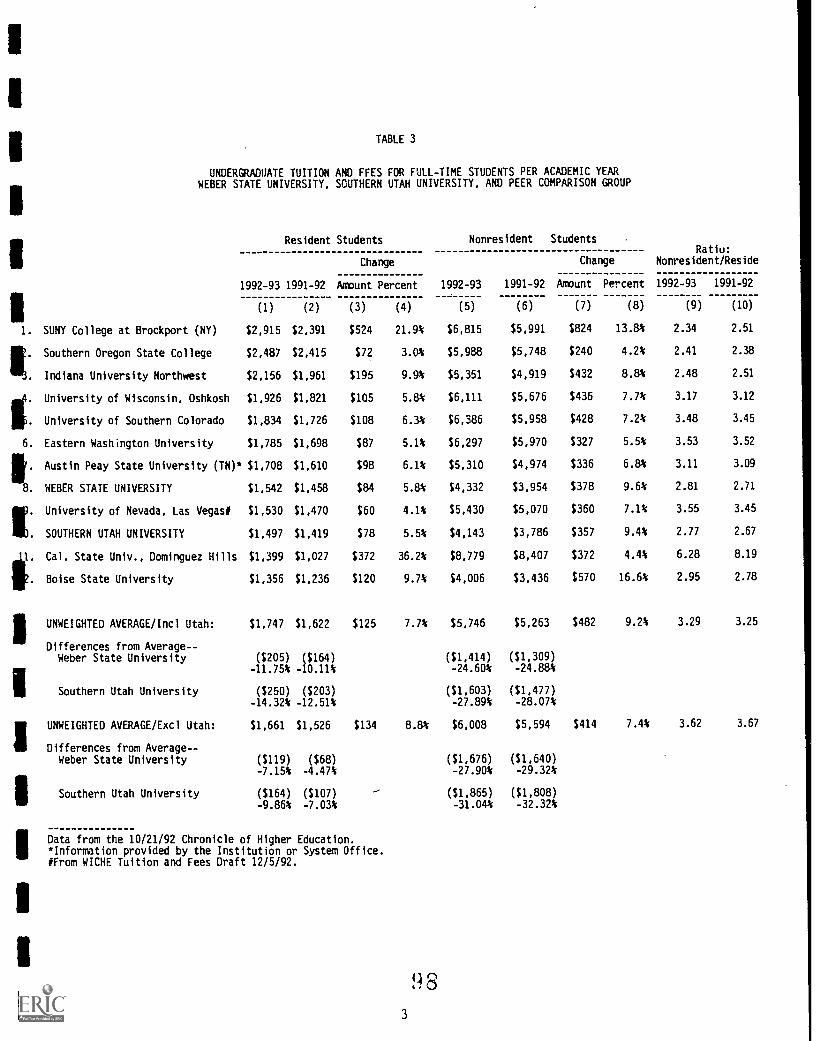
TABLE 3
UNDERGRADUATE TUITION AND FFES FOR FULL-TIME STUDENTS PER ACADEMIC YEARWEBER STATE UNIVERSITY, SOUTHERN UTAH UNIVERSITY, AND PEER COMPARISON GROUP
Resident Students
Change
1992-93 1991-92 Amount Percent
II!.
(1) (2) (3) (4)
SUNY College at Brockport (NY) $2,915 $2,391 $524 21.9%
III.Southern Oregon State College $2,487 $2,415 $72 3.0%
Indiana University Northwest $2,156 $1,961 $195 9.9%
IIIUniversity of Wisconsin, Oshkosh $1,926 $1,821 $105 5.84
University of Southern Colorado $1,834 $1,726 $108 6.3%
I(
Eastern Washington University $1,785 $1,698 $87 5.1%
Austin Peay State University (TN)* $1,708 $1,610 $98 6.1%
WEBER STATE UNIVERSITY $1,542 $1,458 $84 5.8%
II[.University of Nevada, Las Vegas# $1,530 $1,470 $60 4.1%
SOUTHERN UTAH UNIVERSITY $1,497 $1,419 $78 5.5%
ii. Cal. State Univ., Dominguez Hills $1,399 $1,027 $372 36.2%
Boise State University $1,356 $1,236 $120 9.7%
UNWEIGHTED AVERAGE/Incl Utah: $1,747 $1,622 $125 7.7%
Differences from Average--Weber State University ($205) ($164)
-11.75% -10.11%
Southern Utah University 0250 ($203)-14.32% -12.51%
UNWEIGHTED AVERAGE/Excl Utah: $1,661 $1,526 $134 8.8%
Differences from Average--Weber State University ($119) ($68)
-7.15% -4.47%
Southern Utah University ($164) ($107)
-9.86% -7.03%
Data from the 10/21/92 Chronicle of Higher Education.*Information provided by the Institution or System Office.#From NICHE Tuition and Fees Draft 12/5/92.
3
Nonresident Students
ChangeRatiu:
Nonresident/Reside
1992-93 1991-92 Amount Percent 1992-93 1991-92
(5) (6) (7) (8)
) (
10)
$6,815 $5,991 $824 13.8% 2.3: 2.51
$5,988 $5,748 $240 4.2% 2.41 2.38
$5,351 $4,919 $432 8.84 2.48 2.51
$6,111 $5,676 $436 7.7% 3.17 3.12
$6,386 $5,958 $428 7.2% 3.48 3.45
$6,297 $5,970 $327 5.5% 3.53 3.52
$5,310 $4,974 $336 6.84 3.11 3.09
$4,332 $3,954 $378 9.6% 2.81 2.71
$5,430 $5,070 $360 7.1% 3.55 3.45
$4,143 $3,786 $357 9.4% 2.77 2.67
$8,779 $8,407 $372 4.4% 6.28 8.19
$4,006 $3,436 $570 16.6% 2.95 2.78
$5,746 $5,263 $482 9.2% 3.29 3.25
($1,414) ($1,309)-24.604 -24.88%
($1,603) ($1,477)-27.89% -28.07%
$6,008 $5,594 $414 7.4% 3.62 3.67
($1,676) ($1,640)-27.90% -29.32%
($1.865) ($1,808)-31.04% -32.32%

TABLE 4
UNDERGRADUATE TUITION AND FFES FOR FULL-TIME STUDENTS PER ACADEMIC YEARTWO-YEAR COLLEGES AND PEER COMPARISON GROUP
Resident Students
Change
Nonresident Students
ChangeRatio:
Nonresident/Residen
1992-93 1991-92 Amount Percent 1992-93 1991-92 Amount Percent 1992-93 1991-92
(1) (2) (3) (4) (5) (6) (7) (8) (9) (10)
1. Onaondaga Community College (NY) $1,838 $1,628 $210 12.9% $5,338 $4,708 $630 13.4% 2.90 2.89
2. Anne Arundel Comm. College (MD) $1,720 $1,420 $300 21.1% $5,680 $5,280 $400 7.6% 3.30 3.72
3. UTAH VALLEY COMMUNITY COLLEGE $1,324 $1,239 $85 6.9% $3.711 3,426 $285 8.3% 2.80 2.77
4. SALT LAKE COMMUNITY COLLEGE $1,317 $1,281 $36 2.84 $3,780 $3,558 $222 6.2% 2.87 2.78
5. DIXIE COLLEGE $1,243 $1,186 $5/ 4.84 $3,803 $3,236 $567 17.5% 3.06 2.73
6. Danville Community College (VA) $1,235 $1,054 $181 17.2% $4,265 $4,264 $1 0.0% 3.45 4.05
7. Grand Rapids Comm College (MI) $1,220 $1,220 $0 0.0% $2,270 $2,290 ($20) -0.9% 1.86 1.88
8. COLLEGE OF EASTERN UTAH $1,085 $1,043 $42 4.0% $3,083 $2,816 $267 9.5% 2.84 2.70
9. SNOW COLLEGE $1,068 $1,035 $33 3.2% $3,903 $2,775 $1,128 40.6% 3.65 2.68
10. Joliet Junior College (IL) $1.030 $970 $60 6.2% $5,350 $4,420 $930 21.0% 5.19 4.56
11. Chemetaka Community College (OR) $1,008 $936 $72 7.7% $3,924 $3,636 $288 7.9% 3.89 3.88
12. Spokane Community College (WA) $999 $945 $54 5.7% $3,939 $3,717 $222 6.0% 3.94 3.93
13. North Idaho College $910 $860 $50 5.84 $2,342 $2,010 $332 16.5% 2.57 2.34
14. Western Wyoming Community College $756 $676 $80 11.88 $2,004 $1,292 $712 55.1% 2.65 1.91
15. Yavapai College (AZ) $652 $620 $32 5./% $5,002 $4,780 $222 4.6% 7.67 7.71
UNWEIGHTED AVERAGE/Incl Utah: $1,160 $1,074 $86 8.0% $3,893 $3,481 $412 11.8% 3.36 3.24
Differences from Average--Snow College ($92) ($39) $10 ($706)
-7.96% -3.65% 0.26% -20.27%
Dixie College $83 $112 ($90) ($245)7.124 10.41% -2.314 -7.03%
College of Eastern Utah ($75) ($31) ($810) ($665)-6.49% -2.904 -20.814 -19.09%
Utah Valley Community College $164 $165 ($182) ($55)14.114 15.34% -4.674 -1.57%
Salt Lake Community College $157 $207 ($113) $77
13.50% 19.25% -2.90% 2.23%
UNWEIGHTED AVERAGE/Excl Utah: $1,137 $1,033 $104 10.1% $4,011 $3,640 $372 10.2% 3.53 3.52
Differences from Average--Snow College ($69) ($108) ($865)
-6.05% 0.20% -2.70% -23.76%
Dixie College $106 $153 ($208) ($404)9.34% 14.82% -5.20% -11.09%
College of Eastern Utah ($52) ;10 ($928) ($824)-4.56% 0.984 -23.14% -22.63%
Utah Valley Community College $187 $206 ($300) ($214)16.47% 19.95% -7.49% -5.87%
Salt Lake Community College $180 $248 ($231) ($82)15.85% 24.02% -5.77% -2.24%
Data from the 10/21/92 Chronicle of Higher Education.4
9 9
I.

FIGURE 1
1992-93 USHE TUITION AND FEE LEVELSAS A % OF PEER GROUP AVERAGES
120%-A
110%
100%
90%-i
70%-,"
60%-"/'
50%-,/
40%-,)
30%-*/
20%-/
10%--/'
0%U of U USU WSU SUU Snow Dixie
INSTITUTION
1 L 0
CEU UVCC SLCC

TABLE 5
1992-93 TUITION BY QUARTER CREDIT HOUR LOAD
FOR RESIDENT UNDERGRADUATE STUDENTS
U of U USU WSU SUU Snow Dixie CEU UVCC* SLCC
1 128.70 86.00 67.00 65.00 50.00 26.70 50.75 49.00 56.002 161.20 115.00 101.00 100.00 76.00 53.40 71.50 77.00 82.003 193.70 144.00 136.00 135.00 101.00 80.10 92.25 105.00 108.004 226.20 173.00 172.00 170.00 128.00 106.80 113.00 133.00 134.005 258.70 202.00 207.00 205.00 151.00 133.50 133.75 161.00 160.006 291.20 232.00 243.00 240.00 175.00 160.20 154.50 189.00 186.007 323.70 261.00 278.00 275.00 200.00 186.90 175.25 217.00 212.008 356.20 290.00 314.00 310.00 225.00 213.60 196.00 245.00 238.009 388.70 319.00 349.00 345.00 250.00 240.30 216.75 273.00 264.0010 421.20 348.00 378.00 380.00 274.00 267.00 237.50 301.00 290.0011 453.70 377.00 393.00 380.00 274.00 293.70 258.25 329.00 316.0012 486.20 406.00 401.00 380.00 274.00 320.40 279.00 357.00 342.0013 518.70 436.00 401.00 380.00 274.00 320.40 279.00 357.00 357.0014 551.20 466.00 401.00 380.00 274.00 320.40 279.00 357.00 357.0015 583.70 495.00 401.00 380.00 274.00 320.40 279.00 357.00 357.0016 616.20 524.00 401.00 380.00 274.00 320.40 279.00 357.00 357.0017 648.70 553.00 401.00 380.00 274.00 320.40 279.00 357.00 357.0018 681.20 582.00 401.00 380.00 274.00 320.40 279.00 357.00 376.0019 713.70 611.00 427.00 380.00 274.00 320.40 279.00 379.67 395.0020 746.20 640.00 453.00 380.00 274.00 320.40 299.75 402.33 414.0021 778.70 669.00 480.00 415.00 298.00 347.10 320.50 425.00 433.0022 811.20 698.00 506.00 450.00 323.00 373.80 341.25 447.67 450.0023 843.70 727.00 532.00 485.00 348.00 400.50 362.00 470.33 467.0024 876.20 756.00 558.00 520.00 373.00 427.20 382.75 493.00 484.0025 908.70 785.00 584.00 555.00 398.00 453.90 403.50 515.67 500.00
TABLE 6
1992-93 TUITION AND FEES BY QUARTER CREDIT HOUR LOAD
FOR RESIDENT UNDERGRADUATE STUDENTS
U of U USU WSU SUU Snow Dixie CEU UVCC* SLCC
1 190.50 115.00 95.00 94.00 57.00 46.78 59.00 72.50 78.002 227.00 146.00 138.00 139.00 86.00 80.57 88.00 110.17 110.003 263.50 180.00 181.00 184.00 115.00 116.35 117.00 147.83 144.004 300.00 215.00 227.00 229.00 145.00 149.14 146.00 185.50 177.005 336.50 249.00 271.00 274.00 173.00 185.58 175.00 218.83 210.006 373.00 283.00 318.00 319.00 201.00 219.70 204.00 252.17 243.007 409.50 358.00 362.00 364.00 230.00 254.81 233.00 285.50 274.008 446.00 391.00 406.00 409.00 259.00 288.92 262.00 318.83 309.009 482.50 425.00 455.00 454.00 288.00 325.05 291.00 351.17 340.0010 519.00 460.00 488.00 499.00 356.00 360.83 320.00 383.50 371.0011 555.50 489.00 505.00 499.00 356.00 387.61 340.75 413.17 398.0012 592.00 518.00 514.00 499.00 356.00 414.40 361.50 441.17 424.0013 628.50 548.00 514.00 499.00 356.00 414.40 361.50 441.17 439.0014 665.00 578.00 514.00 499.00 356.00 414.40 361.50 441.17 439.0015 701.50 607.00 514.00 499.00 356.00 414.40 361.50 441.17 439.0016 738.00 636.00 514.00 499.00 356.00 414.40 361.50 441.17 439.0017 774.50 665.00 514.00 499.00 356.00 414.40 361.50 441.17 439.0018 810.00 694.00 514.00 499.00 356.00 414.40 361.50 441.17 458.0019 844.50 723.00 540.00 499.00 356.00 414.40 361.50 463.83 477.0020 879.00 752.00 566.00 499.00 356.00 414.40 382.25 486.50 496.0021 913.50 781.00 593.00 534.00 380.00 441.10 403.00 509.17 515.0022 948.00 810.00 619.00 569.00 405.00 467.80 423.75 531.83 532.0023 982.50 839.00 645.00 604.00 430.00 494.50 444.50 554.50 549.0024 1,017.00 868.00 671.00 639.00 455.00 521.20 465.25 577.17 566.0025 1,051.50 897.00 697.00 674.00 480.00 547.90 486.00 599.83 582.00
*For purposes of comparison UVCC tuition is 2 semesters divided by 3.
6 1 0 1

1000
900
800
700
600
500
400
300
200
100
0
Figure 2
1992-93 TUITION BY CREDIT LOADFOR RESIDENT UNDERGRADUATE STUDENTS
iI.,,,i,,,,,i,,,,,,,,.1 2 3 4 5 6 7 8 9 10 11 12 13 14 15 16 17 18 19 20 21 22 23 24 25
Credit Hours
-NI- U of U --f-- USU -0E- WSU -e- SUU
Figure 3
1992-93 TUITION & FEES BY CREDIT LOADFOR RESIDENT UNDERGRADUATE STUDENTS
1100
1000
900
800
700
600
500
400
300
200
100
0 IIIIIII I
111111711-F11111T I
2 3 4 5 6 7 8 9 10 11 12 13 14 15 16Credit Hours
17 18 19 20 21 22 23
I-Ns- U of U --I USU -00- WSU -e- SUUI
24 25

600
500
400
F.= 300
200
Figure 4
1992-93 TUITION BY CREDIT LOADFOR RESIDENT UNDERGRADUATE STUDENTS
100
Till I T
1 2 3 4 5 6 7 8 9 10 11 12 13 14 15 16 17 18 19 20 21 22 23 24 25Credit Hours
In Snow --f-- Dixie --)K CEU
9-- UVCC SLCC
Figure 5
1992-93 TUITION & FEES BY CREDIT LOADFOR RESIDENT UNDERGRADUATE STUDENTS
600
500
400
300
200
100
06 11 15 1I7 19 21 23 25
2 4 6 8 10 12 14 16 18 20 22 24Credit Hours
-in Snow 4 Dixie CEU
UVCC SLCC
8

TABLE 7
Utah System of Higher EducationA Summary of Tuitions and Fees*
For Utah's Colleges and Universities1983-84 through 1992-93
Page 1 of 2
UofU
1983-84.
TotalRegular TuitionTuition & Fees
1984-85
TotalRegular TuitionTuition & Fees
1985-86
TotalRegular TuitionTuition & Fees
1986-87**
TotalRegular TuitionTuition & Fees
1987-88
TotalRegular TuitionTuition & Fees
Resident $874.50 $1,050.00 $973.50 $1,167.00 $1,069.50 $1,275.00 $1,192.00 $1,490.50 $1,228.50 $1,542.00Nonresident 2,797.50 2,973.00 3,136.50 3,330.00 3,427.50 3,633.00 3,819.20 4,117.70 3,937.50 4,251.00
USU
Resident 732.00 918.00 810.00 1,002.00 879.00 1,071.00 976.00 1,246.00 1,014.00 1,293.00Nonresident 2,382.00 2.568.00 2,628.00 2.820.00 2,859.00 3,051.00 3,174.40 3,444.40 3,270.00 3,549.00
WSU
Resident 627.00 810.00 678.00 876.00 738.00 951.00 822.40 1,068.40 849.00 1,095.00Nonresident 2,007.00 2,190.00 2,169.00 2,367.00 2,361.00 2,574.00 2,630.40 2,876.40 2,712.00 2,964.00
SUU
Resident 597.00 789.00 645.00 852.00 702.00 922.50 780.80 1,014.80 804.00 1,068.00Nonresident 1,914.00 2,106.00 2,064.00 2,271.00 2,247.00 2,467.50 2,496.00 2,730.00 2,574.00 2,838.00
SNOWResident 501.00 696.00 522.00 723.00 570.00 780.00 630.40 852.40 651.00 873.00Nonresident 1,608.00 1,803.00 1,671.00 1,872.00 1,821.00 2,031.00 2,019.20 2,241.20 2,082.00 2,304.00
DIXIEResident 501.00 696.00 522.00 717.00 570.00 765.00 632.00 848.00 773.85 989.85Nonresident 1.602.00 1.797.00 1,665.00 1,860.00 1,824.00 2,019.00 2,019.20 2,235.20 2,476.32 2,692.32
CEU
Resident 501.00 696.00 522.00 729.00 570.00 777.00 643.20 850.20 663.00 876.00Nonresident 1,602.00 1,800.00 1,668.00 1,875.00 1,818.00 2,025.00 2,057.60 2,264.60 2,121.00 2,334.00
UVCC
Resident 501.00 687.00 546.00 747.00 651.00 855.00 758.40 983.40 798.00 1,026.00Nonresident 1.602.00 1,788.00 1,749.00 1,950.00 2,082.00 2,286.00 2,419.20 2,644.2r 2,553.00 2,781.00
SLCCResident 576.00 708.00 654.00 786.00 738.00 900.00 828.80 1,026.80 870.00 1,077.00Nonresident 1,842.00 1,974.00 2,094.00 2,226.00 2,361.00 2,523.00 2,630.40 2,828.40 2,790.00 2,997.00
* Academic year FTE
**Includes 10% one-time surcharge for Winter and Spring QuartersEstablished after mandatory budget cuts
9

TABLE 7 CONT.
Utah System of Higher EducationA Summary of Tuitions and Fees*
For Utah's Colleges and Universities1983-84 through 1992-93
Page 2 of 2
UofU
1988-89
TotalRegular TuitionTuition & Fees
1989-90
TotalRegular TuitionTuition & Fees
1990-91
Total
Regular TuitionTuition & Fees
1991-92
TotalRegular TuitionTuition & Fees
1992-93**
TotalRegular TuitionTuition & Fees
Resident $1,327.50 $1,644.00 1,447.50 1,768.50 1,551.00 1,884.00 1,648.50 1,981.50 1,751.10 2,104.50Nonresident 4,258.50 4,575.00 4,650.00 4,971.00 4,977.00 5,310.00 5,286.00 5,619.00 5,721.60 6,075.00
USU
Resident 1,095.00 1,380.00 1,197.00 1,500.00 1,281.00 1,599.00 1,359.00 1,680.00 1,485.00 1,821.00Nonresident 3,531.00 3,816.00 3,828.00 4,131.00 4,095.00 ,* 413.00 4,341.00 4,662.00 4,647.00 4,983.00
WSU
Resident 918.00 1,200.00 1,002.00 1,308.00 1,071.00 1,398.00 1,134.00 1,458.00 1,203.00 1,542.00Nonresident 2,937.00 3,219.00 3,207.00 3,513.00 3,426.00 3,753.00 3,630.00 3,954.00 3,993.00 4,332.00
SUU
Resident 870.00 1,164.00 948.00 1,242.00 1,014.00 1,350.00 1,074.00 1,419.00 1,140.00 1,497.00Nonresident 2,781.00 3,075.00 3,033.00 3,327.00 3,246.00 3,582.00 3,441.00 3,786.00 3,786.00 4,143.00
SNOWResident 690.00 924.00 738.00 972.00 759.00 1,005.00 789.00 1,035.00 822.00 1,068.00Nonresident 2,208.00 2,442.00 2,364.00 2,598.00 2,433.00 2,679.00 2,529.00 2,775.00 3,657.00 3,903.00
DIXIEResident 820.29 1,066.29 877.71 1,123.71 904.05 1,156.05 931.17 1,186.17 961.20 1,243.20Nonresident 2,624.94 2,864.94 2,808.66 3,054.66 2,892.96 3,144.96 2,981.25 3,236.25 3,520.80 3,802.80
CEU
Resident 702.00 915.00 750.30 963.30 774.00 1,005.00 804.75 1,043.25 837.00 1,084.50Nonresident 2,247.00 2,460.00 2,403.00 2,616.00 2,478.00 2,709.00 2,577.00 2,815.50 2,835.00 3,082.50
UVCC
Resident 861.00 1,095.00 930.00 1,167.00 957.00 1,194.00 994.00 1,239.00 1,071.00 1,323.51Nonresident 2,757.00 2,991.00 2,976.00 3,213.00 3,063.00 3,300.00 3,181.00 3,426.00 3,458.50 3,711.00
SLCC
Resident 909.00 1,128.00 963.00 1,197.00 999.00 1,239.00 1,035.00 1,281.00 1,071.00 1,317.00Nonresident 2,910.00 3,129.00 3,081.00 3,315.00 3,198.00 3,438.00 3,312.00 3,558,00 3,534.00 3,780.00
* Academic year FTE** Excludes one-time surcharge at USU and SLCC
10

2200
2000
1800
1600
1400
1200
1000
800
600
400
Figure 6
TUITION & FEES HISTORYFOR RESIDENT UNDERGRADUATE STUDENTS
1200
1100
1000
900
800
700
600
79-80 81-82 83-84 85-86 87-88 89-90 91-9280-81 82-83 84-85 86-87 88-89 90-91 92-93
Year
vs U of U 4 USU WSU SUU
Figure 7
TUITION & FEES IN CONSTANT $'SFOR RESIDENT UNDERGRADUATE STUDENTS
500 I IIIIIIIIIII79-80 81-82 83-84 85-86 87-88 89-90 9 92
80-81 82-83 84-85 86-87 88-89 90-91 92-93Year
U of U USU WSU SUU

1400
1300
1200
1100
1000
900
800
700
600
500
400
750
700
(Du'650
a)
06 600
5505
500
450
Figure 8
TUITION & FEES HISTORYFOR RESIDENT UNDERGRADUATE STUDENTS
79-80 81-82 83-84 85I-86 87:88 89I-90 91-92
80-81 82-83 84-85 86-87 88-89 90-91 92-93Year
Iel Snow 4-- Dixie >K-- CEU
UVCC SLCC
Figure 9
TUITION & FEES CONSTANT $'SFOR RESIDENT UNDERGRADUATE STUDENTS
400 1 I r I I i . , I , I -1---79-80 81-82 83-84 85-86 87-88 89-90 91-92
80-81 82-83 84-85 86-87 88-89 90-91 92-93Year
Snow 4-- Dixie ---ok"- CEU
UVCC SLCC
12 7
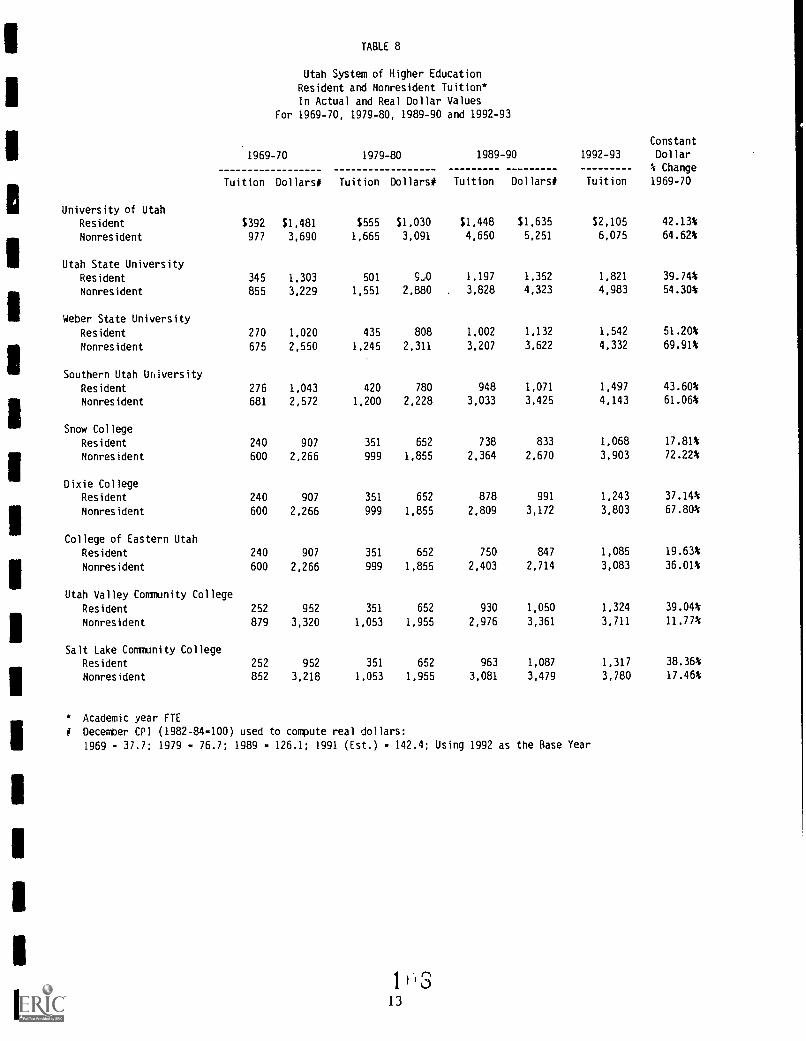
TABLE 8
Utah System of Higher Education
Resident and Nonresident Tuition*
In Actual and Real Dollar Values
For 1969-70, 1979-80, 1989-90 and 1992-93
1969-70
Tuition Dollars#
University of Utah
1979-80
Tuition Dollars#
1989-90
Tuition Dollars#
1992-93
Tuition
Constant
Dollar
% Change
1969-70
Resident $392 $1,481 $555 $1,030 $1,448 $1,635 $2,105 42.13%
Nonresident 977 3,690 1,665 3,091 4,650 5,251 6,075 64.62%
Utah State University
Resident 345 1,303 501 9,0 1.197 1,352 1.821 39.74%
Nonresident 855 3,229 1,551 2,880 3,828 4,323 4,983 54.30%
Weber State University
Resident 270 1,020 435 808 1,002 1,132 1,542 51.20%
Nonresident 675 2,550 1,245 2,311 3,207 3,622 4,332 69.91%
Southern Utah Uhiversity
Resident 276 1,043 420 780 948 1,071 1,497 43.60%
Nonresident 681 2,572 1,200 2,228 3,033 3,425 4,143 61.06%
Snow College
Resident 240 907 351 652 738 833 1.068 17.81%
Nonresident 600 2,266 999 1,855 2,364 2,670 3,903 72.22%
Dixie College
Resident 240 907 351 652 878 991 1,243 37.14%
Nonresident 600 2,266 999 1,855 2,809 3,172 3,803 67.80%
College of Eastern Utah
Resident 240 907 351 652 750 847 1,085 19.63%
Nonresident 600 2,266 999 1,855 2,403 2,714 3,083 36.01%
Utah Valley Community College
Resident 252 952 351 652 930 1,050 1,324 39.04%
Nonresident 879 3,320 1,053 1,955 2,976 3,361 3,711 11.77%
Salt Lake Community College
Resident 252 952 351 652 963 1,087 1,317 38.364
Nonresident 852 3,218 1,053 1.955 3,081 3,479 3,780 17.46%
* Academic year FTE
# December CPI (1982-84-100) used to compute real dollars:
1969 - 37.7; 1979 - 76.7; 1989 . 126.1; 1991 (Est.) - 142.4; Using 1992 as the Base Year

2200
2000
1800
1600
1400
1200
1000
800
600
400
200
Figures 10 & 11
U OF U TUITION TRENDSBASED ON RES/UNDERGRAD TUITION
1969-70 1979-80Year
-IN- Line A ---f--- Line B -*K- Line C
1992-93
Line A = Tuition in 1991 Dollars Line B = Actual Tuition PaidLine C = 1969 Tuition Increased by Inflation
2000
1800
1600
1400
1200
1000
800
600
400
200
USU TUITION TRENDSBASED ON RES/UNDERGRAD TUITION
1969-70 1979-80Year
-61,- Line A --F- Line B -s(--- Line El
14
169
1992-93

1600
1400
1200
1000
800
600
Figures 12 & 13
WSU TUITION TRENDSBASED ON RES/UNDERGRAD TUITION
400
2001969-70 1979-80
Year
am Line A Line B Line C
1992-93
Line A = Tuition in 1991 Dollars Line B = Actual Tuition PaidLine C = 1969 Tuition Increased by Inflation
1600
1400
1200
1000
800
600
400
200
SUU TUITION TRENDSBASED ON RES/UNDERGRAD TUITION
1969-70 1979-80Year
El Line A Line B Line C
15 9
1992-93

1100
1000
900
800
700
600
500
400
300
200
Figures 14 & 15
SNOW TUITION TRENDSBASED ON RES/UNDERGRAD TUITION
1966-70 1976-80Year
-NI- Line A Line B Line C
1992-93
..ine A = Tuition in 1991 Dollars Line B = Actual Tuition PaidLine C = 1969 Tuition Increased by Inflation
1400
1200
1000
800
600
400
200
DIXIE TUITION TRENDSBASED ON RES/UNDERGRAD TUITION
1966-70 197b-80Year
-al- Line A Line B Line C
16
1992-93
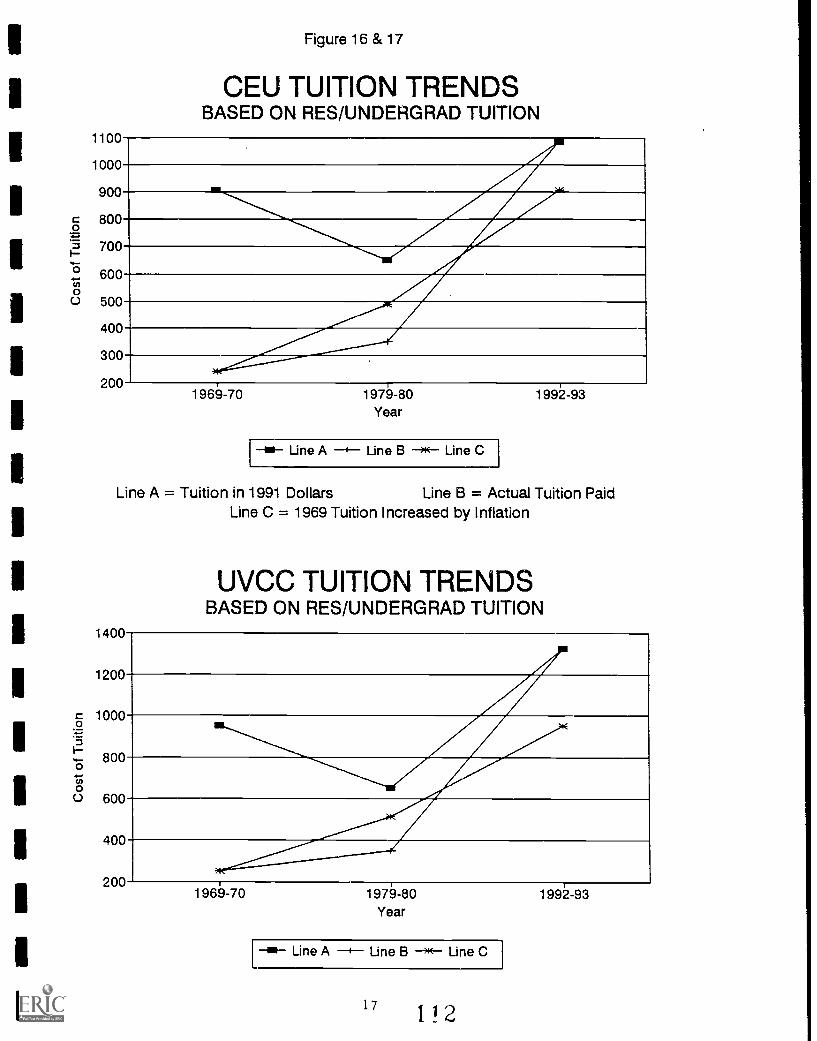
II
II
III
III
II
I
I
I
I
I
I
I
1100
1000
900
800
700
600
500
400
300
200
Figure 16 & 17
CEU TUITION TRENDSBASED ON RES/UNDERGRAD TUITION
7.1969-70 1979-80
Year
-m- Line A -+- Line B --0(--- Line C
1992-93
Line A = Tuition in 1991 Dollars Line B = Actual Tuition PaidLine C = 1969 Tuition Increased by Inflation
1400
1200
1000
800
600
400
200
UVCC TUITION TRENDSBASED ON RES/UNDERGRAD TUITION
1969-70 1979-80Year
-el- Line A --1--- Line B -w- Line C
1992-93

1400
1200
Figure 18
SLCC TUITION TRENDSBASED ON RES/UNDERGRAD TUITION
c 1000
800
o 600
400
200e
1969-70 1979-80Year
61-- Line A --4--- Line B Line C
1 I 3
1992-93

TABLE 9
UTAH SYSTEM OF HIGHER EDUCATION
UNDERGRADUATE STUDENT TUITION AND FEES FOR ACADEMIC YEAR
1992-93*
Tuition
U of U**
Universities
USU# WSU SUU Snow
2 Year Community Colleges
Dixie CEU UVCC SLCC
Resident Students 1,751.10 1,440.00 1,203.00 1,140.00 822.00 961.20 837.00 1,606.50 1,071.00
Nonresident Students 5,721.60 4,602.00 10,890.00 3,786.00 3,657.00 3,520.80 2,835.00 5,187.75 3,534.00
Fees
Student Activity 30.00 45.00 66.78 67.50 40.50 36.00 51.00 33.50 24.00
Building Fee 130.50 90.00 79.32 166.00 60.00 117.00 42.00 112.80 84.00
Athletic Fee 48.00 60.00 63.18 60.00 42.00 36.00 54.00 28.50 18.00
Union Building Fee 54.51 15.00 32.25 30.00 22.50 48.00 54.00
Theaters 9.00
Med. or Health 17.40 39.00 12.51 10.50 7.80 3.00
Recreation Fee 16.50 15.00 20.70
Regis. By Telephone 9.00 6.00
Yearbook 15.00 12.00
Activity/Stud Srvc Ctr 30.00 24.00 30.00 57.00 3.00
Alumni Fee 3.00 3.00 1.20 3.00
Departmental Activity 18.00
Insurance 7.00 12.00
Library 6.00 6.50 3.00
I.D. cards 3.00
Intramu-al 6.45 3.00 12.00
Transci 3.00
Student Services 27.00
Band Uniforms 3.00
Comp. Advising 9.00
Testing Center 1.00
Computer 105.00 69.00 36.00 9.00 6.00 10.00 9.00
Publications Council 6.00
Theater 1.00
Total Fees 353.40 336.00 339.00 357.00 246.00 282.00 247.50 252.50 246.00
Total Tuition & Fees
Resident Students 2,104.50 1,776.00 1,542.00 1,497.00 1,068.00 1,243.20 1,084.50 1,859.00 1,317.00
Nonresident Students 6,075.00 4,938.00 11,229.00 4,143.00 3,903.00 3,802.80 3,082.50 5,440.25 3,780.00
U of U
Undergrad. Graduate Student Tuition and Fees for Academic Year 1992-93*
Physician
Assistant
U of U School of College USU WSU SUU
Graduate Medicine of Law Graduate Graduate Graduate
Tuition
Resident Students 5,901.00 1,910.00 5,502.00 2,648.60 1,584.00 1,323.00 1,254.00
Nonresident Students 6,939.00 6,267.00 12,141.00 6,635.60 5,067.00 4,392.00 4,170.00
Tuition and Fees
Resident Students 6,270.00 2,278.50 5,871.00 3,017.00 1,920.00 1,662.00 1,611.00
Nonresident Students 7,308.00 6,636.00 12,510.00 7,004.00 5,403.00 4,731.00 4,527.00
* Academic year FTE
**Tuition and fees for all undergraduate students with the exception of the
Physician Assistant students. Physician Assistant tuition and fees listed below.
# Does not include an additional fee of $2.00 for Fall Quarter fixed cost increases of the
Associated Student Association.
19 114

F. S
tude
nt F
inan
cial
Aid
l 1 5

I TALFSTUDENT FINANCIAL AID
CAMPUS-BASED & PROGRAM-BASED STUDENT FINANCIAL AID 1
TABLE 1 Fedaral and State Matching Student Financial Aid,1983-84 - 1991-92 2
TABLE 2 Western interstate Commission for Higher Education (WICHE)and Regional Dental Exchange Program (RDEP) 4
TABLE 3 Paul Douglas Teacher Scholarship Program 4
TABLE 4 Utah Career Teaching Scholarship Program 5
FEDERAL FAMILY EDUCATION LOAN PROGRAMS(FEDERAL STAFFORD, SLS & PLUS LOANS) 6
FIGURE 1 UHEAA Annual Gross Guarantee Volui. ?; Federal Stafford,PLUS and SLS Programs 8
FIGURE 2 UHEAA Cumulative Gross Guarantee Volume; Federal Stafford,PLUS and SLS Programs 8
TABLE 5 UHEAA Annual Gross Guarantees Volume; Federal Stafford,PLUS, SLS, Consolidation, and All Loan Programs
TABLE 6 UHEAA Gross Guarantees,
TABLE 7 UHEAA Gross Guarantees,
TABLE 8 UHEAA Gross Guarantees,
TABLE 9 UHEAA Gross Guarantees,
TABLE 10 UHEAA Gross Guarantees,
TABLE 11 UHEAA Gross Guarantees,
TABLE 12 UHEAA Gross Guarantees,
TABLE 13 UHEAA Gross Guarantees,
Federal Stafford, by Lender
Federal SLS Program, by Lender
Federal PLUS Program, by Lender
All Loan Programs, by Lender
Federal Stafford Program, Utah Schools .
Federal SLS Program, Utah Schools
Federal PLUS Program, Utah Schools
All Loan Programs, Utah Schools
9
11
11
12
12
13
14
15
16
I
TAB FSTUDENT FINANCIAL AID
Continued I
FIGURE 3 UHEAA Federal Stafford Loan Default Rates (Gross) 17
FIGURE 4 UHEAA Federal Stafford Loan Defautt Rates (Net) 17
FIGURE 5 UHEAA Federal Stafford Loan Recovery Rates 18
UTAH STATE BOARD OF REGENTS - LOAN PURCHASE PROGRAM 19
1 1 3

CAMPUS-BASED & PROGRAM-BASEDSTUDENT FINANCIAL AID
INTROCCCTION
The following table provides statistical information concerning a number of student financial aidprograms. This information reflects the recent reauthorization amendment signed into law July 23, 1992. TheU.S. Department of Education offers five major student financial aid programs as follows:
Program Description
Federal Perkins Loans
Federal Wort-Study (FWS)
Federal Pell Grants
Federal Supplemental EducationalOpportunity Grants (FSEOG)
State Student IncentiveGrants (SSIG)
The National Direct Student Loan (NDSL) program has been renamed theFederal Perkins Loan program as a memorial to Carl D. Perkins, thechairman of the U.S. House of Representatives Education and LaborCommittee. Perkins loans are low interest (5 percent) loans with amaximum 10 year repayment period. The Federal Perkins Loan programis called a "campus-based" program since each institution is
responsible for administering the program on its own campus.
Institutions are responsible for providing a one-ninth match of theFederal Perkins funding. With reauthorization, the institutionalmatch will increase.
The FWS program provides jobs for undergraduate and graduate studentswho need financial aid. Employers pay a portion of the student'swages while the FWS funds pay the remainder. FWS is also one of thecampus-based programs with funding received directly from the U.S.Department of Education. Beginning in fiscal 1989, the employershare of student wages was increased to 30 percent. The institutionsare now required to provide for the coming year a 25 percent matchfor the Federal Work-Study funds.
The Federal Pell Grant program is the largest Federal studentfinancial aid grant program. Federal Pell Grants are need-basedawards to undergraduate students ranging in size from $200 to $2,300for the 1991-92 award year. Funding for the Federal Pell Grantprogram comes directly from the U.S. Department of Education to theindividual campuses. The Pell Grant program is considered anentitlement since funding is provided to every eligible applicant.For the 1993-94 award year the minimum award is $400 and the maximum
is $2,300.
The FSEOG program is a grant program for undergraduate students with
exceptional need. Awards of up to $4,000 per year are availabledepending on the student's need. The FSEOG program is also
considered a campus-based program. Funding for the program is
provided by the U.S. Department of Education. Beginning in fiscal
1989, institutions became responsible for providing a 5 percentmatching portion of the FSEOG funding. The matching portionpercentage increased to 10 percent in 1990 and increased again to 15percent in 1991. It has remained at 15 percent since that time.Beginning in July 1, 1993, the matching portion will increase to 25percent.
The SSIG program is a grant program for undergraduate students withsubstantial financial need. Awards of up to $2,500 per year areavailable depending on the student's need. Funding for the programis provided partially by the U.S. Department of Education with aminimum of 50 percent matching and maintenance of effort requirementof the designated State agency. The SSIG program in Utah operateson a decentralized system with the individual institutionsresponsible for the administration of the program. Reauthorizationmay increase maximum awards to $5,000 beginning July 1, 1993.

TAI31,13 1UTAH SYSTEM OF HIGHER EDUCATION
FEDERAL AND STATE MATCHING STUDENT F!NANCIAL AID
U OF U
1983-84
No. of 1 Dollar
Stdnts 1 Amount
1984-85
No. of 1 Dollar
Stdnts 1 Amount
0985-86
No. of 1 Dollar
Stints 1 Amount
1986-87
No. of 1 Dollar
Stints 1 Amount
Perkins Loan 1,226 2,054,334 1,244 2,236,359 1,569 2,680,634 1,133 2,121,842CWS 536 1,191,979 562 1,014,454 567 1,101,176 477 1,095,040SEOG
SSIG
Pell
TOTAL
536
958
314,213
488,675
3,165,438
7,214,639
577
785
381,549
417,223
3,610,257
7,659,842
607
855
403,481
414,873
4,063,874
8,664,038
463
464
350,394
726,570
4,588,771
8,882,617
USU
Perkins Loan 920 1,046,005 793 824,098 1,160 1,206,880 882 1,074,610CWS 530 651.023 638 592,467 837 706,851 607 575,397SEOG 735 587.313 878 630,506 738 514,850 884 631,692SSIG 176 159,090 276 193,718 276 174,360 262 184,623Pell 2.631,593 3,433,540 4,050,710 3,982,239
TOTAL
wSU
5,075,024 5,674,329 6,653,651 6,448,561
Perkins Loan 907 787,368 806 719,036 852 879,372 628 658,473
CWS 652 820.316 545 640,365 645 729,520 624 812,698SEOG 710 401,990 660 401,166 624 417.765 507 456,552
SSIG 314 280,633 535 318,912 440 321,256 276 309,973Dell 2,167,419 2,287,653 2,925,846 2,904,181
TOTAL 4,457,726 4,367,132 5,273,759 5,141,877
SUU
Perkins Loan 236 275,765 227 281,590 203 251,705 242 332,701CWS 269 260,934 239 234,893 218 215,885 250 229,376SEOG 290 123,429 292 147,732 263 133,978 262 152,226
SSIG 49 61,128 78 68,379 70 70,579 56 68,286Pell 940,441 1,192,050 1,370,162 1,487,829
TOTAL 1,661,697 1,924,644 2,042,309 2,270,418
SHOW
Perkins Loan 106 72,238 71 41,701 117 78,688 180 151,079CWS 96 70,928 107 63.066 133 68,608 125 71,481
SEOG 87 39,434 95 34,172 127 58,862 218 50,338SSIG 38 32,256 54 35,086 53 35,886 51 34,662Pot 295,015 322.566 375,101 321,396
TOTAL 509,871 496,591 617,145 628,956
DIXIE.
Perkins Loan 109 90,050 113 99,002 167 172,562 125 121,408CWS 163 141,735 165 172,924 169 161,907 169 154,088SEOG 183 96,408 140 84,956 169 89,395 131 90,914SSIG 26 26,028 27 29,272 31 29,772 27 29,140Pell 333,825 412,779 577,535 671,578
TOTAL 688,046 798,933 1,031,171 1,067,128
:EU
Perkins Loan 60 47,788 34 37,226 29 33,931 32 31,882LW5 60 47,788 70 51,297 60 35,968 77 41,538HOG 42 20,449 52 27,554 62 39,469 112 59,718SSIG 33 72,396 44 78,610 27 74,542 50 72,130Pell 417,774 567,299 667,411 780,894
ToTAL 606,195 761,986 851,321 986,162
UVCC
Perkins Loan 100 90,720 141 113,321 116 96.954 192 191,174CwS 137 154,275 115 125,613 115 124,694 195 142,768SEOG 138 82,344 120 78,318 283 114,798 159 77,616
SSIG 109 79.522 143 90,187 173 100,299 185 89.831Pell 1,045,335 1,268,404 1,766,477 1,842,171
TOTAL 1.452,186 1,675,843 2,203,222 2,343,560
SLCC
Perkins Loan 253 204,933 325 259,917 343 298,840 235 202,485CWS 117 106.940 121 148,228 161 166,026 133 140,975SEOG 137 73,679 219 148,492 559 456,279 237 116,5905510 166 100,186 156 112,323 178 114,723 210 110,588dell 1.226,119 1,347.722 1,669,868 1,813,992
TOTAL 1,711,857 2,016,682 2,705,736 2,384,630
*OTAL USKPerkin% Loan 3,917 4,669,201 3,754 4,612,250 4,576 5,699,566 3,649 4,885,654:wS 2,560 3,445,918 2,562 3,043,307 2,905 3,310,635 2,657 3,263,361SEOG 2,858 1,739,259 3,033 1,934,445 3,432 2.228,877 2,973 1,986,040ISIG 1.869 1.299.914 2,098 1,343,710 2,103 1,336.290 1,581 1,625,803Pell
OTAL
12,222,959
23.377,251 1245,14725,297802
17,466,984
30.042,352
18,393,051
30.153.909

Atil,bUTAH SYSTEM Of HIGHER EDUCATION
FEDERAL AND STATE MATCHING STUDENT FINANCIAL AID
UOFU
1987-88
No. of 1 Dollar
Stdnts 1 Amount
1988-89
No. of 1 Dollar
Stdnts 1 Amount
1989-90
No. of 1 Dollar
Stdnts 1 Amount
1990-91
No. of 1 Dollar
Stdnts 1 Amount
1991-92
No. of 1 Dollar
StOnts 1 Amount
Perkins Loan 479 2,306,035 1,039 3,157,097 2,233 3,098,772 2,238 3,994,973 3,153 3,101,580
CMS 1,761 1,130,091 2,404 1,596,564 1,374 1,530,322 1,153 1,725,088 1,446 1,224,849
320G 237 318,149 648 384.117 814 462.966 1,296 526,663 4,447 672,032
SSIG 489 360,254 550 376,195 506 359,635 581 312,019 593 287,758
Pell 5,387,372 6.737,350 7,711.793 7,920,629 9,587,093
TOTAL 9,501,901 12,251,323 13,163,488 14,479,372 14,873.312
VSU
Perkins Loan 870 1,080,247 1,181 1,541,260 835 1,197,935 1,010 1,455.342 977 1,408,983
CWS 537 619,956 536 602,803 560 651.725 512 708,306 511 750.432
SEOG 850 608,801 1,590 596,844 1,392 663,519 1,098 711,434 1,272 773,401
SSIG 303 199,092 239 190,686 463 193,974 292 160,387 434 171,650
Pell 4,430.574 5,776,902 7,192,919 8,029,281 10,132,988
TmTAL
wSU
6,938,670 8,708,495 9,900,072 11,064,750 13,237,454
Perkins Loan 636 627,900 987 884,642 991 952,148 1,236 1,206,956 1,028 1,437,525
CWS 677 798,616 1,421 1,112,237 516 749,975 549 798,860 535 1,033,022
SEOG 653 465,438 688 482,916 640 445,707 847 596,842 754 636,910
SSIG 353 248,294 264 209.294 254 192,216 264 172,143 203 163.962
Pell 3,498,230 5,044,541 6,022,812 6,030,832 7,594,974
TOTAL 5,638,478 7,733,630 8,362,858 8,796,633 10,866,393 -
SUU
Perkins Loan 209 346.500 217 371.117 182 287,566 174 263,350 218 385,960
CWS 259 229,401 272 261,880 275 253,904 244 268.756 233 262.194
SECG 232 141.232 277 137,349 382 145,050 397 153,079 529 167.756
SSIG 60 41,758 136 45,282 106 49,292 98 48,040 90 50,208
Pell 1,646.156 2,090,526 2,486,252 2,705,982 3,147,521
TOTAL 2,405.047 2,906,254 3,222,064 3,439,207 4,013,639
SNOw
Perkins Loan 159 143.871 137 130,668 113 113,207 135 146,824 116 124,821
CWS 140 84,410 108 65,626 98 67,097 93 62,900 95 73,130
SEOG 248 71,763 377 56,137 557 64,011 513 67,251 637 72,311
SSIG 54 22,572 94 23,264 78 23,783 103 25,351 130 24,006
Pell 463,251 634,288 824,511 837,529 1,086,270
TOTAL 785,867 909,983 1,092,609 1.139,855 1,380,538
DIXIE
Perkins Loan 98 125,037 135 219,946 129 214,184 124 218,518 136 232,512
CWS 167 167,753 166 161,395 183 169.380 143 178,512 151 187,023
SEOG 164 88.014 339 105,804 307 110,473 260 115.968 264 118.335
SSIG 38 29,344 63 30,694 54 31,965 33 26,239 28 30,910
Pell 838,984 1,062,752 1,220,314 1,409,982 1.717,784
TOTAL 1,249.132 1,580,591 1.746,376 1.949.219 2,286,564
CEU
Perkins Loan 37 45.701 34 29,090 61 45,934 66 54,978 49 41,241
CwS 81 59,631 78 56,311 77 35,837 92 74,404 79 66,723
SEOG 81 46,760 64 33.541 83 62,029 91 46,042 90 42,744
$SIG 61 28,676 51 24,438 58 24,378 75 27,602 58 27.144
Pell 745,202 923,593 1,021,086 1,170.513 1,218.215
TOTAL 925.970 1,066,973 1,189,264 1,373,539 1,395,667
UVCC
perkins Loan 106 122,468 132 182,166 199 293,069 190 246,441 121 198,090
CWS 106 109.741 149 142,778 187 215,803 153 187,519 121 156,267
SEOG 95 56,549 266 131,561 330 130,403 405 189,996 576 300.475
SSIG 126 85,774 136 84.578 160 98,340 188 91,923 193 88.461
Pel) 1,979,225 2,597,081 3,44,670 3,429.054 4,747.103
TOTAL 2,353,757 3,138.164 4,19',285 4,144,933 5.490.396
SLCC
Perkins Loan 444 507,021 562 922,552 605 639.511 722 786,764 671 790,564
CWS 140 157,444 211 210.706 281 323,593 233 291,654 284 433.095
SEOG 379 216,386 605 276,955 696 296,844 307,216 715 317,674
SS1G 207 100,446 216 104.224 244 110,972 253 112,080 373 153,136
cell 2,475,359 3,772,436 4,429,249 4,855,862 6,464,267
TOTAL 3,456,656 5,286,873 5,800,169 6,353,576 8,158,736
TOTAL USHF
Perkins Loan 3,038 5.304,780 4,424 7,438,538 5.348 6.842,326 5,895 8,374,146 6,469 7,721,276
CWS 3,868 3,357,043 5,345 4,210.300 3.551 3,997,636 3,172 4,295,999 3.455 4,186,735
606 2.939 2.013.092 4,854 2.205,224 5,201 2,381.002 2,714,491 9,284 3,101,238
6616 1,691 1,116.210 1,749 1,088,655 1,923 1,084,555 1,887 975,784 :.102 997.235
Pell 21,464,353 28,639,569 34,363.666 36.389,664 45,696.215
TOTAL 33,255,478 43,582,286 48,669,185 52.741.084 61.772,699
ource: TISAP I. Other Federal Reports
1 9 1 3

TAI31,13 2ASTERN INTERSTATE COMMISSION
fCR HIGHER EDUCATION (WICHE)Scholarships Awarded
84-45
leterinary Medicine
85-86 16-47 87-84 88-69 89-90 90-91 91-92
8 of emerdil 47 47 47 47 46 44 40.5 39Dollar Amount$639,200 1653.300 1672.100 1749.400 1799.167 1809,600 1745.200 1717.600Optometry
4 of Awards 16 16 14 17 17 14 16 :2Dollar Amount 191.200 194.400 185,400 1105.400 1107,100 189.600 110,400 181,600Podiatry
of Awards 6 7 s 8 9 7 11 9Dollar Amount 139.000 146,900 134.500 152,500 160,350 150,400 180.300 168,400Dentistry
$ of Awards 6 4Dollar Amoent 170,000 143.200
Administration Fee
Dollar Anoint 153.000 153.000 156.000 159400 962,000 165,100 164,400 171,500TOTAL
1 of Awards 75 74 66 72 72 5 67.5 60Dollar Amoent9492.400 1890.400 1544,0130 1966,700 51,024,617 51,014,700 1997,900 9939.100
REGICew. DENTAL EXCHANGE PACGRAM (RDEP)Scholarships Awaroed
Leg. Appropriation
0 of Awards zo zo 43 43 40 40 40 40Dollar AmountS178,000 9283.000 1382.600 1381.300 1379.300 1379,400 1394400 1399,400Total Expenditure
Dollar Amount1210,506 1323.363 9429.594 1413,043 1421.200 1425,150 1446.900 1e50.300
The Student Exchange Program administered through the Western Interstate Commission (Or Higher Education (WICHE) and theRegional Dental Education Program (RDEP) assist Utah students in obtaining professional training In dentistry, vetennary medicine,optometry, and podiatry outside the state of Utah. Under these reciprocal arrangements. Utah recerves out-of-state students inmedicine, physical therapy, pharmacy, law and architecture under the interstate compact. Participating students pay resident tuitionand general fees of the receiving state or reduced tuition at private institutions. The chart above is a summary of Utah's participationin these programs.
TABLE 3PAUL DOUGLAS TEACHER SCHOLARSHIP PROGRAM
Brigham Young University
87-48 88-89 19-90 90-91 91-92
0 of Students 9 13 9 7 4Dollar Amountuniversity of Utah
of Students
145.000 165.000 942.500 112,440
4
120.000
200iiir AmOunt120.000 510,000Utah State Untver it)
0 of StudentsI 9 9 7 5Dollar moot
weber State University
/ of StuOents
115.000 1e5.000
1
145.000
2
135,000
2
140,000
3dollar Amount15.000 110.003 110,000 115,000Trenton State (NJ)
/ of Students t 1 I IDollar Amount15.000 15400 15,000 15,000Southern Utah University
of Stigmata 3 2dollar Amount 515.000 18,335
Snow College
/ of Students1 t 1
Dollar Amount 14.469 94,665 15.000Rick's College
of Students1
Dollar Amount15,000'VAL
0 of Students16 28 22 21 1$Dollar Amount 179.469 1138.000 1107,500 9102.486 590.000
The Paul Douglas Teacher Scholarsnip Program is a federally-funded program estal-lr .ned to provide scnolarshios to encourage andenable outstanding nigh School graduates (who were in the top ICA of their graduating clasSI to pursue teaching careers Stucientsmay apply at their nigh school for this scholarship which provides up to $5,000 each academic year, tOr nO more than low academicyears. of education in preparation to becoming a teacher Students receiving this scholarship will be reouired to complete a teachercertification program and teach on a full-time bears tor a period of not less than two years for each year of scrwiarsnio rundingreceive0.
1 2 2

TABLE 4Utah System of Higher Education
Utah Career Teaching Scholarsnip (UCTS) Program1984-85 through 1991-92
FALL'FIVERS SUMMER WINTER SPRING TOTAL
Awardees $ Expended Awardees $ Expended Awardees S Expended Awardees $ Expended $ Expended
1984-85 0 $O 325 324 314599,316 $103,205 $97,045 $299,566
68 522,836 358 $125,812 338 $121,130 324 $116,972 $386,750
986-87 10 $2,934 * 308 $117,822 287 $120,032 266 $109,193
987-88 14 306 $129,244 329 $137,621 311
S349,981
1988-89 18$5,373
376 341 331$129,237$147,296
$401,475
$7,203 $166,342 $154,089
32 $14,813 347 $168,618 326 $157,217 319 $152,561
$144579411921990-91 73 $27,751 360 334 $173,208 301 $153.716$186,437
1991-92 97 $31,042 344 $189,618 331 308 $160,491$181,773 $562.925
STIPENDS SUMMER FALLAwardees S Expended Awardees
WINTER SPRING TOTAL
$ Expended Awardees S Expended Awardees S Expended S Expended
1985-86 0 $0 97 $48,500 97 87
$53,500
$44,000
$143,5001984-85 0 $0 83 $41,500 97 $48,500 107
1987-88 0
1 $500$0
93
95 $47,50090
85
$45,000
$42,500 84
79 $39,500$42,000
$141,000
$131.500$46,500
S48,500
$2,000 96 $48,000 89 94
$39,000
$47,000
$132.000$116,000
$141,5001989-90 4 $4,550000
781988-89 0 $0 77 $38,500 77
111991-92 5 $2,500 72 $36,000 70 $35,500 71 535,500
TOTALIII
5001990-91 2 90 $45,250 89 $44,750 90 $45,000 000$1,000
PREMIER SUMMER FALL WINTER SPRING
Awardees $ Expended Awardees $ Expended Awardees $ Expended Awardees S Expended $ Expended
1111984-850 $0 20 18 19
1985-86 0 $0 17
$20,00018
S18,00017 11?:000000
$57,000
$17,000 $52,000
18
S18,00018
1987-88 0 $0 19 18
$18,00016
$18,000 $55,0001986-87 0 $0 19 $19,000
1111988-89
1989-90
0
1
SO
20
18$19,000$18,000
$20,000 20
17
$18,000$17,000
20
16
$16,000$16,000
$53,000$51,000
$1,000 18 $18,500 19
$20,00016
$20,000 $61,000
1990-91 1
$1,000
1991-92 3 18 20
$19,50014
$16,000 $55,000
$3,000 $20,000 $22,000 $14,000 $59,000
IITOTAL SUMMER FALL WINTER SPRING TOTAL
Awardees+ $ Expended Awardees+ $ Expended Awardees+ S Expended Awardees. $ Expended S Expended
$169,545$177,972
$166,693
$187,237
$202,296
$219,561$214,716
$209,991
$500,066
$579,750$536,481
$586,4/5
$641,930
P932:11092
$731,424
1985-86 68
0
$22,836
$0 325
358
308
$160,816
$191,312
324
338
$169,705$187,630
314
324
$3,434 $183,322 287 $183,032 2661986-87 10
1987-88 14 $5,373 306 $195,744 329 $198,121 311
1988-89 18 $7,203 376 $222,842 341 $209,589 331
1[989-901990-91
32
73
$17,813$29,751
347
360
$236,618$250,187
326
334
$221,717 319301
1991-92 97$36,542 344 $245,618 331
$237,458$239,273 308
IReimbursmt andAdjustments
1985-86 $0
1984-85 $0
111987-88 SO
1986-87 $O
1988-89 $0
1989-90
111990-911991-92
$1,545$371
$103
Includes Spring Quarter 1985-86 tuition paid in 1986-87.Total Duplicated
Administrativ4Support Costs
$0
SO
SO
S23,100$23,100
12M7326
$26,587
Total
S Expended
$500,067
$579,750
$536,481
$609,575
$665,030
I772630,93218
$758,116
The Utaii Career Teaching Scholarship (UCTS) Program is designed to encourage outstanding students to pursue careers 13teachers. The program is open to students enrolled in a program of study leading to teacher certification in a state-supportedcollege or unrversity, Brigham Young Univervty, or Westminster College. Up to 365 students ars awarded turtion and regular seidentfoe waivers. In addrtion to waivers, up to 100 UCTS reapients mews cash stipend of $500 per quartert$750 per semester, andup to 20 UCTS reapients receive the Premier award of $1,003 per quartert$1,500 per semester.
12 3

FEDERAL FAMILY EDUCATION LOAN PROGRAMS(FEDERAL STAFFORD, SLS & PLUS LOANS)
INTRODUCTION
The Federal Family Education Loan Program (formerly Guaranteed Student Loan Program), which consistsof the Federal Stafford, Federal PLUS, and Federal SLS loan programs, makes long-term, low interest loansavailable for students and the parents of students enrolled in postsecondary institutions. Federal FamilyEducation Loans are made primarily by commercial lenders and are insured against loss by state guaranteeagencies and reinsured by the Federal government.
The Federal Family Education Loan program is the largest single source of student financial assistancein the nation. For the federal fiscal year 1992, national loan volume totaled $14.8 billion consisting ofapproximately 5.1 million loans. Since the inception of the program, more than $142 billion of loans have beenmade.
UTAH HIGHER EDUCATION ASSISTANCE AUTHGRITY
Utah Higher Education Assistance Authority (UHEAA) is the designated guarantee agency in Utah. The
tables and graphs on the following pages describe the loan volume and related statistics for loans guaranteedby UHEAA.
BASIC PROGRAM PROVISIONS
A summary of the basic provisions fur each Federal Family Education Loan Program is provided below:
Program Description
Federal Stafford Loans As of October 1, 1992, the Federal Stafford Loan program consists oftwo separate loan types. Subsidized, or traditional Federal StaffordLoans are available to eligible students up to the annual loan
amounts listed below. Less than full-time students' awards will beprorated accordingly.
Federal PLUS Loans
1992-93 Yr 1993-94 Yr
First-Year Undergraduates $2,625 $2,625
Second-Year Undergraduates $2,625 $3,500
3rd & 4th-Year Undergraduates $4,000 $5,500
Graduate Students $7,500 $7,500
Cumulctive Loan Limit for
Undergraduate Study $17,250 $23,000
Cumulative Loan Limit forUndergrad and Graduate Study $54,750 $65,600
Students not qualifying for the maximum Federal Stafford loan amounts
listed above may "fill the gap" in Unsubsidized Federal StaffordLoans. Unsubsidized Federal Stafford loans are identical to
traditional Federal Stafford Loans except that they carry no in-
school or grace period interest subsidies.
New Federal Stafford loans for borrowers with previous loans carryinterest rates of 7, 8, or 9 percent or a variable rate up to 10percent. Loans for full-time borrowers carry a variable interestrate with a 9 percent cap. The current interest rate for newborrowers on both types of Federal Stafford loans is 6.94 percent,
and will vary annually based on short-term market rates. The maximumrepayment period for both Federal Stafford loan types, which begins6 months after the student is no longer attending school or at leasta half-time basis, is 10 years.
Federal PLUS Loans are available to the parents of dependent
undergraduate or graduate students. A parent may now borrow up tothe cost of attendance (less other aid) for each dependent student
6
4

Federal SLS Loans
annually. Interest on Federal PLUS Loans is a variable rate with a
104 cap. The rate is based on short-term market rates and currently
stands at 7.51 percent. Repayment on Federal PLUS Loans begins whenthe loan is made and extends over a maximum 10-year period.
Federal SLS Loans are available to independent undergraduatestudents, graduate students and, in some cases, dependent students.The annual loan limits under the FSLS program, effective July 1,1993, are $4,000 for first and second year students, $5,000 for otherundergraduate students, and $10,000 for graduate students. FSLS
interest rates are the same as those on Federal ?LUS loans exceptwith an 11% cap.
DEFAULT DEFINITIONS
Some of the tables and graphs on the following pages provide data concerning the default rate on Federal
Family Education Loans. To promote understanding of the data, the following definitions are provided:
Matured Paper. Matured paper is equal to the net loans guaranteed minus in-school and in-grace loans.
Gross Default Rate. The gross default rate is equal to cumulative defaults paid to lenders divided by
cumulative matured paper.
Net Default Rate. The net default rate is equal to cumulative defaults paid to lenders minus
cumulative default collections divided by cumulative matured paper.
Recovery Rate. The recovery rate is equal to cumulative default collections divided by cumulative
defaults paid to lenders.
7 1 95

UHEM Annual Gross Guarantse VolumeFederal Stafford, PLUS and SLS Programs
Rscal Year Ending June 30
.
Year Dollar Amount
1979 15,923,554
1980 25,573,659
1981 38,954,075
1982 39,550,102
1933 39,718,048
1984 39,572,064
1935 44,550,010
1986 49,434,205
1987 51,962,901
1988 64,148,205
1989 77,818,228
1990 85,783,309
1991 100,379,776
1992 116,467,957
UHEM Cumulative Gross Guarantee VolumeFederal Stafford, PWS and SLS Programs
Racal Year Ending June 30
Year Dollar Amount
1979 17,867,798
1980 43,411,457
1981 80,395,532
1982 120,045,634
19.3 159,763,680
1984 199,335,744
1985 243,885,754
1986 293,319,959
1987 345,282,860
1988 409,429,066
1989 483,110,265
1990 568,893,574
1991 669,286,419
1992 785,740,973
Agure 1
UHEAA CUMULATIVE GROSS GUARANTEE VOLUME
Federal Stafford, PLUS and SLS Programs
79 80 81 82 83 84 b5 88 87 88 89 90 91 92
8
1 26
Figure 2

Federal
Stafford
Shpdent
Loan
Program
Federal
PLU
S
Program
Federal
SLS
Program
Federal
Consolidation
Loan
Program
TA
BL
E
5
UH
EM
GR
OS
S
GU
AR
AN
TE
ES
AN
NU
AL
VO
LUM
E
For
Each
Racal
Year
Ending
June
30
Num
ber
of Loans
Dollar
Am
ount
1978
805
$ 1,944,244
1979
6,992
15,923,554
1900
12,969
25,573,659
1981
33,593
36,954,075
1902
22,593
39,650,102
1983
18,813
39,823,454
1984
19,659
39,458,833
1985
20,731
43,866,491
1986
21,270
48.493,521
1987
23,554
50,795,877
1988
22,142
61,649,603
1989
25,229
70,115,989
1990
27,340
78,470,686
1991
31,152
90,834,792
1992
34,578
101,441,767
TO
TA
L
318
420
$ 74,479,364
1963
22
$ 47,296
1984
34 83,670
1985
77 203,465
1986
128
339,350
1987
122
332.651
1988
201
583,959
1989
300
884,405
1990
409
1,246,942
1991
881
2,703,773
1992
1,188
3,673,939
TO
TA
L
3 362=L
..=
$10,079,450
1983
1 $ 3,000
1984
28 76,857
1985
166
480,054
1986
228
601,334
1987
335
846,103
1988
650
1,929,681
1989
948
2,688,525
1990
1,267
3,620,734
1991
2,444
6,841,211
1992
4,075
11,M2251
TO
TA
L
10.161mmillimomm
28,439,750
1988
178
$ 2 L97,883
1989
285
:,923,8801990
337
4,758,842
1991
348
5,177,110
1992
472
7,042,012
TO
TA
L
91 2 7
$23,599,724,

1978 805 $ 1,944,2441979 6,992 15,923,5541980 12,969 25,573,6591981 33,593 36,954.075
1982 22,593 39,650,102
1983 18,836 39,670,750
1984 19,721 39,619,3601985 20,993 44,550,010
1986 21,626 49,434,2051987 21,011 51,974,631
1988 23,171 66,841,1231989 26,762 77,612,799
1990 29,353 88,097,2041991 34,825 105,556,886
1992 40,313 123,509,969
TOTAL 333 563 $806,912,571
1 93
10

UHEAA Gross GumanteesBy Lender
Focal Year Ending June 90, 1992%decal Stafford Loon Program
TABLE 6
LenderNumber of
LoansDollar
Amount
Percent ofibtal
Dollar Volume
America First Credit Union 1,883 5,067,926 5.00%
Barnes Banking Co. 137 375,965 0.37%
Community First Bank 72 181,656 0.18%
ESE Credit Union 8 26,305 0.03%
Runily First Credit Union 59 151,745 0.15%
First Interstate Bank 3,735 10,986,821 10.83%
First National Bank of layton 59 138,285 0.14%
First Security Bank 7,299 20,806,716 20.51%
Goldenwest Credit Union 218 537,185 0.53%
Granite District Credit Union 305 968,127 0.95%
Guardian State Bank 80 225,002 0.22%
Jordan Credit Union 117 330,006 0.33%
Key Bank of Utah 1,207 3,535,253 3.49%
Mountain America Credit Union 1,590 4,411,936 4.35%
National J.A.C.L. Credit Union 4 7,468 0.01%
Olympus Bank 561 1,869,036 1.84%
Ogden Govt Employees Credit Union 0 0 0.00%
Security National Life Insurance 1 2,500 0.00%
Southern Utah Credit Union 49 99,762 0.10%
Tooele Credit Union 71 198,185 0.20%
United Savings Bank 1,157 2,955,859 2.91%
Universal Campus Credit Union 3,271 11,121,362 10.96%
University of Utah Credit Union 1,217 4,059,004 4.00%
USU Community Credit Union 413 1,296,975 1.28%
Valley Bank 932 2,663,845 2.63%
Weber State College Credit Union 203 599,261 0.59%
West One Bank 497 1,443,191 1.42%
Zions First National Bank 9,433 27,382,391 26.99%
TOTAL ALL LENDERS 34,578 $101,441,767 100.00%
UHEAA Gross GuaranteesBy Lender
Ermal Year Ending June 30, 1992Federal Supplemental Loans for Students (SIS) Program
TABLE 7 Percent ofNumber of Dollar Ibtal
Lender Loans Amount Dollar %blume
America First Credit UnionFamily First Credit UnionFirst Interstate BankFirst Security BankGranite District Credit UnionGuardian State BankKey Bank of UtahMountain America Credit UnionOlympus BankTooele Cicdit UnionUnited Savings Bank
Universal Campus Credit UnionUSU Community Credit UnionValley Bank
West One Bank
Zions First National Bank
1 ') 9TOTAL ALL LENDERS. 4-
137 386,381 3.40%
4 9,363 0.08%
743 1,953,889 17.21%
593 1,673,395 14.74%
34 113,342 1.00%
7 26,615 0.23%
115 299,732 2.64%376 1,028,741 9.06%259 721,746 6.36%
3 10,173 0.09%
263 640,701 5.64%
299 861,292 7.59%
13 39,995 0.35%
110 301,379 2.65%
86 236,417 2.08%
1,033 3,049,090 26.86%
4,075 $11,352,251 100.00%
11

UHEAA Grows GornmbleirBy lender
lid Year ankh* June 30, 1992Federal PLUS lam Ptogram
TABLE 8
LenderNumber of
LoonsDollar
Amount
Percent ofibtal
Dollar Vohime
America First Credit Union 45 134,872 3.67%
Runi ly First Credit Union 1 865 0.02%
First Interstate Bank 228 730,583 19.89%
First Security Bank 211 670,631 18.25%
Granite District Credit Union 24 83,484 2.27%
Guardian State Bank 5 8,822 0.24%
Key Bank of Utah 26 84,412 2.30%
Mountain America Credit Union 70 219,825 5.98%
Olympus Bank 49 132,679 3.61%
Ogden Govt Employees Credit Union 3 9,500 0.26%
Tooele Credit Union 4 12,947 0.36%
United Savings Bank 73 198,372 5.40%
Universal Campus Credit Union 74 247,851 6.75%
USU Community Credit Union 1 1,660 0.05%
Valley Bank 34 102,821 2.80%
West One Bank 16 41,041 1.12%
Zions First National Bank 324 993,574 27.04%
TCrrAL ALL LENDERS 1,188 $3,673,939 100.00%
UHEAA Gross GuaranteesBy lender
Vocal Year Ending June 30, 1992Federal Staffixd, SIS and PLUS loan Programs
TABLE
Lender
9
Number ofLoans
DollarAmount
Percent ofibtal
Dollar Vohnne
America First Credit Union 2,065 5,589,179 4.80%
Barnes Banking Co. 137 375,965 0.32%
Community First Bank 72 181,656 0.16%
ESE Credit Union 8 26,305 0.02%
Family First Credit Union 64 161,973 0.14%
First Interstate Bank 4,706 13,671,293 11.74%
First National Bank of Layton 59 138,285 0.12%
First Security Bank 8,103 23,150,742 19.88%Goldenwest Credit Union 218 537,185 0.46%Granite District Credit Union 363 1,164,953 1.00%
Guardian State Bank 92 260,439 0.22%Jordan Credit Union 117 330,006 0.28%Key Bank of Utah 1,348 3,919,397 3.37%Mountain America Credit Union 2,036 5,660,502 4.86%National J.A.C.L. Credit Union 4 7,468 0.01%Olympus Bank 869 2,723,461 2.34%
Ogden Govt Employees Credit Union 3 9,500 0.01%Security National Life Insurance 1 2,500 0.00%
Southern Utah Credit Union 49 99,762 0.09%
Tooele Credit Union 78 221,305 0.19%
United Savings Bank 1,493 3,794,932 3.26%Universal Campus Credit Union 3,644 12,230,505 10.50%University of Utah Credit Union 1,217 4,059,004 3.49%USU Community Credit Union 427 1,338,630 1.15%
Valley Bank 1,076 3,068,045 2.63%
Weber State College Credit Union 203 599,261 0.51%
West One Bank 599 1,720,649 1.48%
Zions First National Bank 10,790 31,425,055 26.98%
TOTAL ALL LENDERS 39,841 116,467,957 100.00%
130 12

TABLE 10MEM Gross Oman Wee
Utah SchoolsFedeml Sta Nord Wan Program
Racal Year Ending June 30, 1992
&hoodsNumber of
LoansDollar
VolumePercent of
Doi Jar Volume
American Technical Center 37 95,812 0.09%
American insttute of Medical & Dental 160 348,898 0.34%
Beau La Rein College of Beauty Culture xi 63,400 0.06%
Bon Lose* Academy of Hair Artistry 58 149,048 0.15%
Brigham Young University 8,117 26,580,805 28.18%
Bryman School 767 1,920,089 1.89%
Certified Careers Institute 423 1,051,302 1.04%
College of Eastern Utah 242 484,565 0.48%
Continental College of Beauty 104 251,215 0.25%
Dixie College 493 1,099,397 1.08%
Evans Haltatyling College, St. George 11 28,750 0.03%
Evans Hairstyling College, Cedar City 10 24,225 0.02%
Evans Hairstyling College, Orem 3 6,890 0.01%
Fran Brown College of Beauty, Ogden 26 63,248 0.06%
Fran Brown College of Beauty, Layton 46 105,381 0.10%
Ha Wage College of Beauty, Murray 21 43,589 0.04%
Hairitage College of Beauty, WVC 22 47,025 0.05%
intermountain College/Court Reporting 47 109,893 0.11%
International Institute of Hair Design 86 187,054 0.18%
ITT Technical Institute 829 2,120,974 2.09%
LDS Business College 254 547,251, 0.54%
Logan Business College 5 13,125 0.01%
Mary Kawakami College of Beauty 13 30,787 0.03%
Painter's College of Beauty/Ogden. 0 0 0.00%
Painter's College of Beauty/Roy 2 5,245 0.01%
PC Technical insfitute 61 152,812 0.15%
Phillips College 839 2,079,442 2.05%
Provo College 62 134,566 0.13%
Salt Lake Community College 1,402 2,934,914 2.89%
Sevier Valley Area Vocational Center 70 169,411 0.17%
Snow College 328 548,648 0.54%
Southern Utah University 1,219 2,693,080 2.85%
Stacey's Hands of Champions 18 42,553 0.04%
Stevens Henager College - Ogden 335 809,573 0.80%
Stevens Henager College - Pmvo 233 555,844 0.55%
Universal Academy of Hair Design 22 48,593 0.05%
University of Utah 6,703 22,803,514 22.48%
University of Phoenix 641 2,636,934 2.60%
Utah Valley Communtty College 1,536 3,171,149 3.13%
Utah State University 3,606 10,371,711 10.22%
Utah School of Massage Therapy 163 379,610 0.37%
Von Curtis Academy (Provo) 70 174,382 0.17%
Von Curtis Academy (Salt Lake) 88 198,418 0.20%
Weber State Universtty 2,895 6,830,304 6.73%
Westminster College 977 3,282,036 3.24%TOTAL UTAH SCHOOLS 33,074 95,371,458 94.02%
TOTAL OUT OF STATE SCHOOLS 1,504 6,070,309 5.98%
GRAND TOTAL 34,578 101,441,767 100.00%
1 3 1
1 3
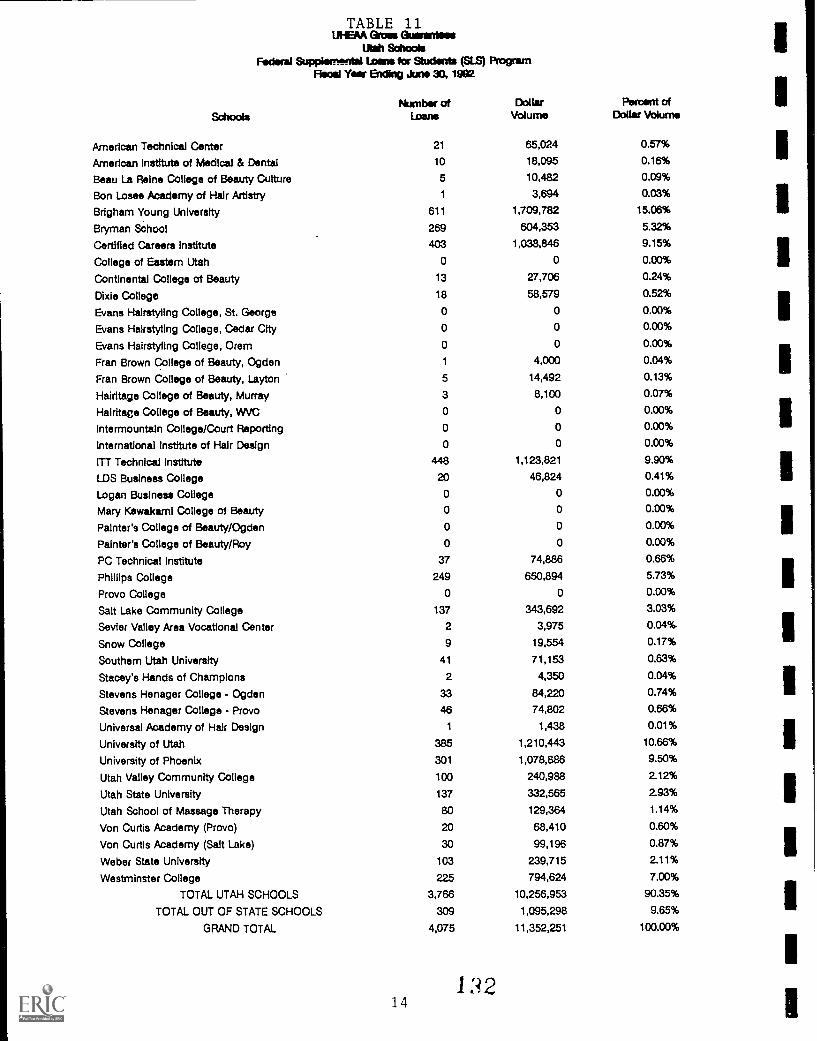
TABLE 11UHEAA Gross Guerrero's
Utith SchoolsFederal Supplemental them for Students (SLS) Program
Racal Year Ending June 30, 1992
SchoolsNumber of
LOOM
DollarVolume
Percent ofDollar Volume
American Technical Center 21 65,024 0.57%
American Institute of Medical & Dental 10 18,095 0.16%
Beau La Reins College of Beauty Culture 5 10,482 0.09%
Bon Lose* Academy of Hair Artistry 1 3,694 0.03%
Brigham Young University 611 1,709,782 15.06%
Bryman School 2E9 604,353 5.32%
Certified Careers institute 403 1,038,846 9.15%
College of Eastern Utah 0 0 0.00%
Continental College of Beauty 13 27,706 0.24%
Dixie College 18 58,579 0.52%
Evans Hairstyling College, St. George 0 0 0.03%
Evans Hairstyling College, Cedar City 0 0 0.00%
Evans Hairstyling College, Orem 0 0 0.00%
Fran Brown College of Beauty, Ogden 1 4,000 0.04%
Fran Brown College of Beauty, Layton 5 14,492 0.13%
Hairitage College of Beauty, Murray 3 8,100 0.07%
Hairitage College of Beauty, MC 0 0 0.00%
intermountain College/Court Reporting 0 0 0.00%
International Institute of Hair Design 0 0 0.00%
ITT Technical Institute 448 1,123,821 9.90%
LDS Business College 20 46,824 0.41%
Logan Business College 0 0 0.00%
Mary Kawakami College of Beauty 0 0 0.00%
Painter's College of Beauty/Ogden 0 0 0.00%
Painter's College of Beauty/Roy 0 0 0.00%
PC Technical Institute 37 74,886 0.66%
Phillips College 249 650,894 5.73%
Provo College 0 0 0.00%
Salt Lake Community College 137 343,692 3.03%
Sevier Valley Area Vocational Center 2 3,975 0.04%
Snow College 9 19,554 0.17%
Southern Utah University 41 71,153 0.63%
Stacey's Hands of Champions 2 4,350 0.04%
Stevens Henager College - Ogden 33 84,220 0.74%
Stevens Henager College - Provo 46 74,802 0.66%
Universal Academy of Hair Design 1 1,438 0.01%
University of Utah 385 1,210,443 10.66%
University of Phoenix 301 1,078,686 9.50%
Utah Valley Community College 100 240,988 2.12%
Utah State University 137 332,565 2.93%
Utah School of Massage Therapy 80 129,364 1.14%
Von Curtis Academy (Provo) 20 68,410 0.60%
Von Curtis Academy (Salt Lake) 30 99,196 0.87%
Weber State University 103 239,715 2.11%
Westminster College 225 794,624 7.00%
TOTAL UTAH SCHOOLS 3,766 10,256,953 90.35%
TOTAL OUT OF STATE SCHOOLS 309 1,095,298 9.65%
GRAND TOTAL 4,075 11,352,251 100.00%
1321 4
1
1

TABLE 12UHEAA Gross Oterarases
Utah SchoolsFederal PLUS Loan Program
Racal Year Ending June 30, 1902
SchoolsNumber of
LoansDollar
VolumePercent of
Dollar Volume
American Technical Center 3 10,000 0.27%American institute of Medical & Dental 11 18,385 0.50%Beau La Reins College of Beauty Culture 0 0 0.00%Bon Lose* Academy of Hair Artistry 0 0 0.00%Brigham Young University 240 798,258 21.73%Bryman School 70 174,280 4.74%Certified Careers institute 37 93,881 2.55%College of Eastern Utah 5 18,260 0.50%Continental College of Beauty 0 0 0.00%Dixie College 4 13,2C0 0.38%Evans Hairstyling College, St. George 0 0 0.00%Evans Hairstyling College, Cedar City 2 5,135 0.14%Evans Hairstyling College, oferrl 2 7,900 0.22%
Fran Brown College of Becuty, Ogden o o 0.00%Fran Brown College of Beauty, Layton 1 4,000 0.11%Ha tango College of Beauty, Murray 3 9,920 0.27%Hairitage College of Beauty, V1A/C o o 0.00%Intermountain College/Court Reporting 0 0 0.00%International Institute of Hair Design 1 3,295 0.09%ITT Technical institute 183 589,735 16.05%LDS Business College 1 3,000 0.08%Logan Business College 0 0 0.00%Mary Kawakarni College of Beauty 0 0 0.00%Painter's College of Beauty/Ogden 0 0 0.00%Painter's College of Beauty/Roy 0 0 0.00%PC Technical Institute 0 0 0.00%Phillips College 43 113,343 3.09%Provo College 4 11,350 0.31%Salt Lake Community College 15 40,616 1.11%Sevier Valley Area Vocational Center 0 0 0.00%Snow College 19 50,698 1.38%Southern Utah University 45 143,500 3.91%Stacey's Hands of Champions 1 4,000 0.11%Stevens Henager College - Ogden 40 125,894 3.43%Stevens Henager College - Provo 42 116,560 3.17%Universal Academy of Hair Design o 0 0.00%University of Utah 106 333,194
9.07%00%University of Phoenix o 0 0Utah Valley Community College 24 67,045 1.82%Utah State University 47 136,879 3.73%Utah School of Massage Therapy 6 9,688 0.26%Von Curtis Academy (Provo) 8 25,947 %01..7181%
Von Curtis Academy (Salt Lake) 13 43,481Weber State University 27 77,960 2.12%Westminster College 77 243,268 6.62%
TOTAL UTAH SCHOOLS 1,080 3,292,632 89.62%TOTAL OUT OF STATE SCHOOLS 108 381,307 10.38%
GRANO TOTAL 1,188 3,673,939 100.00%
1 3 3

TABLE 13UHEM Gross Guinn Ins
Utah ScbooksFederal Stafford, SLS and PLIJS than Programs
Food Y.
Schools
Endkig Jims 30, 1902
hkanber ofthins
DollarVolume
Percent ofDollar Volume
American Technical Center 61 170,836 0.15%
American Institute of Medical & Dental 181 383,358 0.33%
Beau La Reins College of Beauty Cutture 35 73,882 0.06%
Bon Loses Maderny of Hair Artistry 59 152,740 0.13%
Brigham Young University 8,903 29,068,845 24.96%
Bryman School 1,106 2,698,722 2.32%
Certified Careers Institute 863 2,184,009 1.88%
College of Eastern Utah 247 502,825 0.43%
Continental College of Beauty 117 278,921 0.24%
Dixie College 515 1,171,176 1.01%
Evans Hairstyling College, St. George 11 28,750 0.02%
Evans Hairstyling College, Cedar City 12 29,360 0.03%
Evans Hairstyling College, Orem 5 14,790 0.01%
Fran Brown College of Beauty, Ogden 27 67,246 0.06%
Fran Brown College of Beauty, Layton 52 123,873 0.11%
Halritage College of Beauty, Murray 27 61,609 0.05%
Hairitage College of Beauty, WVC 22 47,025 0.04%
Intermountain College/Court Reporting 47 109,893 0.09%
International Institute of Hair Design 87 190,349 0.16%
ITT Technical Institute 1,460 3,834,530 3.29%
LDS Business College 275 597,1775 0.51%
Logan Business College 5 13,125 0.01%
Mary Kawakami College of Beauty 13 30,787 0.03%
Painter's College of Beauty/Ogden o o 0.00%
Painter's College of Beauty/Roy 2 5,245 0.00%
PC Technical Institute sa 227,698 0.20%
Phillips College 1,131 2,843,679 2.44%
Provo College 66 145,916 0.13%
Salt Lake Community College 1,554 3,319,222 2.85%
Sevier Valley Area Vocational Center 72 173,386 0.15%
Snow College 356 618,900 0.53%
Southern Utah University 1,305 2,907,733 2.50%
Stacey's Hands of Champions 21 50,903 0.04%
Stevens Henager College - Ogden 408 1,019,687 0.88%
Stevens Henager College - Provo 321 747,206 0.64%
Universal Academy of Hair Design 23 48,031 0.04%
University of Utah 7,194 24,347,151 20.90%
University of Phoenix 942 3,715,820 3.19%
Utah Valley Community College 1,660 3,479,182 2.99%
Utah State University 3,790 10,841,155 9.31%
Utah School of Massage Therapy 249 518,662 0.45%
Von Curtis Academy (Provo) 98 268,739 0.23%
Von Curtis Academy (Salt Lake) 131 341,095 0.29%
Weber State University 3,025 7,147,979 6.14%
Westminster College 1,27? 4,319,928 3.71%
TOTAL UTAH SCHOOLS 37,920 108,921,043 93.52%
TOTAL UTAH & TOP VOL OUT OF STATE 1,921 7,546,914 6.48%
GRAND TOTAL 39,841 116,467,957 100.00%
1341 6

1
1
I Stafford Loan Default Rates (Gross)17
18
15
14
13E8 12
11
For the Year Ending September 30
10
12
g
8
83 84 85 88 87 88 89 90 91
Year
e
Logend
UHEAA
IIINational Average
Figure 3
1
Stafford Loan Default Rates (Net)
11.5
11
10.6
10
9.5
1
9 I
8.5 1
8
7.5
7
6.5
6
For the Year Ending September 30
83 84 85 88 87 isa
Year
89 90 91
vLegend
UHEAA
IIMak:mid Average
Figure
1 7

Stafford Loan Recovery Rates48
For the Year Ending September 30
Legend
UHEAA
IIINational Average
83 84 85 86 87 88 89 90 91
Year
Figure 5
1361 8

1
1
1
1
1
UTAH STATE BOARD OF REGENTSLOAN PURCHASE PROGRAM
The Student Loan Purchase Program was formed in 1977 for the purpose of making loans to,and purchasing the loans of, qualified students attending eligible institutions of higher education. TheProgram, which began operations in January 1179, provides a secondary market for student loanswhich are guaranteed by the Utah Higher Education Assistance Authority (UHEAA) and originated byUtah lenders.
At the present time, 28 Utah lenders are originating student loans guaranteed by UHEAA. Ofthese 28 lenders, 26 of them also participate in the Board's secondary market activities and generallyspeaking sell their loans to the Loan Purchase Program at or prior to the time the borrower leavesschool and begins repayment.
In October 1987, the Loan Purchase Program also began originating Consolidation Loanswhich provides a borrower with the opportunity to combine eligible types of outstanding student loandebts into one, new consolidation loan. Through a Consolidation Loan, a borrower is able to makea single monthly payment and can generally lower the amount of the monthly payment over theextended repayment period.
Following is a table of student loans purchased and originated by the Loan Purchase Programsince inception:
Year ConsolidationEnded Loans Loans
June 30 Purchased Orkilnated
1979 $ 21,320,674 $1980 25,048,0841981 3,984,4611982 21,366,1851983 48,340,9631984 40,475,2391985 18,773,1461986 32,062,7831987 29,581,2001988 30,241,627 2,671,6351989 35,549,411 3,956,9551990 38,570,030 4,776,9651991 54,916,532 5,226,0861992 54,168,658 7,012,094
TOTAL $ 454 398 993 $23,643,735
At June 30, 1992, the Loan Purchase Program's portfolio of student loans consisted of 55,347borrowers with an aggregate outstanding balance totaling $234,717,681. The student loan portfoliois financed through tax exempt student loan revenue bonds issued by the Board of Regents. At June30, 1992, there were $294,985,000 of bonds outstanding. These bonds are secured by the assets ofthe Program and are not liabilities of the State of Utah.
1 :3 719

G. F
hard
Info
rmat
ion
I
TAB GFINANCIAL INFORMATION
I
TABLE 1 USHE Revenue Trend Analysis 1976-77 through 1993-94Education and General 1
TABLE 2 USHE Mineral Lease Allocations 1986-87 through 1992-93 6
TABLE 3 University of Utah Tuition and Fee Revenue AnalysisSchool of Medicine 8
TABLE 4 U.S. Bureau of Labor Statistics Consumer Price Indexfor all Urban Consumers, U.S. City Average, All Items 9
TABLE 5 State of Utah General and Uniform School Fund Distribution 10
TABLE 6 Reimbursed Overhead Gross Receipts and Uses 1989-90 to 1993-94 11
TABLE 7 Summary of Current Funds, Revenues, Expendituresand Transfers 15
1 4 0

Utah System of Higher Education
Revenue Trend Analysis
For 1976-77 through 1993-94
Education and General
TABLE 1
Institution
University of Utah
General
Fund
Appropr-
ation
(1)
%
of
Total
Revenues
(2)
Tuition
And
Fees
(3)
%
of
Total
Revenues
(4)
Other
Operating
Revenue
(5)
%
of
Total
Revenues
(6)
Total
Revenues
(7)
1976-77 $39,884,950 72.24% $11,274,118 20.42% $4,051,376 7.34% $55,210,444
1977-78 45,288,148 74.784 11,906,463 19.66% 3,370,221 5.56% 60,564,832
1978-79 50,371,600 75.65% 11,947,069 17.94% 4,269,991 6.41% 66,588,660
1979-80 52,297,877 73.29% 13,068,770 18.31% 5,991,563 8.40% 71,358,210
1980-81 58,115,774 75.12% 15,390,741 19.89% 3,861,255 4.99% 77,367,770
1981-82 65,163,400 74.97% 17,140,050 19.72% 4,616,445 5.31% 86,919,895
1982-83 71,564,200 72.66% 18,935,356 19.22% 7,996,993 8.12% 98,496,549
1983-84 74,234,000 72.41% 20,458,281 19.96% 7,826,000 7.63% 102,518,281
1984-85 86,332,600 76.59% 21,770,570 19.31% 4,611,556 4.09% 112,714,726
1985-86 89,450,287 74.56% 23,243,560 19.37% 7,278,563 6.07% 119,972,410
1986-87 88,766,600 75.73% 25,457,174 21.72% 2,996,945 2.56% 117,220,719
1987-88 94,106,700 74.02% 25,941,874 20.41% 7,083,106 5.57% 127,131,680
1988-89 96,589,200 74.91% 27,501,268 21.33% 4,853,174 3.76% 128,943,642
1989-90 101,828,300 75.46% 30,453,192 22.57% 2,656,911 1.97% 134,938,403
1990-91 104,878,000 72.53% 33,997,083 23.51% 5,715,444 3.95% 144,590,527
1991-92 Actual 111,665,300 72.47% 38,096,428 24.73% 4,315,363 2.80% 154,077,091
1992-93 Budget 114,279,700 74.89% 38,206,300 25.04% 112,200 0.07% 152,598,200
1993-94 Requested 128,435,200 73.98% 45,066,800 25.96% 112,200 0.06% 173,614,200
Utah State University
1976-77 $17,833,550 71.20% $5,666,546 22.62% $1,546,369 6.17% 525,046,465
1977-78 20,040,288 71.99% 6,488,419 23.31% 1,307,053 4.70% 27,835,760
1978-79 22,424,200 73.31% 6,806,164 22.25% 1,356,390 4.43% 30,586,754
1979-80 23,860,608 71.64% 7,260,331 21.804 2,185,765 6.56% 33,306,704
1980-81 26,621,069 72.684 8,459,882 23.10% 1,544,942 4.22% 36,625,893
1981-82 29,591,900 72.00% 9.278,589 22.58% 2,227,500 5.42% 41,097,989
1982-83 32,777,121 72.48% 9,883,573 21.85% 2,562,732 5.67% 45,223,426
1983-84 34,053,600 72.01% 10,127,369 21.41% 3,111,872 6.58% 47,292,841
1984-85 40,492,200 76.20% 10,233,769 19.26% 2,415,172 4.544 53,141,141
1985-86 42,849,180 75.42% 10,475,331 18.44% 3,492,854 6.15% 56,817,365
1986-87 43,511,800 77.35% 11,331,864 20.14% 1,412,997 2.51% 56,256,661
1987-88 46,088,900 77.74% 11,347,377 19.14% 1,849,964 3.12% 59,286,241
1988-89* 46,622,100 76.16% 12,516,682 20.45% 2,075,652 3.39% 61,214,434
1989-90* 50,410,500 76.55% 14,343,875 21.78% 1,097,821 1.67% 65,852,196
1990-91* 52,846,700 73.96% 16,976,417 23.76% 1,630,470 2.284 71,453,587
1991-92 Actual* 57,058,000 72.10% 19,695,159 24.89% 2,381,998 3.01% 79,135,157
1992-93 Budget* 59,204,400 75.26% 19,000,900 24.15% 464,500 0.59% 78,669,800
1993-94 Requested* 67,914,800 73.69% 23,779,400 25.80% 464,500 0.504 92,158,700
*Includes Coop. Masters w/SUU
1 en

Utah System of Higher Education
Revenue Trend Analysis
For 1976-77 through 1993-94
Education and General
TABLE 1
Institution
Weber State University
General
Fund
Appropr-
ation
(1)
%
of
Total
Revenues
(2)
Tuition
And
Fees
(3)
%
of
Total
Revenues
(4)
Other
Operating
Revenue
(5)
%
of
Total
Revenues
(6)
Total
Revenues
(7)
1976-77 $11,802,300 74.31% $3,214,543 20.24% $865,686 5.45% $15,882,529
1977-78 13,957,840 78.02% 3,563,580 19.92% 369,802 2.07% 17,891,222
1978-79 15,559,400 78.69% 3,816,945 19.30% 396,922 2.01% 19,773,267
1979-80 16,046,409 75.05% 4,668,849 21.84% 666,570 3.12% 21,381,828
1980-81 18,383,250 75.04% 5,467,837 22.32% 647,617 2.64% 24,498,704
1981-82 20,289,400 75.56% 5,970,876 22.24% 590,756 2.20% 26,851,032
1982-83 22,403,160 73.50% 6,628,193 21.75% 1,449,243 4.75% 30,480,596
1983-84 23,570,100 75.05% 6,833,114 21.76% 1,001,762 3.19% 31,404,976
1984-85 27,366,100 76.76% 7,071,522 19.83% 1,215,322 3.41% 35,652,944
1985-86 28,465,173 74.79% 7,654,694 20.11% 1,941,109 5.10% 38,060,976
1986-87 28,146,000 73.35% 8,697,469 22.67% 1,526,865 3.98% 38,370,334
1987-88 29,840,400 72.11% 9,330,537 22.55% 2,209,071 5.34% 41,380,008
1988-89 30,396,300 68.58% 10,593,720 23.90% 3,331,540 7.52% 44,321,560
1989-90 31,770,300 64.16% 12,038,290 24.31% 5,712,395 11.54% 49,520,985
1990-91 34,703,600 62.71% 12,785,192 23.10% 7,849,461 14.18% 55,338,253
1991-92 Actual 36,344,400 63.02% 15,196,091 26.35% 6,132,734 10.63% 57,673,225
1992-93 Budget 37,515,400 70.06% 15,166,700 28.32% 864,800 1.62% 53,546,900
1993-94 Requested 42,547,500 69.30% 17,958,700 29.25% 892,900 1.45% 61,399,100
Southern Utah University
1976-77 $3,707,500 82.72% $669,600 14.94% $104,900 2.34% $4,482,000
1977-78 4,137,215 81.57% 790,491 15.59% 144,388 2.85% 5,072,094
1978-79 4,635,600 84.12% 832,300 15.10% 42,500 0.77% 5,510,400
1979-80 4,918,350 80.58% 974,396 15.96% 211,212 3.46% 6,103,958
1980-81 5,537,700 81.41% 1,122,700 16.50% 141,800 2.08% 6,802,200
'1981-82 6,206,500 81.80% 1,181,981 15.58% 199,051 2.62% 7,587,532
1982-83 6,916,226 81.00% 1,407,408 16.48% 215,269 2.52% 8,538,903
1983-84 7,193,400 79.49% 1,482,001 16.38% 374,041 4.13% 9,049,442
1984-85 8,262,200 80.11% 1,642,399 15.92% 409,144 3.97% 10,313,743
1985-86 8,767,895 79.28% 1,716,914 15.53% 574,027 5.19% 11,058,836
1986-87 8,688,200 78.30% 2,072,715 18.684 335,042 3.02% 11,095,957
1987-88 9,119,900 78.17% 2,169,394 18.59% 378,009 3.24% 11,667,303
1988-89 9,449,400 77.06% 2,426,433 19.79% 387,167 3.16% 12,263,000
1989-90 10,696,300 75.74% 2,977,679 21.09% 447,860 3.17% 14,121,839
1990-91 11,597,000 73.42% 3,497,018 22.14% 701,798 4.44% 15,795,816
1991-92 Actual 12,411,100 72.56% 3,994,190 23.354 698,140 4.084 17,103,430
1992-93 Budget 13,258,600 74.89% 4,153,400 23.46% 291,800 1.65% 17,703,800
1993-94 Requested 16,132,000 74.13% 5,323,400 24.46% 305,800 1.41% 21,761,200
2 1,121

Utah System of Higher Education
Revenue Trend Analysis
For 1976-77 through 1993-94
Education and General
TABLE 1
Institution
Snow College
General
Fund
Appropr-
ation
(1)
%
of
Total
Revenues
(2)
Tuition
And
Fees
(3)
%
of
Total
Revenues
(4)
Other
Operating
Revenue
(5)
%
of
Total
Revenues
(6)
Total
Revenues
(7)
1976-77 $1,776,750 85.25% $247,917 11.89% $59,616 2.86% $2,084,283
1977-78 2,105,945 86.85% 301,100 12.42% 17,800 0.73% 2,424,845
1978-79 2,524,300 88.92% 336,200 11.84% (21,800) -0.77% 2,838,700
1979-80 2,694,500 82.94% 427,000 13.14% 127,300 3.92% 3,248,800
1980-81 3,035,900 82.97% 559,000 15.28% 64,000 1.75% 3,658,900
1981-82 3,421,500 82.34% 683,274 16.44% 50,746 1.22% 4,155,520
1982-83 3,859,465 85.95% 624,184 13.90% 6,877 0.15% 4,490,526
1983-84 4,156,100 80.57% 745,872 14.46% 256,172 4.97% 5,158,144
1984-85 4,837,000 82.70% 755,361 12.91% 256,456 4.384 5,848,817
1985-86 4,965,102 84.17% 816,118 13.84% 117,480 1.99% 5,898,700
1986-87 4,965,100 82.03% 972,520 16.07% 115,067 1.90% 6,052,687
1987-88 5,203,900 76.62% 1,058,206 15.584 529,905 7.80% 6,792,011
1988-89 5,322,700 76.21% 1,156,542 16.56% 505,180 7.23% 6,984,422
1989-90 5,888,200 71.82% 1,593,757 19.44% 716,227 8.74% 8,198,184
1990-91 6,431,700 69.63% 1,755,407 19.00% 1,049,905 11.37% 9,237,012
1991-92 Actual 7,004,000 70.70% 2,113,629 21.34% 788,533 7.96% 9,906,162
1992-93 Budget 7,316,900 77.21% 2,011,600 21.23% 148,200 1.56% 9,476,700
1993-94 Requested 8,381,300 77.13% 2,326,500 21.41% 158,800 1.46% 10,866,600
Dixie College
1976-77 $1,879,000 78.03% $396,000 16.45% $133,000 5.52% $2,408,000
1977-78 2,119,995 78.61% 462,478 17.15% 114,427 4.24% 2,696,900
1978-79 2,496,700 82.98% 497,719 16.54% 14,503 0.48% 3,008,922
1979-80 2,682,705 81.06% 560,900 16.95% 65,893 1.99% 3,309,498
1980-81 3,095,489 80.93% 682,581 17.85% 46,930 1.23% 3,825,000
1981-82 3,448,400 80.20% 719,120 16.72% 132,280 3.08% 4,299,800
1982-83 3,793,986 79.56% 789,349 16.55% 185,492 3.89% 4,768,827
1983-84 3,966,800 79.37% 837,855 16.77% 192,978 3.86% 4,997,633
1984-85 4,493,400 78.94% 932,943 16.39% 266,133 4.684 5,692,476
1985-86 4,796,157 77.884 1,140,654 18.52% 221,302 3.59% 6,158,113
1986-87 5,211,900 75.79% 1,316,538 19.14% 348,431 5.07% 6,876,869
1987-88 5,453,600 73.51% 1,569,123 21.15% 396,470 5.34% 7,419,193
1988-89 5,656,500 68.84% 1,621,730 19.74% 938,592 11.42% 8,216,822
1989-90 6,257,000 69.22% 1,877,015 20.77% 905,203 10.01% 9,039,218
1990-91 6,706,400 70.53% 2,010,671 21.15% 791,026 8.32% 9,508,097
1991-92 Actual 7,359,800 73.54% 2,172,339 21.71% 475,726 4.75% 10,007,865
1992-93 Budget 7,798,200 76.61% 2,205,600 21.67% 175,000 1.72% 10,178,800
1993-94 Requested 9,244,600 76.82% 2,607,100 21.66% 182,500 1.52% 12,034,200
1 3

Utah System of Higher Education
Revenue Trend Analysis
For 1976-77 through 1993-94
Education and General
TABLE 1
Institution
College of Eastern Utah
General
Fund
Appropr-
ation
(1)
%
of
Total
Revenues
(2)
Tuition
And
Fees
(3)
%
of
Total
Revenues
(4)
Other
Operating
Revenue
(5)
%
of
Total
Revenues
(6)
Total
Revenues
(7)
1976-77 $1,444,000 88.71% $168,480 10.35% $15,374 0.94% $1,627,854
1977-78 1,629,525 84.69% 232,027 12.06% 62,637 3.26% 1,924,189
1978-79 1,897,900 84.19% 222,293 9.86% 134,163 5.95% 2,254,356
1979-80 2,072,725 83.26% 272,481 10.95% 144,110 5.79% 2,489,316
1980-81 2,389,672 85.44% 332,110 11.87% 75,205 2.69% 2,796,987
1981-82 2,656,100 84.26% 376,654 11.95% 119,451 3.79% 3,152,205
1982-83 2,914,177 83.66% 413,720 11.88% 155,344 4.46% 3,483,241
1983-84 3,058,530 83.72% 442,776 12.12% 151,976 4.16% 3,653,282
1984-85 3,692,700 84.39% 479,862 10.97% 203,418 4.65% 4,375,980
1985-86 3,786,651 76.74% 550,395 11.15% 597,090 12.10% 4,934,136
1986-87 4,013,700 83.64% 623,071 12.984 161,798 3.37% 4,798,569
1987-88 4,145,774 83.96% 627,711 12.71% 164,235 3.33% 4,937,720
1988-89 4,307,400 80.09% 681,249 12.67% 389,365 7.24% 5,378,014
1989-90 4,862,900 79.65% 816,600 13.38% 425,578 6.97% 6,105,078
1990-91 5,262,801 76.55% 954,295 13.884 657,549 9.56% 6,874,645
1991-92 Actual 5,719,700 77.54% 1,140,636 15.46% 515,728 6.99% 7.376,064
1992-93 Budget 5,890,400 82.47% 1,115,043 15.61% 137,357 1.92% 7,142,800
1993-94 Requested 6,783,400 81.71% 1,377,343 16.59% 141,257 1.70% 8,302,000
Utah Valley Community College
1976-77 $3,463,500 70.65% 987,299 20.14% $451,508 9.21% 4,902,307
1977-78 4,441,140 76.63% 1,123,528 19.39% 230,864 3.98% 5,795,532
1978-79 5,286,000 74.79% 1,291,200 18.27% 491,000 6.95% 7,068,200
1979-80 5,436,500 72.85% 1,473,800 19.75% 552,500 7.40% 7,462,800
1980-81 6,206,500 71.70% 1,904,800 22.00% 545,100 6.30% 8,656,400
1981-82 7,054,100 68.61% 2,285,000 22.23% 942,100 9.16% 10,281,200
1982-83 7,671,400 67.43% 2,952,500 25.95% 753,600 6.62% 11,377,500
1983-84 7,997,700 66.53% 3,298,200 27.44% 725,800 6.04% 12,021,700
1984-85 9,963,500 71.925; 3,393,900 24.50% 496,700 3.59% 13,854,100
1985-86 10,723,475 69.63% 3,833,824 24.89% 842,982 5.47% 15,400,281
1986-87 10,716,500 67.11% 4,594,125 28.77% 657,127 4.12% 15,967,752
1987-88 11,162,400 66.46% 4,853,938 28.90% 780,088 4,64% 16,796,426
1988-89 11,658,900 64.36% 5,283,565 29.17% 1,172,715 6.47% 18,115,180
1989-90 12,771,900 61.64% 6,451,749 31.14% 1,496,373 7.22% 20,720,022
1990-91 14,143,600 62.93% 7,203,145 32.05% 1,127,114 5.02% 22,473,859
1991-92 Actual 15,406,900 61.06% 8,763,620 34.73% 1,059,831 4.20% 25,230,351
1992-93 Budget 16,121,200 61.03% 9,660,600 36.57% 634,700 2.40% 26,416,500
1993-94 Requested 18,762,300 62.26% 10,731,100 35.61% 641,100 2.13% 30,134,500
41 4 4

Utah System of Higher Education
Revenue Trend Analysis
For 1976-77 through 1993-94
Education and General
TABLE 1
Institution
Salt Lake Community College
General
Fund
Appropr-
ation
(1)
4
of
Total
Revenues
(2)
Tuition
And
Fees
(3)
%
of
Total
Revenues
(4)
Other
Operating
Revenue
(5)
4
of
Total
Revenues
(6)
Total
Revenues
(7)
1976-77 $4,618,244 71.14% $1,104,079 17.01% $769,067 11.85% $6,491,390
1977-78 5,418,973 75.02% 1,248,703 17.29% 555,899 7.70% 7,223,575
1978-79 6,129,500 75.27% 1,324,105 16.26% 689,455 8.47% 8,143,060
1979-80 6,386,840 74.98% 1,484,515 17.43% 646,509 7.59% 8,517,864
1980-81 7,144,570 74.65% 1,886,627 19.71% 539,687 5.64% 9,570,884
1981-82 7,993,800 71.71% 2,443,899 21.92% 709,659 6.37% 11,147,358
1982-83 8,733,458 71.55% 3,156,209 25.86% 317,266 2.60% 12,206,933
1983-84 9,067,900 64.42% 3,820,183 27.14% 1,187,612 8.44% 14,075,695
1984-85 11,357,200 68.97% 3,865,028 23.47% 1,244,352 7.56% 16,466,580
1985-86 12,219,717 65.484 4,606,272 24.68% 1,834,593 9.83% 18,660,582
1986-87 12,427,200 64.98% 5,303,588 27.73% 1,393,819 7.29% 19,124,607
1987-88 13,077,200 64.84% 5,478,241 27.16% 1,613,000 8.00% 20,168,441
1988-89 14,033,500 60.50% 6,422,103 27.69% 2,740,458 11.81% 23,196,061
1989-90 16,206,100 60.284 8,139,381 30.28% 2,537,512 9.44% 26,882,993
1990-91 20,582,500 60.66% 9,934,868 29.28% 3,411,497 10.05% 33,928,865
1991-92 Actual 24,492,400 58.45% 12,611,867 30.10% 4,797,270 11.45% 41,901.537
1992-93 Budget 25,698,000 70.25% 10,073,400 27.54% 807,600 2.21% 36,579,000
1993-94 Requested 31,064,700 70.31% 12,274,700 27.784 842,400 1.91% 44,181,800
Nine Institution Total
1976-77 $86,409,794 73.14% $23,728,582 20.09% $7,996,896 6.77% 118,135,272
1977-78 $99,139,069 75.43% $26,116,789 19.87% $6,173,091 4.70% 131,428,949
1978-79 $111,325,200 76.37% $27,073,995 18.57% $7,373,124 5.06% 145,772,319
1979-80 $116,396,514 74.05% $30,191,042 19.21% $10,591,422 6.74% 157,178,978
1980-81 $130,529,924 75.10% $35,806,278 20.60% $7,466,536 4.30% 173,802,738
1981-82 $145,825,100 74.59% $40,079,443 20.50% $9,587,988 4.90% 195,492,531
1982-83 $160,633,193 73.33% $44,790,492 20.45% $13,642,816 6.23% 219,066,501
1983-84 $167,298,130 72.684 $48,045,651 20.87% $14,828,213 6.44% 230,171,994
1984-85 $196,796,900 76.26% $50,145,354 19.43% $11,118,253 4.31% 258,060,507
1985-86 $206,023,637 74.39% $54,037,762 19.51% $16,900,000 6.10% 276,961,399
1986-87 $206,447,000 74.86% $60,369,064 21.89% $8,948,091 3.24% 275,764,155
1987-88 $218,198,774 73.82% $62,376,401 21.10% $15,003,848 5.08% 295,579,023
1988-89 $224,036,000 72.59% $68,203,292 22.10% $16,393,843 5.31% 308,633,135
1989-90 $240,691,500 71.77% $78,691,538 23.46% $15,995,880 4.77% 335,378,918
1990-91 $257,152,301 69.65% $89,114,096 24.14% $22,934,264 6.21% 369,200,661
1991-92 Actual $277,461,600 68.95% $103,783,959 25.79% $21,165,323 5.26% 402,410,882
1992-93 Budget $287,082,800 73.184 $101,593,543 25.90% $3,636,157 0.93% 392,312,500
1993-94 Requested $329,265,800 72.45% $121,445,043 26.72% $3,741,457 0.82% 454,452,300

TABLE 2111
Utah System of Higher Education
Mineral Lease Allocations
for Fiscal Years 1986-87 through 1992-93
Institutions 1986-87 1987-88 1988-89 1989-90 1990-91 1991-92 1992-93
Budget
University of Utah
Formula Allocation
Mineral Lease Research 1,847,114 1,802,330 1,862,200 1,892,500 1,914,600 1,988,000 1,970,500
Discretionary
Fossil Fuel Research 0 0 o 0 0 0 0
One-Time Suplemental
Education and General 0 0 294,300 o 0 0 0
KUED/County Translator 0 0 259,400 360,000 0 0 0
Mineral Lease Research 0 0 556,000 0 0 0 0
Total, U of U 1,847,114 1,802,330 2,971,900 2,252,500 1,914,600 1,988,000 1,970,500
Utah State University
Formula Allocation
Mineral Lease Research 973,478 967,617 1,003,200 1,057,900 1,092,900 1,188,500 1,215,600
Discretionary
Uintah Basin 0 0 0 0 0 0 0
Water Res. !.ati. 467,360 638,179 849,663 945,205 646,838 641,745 663,800
Ground Water Res. 0 o 0 0 0 0 0
Agricultural Exper. Stn. 0 0 0 0 0 0 0
One-Time Suplemental
Education and General 0 0 159,500 0 0 0 0
Mineral Lease Research 0 0 500,000 0 0 0 0
Total, USU 1,440,838 1,605,796 2,512,383 2,003,105 1,739,738 1,830,245 1,879,400
Weber State University
Formula Allocation
Education and General 648,280 674,948 716,300 754,300 782,900 805,900 814,200
One-Time Suplemental
Education and General 0 0 94,700 0 0 0 0
Total, WSC 648,280 674,948 811,000 754,300 782,900 805,900 814,200
Southern Utah University
Formula Allocation
Education and General 178,411 200,757 212,500 230,400 239,700 267,500 275,300
One-Time Suplemental
Education and General 0 0 32,100 0
Total, SUSC 178,411 200,757 244,600 230,400 239,700 267,500 275,300
Snow College
Formula Allocation
Education and General 86,372 91,369 96,000 109,500 126,100 137,500 148,200
One-Tire Suplemental
Education and General 0 0 23,100 0
Total, Snow 86,372 91,369 119,100 109,500 126,100 137,500 148,200
Dixie College
Formula Allocation
Education and General 124,381 137,801 139,900 143,500 155,400 167,700 171,000
One-Time Suplemental
Education and General 0 0 38,000 0 0 0 0
Total, Dixie 124,381 137,801 177,900 143,500 155,400 167,700 171,000
6

TABLE 2
Utah System of Higher Education
Mineral Lease Allocations
for Fiscal Years 1986-87 through 1992-93
Institutions
College of Eastern Utah
Formula Allocation
1986-87 1987-88 1988-89 1989-90 1990-91 1991-92 1992-93
Budget
Education and General 86,145 98,800 98,900 109,500 110,800 131,000 126,100
Discretionary
Education and General 0 0 0 0 0 0 0
One-Time Suplemental
Education and General 0 0 275,000 0 0 0 0
San Juan Center 0 0 9,300 0 0 0 0
Prehistoric Museum 0 0 0 100,000 0 0 0
Total, CEU 86,145 98,800 383,200 209,500 110,800 131,000 126,100
Utah Valley Community College
Formula Allocation
Education and General 370,197 389,178 409,300 424,200 456,800 450,100 501,200
One-Time Suplemental
Education and General 0 0 35,800 0 0 0 0
Total, UVCC 370,197 389,178 445,100 424,200 456,800 450,100 501,200
Salt Lake Community College
Formula Allocation
Education and General 432,237 436,956 471,700 508,600 591,800 668,500 762,600
One-Time Suplemental
Education and General 0 0 91,300 0 0 0 0
Total, SLCC 432,237 436,956 563,000 508,600 591,800 668,500 762,600
State Board of Regents
One-Time Suplemental
Administration 0 0 22,400 * 0 0 0 0
Total
Formula Allocation 4,746,615 4,799,756 5,010,000 5,230,400 5,471,000 5,804,700 5,984,700
Discretionary 467,360 638,179 849,683 945,205 646,838 641,754 663.800
One-Time Suplemental 0 0 2,390,900 460,000 0 0 0
Total 5,213,975 5,437,935 8,250,583 6,635,605 6,117,838 6,446,454 6,648,500
*Not Included in 1990-91 Appropriated Operating Budget Book

TABLE 3
University of Utah
Tuition and Fee Revenue Analysis
School of Medicine
1991-92, 1992-93 and 1993-94
Tuition and Fees
Actual 1991-92
Total
Students Tuition Revenue
Budget 1992-93
Total
Students Tuition Revenue
SBR Request 1993-94----
Est. Est. Total
Students Tuition Revenue
Resident Students 345.51 $5,190 $1.793,216 325.00 $5,502 $1,788,150 325.00 $5,887 $1,913,300
Nonresident Students 11.33 11,229 127,225 32.00 12,141 $388,512 32.00 12,991 415,700
WICHE Students:
Resident Fees 18.00 5,190 93,420 43.00 5,502 $236,586 43.00 5,887 253,140
WICHE Fee 22,800 410,400 22,800 980,400 22,800 980,400
Wyoming Student-Non Resident Fees 21.00 11,229 235,809 0.00 0 0 0.00 0 0
Physician Assistant Program
Resident Students 33.00 5,565 183,645 0.00 0 0 0.00 0 0
Nonresident Students 15.13 6,417 97,107 0.00 0 0 0.00 0 0
Masters & Doctoral Student Fees 268,500 346,200 418,650
Other Miscellaneous Fees 22,840 18,952 19,000
Total Tuition and Fees 443.97 $3,232,162 400.00 $3,758,800 400.00 $4,000,200
Tuition and Fees
Tuition and Fee Revenue Analysis
Regional Dental Education Program
1991-92, 1992-93 and 1993-94
Actual 1991-92 Budget 1992-93
Total Total
Students Tuition Revenue Students Tuition Revenue Students Tuition
SBR Request 1993-94----
Total
Revenue
Tuition paid to the U of U 10.00 5,406 54,060 10.00 5,490 54,900 10.00 5,875 58,750
8
1 48

U.S. Bureau of Labor Statistics
Consumer Price Index for all Urban Consumers
U. S. City Average, All Items
(1982-84 - 100)
Year Jan. Feb. March April May June July Aug. Sept. Oct. Nov. Dec.
1967 32.9 32.9 33.0 33.1 33.2 33.3 33.4 33.5 33.6 33.7 33.8 33.9
1968 34.1 34.2 34.3 34.4 34.5 34.7 34.9 35.0 35.1 35.3 35.4 35.5
1969 35.6 35.8 36.1 36.3 36.4 36.6 36.8 37.0 37.1 37.3 37.6 37.7
1970 37.8 38.0 38.2 38.5 38.6 38.8 39.0 39.0 39.2 39.4 39.6 39.8
1971 39.8 39.9 40.0 40.1 40.3 40.6 40.7 40.8 40.8 40.9 40.9 41.1
1972 41.1 41.3 41.4 41.5 41.6 41.7 41.9 42.0 42.1 42.3 42.4 42.5
1973 42.6 42.9 43.3 43.6 43.9 44.2 44.3 45.1 45.2 45.6 45.9 46.2
1974 46.6 47.2 47.8 48.0 48.6 49.0 49.4 50.0 50.6 51.1 51.5 51.9
1975 52.1 52.5 52.7 52.9 53.2 53.6 54.2 54.3 54.6 54.9 55.3 55.5
1976 55.6 55.8 55.9 56.1 56.5 56.8 57.1 57.4 57.6 57.9 58.0 58.2
1977 58.5 59.1 59.5 60.0 60.3 60.7 61.0 61.2 61.4 61.6 61.9 62.1
1978 62.5. 62.9 63.4 63.9 64.5 65.2 65.7 66.0 66.5 67.1 67.4 67.7
1979 68.3 69.1 69.8 70.6 71.5 72.3 73.1 73.8 74.6 75.2 75.9 76.7
1980 77.8 78.9 80.1 81.0 81.8 82.7 82.7 83.3 84.0 84.8 85.5 86.3
1981 87.0 87.9 88.5 89.1 89.8 90.6 91.6 92.3 93.2 93.4 93.7 94.0
1982 94.3 94.6 94.5 94.9 95.8 97.0 97.5 97.7 97.9 98.2 98.0 97.6
1983 97.8 97.9 97.9 98.6 99.2 99.5 99.9 100.2 100.7 101.0 101.2 101.3
1984 101.9 102.4 102.6 103.1 103.4 103.7 104.1 104.5 105.0 105.3 105.3 105.3
1985 105.5 106.0 106.4 106.9 107.3 107.6 107.8 108.0 108.3 108.7 109.0 109.3
1986 109.6 109.3 108.8 108.6 108.9 109.5 109.5 109.7 110.2 110.3 110.4 110.5
1987 111.2 111.6 112.1 112.7 113.1 113.5 113.8 114.4 115.0 115.3 115.4 115.4
1988 115.7 116.0 116.5 117.1 117.5 118.0 118.5 119.0 119.8 120.2 120.3 120.5
1989 121.1 121.6 122.3 123.1 123.8 124.1 124.4 124.6 125.0 125.6 125.9 126.1
1990 127.4 128.0 128.7 128.9 129.2 129.9 130.4 131.6 132.7 133.5 133.8 133.8
1991 134.6 134.8 135.0 135.2 135.6 136.0 136.2 136.6 137.2 137.4 137.8 137.9
1992
TABLE 4
Yearly --% Increase--
Ave. Dec Ann Ave
33.4 3.1% 3.1%
34.8 4.7% 4.3%
36.7 6.2% 5.5%
38.8 5.6% 5.8:
40.5 3.3% 4.3%
41.8 3.4% 3.3%
44.4 8.7% 6.2%
49.3 12.3% 11.1%
53.8 6.9% 9.1%
56.9 4.9% 5.7%
60.6 6.7% 6.5%
65.2 9.0% 7.6%
72.6 13.3% 11.3%
82.4 12.5% 13.5%
90.9 8.9% 10.3%
96.5
99.6
103.9
107.6
109.6
3.8%
3.84
3.9%
3.84
1.1%
6.1%
3.2%
4.3%
3.5%
1.9%
113.6 4.4% 3.7%
118.3 4.4% 4.1%
124.0 4.6% 4.8%
130.7 6.1% 5.4%
136.2 3.1% 4.2%
3.3% 3.1%
Est. Est.
138.1 138.6 139.3 139.5 139.7 140.2 140.5 140.9 141.3 141.8 142.0 142.4 140.4
Est. Est.

Table 5
State of Utah
General and Uniform School Fund*
Percentage Distribution
Actual
1984-85
Actual
1985-86
Actual
1986-87
Actual
1987-88
Actual Actual
1988-89 1989-90
Actual
1990-91
Actual
1991-92
Initial
1992-93
Business, Labor, and 1.36% 1.30% 1.21% 1.10% 1.04% 1.06% 1.07% 0.64% 0.63%
Agriculture
Community and Economic 1.81% 1.24% 1.23% 1.46% 1.32% 1.66% 1.39% 1.25% 1.32%
Development
Corrections 3.78% 4.20% 4.39% 4.85% 4.59% 4.81% 5.15% 5.30% 5.36%
Courts 1.68% 1.91% 2.10% 2.06% 2.28% 2.53% 2.55% 2.62% 2.71%
Elected Officieals 0.73% 0.77% 0.78% 0.72% 0.81% 0.94% 0.82% 0.91% 0.83%
Environmental Quality# N/A N/A N/A N/A N/A 0.42% 0.40% 0.40% 0.39%
Government Operations 2.64% 2.48% 2.81% 2.73% 2.27% 2.37% 2.24% 2.35% 2.40%
Health# 4.49% 4.60% 4.51% 4.77% 4.50% 4.57% 4.94% 5.19% 5.59%
Higher Education 17.67% 19.04% 19.05% 18.58% 17.54% 18.00% 17.50% 17.65% 17.78%
Health Services 6.68% 7.35* 7.51% 7.29% 6.83% 6.61% 6.93% 7.02% 7.17%
Legislature 0.42% 0.43% 0.43% 0.41% 0.41% 0.39% 0.41% 0.41% 0.43%
National Guard 0.10% 0.12% 0.12% 0.12% 0.12% 0.11% 0.11% 0.11% 0.10%
Natural Resources 1.45% 1.45% 1.49% 1.55% 1.33% 1.37% 1.34% 1.18% 1.12%
Public Education 42.24% 47.66% 49.55% 48.98% 46.39% 47.65% 47.80% 48.34% 48.37%
Public Safety 1.49% 0.884 0.52% 0.53% 0.46% 0.86% 1.18% 1.32% 1.37%
Transportation 0.264 0.07% 0.08% 0.07% 0.85% 0.064 0.04% 0.04% 0.06%
Subtotal: Operations Bu 86.79% 93.49% 95.79% 95.22% 90.73% 93.44% 93.87% 94.72% 95.64%
Capital Budget 4.95% 1.29% 0.30% 1.01% 3.50% 2.51% 2.31% 2.06% 1.16%
Debt Service 4.02% 2.52% 3.92% 3.69% 3.91% 3.69% 3.45% 2.884 2.97%
Flooding 4.23% 2.70% 0.00% 0.00% 0.00% 0.00% 0.00% 0.00% 0.00%
Thrift Settlement 0.00% 0.00% 0.00% 0.00% 1.65% 0.00% 0.00% 0.00% 0.00%
State Insurance Fund 0.001; 0.00% 0.00% 0.07% 0.00% 0.00% 0.00% 0.00% 0.00%
Hazardous Waste 0.00% 0.00% 0.00% 0.00% 0.20% 0.00% 0.00% 0.00% 0.00%
Other 0.00% 0.00% 0.00% 0.00% 0.00% 0.36% 0.37% 0.33% 0.23%
Total 100.00% 100.00% 100.00% 100.00% 100.00% 100.00% 100.00% 100.00% 100.00%
*Sources: Exec. Budget lecommendations FY 1993 and 1994
Budget In Brief: 1986-87, 1987-88, 1988-89
#Beginning 1990-91 Enivornmental Quality Separated from Health
10 5

Table 6
Reimbursed Overhead Gross Receipts and Uses 1989-90 1990-91 1991-92 1992-93 1993-94
Actual Actual Actual Budget Request
UNIVERSITY OF UTAH
Carryforward N/A $2,458,345 $4,299,996 $7,781,845 $2,408,985
Gross Receipts & Carryforward $21,079,152 $21,067,794 $23,514,952 $24,000,000 $25,000,000
Total Funds Available $21,079,152 $23,526,139 $27,814,948 $31,781,845 $27,408,985
Uses of Reimbursed Overhead
Development of New Res. Funding $3,219,557 $3,625,314 $4,247,827 $10,067,100 $10,310,000
Research Equipment Replacement $1,650,000 $1,650,000 $1,650,000 $750,000 $750,000
Recruiting/Lab Set-ups For New Fac. $1,551,803 $2,372,757 $2,034,087 $484,500 $80,000
Retention of Key Researchers $1,319,840 $1,696,600 $615,746 $231,660 $148,000
Research Labs Remodeling $780,229 $600,000 $660,000 $1,725,000 $1,100,000
Capital Facilities $1,894,000 $1,764,000 $1,690,000 $3,200,000 $3,200,000
Programmatic Support $4,627,383 $5,126,541 $5,290,288 $9,031,600 $6,738,100
0 & M - New Facilities $50,000 $80,000 $40,000 $0 $0
Other:
Henry Eyring Endowed Chair $24,400 $0 $1,250,000 $1,250,000
Other Research Needs $0 $79,834 $0 $0
Reserve for Disallowances $200,000 $200,000 $200,000 $200,000
Management Information Systems $400,000 $400,000 $0 $0
St. Marks Hospital-Leased Space $389,374 $307,184 $443,000 $460,000
Research Park-Leased Space $1,304,264 $1,323,913 $1,715,155 $1,813,000
School of Medicine-Dedicated Credit $250,000 $0 $0 $0
Retained in Dedicated Credits $721,800 $0 $0 $0
Grad. Fellowships - Engineering $35,000 $50,000
Mass Spec Maint Contract, Chem $10,000 $10,000
Waste Compactor / Vial Crusher $52,000 $0
Grad Student Stipends, Science $100,000 $100,000
Total Otfier $3,289,838 $2,310,931 $3,805,155 $3,883,000 $3,927,000
Total Uses of Reinibursed Overhead $18,382,650 $19,226,143 $20,033,103 $29,372,860 $26,253,100
Carryforward N/A $4,299,996 $7,781,845 $2,408,985 $1,155,885
UTAH STATE UNIVERSITY
Carryforward N/A $4,408,333 $4,660,419 $3,579,988 $3,245,000
Gross Receipts & Carryforward $7,370,694 $8,318,026 $8,869,961 $8,900,000 $9,000,000
Total Funds Available $7,370,694 $12,726,359 $13,530,380 $12,479,988 $12,245,000
Uses of Reimbursed Overhead
Development of New Res. Funding $2,721,492 $2,924,853 $4,855,080 $3,927,504 $4,000,000
Research Equipment Replacement $1,290,000 $784,447 $1,488,785 $1,412,196 $1,500,000
Recruiting/Lab Set-ups For New Fac. $392,109 $177,503 $816,337 $966,963 $960,000
Retention of Key Researchers $500,000 $825,063 $0 $0 $0
Research Labs Remodeling $724,866 $820,515 $140,280 $300,000 $300,000
Capital Facilities $220,000 $1,058,368 $1,082,744 $957,000 $955,000
Programmatic Support $508,877 $525,705 $602,409 $590,000 $530,000
0 & M - New Facilities $99,865 $46,797 $0 $0 $0
Other:
Reserve for Disallowances $12,249 $53,000 $53,000 $53,000 $53,000
Management Information Systems $115,000 $115,000 $115,000 $115,000 $115,000
Safety Office $335,694 $350,800 $422,951 $360,000 $360,000
Contracts and Grants Office $237,942 $248,649 $294,899 $473,000 $475,000
Accounting, Purchasing & Maint. $72,000 $75,240 $78,907 $80,325 $81,000
Retained in Dedicated Credits $140,600 $0 $0 $0 $0
Other $0 $60,000 $0 $0 $0
lotal Other $913,485 $902,689 $964,757 $1,081,325 $1,084,000
Total Uses of Reimbursed Overhead $7,370,694 $8,065,940 $9,950,392 $9,234,988 $9,329,000
Carryforward N/A $4,660,419 $3,579,988 $3,245,000 $2,916,000

Reimbursed Overhead Gross Receipts and Uses
WEBER STATE UNIVERSITY
1989-90
Actual
1990-91
Actual
1991-92
Actual
1992-93
Budget
Table
1993-94
Request
Carryforward N/A $120,132 $132,017 $129,729 $10,435
Gross Receipts & Carryforward $166,985 $136,378 $124,756 $130,000 $130,000
Total Funds Available $166,985 $256,510 $256,773 $259,729 $140,435
Uses of Reimbursed Overhead
Development of New Res. Funding $88,818 $110,922 $90,481 $73,000 $53,000
Programmatic Support $20,616 $12,259 $19,749 $30,000 $30,000
Other:
Academic Support-Seed Money $23,451 $1,312 $16,814 $146,294 $57,435
Computer Time & Effort Maintenance $20,300 $0 $0 $0 $0
Reserve for Disallowances $13,000 $0 $0 $0 $0
Retained in Dedicated Credits $800 $0 $0 $0 $0
Total Other $57,551 $1,312 $16,814 $146,294 $57,435
Total Uses of Reimbursed Overhead $166,985 $124,493 $127,044 $249,294 $140,435
Carryforward N/A $132,017 $129,729 $10,435 $0
SOUTHERN UTAH UNIVERSITY
Carryforward $28,202 $55,678 $51,231 $60,531 $42,531
Gross Receipts & Carryforward $77,871 $78,681 $94,521 $80,000 $80,000
Total Funds Available $106,073 $134,359 $145,752 $140,531 $122,531
Uses of Reimbursed Overhead
Development of New Res. Funding $49,295 $83,128 $85,221 $98,000 $80,000
Retained'in Dedicated Credits $1,100 $0 $0 $0 $0
Carryforward $55,678 $51,231 $60,531 $42,531 $42,531
SNOW COLLEGE
Carryforward $11,929 $20,732 $0 $5,467 $467
Gross Receipts & Carryforward $22,152 $27,231 $38,499 $35,000 $38,000
Total Funds Available 134,081 $47,963 $38,499 $40,467 $38,467
Uses of Reimbursed Overhead
Programmatic Support $549 $0 $0 $0 $0
Other:
Scholarships $10,000 $47,963 $0 $0 $0
Faculty Development $1,200 $0 $33,032 $40,000 $38,000
Dixie College $0 $0 $0 $0 $0
College of Eastern Utah $1,000 $0 $0 $0 $0
Retained in Dedicated Credits $600 $0 $0 $0 $0
Total Other $12,800 $47,963 $33,032 $40,000 $38,000
Total Uses of Reimbursed Overhead $13,349 $47,963 $33,032 $40,000 $38,000
Carryforward $20,732 $0 $5,467 $467 $467
12 152
6

Reimbursed Overhead Gross Receipts and Uses
DIXIE COLLEGE
1989-90
Actual
1990-91
Actual
1991-92
Actual
1992-93
Budget
laDle
1993-94
Request
Carryforward N/A $4,795 $5,960 $6,641 $261
Gross Receipts & Carryforward $47,700 $23,614 $40,563 $47,500 $45,000
Total Funds Available $47,044 $28,409 $46,523 $54,141 $45,261
Uses of Reimbursed Overhead
Development of New Res. Funding $17,173 $22,449 $39,882 $53,880 $45,000
Programmatic Support $24,076 $0 $0 $0 $0
Retained in Dedicated Credits $1,000 $0 $0 $0 $0
Total Uses of Reimbursed Overhead $42,249 $22,449 $39,882 $53,880 $45,000
Carryforward $4,795 $5,960 $6,641 $261 $261
COLLEGE OF EASTERN UTAH-Education and General
Carryforward N/A N/A $0 $0 $0
Gross Receipts & Carryforward $1,000 $0 $0 $0 $0
Total Funds Available $1,000 $0 $0 $0 $0
Uses of Reimbursed Overhead
Development of New Res. Funding $1,497 $0 $0 $0 $0
Retained in Dedicated Credits $400 $0 $0 $0 $0
Carryforward N/A $0 $0 $0 $0
COLLEGE OF EASTERN UTAH-San Juan Center
Carryforward N/A $17,199 $24,062 $64,967 $40,905
Gross Receipts & Carryforward $38,329 $72,630 $74,876 $34,250 $34,250
Total Funds Available $38,329 $89,829 $98,938 $99,217 $75,155
Uses of Reimbursed Overhead
Development of New Res. Funding $28,998 $61,710 $25,571 $58,312 $58,312
Capital Facilities $0 $4,057 $8,400 $0 $0
Retained in Dedicated Credits $1,600 $0 $0 $0 $0
Carryforward N/A $24,062 $64,967 $40,905 $16,843
UTAH VALLEY COMMUNITY COLLEGE
Carryforward N/A $8,273 $10,611 $34,775 $38,300
Gross Receipts & Carryforward $24,273 $9,467 $38,342 $38,300 $0
Total Funds Available $24,273 $17,740 $48,953 $73,075 $38,300
Uses of Reimbursed Overhead
Development of New Res. Funding $8,000 $4,597 $7,007 $8,000 $8,000
Programmatic Support $0 $0 $7,171 $0 $0
Other:
Reserve For Disallowances $2,000 $0 $0 $0 $0
Library $2,000 $0 $0 $0 $0
Humanities Seminars $0 $2,532 $0 $0 $0
Instructional Equipment $2,000 $0 $0 $6,775 $10,300
Retained in Dedicated Credits $2,000 $0 $0 $0 $0
Grant Preparation Incentives $0 $0 $0 $10,000 $10,000
Bus Office/Purchasing/Personnel $0 $0 $0 $10,000 $10,000
Total Other $8,000 $2,532 $0 $26,775 $30,300
Total Uses of Reimbursed Overhead $16,000 $7,129 $14,178 $34,775 $38,300
Carryforward $8,273 $10,611 $34,775 $38,300 $0
13
153
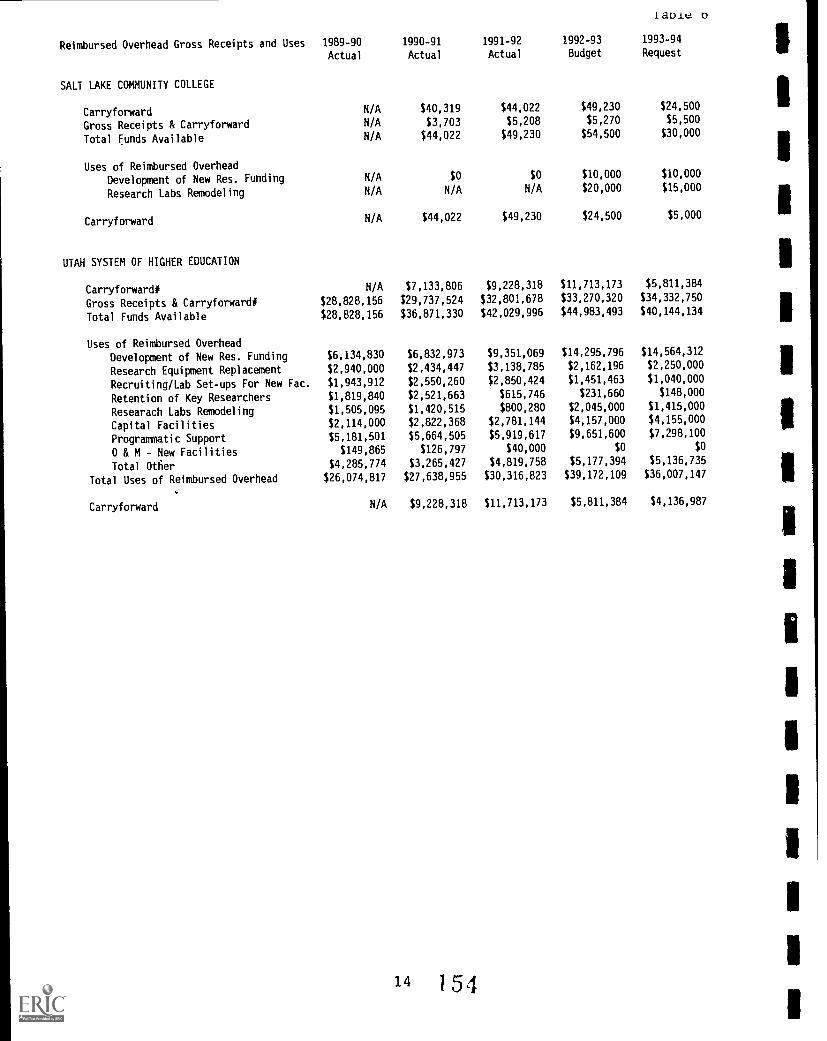
aole
Reimbursed Overhead Gross Receipts and Uses 1989-90 1990-91 1991-92 1992-93 1993-94
Actual Actual Actual Budget Request
SALT LAKE COMMUNITY COLLEGE
Carryforward N/A $40,319 $44,022 $49,230 $24,500
Gross Receipts & Carryforward N/A $3,703 $5,208 $5,270 $5,500
Total Funds Available N/A $44,022 $49,230 $54,500 $30,000
Uses of Reimbursed Overhead
Development of New Res. Funding N/A $0 $0 $10,000 $10,000
Research Labs Remodeling N/A N/A N/A $20,000 $15,000
Carryforward N/A $44,022 $49,230 $24,500 $5,000
UTAH SYSTEM OF HIGHER EDUCATION
Carryforward# N/A $7,133,806 $9,228,318 $11,713,173 $5,811,384
Gross Receipts & Carryforward# $28,828,156 $29,737,524 $32,801,678 $33,270,320 $34,332,750
Total Funds Available $28,828,156 $36,871,330 $42,029,996 $44,983,493 $40,144,134
Uses of Reimbursed Overhead
Development of New Res. Funding $6,134,830 $6,832,973 $9,351,069 $14,295,796 $14,564,312
Research Equipment Replacement $2,940,000 $2,434,447 $3,138,785 $2,162,196 $2,250,000
Recruiting/Lab Set-ups For New Fac. $1,943,912 $2,550,260 $2,850,424 $1,451,463 $1,040,000
Retention of Key Researchers $1,819,840 $2,521,663 $615,746 $231,660 $148,000
Researach Labs Remodeling $1,505,095 $1,420,515 $800,280 $2,045,000 $1,415,000
Capital Facilities $2,114,000 $2,822,368 $2,781,144 $4,157,000 $4,155,000
Programmatic Support $5,181,501 $5,664,505 $5,919,617 $9,651,600 $7,298,100
0 & M - New Facilities $149,865 $126,797 $40,000 $0 $0
Total Otfier $4,285,774 $3,265,427 $4,819,758 $5,177,394 $5,136,735
Total Uses of Reimbursed Overhead $26,074,817 $27,638,955 $30,316,823 $39,172,109 $36,007,147
Carryforward N/A $9,228,318 $11,713,173 $5,811,384 $4,136,987
o
TABLE 7
Summary of Current Funds, Revenues, Expenditures and Transfers
155

UNIVERSITY OF UTAH
SUMMARY OF CURRENT FUNDS, REVENUES, EXPENDITURES AND TRANSFERS TABLE 7
1991-92 Actual 1992-93 ESTIMATED
Other Total Other Total
Appropriated Current Funds Current Funds Appropriated Current Funds Current Funds
CURRENT FUNDS REVENUES
Education and General
Tuition and Fees $40,972,250 $8,420,923 $49,393,173 $41,039,600 $8,934,600 $49,974,200Endowment Income $0 $7,844,754 $7,844,754 $0 $8,080,100 $8,080,100Sales and Services $0 $123,066,183 $123,066,183 $0 $126,758,200 $126,758,200Other Sources $657,605 $10,123,019 $10,780,624 $1,594,700 $10,426,700 $12,021,400Gift, Grant and Contract Funds $0 $139,578,446 $139,578,446 $0 $143,765,800 $143,765,800Federal Appropriations $0 $0 $0 $0 $0 $0State Appropriations $133,655,400 $0 $133,655,400 + $136,837,600 $0 $136,837,600Local Appropriations $0 $0 $0 $0 $0 $0TOTAL EDUCATION AND GENERAL $175,285,255 $289,033,325 $464,318,580 $179,471,900 5297,965,400 $477,437,300
Hospital (Including Appropriations) $3,165,100 $197,557,487 $200,722,587 $3,165,100 $207,435,400 $210,600,500
Auxiliary Enterprises $0 $42,064,843 $42,064,843 $0 $44,168,100 $44,168,100
Independent Operations $0 $0 $0 $0 $0 $0
TOTAL REVENUES $178,450,355 $528,655,655 $707,106,010 $182,637,000 $649,568,900 $732,205,900
Expenditures and Transfers
Education and General
Instruction $96,909,843 $26,464,678 $123,374,521 $101,905,400 $29,248,800 $131,154,200Research $1,879,557 583.913,619 $85,793,176 $1,970,500 $92,741,400 $94,711,900Public Service $3,798,391 $116,419,948 $120,218,339 * $3,778,300 $128,667,500 $132,445,800Academic Support $22,789,875 $9,928,166 $32,718,041 $19,230,300 $10,972,600 $30,202,900Student Services $8,219,112 $2,930,812 $11,149,924 $8,344,600 $3,239,100 $11,583,700Institutional Support $18,321,225 $4,818,732 $23,139,957 * $19,240,200 $5,325,700 $24,565,900Operation and Maintenance of Plant $22,429,599 $1,184,270 $23,613,869 $24,101,300 $1,308,900 $25,410,200Scholarships and Fellowships $344,306 $17,110,841 $17,455,147 $282,000 $18,910,900 $19,192,900Transfers (Net) $2,280,631 $6,831,749 $9,112,380 * $502,100 $7,550,500 $8,052,600TOTAL EDUCATION AND GENERAL $176,972,539 $269,602,815 $446,575,354 $179,354,700 $297,965,400 $477,320,100
Hospitals
Expenditures $3,165,100 $182,439,520 $185,604,620 $3,282,300 $196,938,500 $200,220,800Transfers (Net) $0 $9,892,776 $9,892,776 $0 $10,496,900 $10,496,900TOTAL HOSPITALS $3,165,100 $192,332,296 $195,497,396 $3,282,300 $207,435,400 $210,717,700
Auxiliary Enterprises
Expenditures $0 $41,827,203 $41,827,203 $0 $43,113,400 $43,113,400Transfers (Net) $0 $1,023,257 $1,023,257 $0 $1,054,700 $1,054,700TOTAL AUXILIARY ENTERPRISES $0 $42,850,460 $42,850,460 $0 $44,168,100 $44,168,100
Total Independent Operations $0 $0 $0 $0 $0 $0
TOTAL EXPENDITURES AND TRANSFERS $180,137,639 $504,785,571 $684,923,210 $182,637,000 $549,568,900 $732,205,900
REVENUE/EXPENDITURES DIFFERENCE ($1,687,284) $23,870,084 $22,182,800 $0 $0 $0
+Difference from IPEDS report and Financial Statement due to revenue received but not expended.
*Difference from IPEDS report and Financial Statement due to different definitions used by the budget office as compared to the accounting office.
1 015

SUIVARY OF CURRENT FUNDS, REVENUES, EXPENDITURES AND TRANSFERS TABLE 7
UNIVERSITY OF UTAH 1993-94 ESTIMATED
CURRENT FUNDS REVENUES
Education and General
Actual
Appropriated
Other
Current Funds
Total
Current Funds
Tuition and Fees $48,145,300 $9,560,000 '$57,705,300
Endowment Income $0 $8,403,300 $8,403,300
Sales and Services $0 $131,828,500 $131,828,500
Other Sources $1,594,700 $10,843,800 $12,438,500
Gift, Grant and Contract Funds $0 $149,516,00 $149,516,400
Federal Appropriations $0 $0 $0
State Appropriations $152,599,600 $0 $152,599,600
Local Appropriations $0 $O $0
TOTAL EDUCATION ANO GENERAL $202,339,600 $310,152,000 $512,491,600
Hospital (Including Appropriations) $3,413,600 $215,732,800 $219,146,400
Auxiliary Enterprises $0 $45,934,800 $45,934,800
Independent Operations $0 $0 SO
TOTAL REVENUES $205,753,200 $571,819,600 $777,572,800
Expenditures and Transfers
Education and General
Instruction $112,247,500 $30,445,100 $142,692,600
Research $2,177,000 $96,534,500 $98,711,500
Public Service $4,399,500 $133,929,900 $138,329,400
Academic Support $26,396,700 $11,421,400 $37,818,100
Student Services $9,519,900 $3,371,600 $12,891,500
Institutional Suppert $21,220,800 $5,543,500 $26,764,300
Operation and Maintenance of Plant $25,979,400 $1,362,400 $27,341,800
Scholarships and Fellowships $398,800 $19,684,400 $20,083,200
Transfers (Net) $0 $7,859,200 $7,859,200
TOTAL EDUCATION AND GENERAL $202,339,600 $310,152,000 $512,491,600
Hospitals
Expenditures $3,413,600 5204,816,000 $208,229,600
Transfers (Net) $0 $10,916,700 $10,916,700
TOTAL HOSPITALS $3,413,600 $215,732,800 $219,146,400
Auxiliary Enterprises
Expenditures $0 $44,837,900 $44,837,900
Transfers (Net) $0 $1,096,900 $1,096,900
TOTAL AUXILIARY ENTERPRISES $0 $45,934,800 $45,934,800
Total Independent Operations $0 $0 $0
TOTAL EXPENDITURES AND TRANSFERS $205,753,200 $571,819,600 $777,572,800
REVENUE/EXPERDITURES DIFFERENCE $0 $0 $O
15716

UTAH STATE UNIVERSITY
SUMMARY Of CURRENT FUNDS, REVENUES, EXPENDITURES AND TRANSFERS
1991-92 Actual 1992-93 ESTIlikTED
TABLE]
Other Total Other Total
Appropriated Current Funds Current Funds Appropriated Current Funds Current Funds
CURRENT FUNDS REVENUES
Education and General
Tuition and Fees $20,446,253 $8,009,208 $28,455,461 $19,886,200 $8,385,600 $28,271,800
Endowment Inca* $0 $790,773 $790,773 $0 $814,500 $814,500
Sales and Services $940,911 $2,649,775 $3,590,686 $1,050,000 $2,729,300 $3,779,300
Other Sources $680,718 $4,980,185 $5,660,903 $515,100 $5,129,600 $5,644,700
Gift, Grant and Contract Funds $134,538 $92,396,157 $92,530,695 $150,000 $95,168,000 $95,318,000
Federal Appropriations $4,048,336 $222,849 $4,271,185 $3,626,400 $0 $3,626,440
State Appropriations $76,926,645 $0 $76,926,645 + $79,781,700 $0 $79,781,700
Local Appropriations $0 $0 $0 $0 $0 $0
TOTAL EDUCATION AM GENERAL $103,177,401 $109,048,947 $212,226,348 $105,009,400 $112,227,000 $217,236,400
Hospital (Including Appropriations) $0 $0 $0 $0 $0 $0
Auxiliary Enterprises $0 $21,170,575 $21,170,575 $0 $22,229,100 $22,229,100
Independent Operations $0 $0 $0 $0 $0 $0
TOTAL REVENUES $103,177,401 $130,219,522 $233,396,923 $105,009,400 $134,456,100 $239,465,500
Expenditures and Transfers
Education and General
Instruction $41,734,517 $12,556,186 $54,290,703 $46,141,745 $12,882,300 $59,024,045
Research $13,475,795 $56,746,447 $70,222,242 $14,357,900 $58,220,400 $72,578,300
Public Service $10,298,189 $6,415,890 $16,714,079 $9,904,044 $6,582,500 $16,486,544
Academic Support $11,552,387 $1,939,268 $13,491,655 $11,063,491 $1,989,600 $13,053,091
Student Services $5,089,215 $449,927 $5,539,142 $4,787,054 $461,500 $5,248,654
Institutional Support $7,622,358 $7,489,357 $15,111,715 $7,423,439 $7,683,900 $15,107,339
Operation and Maintenance of Plant $10,993,312 $123,035 $11,116,347 * $11,136,977 $126,200 $11,263,177
Scholarships and Fellowships $97,099 $17,016,328 $17,113,427 $94,150 $17,458,300 $17,552,450
Transfers (Net) $113,498 $6,649,347 $6,762,845 * $100,600 $6,822,200 $6,922,800
TOTAL EDUCATION AND GENERAL $100,976,370 $109,385,785 $210,362,155 $105,009,400 $112,227,000 $217,236,400
Hospitals
Expenditures $0 $0 $0 $0 $0 $0
Transfers (Net) $O $0 $0 $0 $0 $0
TOTAL HOSPITALS $0 $0 $0 $0 $0 $0
Auxiliary Enterprises'
Expenditures $0 $21,031,436 $21,031,436 $0 $21,993,600 $21,993,600
Transfers (Net) $0 $225,231 $225,231 $0 $235,500 $235,500
TOTAL AUXILIARY ENTERPRISES $0 $21,256,667 $21,256,667 $0 $22,229,100 $22,229,100
Total Independent Operations $0 $0 $0 $0 $0 $0
TOTAL EXPENDITURES AND TRANSFERS $100,976,370 $130,642,452 $231,618,822 $105,009,400 $134,456,100 $239,465,500
REVENUE/EXPENDITURES DIFFERENCE $2,201,031 ($422,930) $1,778,101 $0 $0 $0
+Difference from IPEDS report and Financial Statement due to revenue received but not expended.
*Difference from IPEDS report and Financial Statement due to different definitions used by the budget office as compared to the accounting office.
17 153

SUWARY OF CURRENT FUNDS, REVENUES, EXPENDITURES AND TRANSFERS TABLE 7
UTAH STATE UNIVERSITY 1993-94 ESTIMATED
CURRENT FUNDS REVENUES
Education and General
Appropriated
Other
Current Funds
Total
Current Funds
Tuition and Fees $24,799,100 $8,972,600 $33,771,700
Endowment Income $0 $847,100 $847,100
Sales and Services $1,050,000 $2,838,500 $3,888,500
Other Sources $515,100 $5,334,800 $5,849,900
Gift, Grant and Contract Funds $150,000 $98,974,700 $99,124,700
Federal Appropriations $3,626,400 $0 $3,626,400
State Appropriations $90,050,600 $0 $90,050,600
Local Appropriations $0 $0 $0
TOTAL EDUCATION AND GENERAL $120,191,200 $116,967,700 $237,158,900
Hospital (Including Appropriations) $0 $0 $0
Auxiliary Enterprises $0 $23,118,300 $23,118,300
Independent Operations $0 $0 $0
TOTAL REVENUES $120,191,200 $140,086,000 $260,277,200
Expenditures and Transfers
Education and General
Instruction $49,732,000 $13,426,500 $63,158,500
Research $16,058,200 t50,679,700 $76,737,900
Public Service $12,271,600 $6,860,600 $19,132,200
Academic Support $13,766,200 $2,073,700 $15,839,900
Student Services $6,064,500 $481,100 $6,545,600
Institutional Support $9,083,000 $8,008,500 $17,091,500
Operation and Maintenance of Plant $13,100,000 $131,600 $13,231,600
Scholarships and Fellowships $115,700 $18,195,800 $18,311,500
Transfers (Net) $0 $7,110,200 $7,110,200
TOTAL EDUCATION AND GENERAL $120,191,200 $116,967,700 $237,158,900
Hospitals
Expenditures $O $0 $0
Transfers (Net) $0 $0 $0
TOTAL HOSPITALS $0 $0 $0
Auxiliary Enterprises
Expenditures $0 $22,873,300 $22,873,300
Transfers (Net) $0 $245,000 $245,000
TOTAL AUXILIARY ENTERPRISES $0 $23,118,300 $23,118,300
Total Independent Operations $0 $0 $0
TOTAL EXPENDITURES AA TRANSFERS $120,191,200 $140,086,000 $260,277,200
REVENUE/EXPENDITURES DIFFERENCE $0 $0 $0
18 1 5 9

WEBER STATE UNIVERSITY
SUM4ARY OF CURRENT FUNDS, REVENUES, EXPENDITURES AND TRANSFERS TABLE 7
1991-92 Actual 1992-93 ESTIMATED
Other Total Other Total
Appropriated Current Funds Current Funds Appropriated Current Funds Current Funds
CURRENT FUNDS REVENUES
Education and General
Tuition and Fees $15,227,791 $4,644,609 $19,872,400 $15,200,300 $4,858,300 $20,058,600
Endowment Income $0 $394,129 $394,129 $0 $406,000 $406,000
Sales and Services $0 $518,701 $518,701 $0 $534,300 $534,300
Gther Sources $35,848 $2,112,897 $2,148,745 $50,600 $2,176,300 $2,226,900
Gift, Grant and Contract Funds $151,015 $14,197,912 $14,348,927 $321,000 $14,623,800 $14,444,800
Federal Appropriations $0 $0 $0 $0 $0 $0
State Appropriations $37,788,200 $0 $37,788,200 + $38,987,900 $0 $38,987,900
Local Appropriations $0 SO $0 $0 $0 $0
TOTAL EDUCATION AND GENERAL $53,202,854 121,868,248 $75,071,102 $54,559,800 $22,598,700 $77,158,500
Hospital (Including Appropriations) $0 $0 $0 $0 $0 $0
Auxiliary Enterprises $0 $9,771,025 $9,771,025 $0 $8,793,900 $8,793,900
Independent Operations $0 $0 $0 $O $0 $0
TOTAL REVENUES $53,202,854 $31,639,273 $84,842,127 $54,559,800 $31,392,600 $85,952,400
Expenditures and Transfers
Education and General
Instruction $30,016,030 $5,430,116 $35,446,146 $31,231,173 $5,322,500 $36,553,673
Research $60,860 $482,545 $543,405 $0 $473,000 $473,000
Public Service $462,067 $1,167,069 $1,629,136 $448,340 $1,143,900 $1,592,240
Academic Support $4,985,898 $1,401,859 $6,387,757 $4,701,706 $1,374,100 $6,075,806
Student Services $4,335,324 $1,640,547 $5,975,871 $3,663,854 $1,608,000 $5,271,854
Institutional Support $6,836,313 $992,521 $7,828,834 $8,188,219 $972,900 $9,161,119
Operation and Maintenance of Plant $6,134,594 $18,948 $6,153,542 $6,326,508 $18,600 $6,345,108
Scholarships and Fellowships $43,390 $9,832,492 $9,875,882 $0 $9,637,700 $9,637,700
Transfers (Net) $0 $2,089,353 $2,089,353 $0 $2,048,000 $2,048,000
TOTAL EDUCATICM AND GENERAL $52,874,476 $23,055,450 $75,929,926 $54,559,800 $22,598,700 $77,158,500
Hospitals
Expenditures $0 $0 $0 $0 $0 $0
Transfers (Net) $0 $0 $0 $0 $0 SO
TOTAL HOSPITALS $0 $0 $0 $0 $0 $0
Auxiliary Enterprises
Expenditures $0 $10,724,686 $10,724,686 $0 $9,368,600 $9,368,600
Transfers (Net) $0 ($657,8E4) ($657,864) $0 ($574,700) ($574,700)
TOTAL AUXILIARY ENTERPRISES $0 $10,066,822 $10,066,822 $0 $8,793,900 $8,793,900
Total Independent Operations $0 $0 $0 $0 $0 $0
TOTAL EXPENDITURES AND TRANSFERS $52,874,476 $33,122,272 $85,996,748 $54,559,800 $31,392,600 $85,952,400
REVENUE/EXPENDITURES DIFFERENCE $328,378 ($1,482,999) ($1,154,621) SO SO $0
+Difference from IPEDS report and Financial Statement due to revenue received but not expended.
19
I 60

SUMMARY OF CURRENT FUNDS, REVENUES, EXPENDITURES AND TRANSFERS TABLE 7
hEBER STATE UNIVERSITY 1993-94 ESTIMATED
CURRENT FUNDS REVENUES
Education and General
Appropriated
Other
Current Funds
Total
Current Funds
Tuition and Fees $17,994,700 $5,198,400 $23,193,100
Endowment Income $0 $422,200 $422,200
Sales and Services $0 $555,700 $555,700
Other Sources $50,600 $2,263,400 $2,314,000
Gift, Grant and Contract Funds $321,000 $15,208,800 $15,529,800
Federal Appropriations $0 $O $0
State Appropriations $44,074,700 $0 $44,074,700
Local Appropriations $0 $O $0
TOTAL EDUCATICM AXD GENERAL $62,441,000 $23,648,500 $86,089,500
Hospital (Including Appropriations) $0 $0 $O
Auxiliary Enterprises $0 $9,145,700 $9,145,700
Independent Operations $0 $0 $0
TOTAL REVENUES $62,441,000 $32,794,200 $95,235,200
Expenditures and Transfers
Education and General
Instruction 535,446,800 $5,569,800 $41,016,600
Research $71,900 $495,000 $566,900
Public Service $545,700 $1,197,100 $1,742,800
Academic Support $5,888,000 $1,437,900 $7,325,900
Student Services $5,119,700 $1,682,700 $6,802,400
Institutional Support $8,073,200 $1,018,100 $9,091,300
Operation and Maintenance of Plant $7,244,500 $19,400 $7,263,900
Scholarships and Fellowships $51,200 $10,085,400 $10,136,600
Transfers (Net) $0 $2,143,100 $2,143,100
TOTAL EDUCATICM AMU GENERAL $62,441,000 $23,648,500 $86,089,500
Hospitals
Expenditures $0 SO $0
Transfers (Met) $0 $0 $0
TOTAL HOSPITALS $0 $0 $0
Auxiliary Enterprises
Expenditures $0 $9,743,400 $9,743,400
Transfers (Net) SO ($597,700) ($597,700)
TOTAL AUXILIARY ENTERPRISES $0 $9,145,700 $9,145,700
Total Independent Operations $0 $0 $0
TOTAL EXPENDITURES AND TRANSFERS $62,441,000 $32,794,200 $95,235,200
REVENUE/EXPENDITURES DIFFERENCE $0 $0 $0
21b61

SOUTHERN UTAH UNIVERSITY
SUtliaRY OF CLRRENT FUNDS, REVENUES, EXPENDITURES AND TRANSFERS TABLE 7
1991-92 Actual 1992-93 ESTIMATED
Other Total Other Total
Appropriated Current Funds Current Funds Appropriated Current Funds Current Funds
CURRENT FUNDS REVENUES
Education and General
Tuition and Fees $3,994,190 $1,708,677 $5,702,867 $4,153,400 $1,768,500 $5,921,900
Endowment Income $0 $87,226 $87,226 $0 $89,800 $89,800
Sales and Services $0 $3,785,060 $3,785,060 $0 $3,898,600 $3,898,600
0ther Sources $8,375 $271),865 $279,240 $16,500 $279,000 $295,500
Gift, Grant and Contract Funds $48,263 $6,209,207 $6,257,470 $49,500 $6,395,500 $6,445,000
Federal Appropriations $0 $0 $0 $0 $0 $0
State Appropriations $12,742,400 $0 $12,742,400 + $13,606,100 $0 $13,606,100
Local Appropriations $0 $0 $0 $0 $0 $0
TOTAL EDUCATION AHD GENERAL $16,793,228 $12,061,035 $28,854,263 $17,825,500 $12,431,400 $30,256,900
Hospital (Including Appropriations) $0 $0 $0 $0 $0 $0
Auxiliary Enterprises $0 $4,149,924 $4,149,924 $0 $4,357,400 $4,357,400
Independent Operations $0 $0 $0 $0 $0 $0
TOTAL REVENUES $16,793,228 $16,210,959 $33,004,187 $17,825,500 $16,788,800 $34,614,300
Expenditures and Transfers
Education and General
Instruction $8,103,224 $289,197 $8,392,421 $8,725,165 $322,400 $9,047,565
Research $0 $0 $0 $0 $0 $0
Public Service $215,833 $4,164,540 $4,380,373 $200,635 54,643,000 $4,843,635
Academic Support $1,642,265 $607,523 $2,249,788 $1,708,774 $677,300 $2,386,074
Student Services $1,736,220 $796,870 $2,533,090 $1,847,011 $888,400 $2,735,411
Institutional Support $2,281,449 $735,228 $3,016,677 $2,397,050 $819,700 $3,216,750
Operation and Maintenance of Plant $2,644,298 $34,902 $2,679,200 $2,929,865 $38,900 $2,968,765
Scholarships and Fellowships $16,762 $4,444,573 $4,461,335 $17,000 $4,955,200 $4,972,200
Transfers (Net) $0 $77,608 $77,608 $0 $86,500 $86,500
TOTAL EDUCATION AND GENERAL $16,640,051 $11,150,441 $27,790,492 $17,825,500 $12,431,400 $30,256,900
Hospitals
Expenditures $0 $0 $0 $0 $O $0
Transfers (Net) $0 $0 $0 $0 $0 $0
TOTAL HOSPITALS $0 $0 $0 $O $0 $0
Ancillary Enterprises
Expenditures $0 $3,1144,011 $3,844,011 $0 $3,723,400 $3,723,400
Transfers (Net) $0 $654,497 $654,497 $0 $634,000 $634,000
TOTAL AUXILIARY ENTERPRISES $0 $4,498,508 $4,498,508 $0 $4,357,400 $4,357,400
Total Independent Operations $0 $0 $0 $0 $0 $0
TOTAL EXPENDITURES AND TRANSFERS $16,640,051 $15,648,949 $32,289,000 $17,825,500 $16,788,800 $34,614,300
REVENUE/EXPENDITURES DIFFERENCE $153,177 $562,010 $715,187 $0 $0 $0
+Difference from IPEDS report and Financial Statement due to revenue received but not expended.
I. 6 2
2 1

SUMMARY OF CURRENT FUNDS, REVENUES, EXPENDITURES AND TRANSFERS TABLE 7
SOUTHERN UTAH UNIVERSITY 1993-94 ESTIMATED
CURRENT FUNDS REVENUES
Education and General
Appropriated
Other
Current Funds
Total
Current Funds
Tuition and Fees $5,323,400 $1,892,300 $7,215,700
Endowment Income $0 $93,400 $93,400
Sales and Services $0 $4,054,500 $4,054,500
Other Sources $16,500 $290,200 $306,700
Gift, Grant and Contract Funds $49,500 $6,651,300 $6,700,800
Federal Appropriations $0 $0 $0
State Appropriations $16,496,400 $0 $16,496,400
Local Appropriations $0 $0 $0
TOTAL EDUCATION AND GENERAL $21,885,800 $12,981,700 $34,867,500
Hospital (Including Appropriations) $0 $0 $0
Auxiliary Enterprises $0 $4,531,700 54.531.:00
Independent Operations $0 $0 $0
TOTAL REVENUES $21,885,800 $17,513,400 $39,399,200
Expenditures and Trasfers
Education and General
Instruction $10,657,700 $336,700 $10,994,400
Research $0 $0 $0
Public Service $283,900 $4,848,500 $5,132,400
Academic Support $2,160,000 $707,300 $2,867,300
Student Services $2,283,600 $927,700 $3,211,300
Institutional Support $3,000,700 $856,000 $3,856,700
Operation and Maintenance of Plant $3,477,900 $40,600 $3,518,500
Scholarships and Fellowships $22,000 $5,174,500 $5,196,500
Transfers (Net) $0 $90,400 $90,400
TOTAL EDUCATICM AND GENERAL $21,885,800 $12,981,700 $34,867,500
Hospitals
Expenditures $0 $0 $0
Transfers (Net) $0 $0 $0
TOTAL HOSPITALS $0 $0 $0
Auxiliary Enterprises
Expenditures $0 $3,872,400 $3,872,400
Transfers (Net) $0 $659,300 $659,300
TOTAL AUXILIARY ENTERPRISES $0 $4,531,700 $4,531,700
Total Independent Operations $0 $0 $0
TOTAL EXPENDITURES AND TRAASFERS $21,885,800 $17,513,400 $39,399,200
REVENUE/EXPENDITURES DIFFERENCE $0 $0 $0
+Difference from IPEDS report and Flnanc
1 3
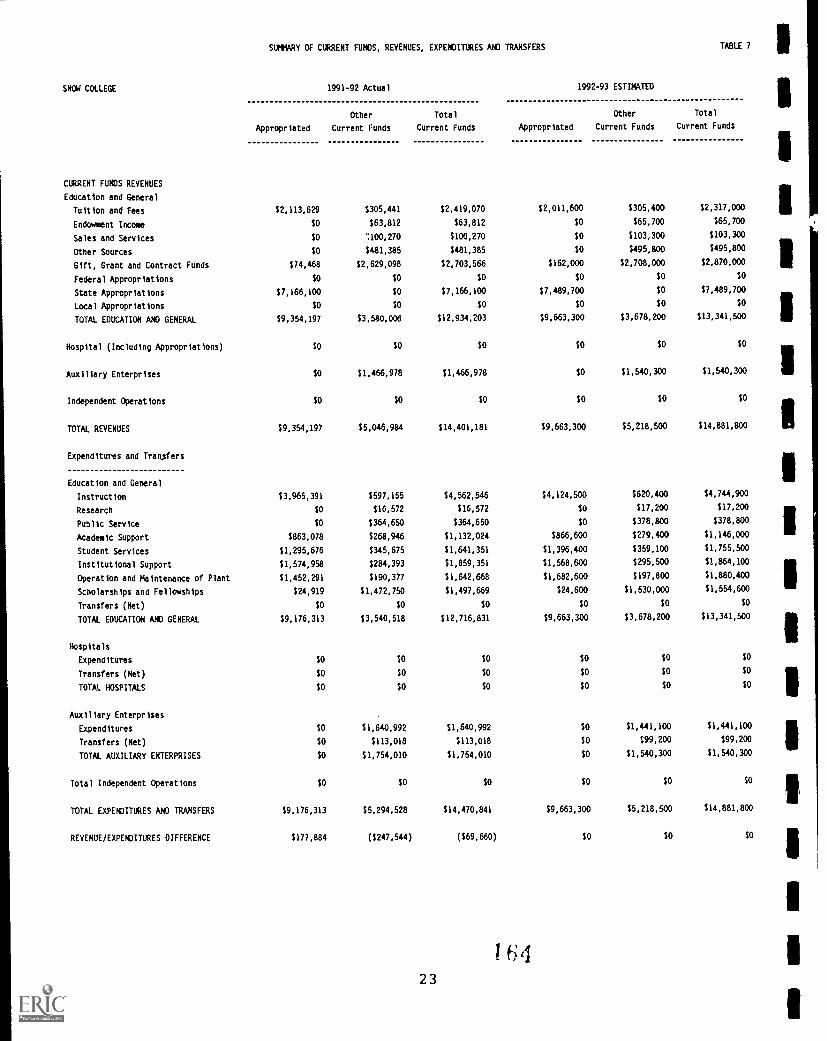
SNOW CCCLEGE
SUMMARY OF CURRENT FUNDS, REVENUES, EXPENDITURES AND TRANSFERS TABLE 7
1991-92 Actual 1992-93 ESTIMTED
Other Total Other Total
Appropriated Current Funds Current Funds Appropriated Current Funds Current Funds
CURRENT FUNDS REVENUES
Education and General
Tuition and Fees $2,113,629 $305,441 $2,419,070 $2,011,600 $305,400 $2,317,000
Endowment Income $0 $63,812 $63,812 $0 $65,700 $65,700
Sales and Services $0 %100,270 $100,270 $0 $103,300 $103,300
Cther Sources $0 $481,385 $481,385 $0 $495,800 $495,800
Gift, Grant and Contract Funds $74,468 $2,629,098 $2,703,566 $162,000 $2,708,000 $2,870,000
Federal Appropriations $0 $0 $0 $0 $0 $0
State Appropriations $7,166,100 $0 $7,166,100 $7,489,700 $0 $7,489,700
Local Appropriations $0 $0 $0 $0 $O $0
TOTAL EDUCATION AND GENERAL $9,354,197 $3,580,006 $12,934,203 $9,663,300 $3,678,200 $13,341,500
Hospital (Including Appropriations) SO $0 $0 $0 $0 $0
Auxiliary Enterprises $0 $1,466,978 $1,466,978 $0 $1,540,300 $1,540,300
Independent Operations $0 $0 $0 $0 $O $O
TOTAL REVENUES $9,354,197 $5,046,984 $14,401,181 $9,663,300 $5,218,500 $14,881,800
Expenditures and Transfers
Education and General
Instruction $3,965,391 $597,155 $4,562,546 $4,124,500 5620,400 $4,744,900
Research $0 $16,572 $16,572 $0 $17,200 $17,200
Public Service SO $364,650 $364,650 $0 $378,800 $378,800
Academic Support $863,078 $268,946 $1,132,024 $866,600 $279,400 $1,146,000
Student Services $1,295,676 $345,675 $1,641,351 $1,396,400 $359,100 $1,755,500
Institutional Support $1,574,958 $284,393 $1,859,351 $1,568,600 $295,560 $1,864,100
Operation and Maintenance of Plant $1,452,291 $190,377 $1,642,668 $1,682,600 $197,800 $1,880,400
Scholarships and Fellowships $24,919 $1,472,750 $1,497,669 $24,600 $1,530,000 $1,554,600
Transfers (Net) $0 $0 $0 $0 $0 $0
TOTAL EDUCATION AND GENERAL $9,176,313 $3,540,518 $12,716,831 $9,663,300 $3,678,200 $13,341,500
Hospitals
Expenditures $0 $0 $0 $0 $0 $0
Transfers (Net) $0 $0 $0 $0 $0 $0
TOTAL HOSPITALS $0 $0 $O $0 $0 $0
Auxiliary Enterprises
Expenditures $0 $1,640,992 $1,640,992 $0 $1,441,100 $1,441,100
Transfers (Net) $0 $113,018 $113,018 $0 I99,200 $99,200
TOTAL AUXILIARY ENTERPRISES $0 $1,754,010 $1,754,010 $0 $1,540,300 $1,540,300
Total Independent Operations $0 $0 $0 $0 $0 $0
TOTAL EXPENDITURES AND TRANSFERS $9,176,313 $5,294,528 $14,470,841 $9,663,300 $5,218,500 $14,881,800
REVENUE/EXPENDITURES DIFFERENCE $177,884 ($247,544) ($69,660) $0 $0 $O
2 3
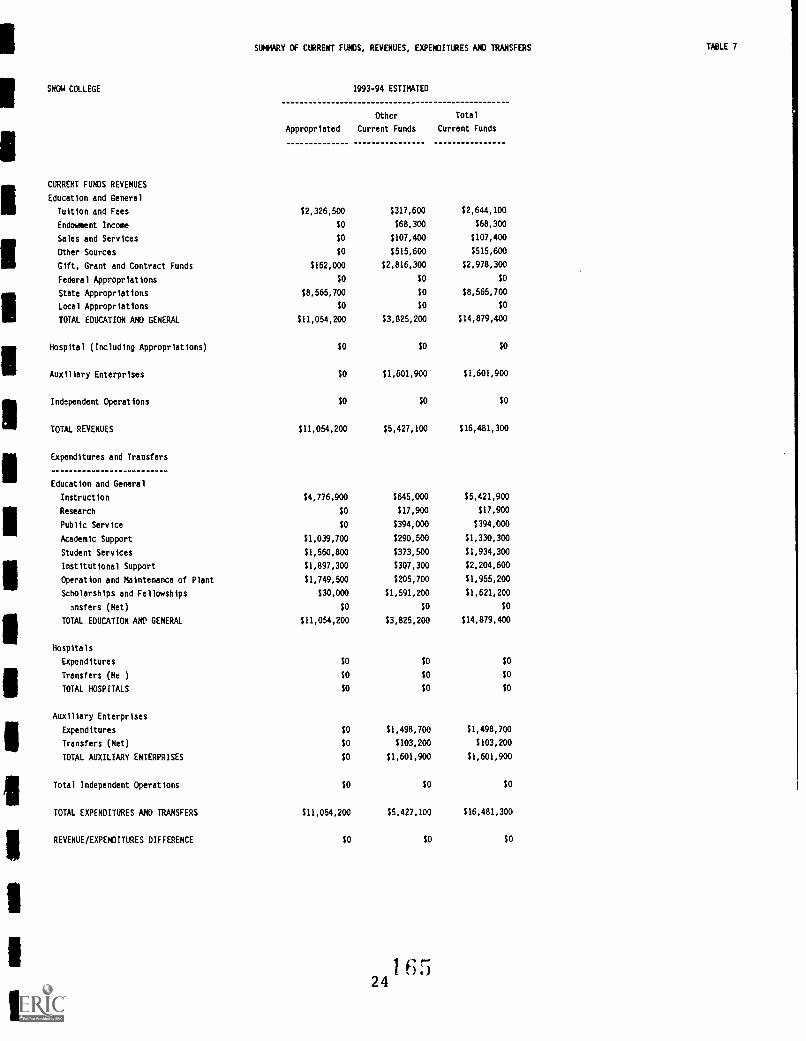
SUMMARY OF CURRENT FUNDS, REVENUES, EXPENDITURES AND TRANSFERS TABLE 7
SNOW COLLEGE 1993-94 ESTIMATED
CURRENT FUNDS REVENUES
Education and General
Appropriated
Other
Current Funds
Total
Current Funds
Tuition and Fees $2,326,500 $317,600 $2,644,100
Endowment Income $0 $68,300 $68,300
Sales and Services $0 $107,400 $107,400
Other Sources $0 $515,600 $515,600
Gift, Grant and Contract Funds $162,000 $2,816,300 $2,978,300
Federal Appropriations $0 $0 $0
State Appropriations $8,565,700 $0 $8,565,700
Local Appropriations $O $0 $0
TOTAL EDUCATION AND GENERAL $11,054,200 $3,825,200 $14,879,400
Hospital (Including Appropriations) $0 $0 $0
Auxiliary Enterprises $0 $1,601,900 $1,601,900
Independent Operations $0 $0 $0
TOTAL REVENUES $11,054,200 $5,427,100 $16,481,300
Expenditures and Transfers
Education and General
Instruction $4,776,900 $645,000 $5,421,900
Research $0 $17,900 $17,900
Public Service $0 $394,000 $394,000
Academic Support $1,039,700 $290,500 $1,330,300
Student Services $1,560,800 $373,500 $1,934,300
Institutional Support $1,897,300 $307,300 $2,204,600
Operation and Maintenance of Plant $1,749,500 $205,700 $1,955,200
Scholarships and Fellowships $30,000 $1,591,200 $1,621,200
insfers (Net) $0 $0 $0
TOTAL EDUCATION ARP GENERAL $11,054,200 $3,825,200 $14,879,400
Hospitals
Expenditures $0 $0 $0
Transfers (Ne ) $0 $0 $0
TOTAL HOSPITALS $0 $0 $0
Auxiliary Enterprises
Expenditures $0 $1,498,700 $1,498,700
Transfers (Net) $0 $103,200 $103,200
TOTAL AUXILIARY ENTERPRISES $0 $1,601,900 $1,601,900
Total Independent Operations $0 $0 $0
TOTAL EXPENDITURES AND TRANSFERS $11,054,200 $5,427,100 $16,481,300
REVENUE/EXPENDITURES DIFFERENCE $0 $0 $0

DIXIE COLLEGE
SUWARY Cf CURRENT FUNDS, REVENUES, EXPENDITURES AND TRANSFERS TABLE 7
1991-92 Actual 1992-93 ESTIMATED
Other Total Other Total
Appropriated Current Funds Current Funds Appropriated Current Funds Current Funds
CURRENT FUNDS REVENUES
Education and General
Tuition and Fees $2,172,339 $1,151,488 $3,323,827 $2,205,600 $1,273,500 $3,479,100
Endowment Income $0 $191,351 $191,351 $0 $197,100 $197,100
Sales and Services $0 $0 $0 $0 $0 $0
Other Sources $61,271 $119,058 $180,329 $35,400 $122,600 $158,000
Gift, Grant and Contract Funds $174,350 $3,348,211 $3,522,561 $130,000 $3,448,700 $3,578,700
Federal Appropriations $0 $0 $0 $0 $0 $0
State Appropriations $7,586,300 $0 $7,586,300 + $8,029,300 $0 $8,029,300
Local Appropriations $0 $0 $0 $0 $0 $0
TOTAL EDUCATION AND GENERAL $9,994,260 $4,810,108 $14,804,368 $10,400,300 $5,041,900 $15,442,200
Hospital (Including Appropriations) $0 $0 $0 $0 $0 $0
Auxiliary Enterprises $0 $2,450,723 $2,450,723 $0 $2,573,300 $2,573,360
Independent Cperations $0 $O $0 $O $0 $O
TOTAL REVENUES $9,994,260 $7,260,831 $17,255,091 $10,400,300 $7,615,200 $18,015,500
Expenditures and Transfers
Education and General
Instruction $4,348,389 $1,120,039 $5,468,428 $4,823,420 $1,272,300 $6,095,720
Research $0 $0 $O $0 $0 $0
Public Service $148,955 $506,275 $655,230 $143,529 $575,100 $718,629
Academic Support $765,889 $207,507 $973,396 $697,976 $235,700 $933,676
Student Services $1,458,672 $105,940 $1,564,612 $1,451,736 $120,300 $1,572,036
Institutional Support $1,377,283 $180,459 $1,557,742 $1,539,981 $205,000 $1,744,981
Operation and Maintenance of Plant $1,647,343 $37,641 $1,684,984 $1,728,558 $42,800 $1,771,358
Scholarships and Fellowships $15,100 $2,497,237 $2,512,337 $15,100 $2,836,800 $2,851,900
Transfers (Net) $63,680 ($216,681) ($153,001) $0 ($246,100) ($246,100)
TOTAL EDUCATION ANO GENERAL $9,825,311 $4,438,417 $14,263,728 $10,400,300 $5,041,900 $15,442,200
Hospitals
Expenditures $0 $0 $O $0 $0 $0
Transfers (Net) $0 $0 $0 $0 $0 $O
TOTAL HOSPITALS $0 $0 $0 $O SO $0
Auxiliary Enterprises
Expenditures $0 $2,489,864 $2,489,864 $0 $2,579,800 $2,579,800
Transfers (Net) $0 ($6,250) ($6,250) $0 ($6,500) ($6.500)
TOTAL AUXILIARY ENTERPRISES $O $2,483,614 $2,483,614 $0 $2,573,300 $2,573,300
Total Independent Operations $O $0 $0 $0 $0 $0
TOTAL EXPENDITURES AND TRANSFERS $9,825,311 $6,922,031 $16,747,342 $10,400,300 $7,615,200 $18,015,500
REVENUE/EXPENDITURES DIFFERENCE $168,949 $338,800 $507,749 $0 $0 $0
+Difference from IPEDS report and Financial Statement due to revenue received but not expended.
*Difference from IPEOS report and Financial Statement due to different definitions used by the budget office as compared to the accoubting office.
25 I 66

SUMMARY OF CURRENT FUNDS, REVENUES, EXPENDITURES AND TRANSFERS
DIXIE COLLEGE 1993-94 ESTIMATED
CURRENT FUNDS REVENUES
Education and General
Appropriated
Other Total
Current Funds Current Funds
Tuition and Fees $2,607,100 $1,324,400 $3,931,500
Endowment Income $0 $205,000 $205,000
Sales and Services $O $O $O
Other Sources $35,400 $127,500 $162,900
Gift, Grant and Contract Funds $130,000 $3,586,600 $3,716,600
Federal Appropriations $O $O $O
State Appropriations $9,502,900 $O $9,502,900
Local Appropriations $O $0 $O
TOTAL EDUCATION AND GENERAL $12,275,400 $5,243,500 $17,518,900
Hospital (Including Appropriations) $O $O $O
Auxiliary Enterprises $O $2,676,200 $2,676,200
Independent Operations $O $O $O
TOTAL REVENUES $12,275,400 $7,919,700 $20,195,100
Expenditures and Transfers
Education and General
Instruction $5,468,100 $1,323,200 $6,791,300
Researth $0 $O $O
Public Service $187,300 $598,100 $785,400
Academic Support $963,100 $245,100 $1,208,200
Student Services $1,834,300 $125,203 $1,959,500
Institutional Support $1,732,000 $213,200 $1,945,200
Operation and Maintenance of Plant $2,071,600 $44,500 $2,116,100
Scholarships and Fellowships $19,000 $2,960,200 $2,969,200
Transfers (Net) $O ($256,000) ($256,000)
TOTAL EDUCATION AND GENERAL $12,275,400 $5,243,500 $17,518,900
Hospitals
Expenditures $O $O $O
Transfers (Net) $O $O $O
TOTAL HOSPITALS $O $O $O
Auxiliary Enterprises
Expenditures $O $2,682,900 $2,682,900
Transfers (Net) $O ($6,700) ($6,700)
TOTAL AUXILIARY ENTERPRISES $O $2,676,200 $2,676,200
Total Independent Operations $O $O $O
TOTAL EXPENDITURES AND TRANSFERS $12,275,400 $7,919,700 $20,195,100
REVENUE/EXPENDITURES DIFFERENCE $O $0 $O
1672 6
TABLE]

COLLEGE OF EASTON UTAH
SUMMARY OF CURRENT FUNDS, REVENUES, EXPENDITURES AND TRANSFERS TABLE 7
1991-92 Actual 1992-93 ESTIMATED
Other Total Other Total
Appropriated Current Funds Current Funds Appropriated Current Funds Current Funds
CURRENT FUNDS REVENUES
Education and General
Tuition and Fees $1,389,041 $265,260 $1,654,301 $1,393,400 $275,300 $1,668,700
Endowment Income $0 $7,819 $7,819 $0 $8,100 $8,100
Sales and Services $0 $79,517 $79,517 $0 $81,900 $81,900
Other Sources $7,989 $795,650 $803,639 $12,300 $819,500 $831,800
Gift, Grant and Contract Funds $143,186 $3,708,369 $3,851,555 $375,000 $3,819,600 $4,194,600
Federal Appropriations $0 $0 $0 $0 $0 $0
State Appropriations $6,969,600 $O $6,969,600 $7,175,700 $0 $7,175,700
Local Appropriations $0 $0 $0 $0 $0 $0
TOTAL EDUCATION AND GENERAL $8,509,816 $4,856,615 $13,366,431 $8,956,400 $5,004,400 $13,960,800
Hospital (Including Appropriations) $0 $0 $0 $0 $0 $0
Auxiliary Enterprises .$0 $1,679,242 $1,679,242 $0 $1,763,200 $1,763,200
Independent Operations $0 $0 $0 $0 $0 $0
TOTAL REVENUES $8,509,816 $6,535,857 $15,045,673 $8,956,400 $6,767,600 $15,724,000
Expenditures and Transfers
Education and General
Instruction $3,619,301 $1,222,874 $4,842,175 53,796.559 $1,296,300 $5,092,859
Research $0 $0 $0 $0 $0 $0
Public Service $0 $2,050 $2,050 $0 $2,200 $2,200
Academic Support $935,206 $90,116 $1,025,322 $936,427 $95,500 $1,031,927
Student Services $1,140,961 $1,013,666 $2,154,627 $1,233,145 $1,074,600 $2,307,745
Institutional Support $1,503,117 $219,445 $1,722,562 $1,655,531 $232,600 $1,888,131
Operation and Maintenance of Plant $1,219,859 $19,626 $1,239,485 $1,180,356 $20,800 $1,201,156
Scholarships and Fellowships $152,126 $2,052,793 $2,204,919 $154,382 $2,176,100 $2,330,482
Transfers (Net) $184,571 $100,215 $284,786 $0 $106,300 $106,300
TOTAL EDUCATION AND GENERAL $8,755,141 $4,720,785 $13,475,926 $8,956,400 $5,004,400 $13,560,800
Hospitals
Expenditures $0 $0 $0 $0 $0 $0
Transfers (Net) $0 $0 $0 $0 $0 $0
TOTAL HOSPITALS $0 $0 $0 $0 $0 $0
Auxiliary Enterprises
Expenditures $0 $1,841,904 $1,841,904 $0 $1,600,900 $1,600,900
Transfers (Net) $0 $186,703 $186,703 $0 $162,300 $162,300
TOTAL AUXILIARY ENTERPRISES $O $2,028,607 $2,028,607 $0 $1,763,200 $1,763,200
Total Independent Operations $0 $0 $0 $0 $0 $0
TOTAL EXPENDITURES AND TRANSFERS $8,755,141 $6,749,392 $15,504,533 $8,956,400 $6,767,600 $15,724,000
REVENUE/EXPENDITURES DIFFERENCE ($245,325) ($213,535) ($458,860) $0 $0 $0
1 682 7

SUMMARY OF CURRENT FUNDS, REVENUES, EXPENDITURES Aht TRANSFERS TABLE 7
COLLEGE OF EASTERN UTAH 1993-94 ESTIMATED
CURRENT FUNDS REVENUES
Education and General
Appropriated
Other
Current Funds
Total
Current Funds
Tuition and Fees $1,666,743 $286,300 $1,953,043
Endowment Incase $0 $8,400 $6,400
Sales and Services $0 $85,200 $85,200
Other Sources $12,257 $852,300 $864,557
Gift, Grant and Contract Funds $375,000 $3,972,400 $4,347,400
Federal Appropriations $0 $0 $0
State Appropriations $8,166,800 $0 $8,166,800
Local Appropriations $0 $0 $0
TOTAL EDUCATION AND GENERAL $10,220,800 $5,204,600 $15,425,400
Hospital (Including Appropriations) $0 $0 $0
Auxiliary Enterprises SO $1,833,700 $1,833,700
Independent Operations $0 $0 $0
TOTAL REVENUES $10,220,800 $7,038,300 $17,259,100
Expenditures and Transfers
Education and General
Instruction $4,316,300 $1,348,200 $5,664,500
Research SO $0 $0
Public Service $0 $2,300 $2,300
Academic Support $1,115,300 $99,400 $1,214,700
Student Services $1,360,600 $1,117,600 $2,478,200
Institutional Support $1,792,500 $241,900 $2,034,400
Operation end Maintenance of Plant $1,454,700 $21,600 $1,476,300
Scholarships and Fellowships $181,400 $2,263,200 $2,444,600
Transfers (Net) $0 $110,400 $110,400
TOTAL EDUCATION AND GENERAL $10,220,800 $5,204,600 $15,425,400
Hospitals
Expenditures $0 $0 $0
Transfers (Net) $0 $0 $0
TOTAL HOSPITALS $0 $0 $0
Auxiliary Enterprises
Expenditures $0 $1,664,900 $1,564,900
Transfers (Net) $0 $168,800 $168,600
TOTAL AUXILIARY ENTERPRISES $0 $1,833,700 $1,833,700
Total Independent Operations $0 $O $O
TOTAL EXPENDITURES AND TRANSFERS $10,220,800 $7,038,300 $17,259,100
REVENUE/EXPENDITURES DIFFERENCE $0 $0 $0
2 8 1 6 9
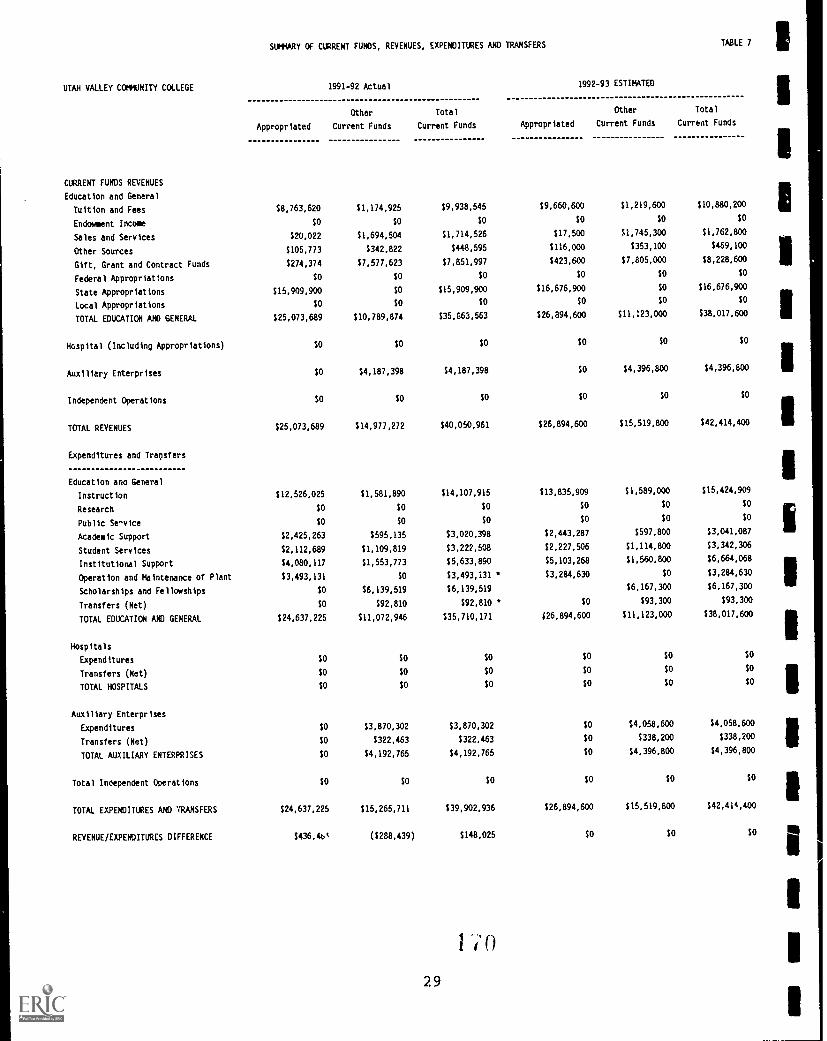
UTAH VALLEY COMMUNITY COLLEGE
SUWARY Of CURRENT FUNDS, REVENUES, EXPENDITURES AHD TRANSFERS TABLE 7
1991-92 Actual 1992-93 ESTIMATED
Other Total Other Total
Appropriated Current Funds Current Funds Appropriated Current Funds Current Funds
CURRENT FUNDS REVENUES
Education and General
Tuition and Fees $8,763,620 $1,174,925 $9,938,545 $9,660,600 $1,219,600 $10,880,200
Endowment Income $0 $0 $0 $0 $0 $0
Sales and Services $20,022 $1,694,504 $1,714,526 $17,500 $1,745,300 $1,762,800
Other Sources $105,773 $342,822 $448,595 $116,000 $353,100 $469,100
Gift, Grant and Contract Funds $274,374 $7,577,623 $7,851,997 $423,600 $7,805,000 $8,228,600
Federal Appropriations $0 $0 $0 $0 $0 $0
State Appropriations $15,909,900 $0 $15,909,900 $16,676,900 $0 $16,676,900
Local Appropriations $0 $0 $0 $0 $0 $0
TOTAL EDUCATION ANO GENERAL $25,073,689 $10,789,874 $35,863,563 $26,894,600 $11,123,000 $38,017,600
Hospital (Including Appropriations) $0 $0 $0 $0 $0 $0
Auxiliary Enterprises $0 $4,187,398 $4,187,398 $0 $4,396,890 $4,396,800
Independent Operations $0 $0 $0 $O $0 $0
TOTAL REVENUES $25,073,689 $14,977,272 $40,050,961 $26,894,600 $15,519,800 $42,414,400
Expenditures and Transfers
Education ano General
Instruction S12,526,025 $1,581,890 $14,107,915 $13,835,999 $1,589,000 $15,424,909
Research $0 $0 $0 $0 $0 $0
Public Se-vice $0 $0 $0 $O $0 $O
Academic Support $2,425,263 $595,135 $3,020,398 $2,443,287 $597,800 $3,041,087
Student Services $2,112,689 $1,109,819 $3,222,508 $2,227,506 $1,114,800 $3,342,306
Institutional Support $4,080,117 $1,553,773 $5,633,890 $5,103,268 $1,560,800 $6,664,068
Operation and Maintenance of Plant $3,493,131 $0 $3,493,131 * $3,284,630 $0 $3,284,630
Scholarships and Fellowships $0 $6,139,519 $6,139,519 $6,167,300 $6,167,300
Transfers (Het) $0 $92,810 $92,810 * $0 $93,300 $93,300
TOTAL EDUCATION AND GENERAL $24,637,225 $11,072,946 $35,710,171 $26,894,600 $11,123,000 $38,017,600
Hospitals
Expenditures $0 $0 $0 $0 $0 $0
Transfers (Met) $0 $0 $0 $O $0 $0
TOTAL HOSPITALS $0 $0 $0 $0 $0 $0
Auxiliary Enterprises
Expenditures $0 $3,870,302 $3,870,302 $0 $4,058,600 $4,058,600
Transfers (Net) SO $322,463 $322,463 SO $338,200 $338,200
TOTAL AUXILIARY ENTERPRISES $0 $4,192,765 $4,192,765 $0 $4,396,800 $4,396,800
Total Independent Operations $0 $0 $0 $0 $0 $0
TOTAL EXPEMDITLRES AND TRANSFERS $24,637,225 $15,265,711 $39,902,936 $26,894,600 $15,519,800 $42,414,400
REVENUE/EXPENDITURES DIFFERENCE $436,40 ($288,439) $148,025 $O $O $0
1 '1 0
2 9

SUMMARY OF CURRENT FUNDS, REVENUES, EXPENDITURES AND TRANSFERS TABLE 7
UTAH VALLEY COMMUNITY COLLEGE 1993-94 ESTIMATED
CURRENT FUNDS REVENUES
Education and General
Appropriated
Other
Current Funds
Total
Current Funds
Tuition and Fees $10,731,100 $1,268,400 $11,999,500
Endowment Income $0 $0 $0
Sales and Services $17,500 $1,815,100 $1,832,600
Other Sources $116,000 $367,200 $483,200
Gift, Grant and Contract Funds $423,600 $8,117,200 $8,540,800
Federal Appropriations $0 SO $0
State Appropriations $19,327,000 $0 $19,327,000
Local Appropriations $0 $0 $0
TOTAL EDUCATION AND GENERAL $30,615,200 $11,667,900 $42,183,100
Hospital (Including Appropriations) $0 $0 $0
Auxiliary Enterprises $0 $4,572,700 $4,572,700
Independent Operations $0 $0 $0
TOTAL REVENUES $30,615,200 $16,140,600 $46,765,800
Expenditures and Transfers
Education and General
Instruction $15,565,400 $1,652,600 $17,218,000
Research $0 $0 $0
Public Service $0 $0 $0
Academic Support $3,013,700 $621,700 $3,635,400
Student Services $2,625,300 $1,159,400 $3,784,700
Institutional Sdpport $5,070,100 $1,623,200 $6,693,300
Operation and Saintenance of Plant $4,340,700 $0 $4,340,700
Scholarships and Fellowships $0 $6,414,000 $6,414,000
Transfers (Net) $0 $97,000 $97,000
TOTAL EDUCATION AND GENERAL $30,615,200 $11,567,900 $42,183,100
Hospitals
Expenditures $0 $0 $0
Transfers (Net) $O $0 $0
TOTAL HOSPITALS $0 $0 $0
Auxiliary Enterprises
Expenditures $0 $4,221,000 $4,221,000
Transfers (Net) $0 $351,700 $351,700
TOTAL AUXILIARY ENTERPRISES $0 $4,572,700 $4,572,700
Total Independent Operations $0 $0 $0
TOTAL EXPFNDITURES AND TRANSFERS $30,615,200 $16,140,600 $46,755,800
REVENUE/EXPENDITURES DIFFERENCE $0 $0 $0

SALT LAKE COMMUNITY COLLEGE
SUMMARY OF CURRENT FUNDS, REVENUES, EXPENDITURES AND TRANSFERS TABLE 7
1991-92 Actual 1992-93 ESTIMATED
Other Total Other Total
Appropriated Current Funds Current Funds Appropriated Current Funds Current Funds
CURRENT FUNDS REVENUES
Education and General
Tuition and Fees $13,305,914 $2,477,160 $15,783,074 $10,434,000 $2,554,000 512,988,000
Endowment Income $0 $26,686 $26,686 $0 $27,500 $27,500
Sales and Services $30,661 $274,259 $304,920 $45,000 $282,500 $327,500
Other Sources $61,829 $1,298,942 $1,360,771 $0 $1,337,900 $1,337,900
Gift, Grant and Contract Funds $546,609 $10,708,420 $11,257,029 $640,400 $11,029,700 $11,670,100
Federal Appropriations $0 $0 $0 $0 $0 $0
State Appropriations $27,394,500 $0 $27,394,500 + $28,789,400 $0 $28,789,400
Local Appropriations $0 $0 $0 $0 $0 $0
TOTAL EDUCATION AND GENERAL $41,341,513 $14,785,467 $56,126,980 $39,908,800 $15,231,600 $55,140,400
Hospital (Including Appropriations) $0 $0 $0 $0 $0 $0
Auxiliary Enterprises $0 $7,161,975 $7,161,975 $0 $7,520,100 $7,520,100
Independent Operations $0 $0 $0 $0 $0 $0
TOTAL FUNDS AVAILABLE $41,341,513 $21,947,442 $63,288,955 $39,908,800 $22,751,700 $62,660,500
Expenditures and Transfers
Education and General
Instruction $22,300,767 $2,034,817 $24,335,584 $22,023,200 $2,168,300 $24,191,500
Research $0 $0 $0 $0 $0 $0
Public Service $0 $0 $0 $0 $0 $0
Academic Support $2,484,778 $740,785' $3,225,563 $2,305,000 $789,400 $3,094,400
Student Services $3,523,473 $2,001,623 $5,525,096 $3,647,400 $2,132,900 $5,780,300
Institutional Support $6,933,476 $1,128,710 $8,062,186 * $6,743,500 $1,202,800 $7,946,300
Operation and Maintenance of Plant $5,086,919 $439,986 $5,526,905 $5,125,200 $468,800 $5,594,000
Scholaiships and Fellowships $55,762 $7,697,211 $7,752,973 $64,500 $8,202,100 $8,266,600
Transfers (Net) $0 $250,811 $250,811 * $0 $267,300 $267,300
TOTAL EDUCATICM AND GENERAL $40,385,175 $14,293,943 $54,679,118 $39,908,800 $15,231,600 $55,140,480
Hospitals
Expenditures $O $0 $0 $0 $0 $0
Transfers (Net) $0 $0 $0 $0 $0 $0
TOTAL HOSPITALS $0 $0 $0 $0 $0 $0
Auxiliary Enterprises
Expenditures $0 $6,585,663 $6,585,663 $0 $7,076,400 $7,076,400
Transfers (Net) $0 $412,895 $412,895 $0 $443,700 $443,700
TOTAL AUXILIARY ENTERPRISES $0 $6,996,558 $6,998,558 $0 $7,520,100 $7,520,100
Total Independent Operations $0 $0 $0 $0 $0 $0
TOTAL EXPENDITURES AND TRANSFERS $40,385,175 $21,292,501 $61,677,676 $39,908,800 $22,751,700 $62,660,500
REVENUE/EXPENDITURES DIFFERENCE $956,338 $654,941 $1,611,279 $0 $0 $0
+Difference from IPEDS report and Financial Statement due to revenue received but not expended.
*Difference from IPEDS report and Financial Statement due to different definitions used by the budget office as compared to the accounting office.
3 1

SUMMARY Of CURRENT FUNDS, REVENUES, EXPENDITURES AND TRANSFERS TABLE 7
SALT LAXE CCOMUNITY COLLEGE 1993-94 ESTIMATED
CURRENT FUNDS REVENUES
Education and General
Appropriated
Other
Current Funds
Total
Current Funds
Tuition and Fees $12,695,600 $2,656,200 $15,351,800
Endowment Income $0 $28,600 $28,600
Sales and Services $45,000 $293,800 $338,800
Other Sources $0 $1,391,400 $1,391,400
Gift, Grant and Contract Funds $640,400 $11,470,900 $12,111,300
Federal Appropriations $0 $0 $0
State Appropriations $34,627,000 $0 $34,627,000
Local Appropriations $0 $0 $0
TOTAL EDUCATION AND GENERAL $48,008,000 $15,840,900 $63.848,900
Hospital (Including Appropriations) $0 $0 $0
Auxiliary Enterprises $0 $7,820,900 $7,820,900
Independent Operations $0 $0 $0
TOTAL FUNDS AVAILABLE $48,008,000 $23,661,800 $71,669,800
Expenditurec and Transfers
Education and General
Instruction $26,510,100 $2,255,000 $28,765.100
Research $0 $0 $0
Public Service $0 :0 $0
Academic Support $2,963,800 $821,000 $3,774,800
Student Services $4,188,500 $2,218,200 $6,406,700
Institutional Support $8,242,200 $1,250,900 $9,493,100
Operation and Maintenance of Plant $6,047,100 $487,600 $6,534,700
Scholarships and Fellowships $66,300 $8,530,200 $8,596,500
Transfers (Net) $0 $277,900 $277,900
TOTAL EDUCATION AND GENERAL $48,008,000 $15,840,800 $63,848,8110
Hospitals
Expenditures $0 $0 $0
Transfers (Net) $0 $0 $0
TOTAL HOSPITALS $0 $0 $0
Auxiliary Enterprises
Expenditures $0 $7,359,600 $7,359,600
Transfers (Net) $0 $461,400 $461,400
TOTAL AUXILIARY ENTERPRISES $0 $7,821,000 $7,821,000
Total Independent Operations $0 $0 $0
TOTAL EXPENDITURES AND TRANSFERS $48,008.000 $23,661,800 $71,669,800
REVENUE/EXPENDITURES DIFFERENCE $0 $0 $0
3 2 1:i 3

NINE INSTITUTION TOTAL
SUMMARY Of CURRENT FUNDS, REVENUES, EXPENDITURES AND TRANSFERS TABLE 7
1991-92 Actual 1992-93 ESTIMATED
Other Total Other Total
Appropriated Current Funds Current Funds Appropriated Current Funds Current Funds
CURRENT FUNDS REVENUES
Education and General
Tuition and Fees $108,385,027 $28,157,691 $136,542,718 $105,984,700 $29,574,800 $135,559,500
Endowmuit Income $0 $9,406,550 $9,406,550 $0 $9,688,800 $9,688,800
Sales and Services $991,594 $132,168,269 $133,159,863 $1,112,500 $136,133,400 $137,245,900
Cther Sources $1,619,408 $20,524,823 $22,144,231 $2,340,600 $21,140,500 $23,481,100
Gift, Grant and Contract Funds $1,548,803 $280,353,443 $281,902,246 $2,251,500 $288,764,100 $291,015,600
Federal Appropriations $4,048,336 $222,849 $4,271,185 $3,626,400 $0 $3,626,400
State Appropriations $326,139,045 $0 $326,139,045 $337,374,300 $0 $337,374,300
Local Appropriations $0 $0 $0 $0 $0 $0
TOTAL EDUCATION AND GENERAL $442,732,213 $470,833,625 $913,565,838 $452,690,000 $405,301,600 $937,991,600
Hospital (Incldding Appropriations) $3,165,100 $197,557,487 $200,722,587 $3,165,100 $207,435,400 $210,600,500
Auxiliary Enterprises $0 $94,102,683 $94,102,683 $0 $97,342,200 $97,342,200
Independent Operations $0 $0 $0 $0 $0 $O
TOTAL REVENUES $445,897,313 $762,493,795 $1,208,391,108 $455,855,100 $790,079,200 $1,245,934,300
Expenditures and Ttansfers
Education and General
Instruction $223,523,487 $51,296,952 $274,820,439 $236,607,071 $54,722,300 $291,329,371
Research $15,416,212 $141,159,183 $156,575,395 $16,328,400 $151,452,000 $167,780,400
Public Service $14,923,435 $129,040,422 $143,963,857 $14,474,848 $141,993,000 $156,467,848
Academic Support $48,444,639 $15,779,305 $64,223,944 $43,953,561 $17,011,400 $60,964,961
Student Services $28,911,342 $10,394,879 $39,306,221 $28,598,706 $10,998,800 $39,597,506
Institutional Support $50,530,296 $17,402,618 $67,932,914 $53,859,788 $18,298,900 $72,158,688
Operation and Maintenance of Plant $55,101,346 $2,048,785 $57,150,131 $57,495,994 $2,222,800 $59,718,794
Scholarships and Fellowships $749,464 $68,263,744 $69,013,208 $651,732 $71,874,400 $72,526,132
Transfers (Net) $2,642,380 $15,875,212 $18,517,592 $602,700 $16,728,000 $17,330,700
TOTAL EDUCATION AND GENERAL $440,242,601 $451,261,100 $13C1,503,701 $452,572,800 $485,301,600 $937,874,400
Hospitals
Expenditures $3,165,100 $182,439,520 $185,604,620 $3,282,300 $196,938,500 $200,220,800
Transfers (Net) $0 $9,892,776 $9,892,776 $0 $10,496,900 $10,496,900
TOTAL HOSPITALS $3,165,100 $192,332,296 $195,497,396 $3,282,300 $207,435,400 $210,717,700
Auxiliary Enterprises
Expenditures $0 $93,856,061 $93,856,061 $0 $94,955,800 $94,955,800
Transfers (Net) $0 $2,273,950 $2,273,950 $0 $2,386,400 $2,386,400
TOTAL AUXILIARY ENTERPRISES $0 $96,130,011 $96,130,011 $0 $97,342,200 $97,342,200
Total Independent Cperations $0 $0 $O $0 $0 $0
TOTAL EXPENDITURES AND TWISFERS $443,407,701 $739,723,407 $1,183,131,108 $435,855,100 $790,079,200 $1,245,934,300
REVENUE/EXPENDITURES DIFFERENCE $2,489,612 $22,770,388 $25,260,000 $0 $0 $0
174
3 3

SUMMARY OF CURRENT FUNDS, REVENUES, EXPENDITURES AND TRANSFERS TABLE 7
NINE INSTITUTION TOTAL 1993-94 ESTIMATED
CURRENT FUNDS REVENUES
Education and General
Appropriated
Other
Current Funds
Total
Current Funds
Tuition and Fees $126,289,543 $31,476,200 $157,765,743
Endowment Income $0 $10,076,300 $10,076,300
Sales and Services $1,112,500 $141,578,700 $142,691,200
Cther Sources $2,340,557 $21,986,200 $24,326,757
Gift, Grant and Contract Funds $2,251,500 $300,314,600 $302,566,100
Federal Appropriations $3,626,400 $0 $3,626,400
State Appropriations $383,410,700 $0 $383,410,700
Local Appropriations $0 SO $0
TOTAL EDUCATION AND GENERAL $519,031,200 $505,432,000 $1,024,463,200
Hospital (Including Appropriations) $3,413,600 $215,732,800 $219,146,400
Auxiliary Enterprises $0 $101,235,900 :101,235,900
Independent Operations $0 $0 $0
TOTAL REVENUES $522,444,800 $822,400,700 $1,344,845,500
Expenditures and Trmnsfers
Education and General
Instruction $264,720,800 $57,002,100 $321,722,900
Research $18,307,100 $157,727,100 $176,034,200
Public Service $17,688,000 $147,830,500 $165,518,500
Academic Support $57,296,500 $17,718,100 $75,014,600
Student Services $34,557,200 $11,457,000 $46,014,200
Institutional Support $60,111,800 $19,062,600 $79,174,400
Operation and Maintenance of Plant $65,465,400 $2313,400 $67,778,800
Scholarships and Fellowships $884,400 $74,888,900 $75,773,300
Transfers (Net) $0 $17,432,300 $17,432,300
TOTAL EDUCATION AND GENERAL $519,031,200 $505,432,000 $1,024,463,200
Hospitals
Expenditures $3,413,600 $204,816,000 $208,229,600
Transfers (Net) $0 $10,916,700 $10,916,700
TOTAL HOSPITALS $3,413,600 $215,732,730 $219,146,300
Auxiliary Enterprises
Expenditures $0 $98,754,100 $98,754,100
Transfers (Net) $0 $2,481,900 $2,481,900
TOTAL AUXILIARY ENTERPRISES $0 $101,236,000 $101,236,000
Total Independent Operations $0 $0 $0
TOTAL EXPENDITURES AND TRANSFERS $522,444,800 $822,400,700 $1,344,845,500
REVENUE/EXPENDITURES DIFFERENCE $O $0 $0
1 7 53 4

SBR & STATEWIDE PROGRAMS
SUMMARY OF CURRENT FUNDS, REVENUES, EXPEWITURES AhD TRANSFERS TABLE 7
1991-92 Actual 1992-93 ESTIMATED
Other Total Other Total
Appropriated Current Funds Current Funds Appropriated Current Funds Current Funds
CURRENT FUNDS REVENUES
Education and General
Tuition and Fees $0 $O SO $0 $0 $0
Endowment Income SO $0 $0 $0 $0 $0
Sales and Services $0 $0 $0 $0 $0 SO
Other Sources $122,148 $5,429,804 $5,551,952 $55,000 $5,592,700 $5,647,700
Gift, Grant and Contract Funds $72,202 $909,342 $981,544 $59,600 $936,600 $996,200
Federal Appropriations $0 $0 $O $0 $0 $0
State Appropriations $4,862,400 $0 $4,862,400 $4,906,400 $0 $4,906,400
Local Appropriations $0 $0 $0 $0 $0 $0
TOTAL EDUCATION AND GENERAL $5,056,750 $6,339,146 $11,395,896 $5,021,000 $6,529,300 $11,550,300
Hospital (Including Appropriations) $O $0 $0 $0 $0 $0
Auxiliary Enterprises $0 $0 $0 $0 $0 $0
Independent Operations $0 $0 $0 $0 $0 $0
TOTAL REVENUES $5,056,750 $6,339,146 $11,395,896 $5,021,000 $6,529,300 $11,550,300
Expenditures and Transfers
Education and General
Instruction $0 $308,911 $308,911 $0 $500,600 $500,600
Research $0 $0 $0 $0 $0 $0
Public Service $0 $O $0 $0 $0 $0
Academic Support $71,500 $O $71,500 $75,000 $0 $75,000
Student Services $0 $2,410,939 $2,410,939 $0 $3,907,400 $3,907,400
Institutional Support $3,424,466 $723,905 $4,148,371 $1,692,500 $1,173,200 $2;865,700
Operation and Maintenance of Plant $0 $0 $0 $0 SO $0
Scholarships and Fellowships $1,637,025 $585,023 $2,222,048 $1,580,600 $948,100 $2,528,700
Transfers (Net) $1,225,413 $0 $1,225,413 $1,672,900 $0 $1,672,900
TOTAL EDUCATION AND GENERAL $6,358,404 $4,028,777 $10,387,181 $5,021,000 $6,529,300 $11,550,300
Hospitals
Expenditures $0 $0 $0 $0 $0 SO
Transfers (Net) $0 $0 $0 $O $O $0
TOTAL HOSPITALS $0 $0 $0 $0 $0 $O
Auxiliary Enterprises
Expenditures $O $0 $0 $0 $0 $0
Transfers (Net) $0 $0 $0 $0 $0 $0
TOTAL AUXILIARY ENTERPRISES $0 $0 $0 SO $0 $0
Total Independent Operations $0 $0 $0 $0 $O $0
TOTAL EXPENDITURES ANO TRANSFERS $6,358,404 $4,028,777 $10,387,181 $5,021,000 $6,529,300 $11,550,300
REVENUE/EXPENDITURES DIFFERENCE ($1,301,654) $2,310,368 $1,008,714 $O $0 $0
176
3 5

SUMMARY Of CURRENT FUNDS, REVENUES, EXPENDITURES AND 1RANSFERS TABLE 7
TOTAL USHE 1993-94 ESTIMATED
CURRENT FUNDS REVENUES
Education and General
Appropriated
Other
Current Funds
Total
Current Funds
Tuition and Fees $126,289,543 $31,476,200 $157,765,743
Endowment Income $0 $10,076,300 $10,076,300
Sales and Services $1,112,500 $141,578,700 $142,691,200
Other Sources $2,395,557 $27,802,600 $30,198,157
Gift, Grant and Contract Funds $2,311,100 201,288,700 $303,599,800
Federal Appropriations $3,626,400 $0 $3,626,400
State Appropriations $397,289,300 $0 $397,289,300
Local Appropriations $0 $0 $0
TOTAL EDUCATION AND GENERAL $533,024,400 $512,222,500 $1,045,246,900
Hospital (Including Appropriations) $3,413,600 $215,732,800 $219,146,400
Auxiliary Enterprises $0 $101,235,900 $101,235,900
Independent Operations $0 $0 $0
TOTAL REVENUES $536,438,000 $829,191,200 $1,365,629,200
Expenditures and Transfers
Education and General
Instruction $270,462,400 $57,522,800 $327,985,200
Research $18,307,100 $157,727,100 $176,034,200
Public Service $17,688,000 $147,830,500 $165,518,500
Academic Support $57,386,200 $17,718,100 $75,104,300
Student Services $34,557,200 $15,520,640 $50,077,800
Institutional Support $64,409,300 $20,282,700 $84,692,000
Operation and Maintenance of Plant $65,465,400 $2,313,400 $67,778,800
Scholarships and Fellowships $2,938,800 $75,875,000 $78,813,800
Transfers (Net) $1,810,000 $17,432,300 $19,242,300
TOTAL EDUCATION AND GENERAL $533,024,400 $512,222,500 $1,045,246,900
Hospitals
Expenditures $3,413,600 $204,816,000 $208,229,600
Transfers (Net) $O $10,916,700 $10,916,700
TOTAL HOSPITALS $3,413,600 $215,732,700 $219,146,300
Auxiliary Enterprises
Expenditures $0 $98,754,100 $98,754,100
Transfers (Net) $0 $2,481,900 $2,481,900
TOTAL AUXILIARY ENTERPRISES $0 $101,236,000 $101,236,000
Total Independent Operations $0 $0 $0
TOTAL EXPENDITURES AND TRANSFERS $536,438,000 $829,191,200 $1,365,629,200
REVENUE/EXPENDITURES DIFFERENCE $0 $0 $0
1 7 73 6

TOTAL USHE
SUMORY Cf CLRREKT FUNDS, REVENUES, EXPENDITURES AND TRANSFERS TABLE 7
1991-92 Actual 1992-93 ESTIMATED
Other Total Other Total
Appropriated Current Funds Current Funds Appropriated Current Funds Current Funds
CURRENT FUNDS REVENUES
Education and General
Tuition and Fees $108,385,027 $28,157,691 $136,542,718 $105,984,700 $29,574,800 $135,559,500
Endowment Income $0 $9,406,550 $9,406,550 $0 $9,688,800 $9,688,800
Sales and Services $991,594 $132,168,269 $133,159,863 $1,112,500 $136,133,400 $137,245,900
Other Sources $1,741,556 $25,954,627 $27,696,183 $2,395,600 $26,733,200 $29,128,800
Gift, Grant and Contract Funds $1,621,005 $281,262,785 $282,883,790 $2,311,100 $289,700,700 $292,011,800
Federal Appropriations $4,048,336 $222,849 $4,271,185 $3,626,400 $0 $3,626,400
State Appropriations $331,001,445 $0 $331,001,445 $342,280,700 $0 $342,280,700
Local Appropriations $0 $0 $0 $0 $0 $0
TOTAL EDUCATION AND GENERAL $447,788,963 6477,172,771 $924,961,734 $457,711,000 $491,830,900 $949,541,900
Hospital (Including Appropriations) $3,165,100 $197,557,487 $200,722,587 $3,165,100 $207,435,400 $210,600,500
Auxiliary Enterprises $0 $94,102,683 $94,102,683 $0 $97,342,200 $97,342,200
Independent Operations $0 $0 $0 $0 $0 $0
TOTAL REVENUES $450,954,063 $768,832,941 $1,219,787,004 $460,876,100 $796,608,500 $1,257,484,600
Expenditures and Transfers
Education and General
Instruction $223,523,487 $51,605,863 $275,129,350 $236,607,071 $55,222,900 $291,829,971
Research $15,416,212 $141,159,183 $156,575,395 $16,328,400 $151,452,000 $167,780,400
Public Service $14,923,435 $129,040,422 $143,963,857 $14,474,848 $141,993,000 $156,467,848
Academic Support $48,516,139 $15,779,305 $64,295,444 $44,028,561 $17,011,400 $61,039,9'1
Student Services $28,911,342 $12,805,818 $41,717,160 $28,598,706 $14,906,200 $43,504,9u6
Institutional Support $53,954,762 $18,126,523 $72,081,285 $55,552,288 $19,472,100 $75,024,388
Operation and Kaintenance of Plant $55,101,346 $2,048,785 $57,150,131 $57,495,994 $2,222,800 $59,718,794
Scholarships and Fellowships $2,386,489 $68,848,767 $71,235,256 $2,232,332 $72,822,500 $75,054,832
Transfers (Net) $3,867,793 $15,875,212 $19,743,005 $2,275,600 $16,728,000 $19,003,600
TOTAL EDUCATION AND GENERAL $446,601,005 $455,289,877 $901,890,882 $457,593,800 $491,830,900 $949,424,700
Hospitals
Expenditures $3,165,100 $182,439,520 $185,604,620 $3,282,300 $196,938,500 $200,220,800
Transfers (Net) $0 $9,892,776 $9,892,776 $0 $10,496,900 $10,496,900
TOTAL HOSPITALS $3,165,100 $192,332,296 $195,497,396 $3,282,300 $207,435,400 $210,717,700
Auxiliary Enterprises
Expenditures $0 $93,856,061 $93,856,061 $0 $94,955,800 $94,955,800
Transfers (Het) $0 $2,273,950 $2,273,950 $0 $2,386,400 $2,386,400
TOTAL AUXILIARY ENTERPRISES $0 $96,130,011 $96,130,011 $O $97,342,200 $97,342,200
Total Independent Operations $O $0 $0 $0 $0 $0
TOTAL EXPENDITURES AND TRANSFERS $449,766,105 $743,752,184 $1,193,518,289 $460,876,100 $796,608,500 $1,257,484,600
REVENUE/EXPENDITURES DIFFERENCE $1,187,958 $25,080,756 $26,268,714 $0 $0 $0
173
3 7

SUMARY OF CURRENT FUNDS, REVENUES, EXPENDITURES AND TRANSFERS TABLE 7
SBR & STATEWIDE PROGRAMS 1993-94 ESTIMATED
CURRENT FUNDS REVENUES
Education and General
Appropriated
Other
Current Funds
Total
Current Funds
Tuition and Fees $0 $0 $0
Endowment Income $0 $0 $0
Sales and Services $0 $0 $0
Other Sources $55,000 $5,816,400 $5,871,400
Gift, Grant and Contract Funds $59,600 $974,100 $1,033,700
Federal Appropriations $0 $0 $0
State Appropriations $13,878,600 $0 $13,878,600
Local Appropriations $0 $0 $0
TOTAL EDUCATION AND GENERAL $13,993,203 $6,790,500 $20,783,700
Hospital (Including Appropriations) $0 $0 $0
Auxiliary Enterprises $0 $0 $0
Independent Operations $0 $0 $0
TOTAL REVENUES $13,993,200 $6,790,500 $20,783,700
Expenditures and Transfers
Education and General
Instruction $5,741,600 $520,700 $6,262,300
Research $0 $0 $0
Public Service $0 $0 $0
Academic Support $89,700 $0 $89,700
Student Services $0 $4,063,600 $4,063,600
Institutional Support $4,297,500 $1,220,100 $5,517,600
Operation and Maintenance of Plant $0 $0 $0
Scholarships and Fellowships $2,054,400 $986,100 $3,040,500
Transfers (Net) $1,810,000 $0 $1,810,000
TOTAL EDUCATION AND GENERAL $13,993,200 $6,790,500 $20,783,700
Hospitals
Expenditures $0 $0 $O
Transfers (Net) $0 $0 $0
TOTAL HOSPITALS $0 $0 $0
Auxiliary Enterprises
Expenditures $0 $0 $0
Transfers (Net) $0 $0 $0
TOTAL AUXILIARY ENTERPRISES $0 $0 $0
Total Independent Operations $0 $0 $0
TOTAL EXPENDITURES AND TRANSFERS $13,993,200 $6,790,500 $20,783,700
REVENUE/EXPENDITURES DIFFERENCE $0 $0 $0
1793 8

H. B
udge
t His
tory
1

TAB HBUDGET HISTORY
Historical Information on USHE Appropriated Budgets 1
FIGURE 1 Expenditures per FTE Cumulative 15 Year Changes 2
FIGURE 2 Expenditures per FTE One Year Changes (91-92 over 90-91) 2
FIGURE 3 State Tax Funds per FTE Cumulative 15 Year Changes 3
FIGURE 4 State Tax Funds per FTE One Year Changes (91-92 over 90-91) 3
FIGURE 5 Tuition per FTE Cumulative 15 Year Changes 4
FIGURE 6 Tuition per FTE One Year Changes (91-92 over 90-91) 4
FIGURE 7 USHE Expenditures and Revenues per FTE 5
FIGURE 8 USHE Cumulative Percent Changes of per FTE Measures 5
FIGURE 9 University of Utah Expenditures and Revenues per FTE 6
FIGURE 10 University of Utah Cumulative Percent Changes 6
FIGURE 11 Utah State University Expenditures and Revenues per FTE 7
FIGURE 12 Utah State University Cumulative Percent Changes 7
FIGURE 13 Weber State University Expenditures and Revenues per FTE 8
FIGURE 14 Weber State University Cumulative Percent Changes 8
FIGURE 15 Southern Utah University Expenditures and Revenues per FTE 9
FIGURE 16 Southern Utah Univernity Cumulative Percent Changes 9
FIGURE 17 Snow College Expenditures and Revenues per FTE 10
FIGURE 18 Snow College Cumulative Percent Changes 10
FIGURE 19 Dixie College Expenditures and Revenues per FrE 11
FIGURE 20 Dixie College Cumulative Percent Changes 11

TAB HBUDGET HISTORY
Continued-- 1
FIGURE 21 College of Eastern Utah Expendttures and Revenues per FTE 12
FIGURE 22 College of Eastern Utah Cumulative Percent Changes 12
FIGURE 23 Utah Valley Comm College Expenditures and Revenues per FTE 13
FIGURE 24 Utah Valley Comm College CLmuiative Percent Changes 13
FIGURE 25 Satt Lake Comm College Expenditures and Revenues per FTE 14
FIGURE 26 Sett Lake Comm College Cumulative Percent Changes 14
TABLE 1 USHE 15 Year Changes In Enrollments and AppropriatedExpenditures, Appropriations, and Tax Funds 15
APPENDIX History of Enrollment and Budget Changes, USHE 17
TABLE 1 Current Dollar Expenditures 18
TABLE 2 Constant Dollar Expenditures 22
TABLE 3 Current Dollar State Tax Funds 26
TABLE 4 Constant Dollar State Tax Funds 30
TABLE 5 Current Dollar Tuition & Fee Revenues 34
TABLE 6 Constant Dollar Tuition & Fee Revenues 38
TABLE 7 Current Dollar Expenditures, Tax Funds,f.a.nd Tuition & Fees per FTE 42
TABLE 8 Constant Dollar Expenditures, Tax Funds,and Tuition & Fees per FTE 46
TABLE 9 Calculation of Constant Dollar InflatorsBased on CPI at December 31 50

HISTORICAL INFORMATION ON USHE APPROPRIATED BUDGETS
Background
The analysis presented in the following graphs and tables has been prepared
to provide a neutral analysis of recent budget history for the USHE and for each
individual institution. This is one of .nree basic data sets developed to proved
a balanced basis for analysis of the relative funding needs of USHE institutions.
the other two data sets are the USHE Cost Study, and Comparison Institutions
Financial Information.
Explanation of Attachments
Figures 1 through 6 show both cumulative 15-year relationships and most
recent 1-year relationships between enrollment change and changes in constant
dollar expenditures, State tax funds, and tuition revenues per FTE student for
each institution and total USHE. The graphs support the observation that both
expenditures per FTE and tax funds per FTE tended to be negatively associated
with enrollment growth over the 15-year period. In other words, funding
generally did not follow enrollment growth to an adequate degree. Looking at
Figure 5, however, there is no discernable long-term relationship between
enrollment growth and tuition revenues per FTE student.
Looking at Figures 7 and 8, the following patterns are apparent. The high
point in purchasing power per student for total USHE was in 1978-79. This high
point followed several years of state revenue growth during which time executive
and legislative policy supported improving the resources available to provide a
high quality system of higher education. Between 1979-80 and 1982-83, USHE
absorbed significant enrollment increases without needed increases in funding to
support the added students. This compounded by high inflation during thatperiod, including double digit CPI increases in 1979-80 and 1980-81.
After 1982-83, the Board instituted annual funded enrollment targets to
prevent further erosion in the resource support to maintain acceptable quality
for students enrolled. In 1984-85 and 1985-86 some gains were achieved.However, limited state revenues, and aggressive institutional enrollment policies
have caused deterioration since 1985-86. Constant dollar expenditures and tax
funds pre FTE budgeted for 1992-93 are lower than at any time in recent history.
At the same time, tuition revenues per FTE are expected to reach record highs
(although generally not high when compared to national averages and peer
institutions, except in some of the two-year colleges). Figures 9 through 26
provide similar trend information for each individual institution.
Table 1 provides basic data on the net changes for the 15-year period, for
each institution and total USHE. Finally, source data are arrayed in the
appendix for those who may wish to understand the calculations behind the trends
summarized in the graphs and Table 1.

40%
30%
20%
10%
0%
-10%
FIGURES 1 AND 2EXPENDITURES PER FTE (CONSTANT DOLLAR)
CHANGES IN ENRLMT & EXP/PER FTECUMULATIVE 15-YEAR CHANGES
-20%
-30%
-VyImUSU
SU
mUSIIC
or DC
UVCNISLCC
NISUUNISC
-40%0%
20%
15%
10%
5%
0%
-5%
-10%
-15%
EICEU
50% 100% 150% 200% 250%
CUM. CHANGES IN ENROLLMENT
CHANGES IN ENRLMT & EXP/PER FTEONE-YEAR CHANGES (91-92 OVER 90-91)
INCEU
INSLC
DcJU NUS E
Es SC INUVCC
-20%0% 2% 4% W% 8% 10% 12% 14% 16% 18% 20%
ONE-YEAR CHANGES IN ENROLLMENT
2

1
FIGURES 3 AND 4STATE TAX FUNDS PER FTE (CONSTANT DOLLAR)
CHANGES IN ENRLMT & TX FNDS/PER FTECUMULATIVE 15-YEAR CHANGES
40%
30%
20%
10%
0
-10
-20
-30
-40
-50
MUU
,
116114%YSHE1
mDCL.JVCC
SLCC
,
msr, mSUU
CEU
-I-,..0% 50% 100
CUM. CHANGES IN ENROLLMENT
CHANGES IN ENRLMT & TX FNDS/PER FTEONE-YEAR CHANGES (91-92 OVER 90-91)
20%
15%
10%
5%
0% BC
low SU -t-R-6 JU mSLCC
-5%
mUSU
mUSHE -SC
mUvCC-10%
-15%
-20%0% 2% 4% 6°,4 8% 10% 12% 14% 16% 18% 20%
ONE-YEAR CHANGES IN ENROLLMENT
3
1SG

60%
50%
40%
30%
20%
10%
0%
-10%
-20%
-30%
FIGURES 5 AND 6TUITION PER FTE (,JNSTANT DOLLAR)
CHANGES IN ENRLMT & T&F/PER FTECUMULATIVE 15-YEAR CHANGES
arSC
fitlASU
UU
-40%0% 50% 100% 150%
CUM. CHANGES IN ENROLLMENT
20%
10%
0%
-10%
-20%
-30%
-40%
LU HENIIDC
CEU
200%
CHANGES IN ENRLMT & T&F/PER FTEONE-YEAR CHANGES (91-92 OVER 90-91
250%
0161_6CEU lutist)
ImdtPU 11SHESC
IEUVCC
DC
-Hs"
0% 2% 4% 6% 8% 10% 12% 14% 16%
ONE-YEAR CHANGES IN ENROLLMENT
4
1S7
18% 20%
1

$7,000.0
$6.000.0
$5,000.0
$4,000.0
$3,000.0
$2,000.0
$1,000.0
20%
15%
10%
5%
0%
-5%
-10%
-15%
FIGURES 7 AND 8
UTAH SYSTEM OF HIGHER EDUCATIONE & G + RELATED (CONSTANT $)
1976-77 1978-79 1980-81 1982-83 1984-85 1986-87 1988-89
EXP/FTE TAX/FTE T&F/FTE
1990-91
UTAH SYSTEM OF HIGHER EDUCATIONCUMULATIVE % CHANGES (CONSTANT $)
1976-77 1978-79 1980-81 1982-63 1984 -85 1986-87 1988-89 1990-91
EXP/FTE TAX/FTE T&F/FTE
5
1 S 3

$8,000.0
$7,000.0
$6,000.0
$5 ,000.0
$4.000.0
$3.000.0
$2,000.0
FIGURES 9 AND 10
UNIVERSITY OF UTAHE & G + RELATED (CONSTANT $)
$1,000.0 a
1976-77 197,9-79 1980-81 1982-83 198;1-85 1986-87 1988-89 1990-91
30%
25%
20%
15%
10%
5%
0%
-5%
EXP/FTE TAX/FTE -->K-- T&F/FTE
UNIVERSITY OF UTAHCUMULATIVE % CHANGES (CONSTANT $)
-10%1976-77 1976-79 1980-81 1982-83 1964-85 1986-87 198'8-89 1990-91
EXP/FTE -1--- TAX/FTE T&F/FTE
6

$8,000.0
$7,000.0
$6.000.0
$5.000.0
$4.000.0
$3.000.0
$2.000.0
$1.000.0
20%
15%
10%
5%
0%
-5%
-10%
FIGURES 11 AND 12
UTAH STATE UNIVERSITYE & G + RELATED (CONSTANT $)
,
1976-77,
1978-79-, ,
1980-81,
1982-83 1984-85,
1986-871 I I
1988-89
-0- EXP/FTE --f-- TAX/FTE --)K-- T&F/FTE
UTAH STATE UNIVERSITYCUMULATIVE % CHANGES (CONSTANT $)
1990-91
1976-77 1978-79 1980-81 1982-83 1984 -85 1986-87 1988-89 1990-91
-am- EXP/FTE --4- TAX/FTE -w--- T&F/FTE

$6.000.0
$5,000.0
$4 .000.0
$3,000.0
$2,000.0
$1,000.0
$0.0
40%
30%
20%
10%
0%
-10%
FIGURES 13 AND 14
WEBER STATE UNIVERSITYE & G + RELATED (CONSTANT $)
z'--\\
1976-77,
1978-79 1980-81 1982-83 1984-85,
1986-87,
1988-89
-IR-- EXP/FTE -1--- TAX/FTE -w,-- T&F/FTE
WEBER STATE UNIVERSITYCUMULATIVE % CHANGES (CONSTANT $)
,1990-91
1976-77 1978-79 1980-81I 1982-83 198'4-85 1986-87 1988-89 1990-91
--ND- EXP/FTE -+- TAX/FTE --)+(-- T&F/FTE
8
I 9 1

1
1
$7,000.0
$6,000.0
$5 .000.0
$4 ,000.0
$3 ,000.0
$2,000.0
$1,000.0
FIGURES 15 AND 16
SOUTHERN UTAH UNIVERSITYE & G + RELATED (CONSTANT $)
30%
20%
10%
0%
-10%
-20%
-30%
$0.0
st.. , 4--
1976-77 1978-79 1980-81 1982-83 1984-85 1986-87 1988-89 1990-91
EXP/FTE -4- TAX/FTE T&F/FTE
SOUTHERN UTAH UNIVERSITYCUMULATIVE % CHANGES (CONSTANT $)
11,
-40% I
1976-77 1978-79 1980-81 1982-83 1984-85 1986-87 1988-89
EXP/FTE TAX/FTE T&F/FTE
9
1 ;4 2
1990-91

$7,000.0
$6,000.0
$5,000.0
$4.000.0
$3.000.0
$2.000.0
$1,000.0
60%
50%
40%
30%
20%
10%
0%
-10%
-20%
-30%
FIGURES 17 AND 18
SNOW COLLEGEE & G + RELATED (CONSTANT $)
$0.0 i1976-77 1976-79 1980-81 1982-83 198..4-85 1986-87 1986-89 1990-91
EXP/FTE TAX/FTE T&F/FTE
SNOW COLLEGECUMULATIVE % CHANGES (CONSTANT $)
1976-77 1978-79 1980-81 1982-83 198.4-85 1986-87 1988-89 1990-91
EXP/FTE TAX/FTE T&F/FTE
10
ii3
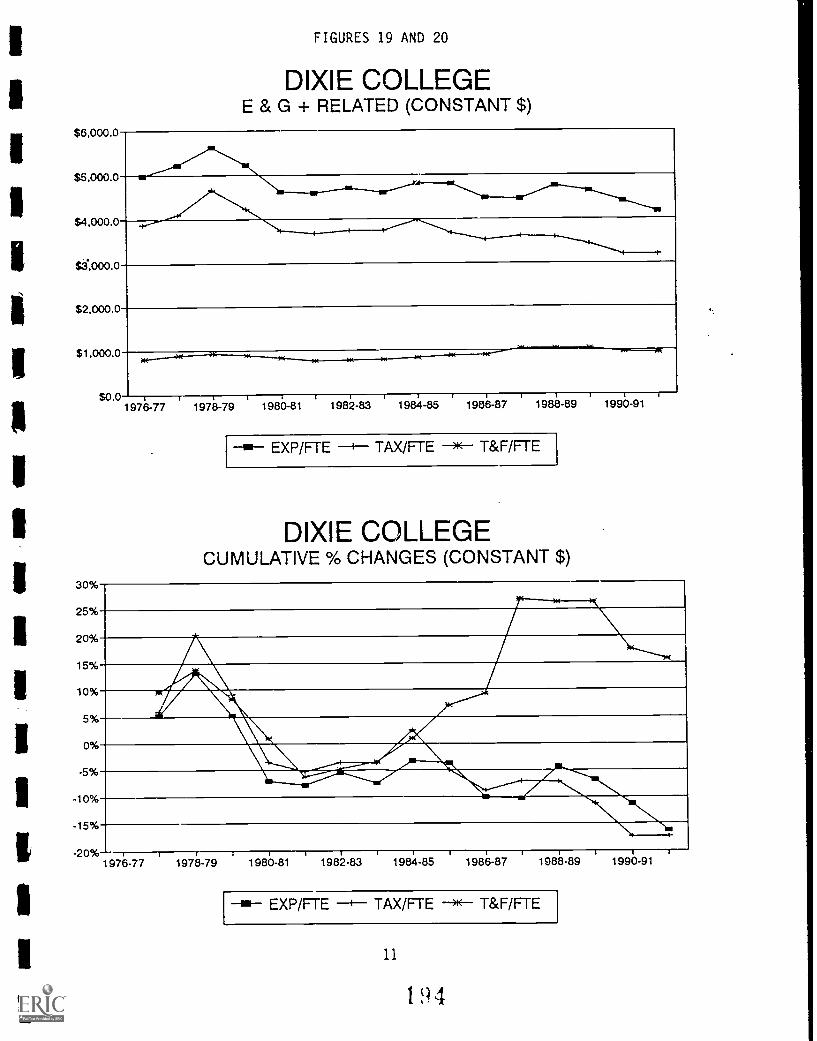
FIGURES 19 AND 20
DIXIE COLLEGEE & G + RELATED (CONSTANT $)
$6,000.0
$5.000.0
$4.000.0
S3..000.0
$2.000.0
$1,000.0
$0.0 I
1976-77 1978-79 1980-81 1982-83 198;1-85 1986-87 19813 -89 1990-91
30%
25%
20%
15%
10%
5%
0%
-5%
-10%
-15%
EXP/FTE TAX/FTE --w- T&F/FTE
DIXIE COLLEGECUMULATIVE % CHANGES (CONSTANT $)
-20%1976-77 1976-79 1980-81 1982-83 19814-85 1986-87 1986-89 1990-91
EXP/FTE TAX/FTE T&F/FTE
11
194

$8.000.0
$7.000.0
$6,000.0
$5 ,C00.0
$4.000.0
$3,000.0
$2,000.0
$1 .000.0
30%
20%
10%
0%
-10%
-20%
-30%
-40%
-50%
FIGURES 21 AND 22
COLLEGE OF EASTERN UTAHE & G + RELATED (CONSTANT $)
$0.0 1
1976-77 1978-79 1980-81 1982-83 1984-85 1986-87 1988-89 990-91
EXP/FTE -+- TAX/FTE T&F/FTE
COLLEGE OF EASTERN UTAHCUMULATIVE % CHANGES (CONSTANT $)
-N
1976-77 1978-79 1980-81 19k,2-63 1984-85 1986-87 1988-89
EXP/FTE TAX/FTE T&F/FTE
12
G
1990-91
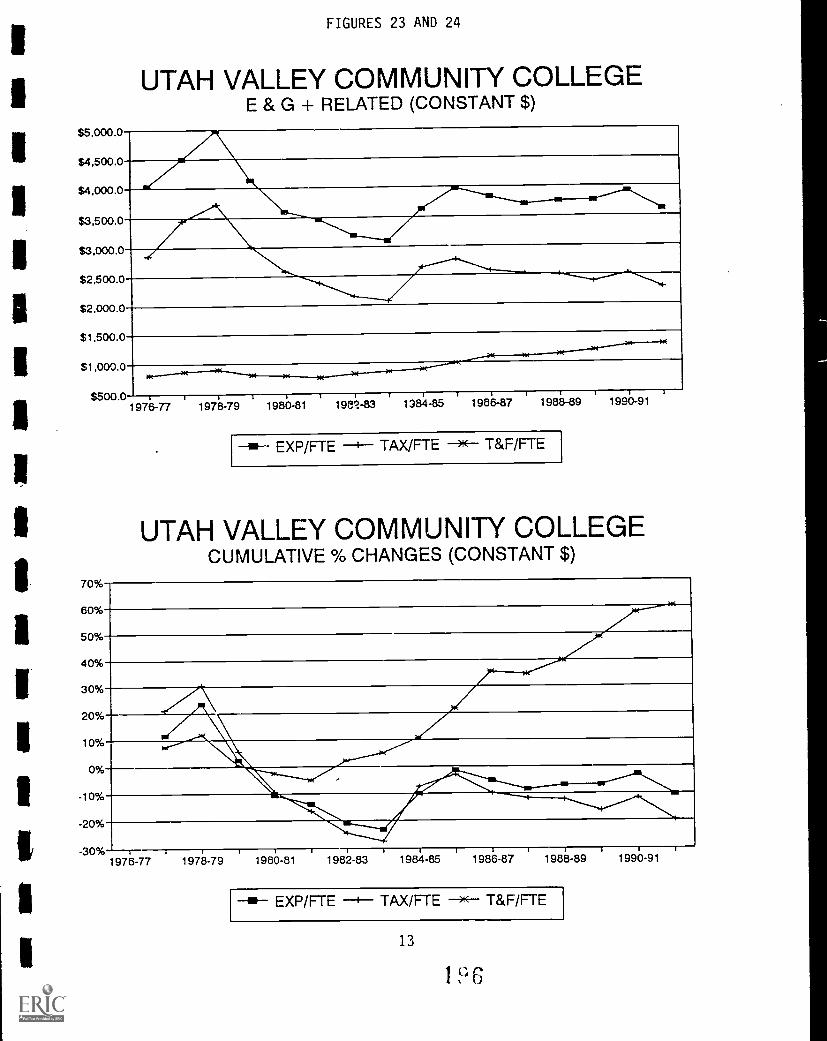
1
$5,000.0
$4,500.0
$4,000.0
$3,500.0
$3,000.0
$2,500.0
$2,000.0
$1,500.0
$1,000.0
$500.0
70%
60%
50%
40%
30%
20%
10%
0%
-10%
-20%
-30%
FIGURES 23 AND 24
UTAH VALLEY COMMUNITY COLLEGEE & G + RELATED (CONSTANT $)
1976-77 197E3-79 1980-81 1982-83 138'445 1988-87 1988-89 1990-91
EXP/FTE -1--- TAX/FTE T&F/FTE
UTAH VALLEY COMMUNITY COLLEGECUMULATIVE % CHANGES (CONSTANT $)
1976-77 1978-79 1980-81 1982-83 1984-85 1986-87 1988-89
EXP/FTE --f-- TAX/FTE T&F/FTE
13
1 9 6
1990-91

$4.500.0
$4,000.0
$3,500.0
$3.000.0
$2,500.0
$2,000.0
$1.500.0
$1,000.0
FIGURES 25 AND 26
SALT LAKE COMMUNITY COLLEGEE & G + RELATED (CONSTANT $)
-4--...............4,.....-,..---......4.
oo,-------44
$500.01976-77 1978-79 1980-81 1982-83 1984-85 1986-87 1988-89 1990-91
100%
80%
60%
40%
20%
0%
-20%
-as-- EXP/FTE -i---- TAX/FTE )1(-- T&F/FTE
SALT LAKE COMMUNITY COLLEGECUMULATIVE % CHANGES (CONSTANT $)
,
1976-77
/
,
1978-79,
1980-81,
1982-83 1984-85 1986-87 1988-89
-se- EXP/FTE --f--- TAX/FTE --)K- T&F/FTE
14
1 .', 7
1990-91

TABLE 1
15-Dec-92 USHE-I5 YEAR CHANGES IN ENROLLMENTS AND APPROPRIATED EXPENDITURES, APPROPRIATIONS, AND TAX FUNDS
University of Utah
Annualized
FTE
Current Dollars
Expend Tax Fund Tuit/Fees
per FIE per FTE per FTE
Constant Dollars
Expend Tax Fund Tuit/Fees
per FTE per FTE per FTE
1976-77 Actual 18,982 $2,917 12,109 1594 $6,916 15,002 11,408
1991-92 Actual 21,156 $7,167 $5,278 $1,801 $7,167 $5,278 11,801
% Change 11.5% 145.7% 150.2% 203.2% 3.6% 5.5% 27.9%
Utah State University
1976-77 Actual 9,518 12,679 11,908 $608 $6,352 $4,525 $1,442
1991-92 Actual 13,063 $5,907 $4,143 $1,342 15,907 $4,143 $1,342
% Change 37.2% 120.5% 117.1% 120.7% -7.0% -8.5% -6.9%
Weber State University
1976-77 Actual 7,634 12,121 $1,587 $421 $5,028 $3,763 $998
1991-92 Actual 10,936 $4,803 $3,363 $1,392 $4,803 $3,363 $1,392
% Change 43.3% 126.5% 111.9% 230.7% -4.5% -10.6% 39.5%
Southern Utah University
1976-77 Actual 1,807 $2,480 $2,052 $371 $5,881 $4,865 $679
1991-92 Actual 3,698 $4,468 $3,356 $1,080 $4,468 $3,356 $1,080
% Change 104.6% 80.1% 63.64 191.5% -24.0% -31.0 22.94
Snow College
1976-77 Actual 849 $2,455 $2,093 $292 $5,821 $4,962 $692
1991-92 Actual 1,590 $4,537 $3,520 $1,062 $4,537 $3,520 $1,062
% Change 134.4% 84.8% 68.2% 263.8% -22.1% -29.1% 53.4%
Dixie College
1976-77 Actual 1,150 $2,094 $1,634 $344 $4,965 $3,874 $816
1991-92 Actual 2,297 14,158 $3,204 $946 $4,158 $3,204 $946
% Change 99.7% 98.6% 96.1% 174.6% -16.3% -17.3% 15.8%
College of Eastern Utah
1976-77 Actual 543 $2,998 $2,659 $310 $7,108 16,306 $736
1991-92 Actual 1,693 14,870 $3,897 $820 14,870 $3,897 $820
% Change 211.8% 62.4% 46.5% 164.5% -31.5% -38.24 11.54
Utah Valley Community College
1976-77 Actual 2,881 $1,702 $1,202 $343 $4,035 $2,851 $813
1991-92 Actual 6,732 $3,611 $2,289 $1,302 $3,611 $2,289 $1,302
% Change 133.7% 112.2% 90.4% 279.9% -10.5% -19.7k 60.29;
Salt Lake Community College
1976-77 Actual 3,964 $1,638 $1,165 $279 $3,883 $2,762 $660
1991-92 Actual 10,243 $3,624 $2,391 $1,299 $3,624 $2,391 $1,299
% Change 158.44 121.3% 105.2% 366.44 -6.7% -13.4% 96.7%
Total USNE
1976-77 Actual 47,330 12,515 $1,843 $504 $5,964 $4,369 $1,195
1991-92 Actual 71,808 15,377 $3,841 $1,429 $5,377 $3,841 $1,429
% Change 51.7% 113.8% 108.5% 183.5% -9.8% -12.1% 19.6%
Pagel
*Analysis includes all Education & General line items plus all other instructional line items except
School of Med, RDEP and Skills Center.
** Budget-Related FTE beginning 1991-92.
15
1 ;43

TABLE 1
15-Dec-92 USHE-15 YEAR CHANGES IN ENROLLMENTS AND AppRoPRIATED EXPENDITURES, APPROPRIATIONS, AND TAX FUNDS Pagm 2
University of Utah
Current Dollar Tax Funds (000)
Total Medical Ag
Instit Programs Programs
Constant Dollar Tax Funds (000)
Total Medical Ag
Instit Programs Programs
00111117
1976-77 Actual $48,341 $5,792 $:14,624 $13,732
1991-92 Actual $134,348 $16,843 $134,348 $16,843
% Change 177.94 190.8% 17.2% 22.6%
Utah State University
1976-77 Actual $23,745 $4,264 $56,302 $10,110
1991-92 Actual $70,012 $13,103 $70,012 $13,103
% Change 194.9% 207.34 24.4% 29.6%
Weber State University
1976-77 Actual $12,265 $29,082
1991-92 Actual $36,982 $36,982
% Change 201.5% 27.2%
Southern Utah University
1976-77 Actual $3,740 $8,867
1991-92 Actual $12,475 S12,475
% Change 233.6% 40.7%
SWW College
1976-77 Actual $1,829 $4,336
1991-92 Actual $7,029 $7,029
% Change 284.44 62.1%
Dixie College
1976-77 Actual $1,945 54,613
1991-92 Actual $7,419 $7,419
Change 281.4 60.8%
College of Eastern Utah
1976-77 Actual $1,535 $3,641
1991-92 Actual $6,839 $6,839
% Change 345.44 87.9%
Utah Valley Community College
1976-77 Actual $3,485 $8,262
1991-92 Actual $15,460 $15,460
Change 343.7% 87.1%
Salt Lake Community College
1976-77 Actual $4,635 $10,991
1991-92 Actual 124,557 $24,557
% Change 429.8% 123.4%
Tetal USHE
1976-77 Actual $102,838 $243,842
1991-92 Actual $319,983 $319,983
% Change 211.2% 31.2%
16

xcm.zL.L.1
cl-cl-¢
1.1 Mae Milarialle NUM MEMOS. Iiii

History 14 -Dec-92
TM3LE I--Current Dollar Expenditures
in thousands of dollars
UNIVERSITY OF UTAH
1976-77
Actual
HISTCRY Of ERROAMENT AND BUDGET CHANGES, USHE
1977-78 1978-79 197940
Actual I-Yr Inc Actual 1-Yr Inc 2-Yr Inc Actual 1-Yr Inc 3-Yr Inc
1980-81
Actual 1-Yr Inc 4-Yr Inc
Annualized ETV' 18,982 18,699 -1.49% 17,975 -3.87% -5.31% 18,430 2.53% -2.91% 18,768 1.83% -1.13%
Ed & Gen Coop Nursing $55,366 $60,756 9.734 $66,783 9.92% 20.62% $71,509 7.08% 29.16% 177,582 8.494 40.12%
Medical Programs (Incl 5th Path) $6,644 $7,304 9.94% $7,855 7.54% 18.23% $8,925 13.634 34.344 $9,837 10.22% 48.07%
All Other (Including KUED) $2,424 $3,650 50.61% $3,686 1,004 52.11% $3,448 -6.46% 42.29% $3,425 -0.684 41.32%
Total $64,433 $71,710 11.29% $78,324 9.2294 21.56% $83,882 7.10% 30.18% 590,844 8.3014 40.99%
UTAH STATE UNIVERSITY
Annualized FTE** 9,518 9,729 2.22% 9,156 -5.89% -3.80% 9,562 4.43% 0.46% 10,359 8.34% 8.$44
Ed & Gen CE Centers Coop M Ed $25,496 $28,348 11.19% 131,221 10.13% 22.45% 133,971 8.814 33.24% 37,413 10.13% 46.74%
Agricultural Programs $7,313 18,297 13.46% 59,034 8.88% 23.53% $9,972 10.39% 36.36% 10,701 7.31% 46.33%
All Other (Including Prod Ctr) 11,518 $1,639 7.97% 11,874 14.34% 23.45% $2,189 16.82% 44.21% $2,168 -0.944 42.86%
Total $34.327 $38,284 11.53% 542,128 10.04% 22.73% $46,132 9.50% 34.39% 50,282 9.00% 46.48%
WEBER STATE UNIVERSITY
Annualized FTE*** 7,634 7,449 -2.42% 7,480 0.42% -2.02% 8.116 8.50% 6.31% 8.919 9.89% 16.8344
Ed & Gen .4 Ccop Nursing $16,189 $18,221 12.55% $20,173 10.71% 24.61% $21,753 7.83% 34.37% $24,944 14.67% 54.08%
All Other $151 $151 0.42% $149 -1.49% -1.08% $148 -0.93% -1.99% $164 11.30% 9.08%
Total 416,340 518,372 12.44% $20,322 10.61% 24.37% $21,901 7.77% 34.03% $25,108 14.65% 53.66%
SOJTHERN UTAH UNIVERSITY
Annualized FTE 1,807 1,750 -3.15% 1,719 -1.77% -4.87% 1,853 7.80% 2.55% 1.948 5.13% 7.1104
Ed & Gen 4. Coop M Ed $4,482 $5,072 13.17% $5,542 9.27% 23.654 $6,104 10.144 36.19% $6,824 11.79% 52.244
All Other $32 $190 490.77% 537 -80.814 13.35% $58 58.244 79.37% 540 -31.614 22.67%
Total $4,514 $5,262 16.57% 15,579 6.01% 23.58% $6,162 10.45% 36.5011 $6,863 11.38% 52.03%
SNOA COLLEGE
Annualized FTE 849 915 7.77% 897 -1.9744 5.65% 1,002 11.71* 18.024 1,108 10.584 30.51%
Education and General $2,084 $2,425 16.34% $2,839 17.07% 36.20% $3,249 14.45% 55.87% $3,659 12.62% 7.55%
All Other $52 $20 -60.79% $19 -5.45% -62.93% 122 15.18% -57.304 $30 34.55% -42.55%
Total $2,136 52,445 14.48% 52,858 16.884 33.80% 53,271 14.454 53.14% 13,689 12.77% 72.70%
DIXIE COLLEGE
Actualized FTE 1,150 1,148 -0.17% 1,092 -4.88% -5.044 1,141 4.49% -0.78% 1,325 16.13% 15.22%
Education and General $2,408 $2,697 12.00% 13,009 11.57% 24.96% $3,309 9.99% 37.44% $3,825 15.58% 58.85%
All Other (Incl IP Amp) $66 $11 -83.43% $12 7.27% -82.23% 132 172.26% -51.6211 $40 23.40% -40.29%
Total $2,474 $2,708 9.44% 53,021 11.55% 22.08% $3,342 10.62% 35.05% 53,865 15.65% 56.19%
COLLEGE OF EASTERN UTAH
Annualized FTE*"** 543 649 19.52% 660 1.69% 21.55% 625 -5.3011 15.10% 753 20.48% 38.67%
Ed & Gen S4n Juan Ctr $1.628 $1.924 18.20% $2,254 17.16% 38.49% $2,557 13.41% 57.05% $2,869 12.22% 76.24%
All Other $114 $69 -39.34% $68 -2.02% -40.564 $81 18.76% -29.41% $91 13.11% -20.15%
Total $1,742 51,994 14.43% 12,322 16.49% 33.304 $2,637 13.564 51.38% $2,960 12.244 69.91%
UTAH VALLEY 014MUNITY COLLEGE
Annualized FTE 2,881 2,863 -0.62% 2,897 1.19% , 0.56% 3,250 12.19% 12.81% 3,840 18.15% 33.29%
Education and General $4.902 $5,796 18.22% $7,068 21.96% 44.18% $7,463 5.58% 52.23% $8,656 15.99% 76.58%
All Other $20 5135 570.844 $35 -74.32% 72.30% $43 23.34% 112.52% $44 1.64% 116.00%
Total $4,922 $5,931 20.48% $7,103 19.77% 44.30% $7,506 5.67% 52.46% 58,700 15.91% 76.74%
SALT LAKE COMMUNITY COLLEGE
Annualized FTE 3,964 3,974 0.25% 3,814 -4.03% -3.78% 3,870 1.47% -2.37% 4,155 7.36% 4.824
Education and General $6,491 $7,224 11.28% $8,143 12.73% 25.44% $8,518 4.60% 31.22% $9,571 12.364 47.44%
All Other (Excl Sk Ctr) $17 $33 94.12% 143 31.37% 155.01% $51 18.31% 201.69% $52 1.98% 207.66%
Total (Excl Sk Ctr) $6,508 $7,257 11.50% $8,186 12.8114 25.78% $8,569 4.66% 31.66% $9,623 12.30% 47.86%
5844 AM) STATEWIDE
SBA Administration $601 $711 18.25% $786 10.57% 30.75% $843 7.19% 40.15% $980 16.37% 63.09%
Other Statewide $769 $1,518 97.35% 11,170 -22.90% 52.14% $1,351 15.45% 75.64% $1,440 6.58% 87.21%
Total 11.370 52,229 62.65% 51.956 -12:33% 42.76% 12,194 12.13% 60.08% $2,421 10.34% 76.63%
TOTAL USHE
Annualized FTE' 47.330 47,178 -0.32% 45,690 -3.15% -3.47% 47,849 4.73% 1.10% 51,174 6.95% 8.12%
Educ & Gen 4. Other lnst $119,048 $132,462 11.27% $147,033 11.004 23.51% $158,433 7.75% 33.08% $17 342 10.67% 47.29,%
All Other Line Items 119,721 $23,729 20.33% 124,767 4.38% 25.59% $27,162 9.67% 37.74% $29,012 6.81% 47.11%
Total 1138,768 5156,191 12.56% 5171,800 9.99% 23.80% 5185,595 8.03% 33.74% 6204,354 10.11% 47.26%
'Excluding Medical **Including Cont Ed Centers **Including Coop Nursing **Including San Juan Center ***** Budget-Related FIE beginning 1991-92
18
1
1

IIIHistory 14-Dec-92 HISTORY Of ENROLLMENT AND BUDGET CHANGES. USHE
IIITABLE I--Current Dollar Expenditures
in thousands of dollars
UNIVERSITY Of UTAH
Annualized FTE*
IIIEd X Gen + Coop Nursing
Medical Programs (Ind 5th Path)
All Other (Including KUED)
Total
UTAH STATE UNIVERSITY
Annualized FTE**
Ed X Gen + CE Centers + Coop M Ed
Agricultural Programs
All Other (Including Prod Ctr)
Total
WEBER STATE UNIVERSITY
Annualized FTE***
Ed & Gen + Coop Nursing
All Other
Total
SOUTHERN UTAH UNIVERSITY
Annualized FTE
Ed i Gen + Coop M Ed
All Other
Total
SNOW COLLEGE
Annualized FTE
Education and General
All Other
Total
DIXIE COLLEGE
Annualized FTE
Education and General
All Other (Incl ZP Amp)
Total
COLLEGE OF EASTERN UTAH
Annualized FTE****
Ed i Gen + San Juan Ctr
All Other
Total
UTAII VALLEY COMMUNITY COLLEGE
Annualized FTE
Education and General
All Other
Total
SALT LAKE COMMONITY COLLEGE
Annualized FIT
Education and General
All Other (Excl Sk Ctr)
Total (Excl Sk Ctr)
SBR AND STATEWIDE
S8R Administration
Other Statewide
Total
TOTAL USHE
Annualized FTE'
Educ i Gen + Other lnst
iAll Other Line Items
Total
1981-82 1982-83 1983-84 1984-85
Actual 1-Yr Inc 5-Yr Inc Actual I-Yr Inc 6-Yr Inc Actual 1-Yr Inc 7-Yr Inc Actual 1-Yr Inc 8-Yr Inc
18,833 0.35% -0.78% 19,454 3.30% 2.49% 19,492 0.20% 2.69% 19,445 -0.24% 2.44%
$87.190 12.38% 57.48% $98,715 13.22% 78.29% $101,390 2.71% 83.13% $110,840 9.32% 100.19%
$12.178 23.80% 83.30% $13,850 13.73% 108.46% $14,074 1.62% 111.84% $15,519 10.274 133.59k
$4,401 28.51% 81.62% $6,268 42.41% 158.64% $6,472 3.25% 167.05% $6,945 7.30% 186.55%
$103,769 14.23% 61.05% $118,832 14.52% 84.43% $121,936 2.61% 89.244 5133,303 9.324 106.89%
10,365 0.06% 8.90% 10,553 1.814 10.87% 10,989 4.134 15.45% 10,663 -2.97% 12.03%
541.902 12.00% 64.35% $46,093 10.00% 80.79% $47,321 2.66% 85.60% 552,594 11.14% 106.28%
512.165 13.68% 66.35% 512.810 5.30% 75.17% $12,973 1.27% 77.40% 514,412 11.09% 97.07%
$2,752 26.94% 81.34% $4,200 52.60% 176.74% $3,878 -7.66% 155.54% $4,527 16.724 198.26%
556,819 13.00% 65.52% 563,103 11.06% 83.83% $64,172 1.69% 86.94% 571.532 11.47% 108.39%
8,924 0.06% 16.90t 9,010 0.96% 18.02% 8,822 -2.09% 15.56% 8,467 -4.02% 10.91%
$27,377 9.75% 69.11% 531,082 13.544 91.99% $31,444 1.16% 94.23% $34,582 9.98% 113.61%
$149 -9.10% -0.84% $211 41.22% 40.03% 5208 -1.17% 38.40% $200 -4.08% 32.75%
$27,526 9.63% 68.46% $31,293 13.69% 91.51% 531,652 1.15% 93.71% 534,782 9.89% 112.86%
1,922 -1.33% 6.36% 2,173 13.06% 20.25% 2,315 6.53% 28.11% 2,410 4.10% 33.37%
$7,611 11.54% 69.81% 58,562 12.50% 91.03% $8,870 3.59% 97.90% $9,988 12.60% 122.64%
$55 38.78% 70.24% 557 3.87% 76.83% 556 -1.99% 73.30% 560 6.69% 84.90%
$7,666 11.69% 69.81% $8,619 12.44% 90.93% 58,926 3.56% 97.72% $10,047 12.57% 122.57%
1,132 2.17% 33.33% 1,025 -9.45% 20.73% 1,146 11.80% 34.98% 1,130 -1.40% 33.10%
$4,156 13.57% 99.37% $4,491 8.06% 115.45% $5,011 11.59% 140.43% $5,455 8.85% 161.71%
$25 -15.82% -51.64% $22 -11.74% -57.32% 522 1.96% -56.48% 522 -2.26% -57.46%
$4,180 13.34% 95.73% $4,513 7.94% 111.28% 55,034 11.55% 135.68% 55,477 8.80% 156.43%
1,380 4.15% 20.00% 1,436 4.06% 24.87% 1,449 0.91% 26.00% 1,483 2.354 28.96%
54,300 12.41% 78.56% 54,769 10.91% 98.04% $4,887 2.48% 102.96% 55,436 11.24% 125.77%
$51 29.51% -22.67% 556 9.05% -15.68% 557 1.03% -14.81% 571 25.16% 6.62%
54,351 12.59% 75.85% 54,825 10.89% 94.99% 54,944 2.47% 99.80% 55,507 11.40% 122.57%
829 10.09% 52.67% 922 11.22% 69.80% 1,065 15.51% 96.13% 1,162 9.11% 114.00%
$3,266 13.84% 100.63% $3,650 11.76% 124.23% $3,901 6.88% 139.67% 54,344 11.35% 166.86%
585 -6.43% -25.29% 595 11.17% -16.94% $92 -3.31% -19.69% 596 4.77% -15.85%
$3,351 13.21% 92.37% 53,745 11.75% 114.974 53,993 6.634 129.21% 54,440 11.19% 154.87%
4,349 13.26% 50.95% 5,035 15.77% 74.77% 5,272 4.71% 82.99% 4,947 -6.16% 71.71%
510,281 18.77% 109.72% 511,378 10.66% 132.08% 511,985 5.344 144.48% $13,700 14.31% 179.47%
546 5.294 127.42% $45 -1.09% 124.944 545 -0.224 124.44% 547 4.65% 134.87%
510,327 18.70% 109.79% 511,423 10.614 132.06% 512,030 5.32% 144.40% 513,748 14.27% 179.29%
4,573 10.06% 15.36% 5,339 16.75% 34.69% 5,518 3.35% 39.20% 5,563 0.82% 40.34%
511,147 16.47% 71.73% 512,207 9.51% 88.054 513,560 11.08% 108.89% 515,303 12.85% 135.74%
555 5.35% 224.12% 559 6.54% 245.31% 559 0.85% 248.24% 562 4.90% 265.29%
$11,202 16.41% 72.12% $12,266 9.49% 88.46% 513,619 11.03% 109.254 515,365 12.82% 136.08%
$913 -6.90% 51.84% $1,106 21.18% 83.99% 51,078 -2.54% 79.33% 51,142 5.95% 89.99%
$1,448 0.57% 88.28% $1,948 14.46% 153.16% $1,806 -7.29% 134.72% 52,707 49.92% 251.69%
52,361 -2.46% 72.29% 53,054 29.33% 122.82% $2,884 -5.57% 110.42% 53,849 33.48% 180.87%
52,306 2.21% 10.51% 54,946 5.05% 16.09% 56,068 2.04% 18.46% 55,270 -1.42% 16.7801
1197,229 12.48% 65.67% 4220,947 12.03% 85.60% 5228,369 3.36% 91.83% 5252,243 10.45% 111.88%
534,325 18.31% 74.06% 540,726 18.65% 106.52% $40,821 0.23% 106.99% 545,808 12.22% 132.29%
5231,554 13.31% 66.86% $261,673 13.01k 88.57% 5269,190 2.87% 93.994 $298,051 10.72% 114.78%
III Excluding Medical **Including Cont Ed Centers ***Including Coop Nursing ****Including San Juan Center Budget-Related FTE beginning !991-92
19
2 2

History 14-Dec-92
TABLE I--Current Dollar Expenditures 1985-86
in thousands of dollars
UNIVERSITY Of UTAN
Annualized FTE*
Ed & Gen + Coop Nursing
Medical Programs (Incl 5th Path)
All Other (Including XUED)
Total
UTAH STATE UNIVERSITY
Annualized FTE*-*
Ed & Gen + CE Centers + Coop M Ed
Agricultural Programs
All Other (Including Prod Ctr)
Total
WEBER STATE UNIVERSITY
Annualized FTE***
Ed & Gen + Coop Nursing
All Other
Total
SOUTHERN UTAH UNIVERSITY
Annualized FTE
Ed & Gen + Coop M Ed
All Other
Total
SNOW COLLEGE
Annualized FTE
Education and General
All Other
Total
DIXIE COLLEGE
Annualized FTE
Education and General
All Other (Incl ZP Amp)
Total
COLLEGE OF EASTERN UTAH
Annualized FTE****
Ed & Gen San Juan Ctr
All Other
Total
UTAH VALLEY COMMUNITY COLLEGE
Annualized FTE
Education and General
All Other
Total
SALT LAKE COMMUNITY COLLEGE
Annualized FTE
Education end General
All Other (Excl St Ctr)
Total (Excl Sk Ctr)
S8R ABO STATEWIDE
SBR Administration
Other Statewide
Total
TOTAL USHE
Annualized FTE*
Educ I. Gen + Other Inst
All Other Line Items
Total
HISTORY OF EIROLLMENT AND BUDGET CHAMGES. USHE
1986-87
Actual 1-Yr Inc 9-Yr Inc Actual t-Yr Inc 10-Yr Inc
1987-88 1988-89
Actual 1-Yr Inc 11-Yr Inc Actual 1-Yr Inc 12-Yr Inc
19,153 -1.50% 0.90% 18,892 -1.30 -0.47% 18,896 0.02% -0.45% )8,622 -1.45% -1.90%
$120,289 8.52% 117.26% $118,810 -1.23% 114.59% $122,907 3.45% 121.99% $126,765 3.14% 128.96%
$17,351 11.80% 161.16% $16,650 -4.04% 150.61% $17,357 4.25% 161.26% $17,715 2.06% 166.65%
$7,623 9.77% 214.54% $7,798 2.20 221.75% $8,161 4.60 236.75% $9,009 10.39% 271.75%
$145,262 8.97% 125.45% $143,258 -1.38% 122.334 $148,426 3.61% 130.35% $153,489 3.41% 138.21%
10,306 -3.30 8.28% 10,353 0.46% 8.77% 10,397 0.42% 9.24% 10,631 2.25% 11.69%
$57,471 9.27% 125.41% $56,432 -1.81% 121.33% $59,511 5.46% 133.41% $62,206 4.53% 143.98%
$15,266 5.93% 108.74% $15,177 -0.58% 107.53% $15,506 2.174 112.03% 116.347 5.424 123.53%
$5,088 12.41% 235.26% $4,986 -2.004 228.564 $4,986 0.00 228.56% $5,729 14.904 277.504
$77,825 8.80% 126.724 $76,595 -1.58% 123.13% $80,003 4.454 133.068 $84,282 5.35% 145.53%
8,579 1.32% 12.38% 9,027 5.22% 18.254 9,279 2.79% 21.55% 9,475 2.11% 24.12%
$37,977 9.82% 134.58% $37,618 -0.94% 132.36% $39,714 5.57% 145.31% 140,123 1.034 147.84%
$266 33.26% 76.90% $630 136.29% 318.00% $619 -1.73% 310.76% $431 -30.29% 186.35%
$38,243 9.95% 134.05% $38,248 0.01% 134.08% $40,333 5.45% 146.844 $40,554 0.55% 148.19%
2,361 -2.03% 30.66% 2,685 13.72% 48.59% 2,779 3.50% 53.79% 2,894 4.14% 60.15%
$10,945 9.59% 144.21% $10,973 0.25% 144.82% $11,567 5.42% 158.09% $12,061 4.27% 169.10%
$65 9.50% 102.47% $224 243.62% 595.72% $158 -29.60% 389.75% $118 19.02% 482.92%
$11,011 9.59% 143.91% $11,197 1.69% 148.04% $11,725 4.72% 159.74% $12,249 4.47% 171.344
1,142 1.06% 34.51% 1,265 10.77% 49.00% 1,244 -1.66% 46.53% 1,375 10.53% 61.96%
$6,105 11.92% 192.91% $5,814 -4.76% 178.964 $6,444 10.82% 209.15% $6,378 -1.01% 206.02%
20.70% -4Z,65% $254 860.50% 393.18% $199 -21.80% 285.65% $210 5.89% 308.36%
$6,131 11.95% 187.08% $6,068 -1.03% 184.13% $6,642 9.46% 211.004 $6,589 -0.81% 208.49%
1,646 10.99% 43.13% 1,843 11.97% 60.26% 1,812 -1.68% 57.57% 1,802 -0.55% 56.70%
$6,232 14.63% 158.81% $6,596 5.84% 173.92% $6,745 2.26% 180.12% $7,468 10.71% 210.11%
$66 -6.63% -0.45% $127 91.544 90.69% $251 98.084 277.71% $221 -12.00 232.38%
$6,298 14.30 154.53% $6,723 6.74% 171.69% $6,996 4.07% 182.74% $7,688 9.89% 210.71%
1,141 -1.81% 110.13% 1,309 14.72% 141.07% 1,281 -2.14% 135.91% 1,354 5.70% 149.36%
$5,294 21.87% 225.22% 15.234 -1.14% 221.52% $5,521 5.48% 239.15% $5,727 3.73% 251.80%
$96 -0.60% -16.36% $371 288.00% 224.54% $486 30.88% 324.75% $466 -4.08% 307.43%
$5,390 21.38% 209.36% $5,605 3.99% 221.72% $6,007 7.16% 244.774 $6,193 3.10% 255.45%
4,899 -0.97% 70.05% 5,206 6.27% 80.70% 5,302 1.84% 84.03% 5,329 0.51% 84.97%
$15,440 12.41% 214.144 115,946 3.55% 225.29% $16,393 2.80% 234.39% $17,463 6.53% 255.22%
$50 6.13% 149.27% $560 1016.444 2682.91% $602 7.36% 2887.70 $425 -29.32% 2011.82%
$15,450 12.39% 213318% $16,507 6.84% 235.344 $16,995 2.95% 245.25% $17,889 5.26% 263.41k
5,720 2.82% 44.30 5,845 2.19% 47.45% 6,073 3.90% 53.20% 6,530 7.53% 64.73%
$17,817 16.43% 174.48% $18,051 1.31% 178.07% $18,053 0.01% 178.11% $21,259 17.76% 227.49%
$65 3.80 279.41% $77 352.35% $80 3.644 368.82% $1.005 1161.5% 5814.1%
$17,882 16.38% 174.75% $18.128 1.37% 178.53% $18.133 0.03% 178.61% $22,264 22.78% 242.08%
$1,399 22.50% 132.74% $1,329 -5.02% 121.05% $1,384 4.15% 130.224 $1,347 -2.67h 124.06%
$4,864 79.69% 532.31% $1,787 -63.26% 132.29% $1,881 5.26% 144.50% $1.100 1.00% 146.95%
$6.263 62.72% 357.03% $3,116 -50.25% 127.36% $3,265 4.79% 138.244 -0.56% 136.91%
54,947 -0.58h 16.094 56,425 2.69% 19.22% 57,063 1.13% 20.56% 58,012 1.66% 22.57%
$277,530 10.03% 133.13% $275,474 -0.74% 131.40% $286,855 4.13% 140.96% $299,449 4.39% 151.54%
$52,225 14.01% 164.83% $49,969 -4.32% 153.38% $51,669 3.40% 162.004 $54.994 6.43% 178.86%
$329,756 10.64% 137.63% $325,443 -1.31% 134.52% $338,524 4.02% 143.95% $354,443 4.70% 155.42%
*Excluding Medical '*Including Cont Ed Centers ***Including Coop Nursing ***Including San Juan Center ***** Budget-Related FTE beginning 1991-92
20
1
1
1
1
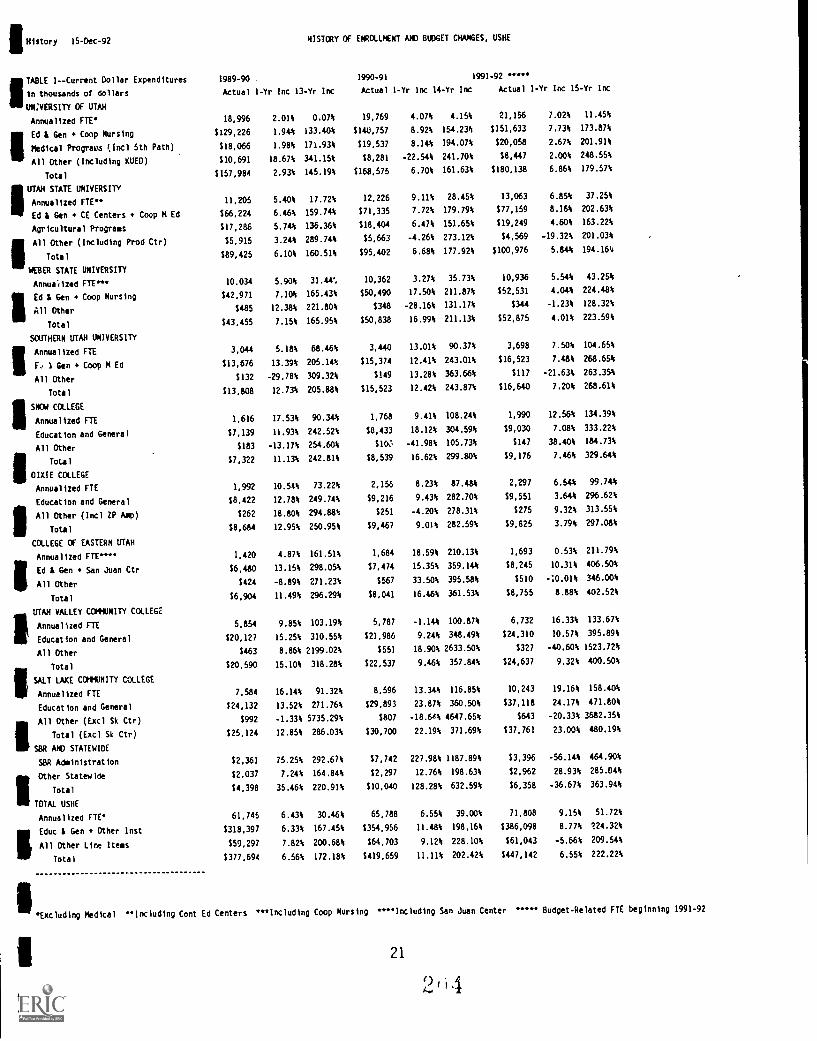
IIIHistory 15-Dec-92 NISTCRY OF ENROLLMENT AND BUDGET CHANGES, USHE
IIITABLE 1- -Current Dollar Expenditures
in thousands of dollars
UN;VERSITY Cf UTAH
Annualized FTE
111
Ed & Gen + Coop Nursing
Medical Programs (1ncl 5th Path)
All Other (Including KUED)
Total
IIIUTAH STATE UNIVERSITY
Annualized FTE**
Ed & Gen CE Centers * Coop M Ed
Agricultural Programs
111
All Other (Including Prod Ctr)
Total
III WEBER STATE UNIVERSITY
Annua1i2ed FTE***
III
Ed & Gen + Coop Nursing
All Other
Total
SOUTHERN UTAH UNIVERSITY
111
Annualized FTE
F. 1 Gen + Coop M Ed
All Other
Total
III SNOW COLLEGE
Annualized FTE
Education and General
All Other
III Total
DIXIE COLLEGE
Annualized FTE
Education and General
All Other (Incl ZP Asp)
Total
COLLEGE Cf EASTERN UTAH
Annualized FTE*""
Ed & Gen San Juan Ctr
All Other
Total
UTAH VALLEY COMUNITY COLLEGEI Annualized FTE
Education and General
All Other
III
Total
ed FTE
SALT LAKE CUIMUNITY COLLEGE
Annualiz
Education and General
All 0ther (Excl Sk Ctr)
II Total (Excl Sk Ctr)
II/ SBR AND STATEWIDE
SBR Administration
III
Other Statewide
Total
III TOTAL USHE
Annualized FTE*
Educ L Gen Other lnst
All Other Line Items
Total
1989-90
Actual I-Yr Inc I3-Yr Inc
1990-91 1991-92 *****
Actual 1-Yr Inc 14-Yr Inc Actual 1-Yr Inc I5-Yr Inc
18,996 2.01% 0.07% 19,769 4.07% 4.15% 21,156 7.02% 11.45%
$L29,226 1.94% 133.40% 1140,757 8.92% 154.2311 $151,633 7.73% 173.87%
$18,066 1.98% 171.93% $19,537 8.144 194.074 $20,058 2.67% 201.91%
$10,691 18.67% 341.15% $8,281 -22.54% 241.704 $8,447 2.00% 248.55%
$157,984 2.93% 145.19% $168,575 6.70% 161.63% $180,138 6.86% 179.57%
11,205 5.40% 17.72% 12,226 9.11% 28.45% 13,063 6.854 37.25%
$66,224 6.46% 159.74% $71,335 7.72% 179.79% $77,159 8.164 202.63%
$17,286 5.70 136.36% $18,44 6.47% 151.65% $19,249 4.60% 163.22%
$5,915 3.24% 289.744 $5,663 -4.26% 273.12% $4,569 -19.324 201.03%
189,425 6.10% 160.51% $95,402 6.68% 177.92% 1100,976 5.84% 194.164
10,034 5.90% 31.44% 10,362 3.27% 35.73% 10,936 5.54% 43.25%
$42,971 7.10% 165.43% $50,490 17.50% 211.87% $52,531 4.04% 224.48%
5485 12.38% 221.80% $348 -28.16% 131.17% 1344 -1.23% 128.32%
$43,455 7.15% 165.95% $50,838 16.99% 211.13% $52,875 4.01% 223.59%
3,044 5.18% 68.46% 3,440 13.01% 90.37% 3,698 7.50% 104.65%
$13,676 13.39% 205.14% $15,374 12.41% 243.01% $16,523 7.48% 268.654
1132 -29.78% 309.32% $149 13.28% 363.66% $117 -21.63% 263.35%
$13,808 12.73% 205.88% $15,523 12.42% 243.87% 116,640 7.20% 268.61%
1,616 17.53% 90.34% 1,768 9.41% 108.24% 1,990 12.56% 134.39%
$7,139 11.93% 242.52% $8,433 18.12% 304.598 $9,030 7.084 333.22%
$183 -13.17% 254.60% $10:, -41.98% 105.73% $147 38.40% 184.73%
$7,322 11.13% 242.81% $8,539 16.62% 299.80% $9,176 7.46% 329.54%
1,992 10.54% 73.22% 2,156 8.23% 87.48A 2,297 6.54% 99.744
$8,422 12.78% 249.74% $9,216 9.434 282.70% $9,551 3.64% 296.62%
$262 18.80% 294.88% $251 -4.20% 278.31% $275 9.32% 313.55%
58,684 12.95% 250.95% $9,467 9.01% 282.59% $9,825 3.79% 297.08%
1,420 4.87% 161.51% 1,684 18.59% 210.13% 1,693 0.53% 211.79%
$6,480 13.15% 298.058 $7,474 15.35% 359.14% $8,245 10.31% 406.50%
$424 -8.89% 271.23% $567 33.504 395.58% $510 -0.01% 346.00%
$6,904 11.49% 296.29% 58,041 16.46% 361.53% $8,755 8.88% 402.52%
5,854 9.85% 103.19% 5,787 -1.144 100.874 6,732 16.33% 133.67%
$20,127 15.25% 310.55% $21,986 9.24% 348.49% $24,310 10.57% 395.89%
$463 8.86% 2199.02% $551 18.90% 2633.50% $327 -40.60% 1523.72%
120,590 15.10% 318.28% $22,537 9.46% 357.84% $24,637 9.32% 400.50%
7,584 16.14% 91.32% 8,596 13.34% 116.85% 10,243 19.16% 158.404
$24,132 13.52% 271.76% 129,893 23.87% 360.50% $37,118 24.17% 471.80%
$992 -1.33% 5735.29% $807 -18.6A% 4647.65% $643 -20.33% 3682.35%
$25,124 12.85% 286.03% $30,700 22.19% 371.69% $37,761 23.00% 480.19%
$2,361 75.25% 292.67% $7,742 227.98% 1187.89% 13,396 -56.14% 464.90%
$2.037 7.24% 164.84% 12.297 12.76% 198.63% $2.962 28.93% 285.04%
$4,398 35.46% 220.91% 110,040 128.28% 632.59% $6,358 -36.67% 363.94%
61,745 6.43% 30.46% 65,788 6.55% 39.08% 71,808 9.15% 51.72%
$318,397 6.33% 167.45% $354,956 11.484 198.16% $386,098 8.77% 124.32%
559,297 7.82% 200.68% 164,703 9.124 228.10% 161,043 -5.66% 209.54%
1377,694 6.56% 172.18% 1419,659 11.11% 202.42% $447,142 6.55% 222.22%
*Excluding Medical **Including Cont Ed Centers ***Including Coop Nursing ****Including San Juan Center Budget-Related FTE beginning 1991-92
21
2 i 4

History 14-Dec-92 HISTORY Cf ENRCCLMENT AND BUDGET CHANGES, USHE
TABLE 2--CONSTANT Dollar Expenditures 1976-77 1977-78 1978-79 1979-80 1980-81
in thousands of dollars Actual Actual 1-Yr Inc Actual I-Yr Inc 2-Yr Inc Actual 1-Yr Inc 3-Yr Inc Actual 1-Yr Inc 4-Yr Inc
UNIVERSITY OF UTAH
Annualized FTE*
Ed & Gen + Coop Nursing
Medical Programs (Incl 5th Path)
All Other (Including KdED)
Total
UTAH STATE UNIVERSITY
Annualized FTE**
Ed & Gen + CE Centers + Coop M Ed
Agricultural Programs
All Other (Including Prod Ctr)
Total
WEBER STATE UNIVERSITY
Annualized FTE***
Ed A Gen Coop Nursing
All Other
Total
SOUTHERN UTAH UNIVERSITY
Annualized FTE
Ed & Gen + Coop M Ed
All Other
Total
SNOW COLLEGE
Annualized FTE
Education and Generll
All Other
Total
DIXIE COLLEGE
Annualized FTE
Educttion and General
All Other (Incl ZP Am))
Total
COLLEGE Of EASTERN UTAH
Annualized FTE****
Ed & Gen San Juan Ctr
All Other
Total
UTAH VALLEY COMMUNITY COLLEGE
Annualized FTE
Education and General
All Other
Total
SALT LAKE COMMUNITY COLLEGE
Annualized FTE
Education and General
All Other (Excl Sk Ctr)
Total (Excl Sk Ctr)
MR AND STATEWIDE
$BR Administration
Other Statewide
Total
TOTAL USHE
Annualized FTE*
Educ & Gen Other Inst
All Other Line Items
Total
18,982 18,69) -1.49% 17,45 -3.87% -5.314 18,430 2.53% -2.91% 18,768 1.83% -1.13%
$131,281 $135,013 2.84% 1136,132 0.83% 3.69% $128,660 -5.49% -2.00% $124,059 -3.58% -5.50%
$15,753 $16,231 3.04% $16,011 -1.36% 1.644 $16,058 0.29% 1.934 $15,730 -2.044 -0.15%
$5,746 $8,111 41.16% $7,515 -7.36% 30.774 $6,204 -17.44% 7.97% $5,477 -11.73% -4.69%
$152,780 $159,355 4.30% $159,657 0.19% 4.50% 5150,922 -5.47% -1.22% 1145,266 -3.75% -4.92%
9,518 9,729 2.22% 9,156 -5.89% -3.80% 9,562 4.43% 0.46% 10,359 8.344 8.84%
$60,455 $62,996 4.20% $63,641 1.02% 5.27% $61,121 -3.96% 1.10% $59,826 -2.12% -1.00
$17,340 $18,438 6.33% $18,414 -0.13% 6.19% $17,942 -2.56% 3.47% $17,112 -4.63A -1.32%
$3,599 $3,641 1.19% $3,819 4.88% 6.13% $3,938 3.11% 9.43% $3,467 -11.96% -3.664
$81,394 $85,075 4.52% $85,875 0.S4A 5.51% $83,001 -3.35% 1.9% $80,405 -3.134 -1.21%
7,634 7,449 -2.42% 7,480 0.42% -2.02% 8,116 8.50% 6.31% 8,919 9.89% 16.83%
$38,387 $40,491 5.48% $41,120 1.55% 7.12% $39,139 -4.82% 1.96% $39,887 1.91% 3.91%
$357 $336 -5.89% $304 -9.64% -14.96% $266 -12.558 -25.63% $263 -1.08% -26.434
$38,744 $40,827 5.38% $41,424 1.46% 6.924 $39,404 -4.88% 1.70% $40,150 1.89% 3.63%
s ...
1,807 1,750 -3.15% 1,719 -1.77% -4.87% 1,853 7.80% 2.55% 1,948 5.13% 7.804
$10,627 $11,271 6.06% $11,297 0.23% 6.304 $10,982 -2.79% 3.34% $10,911 -0.65% 2,67%
$76 $423 453.67% $74 -82.40% -2.55% $104 39.67% 36.11% $63 -39.22% -17.27%
$10.704 $11,694 9.25% 111,371 -2.764 6.244 111,086 -2.51% 3.57% 110,974 4.01% 2.534
849 915 7.77% 897 -1.97% 5.65% 1,002 11.71% 18.02% 1,108 10.584 30.51%
$4,942 $5,388 9.03% $5,786 7.39% 17.08% $5,845 1.02% 18.284 $5,851 0.09% 18.39%
$122 $45 -63.26% $39 -13.27% -68.13% $40 1.67% -67.60; $47 19.58% -61.264
$5,064 $5,433 7.29% $5,825 7.22% 15.03% $5,885 1.02% 16.20% $5,8 ea 0.23% 16.47%
1.150 1,148 -0.17% 1,092 -4.88% -5.04% 1,141 4.49% -0.78% 1.325 16.13% 15.22%
$5.710 $5,993 4.96% $6,133 2.344 7.42% $5.955 -2.92% 4.29% $6,116 2.72% 7.12%
$157 $24 -84.47% $24 -1.60% -84.72% 158 140.32% -63.29% $63 9.67% -59.734
$5,867 $6,018 2.56% $6,157 2.32% 4.95% $6,012 -2.36% 2.47% $6,180 2.79% 5.33%
543 649 19.52% 660 1.69% 21.55% 625 -5.30% 15.104 753 20.484 38.67%
$3,860 $4,276 10.78% $4,595 7.47% 19.05% $4,600 0.10% 19.17% $4,589 -0.27% 18.864
$271 $154 -43.15k $139 -10.12% -48.90% $145 4.83% -46.444 $146 0.53% 46.15%
$4,131 $4,430 7.24% $4,734 6.864 14.59% $4,745 0.24% 14.874 14,734 -0.24% 14.59%
2,881 2,863 -0.62% 2,897 1.19% 0.56% 3,250 12.19% 12.81% 3,840 18.15% 33.29%
$11,624 $12,879 10.80% $14,408 11.87% 23.95% $13,427 -6.81% 15.51% $13.842 3.09% 19.08%
$48 1:300 528.71% $71 -76.444 48.12% $77 8.87% 61.26% $70 -9.67k 45.67%
$11.672 113,179 12.91% $14,479 9.86% 24.05% 513,504 -6.73% 15.70% $13,912 3.02% 19.19%
3,964 3,974 0.25% 3,814 -4.03% -3.78% 3,870 1.47% -2.37% 4,155 7.36% 4.82%
$15,392 $16,052 4.29% $16,599 3.40% 7.84% $15,325 -7.67% -0.43% $15,305 -0.14% -0.57%
$40 $73 81.93% $88 20.50% 119.23% $92 4.42% 128.93% $84 -9.37% 107.49%
$15,432 $16,126 4.49% $16,687 3.48% 8.134 $15,418 -7.61% -0.094 $15.386 -0.19% -0.29%
$1,425 $1,580 10.82% 11,102 1.43% 12.41% $1,516 -5.39% 6.35% $1,568 3.42% 9.99%
$1,824 $3,374 84.95% $2,.186 -29.28% 30.79% $2,431 1.90% 33.28% 12,303 -5.27% 26.25%
$3,249 $4,953 52.43% 53,988 -19.49% 22.73% $3,947 -1.03% 21.47% 53,871 -1.93% 19.12%
47,330 47,178 -0.32% 45,690 -3.15% -3.47% 47,849 4.73% 1.10% 51,174 6.95% 8.124
$282,278 1294,360 4.28% $299,712 1.82% 6.18% $285,055 -4.89% 0.98% $280,385 -1.64% -0.674
$46,760 $52,731 12.77% $50,486 -4.26% 7.97% $48,871 -3.20% 4.51% $46,392 -5.07% -0.79%
$329,038 $347,091 5.49% $350,198 0.90% 6.43% 1333,926 -4.654 1.49% $326,777 -2.14% -0.69k
*Excluding Medical **Including Cont Ed Centers ***Including Coop Nursing ****Including San Juan Center -**** Budget-Related FTE beginning 1991-92
22
1
a
I.

IHistory 14-Dec-92 HISTORY OF ENROLLMENT AND BUDGET CHANGES, USHE
1981-82
Actual 1-Yr Inc 5-Yr Inc
1982-83
Actual 1-Yr Inc 6-Yr Inc
1983-84
Actual 1-Yr Inc 7-Yr Inc
198445
Actual 1-Yr Inc 8-Yr Inc
18,833 0.354 -0.70 19,454 3.30% 2.49% 19,492 0.20% 2.69% 19,445 -0.20 2.44%
$128,002 3.18% -2.50% $139,576 9.04% 6.32% $138,123 -1.04% 5.21% $145,261 5.17% 10.65%
$17,878 13.664 13.49% $19,582 9.53% 24.31% $19,172 -2.09% 21.71% $20,338 6.08% 29.10%
$6,462 17.99% 12.45% $8,863 37.16% 54.23% $8,817 -0.52h 53.43% $9,101 3.22% 58.38%
5152,342 4.87% -0.29% $168,021 10.29% 9.98% $166,112 -1.14% 8.73% $174,700 5.17% 14.35%
10,365 0.06% 8.90% 10,553 1.81% 10.87% 10,989 4.13% 15.454 10,663 -2.97% 12.03%
$61,515 2.82% 1.75% $65,173 5.95% 7.80% $64,464 -1.G9% 6.63% $68,927 6.92% 14.01%
$17,860 4.37% 3.00% $18,113 1.41% 4.45% $17,673 -2 42% 1.92% $18,887 6.87% 8.92%
$4,040 16.54% 12.28% $5,939 46.98% 65.02% $5,283 -11.03% 46.82% $5,932 12.28% 64.85%
$83,415 3.74% 2.48% $89,224 6.96% 9.62% $87,421 -2.02% 7.41% $93,746 7.24% 15.18%
8,924 0.00 16.90% 9,010 0.96% 18.02% 8,822 -2.09% 15.56% 8,467 -4.02% 10.911;
$40,192 0.76% 4.70% $43,948 9.354 14.49% $42,836 -2.53% 11.59% $45,321 5.80% 18.06%
$219 -16.55% -38.61% $298 36.01% -16.50% $284 -4.78% -20.48% $262 -7.73% -26.63%
840,411 0.654 4.30% $44,247 9.49% 14.20% $43,120 -2.55% 11.29% $45,583 5.71% 17.65%
1,922 -1.33% 6.36% 2,173 13.06% 20.25% 2,315 6.53% 28.11% 2,410 4.10% 33.37%
$11,173 2.40% 5.144 $12,106 8.35% 13.92% $12,083 -0.19% 13.70% $13,089 8.324 23.16%
$80 27.41% 5.40% $81 0.044 5.44% $76 4.57% -0.43% $78 2.64% 2.20%
811,254 2.54% 5.14% $12,187 8.29% 13.86% 812,159 -0.23% 13.60% $13,167 8.29% 23.01%
1,132 2.17% 33.33% 1,025 -9.45% 20.73% 1,146 11.80% 34.98% 1,130 -1.40% 33.10%
$6,101 4.27% 23.44% $6,349 4.08% 28.47% $6,827 7.52% 38.13% $7,149 4.72% 44.65%
$37 -22.72% -70.06% $31 -14.99% -74.55% $31 -1.76% -75.03% $29 -L.97% -76.49%
$6,137 4.05% 21.19% $6,380 3.96% 25.99% $6,80 7.47% 35.40% $7,178 4.67% 41.73%
1,380 4.15% 20.00% 1,436 4.06% 24.87% 1,449 0.91% 26.00% 1,483 2.35% 28.96%
$6,312 3.20% 10.56% $6,743 6.82% 18.09% $6,658 -1.26% 16.61% $7,125 7.01% 24.78%
$75 18.908 -52.12% $79 5.02% -49.72% $77 -2.66% -51.06% $93 20.41% -41.07%
$6,388 3.37% 8.88% $6,822 6.80% 16.27% $6,735 -1.28% 14.79% $7,218 7.17% 23.02%
829 10.09% 52.67% 922 11.22% 69.80% 1,065 15.51% 96.13% 1,162 9.11% 114.00%
$4,795 4.51% 24.22% $5,161 7.64% 33.71% $5,315 2.98% 37.70% $5,693 7.12% 47.50%
$125 -14.09% -53.744 $134 7.07% -50.47% $125 -6.84% -53.86k $126 0.79% -53.49%
$4,920 3.94% 19.10% 55,295 7.63% 28.19% 85,440 2.73% 31.69% 55,819 6.97% 40.87%
4,349 13.26% 50.95% 5,035 15.77% 74.77% 5,272 4.71% 82.99% 4,947 -6.16% 71.71%
$15,094 9.04% 29.85% $16,087 6.58% 38.39% $16,327 1.49% 40.468 $17,955 9.97% 54.46%
$67 -3.34% 40.81% $64 -4.74% 34.13% $62 -3.87% 28.95% $62 0.67% 29.81%
$15,161 8.98% 29.89% $16,151 6.53% 38.38% 816,389 1.47% 40.41% 818,017 9.93% 54.36%
4,573 10.06% 15.36% 5.339 16.75% 34.69% 5,518 3.35% 39.20% 5,563 0.82% 40.34%
$16,365 6.93% 6.32% $17,260 5.47% 12.10 $18,472 7.03% 20.01% $20,055 8.57% 30.30%
$81 -3.28% 100.68% $83 2.61% 105.91% $81 -2.84% 100.07% 881 0.91% 101.90%
$16,446 6.88% 6.57% 817,343 5.45% 12.38% 818,553 6.98% 20.22% 820,137 8.53% 30.48%
$1,340 -14.53% -5.99% 81,564 16.714 9.72% $1,469 -6.10% 3.03% 81,497 1.92% 5.01%
$2,126 -7.67% 16.57% $2,754 29.50% 50.96% $2,460 -10.67% 34.85% $3,548 44.22% 94.4916
$3,466 -10.45% 6.67% $4,318 24.56% 32.87% $3,928 -9.01% 20.89% $5,044 28.41% 55.24%
52,306 2.21% 10.51% 54,946 5.05% 16.09% 56,068 2.04% 18.46% 55,270 -1.42% 16.78%
$289,549 3.27% 2.58% $312,404 7.89% 10.67% $311,105 -0.42% 10.21% $330,574 6.26% 17.11%
,392 8.62% 7.77% $57,584 14.27% 23.15% $55,609 -3.43% 18.92% 860,034 7.96% 28.39%
1339.941 4.03% 3.31% $369.588 8.84% 12.45% 8366,715 -0.88% 11.45% $390,608 6.52% 18.71%
TABLE 2--CONSTANT Dollar Expenditures
111
in thousands of dollars
UNIVERSITY Of UTAH
Annualized FTE
Ed & Gen + Coop Nursing
IIIMedical Programs (Incl 5th Path)
All Other (Including KUED)
Total
IIIUTAH STATE UNIVERSITY
Annualized FTE**
Ed & Gen + CE Centers + Coop M Ed
Agricultural Programs
All Other (Including Prod Ctr)
IIITotal
W EBER STATE UNIVERSITY
Annualized FTE***
Ed & Gen + Coop Nursing
111
All Other
Total
SOUTHERN UTAH UNIVERSITY
IAnnualized FTE
Ed & Gen + Coop M Ed
All Other
Total
IIISNOW COLLEGE
Annualized FTE
Education and General
All Other
II!Total
DIXIE COLLEGE
Annualized FTE
Education and General
III
All Other (Incl ZP Amp)
Total
COLLEGE OF EASTERN UTAH
Annualized FTE****
Ed & Gen + San Juan Ctr
All Other
Total
UTAH VALLEY COMMUNITY COLLEGE
IIIAnnualized FTE
Education and General
All Other
Total
IIISALT LAKE COMMUNITY COLLEGE
Annualized FTE
Education and General
All Other (Excl Sk Ctr)
Total (Excl Sk Ctr)
II/56R AND STATEWIDE
SBR Administration
Other Statewide
IIITotal
TOTAL USHE
Annualized FTE'
Educ & Gen + Other Inst
i$50All Other Line Items
Total
i*Excluding Medical **Including Cont Ed Centers ***Including Coop Nursing ****Including San Juan Center Budget-Related FTE beginning 1991-92
23

History 14-Dec-92
TABLE 2--OOMSTANT Dollar Expenditures
in thousands of dollars
UNIVERSITY Of UTAH
HISTORY OF ENROLLMENT AND BUDGET CHANGES, USHE
1985-86 1986-87 1987-88
Actual 1-Yr Inc 9-Yr Inc Actual 1-Yr :nc 10-Yr Inc Actual 1-Yr Inc 11-Yr Inc
1988-89
Actual 1-Yr Inc 12-Yr Inc
Annualized FTE* 19,153 -1.50% 0.90% 18,892 -1.36% -0.47% 18,896 0.02% -0.45% 18,622 -1.45% -1.90%
Ed i Gen + Coop Nursing $151,874 4.55% 15.69% $148,379 -2.30% 13.02% $146,977 -0.94A 11.96% $145,174 -1.23% 10.58%
Medical Programs (Incl 5th Path) $21,907 7.71% 39.06% $20,793 -5.08% 31.99% $20,757 -0.18% 31.76% $20,288 -2.26% 28.79%
Ali Other (Including HUED) $9,625 5.75% 67.49% $9,738 1.18% F9.46% $9,759 0.22% 69.83% $10,318 5.72% 79.55%
Total $183,405 4.98% 20.04% $178,910 -2.45% 17.10% $177,493 -0.79% 16.18% 5175,780 -0.97% 15.05%
UTAH STATE UNIVERSITY
Annualized FTE** 10 '35 -3.35% 8.284 10,353 0.46% 8.774 10.397 0.42% 9.244 10,631 2.25% 11.694
Ed i Gen + CE Centers + Coop M Ed $72,562 5.27% 20.03% $70,476 -2.87% 16.58% $71,166 0.98% 17.72% $71,240 0.10% 17.844
Agricultural Programs $19,274 2.05% 11.15% $18,954 -1.66% 9.30% $18,543 -2.17% 6.93% $18,721 0.96% 7.964
All Other (Including Prod Ctr) $6,424 8.29% 78.52% $6,227 -3.07% 73.05% $5,963 -4.25% 65.70% $6,561 10.03% 82.334
Total $98,260 4.82% 20.72% $95,657 -2.65% 17.524 $95,671 0.02% 17.544 $96,522 0.89% 18.59%
WEBER STATE UNIVERSITY
Annualized FTE*** 8,579 1.32% 12.38% 9,027 5.22% 18.25% 9,279 2.79% 21.55% 9.475 2.11% 24.12%
Ed 8 Gen + Coop Nursing $47,949 5.80% 24.91% 646,980 -2.02% 22.39% $47,492 1.09% 23.72% $45.950 -3.25% 19.70%
All Other $336 28.38% -5.80% $786 133.724 120.16% 5740 -5.90% 107.16% 5494 -33.24% 38.30%
Total $48,285 5.93% 24.63% 547,766 -1.07% 23.29% $48,232 0.97% 24.49% $46,444 -3.71k 19.87%
SOUTHERN UTAH UNIVERSITY
Annualized FTE 2,361 -2.031 30.664 2,685 13.72% 48.59% 2,779 3.50% 53.79% 2,894 4.144 60.15%
Ed i Gen + Coop M Ed $13,819 5.58% 30.03% $13,704 -0.844 28.95% $13,833 0.944 30.16% $13,813 -0.154 29.97%
All Other $82 5.49% 7.81% 5280 239.89% 266.43% $189 -32.59% 147.00% 5215 13.99% 181.544
Total 513,902 5.58% 29.88% 513,983 0.59% 30.644 $14,021 0.274 30.99* 614,028 0.044 J1.054
SNOW COLLEGE
Annualized FTE 1.142 1.06% 34.51% 1,265 10.77% 49.00% 1,244 -1.664 46.53% 1,375 10.53% 61.96%
Education and General $7,708 7.82% 55.97% $7,261 -5.80% 46.93% $7,706 6.12% 55.92% $7,305 -5.20% 47.80%
All Other $33 16.28% -72.66% 5317 850.07% 159.76% 5238 -25.12% 94.50% $241 1.41% 97.234
Total 57,741 7.86% 52.86% $7,579 -2.10% 49.65% 57,943 4.81% 56.85% $7,546 -5.01% 49.00%
DIXIE COLLEGE
Annualized FTE 1,646 10.99% 43.134 1,843 11.97% 60.26% 1,812 -1.68% 57.57% 1,802 -0.554 56.70%
Education and Ger. 1 17,869 10.44% 37.81% 18.238 4.69% 44.274 $8.066 -2.08% 41.27% $8.552 6.02% 49.78%
All Other (Incl ZP Amp) $83 -10.05% -46.99% $158 89.46% 0.43% $300 89.67% 90.49% $253 -15.73% 60.54%
Total 57,952 10.18% 35.53% 58,396 5.58% 43.10% 18,366 -0.35% 42.59% $8,805 5.24% 50.07%
COLLEGE OF EASTERN UTAH
Annualized FTE**** 1,141 -1.81% 110.13% 1,309 14.72% 141.07% 1,281 -2.144 135.914 1,354 5.70% 149.36%
Ed I Gen + San Juan Ctr $6,684 17.41% 73.174 $6,536 -2.21% 69.344 $6,602 1.00% 71.05% $6,558 -0.66% 69.92%
All Other 5121 -4.23% -55.46% 5463 283.79% 70.934 5581 25.32% 114.21% 5534 -8.144 96.794
Total 56,805 16.944 64.73% $7,000 2.86% 69.45% 57,183 2.61% .73.88% 57,092 -1.274 71.68%
UTAH VALLEY COMMUNITY COLLEGE
Annualized FTE 4,899 -0.97% 70.05% 5,206 6.27% 80.70% 5,302 1.84% 84.03% 5,329 0.51% 84.97%
Education and General $19,444 8.29% 67.27% $19,915 2.42% 71.33% $19,603 -1.56% 68.65% $19,999 2.02% 72.05%
All Other $63 2.25% 32.73% 5700 1004.31% 1365.75% 5720 2.80% 1406.81% 5487 -32.31% 919.98%
Total 519,507 8.27% 67.13% 520,615 5.68% 76.62% $20,323 -1.42% 74.12% $20,486 0.80% 75.52%
SALT LAKE COMMUNITY COLLEGE
Annualized FTE 5,720 2.82% 44.304 5,845 2.19% 47.45% 6,073 3.90% 53.20% 6,530 7.53% 64.73%
Education and General $22.496 :2.174 46.15% $22,543 0.21% 46.46% $21,589 -4.23% 40.26% $24,346 12.774 58.17%
All Other (Excl Sk Ctr) 581 0.06% 102.03% $96 17.93% 138.25% $95 -0.76% t.6.444 $1,151 1108.09% 2756.45%
Total (Excl Sk Ctr) $22,577 12.12% 46.30% $22,639 0.274 46.70% $21,684 -4.22% 40.51% $25.497 17.59% 65.22%
S8R AND STATEWIDE
SBR Adm:.,ictratinn $1,767 18.02% 23.93% $1,660 -6.05% 16.43% $1,655 -0.28% 16.11% $1,543 -6.79% 8.22%
Other Statewide $6,141 73.12% 236.69% $2,232 -63.66% 22.34% $2,249 0.79% 23.31% $2,176 -3.28% 19.27%
Total $7,908 56.77% 143.36% 53.891 -50.79% 19.75% 53,904 0.34% 20.15% 53,718 -4.77% 14.42%
TOTAL USHE
Annualized CIF* 54,947 -0.58% 16.09% 56,425 2.69% 19.22% 57,063 1.13% 20.56% 58,012 1.66% 22.57%
Educ & Gen + Other Inst $350,404 6.00% 24.13% $344,031 -1.82% 21.88% 5343,033 -0.29% 21.52% $342,938 -0.03% 21.49%
All Other line Items $65,939 9.84% 41.01% $62,405 -5.36% 33.46% 561,788 -0.99% 32.14% $62,980 1.93% 34.69%
Total $416,343 6.59% 26.53% 5406,436 -2.38% 23.52% 5404,821 -0.40% 23.03% $405,918 0.27% 23.37%
*Excluding Medical **Including Cont Ed Centers ***Including Coop Nursing ....Including San Juan Center Budget-Related FTE beginning 1991-92
24
1

II/History 15-Dec-92 HISTORY OF ENROLLMENT AM BUDGET CHANGES, USHE
TABLE 2--COMSTANT Dollar Expenditures
III
in thousands of dollars
UNIVERSITY Of UTAH
Annualized FTE*
Ed & Gen + Coop Nursing
IIIMedical Programs (Incl 5th Path)
All Other (Including KUED)
Total
II/
UTAH STATE UNIVERSITY
Annualized FTE**
oop M EdEd & Gen + CE Centers + C
. Agricultural Programs
All Other (Including Prod Ctr)
Total
II/ WEBER STATE UNIVERSITY
Annualized FTE***
Ed & Gen + Coop Nursing
All Other
Total
SOUTHERN UTAH UNIVERSITY
illAnnualizedFTE
IIIEd i Gen + Coop M Ed
All Other
Total
111
SNOW COLLEGE
Annualized FTE
Education and General
All Other
Total
III DIXIE COLLEGE
Annualized FTE
Education and General
All Other (Incl IP Amp)
Total
COLLEGE OF EASTERN UTAH
Annualized FTE****
II/
Ed & Gen San Juan Ctr
All her
Total
Ot
UTAH VALLEY COMMUNITY COLLEGE
111
Annualized FTE
Education and General
All Other
Total
IIISALT LAKE COMMUNITY COLLEGE
Annualized FTE
Education and General
All Other (Excl Sk Ctr)
Total (Excl Sk Ctr)
II/SBR AND STATEWIDE
SBR Administration
Other Statewide
111
Total
TOTAL USHE
Annualized FTE*
Educ & Gen Other InstI All Other Line Items
Total
1989-90
Actual 1-Yr Inc 13-Yr Inc
1990-91 1991-92
Actual 1-Yr Inc 14-Yr Inc Ac
.
tual 1-Yr Inc 15-Yr Inc
18,996 2.01% 0.07% 19,769 4.07% 4.15% 21,156 7.02% 11.45%
$141,421 -2.59% 7.72% $144,958 2.504 10.42% $151,633 4.604 15.504
$19,771 -2.596 25.51% $20,120 1.77% 27.72% $20,058 -0.31% 27.33%
$11,700 13.40% 103.61% $8,528 -27.11% 48.41% $8,447 -0.95% 47.004
$172,893 -1.64% 13.16% $173,607 0.41% 13.63% $180,138 3.76% 17.91%
11,205 5.40% 17.72% 12,226 9.11% 28.45% 13,063 6.85% 37.25%
$72,474 1.73% 19.88% 673,465 1.37% 21.52% 677.159 5.03% 27.63%
$18,917 1.05% 9.094 $18,953 0.19% 9.30% $19,249 1.56% 11.01%
$6.473 -1.348 79.88% $5,832 -9.91% 62.06% $4,569 -21.66% 26.96%
697,864 1.39% 20.24% $98,249 0.39% 20.714 6100,976 2.78% 24.06%
10,034 5.90% 31.44% 10,362 3.27% 35.73% 10.936 5.544 43.25%
$47,026 2.344 22.50% $51,997 10.57% 35.45% $52,531 1.03% 36.85%
$530 7.39% 48.52% $359 -32.40% 0.41% $344 -4.10% -3.71%
$47,556 2.39% 22.74% 652,355 10.09% 35.13% $52,875 0.9996 36.47%
3,044 5.18% 68.46% 3,440 13.01% 90.3716 3,698 7.50% 104.65%
$14,967 8.36% 40.83% $15,833 5.78% 48.98% $16,523 4.36% 55.48%
$144 -32.9011 88.92% 6154 6.60% 101.38% 6117 -23.91% 53.24%
$15,111 7.73% 41.18% $15,986 5.79% 49.35% 616,640 4.09% 55.46%
1,616 17.53% 90.34% 1,768 9.41% 108.244 1,990 12.56% 134.39%
$7,813 6.96% 58.089; $8,685 11.16% 75.73% $9,030 3.97% 82.71%
$200 -17.02% 63.66% $109 -45.40% -10.64% $147 34.38% 20.08%
$8,013 6.19% 58.22% $8,794 9.75% 73.644 $9,176 4.35% 81.20%
1,992 10.54% 73.22% 2,156 8.23% 87.48% 2,297 6.54% 99.74%
$9,216 7.77% 61.42% $9,491 2.97% 66.22% $9,551 0.63% 67.27%
6287 13.53% 82.25% $259 -9.84% 64.31% $275 6.15% 74.41%
$9,503 7.93% 61.98% 69,749 2.59% 66.17% $9,825 0.78% 67.464
1,420 4.87% 161.51% 1,684 18.59% 210.13% 1,693 0.53% 211.79%
$7,091 8.12% 83.72% 67,697 8.55% 99.42% $8,245 7.12% 113.61%
$465 -12.93% 71.34% $584 25.63% 115.25% $510 -12.61% 88.10%
$7,556 6.54A 82.90% $8,281 9.60% 100.46% $8,755 5.73% 111.93%
5,854 C.85% 103.191; 5,787 -1.144 100.87% 6,732 16.33% :33.67%
$22,026 10.13% 89.49% $22,643 2.80% 94.79% $24,310 7.36% 109.14%
$507 4.03% 961.09% $567 11.89% 1087.244 $327 -42.32% 584.78%
$22,533 9.99% 93.05% 623,210 3.00% 98.85% 624,637 6.15% 111.08%
7,584 16.14% 91.32% 8,596 13.34% 116.85% 10,243 19.16% 158.40%
$26,410 8.48% 71.58% $30,785 16.57% 100.01% $37,118 20.57% 141.15%
$1,086 -5.71% 2593.21% $831 -23.44% 1962.04% $643 -22.64% 1495.17%
$27,495 7.84% 78.17% 131,616 14.99% 104.87% $37,761 19.44% 144.69%
$2.583 67.47% 81.23% $7,974 208.65% 459.37% $3,396 -57.41k 138.24%
$2,230 2.48% 22.23% $2,366 6.11% 29.71% $2,962 25.20% 62.39%
$4,813 29.44% 48.11% $10,339 114.83% 218.18% 66,358 -38.51% 95.66%
61,745 6.43% 30.46% 65,788 6.55% 39.00% 71,808 9.15% 51.72%
6348,444 1.61% 23.44% $365,552 4.91% 29.50% $386,098 5.62% 36.78%
$64,893 3.04191 38.78% 666,634 2.68% 42.50% 661,043 -8.39% 30.54%
$413,336 1.83% 25.62% $432,186 4.56% 31.35% 6447,142 3.46% 35.89%
I*Excluding Medical **Including Cont Ed Centers ***Including Coop Nursing ****Including San Juan Center ***** Budget-Related FTE begiming 1991-92
1
25
9 Ii
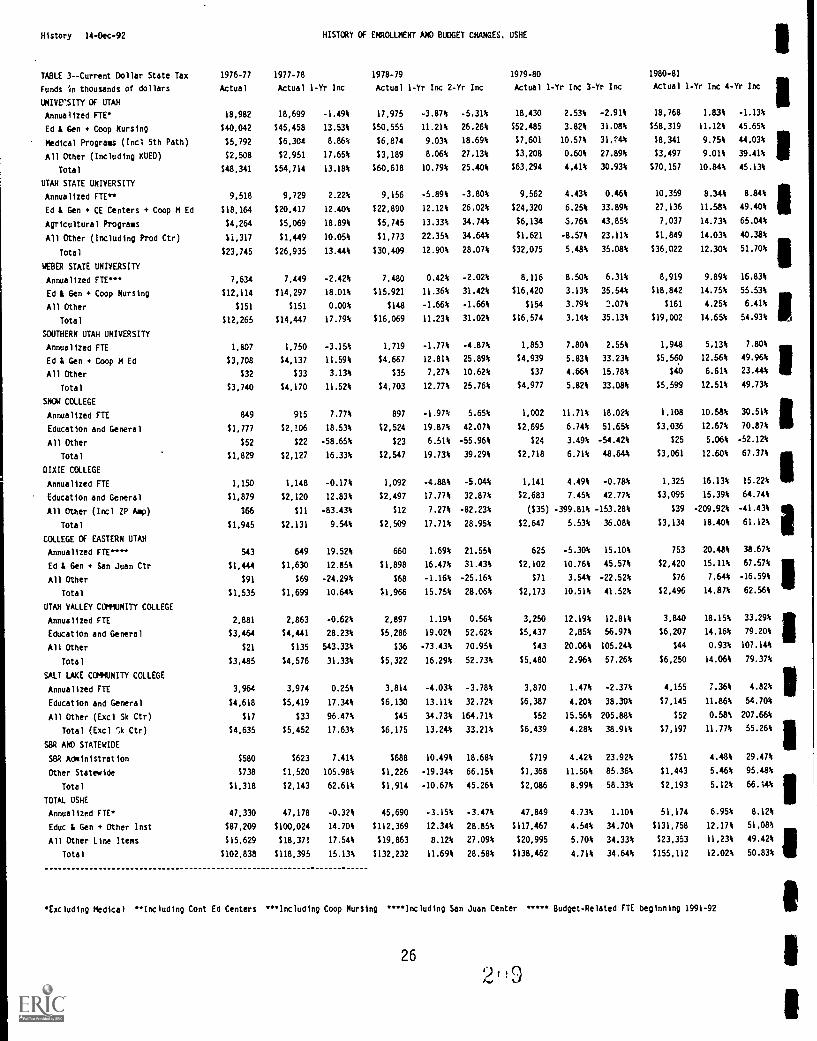
History 14-Dec-92 HISTCRY OF ENROLLMENT AHD BUDGET CHANGES, USHE
TABLE 3--Current Dollar State Tax 1976-77 1977-78 1978-79 1979-80 1980-81
Funds in thousands of dollars Actual Actual 1-Yr Inc Actual 1-Yr Inc 2-Yr Inc Actual 1-Yr Inc 3-Yr Inc Actual 1-Yr Inc 4-Yr Inc
UNIVErSITY OF UTAH
Annualized FTE*
Ed & Gen + Coop Nursing
Medical Programs (Inc 5th Path)
All Other (Including KUED)
Total
UTAH STATE UNIVERSITY
Annualized FIE**
Ed & Gen + CE Centers + Coop M Ed
Agricultural Programs
All Other (Including Prod Ctr)
Total
WEBER STATE UNIVERSITY
Annualized FTE***
Ed & Gen + Coop Nursing
All Other
Total
SOUTHERN UTAH UNIVERSITY
Annualized FTE
Ed & Gen + Coop M Ed
All Other
Total
SNOW COLLEGE
Annualized FTE
Education and General
All Other
Total
DIXIE COLLEGE
Annualized FTE
Education and General
All Other (Incl IP Amp)
Total
COLLEGE OF EASTERN UTAH
Annualized FIE.***
Ed & Gen + San Juan Ctr
All Other
Total
UTAH VALLEY COMMUNITY COLLEGE
Annualized FTE
Education and General
All Other
Total
SALT LAKE COMMUNITY COLLEGE
Annualized FTE
Education and General
All Other (Excl Sk Ctr)
Total (Excl ',1( Ctr)
S8R AND STATEWIDE
SBR Administration
Other Statewide
Total
TOTAL USK
Annualized FTE'
Educ & Gen + Other Inst
All Other Line Items
Total
18,982 18,699 -1.49% 17,975 -3.8716 -5.314 18,430 2.53% -2.91% 18,768 1.83% -1.13%
$40,042 $45,458 13.53% $50,555 11.21% 26.26% $52,485 3.82% 31.08% $58,319 11.12% 45.65%
$5,792 $6,304 8.86% $6,874 9.03% 18.69% $7,601 10.57% 31.?4% $8,341 9.75% 44.03%
$2,508 $2,951 17.65% $3,189 8.06% 27.13% $3,208 0.60% 27.89% $3,497 9.01% 39.41%
$48.341 $54,714 13.18% $60,618 10.79% 25.40% $63,294 4.41% 30.93% 170,157 10.84% 45.13%
9,518 9,729 2.22% 9,156 -5.89% -3.80% 9.562 4.43% 0.46% 10,359 8.34% 8.84%
$18,164 $20,417 12.40% $22,890 12.12% 26.02% $24,320 6.25% 33.89% 27.136 11.58% 49.40%
$4,264 $5,069 18.89% $5,745 13.33% 34.744 $6,134 5.76% 43.85% 7,037 14.73% 65.04%
$1,317 $1,449 10.05% $1,773 22.35% 34.64% $1,621 -8.57% 23.11% $1,849 14.03% 40.38%
$23,745 $26,935 13.44% $30,409 12.90% 28.07% $32,075 5.48% 35.08% $36,022 12.30% 51.70%
7,634 7,449 -2.42% 7,480 0.42% -2.02% 8,116 8.50% 6.31% 8,919 9.89% 16.83%
$12,114 114,297 18.01% $15,921 11.36% 31.42% $16,420 3.13% 35.54% $18,842 14.75% 55.53%
$151 $151 0.00% $148 -1.66% -1.66% $154 3.79% 2.07% $161 4.25% 6.41%
$12,265 114,447 17.79% $16,069 11.23% 31.02% $16,574 3.14% 35.13% $19,002 14.65% 54.93%
1,807 1,750 -3.15% 1,719 -1.77% -4.87% 1,853 7.80% 2.55% 1,948 5.13% 7.80%
$3,708 $4,137 11.59% $4,667 12.81% 25.89% $4,939 5.83% 33.23% $5,560 12.56% 49.964
$32 $33 3.13% $35 7.27% 10.62% $37 4.66% 15.78% $40 6.61% 23.44%
$3,740 $4.170 11.52% $4,703 12.77% 25.76% $4,977 5.82% 33.08% $5,599 12.51% 49.73%
849 915 7.77% 897 -1.972: 5.65% 1,002 11.71% 18.02% 1,108 10.58% 30.51%
$1,777 $2,106 18.53% $2,524 19.87% 42.07% $2,695 6.74% 51.65% $3,036 12.67% 70.87%
$52 $22 -58.65% $23 6.51% -55.96% $24 3.49% -54.42% $25 5.06% -52.12%
$1,829 $2,127 16.33% 12,547 19.73% 39.29% $2,718 6.71% 48.64% $3,061 12.60% 67.37%
1,150 1,148 -0.17% 1,092 -4.88% -5.04% 1,141 4.49% -0.78% 1,325 16.13% 15.22%
$1,879 $2,120 12.83% $2,497 17.779; 32.87% $2,683 7.45% 42.77% $3,095 15.3911 64.74%
$66 $11 -83.43% $12 7.27% -82.23% ($35) -399.81% -153.28% $39 -209.92% -41.43%
$1,945 $2,131 9.54% $2,509 17.71% 28.95% $2,647 5.53% 36.08% $3,134 18.40% 61.12%
543 649 19.52% 660 1.69% 21.55% 625 -5.30% 15.10% 753 20.48% 38.67%
$1,444 $1,630 12.85% $1,898 16.47% 31.43% $2,102 10.76% 45.57% $2,420 15.11% 67.57%
$91 $69 -24.29% $68 -1.16% -25.16% $71 3.54% -22.52% $76 7.64% -16.59%
$1,535 $1,699 10.64% $1,966 15.75% 28.06% $2,173 10.51% 41.52% $2,496 14.87% 62.56%
2,881 2,863 -0.62% 2,897 1.19% 0.56% 3,250 12.19% 12.81% 3,840 18.15% 33.29%
$3,464 $4,441 28.23% 15,286 19.02% 52.62% 15,437 2.85% 56.97% $6,207 14.16% 79.20%
$21 1135 543.33% $36 -73.43% 70.95% $43 20.06% 105.24% $44 0.93% 107.14%
$3,485 14,576 31.33% $5,322 16.29% 52.73% $5.480 2.96% 57.26% 16,250 14.06% 79.37%
3,964 3,974 0.25% 3,814 -4.03% -3.78% 3,870 1.47% -2.37% 4,155 7.36% 4.82%
$4,618 $5,419 17.34% $6,130 13.11% 32.72% $6,387 4.20% 38.30% $7,145 11.86% 54.70%
$17 $33 96.47% $45 34.73% 164.71% $52 15.56% 205.88% $52 0.58% 207.66%
$4,635 $5,452 17.63% $6,175 13.24% 33.21% $6,439 4.28% 38.91% $7,197 11.77% 55.26%
$580 $623 7.41% $688 10.49% 18.68% $719 4.42% 23.92% $751 4.48% 29.47%
$738 :1,520 105.98% $1,226 -19.34A 66.15% $1,368 11.56% 85.36% $1,443 5.46% 95.48%
$1,318 $2,143 62.61% 11,914 -10.67% 45.26% $2,086 8.99% 58.33% $2,193 5.12% 66.14%
47,330 47,178 -0.32% 45,690 -3.15% -3.47% 47,849 4.73% 1.10% 51,174 6.95% 8.12%
$87,209 $100,024 14.70% $112,369 12.34% 28.854 $117,467 4.54% 34.70% $131,758 12.17% 51.08%
$15,629 $18,371 17.54% 119,863 8.12% 27.09% $20,995 5.70% 34.33% $23,353 11.23% 49.42%
$102,838 $118,395 15.13% $132,232 11.69% 28.58% $138,462 4.71% 34.64% 1155,112 12.02% 50.83%
*Excluding Medical **Including Cont Ed Centers **Including Coop Nursing "...Including San Juan Center Budget-Related FTE beginning 1991-92
269
1
1
it
1
1
1
1

II/Total (Excl Sk Ctr)
SBR AM STATEWIDE
SBR Administration
Other Statewide
IIITOTAL USHE
Total
Annualized FTE
Educ & Gen Other Inst
iAll Other Line Items
Total
History 14-Dec-92 HISTORY OF ENROLLMENT AhO BUDGET CHANGES. USHE
TABLE 3--Current Dollar State Tax
Funds in thousands of dollars
UNIVERSITY Of UTAH
Annualized FTE*
Ed & Gen + Coop Nursing
Medical Programs (Incl 5th Path)
All Other (Including KUED)
Total
UTAH STATE UNIVERSITY
Annualized FTE**
Ed & Gen + CE Centers + Coop M Ed
Agricultural Programs
All Other (Including Prod Ctr)
Total
WEBER STATE UNIVERSITY
Annualized FTE***
Ed & Gen + Coop Nursing
All Other
Total
SOUTHERN UTAH UNIVERSITY
Annualized FTE
Ed & Gen + Coop M Ed
All Other
Total
SNOW COLLEGE
Annualized FTE
Education and General
All Other
Total
DIXIE COLLEGE
Annualized FTE
Education and General
All Other (Incl ZP Amp)
Total
COLLEGE Of EASTERN UTAH
Annualized F1E****
Ed & Gen + San Juan Ctr
All Other
Total
UTAH VALLEY COMMUNITY COLLEGE
Annualized FTE
Education and General
All Other
Total
SALT LAKE COMMUNITY COLLEGE
Annualized FTE
Education and General
All Other (Excl Sk Ctr)
1981-82
Actual 1-Yr Inc 5-Yr Inc
1982-83
Actual 1-Yr Ir. 6-Yr Inc
1983-84
Actual 1-Yr Inc 7-Yr Inc
1984-85
Actual 1-Yr Inc 8-Yr Inc
18,833 0.35% -0.78% 19,454 3.30% 2.49% 19,492 0.20% 2.69% 19,445 -0.24% 2.44;
$65,387 12.12% 63.30% $71,804 9.81% 79.33% $74,480 3.73% 86.01% $86,601 16.27% 116.28%
$10,323 23.75% 78.24% $11,464 11.06% 97.95% $11,937 4.12% 106.11% $13.391 12.18% 131.21%
$3,828 9.46% 52.60% $4,167 8.85% 66.11% $4,260 2.244 69.83% $4,682 9.90% 66.64%
579,538 13.37% 64.53% $87,436 9.93% 80.87% $90,678 3.71% 67.58% 9104,674 15.43% 116.53%
10,365 0.06% 8.90% 10,553 1.81% 10.87% 10,989 4.13% 15.45% 10,663 -2.97% 12.03%
$30,161 11.15% 66.05% $33,423 10.82% 84.01% $34,702 3.83% 91.05% $41.176 18.66% 126.69%
$7,874 11.89% 84.67% $8,785 11.57% 106.03% $8,948 1.86% 109.87% $9,951 11.20% 133.37%
$1,966 6.35% 49.304 $2.039 3.70% 54.82% $1,627 -20.204 23.54% $2,207 35.67% 67.61%
$40,001 11.05% 68.46% $44,246 10.61% 86.34% $45,277 2.33% 90.68% 553,334 17.80% 124.62%
8,924 0.06% 16.90% 9,01C 0.96% 18.02% 8,822 -2.09% 15.56% 8,467 -4.02% 10.91%
$20,804 10.41% 71.73% $23,005 10.5E% 89.90% $24,143 4.95% 99.30% $27,990 15.93% 131.05%
$167 3.81% 10.47% $176 5.344 16.37% 9180 2.56% 19.35% 9188 4.50% 24.72%
$20,971 10.36% 70.98% 923,181 10.54A 89.00% $24,323 4.93% 98.31% 928.178 15.85% 129.74%
1,922 -1.33% 6.36% 2.173 13.06% 20.25% 2,315 6.53% 28.11% 2,410 4.10% 33.77%
$6,231 12.08% 68.07% $6,942 11.41% 87.26% $7,220 4.004 94.75% $8,291 14.83% 123.62%
154 35.70% 67.50% $57 6.23% 77.93% $58 1.88% 81.27% $61 5.16% 90.63%
$6,285 12.25% 68.07% $6,999 11.37% 87.18% 97,278 3.98% 94.63% 98,352 14.75% 123.33%
1,132 2.17% 33.33% 1,025 -9.45% 20.73% 1.146 11.80% 34.98% 1,130 -1.40% 33.10%
$3.422 12.70% 92.57% $3,859 12.80% 117.22% $4,156 7.69% 133.92% $4,837 16.384 172.24%
$21 -15.66% -59.62% $22 6.87% -56.844 $23 2.04% -55.964 $24 3.93% -54.23%
93,443 12.47% 88.24% $3,882 12.76% 112.27% 94,179 7.65% 128.52% $4,861 16.31% 165.80%
1,380 4.15% 20.00% 1,436 4.06% 24.87% 1,449 0.91% 26.00% 1,483 2.35% 28.96%
$3,448 11.404 83.52% $3,794 10.02% 101.92% $3,967 4.55% 111.11% $4,493 13.28% 139.14%
$42 7.74% -36.90% $44 5.95% -33.14% $44 4.11% -33.89% $47 6.83% -29.37%
$3,490 11.36% 79.41% $3,838 9.97% 97.31% 94,011 4.49% 106.16% $4,540 13.20% 133.39%
829 10.094 52.67% 922 11.22% 69.80% 1,065 15.51% 96.13% 1.162 9.11% 114.00%
$2,706 11.82% 87.38% $3,016 11.47% 108.87% $3,156 4.64% 118.56% $3,848 21.91% 166.45%
$78 2.58% -14.44% $83 6.23% -9.11% $85 1.75% -7.53% $91 7.55% -0.55%
$2,784 11.54% 81.32% 93.099 11.32% 101.85% $3,241 4.56% 111.05% 93,939 21.54% 156.51%
4,349 13.26% 50.95% 5,035 15.77% 74.77% 5,272 4.71% 82.99% 4,947 -6.16% 71.71%
$7,054 13.66% 103.0% $7,671 8.75% 121.49% $7,998 4.25% 130.91% $9,964 24.58% 187.67%
$46 5.29% 118.10% 545 -2.18% 113.33% $45 0.89% 115.24% $47 4.65% 125.24%
$7,100 13.60% 103.764 97,716 8.68% 121.4.4% $8,043 4.23% 130.82% $10,011 24.47% 187.30%
4,573 10.06% 15.36% 5,339 16.75% 34.69% 5,518 3.35% 39.20% 5,563 0.82% 40.34%
$7,994 11.89% 73.09% $8,733 9.25% 89.11% $9,068 3.83% 96.35% $11,357 25.25% 145.92%
$55 5.35% 224,2% $59 6.54% 245.31% $59 0.85% 248.24% $62 4.90% 265.29%
$8,049 11.84% 73.65% $8,792 9.23% 89.68% $9,127 3.81% 96.91% $11,419 25.11% 146.36%
$888 18.33% 53.21% $976 9.84% 68.28% $995 1.96% 71.58% $1,087 9.28% 87.50%
$1,484 2.88% 101.12% $2,022 36.27% 174.05% $1,843 -8.89% 149.69% $5,405 193.35% 632.46%
$2,372 8.17% 80.04% 52.998 26.37% 127.51% $2,837 -5.36% 115.32% $6,492 128.81% 392.68%
52,306 2.21% 10.51% 54,946 5.05% 16.09% 56,068 2.04% 18.46% 55,270 -1.42% 16.78%
$147,207 11.72% 68.80% $162.249 10.22% 86.05% $168,890 4.09% 93.66% $198,556 17.57% 127.68%
$26,825 14.87% 71.64% $29,939 11.61% 91.56% $30,104 0.55% 92.61% $37.243 23.72% 138.29%
$174,032 12.20% 69.23% $192,188 10.43% 86.88% $198,994 3.54% 93.50% $235,799 18.50% 129.29%
I*Excluding Medical **Including Cont Ed Centers **Including Coop Nursing '''''Including San Juan Center Budget-Related FTE beginning 1991-92
27

History 14-Dec-92
TABLE 3--Current Dollar State Tax
Funds in thousands of dollars
UNIVERSITY OF UTAH
HISTORY OF ENROLLMENT AND BUDGET CHANGES, USHE
1985-86 1986-87 1987-88
Actual 1-Yr Inc 9-Yr Inc Actual 1-Yr Inc 10-Yr Inc Actual I-Yr Inc 11-Yr Inc
1988-89
Actual 1-Yr Inc 12-Yr Inc
Annualized FIE* 19,153 -1.50% 0.90% 18,892 -1.36% -0.47% 18,896 0.02% -0.45% 18,622 -1.45% -1.904
Ed & Gen + Coop Nursing $89,732 3.62% 124.10% $89,042 -0.77% 122.37% $94,107 5.69% 135.02% $96,589 2.64% 141.22%
Medical Programs (Incl 5th Path) $14,398 7.52% 148.60% $14,187 -1.47% 144.95% $14,422 1.66% 149.02% $14,773 2.43% 155.08%
All Other (Including KUED) 15,088 8.68% 102.84% $4,879 -4.12% 94.49% $5,147 5.50% 105.18% $5.259 2.19% 109.66%
Total 8109,218 4.34% 125.93% 1108,107 -1.02% 123.63% $113,676 5.15% 135.15% 1116,622 2.59% 141.25%
UTAH STATE UNIVERSITY
Annualized FTE** 10,306 -3.35% 8.28% 10,353 0.46% 8.77% 10,397 0.42% 9.24% 10,631 2.25% 11.69%
Ed & Gen + CE Centers + Coop M Ed $43.717 6.17% 140.68% $44,397 1.56% 144.43% $46,989 5.84% 158.7016 $47,533 1.16% 161.69%
Agricultural Programs $10,798 8.51% 153.20 $10,796 -0.01% 153.20% $11,076 2.59% 159.77% $11,603 4.76% 172.13%
All Other (Including Prod Ctr) $2,146 -2.76% 62.98% $2,414 12.47% 83.31% $2,474 2.48% 87.86% $2,565 3.67% 94.76%
Total $56,661 6.2411 138.63% 857.607 1.67% 142.61% $60,539 5.09% 154.96% 861,701 1.92% 159.85%
WEBER STATE UNIVERSITY
Annualized FIE*** 8,579 1.32% 12.38% 9,027 5.22% 18.25% 9,279 2.79% 21.55% 9,475 2.11% 24.12%
Ed & Gen + Coop Nursing $29,54 4.16% 140.66% $28,799 -1.22% 137.73% $30,518 5.97% 151.91% $31,082 1.85% 156.57%
Al/ Other $192 1.81% 26.97% $166 -13.26% 10.14% $196 17.93% 29.89% $196 -0.00% 29.89%
Total $29,345 4.144 139.26% 526,965 -1.30% 136.16% $30,714 6.04% 150.41% $31,278 1.844 155.02%
SOUTHERN UTAH UNIVERSITY
Annualized FTE 2,361 -2.03% 30.664 2,685 13.72% 48.59% 2,779 3.50% 53.79% 2,894 4.14% 60.15%
Ed & Gen + Coop M Ed $8,798 6.12% 137.29% $8,716 -0.93% 135.09% $9,149 4.97% 146.78% $9,449 3.28% 154.87%
All Other $64 4.10% 98.444 $61 -4.57% 89.38% $60 -1.164 87.19% $89 49.08% 179.06%
Total $8,861 6.10% 136.96% 88,777 -0.95% 134.70% $9,209 4.93% 146.27% $9,539 3.58% 155.08%
SNOW COLLEGE
Annualized FTE 1,142 1.06% 34.51% 1,265 10.77% 49.00% 1,244 -1.60 46.53% 1,375 10.534 61.96%
Education and General $4,965 2.65% 179.45% $4,965 0.00% 179.45% $5,204 4.81% 192.89% $5,323 2.28% 199.58%
All Other $25 3.36% -52.69% $24 -4.00% -54.58% $25 4.17% -52.69% $25 0.00% -52.69%
Total 84,990 2.65% 172.85% $4,989 -0.02% 172.79% 15,229 4.81% 185.91% $5,347 2.27% 192.40%
DIXIE COLLEGE
Annualized FTE 1,646 10.99% 43.13% 1,843 11.97% 60.26% 1,812 -1.68% 57.57% 1,802 -0.554 56.70%
Education and General $4,796 6.74% 155.25% $5,212 8.67% 177.38% $5,454 4.64% 190.24% $5,657 3.72% 201.044
All Other (Incl IP Amp) $49 4.90% -25.90% 847 -3.66% -28.61% $50 5.91% -24.40% $51 0.80% -23.30%
Total $4,845 6.72% 149.07% 85,259 8.54% 170.35% 55,504 4.65% 182.91% 55,707 3.69% 193.36%
COLLEGE CF EASTERN UTAH
Annualized FTE*-*-** 1,141 -1.81% 110.13% 1,309 14.72% 141.07% 1,281 -2.14% 135.91% 1,354 5.70% 149.36%
Ed & Gen + San Juan Ctr $3,993 3.77% 176.51% $4,363 9.26% 202.11% $4,535 3.9516 214.04% $4,701 3.66% 225.55%
All Other $94 3.634 3.06% $91 -3.82% -0.88% $133 47.24% 45.95% $134 0.52% 46.72%
Total $4,087 3.77% 166.18% $4,453 8.96% 190.03% $4,668 4.83% 204.044 84,835 3.57% 214.90%
UTAH VALLEY COMMUNITY COLLEGE
Annualized FTE 4,899 -0.97% 70.05% 5.206 6.27% 80.70% 5,302 1.84% 84.03% 5,329 0.51% 84.97%
Education and General $10,724 7.63% 209.61% $10,717 -0.07% 209.41% $11,162 4.16% 222.29% $11,659 4.45% 236.62%
All Other $50 6.13% 139.05% $48 -3.78% 130.00% $51 5.38% 142.38% $51 0.39% 143.33%
Total $10,774 7.62% 209.19% $10,765 -0.08% 208.93% 811.213 4.17% 221.81% 511,710 4.43% 236.06%
SALT LAKE COMMUNITY COLLEGE
Annualized FTE 5,720 2.82% 44.30% 5,845 2.19% 47.45% 6,073 3.90% 53.20% 6,530 7.53% 64.73%
Education and General 812,220 7.59% 164.60% 812,427 1.70% 169.09% 813,077 5.23% 183.16% $14,034 7.31% 203.87%
All Other (Excl Sk Ctr) $65 3.86% 279.41% $62 -4.03% 264.12% $65 4.20% 279.41% $65 0.00% 279.41%
Total (Excl Sk Ctr) $12,284 7.57% 165.02% $12,489 1.67% 169.44% $13,142 5.23% 183.524 $14,098 7.28% 204.15%
SBR AND STATEWIDE
SBR Administration $1,265 16.35% 118.14% $1,261 -0.30% 117.49% $1,322 4.85% 128.04% $1,355 2.44% 133.62%
Other Statewide $2,112 -60.93k 186.15% $1,905 -9.77%. 158.18% $2,003 5.12% 171.41% $1,795 -10.39% 143.22%
Total 13,376 -47.99% 156.23% $3,166 -6.23% 140.28% 83,325 5.02% 152.33% 53,149 -5.28% 138.99%
TOTAL USHE
Annualized FTE 54,947 -0.58% 16.09% 56,425 2.69% 19.22% 57,063 1.13% 20.56% 58.012 1.66% 22.57%
Educ i Gen Other 1nst 5208,098 4.81% 138.62% 8208,637 0.26% 139.24% 8220,195 5.544 152.49% 8226,026 2.65% 159.18%
All Other Line Items $36,344 -2.41% 132.54% $35,940 -1.11% 129.96% $37,024 3.01% 136.89% $37,960 2.53% 142.88%
Total $244,442 3.67% 137.70% 8244,577 0.06% 137.83% $257,218 5.17% 150.12% $263,986 2.63% 156.70%
*Excluding Medical *Including Cont Ed Centers ***Including Coop Nursing ****Including San Juan Center Budget-Related FTE beginning 1991-92
28

History 15-Dec-92
TABLE 3--Current Dollar State Tax
Funds in thousands of dollars
UNIVERSITY OF UTAH
HISTCRY OF ENROLLPENT AM) BUDGET CHANGES, USHE
1989-90 1990-91 1991-92
Actual 1-Yr Inc 13-Yr Inc Actual 1-Yr Inc 14-Yr Inc mItual I-Yr Inc 15-Yr Inc
Annualized FTE* 18,996 2.01% 0.07% 19,769 4.07% 4.15% 21,156 7.02% 11.45%
Ed A Gen + Coop Nursing $101,828 5.42% 154.31% 5104,878 2.99% 161.92% $111,665 6.47% 178.87%
Medical Prograas (Ind 5th Path) 515,490 4.85% 167.45% 515,972 3.11% 175.78% $16,843 5.45% 190.81%
All Other (Including KUED) 56,787 29.05% 170.57% $6,158 -9.271 145.48% $5,840 -5.16% 132.82%
Total 5124,105 6.42% 156.73% $127,008 2.344 162.73% $134,348 5.78% 177.91%
UTAH STATE UNIVERSITY
Annualized FIE** 11,205 5.40% 17.72% 12,226 9.11% 28.45% 13,063 6.85% 37.25%
Ed & Gen + CE Centers + Coop M Ed $51,392 8.12% 182.94% 554,115 5.30% 197.93% $54,115 0.00% 197.93%
Agricultural Programs 512,160 4.80% 185.18% 513,104 7.77% 207.34% $13,103 -0.01% 207.32%
All Cther (Including Prod Ctr) 52,637 2.82% 100.24% 52,793 5.91% 112.07% $2,794 0.03% 112.13%
Total $66,189 7.27% 178.75% $70,012 5.78% 194.85% $70,012 0.00% 194.854
VEBER STATE UNIVERSITY
Annualized FIE*** 10,034 5.90% 31.448 10,362 3.27% 35.73% 10,936 5.544 43.25%
Ed & Gen + Coop Nursing $32,176 3.52% 165.61% 535,127 9.17% 189.96% $36,782 4.71% 203.62%
All Other 5196 0.00% 29.89% 5199 1.33% 31.61% $201 1.11% 33.07%
Total $32,372 3.50% 163.94% 535,325 9.12% 188.01% $36,982 4.69% 201.52%
SOUTHERN UTAH UNIVERSITY
Annualized FTE 3,044 5.18% 68.46% 3.440 13.014 90.37% 3,698 7.50% 104.65%
Ed A Gen + Coop M Ed 510,696 13.20% 188.50% $11,597 8.42% 212.80% $12,411 7.02% 234.76%
All Other $62 .13% 92.19% $64 3.25% 98.44% $64 0.47% 99.37%
Total 510,758 12.78% 187.68% 511,661 8.39% 211.82% $12,475 6.98% 233.60%
SNOW COLLEGE
Annualized FTE 1,616 17.53% 90.344 1,768 9.41% 108.244 1,990 12.564 134.39%
Education and General 55,888 10.62% 231.40% 56,432 9.23% 261.99% $7,005 8.91% 294.264
All Othzr $25 0.00% -52.69% $25 0.00% -52.69% $24 -2.44% -53.85%
Total 55,913 10.58% 223.32% 56,456 9.19% 253.048 $7,029 8.87% 284.36%
DIXIE CCtLEGE
Annualized FIE 1,992 10.54% 73.22% 2,156 8.23% 87.48% 2,297 6.54% 99.74%
Education and General $6,257 10.62% 233.0191; 56,706 7.18% 256.91% $7,360 9.75% 291.70%
All Other (Incl IP Amp) $52 2.77% -21.69% $54 3.46% -18.98% $59 9.67% -11.14%
Total . 56,309 10.55% 224.30% 56,760 7.15% 247.50% $7,419 9.75% 281.36%
CCCLEGE Cf EASTERN UTAH
Annualized FTE**** 1,420 4.87% 161.51% 1,684 18.59% 210.13% 1,693 0.53% 211.79%
Ed & Gen San Juan Ctr 55,457 16.08% 277.89% 56.060 11.05% 319.66% $6,597 8.87% 356.88%
All Cther $136 1.42% 48.80% 5138 1.764 51.42% $242 74.57% 164.33%
Total 55,593 15.67% 264.26% 56,198 10.83% 303.69% $6,839 10.34% 345.42%
UTAH VALLEY CCHMUNITY COtLEGE
Annualized FTE 5,854 9.85% 103.19% 5,787 -1.14% 100.87% 6,732 16.33% 133.67%
Education and General 512,772 9.55% 268.76% 514,144 10.74% 308.36% $15,407 8.93% 344.84%
All Other $52 1.57%. 147.14% $53 1.93% 151.90% $53 0.19% 152.38%
Total $12,824 9.51% 268.02% $14,197 10.70% 307.42% $15,460 8.90% 343.68%
SALT LAKE COMMUNITY COLLEGE
Annualized FTE 7,584 16.14% 91.32% 8,596 13.344 116.85% 10,243 19.16% 158.40%
Education and General $16.206 15.48% 250.91% $20,583 27.00% 345.684 $24,492 18.99% 430.33%
All Other (Excl Sk Ctr) 565 0.00% 279.41% $65 0.00% 279.41% $65 0.78% 282.35%
Total (Excl Sk Ctr) $16,271 15.41% 251.02% 520,647 26.90% 345.44% $24,557 18.94% 429.79%
$BR AND STATEWIDE
SBR Administration 58,343 515.95% 1338.96% 53,264 -60.87% 463.00% $1,975 -39.51% 240.55%
Cther Statrwide $2,198 22.46% 197.85% $1,776 -19.20k 140.664 52,888 62.594 291.30%
Total $10,541 234.71% 699.93% $5,040 -52.18% 282.494 $4,862 -3.54% 268.97%
TOTAL USHE
Annualized FTE* 61,745 6.43% 30.46% 65,788 6.55% 39.00% 71,808 9.15% 51.72%
Educ & Gen Ether lnst 5242,673 7.36% 178.27% $259,641 6.99% 197.72% $275,834 6.20 216.29%
All Other Line Items 548,201 26.98% 208.41% $43,663 -9.41% 179.37% $44,149 1.11% 182.48%
Total 5290,874 10.19% 182.85% 5303,304 4.27% 194.93% $319,983 5.50% 211.15%
I*Excluding Medical **Including Cont
1
Ed Centers ***Including Coop Nursing ****Including San Juan Center Budget-Related FTE beginning 1991-92
29
2 1 2

History 14-Dec-92
TABLE 4--CONSTANT Dollar State Tax
Funds in thousands of dollars
UNIVERSITY OF UTAH
1976-77
Actual
HISTORY OF ENROLLMENT AAD BLUGET CHANGES. USHE
1977-78 1978-79 1979-80
Actual 1-Yr Inc Actual 1-Yr Inc 2-Yr Inc Actual 1-Yr Inc 3-Yr Inc
1980-81
Actual 1-Yr Inc 4-Yr Inc
Annualized FTE* 18,982 18,699 -1.49% 17,975 -3.87% -5.31% 18,430 2.53% -2.91% 18,768 1.83% -1.13%
Ed & Gen Coop Nursing $94,944 $101,018 6.40% $103,052 2.01% 8.54% $94,432 -8.37% -0.54t $93,256 -1.24% -1.78%
Medical Programs (Ind 5th Path) $13,732 $14,010 2.02% $14,012 0.01% 2.03% $13,675 -2.40% -0.42% $13,339 -2.46% -2.87%
All Other (Including KUED) $5,948 $6,558 10.26% $6,501 -0.88% 9.29% $5,772 -11.21% -2.964 $5,592 -3.12% -5.98%
Total $114,624 $121,586 6.07% $123,565 1.63% 7.804 $113,879 -7.84A -0.65% $112,187 -1.49% -2.13%
UTAH STATE UNIVERSITY
Annualized FTE** 9,518 9,729 2.22% 9,156 -5.89% -3.80% 9,562 4.43% 0.46% 10,359 8.34% 8.84%
Ed & Gen + CE Centers + Coop M Ed $43,069 $45,371 5.34% $46,660 2.84% 8.34% $43,757 -6.22% 1.60% $43,392 -0.83% 0.75%
Agricultural Programs $10,110 $11,265 11.43% $11,711 3.96% 15.84% $11,036 -5.77% 9.16% $11,253 1.97% 11.30%
All Other (Including Prod Ctr) $3,123 $3,220 334% $3,614 12.23% 15.75% $2,917 -19.30% -6.59% $2,956 1.35% -5.33%
Total $56,302 $59,856 6.31% $61,985 3.56% 10.10% $57,710 -6.90% 2.50% 557,601 -0.19% 2.31%
WEBER STATE UNIVERSITY
Annualized FTE*** 7,634 7,449 -2.42% 7,480 0.42% -2.02% 8,116 8.50% 6.31% 8,919 9.89% 16.834
Ed & Gen + Coop Nursing $28.725 $31,770 10.60% $32,453 2.15% 12.98% $29,543 4.97% 2.85% $30,130 1.98% 4.89%
All Other $358 5335 -6.28% $302 -9.79% -15.46% $277 -8.39% -22.55% $257 -7.34% -28.24%
Total $29.082 $32,106 10.39% $32,756 2.03% 12.63% $29,820 -8.964 2.54% $30,386 1.90% 4.41A
SOUTHERN UTAH UNIVERSITY
. Annualized FTE 1,807 1,750 -3.15k 1,719 -1.77% -4.87% 1,853 7.80% 2.55% 1,948 5.13% 7.80%
Ed & Gen + Coop M Ed $8,791 $9,194 4.58% 19,514 3.48% 8.221; $8,887 -6.59% 1.09% $8.890 0.03% 1.13%
All Other $76 $73 -3.35% $72 -1.60% -4.90% $67 -7.62% -12.15% $63 -5.25% -16.75%
Total $8,867 $9,267 4.51% $9,586 3.44% 8.11% $8,954 -6.60% 0.98% $8,953 -0.00% 0.98%
SNOW COLLEGE
Annualized FTE 849 915 7.77% 897 -1.97% 5.65% 1,002 11.71% 18.02% 1,108 10.58% 30.51%
Education end General $4,213 $4,680 11.08% $5,146 9.95% 22.144 $4,848 -5.78% 15.07% $4,855 0.140; 15.23%
All Other $123 $48 -61.25% $47 -2.30% -62.14% $43 -8.65% -65.42% $40 -6.62% -67.71%
Total $4,336 $4,728 9.03% 55,192 9.83% 29.74% $4,891 -5.81% 12.79% $4,894 0.08% 12.87%
DIXIE COLLEGE
Annualized FTE 1,150 1,148 -0.17% 1,092 -4.88% -5.044 1,141 4.49% -0.78% 1,325 16.13% 15.22%
Education and General $4,455 $4,711 5.744 $5,089 8.03% 14.234 $4,027 -5.16% 8.34% $4,950 2.55% 11.10%
All Other (Incl ZP Am)) $157 $24 -84.47% $24 -1.60% -84.72% ($64) -364.63% -140.434 $62 -197.70% -60.50%
Total $4,613 $4,736 2.66% $5,113 7.98% 10.85% $4,763 -6.85% 3.264 $5,012 5.23% 8.66%
COLLEGE OF EASTERN UTAH
Annualized FTE**** 543 649 19.52% 660 1.69% 21.55% 625 -5.30% 15.10% 753 20.484 38.67%
Ed & Gen San Juan Ctr $3,424 $3,621 5.76% $3,869 6.84% 12.99% $3,782 -2.244 10.464 $3,869 2.30% 13.01%
All Other $217 $154 -29.04% $139 -9.33% -35.67% $127 -8.61% -41.21% $122 -4.33% -43.75%
Total $3,641 $3,775 3.69% 54,008 6.18% 10.09% $3,910 -2.46% 7.39% $3,991 2.09% 9.63%
UTAH VALLEY COMMUNITY COLLEGE
Annualized FTE 2,881 2,863 -0.62% 2,897 1.19% 0.56% 3,250 12.19% 12.81% 3,840 18.15% 33.29%
Educatinn and General $8,212 $9,869 20.17% $10,775 9.18% 31.20% $9,781 -9.22% 19.11% $9,925 1.46% 20.85%
All Zither $50 $300 502.93% $73 -75.63% 46.96% $78 5.97% 55.73% $70 -10.304 39.70%
Total $8.262 $10,169 23.08% $10,848 6.67% 31.30% $9,859 -9.12% 19.33% $9,994 1.37% 20.96%
SALT LAKE COMMUNITY COLLEGE
Annualized FTE 3,964 3,974 0.25% 3,814 -4.03% -3.78% 3,870 1.47% -2.37% 4,155 7.36% 4.82%
Education and General $10,950 $12,042 9.97% $12,494 3.76% 14.10% 111,491 -8.03% 4.94% $11,425 -0.58% 4.33%
All Other (Excl Sk Ctr) $40 $74 84.13% $92 23.59% 127.56% $94 2.00% 132.10% $84 -10.61% 107.49%
Total (Excl Sk Ctr) $10.991 $12,116 10.24% $12,586 3.88% 14.52% $11,585 -7.96% 5.41% $11,508 -0.66% 4.71%
$BR ASO STATEWIDE
SBR Administration $1.375 $1,384 0.674 $1,403 1.35% 2.03% $1,293 -7.83% -5.97% $1,200 -7.14% -12.69%
Other Statewide $1.750 $3,378 93.04% $2,499 -26.01% 42.84% $2,461 -1.53% 40.65% $2,307 -6.27% 31.83%
Total $3,125 $4,762 52.40% $3,902 -18.06% 24.88% $3,754 -3.80k 20.14% 53,507 -6.574 12.244
TOTAL 0sHE
Annualized FTE* 47,330 47,178 -0.32% 45,690 -3.15% -3.47% 47,849 4.73% 1.10% 51,174 6.954 8.12%
Educ L Gen + Other Inst $206,783 $222,276 7.49% $229,052 3.05% 10.77% $211,349 -7.73% 2.21% $210,691 -0.31% 1.89%
All Other Line items $37,059 $40,825 10.16% $40,489 -0.82% 9.26% $37,775 -6.70% 1.93% $37,344 -1.14% 0.77%
Total $243,842 $263,101 7.90% $269,542 2.45% 10.544 $249,124 -7.57% 2.17% 5248,035 -0.44% 1.72%
*Excluding Medical **Including Cont Ed Centers ***Including Coop Nursing ***Including San Juan Center
30
Budget-Related FTE beginning 1991-92
1

II/History 14 -Dec-92 HISTCRY Of ENROLLMENT AND BUDGET CHANGES, USHE
111
TABLE 4--CONSTA1' Jollar State Tax
Funds in thousands of dollars
UNIVERSITY OF UTAH
Annualized FTE*
IIIEd & Gen + Coop Nursing
Medical Programs (Ind 5th Path)
All Other (Including KUED)
Total
KAN STATE UNIVERSITY
Annualized FTE**
Ed & Gen + CE Centers + Coop M Ed
Agricultural Programs
All Other (Including Prod Ctr)
Total
WEBER STATE UNIVERSITY
Annualized FTE'***
Ed & Gen + Coop Nursing
All Other
Total
SOUTKRN UTAH UNIVERSITY
II/Annualized FTE
Ed & Gen + Coop M Ed
All Other
Total
SNOW COLLEGE
Annualized FTE
Education and General
All Other
IIITotal
DIXIE COLLEGE
Annualized FTE
Education and General
II/
All Other (Inc) ZP Amp)
Total
COLLEGE OF EASTERN UTAH
Annualized FTE****
IIIEd & Gen + San Juan Ctr
All Other
Total
UTAH VALLEY COMMUNITY COLLEGE
II/
Annualized FTE
Education E nd General
All Other
Total
IIISALT LAKE COMMUNITY COLLEGE
Annualized FTE
Education and General
III
All Other (Excl Sk Ctr)
Total (Excl Sk Ctr)
SBR AND STATEWIDE
SERI Administration
Other Statewide
Total
TOTAL USHE
Annualized FTE*
Educ & Gen Other Inst
All Other Line Items
Total
i*Excluding
1981-82
Actual 1-Yr Inc 5-Yr Inc
1982-83
Actual 1-Yr Inc 6-Yr Inc
198344
Actual 1-Yr Inc 7-Yr Inc
1984-85
Actual 1-Yr Inc 8-Yr Inc
18,833 0.35% -0.78% 19,454 3.30% 2.4916 19,492 0.20% 2.69% 19,445 -0.24% 2.44%
$95,994 2.94% 1.114 5101,527 5.76% 6.93% $101,464 -0.06% 6.87% $113,494 11.86% 19.54%
$15,155 13.62% 10.36% $16,210 6.96% 18.04% $16,262 0.32% 18.42% $17,549 7.92% 27.79%
$5.620 0.50% -5.52% $5,892 4.844 -0.95% $5,803 -1.50% -2.43% $6,136 5.72% 3.16%
5116,769 4.08% 1.87% $123,628 5.87% 7.86% 5123,529 -0.08% 7.77% 5137,179 11.05% 19.68%
10,365 0.06% 8.90% 10,553 1.81% 10.87% 10,989 4.13% 15.45% 10,663 -2.97% 12.03%
$44,278 2.045; 2.81% $47,257 6.73% 9.73% $47,274 0.03% 9.76% $53,963 14.15% 25.30%
$11,559 2.72% 14.34% $12,421 7.45% 22.86% $12,190 -1.86% 20.58% $13,041 6.98% 28.99%
$2,886 -2.36% -7.56% $2,883 -0.13% -7.68% $2,216 -23.12% -29.02% $2,893 30.52% -7.36%
$58,724 1.95% 4.30% $62,561 6.53% 11.12% $61,680 -1.41% 9.55% $69,897 13.32% 24.15%
8,924 0.06% 16.904 9,010 0.96% 18.02% 8,822 -2.09% 15.56% 8,467 -4.02% 10.91%
$30,542 1.37% 6.33% $32,528 6.50% 13.24% $32,890 1.11% 14.50% $36,682 11.53% 27.70%
$245 -4.69% -31.60% $248 1.45% -30.61% $245 -1.18% -31.43% $247 0.53% -31.07%
$30,787 1.32% 5.86% 532,776 6.46% 12.70% 333,136 1.10% 13.94% $36,928 11.45% 26.98%
1,922 -1.33% 6.364 2,173 13.06% 20.25% 2,315 6.53% 28.11% 2,410 4.10% 33.37%
$9,148 2.90% 4.06% $9,816 7.30% 11.66% $9,836 0.20% 11.89% $10,865 10.46% 23.59%
$79 24.58% 3.71% $81 2.31% 6.10% $79 -1.84% 4.15% $80 1.16% 5.36%
59,227 3.05% 4.06% 59.897 7.26% 11.61% 59,915 0.18% 11.82% $10,945 10.39% 23.44%
1,132 2.17% 33.33% 1,025 -9.45% 20.73% 1,146 11.80% 34.98% 1,130 -1.40% 33.10%
$5,023 3.47% 19.23% $5,457 8.644 29.53% $5,662 3.75% 34.39% $6,339 11.96% 50.47%
$31 -22.57% -75.00% 532 2.92% -74.26k $31 -1.69% -74.70% $31 -0.02% -74.70%
55,054 3.26% 16.55% 55,489 8.60% 26.58% 55,693 3.72% 31.29% 56,370 11.90% 46.91%
1,380 4.15% 20.00% 1,436 4.06% 24.87% 1,449 0.91% 26.00% 1,4143 2.35% 28.96%
$5,063 2.28% 13.63% $5,364 5.96% 20.40% $5,404 0.74% 21.29% $5,889 8.97% 32.17%
$62 -1.08% -60.93% $63 2.044 -60.13% 560 -4.72% -62.02% $61 2.78% -60.96%
$5,124 2.23% 11.08% $5,427 5.92% 17.66% $5,464 0.67% 18.45% $5,:.50 8.90% 28.99%
829 10.09% 52.67% 922 11.22% 69.80% 1,065 15.51% 96.13% 1,162 9.11% 114.00%
$3,972 2.66% 16.02% $4,265 7.36% 24.55% $4,299 0.82% 25.57% $5,042 17.28% 47.27%
$115 -5.82% -47.034 $117 2.31% -45.80% $115 -1.974 -46.87% $119 3.46% -45.03%
54,087 2.41% 12.26% 54,382 7.21% 20.36% $4,415 0.74% 21.26% $5,162 16.92% 41.78%
4,349 13.26% 50.95% 5,035 15.774 74.77% 5,272 4.71% 82.99% 4,947 -6.16% 71.71%
$10,356 4.35% 26.10% $10,847 4.74% 32.08% 510.895 0.45% 32.67% 513,058 19.85% 59.00%
$67 -3.34A 35.03% $63 -5.79% 27.21% $62 -2.79% 23.66% $62 0.67% 24.49%
510,423 4.29% 26.16% 510,910 4.67% 32.05% $10,957 0.43% 32.61% $13,120 19.744 68.79%
4,573 10.06% 15.36% 5,339 16.75% 34.69% 5,518 3.35% 39.20% 5,563 0.82% 40.34%
$11,736 2.72% 7.17% $12,349 5.22% 12.77% $12,353 0.04% 12.81% $14,884 20.49% 35.92%
$81 -3.28% 100.68% $83 2.61% 105.91% $81 -2.84% 100.07% $81 0.91% 101.904
$11,816 2.68% 7.51% $12,432 5.21% 13.11% $12,434 0.02% 13.13% $14,965 20.36% 36.16%
$1,304 8.64% -5.14% 51,380 5.79% 0.35% 51,355 -1.764 -1.42% $1,425 5.13% 3.63%
$2,179 -5.54% 24.52% 52,859 31.24% 63.42% $2,510 -12.22% 43.45% $7,084 182.21% 304.84%
$3,483 -0.69% 11.47% 54,239 21.71% 35.67% $3,865 -8.82% 23.71% $8.508 120.12% 172.31%
52.306 2.21% 10.51% 54,946 5.05% 16.09% 56,068 2.04% 18.46% 55,270 -1.42% 16.78%
$216.113 2.57% 4.51% 5229,410 6.15% 10.94% $230,077 0.29% 11.26% $260,216 13.10% 25.84%
$39,382 5.46% 6.27% $42.331 7.49% 14.23% $41,010 -3.12% 10.66% $48,808 19.02% 31.71%
$255,494 3.01% 4.78% 5271,741 6.36% 11.44% 5271,087 -0.24% 11.17% $309,024 13.99% 26.73%
Medical **Including Cont Ed Centers ***Including Coop Nursing ****Including San Juan Center ***** Budget-Related FTE beginning 1991-92
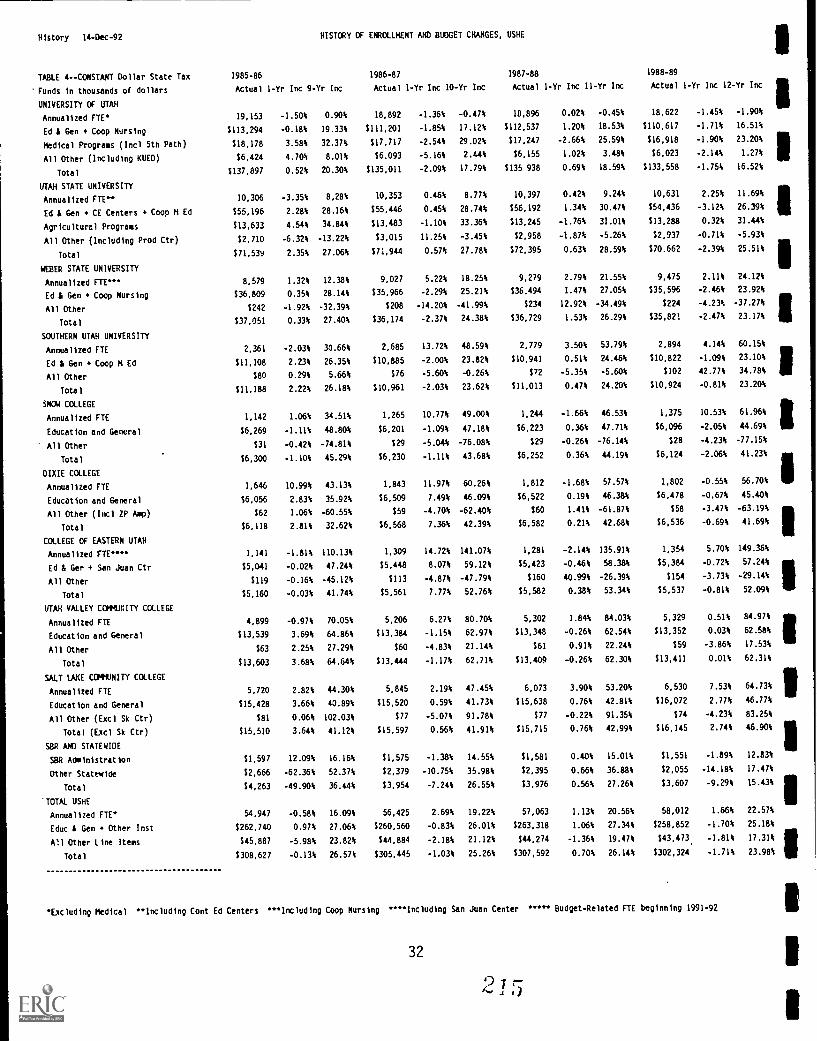
History I4-Dec-92
TABLE 4--CONSTANT Dollar State Tax
Funds in thousands of dollars
UNIVERSITY Of UTAH
HISTORY CW ENROLLMENT AND BUDGET CHANGES, USHE
1985-86 1986-87 1987-88
Actual 1-Yr Inc 9-Yr Inc Actual 1-Yr Inc 10-Yr Inc Actual 1-Yr Inc 11-Yr Inc
1988-89
Actual 1-Yr Inc 12-Yr Inc
Annualized FTE 19,153 -1.50% 0.90% 18,892 -1.36% -0.47% 18,896 0.02% -0.45% 18,622 -1.45% -1.90%
Ed i Gen Coop Nursing $113,294 -0.18% 19.33% $111,201 -1.85% 17.12% $112,537 1.20% 18.53% $110,617 -1.71% 16.51%
Medical Programs (Incl 5th Path) $18,178 3.58% 32.37% $17,717 -2.54% 29.02% $17,247 -2.66% 25.59% $16,918 -1.90% 23.20%
All Other (Including KUED) $6,424 4.70% 8.01% $6.093 -5.16% 2.44% $6.155 1.02% 3.48% $6,023 -2.14% 1.27%
Total $137,897 0.52% 20.30% $135,011 -2.094 17.79% $135 938 0.69% 18.59% $133,558 -1.75% 16.52%
UTAH STATE UNIVERSITY
Annualized FTE** 10,306 -3.35% 8.28% 10,353 0.46% 8.77% 10,397 0.42% 9.24% 10,631 2.25% 11.69%
Ed S. Gen + CE Centers + Coop M Ed $55,196 2.28% 28.16% $55,446 0.45% 28.74% $56,192 1.34% 30.47% $54,436 -3.12% 26.39%
Agricultural Programs $13,633 4.54% 34.84% $13,483 -1.10% 33.36% $13,245 -1.76% 31.01% $13,288 0.32% 31.44%
All Other (Including Prod Ctr) $2,710 -6.32% -13.22% $3,015 11.25% -3.45% $2,958 -1.87% -5.26% $2,937 -0.71% -5.93%
Total $71,539 2.35% 27.06% 171,944 0.57% 27.78% 172,395 0.63% 28.59% $70.662 -2.39% 25.51%
WEBER STATE UNIVERSITY
Annualized FTE*** 8,579 1.32% 12.38% 9,027 5.22% 18.25% 9,279 2.79% 21.55% 9,475 2.114 24.12%
Ed i Gen + Coop Nursing $36.809 0.35% 28.14% $35,966 -2.29% 25.21% $36,494 1.47% 27.05% $35,596 -2.46% 23.92%
All Other $242 -1.92% -32.39% $208 -14.20% -41.99% $234 12.92% -34.49% $224 -4.23% -37.27%
Total 137,051 0.33% 27.40% $36,174 -2.37% 24.38% $36,729 1.53% 26.29% $35,821 -2.47% 23.17%
SOUTHERN UTAH UNIVERSITY
Annualized FT/ 2,361 -2.03% 30.66% 2,685 13.72% 48.59% 2,779 3.50% 53.79% 2,894 4.14% 60.15%
Ed S. Gen Coop M Ed $11,108 2.23% 26.35% $10,885 -2.00% 23.82% $10,941 0.51% 24.46% $10,822 -1.09% 23.10%
All Other $80 0.29% 5.66% $76 -5.60% -0.26% $72 -5.35% -5.60% 1102 42.77% 34.78%
Total $11,188 2.22% 26.18% 110,961 -2.03% 23.62% $11,013 0.47% 24.20% $10,924 -0.81% 23.20%
SNOW COLLEGE
Annualized FTE 1,142 1.06% 34.51% 1,265 10.77% 49.00% 1,244 -1.66% 46.53% 1,375 10.53% 61.96%
Education and General $6,269 -1.11% 48.80% $6,201 -1.09% 47.18% $6,223 0.36% 47.71% $6,096 -2.05% 44.69%
All Other $31 -0.42% -74.81% $29 -5.044 -76.08% $29 -0.26% -76.14% $28 -4.23% -77.15%
Total $6,300 -1.10% 45.29% $6,230 -1.11% 43.68% $6,252 0.36% 44.19% $6,124 -2.06% 41.23%
DIXIE COLLEGE
Annualized FTE 1,646 10.99% 43.13% 1,843 11.97% 60.26% 1,812 -1.68% 57.57% 1,802 -0.55% 56.70%
Education and General $6,056 2.83% 35.92% $6,509 7.49% 46.09% $6,522 0.19% 46.38% 16,478 -0.67% 45.40%
All Other (Incl IP Amp) $62 1.06% -60.55% $59 -4.70% -62.40% $60 1.41% -61.87% $58 -3.47% -63.19%
Total $6,118 2.81% 32.62% 16,568 7.36% 42.39% $6,582 0.21% 42.68% $6,536 -0.69% 41.69%
COLLEGE Of EASTERN UTAH
Annualized FTE**** 1,141 -1.81% 110.13% 1,309 14.72% 141.07% 1,281 -2.14A 135.91% 1,354 5.70% 149.36%
Ed & Ger San Juan Ctr $5,041 -0.02% 47.24% $5,448 8.07% 59.12% $5,423 -0.46% 58.38% $5,384 -0.72* 57.20
All Other $119 -0.16% -45.12% $113 -4.87% -47.79% $160 40.99% -26.39% $154 -3.73% -29.14%
Total 15,160 -0.03% 41.74% $5,561 7.77% 52.76% 15,582 0.38% 53.34% $5,537 -0.81% 52.09%
UTAH VALLEY COMMUNITY COLLEGE
Annualized FTE 4,899 -0.97% 70.05% 5,206 6.27% 80.70% 5,302 1.84% 84.03% 5,329 0.51% 84.97%
Education and General $13,539 3.69% 64.86% $13,384 -1.15% 62.97% $13,348 -0.26% 62.54% $13,352 0.03% 62.58%
All Other $63 2.25% 27.29% $60 -4.83% 21.14% $61 0.91% 22.24% $59 -3.86% 17.53%
Total $13,603 3.68% 64.64% 113,444 -1.17% 62.71% $13,409 -0.26% 62.30% 113,411 0.01% 62.31%
SALT LAKE COMMUNITY COLLEGE
Annualized FTE 5,720 2.82% 44.30% 5,845 2.19% 47.45% 6,073 3.9096 53.20% 6,530 7.53% 64.73%
Education and General $15,428 3.66% 40.89% $15,520 0.59% 41.73% $15,638 0.76% 42.81% $16,072 2.77% 46.77%
All Other (Excl Sk Ctr) $81 0.06% 102.03% $77 -5.07% 91.78% $77 -0.22% 91.35% $74 -4.23% 83.25%
Total (Excl Sk Ctr) $15.510 3.64% 41.12% $15,597 0.56% 41.91% $15,715 0.76% 42.99% $16,145 2.74% 46.90%
SBR ANO STATEWIDE
SBR Administration $1,597 12.09% 16.16% $1,575 -1.38% 14.55% $1,581 0.40% 15.01% $1,551 -1.89% 12.83%
Other Statewide $2,666 -62.36% 52.37% $2,379 -10.75% 35.98% $2,395 0.66% 36.88% $2,055 -14.18% 17.47%
Total $4,263 -49.90% 36.44% $3,954 -7.24% 26.55% 13,976 0.56% 27.26% $3,607 -9.29% 15.43%
'TOTAL USHE
Annualized FTE 54,947 -0.58% 16.09% 56,425 2.69% 19.22% 57,063 1.13% 20.56% 58,012 1.66% 22.57%
Educ i Gen Other Inst $262,740 0.97% 27.06% $260,560 -0.83% 26.01% $263,318 1.064 27.34% $258,852 -1.70% 25.18%
All Other Line Items $45,887 -5.98% 23.82% $44,884 -2.18% 21.12% $44,274 -1.36% 19.47% $43,473. -1.81% 17.31%
Total $308,627 -0.13% 26.57% 1305.445 -1.03% 25.26% $307,592 0.70% 26.14% $302,324 -1.71% 23.98%
*Excluding Medical **Including Cont Ed Centers ***Including Coop Nursing ****lncluding San Juan Center ***** Budget-Related FTE beginning 1991-92
32
0 -I r-
1

History 15 -Dec-92 HISTORY OF ENROLLMENT AhD BUDGET CHANGES, USHE
ITABLE 4--OONSTAKT Dollar State Tax
Funds in thousands of dollars
UNIVERSITY OF UTAH
Annualized FTE*
Ed & Gen + Coop Nursing
IMedical Programs (Ind 5th Path)
All Other (Including KUED)
Total
IUTAH STATE UNIVERSITY
Annualized FIE**
Ed & Gen + CE Centers + Coop M Ed
Agricultural Programs
All Other 9r:luding Prod Ctr)
Total
IIIWEBER STATE UNIVERSITY
Annualized FTE***
Ed i Gen Coop Nursing
IAll Other
Total
SOUTHERN UTAH UNIVERSITY
IIIAnnualized FIE
Ed & Gen + Coop M Ed
All Other
Total
III
SNOw COLLEGE
Annualized FTE
Education and General
All Other
Total
III DIXIE COLLEGE
Annualized FTE
Education and General
All Other (Incl IP Amp)
Total
COLLEGE Cf EASTERN UTAH
Annualized FTE****
II/
Ed & Gen San Juan Ctr
All Other
Total
UTAH VALLEY COMMUNITY COLLEGE
IAnnualized FTE
Education and General
All Other
Total
ISALT LAKE COMMUNITY COLLEGE
Annualized FTE
Education and General
All Other (Excl Sk Ctr)
IIITotal (Excl Sk Ctr)
SBR AK) STATEWIDE
SBR Administration
Other Statewide
IIITotal
TOTAL USHE
Annualized FTE*
Educ & Gen Other Inst
II/
All Other Line Items
Total
1989-90
Actual 1-Yr Inc 13-Yr Inc
1990-91
Actual 1-Yr Inc 14-Yr Inc
1991-92 *****
Actual 1-Yr Inc 15-Yr Inc
18,996 2.01% 0.07% 19,769 4.07% 4.15% 21,156 7.02% 11.45%
6111,438 0.74% 17.374 $108,009 -3.08% 13.76% $111,665 3.39% 17.61%
$16.951 0.19% 23.44% $16,449 -2.96% 19.78% $16,843 2.39% 22.65%
57,428 23.32% 24.88% $6.342 -14.62% 6.62% $5,840 -7.91% -1.81%
5135.817 1.694 18.49% $130,799 -3.69% 14.11% 5134,348 2.71% 17.21%
11,205 5.40% 17.72% 12,226 9.11% 28.45% 13,063 6.85% 37.25%
$56,242 3.32% 30.59% $55,730 -0.914 29.40% $54,115 -2.90% 25.65%
$13,307 0.14% 31.62% $13,495 1.41% 33.48% $13,103 -2.90% 29.614
$2,886 -1.75% -7.58% $2,876 -0.344 -7.89% $2,794 -2.87% -10.53%
$72,435 2.51% 28.66% 172,102 -0.46% 26.06% $70,012 -2.90% 24.35%
10,034 5.90% 31.44% 10,362 3.27% 35.73% 10,936 5.54% 43.25%
$35,213 -1.08% 22.59% $36,175 2.73% 25.944 $36,782 1.68% 28.05%
$214 -4.444 -40.05% 6205 -4.65% -42.844 $201 -1.82% -43.88%
$35,427 -1.10% 21.82% 636,380 2.69% 25.09% 636,982 1.66% 27.16%
3,044 5.18% 68.46% 3,440 13.01% 90.37% 3,698 7.50% 104.65%
$11,706 8.17% 33.16% $11,943 2.03% 35.86% $12,411 3.92% 41.18%
$67 -34.19% -11.30% $65 -2.84% -13.81% $64 -2.44% -15.92%
$11,773 7.77% 32.78% 512,009 2.00% 35.43% $12,475 3.88% 40.69%
1,616 17.53% 90.34% 1,768 9.41% 108.24% 1.990 12.56% 134.394
$6,444 5.71% 52.96% $6,624 2.79% 57.22% $7,005 5.76% 66.27%
$27 -4.44% -78.I7k $25 -5.90% -79.45% $24 -5.27% -80.54%
56,471 5.66% 49.23% $6,649 2.75% 53.34% $7,029 5.71% 62.10%
1.992 10.54% 73.22% 2,156 8.23% 87.48% 2,297 6.54% 99.744
$6,847 5.70% 53.69% 56,907 0.86% 55.02% $7,360 6.56% 65.19%
$57 -1.80% -63.86% $55 -2.64% -64.81% $59 6.49% -62.53%
56.904 5.64% 49.68% $6,962 0.83% 50.93% $7,419 6.56% 60.83%
1,420 4.87% 161.51% 1,684 18.59% 210.13% 1,693 0.53% 211.79%
$5.972 10.92% 74.41% $6,241 4.51% 82.27% $6,597 5.71% 92.694
$149 -3.09% -31.32% $143 -4.23% -34.23A $242 69.51% 11.48%
$6,121 10.54% 68.12% $6,383 4.29% 75.344 56,839 7.144 87.85%
5,854 9.85% 103.19% 5,787 -1.14% 100.87% 6.732 16.33% 133.67%
$13,977 4.68% 70.20% 514,566 4.21% 77.36% $15,407 5.78% 87.61%
$57 -2.94% 14.07% $54 -4.08% 9.41% $53 -2.71% 6.44%
514,034 4.65% 69.86% $14,620 4.18% 76.95% $15,460 5.74% 87.12%
7,584 16.14% 91.32% 8,596 13.34% 116.85% 10,243 19.16% 158.40%
$17,735 10.35% 61.96% $21,197 19.52% 93.57% $24,492 15.55% 123.66%
$71 -4.44% 75.11% $66 -5.90% 64.79% $65 -2.15% 61.25%
$17,806 10.29% 62.01% $21,263 19.42% 93.47% $24,557 15.49% 123.43%
$9,130 488.60% 564.14% $3,362 -63.18% 144.53% $1,975 -41.27% 43.62%
$2,405 17.02% 37.47% $1,829 -23.96% 4.52% $2,888 57.88% 65.02%
$11,536 219.85% 269.20% $5,191 -55.00% 66.13% $4,862 -6.33% 55.61%
61,745 6.43% 30.46% 65,788 6.55% 39.00% 71,808 9.15% 51.72%
$265,574 2.60% 28.43% $267,391 0.68% 29.31% $275,834 3.16% 33.39%
652,750 21.34% 42.34% $44,967 -14.75% 21.34% $44,149 -1.82% 19.13%
5318,324 5.29% 30.55% 5312,358 -1.87% 28.10% 6319,983 2.44% 31.23%
I'Excluding Medical **Including Cont Ed Centers ***including Coop Nursing ****Including San Juan Center Budget-Related FTE beginning 1991-92
33

History I4-Dec -92
TABLE 5--Current Dollar Tuition L Fee
Revenues in thousands of dollars
UNIVERSITY OF UTAH
1976-77
Actual
HISTORY OF ENROLLMENT AND BUDGET CHANGES, USHE
1977-78 1978-79 1979-80
Actual 1-Yr Inc Actual 1-Yr Inc 2-Yr Inc Actual 1-Yr Inc 3-Yr Inc
1980-81
Actual I-Yr Inc 4-Yr Inc
Annualized FTE* 18,982 18,699 -1.494. 17,975 -3.87% _5,31% 18,430 2.53% -2.91% 18,768 1.834 -1.13%
Ed & Gen + Coop Nursing $11,274 $11,906 5.61% $11,947 0.34% 5.97% $13,069 9.39% 15.92% $15,391 17.77% 36.51%
Medical Programs (Incl 5th Path) $841 $1,000 18.92% 11,048 4.88% 24.73% $1,203 14.78% 43.16% $1,416 17.63% 68.40%
All Other (Including KUED) $O SO -- $0 -- -- SO -- -- $0 -- --
Total $12.115 $12,906 6.53% $12,995 0.69% 7.27% $14,272 9.82% 17.81% $16,806 17.76% 38.73%
UTAH STATE UNIVERSITY
Annualized FTE** 9,518 9,729 2.224 9,156 -5.89% -3.80% 9,562 4.43% 0.46% 10,359 8.34% 8.84%
Ed & Gen + CE Centers Coop M Ed $5,789 $6,628 14.49% $6,966 5.09% 20.33% $7,468 7.21* 29.00% 8,725 16.844 50.72%
Agricultural Programs $0 $0 -- SO -- -- $O -- -- $0 -- --
All Other (Including Prod Ctr) $0 $O -- $O -- -- $0 -- -- SO - --
Total $5,789 $6,628 14.49% $6,966 5.09% 20.33% 57,468 7.21% 29.00% $8,725 16.844 50.72%
WEBER STATE UNIVERSITY
Annualized FTE*" 7,634 7,449 -2.42% 7,480 0.42% -2.02% 8,116 8.50% 6.31% 8,919 9.89% 16.83%
Ed& Gen + Coop Nursing $3,215 $3,564 10.86% 13,817 7.11% 18.74% $4,669 22.32% 45.24% $5,468 17.11% 70.10%
.All Other $O SO 0.00% SO -- -- $0 -- -- SO -- --
Total $3,215 $3,564 10.86% $3,817 7.11% 18.74% $4,669 22.32% 45.24% $5,468 17.11% 70.10%
SOUTHERN UTAH UNIVERSITY
Annualized FTE 1,807 1,750 -3.15% 1,719 -1.77% -4.87% 1,853 7.80% 2.55% 1,948 5.13% 7.80%
Ed & Gen + Coop M Ed $670 $790 18.05% $832 5.29% 24.30% $974 17.07% 45.52% $1,123 15.22% 67.67%
All Other $O SO -- $O -- -- $0 -- -- $0 -- --
Total $670 $790 18.05% 1832 5.29% 24.30% 5974 17.07% 45.52% $1,123 15.22% 67.67%
SNOW COLLEGE
Annualized FTE 849 915 7.77% 897 -1.97% 5.65% 1.002 11.71% 18.02% 1,108 10.58% 30.514
Education and General $248 $301 21.45% $336 11.66% 35.61% $427 27.01% 72.24% $559 30.91% 125.48%
All Other $0 $O -- $0 -- -- $0 -- -- $0 -- --
Total $248 $301 21.544 $336 11.58% 35.61% $427 27.01% 72.24% 5559 30.911; 125.48%
DIXIE COLLEGE
Annualized FTE 1,150 1,148 -0.17% 1,092 -4.88% -5.04% 1,141 4.49% -0.78% 1,325 16.13% 15.22%
Education and General $396 $462 16.79% $498 7.62% 25.69% $561 12.69% 41.644 1683 21.69% 72.37%
All Other (Incl IP Amp) $O $0 -- $0 -- -- $0 -- -- $0 -- --
Total $396 5462 16.79% 1498 7.62% 25.69% $561 12.69% 41.64% $683 21.69% 72.37%
COLLEGE Of EASTERN UTAH
Annualized ETV.*** 543 649 19.52% 660 1.69% 21.55% 625 -5.30% 15.10% 753 20.48% 38.67%
Ed & Gen + San Juan Ctr $168 $232 37.74% 1222 -4.20% 31.96% $314 41.06% 86.15% $374 19.40% 122.27%
All Other $0 SO -- $0 -- -- SO -- -- $0 -- --
Total $168 $232 37.74% $222 -4.20% 31.96% $314 41.06% 86.15% $374 19.40% 122.27%
UTAH VALLEY COMMUNITY COLLEGE
Annualized FTE 2,881 2,863 -0.62% 2,897 1.19% 0.56% 3,250 12.19% 12.81% 3,840 18.15% 33.29%
Education and General $987 $1,124 13.80% $1,291 14.92% 30.78% $1,474 14.14% 49.28% 11,905 29.244 92.93%
All Other $0 $0 -- $0 -- $G -- -- $0 -- --
- Total $987 $1,124 13.80% $1,291 14.92% 30.78% 11,474 14.144 49.28% $1,905 29.24% 92.93%
SALT LAKE COMMUNITY COtLEGE
Annualized FTE 3,964 3,974 0.25% 3.814 -4.03% -3.78% 3.870 1.47% -2.37% 4,155 7.36% 4.82%
Education and General $1,104 $1,249 13.10% $1,324 6.04% 19.93% $1,485 12.11% 34.46% $1,887 27.09% 70.88%
All Other (Excl Sk Ctr) $0 SO -- $0 -- -- $0 -- -- $0 -- --
Total (Excl Sk Ctr) 11.104 $1,249 13.10% $1,324 6.0st 19.934 11,485 12.11% 34.46% $1,887 27.09% 70.88%
58$1 AND STATEWIDE
58R Administration SO SO $O $0 $0
Other Statewide $O $0 SO $O SO
Total SO $0 $0 $O SO
TOTAL USHE
Annualized FTE 47,330 47,178 -0.32% 45,690 -3.15% -3.47% 47,849 4.73% 1.10% 8.12%
Educ & Gen Other Inst $23,851 $26,256 10.09% 127.234 3.72% 14.18% $30,440 11.77% 27.62% $5316:1171: 1::::: 51.42%
All Other Line Items $841 $1,000 18.92% $1,048 4.88% 24.73% 11,203 14.78% 43.16% $1,416 17.63% 68.40%
Total $24,692 $27,256 10.39% $28,282 3.76% 14.54% $31,643 11.88% 28.15% 137,530 18.60% 51.99%
*EAcluding Medical **Including Cont Ed Cent.rs *"Including Coop Nursing ""Including San Juan Center
34
2 !
Budget-Related FTE beginr'^g 1991-92

II/ Histoty14-Dec-92 HISTORY Cf ENROLLMENT AND BUDGET CHANGES, USHE
III
TABLE 5--Current Dollar Tuition & Fee 1981-82 1982-83
Actual 1-Yr Inc 5-Yr Inc Actual 1-Yr Inc 6-Yr Inc Actual 1-Yr Inc 7-Yr Inc Ac1983-84
1984-85
tual 1-Yr Inc 8-Yr IncRevenues in thousands of dollars
UNIVERSITY Of UTAH
Annualized FTE*
Ed & Gen + Coop Nursing
Medical Programs (Ind ith Path)
All Other (Including KUEO)
Total
II/
UTAH STATE UNIVERSITY
Annualized FTE
Ed & Gen CE Centers Coop M Ed
*-*
Agricultural Programs
II/
nc
WEBER STATE UNIVERSITY
All Other (Iluding Prod Ctr)
111 Total
Annualized FTE***
Ed 4 Gen # Coop Nursing
All Other
Total
SOUTHERN UTAH UNIVERSITY
Annualized FTE
Ed & Gen + Coop M Ed
All Other
Total
IIISNOW COLLEGE
Annualized FTE
Education and General
All Other
III DIXIE COLLEGE
Total
Annualized FTE
Education and General
III
All Other (Incl ZP Amp)
Total
COLLEGE Of EASTERN UTAH
Annualized FTE****
II
Ed & Gen + San Juan Ctr
All Other
Total
UTAH VALLEY COMMUNITY COLLEGE
III
Annualized FTE
Education and General
All Other
Total
IIISALT LAKE COMMUNITY COLLEGE
Annualized FTE
Education and General
All Other (Excl Sk Ctr)
Total (Excl Sk Ctr)
III SEiR ANO STATEWIDE
SBR Administration
Other Statewide
Total
111 TOTAL USHE
III
Annualized Fit*
II/
Educ & Gen + Other Inst
Total
All Other L Items:4.
18,833 0.35% -0.78% 19,454 3.30% 2.49% 19,492 0.20% 2.69% 19,445 -0.24% 2.44%
$17,140 11.37% 52.03% $18,935 10.47% 67.95% $20,458 8.04% 81.46% $21,771 6.41% 93.10%
$1,294 -8.56% 53.994 $1,343 3.744 59.744 51,420 5.78% 68.974 $1,567 10.29% 86.37%
$0 -- -- $0 -- -- $0 -- -- $0 -- --
$18,434 9.69% 52.17% 520,278 10.00% 67.38% $21,879 7.89% 80.60% $23,337 6.67% 92.63%
10,365 0.06% 8.90% 10,553 1.81% 10.87% 10,989 4.13% 15.45% 10,663 -2.97% 12.03%
$9,515 9.05% 64.36% $10,142 6.59% 75.19% $10,370 2.24% 79.12% $10,490 1.16% 81.20%
$0 -- -- $0 -- -- $0 -- -- $0 -- --
$0 -- -- $0 -- -- $0 -- -- SO -- --
$9,515 9.05% 64.36% $10,142 6.59% 75.19% 510,370 2.24% 79.12% $10,490 1.16% 81.20%
8,924 0.06% 16.90% 9,010 0.96% 18.02% 8,822 -2.09% 15.56% 8,467 -4.02% 10.91%
$5,971
$O
9.20%
__
85.75%
--
$6,628
SO
11.01%
--
106.19%
--
$6,868
$0
3.62%
--
113.65%
--
$7,109
$0
3.52%
--
121.16%
--
55,971 9.20% 85.75% 56,628 11.01% 106.19% $6,868 3.62% 113.65% $7,109 3.52% 121.16%
1,922 -1.3331 6.36% 2,173 13.06% 20.25A 2,315 6.53% 28.11% 2,410 4.10% 33.37%
$1,182 5.28% 76.52% $1,407 19.07% 110.19% 48$1,2 5.30% 121.33% 64$1,2 10.82% 145.28%
SO -- -- $0 -- -- $0 -- -- $0 -. --
$1,182 5.28% 76.52% 51,407 19.07% 110.19% 51,482 5.30% 121.33% $1,642 10.82% 145.28%
1,132 2.17% 33.33% 1,025 -9.45% 20.73% 1,146 11.80% 34.98% 1,130 -1.40% 33.11%
$683 27.23% 175.61% $624 -8.65% 151.77% $746 19.50% 200.86% $755 1.27% 204.68%
$O -- -- $O -- -- $0 -- -- $0 -- --
5683 22.23% 175.61% 5624 -8.65% 151.77% 5746 19.50% 2Uw.86% $755 1.27% 204.68%
1,380 4.15% 20.00% 1,436 4.06% 24.87% 1,449 0.91% 26.00% 1,483 2.35% 28.96%
$719 5.35% 81.60% $789 9.77% 99.33% 1838 6.15% 111.58% $933 11.35% 135.59%
SO -- -- $0 -- -- $0 -- -- $0 -- --
$719 5.35% 81.60% $789 9.77% 99.33% $838 6.15% 111.58% $933 11 35% 135.59%
829 10.09% 52.67% 922 11.22% 69.80% 1,065 15.51% 96.13% 1,162 9.11% 114.00%
$450 20.32% 167.43% $517 14.76% 206.91% $590 14.13% 250.27% $630 6.70% 273.74%
$0 -- -- $0 -- -- $0 -- -- $0 -- --
5450 20.32% 167.43% $517 14.76% 206.91% 5590 14.13% 250.27% $630 6.70% 273.744
4,349 13.26% 50.95% 5,035 15.77% 74.77% 5,272 4.714 82.99% 4.947 -6.16% 71.71%
$2,285 19.96% 131.44% 52,953 29.21% 199.05% 53,298 11.71% 234.06% $3,394 2.90% 243.76%
$0 -- -- $0 -- -- $0 -- -- $O -- --
52,285 19.96% 131.44% 52,953 29.21% 199.05% 53,298 11.71% 234.06% 53,394 2.90% 243.76%
4,573 10.06% 15.36% 5,339 16.75% 34.694 5,518 3.35% 39.20% 5.563 0.82% 40.34%
$2.444 29.54% 121.35% $3,156 29.15% 185.87% $3,820 21.04% 246.01% $3,865 1.17% 250.07%
SO -- -- $0 -- -- $O -- -- $0 -- --
$2,444 29.54% 121.35% 53,156 29.15% 185.87% $3,820 21.04% 246.01% $3,865 1.17% 250.07%
$0 $0 $0 SO
10 $0 $O SO
$0 SO $0 SO
52,306 2.21% 10.51% 54,946 5.05% 16.09% 56,068 2.04% 18.46% 55,270 -1.42% 16.78%
540.390 11.84% 69.34% 545,152 11.79% 89.31% $48.470 7.35% 103.22% 550,589 4.37% 112.10%
$1,294 -8.56% 53.99% $1,343 3.74% 59.74% $1,420 5.78% 68.97% 51,567 10.29% 86.37%
541,684 11.07% 68.82% $46,495 11.54% 88.30% $49,890 7.30% 102.05% 552,156 4.54% 111.23%
/*Excluding Medical **Including Cont Ed Centers ***Including Coop Nursing ****Including San Juan Center ***** Budget-Related FTE beginning 1991-92
35
9

History 14-Dec-92
TABLE 5--Current Dollar Tuition & Fee
Revenues in thousands of dollars
UNIVERSITY Of UTAH
HISTCRY Of ENROLLMENT AND BUDGET CHANGES, USHE
IC -5 1986-87 1987-88
Actual 1-Yr lnc 9-Yr Inc Actual 1-Yr Inc 10-Yr Inc Actual 1-Yr Inc 11-Yr Inc
1988-89
Actual 1-Yr Inc 12-Yr Inc
Annualized FTE* 19,153 -1.50% 0.90% 18,892 -1.36% -0.47k 18,896 0.02% -0.45% 18,622 -1.454 -1.90%
Ed i Gen Coop Nursing $23,244 6.77% 106.17% $25,457 9.52% 125.80% $25,942 1.90% 130.10% $27,501 6.01% 143.93%
Medical Programs (Incl 5th Path) $2,210 41.05% 162.87% $1,994 -9.76% 137.23% $1,969 -1.28% 134.20% $2,177 10.61% 159.04%
All Other (Including KUED) $0 -- -- $O -- -- $0 $O --
Total $25,453 9.074 110.10% $27,451 7.85% 126.59% $27,911 1.67% 130.39% $29,679 6.33% 144.98%
UTAH STATE UNIVERSITY
Annualized FTE''' 10,306 -3.35% 8.28% 10,353 0.46% 8.77% 10,397 0.42% 9.24% 10,631 2.25% 11.69%
Ed & Gen + CE Centers + Coop M Ed $10,783 2.79% 86.26% $11,707 8.57% 102.23% $11,788 0.69% 103.63% $12,987 10.17% 124.34%
Agricultural Programs $O -- -- $0 -- -- $0 -- $0 --
All Other (Including Prod Ctr) SO -- -- $0 -- -- $0 -- SO --
Tote, $10,783 2.79% 86.26% 111,707 8.57% 102.23% $11,788 0.69% 103.63% $12,987 10.17% 124.34%
WEBER STATE UNIVERSITY
Annualized FTE''' 8,579 1.32% 12.38% 9,027 5.22% 18.25% 9,279 2.79% 21.55% 9,475 2.11% 24.12%
Ed & Gen Coop Nursing $7,695 8.24% 139.39% $8,749 13.70% 172.18% $9,378 7.18% 191.72% 110,645 13.51% 231.14%
All Other $0 -- _*_ SO -- -- SO -- $O --
Total $7.695 8.20 139.39% $8,749 13.70% 172.18% $9,378 7.18% 191.72% $10,645 13.51% 231.14%
SOUTHERN UTAH UNIVERSITY
Annualized FTE 2,361 -2.03% 30.66% 2,685 13.72% 48.59% 2,779 3.50% 53.79% 2,894 4.14% 60.15%
Ed & Gen + Coop M Ed $1,717 4.544 156.41% $2,073 20.72% 209.55% $2,169 4.66% 223.98% $2,426 11.85% 262.37%
All Other $0 -- -- $O -- -- $0 -- $0 --
Total $1,717 4.54% 156.41% $2,073 20.72% 209.55% $2,169 4.66% 223.98% $2,426 11.85% 262.37%
511314 COLLEGE
Annualized FTE 1,142 1.06% 34.51% 1,265 10.77% 49.00% 1.244 -1.66% 46.53% 1,375 10.53% 61.96%
Education and General $816 8.04% 229.19% $973 19.16% 292.28% $1,058 8.81% 326 84% $1,157 9.29% 366.49%
All Other $0 -- -- $0 -- -- $0 -- $0 --
Total $816 8.04% 229.19% $973 19.16% 292.28% 11,058 8.81% 326.84% $1,157 9.29% 366.49%
DIXIE COLLEGE
Annualized FTE 1,646 10.99% 43.13% 1,843 11.97% 60.26% 1,745 -5.32% 51.74% 1,802 3.27% 56.70%
Education and Gemeral $1,141 22.26% 188.04% $1,317 15.42% 232.464 $1,569 19.18% 296.24% $1,622 3.35% 309.52%
All Other (Ind ZP Amp) $0 -- -- $0 -- -- $O $0 --
Total $1,141 22.26% 188.04% $1,317 15.42% 232.46% 11,569 19.18% 296.24% 11,622 3.35% 309.52%
COLLEGE OF EASTERN UTAH
Annualized FTE.""" 1,141 -1.81% 110.13% 1,309 14.72% 141.07% 1,281 -2.14% 135.91% 1,354 5.70% 149.36%
Ed & Gen + San Juan Ctr $714 13.48% 324.13% $842 17.79% 399.59% $810 -3.79% 380.68% $884 9.21% 424.96%
All Other $O -- -- $O -- -- $0 -- $0 --
Total $714 13.48% 324.13% $842 17.79% 399.59% 1810 -3.79% 380.68% 1884 9.21% 424.96%
uTAH VALLEY COMMUNITY COLLEGE
Annualized FTE 4,899 -0.97% 70.05% 5,206 6.27% 80.70% 5,302 1.84% 84.03% 5,329 0.51% 84.97%
Education and General $3,834 12.96% 288.31% $4,594 19.83% 365.32% $4,854 5.65% 391.63% $5,284 8.85% 435.16%
All Other $0 -- -- $O -- -- $0 $0 --
Total $3,834 12.96% 288.31% $4,594 19.83% 365.32% 14,854 5.65% 391.63% 15,284 8.85% 435.16%
SALT LAKE COMMUNITY COLLEGE
Annualized FTE 5,720 2.82% 44.30% 5,845 2.19% 47.45% 6,073 3.90% 53.20% 6,530 7.53% 64.73%
Education and General $4,606 19.18% 317.20% $5,304 15.14% 380.36% $5,478 3.29% 396.18% $6,422 17.23% 481.66%
All Other (Excl Sk Ctr) $O -- -- $O -- -- SO SO
Total (Excl Sk Ctr) $4,606 19.18% 317.20% $5,304 15.14% 380.36% $5,478 3.29% 396.18% $6,422 17.23% 481.66%
MR AND STATEWIDE
SBA Administration $O $0 $0 SO
Other Statewide $0 $O $0 $O
Total SO $0 $O $0
TOTAL USHE
Annualized FTE* 54,947 -0.58% 16.09% 56,425 2.69% 19.22% 57,063 1.13% 20.56% 58,012 1.66% 22.57%
Educ & Gen Other Inst $54,550 7.83% 128.71% $61,015 11.85% 155.81% $63,046 3.33% 164.33% $68,928 9.33% 188.99%
All Other Line Items $2.210 41.05% 162.87% $1,994 -9.76% 137.23% $1,969 -1.28% 134.20% 12,177 10.61% 159.04%
Total 156,759 8.83% 129.87% $63,009 11.01% 155.18% $65,015 3.18% 163.31% 171,105 9.37% 187.97%
. *Excluding Medical **Including Cont Ed Centers ***Including Coop Nursing *"'Including San Juan Center "" Budget-Related FTE beginning 1991-92
36
219
1

IIIHistory 15-Dec -92 HISTORY OF ENROLLMENT AND BUDGET CHANGES, USHE
III
TABLE 5--Current Dollar Tuition & Fee
Revenues in thousands of dollars
UNIVERSITY OF UTAH
. Annualized FTE*
illEd & Gen Coop Nursing
Medical Programs (Incl 5th Path)
All Other (Including KUED)
Total
II/
UTAH STATE UNIVERSITY
Annualized FTE**
EdEd & Gen CE Centers Coop 14
Agricultural Programs
All Other (Including Prod Ctr)
III Total
III WEBER STATE UNIVERSITY
Annualized FTE***
Ed & Gen + Coop Nursing
111
All Other
Total
SOUTHERN UTAH UNIVERSITY
IIIAnnualized FTE
Ed & Gen + Coop M Ed
All Other
Total
11/
SNOW COLLEGE
Annualized FTE
Education and General
Ali Other
III
Total
DIXIE COLLEGE
Annualized FTE
Education and General
III
All Other (Incl 2P Amp)
Total
COLLEGE OF EASTERN UTAH
Annualized FTE****
IIIEd & Gen + San Juan Ctr
All Other
Total
UTAH VALLEY COMMUNITY COLLEGE
111
Annualized FTE
Education and General
All Other
Total
IIISALT LAKE CMUOMNITY COLLEGE
Annualized FTE
Education and General
III
All Other (End Sk Ctr)
Total (Excl Sk Ctr)
SBR AND STATEWIDE
Sall Administration
Other Statewide
Total
III TOTAL USHE
ill
Annualized FTE*
II/
Educ t Gen + Other lnst
All Other Line Items
Total
1989-90
Actual I-Yr Inc 13-Yr Inc
1990-91
1991-Actual 1-Yr Inc 14-Yr Inc1:::71-Yr Inc 15-Yr Inc
18,996 2.01% 0.07% 19,769 4.07% 4.154 21,156 7.02% 11.45%
$30,453 10.73% 170.12% $33,997 11.644 201.55% $38,096 12.06% 237.91%
$2,430 11.59% 189.05% $2,665 9.69% 217.06% $2,876 7.90% 242.11%
$O -- -- $0 -- -- $0 -- --
$32,883 10.80% 171.43% $36,662 11.49% 202.63% $40,972 11.76% 238.20%
11,205 5.40% 17.72% 12,226 9.11% 28.45% 13,063 6.85% 37.258
$14,874 14.53% 156.93% $17,532 17.87% 202.84% $17,532 0.00% 202.84%
$0 . -- -- $0 -- -- $O -- --
$0 -- -- $0 -- -- $0 -- --
$14,874 14.53% 156.93% $17,532 17.87% 202.84% $17,532 0.00% 202.84%
10,034 5.90% 31.4.4% 10,362 3.27% 35.73% 10,936 5.54% 43.25%
112,066 13.36% 275.36% $12,815 6.21% 298.66% 115,228 18.83% 373.71%
SO -- -- $0 -- -- SO -- --
$12,066 13.36% 275.36% $12,815 6.21% 298.66% $15,228 18.83% 373.71%
3,044 5.18% 68.46% 3,440 13.01% 90.37% 3,698 7.50% 104.65%
$2,978 22.72% 344.70% $3,497 17.44% 422.25% $3,994 14.21% 496.48%
$0 -- -- $0 -- -- $0 __ --
12.978 22.72% 344.70% $3,497 17.44% 422.25% 13,994 14.21% 496.48%
1,616 17.53% 90.344 1,768 9.41% 108.24% 1,990 12.56% 134.39%
$1,594 37.81% 542.88% $1,755 10.14% 608.06% 12.114 20.43% 752.70%
SO -- -- $0 -- -- $O -- --
$1,594 37.81% 542.88% $1,755 10.14% 608.06% $2,114 20.43% 752.70%
1,992 10.54% 73.22% 2,156 8.23% 87.48% 2,297 6.54% 99.74%
$1.877 15.74% 373.99% $2,011 7.12% 407.75% $2,172 8.02% 448.48%
$0 -- -- $O -- -- SO -- --
$1,877 15.74% 373.99% $2,011 7.12% 407.75% $2,172 8.02% 448.48%
1,420 4.67% 161.51% 1,684 18.59% 210.13% 1,693 0.53% 211.79%
$1,030 16.48% 511.46% $1,231 19.50% 630.66% $1,389 12.85% 724.58%
$0 -- -- SO -- -- $0 -- --
$1,030 16.48% 511.46% $1,231 19.50% 630.66% 11,389 12.85% 724.58%
5,854 9.85% 103.19% 5,787 -1.1 4% 100.87% 6,732 16.33% 133.67%
$6,452 22.114 553.47% $7,203 11.65% 629.58% 18,764 21.67% 787.67%
$0 -- -- $0 -- -- $0
$6,452 22.11% 553.47% 17,203 11.65% 629.58% 18,764 21.67% 787.67%
7,584 16.14% 91.32% 8,596 13.34% 116.85% 10,243 19.16% 158.40%
$8,139 26.14% 637,21% $9,935 22.06% 799.844 $13,306 33.93% 1105.174
$O -- -- $O -- -- $0 -- --
$8,139 26.74% 637.21% $9,935 22.06% 799.84% $13,306 33.93% 1105.17%
$0 $O $0
$0 $0 $0
$0 $0 $0
61,745 6.43% 30.46% 65,788 6.55% 39.00% 71,808 9.15% 51.72%
$79,463 15.28% 233.16% $89,976 13.23% 277.24% $102,595 14.02% 330.15%
$2,430 11.59% 189.05% $2,665 9.69% 217.06% $2,876 7.90% 242.11%
$81,893 15.17% 231.66% $92,641 13.12% 275.19% $105,471 13.85% 327.15%
111 *Excluding Medical **Including Cont Ed Centers ***Including Coop Nursing ****Including San Juan Center ***** Budget-Related FIE beginning 1991-92
37

History 14-Dec-92
Table 6--CONSTAHT Dollar Tuition &
Fee Revenues in thousands of dollars
UNIVERSITY OF UTAH
1976-77
Actual
HISTORY Of ENROLLMENT AND BUDGET CHANGES, USHE
1977-78 1978-79 1979-80
Actual 1-Yr Inc Actual 1-Yr Inc 2-Yr Inc Actual 1-Yr Inc 3-Yr Inc
1980-81
Actual 1-Yr Inc 4-Yr Inc
Annualized FIE* 18,982 16,699 -1.49% 17,975 -3.87h -5.31k 18,430 2.53% -2.91% 18,768 1.83% -1.13%
Ed & Gen + Coop Nursing $26,732 126,459 -1.02% $24,353 -7.96% -8.90% $23,514 -3.45% -12.04% $24,611 4.67% -7.94%
Medical Programs (Incl 5th Path) $1,993 $2,221 11.45% $2,137 -3.80% 7.22% $2,165 1.31% 8.63% $2,264 4.55% 13.57%
All Other (Including KUM) $0 SO -- SO -- -- $O -- -- SO -- --
Total $28,726 $28,680 -0.16% 626,490 -7.64% -7.78% 625,679 -3.06% -10.61% $26,874 4.66% -6.44%
UTAH STATE UNIVERSITY
Annualized FTE*' 9,518 9,729 2.22% 9,156 -5.89% -3.80% 9,562 4.43% 0.46% 10,359 8.344 8.84%
Ed & Gen + CE Centers + Coop M Ed $13,727 114,729 7.30% $14,199 -3.60% 3.444 $13,437 -5.37% -2.11k $13,953 3.84% 1.65%
Agricultural Programs SO $0 -- $0 -- -- SO -- SO -- --
All Other (Including Prod Ctr) $0 SO $O $0 -- $O
Total $13,727 614,729 7.301 $14,199 -3.60% 3.44% $13,437 -5.37% -2.11% 613,953 3.84% 1.65%
WEBER STATE UNIVERSITY
Annualized FTE*** 7,634 7,449 -2.421 7,480 0.42% -2.02% 8,116 8.50% 6.31% 8,919 9.89% 16.83%
Ed & Gen + Coop Nursing $7,622 $7,919 3.90% $7,780 -1.75% 2.08% $8,400 7.97% 10.21% $8,743 4.09% 14.71%
All Other $O SO -- $0 -- -- $0 -- -- $0 -- --
Total 17,622 67,919 3.90% $7,780 -1.75% 2.08% 68,400 7.97% 10.21% $8,743 4.09% 14.71%
SOUTHERN UTAH UNIVERSITY
Annualized FTE 1.807 1,750 -3.15% 1,719 -1.77% -4.87% 1,853 7.80% 2.55% 1,948 5.13% 7.80%
Ed $ Gen + Coop M Ed $1,588 $1,757 10.64% $1,697 -3.42% 6.86% $1,753 3.34% 10.42% $1,795 2.401 13.07%
All Other $0 $0 -- $0 -- -- $0 -- -- $0 -- --
Total $1,588 $1,757 10.64% $1,697 -3.42% 6.86% $1,753 3.34% 10.42% 61,795 2.40% 13.07%
SNOW COLLEGE
Annualized FTE 849 915 7.77% 897 -1.97% 5.65% 1,002 11.71% 18.02% 1,108 10.58% 30.51%
Education and General $588 $669 13.82% $685 2.42% 16.58% $768 12.10% 30.69% $894 16.35% 52.06%
All Other SO $0 -- $0 -- -- $0 -- -- $0 -- --
Total 1588 $670 13.91% 6685 2.35% 16.58% 1768 12.10% 30.69% $894 16.35% 52.06%
DIXIE COLLEGE
Annualized FTE 1,150 1,148 -0.17% 1.092 -4.88% -5.044 1,141 4.49% -0.78% 1,325 16.13% 15.22%
Education and General $939 11,028 9.45% $1,015 -1.28% 8.05% $1,009 -0.53% 7.48% 11,091 8.16% 16.24%
All Other (Incl ZP Amp) $0 SO -- $0 -- -- $0 -- -- $0 -- --
Total $939 $1,028 9.45% 11,015 -1.28% 8.05A $1,009 -0.53% 7.48% $1,091 8.16% 16.24%
COLLEGE Of EASTERN UTAH
Annualized FTE**** 543 649 19.52% 660 1.69% 21.55% 625 -5.30% 15.10% 753 20.48% 38.67%
Ed & Gen + San Juan Ctr $399 $516 29.09% $453 -12.12% 13.45% $564 24.51% 41.25% $599 6.12% 49.89%
All Other $0 $0 -- SO -- -- $0 -- -- $0 -- ....
Total $399 $516 29.09% $453 -12.12% 13.44. $564 24.61% 41.25% $599 6.12% 49.89%
UTAH VALLEY COMMUNITY COLLEGE
Annualized FTE 2,881 2,863 -0.62% 2,897 1.19% 0.56% 3,250 12.19% 12.81% 3,840 18.15% 33.29%
Education and General $2,341 $2,497 6.65% $2,632 5.42% 12.43% $2,652 0.75% 13.27% $3,046 14.87% 30.11%
All Other $O $0 -- $0 -- ... $O -- -- $0 -- --
Total 62,341 62,497 6.65% $2,632 5.42% 12.43% $2,652 0.75% 13.27% 63,046 14.87% 30.11%
SALT LAKE COMMUNITY COLLEGE
Annualized FTE 3,964 3,974 0.25% 3,814 -4.03% -3.781 3,870 1.47% -2.37% 4.155 7.36% 4.82%
Education and General $2,618 $2,775 6.00% $2,699 -2.73% 3.10% $2,671 -1.04% 2.03% 13,017 12.95% 15.24%
All Other (Excl Sk Ctr) $O $0 -- SO -- -- $0 ERR ERR $0 -- --
Total (Excl Sk Ctr) $2.618 $2,775 6.00% $2,699 -2.73% 3.10% $2,671 -1.04% 2.03% $3,017 12.95% 15.24%
-SSR AND STATEWIDE
SBR Administration SO SO SO $0 SO
Other Statewide SO $O $O $0 $0
Total $0 $0 $O 10 $0
TOTAL USHE
Annualized FTE* 47,330 47,176 -0.33% 45,690 -3.15% -3.47% 47,849 4.73% 1.10% 51,174 6.95% 8.12%
Educ & Gen + Other Inst $56,554 $58,348 3.17% 155,513 -4.86% -1.84% $54,768 -1.34% -3.16% $57,749 5.44% 2.11%
All Other Line Items $1,993 12,221 11.45% 12,137 -3.80% 7.22% $2,165 1.31% 8.631 $2,264 4.55% 13.574
Total $58,547 $60,570 3.45% 657,650 -4.82% -1.53% $56,933 -1.24% -2.76% 660,013 5.41% 2.50%
Excluding Medical **Including Cont Ed Centers ***Including Coop Nursing ****Including San Juan Center Budget-Related FTE beginning 1991-92
38
9 3 1
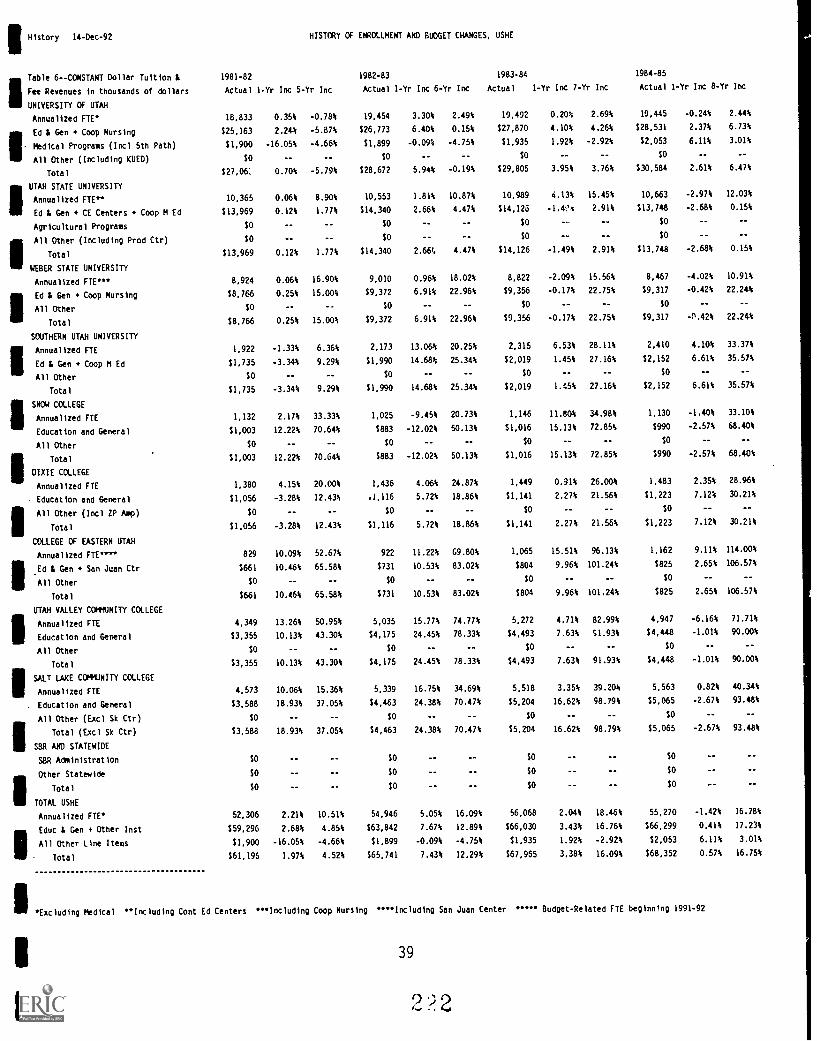
II/History 14-Dec-92 HISTORY Of ENROLLMENT AND BUDGET CHANGES, USHE
Table 6--CORSTANT Dollar Tuition &
III
Fee Revenues In thousands of dollars
UNIVERSITY Of UTAH
Annualized FTE*
illEd & Gen + Coop Nursing
Medical Programs (Incl 5th Path)
All Other (Including KUED)
Total
UTAH STATE UNIVERSITY
Annualized FTE**
Ed & Gen CE Centers + Coop M Ed
Agricultural Programs
All Other (Including Prod Ctr)
Total
WEBER STATE UNIVERSITY
Annualized FEE***
Ed & Gen + Coop Nursing
All Other
Total
SOUTHERN UTAH UNIVERSITY
Annualized FTE
Ed A Gen + Coop M Ed
All Other
Total
SNOW COLLEGE
Annualized FTE
Education and General
All Other
Total
DIXIE COLLEGE
Annualized FTC
Education and General
All Other (Incl ZP Amp)
Total
COLLEGE OF EASTERN UTAH
Annualized FTE**-**
.Ed & Gen + San Juan Ctr
All Other
Total
UTAH VALLEY COMMUNITY COLLEGE
Annualized FTE
Education and General
All Other
Total
SALT LAKE COMMUNITY COLLEGE
Annualized FTE
Education and General
All Other (Excl Sk Ctr)
Total (Excl Sk Ctr)
S8R AHD STATEWIDE
S8R Administration
Other Statewide
Total
TOTAL USHE
Annualized FTE*
Educ & Gen + Other Inst
All Other line Items
Total
1981-82
Actual 1-Yr Inc 5-Yr Inc
1982-83
Actual 1-Yr IDC 6-Yr Inc
1983-84
Actual 1-Yr Inc 7-Yr Inc
1984-85
Actual 1-Yr Inc 8-Yr Inc
18,833 0.35% -0.78% 19,454 3.30% 2.49% 19,492 0.20% 2.69% 19,445 -0.24% 2.44%
$25,163 2.248 -5.87% $26,773 6.40% 0.15% $27,870 4.10% 4.26% $28,531 2.37% 6.73%
$1,900 -16.05% -4.66% $1,899 -0.09% -4.75% $1,935 1.92% -2.92% $2,053 6.11% 3.01%
$O -- -- $0 -- -- SO -- -- $O -- --
$27,06: 0.70% -5.79% $28,672 5.94% -0.19% $29,805 3.95% 3.76% $30,584 2.61% 6.47%
10,365 0.06% 8.90% 10,553 1.81% 10.87% 10,989 4.13% 15.45% 10,663 -2.974 12.03%
$13,969 0.12% 1.77% $14,340 2.66% 4.47% $14,126 -1.4'4 2.91% $13,748 -2.68% 0.15%
$0 -- -- $0 -- -- $0 -- -- $0 -- --
$O $O -- $O -- $0
$13,969 0.12% 1.77% $14,340 2.66. 4.47% $14,126 -1.49% 2.91% $13,748 -2.68% 0.15%
8,924 0.06% 16.90% 9,010 0.96% 18.02% 8,822 -2.09% 15.56% 8,467 -4.02% 10.91%
$8,766 0.25% 15.00% $9,372 6.91% 22.96% $9,356 -0.17% 22.75% $9,317 -0.42% 22.248
$O -- -- $O -- -- $O -- -- $O -- --
$8,766 0.25% 15.00% $9,372 6.91% 22.96% $9,356 -0.17% 22.75% $9,317 -S.42% 22.248
1,922 -1.33% 6.36% 2,173 13.068 20.25% 2,315 6.53% 28.11% 2,410 4.10% 33.37%
$1,735 -3.344 9.29% $1,990 14.68% 25.34% $2,019 1.45% 27.16% $2,152 6.61% 35.57%
$O -- -- $0 -- -- $O -- -- $0 -- --
$1,735 -3.34% 9.29% $1,990 14.68% 25.344 $2,019 1.45% 27.16% $2,152 6.61% 35.57%
1,132 2.17% 33.33% 1,025 -9.45% 20.73% 1,146 11.80% 34.98% 1.130 -1.40% 33.10%
$1,003 12.22% 70.64% $883 -12.02% 50.13% $1,016 15.13% 72.85k $990 -2.57% 68.404
$0 -- -- $0 -- -- $0 -- -- $0 -- --
$1,003 12.22% 70.64% $883 -12.02% 50.13% $1,016 15.13% 72.85% 5990 -2.57% 68.40%
1,380 4.15% 20.00% 1,436 4.06% 24.87% 1,449 0.91% 26.008 1,483 2.35% 28.96%
$1,056 -3.28% 12.43% .1,116 5.724 18.86% $1,141 2.27% 21.56% $1,223 7.12% 30.21%
$0 -- -- $0 -- -- $0 -- -- $0 -- --
51,056 -3.28% 12.43% $1,116 5.72% 18.86% $1,141 2.27% 21.56% $1,223 7.12% 30.21%
829 10.09% 52.67% 922 11.22% 69.80% 1,065 15.51% 96.13% 1,162 9.11% 114.00%
$661 10.46% 65.58% $731 10.53% 83.02% $804 9.96% 101.24% $825 2.65% 106.57%
$O -- -- $0 -- -- $O -- -- $0 -- --
$661 10.46% 65.58% $731 10.53% 83.02% 5804 9.96% 101.24% $825 2.65% 106.57%
4,349 13.26% 50.95% 5,035 15.77% 74.77% 5,272 4.71% 82.99% 4,947 -6.16% 71.71%
$3,355 10.13% 43.30% $4,175 24.45% 78.33% $4,493 7.63% S1.93% $4,448 -1.01% 90.00%
$0 -- -- $O -- -- $0 -- -- $0 -- --
$3,355 10.13% 43.30% $4,175 24.45% 78.33% $4,493 7.63% 91.93% $4.448 -1.01% 90.00%
4,573 10.06% 15.36% 5,339 16.75% 34.69% 5,518 3.35% 39.20% 5,563 0.82% 40.34%
$3,588 18.93% 37.05% $4,463 24.38% 70.47% $5,204 16.62% 98.79% $5,065 -2.67% 93.48%
$0 -- -- $O -- -- $0 -- -- $0 -- --
$3,588 18.93% 37.05% $4,463 24.38% 70.47% $5,204 16.62% 98.79% $5,065 -2.67% 93.48%
$O $O $0 $O
$O $0 $0 $0
$0 $0 $0 $0
52.306 2.21% 10.51% 54,946 5.05% 16.09% 56,068 2.04% 18.46% 55,270 -1.42% 16.78%
$59,296 2.68% 4.85% $63,842 7.67% 12.89% $66,030 3.43% 16.76% $66,299 0.41% 17.23%
$1,900 -16.05% -4.66% $1,899 -0.09% -4.75% $1,935 1.92% -2.92% $2.053 6.11% 3.01%
$61,196 1.97% 4.52% $65,741 7.43% 12.29% $67,955 3.38% 16.09% $68,352 0.57% 1635%
*Excluding Medical **Including Cont Ed Centers ***Including Coop Nursing ****Including San Juan Center ***** Budget-Related FTE beginning 1991-92
39

History 14-Dec-92
Table 6--CONSTANT Dollar Tuition &
Fee Revenues in thov Inds of dollars
UNIVERSITY OF UTAH
HISTORY OF ENROLLMENT AND BUDGET CHANGES, USHE
1985-86 1986-87 1987-88
Actual 1-Yr Inc 9-Yr Inc Actual I-Yr Inc 10-Yr Inc Actual 1-Yr Inc 11-Yr Inc
1988-89
Actual 1-Yr Inc 12-Yr Inc
Annualized FIE* 19,153 -1.50% 0.90% 18,892 -1.364 -0.47% 18,896 0.02% -0.45% 18,622 -1.454 -1.90%
Ed & Gen + Coop Nursing $29,347 2.864 9.78% $31,793 8.33% 18.93% $31,022 -2.42% 16.05% $31,495 1.52% 17.82%
Nedical Programs (Incl 5th Path) $2,790 35.89% 39.98% $2,490 -10.744 24.95% $2,354 -5.474 18.11% $2,494 5.934 25.11%
All Other (Including KUED) $0 -- -- $0 -- -- $0 -- $0 --
Total $32,137 5.08% 11.87% $34,283 6.68% 19.35% 133,377 -2.64% 16.19% $33,989 1.83% 18.32%
UTAH STATE UNIVERSITY
Annualized FTE" 10,306 -3.35% 8.28% 10,353 0.46% 8.77% 10,397 0.42% 9.244 10,631 2.25% 11.69%
Ed & Gen CE Centers + Coop M Ed $13,614 -0.97% -0.82% $14,620 7.39% 6.51% $14,097 -3.58% 2.70% $14,873 5.51% 8.35%
Agricultural Programs $O -- SO -- -- $0 -- $0 --
All Other (Including Prod Ctr) SO -- -- $0 -- $0 -- $0 ..
Total $13,614 -0.97% -0.82% 514,620 7.39% 6.51% $14,097 -3.58% 2.70% $14,873 5.51% 8.35%
WEBER STATE UNIVERSITY
Annualized FTE*** 8,579 1.32% 12.38% 9,027 5.22% 18.25% 9,279 2.79% 21.55% 9.475 2.114 24.12%
Ed & Gen + Coop Nursing $9,716 4.28% 27.47% $10,927 12.46% 43.36% $11,214 2.63% 47.13% $12,190 8.71% 59.944
All Other $0 -- -- $0 -- -- $O -- $O --
Total $9,716 4.28% 27.47% $10,927 12.46% 43.36% $11,214 2.63% 47.13% 512,190 8.71% 59.94%
SOUTHERN UTAH UNIVERSITY
Annualized FTE 2,361 -2.03% 30.66% 2,685 13.72% 48.59% 2,779 3.50% 53.79% 2,894 4.14% 60.15%
Ed & Gen + Coop II Ed $2,168 0.71% 36.53% $2,589 19.41% 63.04% $2,594 0.22% 63.40% $2,779 7.11% 75.02%
All Other $0 -- -- SO -- -- $0 -- $0 --
Total 52,168 0.71% 36.53% $2,589 19.41% 63.04% $2,594 0.22% 63.404 $2,779 7.11% 75.02%
SNOW COLLEGE
Annualized FTE 1.142 1.06% 34.51% 1,265 10.77% 49.00% 1,244 -1.66% 46.53% 1,375 10.53% 61.96%
Education and General $1,030 4.09% 75.29% $1,215 17.87% 106.61% $1,265 4.19% 115.27% $1,324 4.66% 125.31%
All Other $0 -- -- SO -- -- $O -- $0 --
Total 11,030 4.09% 75.29% $1,215 17.87% 106.61% 51,265 4.19% 115.27% $1,324 4.66% 125.31%
DIXIE COLLEGE
Annualized FTE 1,646 10.99% 43.13% 1,843 11.97% 60.264 1,812 -1.68% 57.57% 1,802 -0.55% 56.70%
Education and General $1,440 17.79% 53.38% $1,644 14.17% 75.11% $1,876 14.12% 99.84% $1,857 -1.02% 97.79%
All Other (Incl ZP Amp) $0 -- -- $0 -- -- $0 -- $O --
Total 11,440 17.79% 53.38% 51,644 14.17% 75.11% 11,876 14.12% 99.84% $1,857 -1.02% 97.79%
COLLEGE OF EASTERN UTAH
Annualized FTE"" 1,141 -1.81% 110.13% 1,309 14.72% 141.07% 1,281 -2.144 135.91% 1,354 5.704 149.364
Ed & Gen + San Juan Ctr $902 9.33% 125.84% $1,051 16.51% 163.134 $968 -7.874 142.42% $1,013 4.59% 153.55%
All Other $0 -- -- $0 -- -- SO SO --
Total 5902 9.33% 125.84% 11,051 16.51% 163.13% 5968 -7.87% 142.42% 51,013 4.59% 153.55%
UTAH VALLEY COMMUNITY COLLEGE
Annualized FTE 4,899 -0.97% 70.05% 5,206 6.27% 80.70% 5,302 1.80 84.03% 5,329 0.51% 84.97%
Education and General $4,841 8.83% 106.77% $5,737 18.53% 145.08% $5,804 1.17% 147.95% $6,051 4.25% 158.47%
AI1 Other $0 -- -- $0 -- -- $O -- $O --
Total $4,841 8.83% 106.77% 15,737 18.53% 145.08% $5,804 1.17% 147.95% $6,051 4.25% 158.47%
SALT LAKE COMMUNITY COLLEGE
Annualized FTE 5,720 2.82% 44.30% 5,845 2.19% 47.45% 6,073 3.90% 63.20% 6,530 7.63% 64.73%
Education and General $5,816 14.82% 122.15% $6,623 13.89% 153.01% $6,551 -1.094 150.24% $7.355 12.27% 180.94%
All Other (Excl Sk Ctr) $0 -- -- $O -- -- $0 -- $O
Total (Excl Sk Ctr) $5,816 14.82% 122.15% $6,623 13.89% 153.01% $6,551 -1.09% 150.24% $7,355 12.27% 180.94%
S8R AND STATEWIDE
93.1 Administration SO $O $O $O
Other Statewide $O SO $0 $0
Total SO $O $0 $O
TOTAL USHE
Annualized FTE* 54.947 -0.58% 16.09% 56,425 2.69% 19.22% 57.063 1.13% 20.56% 58,012 1.66% 22.57%
Educ & Gen + Other Inst $68,873 3.88% 21.78% $76,199 10.64% 34.74% $75 193 -1.06% 33.314 $78,938 4.70% 39.58%
All Other Line Items $2,790 35.89% 39.98% $2,490 -10.74% 24.95% !:,3b4 -5.47% 18.11% $2,494 5.93% 25.11%
Total $71,663 4.84% 22.40% 578,690 9.80% 34.40% $77,747 -1.20% 32.79% 581,431 4.74% 39.09%
*Excluding Medical **Including Cont Ed Centers ***Including Coop Nursing ****Including San Juan Center
40 0 3
Budget-Related FTE beginning 1991-92
1
1
1

IIIHistory 15-Dec-92 HISTORY OF EKROLLMENT AND BUDGET CHANGES, USHE
1989-90
Actual 1-Yr Inc I3-Yr Inc
1990-91 1991-92 *****
Actual 1-Yr Inc I4-Yr Inc Actual 1-Yr Inc 15-Yr Inc
.
18,996 2.01% 0.07% 19,769 4.07% 4.15% 21,156 7.02% 11.45%
$33,327 5.82% 24.67% $35,012 5.06% 30.97% $38.096 8.81% 42.51%
$2,659 6.63% 33.41% $2,745 3.22% 37.71% $2,876 4.77% 44.28%
$0 -- -- $0 -- -- $0 -- --
535,986 5.88% 25.28% $37,757 4.92% 31.44% 140,972 8.52% 42.63%
11,205 5.40% 17.72% 12,226 9.11% 28.45% 13,063 6.85% 37.25%
$16,278 9.444 18.58% $18,055 10.92% 31.534 $17,532 -2.90% 27.72%
$0 -- -- $0 -- -- $0 -- --
SO -- -- $0 -- -- $0 -- --
$16,278 9.44A 18.58% $18,055 10.92% 31.53% $17,532 -2.90% 27.72%
10,034 5.90% 31.444 10,362 3.27% 35.73% 10,936 5.548 43.25%
3,205 8.32% 73.24% $13,198 -0.05% 73.15% $15,228 15.38% 99.78%
TO -- -- $0 -- -- $0 -- --
$13,205 8.32% 73.244 513,198 -0.05% 73.15% 515,228 15.38% 99.78%
3,044 5.18% 68.46% 3,440 13.01% 90.37% 3,698 7.50% 104.65%
$3,259 17.27% 105.25% $3,601 10.52% 126.83% $3,994 10.90% 151.56%
$0 -- -- $0 -- -- $0 -- --
53,259 17.27% 105.254 $3,601 10.52% 126.83% 53,994 10.90% 151.56%
1,616 17.534 90.344 1,768 9.41% 108.24% 1,990 12.564 134.39%
$1,744 31.69% 196.71% $1,808 3.65% 207.53% $2,114 16.94% 259.62%
$0 -- -- $0 -- -- $0 -- --
51,744 31.69% 196.71% 51,808 3.65% 207.53% $2,114 16.94% 259.62%
1,992 10.54% 73.22% 2,156 8.23% 87.48% 2,297 6.544 99.74%
$2,054 10.60% 118.76% $2.071 0.81% 120.53% $2,172 4.89% 131.32%
$O -- -- $0 -- -- $0 -- --
52,054 10.60% 118.76% 52,071 0.81% 120.53% $2,172 4.89% 131.32%
1,420 4.87% 161.51% 1,684 18.59% 210.13% 1,693 0.53% 211.79%
$1,127 11.30% 182.21% $1,268 12.454 217.35% $1,389 9.58% 247.76%
$0 -- -- $0 -- -- $0 -- --
$1,127 11.30% 162.21% 51,268 12.45% 217.35% $1,389 9.58% 247.764
5,854 9.85% 103.19% 5,787 -1.14% 100.87% 6,732 16.33% 133.67%
$7,061 16.694 201.60% $7,418 5.064 216.88% $8,764 18.14% 274.37%
$0 -- -- $0 -- -- $0 -- --
57,061 16.651 201.60% 17,418 5.06% 216.88% 58,764 18.144 274.37%
7,584 16.14% 91.32% 8,596 13.344 116.85% 10,243 19.16% 158.40%
$8,908 21.11% 240.25% $10,231 14.86% 290.82% $13,306 30.05% 408.27%
$0 -- -- $O -- -- $0 -- --
$8,908 21.11% 240.25% $10,231 14.86% 290.82% $13,306 30.05% 408.27%
$0 $0 $0
SO $0 $0
$0 $0 $0
61,745 6.43% 30.46% 65,788 6.55% 39.00% 71,808 9.15% 51.72%
$86,962 10.17% 53.77% 592,662 6.55% 63.85% 5102,595 10.72% 81.41%
$2,659 6.63% 33.41% $2,745 3.22% 37.71% $2,876 4.77% 44.28%
$89,621 10.06% 53.07% 595,406 6.46% 62.96% 5105,471 10.55% 80.15%
111
Table 6--CONSTANT Dollar Tuition &
Fee Revenues in thousands of dollars
UNIVERSITY OF UTAH
Annualized FTE*
IIIEd & Gen + Coop Nursing
Medical Programs (Incl 5th Path)
All Other (Including KUED)
Total
IIIUTAH STATE UNIVERSITY
Annualized FTE**
Ed & Gen + CE Centers + Coop M Ed
Agricultural Programs
All Other (Including Prod Ctr)
III Total
II/ WEBER STATE UNIVERSITY
Annualized FIE***
III
$1 Ed & Gen + Coop Nursing
OtAll her
Total
SOUTHERN UTAH UNIVERSITY
IIIAnnualized FTE
Ed & Gen + Coop M Ed
All Other
Total
SNOW COLLEGE
Annualized FTE
Education and General
All Other
IIITotal
DIXIE COLLEGE
Annualized FTE
Education and General
III
All Other (Incl ZP Amp)
Total
COLLEGE OF EASTERN UTAH
Annualized FTE****
IIIEd & Gen + San Juan Ctr
All Other
Total
UTAH VALLEY COMMUNITY COLLEGE
IIIAnnualized FTE
Education and General
All Other
Total
111
SALT LAKE COMMUNITY COLLEGE
Annualized FTE
Education and General
All Other (Exc) Sk Ctr)
IIITotal (Excl Sk Ctr)
SBR AND STATEWIDE
SBR Administration
Other Statewide
III
Total
TOTAL USHE
Annualized FTE*
Educ Ge& n + Other Inst
III
neAll Other Li Items
Total
*Excluding Medical **Including Cont Ed Centers ***Including Coop Nursing ****Including San Juan Center Budget-Related FTE beginning 1991-92
41
224

History 14-Dec-92 HISTORY OF ENROLLMENT AND BIAGET CHANGES, USHE
TABLE 7--CURRENT DOLLAR EXPEWITURES,
TAX FUNDS, & TUITION/FEES PER FTE
.UNIVERSIT7 Of UTAH--E&G + Coop Nurs
1976-77
Actual
1977-78
Actual 1-Yr Inc
1978-79
Actual 1-Yr Inc 2-Yr Inc
1979-80
Actual 1-Yr Inc 3-Yr Inc
1980-81
Actual 1-Yr Inc 4-Yr Inc
Annualized FTE* 18,982 18,699 -1.49% 17,975 -3.874 -5.31% 18,430 2.53% -2.91% 18,768 1.834 -1.13%
Current $ Expenditures/FTE $2,917 $3,249 11.39% 53,7I5 14.35% 27.38% $3,880 4.43* 33.02% $4,134 6.54% 41.72%
Current $ Tax Fund Approp/FTE $2,109 $2,431 15.25% $2,813 15.69% 33.3316 $2,848 1.25% 35.00% $3,107 9.11% 47.31%
Current $ Tuition & Fees/FTE $594 $637 7.21% $665 4.38% 11.91% $709 6.69% 19.39% $820 15.65% 38.07%
UTAH STATE UNIVERSITY--E&G + Ctrs + M Ed
Annualized FTE** 9,518 9,729 2.22% 9.156 -5.89% -3.80% 9,562 4.43% 0.46% 10,359 8.34% 8.84%
Current $ Expenditures/FTE $2,679 $2,914 8.774 $3,410 17.03% 27.30% $3,553 4.19% 32.63% $3,612 1.66% 34.834
Current $ Tax Fund Approp/FTE $1,908 $2,099 9.97% $2,500 19.13% 31.00* $2,543 1.74% 33.28* $2,620 2.99% 37.27%
Current $ Tuition & Fees/FTE $608 $681 12.01% $761 11.67% 25.08% $781 2.66% 28.41% $842 7.85% 38.49%
WEBER STATE UNIVERSITY--E & G + Coop N
Annualized FTE*** 7,634 7,449 -2.42% 7,480 0.42% -2.02% 8,116 8.50* 6.31% 8,919 9.89% 16.83%
Current $ Expenditures/FTE $2,121 $2,446 15.34% $2,697 10.25% 27.17% $2,680 -0.62% 26.39% $2,797 4.344 31.88%
Current $ Tax Fund Approp/FTE $1,587 $1,919 20.95% $2,128 10.90% 34.13% $2,023 -4.95% 27.49% $2,113 4.42% 33.13%
Current $ Tuition & Fees/FTE $421 $478 13.61% $510 6.67% 21.18% $575 12.73% 36.62% $613 6.57% 45.59%
SOUTHERN UTAH UNIVERSITY--Ed i Gen
Annualized FTE 1,807 1,750 -3.15% 1,719 -1.77% -4.87% 1,853 7.80% 2.55% 1,948 5.13% 7.80%
Current S Expenditures/FTE $2,480 $2,898 16.85% $3,224 11.24% 29.98% $3,294 2.174 32.81% $3,503 6.34% 41.22%
Current $ Tax Fund Approp/FTE $2,052 $2,364 15.23% $2,715 14.8596 32.334 $2,666 -1.82% 29.92% $2,854 7.07% 39.10%
Current $ Tuition & Fees/FTE $371 $452 21.90% $484 7.19% 30.664 $526 8.61% 41.91% $576 9.60% 55.53%
SNOW COLLEGE--Ed & Gen
Annualized FTE 849 915 7.77% 897 -1.97% 5.65% 1,002 11.71% 18.02% 1,108 10.58% 30.51%
Current $ Expenditures/FTE $2,455 $2,650 7.95% $3,165 19.42% 28.91% $3.242 2.45% 32.07% $3,302 1.85% 34.51%
Current $ Tax Fund Approp/FTE $2,093 $2,302 9.98% $2,814 22.27% 34.47% $2,689 -4.44% 28.50% $2,740 1.89% 30.93%
Current $ Tuition & Fees/FTE $292 $329 12.6914 $375 13.90% 28.354 $426 13.70% 45.944 5505 18.39% 72.77%
DIXIE COLLEGE--Ed & Gen
Annualized FTE 1,150 1,148 -0.17% 1,092 -4.88% -5.048 1,141 4.49% -0.78% 1,325 16.13% 15.22%
Current $ Expenditures/FTE $2,094 $2,349 12.19% $2,755 17.29% 31.59% $2,901 5.27% 38.52% $2,887 -0.47% 37.87%
Current $ Tax Fund Approp/FTE $1,634 $1,847 13.02% $2,286 23.81% 39.93% $2,351 2.80 43.90% $2,336 -0.64% 42.98%
Current $ Tuition 4 Fees/FTE $344 $403 16.99% $456 13.144 32.36% $492 7.85* 42.76% $515 4.79% 49.60%
COLLEGE Of EASTERN UTAH--E&G + SJO
Annualized FTE"** 543 649 19.52% 660 1.69% 21.55% 625 -5.30% 15.10% 753 20.48% 38.67%
Current $ Expenditures/FTE $2,998 $2,965 -1.10% $3,416 15.21% 13.94% $4,091 19.76% 36.45% $3,810 -6.86% 27.094
Current $ Tax Fund Approp/FTE $2,659 $2,511 -5.58% $2,876 14.534 8.13% $3,363 16.96% 26.47% $3,213 -4.46% 20.84%
Current $ Tuition & Fees/FTE $310 $358 15.25% $337 -5.79% 8.57% $502 48.96* 61.73% $497 -0.89% 60.28%
UTAH VALLEY COMMUNITY COtLEGE
Annualized FTE 2,881 2,863 -0.62% 2,897 1.19% 0.56% 3,250 12.19% 12.81% 3,840 18.15% 33.29%
Current $ Expenditures/FTE $1,702 $2,024 18.96% $2,440 20.53% 43.38% 52,296 -5.89% 34.95% $2,254 -1.83% 32.48%
Current $ Tax Fund Approp/FTE $1,202 $1,551 29.03% $1,825 17.63% 51.784 $1,673 -8.324 39.14% $1,616 -3.384 34.44%
Current $ Tuition & Fees/FTE $343 $392 14.51% $446 13.57% 30.06% $453 1.74% 32.33% $496 9.39% 44.75%
SALT LAKE COMMUNITY COLLEGE
Annualized FTE 3,964 3,974 0.25% 3,814 -4.03% -3.78% 3,870 1.47% -2.37% 4,155 7.36% 4.82%
Current $ Expenditures/FTE $1,638 $1,818 11.00% $2,135 17.46% 30.38% $2,201 3.09% 34.41% $2.303 4.66% 40.66%
Current $ Tax Fund Approp/FTE $1,165 $1,364 17.04% 51.607. 17.86% 37.94% $1,650 2.69% 41.65% $1,720 4.19% 47.59%
Current $ Tuition 4 Fees/FTE $279 $314 12.81% $347 10.49% 24.65% $384 10.49% 37.72% $454 18.37% 63.02%
TOTAL USHE--Ed & Gen t Related Inst
Annualized FTE* 47,330 47,178 -0.32% 45,690 -3.15% -3.47% 47,849 4.73% 1.10% 51,174 6.95% 8.12%
Current $ Expenditures/FTE $2,515 $2,808 11.63% $3,218 14.61% 27.94% $3.311 2.89% 31.64% $3,426 3.4.8% 36.22%
Current $ Tax Fund Approp/FTE $1,843 $2,120 15.06% $2,459 16.00% 33.48% 52,455 -0.18% 33.244 $2,575 4.88% 39.74%
Current $ Tuition & Fees/FTE $504 $557 10.44% $596 7.104 18.28% $636 6.73% 26.24% $706 10.93% 40.04%
*Excluding Medical **Including Cont Ed Centers ***Including Coop Nursing ****lncludIng San Juan Center ***** Budget-Related FTE beginning 1991-92
42
1

History 14-Dec-92 HISTORY OF ENROLLMENT AND BUDGET CHANGES, USHE
TABLE 7 --CURRENT DOLLAR EXPENDITURES,
TAX FUNDS, 4 TUITION/FEES PER FTE
UNIVERS/TY OF UTAN--E&G 4. Coop Nurs
1981-82
Actual 1-Yr Inc 5-Yr Inc
1982-83
Actual 1-Yr Inc 6-Yr Inc
1983-84
Actual 1-Yr Inc 7-Yr Inc
1984-85
Actual 1-Yr Inc 8-Yr Inc
Annualized FIE 18,833 0.35% -0.78% 19,454 3.30% 2.49% 19,492 0.20% 2.69% 19,445 -0.24% 2.44%
Current S Expenditures/FTE $4,630 12.004 58.72% $5,074 9.60% 73.97% $5,202 2.51% 78.33% $5,700 938% 95.43%
Current $ Tax Fund Approp/FTE $3,472 11.73% 64.59% $3,691 6.31% 74.97% $3,821 3.52% 81.14% $4,454 16.55% 111.13%
Current $ Tuition & Fees/FTE $910 10.98% 53.23% $973 6.95% 63.88% $1,050 7.83% 76.71% $1,120 6.67% 88.50%
UTAH STATE UNIVERSITY--E&G + Ctrs + M
Annualized FTE" 10,365 0.06% 8.90% 10,553 1.81% 10.87% 10.989 4.134 15.45% 10,663 -2.97% 12.03%
Current $ Expenditures/FTE $4,043 11.93% 50.92% 54,368 8.04% 63.06% $4,306 -1.41% 60.75% $4,932 14.54% 64.13%
Current $ Tax Fund Approp/FTE $2,910 11.08% 52.48% $3,167 8.84% 65.964 $3,156 -0.29% 65.47% $3,862 22.29% 102.354
Current S Tuition & Fees/FTE $918 8.99% 50.93% $961 4.69% 58.01% $944 -1.81% 55.15% $984 4.25% 61.754
WEBER STATE UNIVERSITY--E & G + Coop N
Annualized FIE*** 8,924 0.06% 16.90% 9,010 0.96% 18.02% 8,822 -2.09% 15.56% 8,467 -4.02% 10.91%
Current $ Expenditures/FTE $3,068 9.69% 44.66% $3,450 12.45% 62.67% $3,564 3.32% 68.07% $4,084 14.59% 92.59%
Current $ Tax Fund Approp/FTE $2,331 10.35% 46.91% $2,553 9.53% 60.90% $2,737 7.18% 72.46% $3,306 20.794 108.32%
Current $ Tuition & Fees/FTE $669 9.14% 58.)0% $736 9.95% 74.70% $778 5.82% 84.88% $840 7.86% 99.404
SOUTHERN UTAH UN1VERSITY--Ed & Gen
Annualized FTE 1,922 -1.33% 6.36% 2,173 13.06% 20.25% 2,315 6.53% 28.11% 2,410 4.10% 33.37%
Current $ Expenditures/FTE $3,960 13.05% 59.65% $3,940 -0.49% 58.86% 53,831 -2.76% 54.47% 14,144 8.16% 67.08%
Current $ Tax Fund Approp/F'E $3,242 13.60% 58.02% 53,195 -1.46% 55.72% $3,119 -2.38% 52.01% $3,440 10.30% 67.67%
Current $ Tuition & Fees/FTE $615 6.70% 65.96% 5648 5.32% 74.78% 5640 -1.16% 72.76% 5681 6.45% 83.91%
SNOW COLLEGE--Ed & Gen
Annualized FTE 1,132 2.17% 33.33% 1,025 -9.45% 20.73% 1,146 11.80% 34.98% 1,130 -1.40% 33.10%
Current $ Expenditures/FTE $3.671 11.17% 49.53% $4,381 19.34% 78.45% $4,373 -0.19% 78.12% $4,827 10.39% 96.63%
Current $ Tax Fund Approp/FTE $3,023 10.31% 44.43% $3,765 24.58% 79.92% $3,627 -3.68% 73.29% $4,281 18.03% 104.54%
Current $ Tuition & Fees/FIE $604 19.648 106.70% $609 0.89% 108.54% $651 6.88% 122.89% $668 2.71% 128.92%
DIXIE COLLEGE--Ed & Gen
Annualized FTE 1,380 4.15% 20.00% 1,436 4.06% 24.87% 1,449 0.91% 26.00% 1,483 2.35% 28.96%
Current $ Expenditures/FTE $3,116 7.93% 48.80% $3,321 6.58% 58.604 $3,373 1.56% 61.08% $3,666 8.694 75.07%
Current $ lax Fund Approp/FTE $2,499 6.96% 52.94% $2.642 5.73% 61.704 $2.738 3.62% 67.55% $3,030 10.68% 85.44%
Current $ Tuition & Fees/FTE $521 1.15% 51.33% $550 5.49% 59.63% $578 5.19% 67.92% $629 8.80% 82.69%
COLLEGE OF EASTERN UTAH--E&G + SJC
Annualized FTE***" 829 10.09% 52.67% 922 11.22% 69.80% 1,065 15.51% 96.13% 1,162 9.11% 114.00%
Current $ Expenditures/FTE $3,940 3.40% 31.42% $3,959 0.49% 32.06% $3,663 -7.47% 22.20% $3.738 2.05% 24.70%
Current $ Tax Fund Approp/FTE $3,264 1.57% 22.74% $3,271 0.22% 23.01% $2,963 -9.414 11.43% $3,311 11.74% 24.51%
Current $ Tuition & Fees/FTE $543 9.29% 75.17% $561 3.19% 60.75% $554 -1.20% 78.59% $542 -2.21% 74.65%
UTAH VALLEY COMMUNITY COLLEGE
Annualized FTE 4,349 13.26% 50.95% 5,035 15.77% 74.77% 5,272 4.71% 82.99% 4,947 -6.16% 71.71%
Current $ Expenditures/FTE $2,364 4.87% 38.93% $2,260 -4.41% 32.80% $2,273 0.61% 33.60% $2,769 21.82% 62.75%
Current $ Tax Fund Approp/FTE $1,622 0.35% 34.92% $1,524 -6.07% 26.74% $1,517 -0.43% 26.19% $2,014 32.76% 67.53%
Current $ Tuition & Fees/FTE $525 5.92% 53.32% $586 11.61% 71.114 $626 6.69% 82.56% $686 9.66% 100.19%
SALT LAKE COMMUNITY COLLEGE
Annualized FTE 4,573 10.06% 15.36% 5,339 16.75% 34.69% 5,518 3.35% 39.20% 5,563 0.82% 40.34%
Current $ Expenditures/FTE 52.438 5.83% 48.86% 12,286 -6.21% 39.62% 52,457 7.48% 50.06% $2,751 11.94% 67.98%
Current $ Tax Fund Approp/FTE $1,748 1.66% 50.04% 11,636 -6.42% 40.41% 51,643 0.46% 41.05% 52,042 24.23% 75.23%
Current $ Tuition 3 Fees/FTE 5534 17.70% 91.87% 5591 10.62% 112.25% 5692 17.11% 148.56% 5695 0.36% 149.45%
TOTAL USHE--Ed & Gen + Related lnst
Annualized FTE' 52,306 2.21% 10.51% 54,946 5.05% 16.09% 56,068 2.044 18.46% 55,270 -1.42% 16.78%
Current $ Expenditures/FTE $3,771 10.05% 49.91% $4,021 6.64% 59.87% $4,073 1.29% 61.93% $4,564 12.05% 81.45%
Current $ Tax Fund Approp/FTE $2,814 9.31% 52.74% $2,953 4.92% 60.26% $3,012 2.01% 63.48% $3.592 19.26% 94.97%
Current S Tuition & Fees/FTE 1772 9.42% 53.23% $822 6.42% 63.07% $864 5.20% 71.55% $915 5.88% 81.63%
'Excluding Medical "Including Cont Ed Centers "'Including Coop Nursing ""Including San Juan Center Budget-Related FTE beginning 1991-92
43
2 2 G

History 14-Dec -92 HISTORY OF ENROLLMENT AND BUDGET CHANGES, USHE
TABLE 7--CURRENT OCCLAR EXPENDITURES, 1985-86
TAX FUNDS, & TUITION/FEES PER FTE
1986-87
Actual 1-Yr Inc 9-Yr Inc Actual 1-Yr Inc 10-Yr Inc
1987-88 1988-89
Actual 1-Yr Inc 11-Yr Inc Actual 1-Yr Inc 12-Yr Inc
UNIVERSITY OF UTAH --E&G + Coop Nurs
Annualized FTE* 19,153 -1.50% 0.90% 18,892 -1.36% -0.47% 18,896 0.02% -0.4516 18,622 -1.45% -1.90%
Current $ Expenditures/FTE $6,280 10.18% 115.32% 16,289 0.14% 115.61% 16,504 3.43% 123.00% 56,807 4.66% 133.38%
Current $ Tax Fund Approp/FTE 14,685 5.20% 122.10% 14,713 0.60% 123.43% 54,980 5.67% 136.09% $5,187 4.15% 145.89%
Current $ Tuition & Fees/FTE $1,214 8.39% 104.33% 11,348 11.04% 126.88% S1,373 1.88% 131.15% 51,477 7.57% 148.65%
UTAH STATE UNIVERSITY--E&G + Ctrs +
Annualized FTE** 10,306 -3.35% 8.28% 10.353 0.46% 8.77% 10.397 0.42% 9.24% 10,631 2.25% 11.69%
Current $ Expenditures/FIE 55,576 13.06% 108.18% 15,451 -2.25% 103.48% 15,724 5.0196 113.68% $5,851 2.23% 118.4.4%
Current $ Tax Fund Approp/FTE 54,242 9.85% 122.28% 54,288 1.09% 124.71% 14,520 5.39% 136.83% 54,471 -1.07% 134.29%
Current $ Tuition & Fees/FTE 11,046 6.35% 72.02% 11,131 8.08% 85.92% $1,134 0.27% 86.41% 11,222 7.75% 100.85%
WEBER STATE UNIVERSITY--E & G + Coop N
Annualized FTE*** 8,579 1.32% 12.38% 9,027 5.22% 18.25% 9,279 2.79% 21.55% 9,475 2.11% 24.12%
Current $ Expenditures/FIE $4,427 8.38% 108.744 14,167 -5.86% 96.51% $4.280 2.70% 101.82% 14.235 -1.06% 99.68%
Current $ Tax Fund Approp/FTE $3,398 2.80% 114.15% $3,190 -6.12% 101.04% 13,289 3.09% 107.25% $3,280 -0.26% 106.72%
Current $ Tuition & Fees/F1E $897 6.83% 113.02% $969 8.064 130.18; 51,011 4.27% 140.01% 11.123 11.16% 166.80%
SOUTHERN UTAH UNIVERSITY --Ed & Gen
Annualized FIE 2,361 -2.03% 30.66% 2,685 13.72% 48.59% 2,779 3.50% 53.79% 2,894 4.14% 60.15%
Current $ Expenditures/FTE $4,636 11.86% 86.90% 14,087 -11.85% 64.76% $4,162 1.85% 67.82% 14,168 0.12% 68.02%
Current $ Tax Fund Approp/FTE 53.726 8.32% 81.61% $3,246 -12.88% 58.22% 13,292 1.42% 60.46% $3,265 -0.82% 59.14%
Current $ Tuition & Fees/FTE $727 6.71% 96.24% $772 6.16% 108.32% 5781 1.12% 110.67% 1838 7.40% 126.26%
SNOW COLLEGE--Ed & Gen
Annualized FTE 1,142 1.06% 34.51% 1,265 10.77% 49.00% 1,244 -1.66% 46.53% 1.375 10.53% 61.96%
Current $ Expend1tures/FTE $5,346 10.74% 117.76% $4,596 -14.02% 87.22% $5,180 12.69% 110.99% $4,639 -10.44% 88.95%
Current S Tax Fund Approp/FTE $4,348 1.57% 107.75% 13,925 -9.72% 87.55% 54,183 6.58% 99.89% $3,871 -7.46% 84.97%
Current $ Tuition & Fees/FTE $715 6.91% 144.73% $769 7.58% 163.27% $851 10.65% 191.31% 5841 -1.12% 188.03%
DIXIE COLLEGE- -Ed & Gen
Annualized FTE 1,646 10.99% 43.13% 1,843 11.97% 60.26% 1,812 -1.68% 57.57% 1,802 -0.55% 56.70%
Current $ Expenditures/FTE $3,786 3.28% 80.82% 13,579 -5.47% 70.92% 13,723 4.01% 77.78% 14,144 11.32% 97.91%
Current $ Tax Fund Approp/FTE $2,914 -3.83% 78.34% $2,828 -2.95% 73.08% 13,010 6.43% 84.20% 53,139 4.30% 92.12%
Current $ Tuition & Fees/FIE $693 10.16% 101.25% 1714 3.08% 107.45% 5866 21.22% 151.48% $900 3.93% 161.35%
COLLEGE OF EASTERN UTAH--E&G + SJC
Annualized FTE**** 1,141 -1.81% 110.13% 1,309 14.72% 141.07% 1,281 -2.144 135.91% 1,354 5.70% 149.36%
Current $ Expenditures/FTE $4,640 24.11% 54.77% $3,998 -13.83% 33.37% 54,310 7.79% 43.76% 14.230 -1.86% 41.08%
Current $ Tax Fund Approp/FTE $3,499 5.68% 31.59% $3,333 -4.76% 25.32% $3,540 6.22% 33.12% $3,472 -1.93% 30.56%
Current $ Tuition & Fees/FTE 5626 15.57% 101.84% $643 2.67% 107.24% 1632 -1.68% 103.75% 1653 3.33% 110.53%
UTAH VALLEY COMMUNITY COLLEGE
Annualized FTE 4,899 -0.97% 70.054 5,206 6.27% 80.70% 5,302 1.84% 84.03% 5,329 0.51% 84.97%
Current $ Expenditures/FIE $3,144 13.51% 84.74% $3,063 -2.56% 80.01% 13,092 0.94% 81.70% $3,277 5.99% 92.58%
Current S Tax Fund Approp/FTE $2,189 8.68% 82.08% 12.058 -5.96% 71.23% 12,105 2.27% 75.12% $2,188 3.92% 81.99%
Current $ Tuition & Fees/FTE 5783 14.07% 128.36% $882 12.76% 157.51% 5915 3.74% 167.144 $991 8.30% 189.32%
SALT LAKE COMMUNITY COLLEGE
Annualized FTE 5,720 2.82% 44.30% 5,845 2.19% 47.45% 6,073 3.90% 53.204 6,530 7.53% 64.73%
Current $ Expenditures/FIE $3,115 13.23% 90.21% 13,088 -0.86% 88.58% 52,973 -3.74% 81.53% 13,256 9.52% 98.80%
Current $ Tax Fund Approp/FTE $2,136 4.64% 83.37% 12,126 -0.48% 82.49% $2,153 1.28% 84.83% $2,149 -0.20% 84.46%
Current $ Tuition & Fees/FTE $805 15.91% 189.13% $907 12.68% 225.78% 1902 -0.59% 223.87% $983 9.02% 253.09%
TOTAL USHE--Ed & Gen + Related Inst
Annualized FIE* 54.947 -0.58% 16.09% 56,425 2.69% 19.22% 57,063 1.13% 20.56% 58,012 1.664 22.57%
Current $ Expenditures/FIE $5,051 10.67% 100.81% $4,882 -3.34% 94.10% 55,027 2.97% 99.86% 15,162 2.68% 105.22%
Current $ Tax Fund Approp/FTE $3,787 5.42% 105.54% 13.698 -2.37% 100.68% $3,859 4.36% 109.43% $3,896 0.97% 111.46%
Current $ Tuition & Fees/FTE $993 8.46% 97.00% 51,081 8.92% 114.58% $1,105 2.17% 119.25% $1,188 7.54% 135.78%
*Excluding Medical **Including Cont Ed Centers "'Including Coop Nursing ****Including San Juan Center ***"** Budget-Related FTE beginning 1991-92
44
9 ) 7,
1
1
1

IIIHistory 15-Dec -92 HISTORY Of ENROLLMENT AND BUDGET CHANGES, USHE
TABLE 7-CURRENT DOLLAR EXPENDITURES.
TAX FUNDS, & TUITION/FEES PER FTE
UNIVERSITY Of UTAH --E&G + Coop Nurs
III
Annualized FTE*
Currtnt $ Expenditures/FTE
Current $ Tax Fund Approp/FTE
Current $ Tuition & Fees/FTE
111UTAH STATE UNIVERSITN-E&G + Ctrs + Fl
Annualized FTE*'
Current $ Expenditurts/FTE
Current $ Tax Fund Approp/FTE
IIICurrent $ Tuition & Fees/FTE
WEBER STATE UNIVERSITY- -E & G + Coop N
Annualized FIE***
Current $ Expenditures/FTE
IIICurrent $ Tax Fund Approp/FTE
Current S Tuition & Fees/FTE
SOUTHERN UTAH UNIVERSITY --Ed & Gen
Annualized FTE
II/Current $ Expenditures/FIE
Current $ Tax Fund Apprinp/FTE
Current $ Tuition & Fees/FTE
SNCW COLLEGE --Ed & Gen
111
Annualized FTE
Current $ Expenditures/FTE
Current $ Tax Fund Approp/FTE
Current $ Tuition & Fees/FTE
IIIDIXIE CCLLEGE-Ed & Gen
Annualized FTE
Current $ Expenditures/FIE
Current $ Tax Fund Approp/FTE
III
Current $ Tuition & Fets/FTE
COLLEGE OF EASTERN UTAH --E&G + SiC
Annualized FTE****
Current $ Expenditures/FIE
IIICurrent $ Tax Fund Approp/FIE
Current $ Tuition & Fees/FTE
UTAH VALLEY COMMUNITY COLLEGE
Annualized FTE
111
Current $ Expenditures/FTE
Current $ Tax Fund Approp/FTE
Current $ Tuition & Fees/FTE
SALT LAKE COMMUNITY COLLEGE
III
Annualized FTE
Current $ Expenditures/FTE
Current $ Tax Fund Approp/FTE
IIICurrent $ Tuition & Fees/FTE
TOTAL USHE- -Ed & Gen + Related Inst
Annualized FTE*
Current $ Expenditures/FTE
Current $ Tax Fund Approp/FTE
Current $ Tuition & Fets/FTE1
1989-90
Actual 1-Yr Inc 13-Yr Inc
1990-91
Actual 1-Yr Inc 14-Yr Inc
1991-92 *****
Actual 1-Yr Inc 15-Yr Inc
18,996 2.01% 0.07% 19,769 4.07% 4.15% 21,156 7.02% 11.454
$6,803 -0.07% 133.23% $7,120 4.66% 144.11% 67,167 0.66% 145.73%
$5.361 3.35% 154.12% $5,305 -1.03% 151.50% $5,278 -0.51% 150.22%
11,603 8.55% 169.924 61,720 7.27% 189.554 $1,801 4.71% 203.19%
11,205 5.40% 17.72% 12,226 9.11% 28.45% 13,063 6.85% 37.25%
$5,910 1.01% 120.644 $5,835 -1.28% 117.82% 65,907 1.23% 120.50%
64,587 2.56% 140.344 $4,426 -3.50% 131.94% $4,143 -6.41% 117.08%
$1,327 8.664 118.25% $1,434 8.03% 135.77% 11,342 -6.41% 120.664
10,034 5.90% 31.444 10,362 3.274 35.73% 10,936 5.54% 43.254
$4,283 1.134 101.944 $4,873 13.78% 129.76% 54,803 -1.42% 126.51%
63,207 -2.25% 102.08% $3,390 5.714 113.62% $3,363 -0.79% 111.954
51,203 7.04% 185.58% $1,237 2.84% 193.70% $1,392 12.59% 230.68%
3,044 5.18% 68.46% 3,440 13.01% 90.37% 3,698 7.50% 104.65%
$4,493 7.81% 81.144 54,469 -0.53% 80.18% 64,468 -0.02% 80.144
$3,514 7.62% 71.26% $3,371 -4.06% 64.31% $3,356 -0.45% 63.58%
$978 16.67% 163.98% $1,017 3.92% 174.33% 61,080 6.244 191.46%
1,616 17.53% 90.344 1,768 9.41% 108.24% 1,990 12.56% 134.39%
$4,418 -4.774 79.95% $4,770 7.974 94.29% 64,537 -4.87% 84.83%
$3,644 -5.87% 74.11% $3,638 -0:16% 73.83% $3,520 -3.244 68.20%
6986 17.264 237.75% $993 0.67% 240.01% 61,062 6.99% 263,79%
1,992 10.54% 73.22% 2,156 8.23% 67.48% 2,297 6.544 99.744
64,228 2.02% 101.91% $4,274 1.10% 104.13% $4,158 -2.72% 98.574
$3,141 0.074 92.264 $3,111 -0.974 90.38% $3,204 3.01% 96.10%
$942 4.70% 173.644 6933 -1.03% 170.834 1946 1.39% 174.60%
1,420 4.87% 161.51% 1,664 18.59% 210.13% 1,693 0.53% 211.79%
64,563 7.89% 52.21% 54,438 -2.74A 48.05% 54,870 9.73% 62.45%
$3,643 10.66% 44.50% $3,599 -6.36% 35.32% $3,897 8.29% 46.544
5725 11.064 133.82% $731 0.76% 135.60% 5820 12.25% 164.47%
5,854 9.854 103.19% 5,787 .1.144 100.87% 6,732 16.33% 133.674
53,438 4.91% 102.054 53,799 10.51% 123.28% 63,611 -4.95% 112.22%
52,182 -0.28% 81.48% $2,444 12.02% 103.30% 52,289 -6.36% 90.37%
$1,102 11.16% 221.60% $1,245 12.94% 263.21% 61,302 4.59% 279.89%
7,584 16.14% 91.32% 8,596 13.344 116.65% 10.243 19.15% 158.40%
$3,182 -2.26% 94.31% $3.478 9.29% 112.36% $3,624 4.21% 121.29%
$2,137 -0.574 83.42% 62,394 12.05% 105.52% 62,391 -0.144 105.244
61,073 9.13% 285.334 $1,156 7.694 314.954 61,299 12.404 366.39%
61,745 6.43% 30.46% 65,788 6.55% 39.00% 71,808 9.15% 51.72%
65,157 -0.10% 105.01% 65,395 4.63% 114.51% 55,377 -0.35% 113.77%
$3,930 0.87% 113.30% 63,947 0.42% 114.19% 63,841 -2.67% 108.47%
61,287 8.31% 155.38% $1,368 6.27% 171.40% 61,429 4.47% 183.52%
*Excluding Medical **Including Cont Ed Centers ***Including Coop Nursing ****Including San Juan Center ****" Budget-Related FTE beginning 1491-92
45

History 14-Det-92 HISTORY OF ENROLLMENT AND BUDGET CHANGES, USHE
TABLE 8-CONSTANT DOLLAR EXPENOITMES, 1976-77
TAX FUNDS, & TUITION/FEES PER FTE Actual
UNIVERSITY Of UTAH-E&G + Coop Nurs
1977-78
Actual 1-Yr Inc
1978-79
Actual 1-Yr Inc 2-Yr Inc
1979-80
Actual 1-Yr Inc 3-Yr Inc
1980-81
Actual 1-Yr Inc 4-Yr Inc
Annualized FTE 18,982 18,699 -1.49% 17,975 -3.87% -5.314 18,430 2.534 -2.91% 18,768 1.83% -1.13A
Constant $ Expenditures/FTE $6,916 $7,220 4.40% $7,573 4.89% 9.50% $6,981 -7.82% 0.94% $6,610 -5.31% -4.42%
Constant $ Tax Fund Approp/FTE $5,002 55,402 8.01% 55,733 6.12% 14.62% $5,124 -10.63% 2.44% $4,969 -3.02% -0.66%
Constant $ Tuition L Fees/FTE $1,408 $1,415 0.47% $1,355 -4.25% -3.80% $1,276 -5.83% -9.41% $1,311 2.78% -6.89%
UTAH STATE UNIVERSITY-E&G + Ctrs + M Ed
Annualized FTE" 9,518 9,729 2.22% 9,156 -5.89% -3.80% 9,562 4.43% 0.46% 10.359 8.34% 8.84%
Constant $ Expenditures/FIT 16,352 $6,475 1.94% $6,951 7.35% 9.43% $6,392 -8.04A 0.644 $5,775 -9.65% -9.07%
Constant $ Tax Fund Approp/FTE $4,525 $4,663 3.06% $5,096 9.28% 12.62% $4,576 -10.20% 1.13% $4,189 -8.46% -7.43%
Constant $ Tuition & Fees/FTE $1,442 11,514 4.98% $1,551 2.43% 7.53% $1,405 -9.39% -2.56% $1,347 -4.15% -6.61%
WEBER STATE UNIVERSITY--E & G + Coop N
Annualized FTE*" 7,634 7,449 -2.42% 7,480 0.42% -2.02% 8,116 8.50% 6.314 8,919 9.89% 16.83%
Constant $ Expenditures/FIE $5,028 $5,436 8.10% $5,497 1.13% 9.33% $4.822 -12.28% 4.10% $4,472 -7.264 -11.064
Constant $ Tax Fund Approp/FTE $3,763 $4,265 13.35% $4,339 1.73% 15.31% $3,640 -16.10% -3.26% $3,378 -7.20% -10.22%
Constant $ Tuition & Fees/FTE $998 $1,063 6.48% 11,040 -2.16% 4.18% $1,035 -0.49% 3.66% $980 -5.29% -1.82%
SOUTHERN UTAN UNIVERSITY-Ed & Gen
Annualized FTE 1,807 1,750 -3.15% 1,719 -1.77% -4.87% 1,853 7.80% 2.55% 1,948 5.13% 7.80%
Constant $ Expenditures/FTE $5,881 $6,441 9.51% $6,572 2.04% 11.74% $5,927 -9.82% 0.77% $5,601 -5.49% -4.76%
Constant $ Tax Fund Approp/FTE $4,865 $5,254 7.99% 15,535 5.35% 13.768 $4.796 -13.34A -1.424 $4,564 4.80 -6.19%
Constant S Tuition & Fees/FTE $879 $1,004 14.24% $987 -1.68% 12.33% $946 -4.144 7.68% $922 -2.59% 4.89%
SNOW COLLEGE--Ed & Gen
Annualized FTE 849 915 7.77% 897 -1.97% 5.65% 1,002 11.71% 18.024 1,108 10.58% 30.51%
Constant $ Expenditures/FTE $5,821 $5,889 1.17% $6,451 9.544 10.82% $5,834 -9.57% 0.224 $5,281 -9.484 -9.29%
Constant $ Tax Fund Approp/FTE $4,962 $5,115 3.07% $5,736 12.16% 15.60% $4,838 -15.66% -2.50% $4,381 -9.44% -11.70%
Constant $ Tuition & Fees/FTE $692 $731 5.61% $764 4.48% 10.344 $767 0.364 10.744 $807 5.22% 16.524
DIXIE COLLEGE--Ed & Gen
Annualized FTE 1,150 1,148 -0.17% 1,092 -4.88% -5.044 1,141 4.49% -0.78% 1,325 16.13% 15.22%
Constant $ Expenditures/FIE $4,965 $5,220 5.15% $5,617 7.59% 13.13% $5,219 -7.094 5.11% $4,616 -11.54% -7.02%
Constant $ Tax Fund Approp/FTE $3,874 $4,104 5.92% $4,661 13.574 20.30% $4,230 -9.234 9.19% $3,736 -11.69% -3.57%
Constant $ Tuition & Fees/FTE $816 $895 9.64% $929 3.78% 13.79% $884 -4.80% 8.33% $824 -6.86% 0.89%
COLLEGE Of EASTERN UTAH-E&G + SJC
Annualized FTE"" 543 649 19.524 660 1.69% 21.554 625 -5.30% 15.10% 753 20.48% 38.67%
Constant S Expenditures/FTE $7,108 $6,589 -7.31% $6,963 5.68% -2.05% $7,360 5.71% 3.54% $6,092 -17.22% -14.29%
Constant $ Tax Fund Approp/FTE $6,306 $5,580 -11.51% $5,862 5.05% -7.044 $6,051 3.244 -4.03% $5,138 -15.09% -18.51%
Constant $ Tuition & Ftes/FTE $736 $794 8.01% $687 -13.58% -6.66% $903 31.48% 22.72% $795 -11.92% 8.09%
UTAH VALLEY COMMUNITY COLLEGE
Annualized FIE 2,881 2,863 -0.62% 2,897 1.19% 0.564 3,250 12.19% 12.81% 3,840 18.15% 33.29%
Constant $ Expenditures/FIE $4,035 $4,498 11.49% $4,973 10.56% 23.26% $4,131 -16.93% 2.40% $3,605 -12.75% -10.66%
Constant $ Tax Fund Approp/FTE $2,851 $3,447 20.93% $3,719 7.904 30.48% $3,010 -19.08% 5.58% $2,585 -14.13% -9.33%
Constant $ Tuition L Fees/FTE $813 $872 7.32% $909 4.18% 11.814 $816 -10.19% 0.41% $793 -2.78% -2.38%
SALT LAXE COMMUNITY COLLEGE
Annualized FTE 3,964 3,974 0.25% 3,814 -4.03% -3.78% 3,870 1.47% -2.374 4,155 7.36% 4.82%
Constant $ Expenditures/FTE $3,883 $4,039 4.03% $4,352 7.74% 12.08% $3,960 -9.01% 1.99% $3,683 -6.99% -5.144
Constant $ Tax Fund Approp/FTE $2,762 $3,030 9.69% $3,276 8.11% 18.59% $2,969 -9.36% 7.49% $2,750 -7.40% -0.47%
Constant $ Tuition & Fees/FTE $660 $698 5.73% $708 1.35% 7.15% 1690 -2.47% 4.50% $726 5.20% 9.94%
TOTAL USHE--Ed & Gen + Related Inst
Annualized FTE' 47,330 47,178 -0.32% 45,690 -3.15% -3.47% 47,849 4.73% 1.10% 51,174 6.95% 8.12%
Constant $ Expenditures/FTE $5.964 $6,239 4.62% 16,560 5.13% 9.99% $5,957 -9.18% -0.11% 55,479 -8.03% -8.13%
Constant $ Tax Fund Approp/FTE $4,369 54,711 7.84% $5,013 6.40% 14.75% $4,417 -11.89% 1.10% $4,117 -6.79% -5.76%
Constant $ Tuition & Fees/FTE $1,195 $1,237 3.50% $1.215 -1.76% 1.68% $1,145 -5.79% -4.21% $1,128 -1.414 -5.56%
"Excluding Medical "Including Cont Ed Centers "'Including Coop Nursing ""Including San Juan Center Budget-Related FTE beginning 1991-92
46
p

14-Dec-92HISTCRY OF ENROLLMENT AND 8106E7 CHANGES, USHE
TABLE 8--CONSTAMT DOLLAR EXPENDITURES,
IIITAX FUNDS, & TUITION/FEES PER FTE
UNIVERSITY OF UTAH--E&G + Coop Nurs
Annualized FTE*
III
Constant $ Expenditures/FIE
Constant $ Tax Fund Approp/FTE
Constact $ Tuition & Fees/FIE
UTAH STATE UNIVERSITY--E&G + Ctrs + M
III
Annualized FTE**
Constant $ Expenditures/FTE
Constant $ Tax Fund Approp/FTE
Constant $ Tuition & Fees/FTE
IIIWEBER STATE UNIVERSITY--E & G + Coop N
Annualized FTE***
Constant $ Expenditures/FTE
Constant $ Tax Fund Approp/FTE
IIIConstant $ Tuition & Fees/FTE
SOUTHERN UTAH UNIVERSITY--Ed & Gen
Annualized FTE
Constant $ Expenditures/FTE
Constant $ Tax Fund Approp/FTE
IIIConstant $ Tuition & Fees/FTE
SNOW COLLEGE--Ed & Gen
Annualized FTE
IIIConstant $ Expenditures/FTE
Constant $ Tax Fund Approp/FTE
Constant $ Tuition & Fees/FTE
DIXIE COLLEGE--Ed & Gen
Annualized FIE
IIIConstant $ Expenditures/FTE
Constant $ Tax Fund Approp/FTE
Constant $ Tuition & Fees/FTE
IIICOLLEGE OF EASTERN UTAH--E&G + SJC
Annualized FTE^'**
Constant $ Expenditures/FTE
Constant $ Tax Fund Approp/FTE
IIIConstant $ Tuition & Fees/FTE
UTAH VALLEY COMMUNITY COLLEGE
Annualized FTE
Constant $ Expenditures/FIE
Co
III
nstant $ Tax Fund Approp/FTE
Constant $ Tuition & Fees/FTE
SALT LAKE COMMUNITY COLLEGE
III
Annualized FTE
nstant $ Expenditures/FTE
Constant $ Tax Fund Approp/FTE
Co
Constant $ Tuition & Fees/FTE
IIITOTAL USHE--Ed & Gen + Related Inst
Annualized FTE*
Constant $ Expendftures/FTE
Constant $ Tax Fund Approp/FTE
111
Constant $ Tuition & Fees/FTE
1981-82
Actual 1-Yr Inc 5-Yr Inc
1982-83
Actual 1-Yr Inc 6-Yr Inc
1983-84
Actual 1-Yr Inc 7-Yr Inc
1984-85
Actual 1-Yr Inc 8-Yr Inc
18,833 0.35% -0.78% 19,454 3.30% 2.49% 19,492 0.20% 2.69% 19,445 -0.24A 2.44%
$6,797 2.82% -1.73% 57,175 5.56% 3.744 $7,086 -1.23% 2.46% $7,470 5.42% 8.01%
$5,097 2.584 1.914 $5,219 2.39% 4.34% $5,205 -0.26% 4.07% $5,837 12.13% 16.69%
$1,336 1.89% -5.13% $1,376 3.00% -2.28% $1,430 3.894 1.53% $1.467 2.62% 4.19%
10,365 0.0606 8.90% 10,553 1.81% 10.87% 10,989 4,13% 15.45% 10,663 -2.97% 12.03%
$5,935 2.76% -6.56% $6,176 4.06% -2.77% $5,866 -5.01% -7.64% $6.464 10.19% 1.77%
$4,272 1.98% -5.59% $4,478 4.83% -1.04% $4,302 -3.93% -4.934 $5,061 17.64% 11.844
51.34.8 0.06% -6.55% 11,359 0.63% -538% $1,286 -5.40% -10.86% $1,289 0.29% -10.604
8,924 0.06% 16.90% 9,010 0.96% 18.02% 8,822 -2.09% 15.56% 8,467 -4.02% 10.91%
$4,504 0.71% -I0.43A $4,878 8.30% -3.00% $4,856 -0.46A -3.44% $5.353 10.24* 6.45%
$3,422 1.31% -9.044 $3,610 5.49% -4.054 $3,728 3.27% -0.92% $4,332 16.20% 15.14%
$982 0.208 -1.62% $1,040 5.89% 4.18% $1,061 1.964 6.22% $1,100 3.764 10.21%
1,922 -1.33% 6.36% 2.173 13.06% 20.25% 2,315 6.53% 28.114 2,410 4.10% 33.37%
$5,813 3.79% -1.15% $5,571 -4.16% -5.274 $5,220 -6.31% -11.25% $5,431 4.05% -7.65%
$4,7 60 4.29% -2.164 $4,517 -5.09% -7.14% 54,249 -5.94A -12.66% 54,608 6.11% -7.33k
$903 -2.048 2.75% 5916 1.43% 4.23% $872 -4.77% -0.744 $293 2.41% 1.65%
1,132 2.174 33.33% 1,025 -9.45% 20.73% 1,146 11.80% 34.98% 1,130 -1.40% 33.10%
$5,389 2.06% -7.42% $6,194 14.94% 6.41% $5,957 -3.83% 2.33% $6,326 6.20% 8.68%
$4,437 1.28% -10.58% $5,324 19.98% 7.29% $4,941 -7.204 -0.44% $5,610 13.55% 13.05%
$886 9.84% 27.98% $861 -2.83% 24.36% $887 2.97% 28.05% $876 -1.204 26.52%
1,330 4.15% 20.00% 1,436 4.06% 24.87% 1,449 0.91% 26.00% 1,483 2.35% 28.96%
$4,574 -0.91% -7.87% $4,696 2.65% -5.43% $4,595 -2.15% -7.46% $4,804 4.56% -3.24A
$3.669 -1.80% -5.31% $3,736 1.83% -3.58% $3,729 -0.17% -3.74% $3,971 6.47% 2.49%
$765 -7.13% -6.30% $777 1.59% -4.81% $788 1.35% -3.524 $824 4.66% 0.97%
829 10.09% 52.67% 922 11.22% 69.80% 1,065 15.51% 96.13% 1,162 9.11% 114.00%
$5,784 -5.07% -18.63% $5,598 -3.22% -21.254 $4,991 -10.85% -29.79% $4,899 -1.83% -31.08%
$4,792 -6.754 -24.01% $4,625 -3.47% -26.65% $4,037 -12.72% -35.98% $4,339 7.49% -31.18%
$798 0.344 8.454 $793 -0.62k 7.7891 $755 -4.81% 2.61% $710 -5.92% -3.47%
4,349 13.26% 50.95% 5,035 15.77% 74.77% 5,272 4.71% 82.99% 4,947 -6.16% 71.71%
$3,471 -3.72% -13.984 $3,195 -7.94% -20.81% $3,097 -3.07% -23.244 $3,629 17.19% -10.04*
52,381 -7.87% -16.464 $2,154 -9.53% -24.434 $2,067 -4.07% -27.50% 52,639 27.72% -7.40%
$771 -2.76% -5.07% $829 7.49% 2.044 $852 2.79% 4.88% $899 5.50% 10.65%
4,573 10.06% 15.36% 5,339 16.75% 34.69% 5,518 3.35% 39.2 0A 5,563 0.82% 40.34%
$3,579 -2.84% -7.%84 $3,233 -9.67% -16.7 4% $3,348 3.55% -13.78% $3,605 7.69% -7.16%
52.566 -6.67% -7.10% 52,313 -9.87% -16.274 $2,239 -3.21% -18.96% 52.676 19.5106 -3.154
$785 8.06% 18.80% $836 6.54% 26.56% $943 12.83% 42.81% $911 -3.46% 37.87%
52,306 2.21% 10.51% 54,946 5.05% 16.09% 56,068 2.04% 18.46% 55,270 -1.42% 16.78%
$5,536 1.03% -7.18% $5,686 2.71% -4.67% $5,549 -2.41% -6.96% $5,981 7.79% 0.29%
$4,132 0.35% -5.43% $4,175 1.05% -4.44% $4,104 -1.72% -6.08% $4,708 14.73% 7.76%
$1,134 0.46% -5.13% $1,162 2.49% -2.76% $1,178 1.36% -1.44A $1,200 1.86% 0.39%
III*fxcluding Medical **Including Cont Ed Centers ***Including Coop Nursing ****Induding San Juan Center ***** Budget-Related FTE beginning 1991-92
47() ) fi
;. 1 ) I

History 14 -Dec-92
'TABLE 8--CONSTANT DOLLAR EXPENDITURES,
TAX FUNDS, & TUITION/FEES PER FTE
UNIVERSITY OF UTAH--E&G + Coop Nurs
HISTORY OF ENROLLMENT ARD BUDGET CHANGES, USHE
19115-86 1986-$7 1987-88
Actual 1-Yr Inc 9-Yr Inc Actual 1-Yr Inc 10-Yr Inc Actual 1-Yr Inc 11-Yr Inc
1988-89
Actual 1-Yr Inc 12-Yr Inc
Annualized FTE* 19,153 -1.50% 0.90% 18,892 -1.36% -0.47% 18,896 0.02% -0.45% 18,622 -1.454 -1.90%Constant $ Expenditures/FTE $7,930 6.15% 14.65% 17,854 -0.95% 13.56% $7,778 -0.97% 12.47% 57,796 0.23% 12.72%Constant $ Tax Fund Approp/FTE $5,915 1.35% 18.26% 55,886 -0.49% 17.68% 15,956 1.18% 19.07% 55,940 -0.26% 18.764Constant $ Tuition a Fees/FTE $1,532 4.43% 8.80% $1,683 9.83% 19.50% 51,642 -2.44A 16.58% $1,691 3.02% 20.09%
UTAH STATE UNIVERSITY--E&G + Ctrs + M
Annualized FIE" 10,306 -3.35% 8.28% 10,353 0.46% 8.77% 10,397 0.42% 9.24% 10,631 2.254 11.69%Constant $ Expenditures/FTE 17,041 8.92% 10.85% $6,807 -3.32% 7.17% 56,845 0.55% 7.76% $6,701 -2.10% 5.50%Constant $ Tax Fund Approp/FTE $5,356 5.83% 18.36% $5,356 -0.00% 18.36% 55,405 0.92% 19.44% $5,121 -5.20 13.16%Constant S Tuition & Fees/FIE $1,321 2.46% -8.40% $1,412 6.914 -2.08% $1,356 -3.99% -5.99% $1,399 3.19% -2.99%
WEBER STATE UNIVERSITY --E & G + Coop N
Annualized FTE*** 8,579 1.32% 12.38% 9,027 5.22% 18.25% 9,279 2.79% 21.55% 9,475 2.11% 24.12%Constant $ Expenditures/FTE 55,589 4.42% 11.15% $5,204 -6.88% 3.50% $5,118 -1.66% 1.79% $4,850 -5.25% -3.56%Constant $ Tax Fund Approp/FIE 54,291 -0.96% 14.03% $3,984 -7.14% 5.89% 53,933 -1.29% 4.53% 13,757 -4.484 -0.164Constant $ Tuition & Foes/FTE $1.133 2.924 13.43% $1,210 6.88% 21.23% 51.209 -0.16% 21.04% $1,287 6.46% 28.1364
SOUTHERN UTAH UNIVERSITY--Ed 4 Gen
Annualized FTE 2,361 -2.03% 30.66% 2,685 13.72% 48.59% 2,779 3.50% 53.79% 2,694 4.14% 60.15%Constant $ Expenditures/FTE 55,853 7.77% -0.48% $5,104 -12.80% -13.224 $4,978 -2.47% -15.36% $4,773 -4.11% -18.85%Constant $ Tax Fund Approp/FTE $4,705 4.35% -3.30% 54,054 -13.83% -16.67% $3,937 -2.89% -19.07k 53,739 -5.02% -23.14%Constant $ Tuition & Fees/FTE $918 2.804 4.50% $964 5.00% 9.72% $934 -3.174 6.25% $960 2.86% 9.28%
SNOW COLLEGE--Ed & Gen
Annualized FTE 1,142 1.06% 34.51% 1,265 10.774 49.00% 1,244 -1.66A 46.53% 1,375 10.53% 61.96%Constant $ Expenditures/FTE 16,750 6.69% 15.95% $5,740 -14.46% -1.39% 56,194 7.91% 6.414 $5,312 -14.23% -8.74%Constant S Tax Fund Approp/FTE 55,489 -2.15% 10.62% 54,902 -10.70% -1.22% 55,002 2.05% 0.81% 54,433 -11.38% -10.66%Constant $ Tuition & Fees/FTE $902 3.00% 30.31% 1960 6.41% 38.67% $1,017 5.95% 46.914 $963 -5.314 39.12%
DIXIE COLLEGE --Ed & Gen
Annualized FTE 1,646 10.49% 43.13% 1,843 11.97% 60.264 1,812 -1.684 57.574 1,802 -0.554 56.70%Constant $ Expenditures/FTE $4,780 -0.50% -3.72% $4,470 -6.50% -9.98% $4,452 -0.40% -10.34% $4,746 6.61% -4.41%Constant S Tax Fund Approp/FTE $3,679 -7.35% -5.04t $3,532 -4.00% -8.84% 53,599 1.91% -7.10% 53,595 -0.124 -7.21%Constant $ Tuition & Fees/FTE $875 6.13% 7.16% 5892 1.964 9.264 $1,036 16.08% 26.83% $1,031 -0.47% 26.23%
COLLEGE OF EASTERN UTAH--E&G SJC
Annualized FTE**** 1,141 -1.81% 110.13% 1,309 14.72% 141.074 1,281 -2.14A 135.91% 1,354 5.70% 149.36%Constant S Expenditures/FTE 55,858 19.57% -17.59% 14,993 -14.76% -29.75% 55,154 3.21% -27.50% 54,844 -6.02% -31.864Constant $ Tax Fund Approp/FTE $4,418 1.82% -29.93% $4,162 -5.80% -33.49% 54,233 1.71% -32.864 $3,976 -6.08% -36.944Constant $ Tuition & Fees/FTE $791 11.344 7.48% $803 1.56% 9.15% 5756 -5.864 2.76% $748 -1.054 1.68%
UTAH VALLEY COMMUNITY COLLEGE
Annualized FTE 4,899 -0.97% 70.05% 5,206 6.27% 80.70% 5,302 1.84% 84.034 5,329 0.51% 84.97%Constant $ Expenditures/FTE $3,969 9.35% -1.63% 13,825 -3.62% -5.194 13,697 -3.354 -8.36% 53,753 1.504 -6.98%Constant $ Tax Fund Approp/FTE 52.764 4.70% -3.05% 52,571 -6.98% -9.81% $2,518 -2.07% -11.60 52,506 -0.48% -12.10%Constant S Tuition & Fees/FTE $988 9.89% 21.60% $1.102 11.54% 35.63% 51,095 -0.66% 34.73% $1,135 3.72% 39.74%
SALT LAKE COMMUNITY COLLEGE
Annualized FTE 5,720 2.82% 44.30% 5,845 2.19% 47.45% 6,073 3.90% 53.200; 6,530 7.53% 64.73%Constant $ Expenditures/FTE $3,933 9.09% 1.29% $3.857 -1.93% -0.67% $3,555 -7.834 -8.45% $3,728 4.88% -3.98%Constant $ Tax Fund Approp/FTE 12.697 0.81% -2.36% $2,655 -1.56% -3.88% $2,575 -3.02% -6.794 12,461 -4.42% -10.91%Constant S Tuition & Fees/FTE $1,017 11.67% 53.95% $1,133 11.45% 71.59% $1,079 -4.814 63.34% $1,126 4.41% 70.54%
TOTAL USHE--Ed & Gen + Related Inst
Annualized FTE* 54,947 -0.58% 16.09% 56,425 2.69% 19.22% 57,063 1.13% 20.50 58,012 1.66% 22.57%Constant S Expenditures/FTE 16,377 6.62% 6.93% $6,097 -4.39% 2.23% $6,011 -1.41% 0.80% $5,911 -1.66% -0.88%Constant $ Tax Fund Approp/FTE $4,782 1.56% 9.45% $4,618 -3.43% 5.70% 14,615 -0.07% 5.62% 54,462 -3.30% 2.13%Constant $ Tuition & Fees/FTE $1,253 4.49% 4.90% $1,350 7.74% 13.02% $1,321 -2.16% 10.57% 11,361 2.99% 13.88%
*Excluding Medical **including Cont Ed Centers ***Including Coop Nursing ****Including San Juan Center Budget-Related FTE beginning 1991-92
48
9 1 1
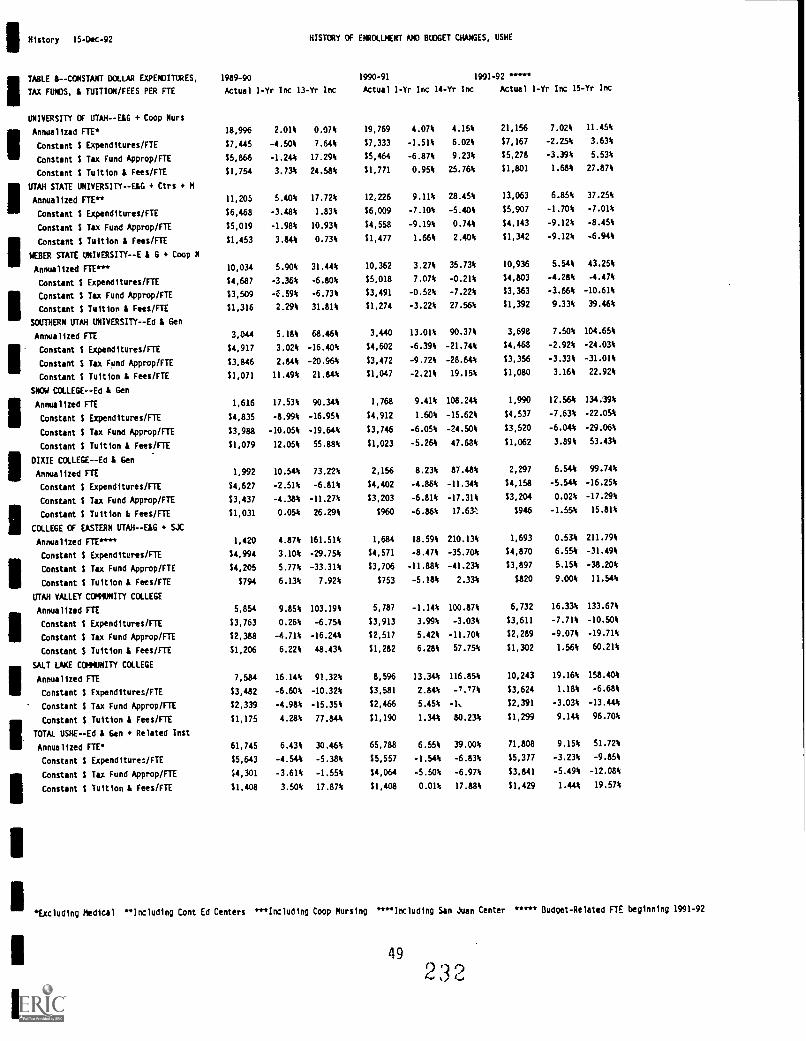
History 15-Dec-92
TABLE 8 --CONSTANT DOLLAR EXPENDITURES,
TAX FUNDS, & TUITION/FEES PER FTE
UNIVERSITY Cf UTAH--E1G + Coop Nurs
HISTORY OF ENROLLPENT AND 8113GET CHANGES, USHE
1989-90 1990-91 1991-92 *****
Actual I-Yr Inc 13-Yr Inc Actual 1-Yr Inc 14-Yr Inc Actual 1-Yr Inc I5-Yr Inc
Annualized FTE* 18,996 2.01% 0.07% 19,769 4.07% 4.15% 21,156 7.02% 11.45%
Constant $ Expenditures/FIE $7,445 -4.50% 7.64% $7,333 -1.51% 6.02% $7,167 -2.254 3.63%
Constant $ Tax Fund Approp/FTE $5,866 -1.244 17.29% $5,464 -6.87% 9.234 $5,278 -3.39% 5.53%
Constant $ Tuition & Fees/FTE $1,754 3.734 24.58% $1,771 0.95% 25.76% $1,801 1.68% 27.87%
UTAH STATE UNIVERSITY--E1G + Ctrs + M
Annualized FTE** 11,205 5.40% 17.72% 12,226 9.11% 28.45% 13,063 6.85% 37.25%
Constant $ Expenditures/FTE $6,468 -3.48% 1.83% $6,009 -7.10% -5.40% $5,907 -1.70% -7.01%
Constant $ Tax Fund Approp/FTE $5,019 -1.98% 10.934 $4,558 -9.19% 0.744 $4,143 -9.12% -8.45%
Constant $ Tuition & Fees/FTE $1,453 3.84% 0.73% $1,477 1.66% 2.40% $1,342 -9.12% -6.94%
WEBER STATE UNIVERSITY- -E & G + Coop N
Annualized FIE*** 10,034 5.90% 31.44% 10,362 3.27% 35.73% 10,936 5.54% 43.25%
Constant $ Expenditures/FTE $4,687 -3.36% -6.80% $5,018 7.07% -0.21% $4,803 -4.28% -4.47%
Constant $ Tax Fund Approp/FTE $3,509 -C.59% -6.73% $3,491 -0.52% -7.22% $3,363 -3.66% -10.61%
Constant Tuition & Fees/FTE $1,316 2.29% 31.81% $1,274 -3.22% 27.56% $1,392 9.33% 39.46%
SOUTHERN UTAH UNIVERSITY --Ed & Gen
Annualized FTE 3,044 5.18% 68.46% 3,440 13.01% 90.37% 3,698 7.50% 104.65%
Constant $ Expenditures/FTE $4.917 3.02* -16.404 $4,602 -6.39% -21.74% $4,468 -2.92% -24.03%
Constant $ Tax Fund Approp/FTE $3,846 2.84% -20.964 $3,472 -9.72% -28.644 $3,356 -3.33% -31.01%
Constant $ Tuition & Fees/FIE $1,071 11.49% 21.844 $1,047 -2.21% 19.154 $1,080 3.16% 22.92%
SNOW COLLEGE--Ed & Gen
Annualized FIE 1,616 17.53% 90.34% 1,768 9.41% 108.244 1,990 12.564 13439%
Constant $ Expenditures/FTE $4,835 -8.49% -16.95% $4,912 1.60% -15.62% $4,537 -7.63% -22.054
Constant $ Tax Fund Approp/FTE $3,988 -10.05% -19.644 $3,746 -6.05% -24.50% $3,520 -6.04% -29.064
Constant $ Tuition & Fees/FTE $1,079 12.05% 55.88% $1,023 -5.264 47.684 $1,062 3.89% 53.43%
DIXIE COLLEGE - -Ed & Gen
Annualized FTE 1,992 10.54% 73.22% 2,156 8.23% 87.48% 2,297 6.544 99.74%
Constant $ Expenditures/FTE $4,627 -2.51% -6.81% $4,402 -4.86% -11.344 $4,158 -5.54A -16.25%
Constant $ Tax Fund Approp/FTE $3,437 -4.384 -11.2711 $3,203 -6.81% -17.31% $3,204 0.02% -17.29%
Constant $ Tuition & Fees/FTE $1,031 0.054 26.29% $960 -6.86% 17.63?. $946 -1.55% 15.81%
CCCLEGE Cf EASTERN UTAH --E&G + SJC
Annualized ETV*** 1,420 4.87% 161.51% 1,684 18.59% 210.13% 1,693 0.53% 211.79%
Constant $ Expenditures/FTE $4,994 3.104 -29.75% $4,571 -8.47% -35.704 $4,870 6.554 -31.49%
Constant $ Tax Fund Approp/FTE $4,205 5.77% -33.31% $3,706 -11.88% -41.23% $3,897 5.154 -38.20%
Constant $ Tuition & Fees/FTE $794 6.13% 7.924 $753 -5.1616 2.334 $820 9.00% 11.54%
UTAH VALLEY COMUNITY CCALEGE
Annualized FIE 5,854 9.85% 103.19% 5,787 -1.14% 100.87% 6,732 16.33% 133.67%
Constant $ Expenditures/FTE $3,763 0.26% -6.754 $3,913 3.99% -3.03% $3,611 -7.71% -10.50%
Constant $ Tax Fund Approp/FTE $2,388 -4.71% -16.24A $2,517 5.42% -11.70% $2,289 -9.074 -19.71%
Constant $ Tuition & Fees/FTE $1,206 6.22% 48.43% $1,282 6.28% 57.754 $1,302 1.564 60.21%
SALT LAKE COMMUNITY COLLEGE
Annualized FTE 7,584 16.14% 91.32% 8,596 13.344 116.85% 10,243 19.16% 158.404
Constant $ Expenditures/FIE $3,482 -6.60% -10.32% $3,581 2.84% -7.77% $3,624 1.18% -6.68%
Constant $ Tax Fund Approp/FTE $2,339 -4.98% -15.35% $2,466 5.45% -1, $2,391 -3.03% -13.44%
Constant $ Tuition & Fees/FTE $1,175 4.281; 77.84% $1,190 1.34% 80.234 $1,299 9.14% 96.708
TOTAL USHE--Ed & Gen + Related Inst
Annualized F1E* 61,745 6.43% 30.464 65,788 6.55% 39.004 71,808 9.15% 51.72%
Constant $ Expenditures/FTE $5,643 -4.54A -5.38% $5,557 -1.54% -6.83% $5,377 -3.234 -9.85%
Constant $ Tax Fund Approp/F1T $4,301 -3.61% -1.55k $4,064 -5.50% -6.97% $3,841 -5.49% -12.08%
Constant $ Tuition & Fees/FIT $1,408 3.50% 17.87% $1,408 0.01% 17.88% $1,429 1.444 19.57%
*Excluding Medical **Including Cont Ed Centers ***Including Coop Nursing ****Including San Juan Center **", Budget-Related FIE beginning 1991-92
49 0'1910k)14

Table 9
CALCULATION OF CONSTANT DOLLAR INFLATORS BASED ON CPI AT DECEMBER 31:
75-76 76-77
CPI: CPI:
77-78
CPI:
78-79
CPI:
79-80
CPI:
80-81
CPI:
81-82
CPI:
82-83
CPI:
83-84
CPI:
84-85
CPI:
85-86
CPI:
86-87
CPI:
87-88
CPI:
88-89
CPI:
89-90
CPI:
90-91
CPI:
91-92
CPI:
55.5 58.2 62.1 67.7 76.7 86.3 94.0 97.6 101.3 105.3 109.3 110.5 115.4 120.5 126.1 134.0 138.0
CPI
Change: 4.86% 6.70% 9.0211 13.2991 12.52% 8.92% 3.P.3% 3.79% 3.954 3.80% 1.10% 4.43% 4.42% 4.65% 6.26% 2.99%
Dollar
Inflator 2.371 2.222 2.038 1.799 1.599 1.468 1.414 1.362 1.311 1.263 1.249 1.196 1.145 1.094 1.030 1.000

!. C
ost S
tudy
2 3
5

TAB ICOST STUDY
Introduction to the USHE Cost Study 1
TABLE 1 History of Key Elements of the Cost Study 1986-87 to 1991-92 2
TABLE 2 Annualized FTE Student Enrollment 4
TABLE 3 Annualized FTE Instructional Faculty 5
TABLE 4 Appropriated Student/Faculty Ratios 6
TABLE 5 Appropriated Direct Cost per FTE Student 7
SCHEDULE A Analysis of Full Costs Education and General 8
SCHEDULE B Instructional Costs Analysis 8
2 3

UTAH SYSTEM OF HIGHER EDUCATION - COST STUDY
The USHE Cost Study provides information by major program on direct andcalculated indirect instructional costs for each institution and for the totalsystem. The Cost Study is prepared two ways: for appropriated funds only, andfor total funds including non-appropriated restricted and auxiliary enterprisefunds.
Direct and indirect costs of instruction in courses creditable for degreesor other formal awards are broken down between Vocational Education, LowerDivision, Upper Division, Basic Graduate, and Advanced Graduate courses, and thefollowing figures are provided for each institutional category: (I) TotalAppropriated Instructional Expenditures; (2) Calculated Estimated Full Cost ofInstruction; (3) Annualized number of Academic Year Equivalent FTE Students; (4)Calculated Appropriated FTE Student/Faculty Ratio (students per faculty FTE); (5)Appropriated Direct Cost per FTE Student; and (6) Calculated Full Cost ofInstruction per FTE Student.
Appropriated direct costs of instruction include applicable expendituresfrom Education and General line items plus other line items that supportinstruction.
Five summary tables from the Cost Study are provided in the followingpages, followed by two sets of schedules showing greater detail on thecalculations. Table 1 provides a six-year history of key elements of the CostStudy. Tables 2 through 5 summarize these key elements for 1991-92 byinstitution, with subtotals by institution type and USHE totals.
Schedule A for total USHE and for each institution provides information onthe indirect cost allocations by major program, and Schedule B provides bothdollar amounts and amounts per FTE student for full as well as direct costs ofinstruction. The Schedules are arranged so that for Total USHE and for eachinstitution the schedule from Appropriated Funds cost study is on the left-handpage and the equivalent schedule from the Total Funds Cost Study is on the facingright-hand page.
In looking at the cost information for different institutions, the readershould keep in mind the factors that influence costs, particularly direct andindirect costs of instruction. These include level of instruction (advancedcourses typically are more expensive), subject matter mix (Natural Sciences,Engineering, Fine Arts, Health Professions typically are more expensive),institutional size, and amount of physical plant in relation to enrollment size.
It is not invalid to compare USHE instructional costs desegregated by leveland subject matter cluster. Such additional information is available uponrequest. But this information should not be the exclusive basis for judgingrelative adequacy of institutional budgets. Equally appropriate and useful arecomparisons of Utah institutions with external comparison groups having similarmissions, as provided under Tab L of this Data Book.
Readers who would like additional information on the Cost Study methodologyor have questions about the data should contact the Associate Commissioner forFinance.
1
t.)

Appropriated Funds Cost Study -- Total USHE
86-87 87-88 88-89 89-90
Annualized FTE Student Enrollment
90-91 91-92
5 year
change %
Vocational 11,266 10,906 10,845 10,815 11,208 12,197 8.3%
Lower 26,849 27,568 29,053 32,218 34,909 38,526 43.5%
Upper 13,323 13,557 13,161 13,749 14,607 15,129 13.6%
Basic Grad. 3,721 3,748 3,726 3,892 3,952 4,059 9.1%
Adv. Grad. 1,161 1,228 1,227 1,067 1,107 1,141 -1.7%
Total 56,320 57,007 58,012 61,741 65,783 71,051 26.2%
Appropriated Student Faculty Ratios
Vocational 19.5 19.6 19.3 19.0 15.7 16.2 -16.9%
Lower 24.9 26.0 27.5 28.9 25.7 27.3 9.6%
Upper 14.0 14.5 14.0 14.6 14.7 15.5 10.7%
Basic Grad. 11.2 10.3 10.6 11.5 11.2 11.5 2.7%
Adv. Grad. 7.4 6.6 6.9 6.0 6.2 5.3 -28.4%
Total 18.2 18.4 18.8 19.6 18.3 19.2 5.5%
Appropriated Di rect Cost per FTE Student
Vocational $2,208 $2,341 $2,410 $2,579 $2,798 $2,861 29.6%
Lower 1,647 1,598 1,547 1,567 1,661 1,613 -2.1%
Upper 3,632 3,661 3,951 4,076 4,120 4,130 13.7%
Basic Grad . 5,165 5,933 6,150 6,044 6,414 6,864 32.9%
Adv. Grad. 9,325 10,494 11,073 13,111 13,222 16,569 77.7%
Total 2,620 2,707 2,751 2,785 2,881 2,903 10.8%
Appropriated Full Cost per FTE Student
Vocational $3,797 $3,931 $4,538 $4,267 $4,679 $4,761 25.4%
Lower 3,652 3,628 3,842 3,578 3,821 3,793 3.9%
Upper 5,788 5,882 6,337 6,276 6,487 6,521 12.7%
Basic Grad. 7,321 8,130 8,550 8,266 8,741 9,303 27.1%
Adv. Grad. 11,664 12,904 13,509 15,498 15,776 19,221 64.8%
Total 4,594 4,718 5,045 4,801 5,056 5,103 11.1%
1991-92 USHE COST STUDY
2 3 9

Cst90C11 UTAH SYSTEM Of HIGHER EDUCATION 08-Jan-91
1991-92 COST STUDY INFORMATION BY FIELD AND DISCIPLINE CLUSTERS AND BY PROGRAM/LEVEL DIVISIONS Page A811
Vocational-Technical Ed
TOTALII
Non-SCH SCH TOTAL Lower Upper TOTAL TOTAL Basic Advance ALL
Gnrtg Gnrtg VOC-TECH Div Div BACC UNDRGRD Grad Grad LEVELS
I. Annualized FTE Student Enrollment
G. TOTAL ALL FIELDS AND DISCIPLINES
1. University of Utah 9,961.9 7,198.4 17,160.2 17,160.2 2,300.0 888.6 20,348.81
2. Utah State University 424.5 424.5 6,656.9 4,141.5 10,798.4 11,222.8 1,596.9 252.2 13,071.9.
3. RESEARCH UNIV SUBTOTAL 424.5 424.5 16,618.7 11,339.9 27,958.6 28,383.1 3,896.9 1,140.8 33,420.81
4. Weber State University 2,906.3 2,906.3 5,384.0 2,520.7 7,904.7 10,811.0 125.2 10,936.21
5. Southern Utah University 0.0 836.5 836.5 1,556.2 1,268.4 2,824.6 3,661.1 36.9 3,698.01
6. COMPREHENSIVE/BACC SUBTOTAL 0.0 3,742.8 3,742.8 6,940.2 3,789.1 10,729.3 14,472.1 162.0 14,634.21
7. COMBINED FOUR-YEAR SUBTOTAL 0.0 4,167.3 4,167.3 23,558.9 15,129.0 38,687.9 42,855.2 4,058.9 1,140.8 48,054.9
8. Snow College 0.0 335.4 335.4 1,647.4 1,647.4 1,982.8 1,982.81
9. Dixie College 0.0 557.0 557.0 1,740.0 1,740.0 2,296.9 2,296.9
10. College of Eastern Utah 8.0 588.8 596.9 1,104.0 1,104.0 1,700.8 1,700.81
11. Utah Valley Comm College 41.0 2.330.1 2,371.1 4,401.9 4,401.9 6,773.0 6,773.0
12. Salt Lake Community College 152.6 4,016.5 4,169.2 6,073.5 6,073.5 10,242.7 10,242.71
13. COMMUNITY COLLEGE SUBTOTAL 201.7 7,827.8 8,029.5 14,966.8 14,966.8 22,996.3 22,996.3
14. USHE GRAND TOTAL 201.7 11,995.2 12,196.8 38,525.7 15,129.0 53,654.7 65,851.5 4,058.9 1,140.8 71,051.21
4
2

111Cst90C11 UTAH SYSTEM Of HIGHER EDUCATION 08-Jan-93
11991-92 COST STUDY INFORMATION BY FIELD AND DISCIPLINE CLUSTERS AND BY PROGRAM/LEVEL DIVISIONS Page A16
111
Vocational-Technical Ed
TOTAL
Non-SCH SCH TOTAL Lower Upper TOTAL TOTAL Basic Advance ALL
Gnrtg Gnrtg VOC-TECH Div Div BACC UNDRGRD Grad Grad LEVELS
III. Annualized Instructional Faculty
G. TOTAL ALL FIELDS AND DISCIPLINES
1 1. University of Utah
2. Utah State University
I3. RESEARCH UNIV SUBTOTAL
I4. Weber State University
5. Southern Utah University
111
6. COMPREHENSIVE/BACC SUBTOTAL
7. COMBINED FOUR-YEAR SUBTOTAL
II8. Snow College
9. DUie College
II10. College of Eastern Utah
11. Utah Valley Comm College
$ 12. Salt Lake Community College
13. COMMUNITY COLLEGE SUBTOTAL
I14. USHE GRAND TOTAL
362.7 463.7 826.3 826.3 231.1 180.4 1,237.9
19.1 19.1 200.7 240.8 441.5 460.5 114.6 34.4 609.4
19.1 19.1 563.4 704.5 1,267.8 1,286.9 345.7 214.8 1,847.3
140.2 140.2 189.6 192.0 381.6 521.8 6.4 528.2
0.0 34.5 34.5 53.1 76.6 129.7 164.2 2.4 166.6
0.0 174.7 174.7 242.7 268.6 511.3 686.0 8.8 694.8
0.0 193.8 193.8 806.1 973.1 1,779.1 1,972.9 354.5 214.8 2,542.1
27.2 27.2 80.8 80.8 108.0 108.0
37.6 37.6 73.3 73.3 110.9 110.9
0.4 39.7 40.1 51.9 51.9 92.0 92.0
3.6 161.4 165.0 182.0 182.0 347.0 347.0
17.5 271.3 288.7 219.0 219.0 507.7 507.7
21.5 537.1 558.6 607.0 607.0 1,165.5 1,165.5
21.5 730.8 752.3 1,413.0 973.1 2,386.1 3,138.4 354.5 214.8 3,707.6
2 4 I

Cst90C11 UTAH SYSTEM Of HIGHER EDUCATION 08-Jan-9i
1991-92 COST STUDY INFORMATION BY FIELD AND DISCIPLINE CLUSTERS AND BY PROGRAM/LEVEL DIVISIONS Page A2411
Vocational-Technical EdTOTAL'
Non-SCH SCH TOTAL Lower Upper TOTAL TOTAL Basic Advance ALL
Gnrtg Gnrtg VOC-TECH Div Div BACC UNDRGRD Grad Grad LEVELS
III. Appropriated Student/Faculty Ratios 111
G. TOTAL ALL FIELDS AND DISCIPLINES
1. University of Utah 0.0 0.0 0.0 27.5 15.5 20.8 20.8 10.0 4.9 16.41
2. Utah State University 0.0 22.3 22.3 33.2 17.2 24.5 24.4 13.9 7.3 21.4
3. RESEARCH UNIV SUBTOTAL 0.0 22.3 22.3 29.5 16.1 22.1 22.1 11.3 5.3 18.111
4. Weber State University 0.0 20.7 20.7 28.4 13.1 20.7 20.7 19.6 0.0 20.7Il
5. Southern Utah University 0.0 24.2 24.2 29.3 16.6 21.8 22.3 15.4 0.0 22.2°
6. COMPREHENSIVE/BACC SUBTOTAL 0.0 21.4 21.4 28.6 14.1 21.0 21.1 18.4 0.0 21.1
7. COMBINED FOUR-YEAR SUBTOTAL 0.0 21.5 21.5 29.2 15.5 21.7 21.7 11.5 5.3 18.9
8. Snow College 0.0 12.3 12.3 20.4 0.0 20.4 18.4 0.0 0.0 18.41
9. Dixie College 0.0 14.8 14.8 23.7 0.0 23.7 20.7 0.0 0.0 20.7
10. College of Eastern Utah 19.1 14.9 14.9 21.3 0.0 21.3 18.5 0.0 0.0 18.5
II. Utah Valley Comm College 11.4 14.4 14.4 24.2 0.0 24.2 19.5 0.0 0.0 19.5
12. Salt Lake Community College 8.7 14.8 14.4 27.7 0.0 27.7 20.2 0.0 0.0 20.2
13. COMMUNITY COLLEGE SUBTOTAL 9.4 14.6 14.4 24.7 0.0 24.7 19.7 0.0 0.0 19.7
14. USHE GRAND TOTAL 9.4 16.4 16.2 27.3 15.5 22.5 21.0 11.5 5.3 19.2
6
216

IIIUSHE APPROPRIATED FUNDS COST STUDY
1. School of Medicine
2. Instruction
3. Research
4. Public Service
5. Academic Support
6. Student Services
8. Institutional Support
9. Plant Operation
and Maintenance
10. Scholarships and
IFellowships
11. Ed & Gen Transfers
to Other Funds
TOTAL EDUCATION
AND GENERAL
TOTAL USHE
1991-92
SCHEDULE A
ANALYSIS OF FULL COSTS
EDUCATION AND GENERAL
Allocations From
08-Jan-93
Appropriated
Direct
Expenditures
(1)
Physical
Plant
(2)
$
Institutional
Support
(3)
$
Academic
Support
(4)
$
Student
Services
(5)
$
Appropriated
Full Cost
(6)
$
16,432,487 0 2,179,322 127,389 0 18,739,197
211,096,117 30,087,374 37,798,642 53,420,788 38,375,721 370,778,641
15,416,212 1,922,010 1,699,545 3,472,788 0 22,510,556
14,923,435 1,926,035 1,823,438 3,525,620 0 22,198,527
46,243,734 6,520,295 7,782,556 (60,546,585) 0 0
28,542,486 4,231,139 5,602,096 0 (38,375,721) (0)
49,636,009 7,249,588 (56,885,597) 0 0 (0)
51,936,441 (51,936,441) 0 0 0 0
749,464 0 0 0 0 749,464
2,642,380 0 0 0 0 2,642,380
437,618,765 0 0 0 0 437,618,765
SCHEDULE B
INSTRUCTIONAL COSTS ANALYSIS
[Excluding School of Medicine and Skill Center]
Appropriated Appropriated
Total Calculated Academic Year Calculated Direct Cost Of Full Cost Of
Appropriated Estimated Equivalent Appropriated Instruction Instruction
Instructional Full Cost Of FTE FTE Student/ Per FTE Per FTE
Expenditures Instruction Students Faculty Ratio Student Student
REGULAR INSTRUCTION
1. Vocational Education
2. Lower Division
3. Upper Division
4. Basic Graduate
5. Advanced Graduate
6. TOTAL
OTHER INSTRUCTIONAL ACTIVITIES
TOTAL INSTRUCTION
(1) (2) (3) (4) (5) (6)
34,896,724 58,069,589 12,197 16.2 2,861 4,761
62,150,713 146,136,788 38,526 27.3 1,613 3,793
62,480,619 98,661,375 15,129 15.5 4,130 6,521
27,861,486 37,760,175 4,059 11.5 6,864 9,303
18,901,805 21,926,758 1,141 5.3 16,569 19,221
206,291,347 362,554,686 71,051 19.2 2,903 5,103
4,804,770 8,223,955
211,096,117 370,778,641

Cst90C11 UTAH SYSTEM Of HIGHER EDUCATION
1991-92 COST STUDY INFORMATION BY FIELD AND DISCIPLINE CLUSTERS AND BY PROGRAM/LEVEL DIVISIONS
Vocational-Technical Ed
08-Jan-9111
Page A32
TOTALI
Non-SCH SCH TOTAL Lower Upper TOTAL TOTAL Basic Advance ALL
Gnrtg Gnrtg VOC-TECH Div Div BACC UNDRGRD Grad Grad LEVELS
IV. Appropriated Direct Cost per FTE Student
G. TOTAL ALL FIELDS AND DISCIPLINES
1. University of Utah $0 $0 $0 $1,813 $4,273 $2,845 $2,845 $8,031 $18,115
2. Utah State University $0 $2,387 $2,387 $1,739 $3,950 $2,587 $2,580 $5,561 $11,121
3. RESEARCH UNIV SUBTOTAL $0 $2,387 $2,387 $1,783 $4,155 $2,745 $2,740 $7,019 $16,569
4. Heber State University $0 $2,662 $2,662 $1,843 $4,622 $2,729 $2,711 $2,889 $0
5. Southern Utah University $0 $2,161 $2,161 $1,562 $2,929 $2,176 $2,172 $4,058 $0
6. COMPREHENSIVE/BACC SUBTOTAL $0 $2,550 $2,550 $1,780 $4,055 $2,584 $2,575 $3,155 $0
7. COMBINED FOUR-YEAR SUBTOTAL $0 $2,533 $2,533 $1,782 $4,130 $2,700 $2,684 $6,864 $16,569
8. Snow College $0 $3,171 $3,171 $1,766 $0 $1,766 $2,003 $0 $0
9. Dixie College $0 $2,549 $2,549 $1,587 $0 $1,587 $1,820 $0 $0
10. College of Eastern Utah $1,485 $2,906 $2,887 $1,718 $0 $1,718 $2,128 $0 $0
11. Utah Valley Comm College $4,448 $2,937 $2,963 $1,228 $0 $1,228 $1,835 $0 $0
12. Salt Lake Community College $4,808 $3,080 $3,144 $1,184 $0 $1,184 $1,982 $0 $0
13. COMMUNITY COLLEGE SUBTOTAL $4,603 $2,991 $3,031 $1,347 $0 $1,347 $1,935 $0 $0
14. USHE GRAND TOTAL $4,603 $2,832 $2,861 $1,613 $4,130 $2,323 $2,423 $6,864 $16,569
111
$4,09811
$3,10911
$3,71111
$2,7131
$2,19111
$2,5811
$3,367
$2,0031
$1,820
$2,1281
$1,835
$1,9821
$1,935
$2,9031

111USHE ALL FUNDS COST STUDY
TOTAL USHE
1991-92
SCHEDULE A
ANALYSIS OF FULL COSTS
EDUCATION AND GENERAL
08-Jan-93
All Funds
Direct
Expenditures
(1)
Physical
Plant
(2)
$
Allocations From
Institutional Academic
Support Support
(3) (4)
$ S
Student
Services
(5)
$
Appropriated
Full Cost
(6)
S
1. School of Medicine 130,988,655 0 8,021,877 152,437 0 139,162,970
2. Instruction 248,635,645 22,940,147 34,065,306 44,052,773 49,608,729 399,302,600
3. Research 115,517,956 7,813,410 10,082,132 14,924,849 0 148,338,347
4. Public Service 88,059,643 6,720,539 7,279,069 13,555,238 0 115,614,489
5. Academic Support 60,025,887 5,270,408 7,389,002 (72,685,297) 0 (0)
6. Student Services 38,934,827 4,100,117 6,573,785 0 (49,608,729) (0)
8. Institutional Support 66,953,845 6,457,326 (73,411,171) 0 0 (0)
9. Plant Operation
and Maintenance 53,301,947 (53,301,947) 0 0 0 0
10. Scholarships and
Fellowships 67,943,868 0 0 0 0 67,943,868
11. Ed 21 Gen Transfers
to Other Funds 18,517,592 0 0 0 0 18,517,592
12. TOTAL EDUCATION
AND GENERAL 888,879,865 0 (0) (0) 0 888,879,865
SCHEDULE B
INSTRUCTIONAL COSTS ANALYSIS
[Excluding School of Medicine and Skill Center]
Appropriated All Funds
Total Calculated Academic Year Calculated Direct Cost Of Full Cost Of
Appropriated Estimated Equivalent Appropriated Instruction Instruction
Instructional Full Cost Of FTE FTE Student/ Per FTE Per FTE
Expenditures Instruction Students Faculty. Ratio Student Student
REGULAR INSTRUCTION
(1) (2) (3) (4) (5) (6)
1. Vocational Education 34,896,724 66,350,806 12,197 16.2 2,861 5,440
2. Lower Division 62,150,713 162,761,030 38,526 27.3 1,613 4,225
3. Upper Division 62,480,619 101,468,602 15,129 15.5 4,130 6,707
4. Basic Graduate 27,861,486 38,293,209 4,059 11.5 6,864 9,434
5. Advanced Graduate 18,901,805 21,844,233 1,141 5.3 16,569 19,148
6. TOTAL 206,291,347 390,717,881 71,051 19.2 2,903 5,499
OTHER INSTRUCTIONAL ACTIVITIES 4,804,770 8,584,719
TOTAL INSTRUCTION 211,096,117 399,302,600

USHE APPROPRIATED FUNDS COST STUDY
UNIVERSITY OF UTAH
1991-92
SCHEDULE A
ANALYSIS OF FULL COSTS
EDUCATION AND GENERAL
Allocations From
08-Jan-93
Appropriated
Direct
Expenditures
(1)
Physical
Plant
(2)
$
Institutional
Support
(3)
$
Academic
Support
(4)
$
Student
Services
(5)
$
Appropriated
Ful l Cost
(6)
$
1. School of Medicine 16,432,487 0 2,179,322 127,389 0 18,739,197
2. Instruction 86,090,747 12,083,136 13,020,090 24,819,783 10,615,725 146,629,480
3. Research 1,879,557 263,802 284,258 544,654 0 2,972,271
4. Public Service 3,798,391 533,117 574,457 1,100,689 0 6,006,654
5. Academic Support 20,588,970 2,889,733 3,113,810 (26,592,514) 0 0
6. Student Services 8,219,112 1,153,581 1,243,032 0 (10,615,725) 0
7. Institutional Support 17,902,316 2,512,652 (20,414,968) 0 0 0
8. Plant Operation
and Maintenance 19,436,022 (19,436,022) 0 0 0 0
9. Scholarships and
Fellowships 344,306 0 0 0 0 344,306
10. Ed & Gen Transfers
to Other Funds 2,280,631 0 0 0 0 2,280,631
11. TOTAL EDUCATION
AND GENERAL 176,972,539 (0) 0 0 0 176,972,539
Total
Appropriated
Instructional
Expenditures
SCHELULE B
INSTRUCTIONAL COSTS ANALYSIS
[Excluding School of Medicine]
Calculated Academic Year
Estimated Equivalent
Full Cost Of FTE
Instruction Students
Calculated
Appropriated
FTE Student/
Faculty Ratio
Appropriated
Direct Cost
Of Instruction
Per FTE
Student
Appropriated
Full Cost
Of Instruction
Per FTE
StuJent
A. REGULAR INSTRUCTION
1. Vocational Education
(1) (2) (3) (4) (5) (6)
2. Lower Division 18,058,442 46,763,010 9,962 27.5 1,813 4,694
3. Upper Division 30,756,466 51,498,193 7,198 15.5 4,273 7,154
4. Basic Graduate 18,470,117 25,097,344 2,300 10.0 8,031 10,912
5. Advanced Graduate 16,097,006 18,657,457 889 4.9 18,115 20,996
6. TOTAL 83,382,031 142,016,004 20,349 16.4 4,098 6,979
B. OTHER INSTRUCTIONAL ACTIVITIES 2,708,716 4,613,476
C. TOTAL INSTRUCTION 86,090,747 146,629,480
10 2 4 (3
111

USHE ALL FP'Y.. ,:nST STUDY 08-Jan-93
1. School of Medicine
2. Instruction
3. Research
4. Public Service
5. Academic Support
6. Student Services
7. Institutional Support
8. Plant Operation
and Maintenance
9. Scholarships and
IFellowships
10. Ed & Gen Transfers
to Other Funds
I11. TOTAL EDUCATION
AND GENERAL
A.
UNIVERSITY OF UTAH
1991-92
SCHEDULE A
ANALYSIS OF FULL COSTS
EDUCATION AND GENERAL
Allocations From
All Funds
Direct
Expenditures
(1)
$
Physical
Plant
(2)
$
Institutional
Support
(3)
$
Academic
Support
(4)
$
Student
Services
(5)
$
Appropriated
Full Cost
(6)
$
130,988,655 0 8,021,877 152,437 0 139,162,970
98,805,189 7,291,762 6,497,484 15,296,749 12,703,114 140,594,299
44,735,737 3,301,470 2,941,847 6,994,883 0 57,973,937
64,314,125 4,746,343 4,229,333 10,056,161 0 83,345,962
28,519,984 2,104,757 1,875,490 (32,500,231) 0 0
11,147,386 822,670 733,058 0 (12,703,114) 0
22,629,078 1,670,012 (24,299,090) 0 0 0
19,937,013 (19,937,013) 0 0 0 0
16,385,807 0 0 0 0 16,385,807
9,112,380 0 0 0 0 9,112,380
446,575,354 0 0 0 0 446,575,354
SCHEDULE B
INSTRUCTIONAL COSTS ANALYSIS
[Excluding School of Medicine]
Appropriated All Funds
Total Calculated Academic Year Calculated Direct Cost Full Cost
Appropriated Estimated Equivalent Appropriated Of Instruction Of Instruction
Instructional Full Cost Of FTE FTE Student/ Per FTE Per FTE
Expenditures Instruction Students Faculty Ratio Student Student
REGULAR INSTRUCTION
1. Vocational Education
2. Lower Division
3. Upper Division
4. Basic Graduate
5. Advanced Graduate
6. TOTAL
IB. OTHER INSTRUCTIONAL ACTIVITIES
C. TOTAL INSTFUCTION
1
(1) (2) (3) (4) (5) (6)
18,058,442 43,901,416 9,962 27.5 1,813 4,407
30,756,466 49,430,425 7,198 15.5 4,273 6,867
18,470,117 24,436,667 2,300 10.0 8,031 10,625
16,097,006 18,402,203 889 4.9 18,115 20,709
83,382,031 136,170,710 20,349 16.4 4,098 6,692
2,708,716 4,423,588
86,090,747 140,594,299
24711

USHE APPROPRIATED FUNDS COST STUDY
UTAH STATE UNIVERSITY
1991-92
SCHEDULE A
ANALYSIS OF FULL COSTS
EDUCATIONAL AND GENERAL
Allocations From
08-Jan-93
Appropriated
Direct
Expenditures
(1)
Physical
Plant
(2)
$
Institutional
Support
(3)
$
Academic
Support
(4)
$
Student
Services
(5)
S
Appropriated
Full Cost
(6)
$
1. School of Medicine 0 0 0 0 0 0
2. Instruction 41,734,517 5,110,705 4,346,569 9,027,643 6,242.459 66,461,893
3. Research 13,475,795 1,650,212 1,403,478 2,914,965 0 19,444,450
4. Public Service 10,298,189 1,261,091 1,072,536 2,227,614 0 14,859,429
5. Academic Support 11,552,387 1,414,677 1,203,159 (14,170,222) 0 0
6. Student Services 5,089,215 623,213 530,032 0 (6,242,459) (0)
7. Institutional Support 7,622,358 933,415 (8,555,773) 0 0 0
8. Plant Operation
and Maintenance 10,993,312 (10,993,312) 0 0 0 o
9. Scholarships and
Fellowships 97,099 0 o 0 o 97,099
10. Ed & Gen Transfers
to Other Funds 113,498 0 0 0 0 113,498
11. TOTAL EDUCATION
AND GENERAL 100,976,370 0 (0) 0 0 100,976,370
SCHEDULE B
INSTRUCTIONAL COSTS ANALYSIS
A. REGULAR INSTRUCTION
Total
Appropriated
Instructional
Expenditures
(1)
Calculated
Estimated
Full Cost Of
Instruction
(2)
Academic Year
Equivalent
FTE
Students
(3)
Calculated
Appropriated
FTE Student/
Faculty Ratio
(4)
Appropriated
Direct Cost
Of Instruction
Per FTE
Student
(5)
Appropriated
Full Cost
Of Instruction
Per FTE
Student
(6)
1. Vocational Education 1,013,013 1,794,796 424 22.3 2,387 4,228
2. Lower Division 11,578,480 23,839,097 6,657 33.2 1,739 3,581
3. Upper Division 16,358,517 23,986,352 4,142 17.2 3,950 5,792
4. Basic Graduate 8,880,168 11,821,338 1,597 13.9 5,561 7,403
5. Advanced Graduate 2,804,799 3,269,301 252 7.3 11,121 12,963
6. TOTAL 40,634,977 64,710,884 13,072 21.4 3,109 4,950
B. OTHER INSTRUCTIONAL ACTIVITIES 1,099,540 1,751,009
C. TOTAL INSTRUCTION 41,734,517 66,461,893
12o '13

USHE ALL FUNDS COST STUDY
1.
2.
3.
4.
5.
6.
7.
8.
9.
10.
11.
A.
C.
UTAH STATE UNIVERSITY
1991-92
SCHEDULE A
ANALYSIS OF FULL COSTS
EDUCATIONAL AND GENERAL
Allocations From
08-Jan-93
All Funds
Direct
Expenditures
(1)
Physical
Plant
(2)
$
Institutional
Support
(3)
$
Academic
Support
(4)
$
Student
Services
(5)
$
Appropriated
Full Cost
(6)
$
School of Medicine 0 0 0 0 0 0
Instruction 54,290,703 3,441,386 5,443,921 6,035,310 6,445,687 75,657,008
Research 70,222,242 4,451,257 7,041,433 7,806,365 0 89,521,296
Public Service 16,714,079 1,059,474 1,675,980 1,858,047 0 21,307,580
Academic Support 13,491,655 855,211 1,352,856 (15,699,722) 0 0
Student Services 5,539,142 351,116 555,429 0 (6,445,687) (0)
Institutional Support 15,111,715 957,903 (16,069,618) 0 0 0
Plant Operation
and Maintenance 11,116,347 (11,116,347) 0 0 0 0
Scholarships and
Fellowships 17,113,427 0 0 0 0 17,113,427
Ed & Gen Transfers
to Other Funds 6,762,845 0 0 0 0 6,762,845
TOTAL EDUCATION
AND GENERAL 210,362,155 0 0 0 0 210,362,155
SCHEDULE B
INSTRUCTIONAL COSTS ANALYSIS
Appropriated All Funds
Total Calculated Academic Year Calculated Direct Cost Full Cost
Appropriated Estimated Equivalent .:loropriated Of Instruction Of Instruction
Instructional Full Cost Of FTE Student/ Per FTE Per FTE
Expenditures Instruction Students FaA.Ity Ratio Student Student
REGULAR INSTRUCTION
(1) (2) (3) (4) (5) (6)
1. Vocational Education 1,013,013 2,085,509 424 22.3 2,387 4,913
2. Lower Division 11,578,480 28,398,326 6,657 33.2 1,739 4,266
3. Upper Division 16,358,517 26,822,837 4,142 17.2 3,950 6,477
4. Basic Graduate 8,880,168 12,915,041 1,597 13.9 5,561 8,088
5. Advanced Graduate 2,804,799 3,442,031 252 7.3 11,121 13,648
6. TOTAL 40,634,977 73,663,744 13,072 21.4 3,109 5,635
OTHER INSTRUCTIONAL ACTIVITIES 1,099,540 1,993,264
TOTAL INSTRUCTION 41,734,517 75,657,008
32 4

USHE APPROPRIATED FUNDS COST STUDY 08-Jan-93 I
1991-92 iWEBER STATE UNIVERSITY
SCHEDULE A
1ANALYSIS OF FULL COSTS
EDUCATIONAL AND GENERAL
Allocations From II
Appropriated Physical Institutional Academic Student Appropriated
IDirect Plant Support Support Services Full Cost
Expenditures
(1)
$
(2)
$
(3)
$
(4)
$
(5)
$
(6)
$ I1. School of Medicine 0 0 0 0 o 0
2. Instruction 30,016,030 3,943,255 5,824,266 6,495,203 5,746,082 52,024,836
3. Research 60,860 7,995 11,809 13,170 0 93,834
4. Public Service 462,067 60,702 89,659 99,987 o 712,416 i5. Academic Support 4,985,898 655,006 967,456 (6,608,360) 0 (0)
6. Student Services 4,335,324 569,539 841,220 0 (5,746,082) o
7. Institutional Support 6,836,313 898,098 (7,734,411) 0 0 (0) I8. Plant Operation
and Maintenance 6,134,594 (6,134,594) o o 0 o
9. Scholarships and
Fellowships 43,390 0 0 0 0 43,390
10. Ed & Gen Transfers
to Other Funds 0 0 0 o o 0
11. TOTAL EDUCATION
AND GENERAL 52,874,476 0 (0) 0 0 52,874,476
SCHEDULE B
INSTRUCTIONAL COSTS ANALYSIS
A. REGULAR INSTRUCTION
Total
Appropriated
Instructional
Expenditures
(1)
Calculated
Estimated
Full Cost Of
Instruction
(2)
Academic Year
Equivalent
FTE
Students
(3)
Calculated
Appropriated
FTE Student/
Faculty Ratio
(4)
Appropriated
Direct Cost Of
Instruction
Per FTE
Student
(5)
Appropriated
Full Cost Of
Instruction
Per FTE
Student
(6)
1. Vocational Education 7,736,212 13,518,194 2,906 20.7 2,662 4,651
2. Lower Division 9,923,296 20,634,535 5,384 28.4 1,843 3,833
3. Upper Division 11,650,818 16,665,665 2,521 13.1 4,622 6,611
4. Basic Graduate 361,610 610,624 125 19.6 2,889 4,878
5. Advanced Graduate 0 0 0 0.0
6. TOTAL 29,671,936 51,429,018 10,936 20.7 2,713 4,703
B. OTHER INSTRUCTIONAL ACTIVITIES 344,094 595,819
C. TOTAL INSTRUCTION 30,016,030 52,024,836
142 ;)
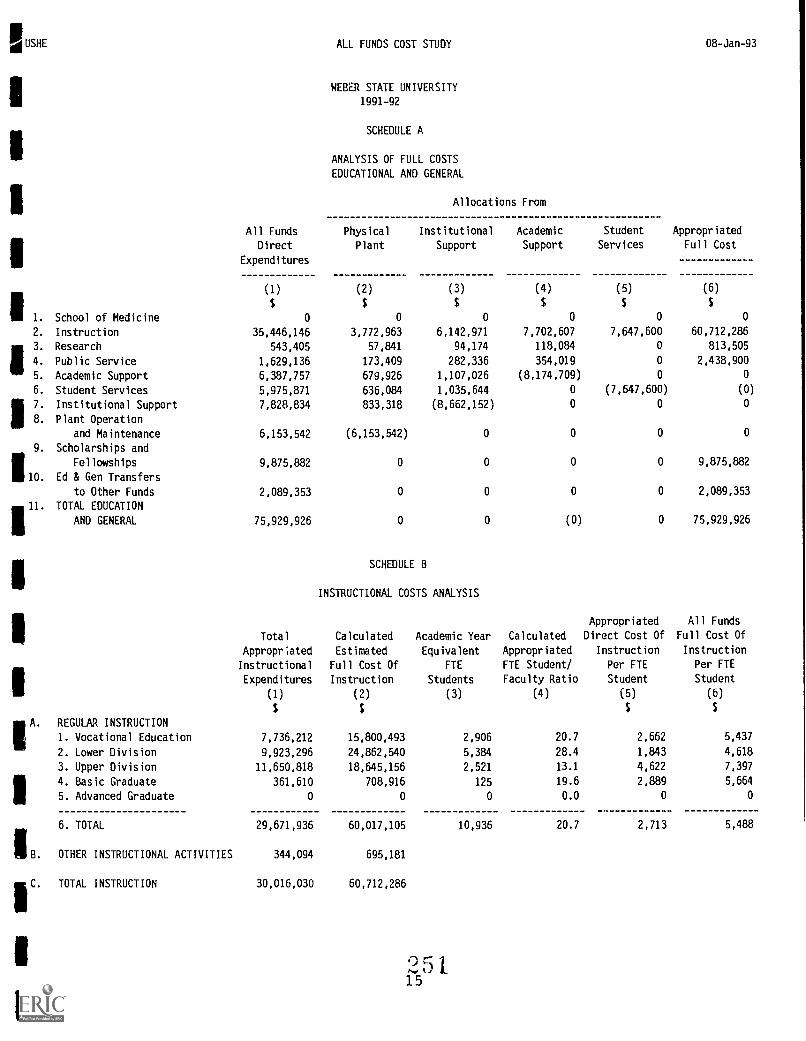
IUSHE
1. School of Medicine
2. Instruction
3. Research
4. Public Service
5. Academic Support
6. Student Services
7. Institutional Support
8. Plant Operation
and Maintenance
9. Scholarships and
IFellowships
10. Ed & Gen Transfers
to Other Funds
TOTAL EDUCATION
AND GENERAL
I
1B
IC
ALL FUNDS COST STUDY 08-Jan-93
WEBER STATE UNIVERSITY
1991-92
SCHEDULE A
ANALYSIS OF FULL COSTS
EDUCATIONAL AND GENERAL
Allocations From
All Funds
Direct
Expenditures
(1)
$
Physical
Plant
(2)
$
Institutional
Support
(3)
$
Academic
Support
(4)
$
Student
Services
(5)
$
Appropriated
Full Cost
(6)
$
o o 0 0 0 0
35,446,146 3,772,963 6,142,971 7,702,607 7,647,600 60,712,286
543,405 57,841 94,174 118,084 0 813,505
1,629,136 173,409 282,336 354,019 0 2,438,900
6,387,757 679,926 1,107,026 (8,174,709) 0 0
5,975,871 636,084 1,035,644 0 (7,647,600) (0)
7,828,834 833,318 (8,662,152) o o o
6,153,542 (6,153,542) o o o o
9,875,882 o 0 o o 9,875,882
2,089,353 0 0 0 o 2,089,353
75,929,926 o 0 (0) 0 75,929,926
SCHEDULE B
INSTRUCTIONAL COSTS ANALYSIS
Appropriated All Funds
Total Calculated Academic Year Calculated Direct Cost Of Full Cost Of
Appropriated Estimated Equivalent Appropriated Instruction Instruction
Instructional Full Cost Of FTE FTE Student/ Per FTE Per FTE
Expenditures Instruction Students Faculty Ratio Student Student
REGULAR INSTRUCTION
1. Vocational Education
2. Lower Division
3. Upper Division
4. Basic Graduate
5. Advanced Graduate
6. TOTAL
OTHER INSTRUCTIONAL ACTIVITIES
TOTAL INSTRUCTION
(1)
7,736,212
9,923,296
11,650,818
361,610
29,671,936
344,094
30,016,030
(2)
15,800,493
24,862,540
18,645,156
708,916
0
60,017,105
695,181
60,712,286
0
15
(3)
2,906
5,384
2,521
125
10,936
(4)
20.7
28.4
13.1
19.6
0.0
20.7
(5)
$
2,662
1,843
4,622
2,889
0
2,713
(6)
$
5,437
4,618
7,397
5,664
0
5,488

USHE APPROPRIATED FUNDS COST STUDY
SOUTHERN UTAH UNIVERSITY
1991-92
SCHEDULE A
ANALYSIS OF FULL COSTS
EDUCATION AND GENERAL
Allocations From
08-Jan-93 I
Appropriated
Direct
Expenditures
(1)
$
Physical
Plant
(2)
$
Institutional
Support
(3)
$
Academic
Support
(4)
$
Student
Services
(5)
$
Appropriated
Full Cost
(6)
$
1. School of Medicine o 0 0 0 0 0
2. Instruction 8,103,224 1,532,824 1,879,382 2,273,261 2,467,329 16,256,021
3. Research 0 0 0 0 0 0
4. Public Service 215,833 40,827 50,058 60,549 0 367,268
5. Academic Support 1,642,265 310,655 380,891 (2,333,810) 0 (0)
6. Student Services 1,736,220 328,427 402,682 0 (2,467,329) (0)
7. Institutional Support 2,281,449 431,564 (2,713,013) 0 0 (0)
8. Plant Operation
and Maintenance 2,644,298 (2,644,298) 0 0 0 0
9. Scholarships and
Fellowships 16,762 0 0 0 0 16,762
10. Ed & Gen Transfers
to Other Funds o o o o o o
11. TOTAL EDUCATION
AND GENERAL 16,640,051 (0) (0) 0 0 16,640,051
SCHEDULE B
INSTRUCTIONAL COSTS ANALYSIS
Appropriated Appropriated
Total Calculated Academic Year Calculated Direct Cost Full Cost
Appropriated Estimated Equivalent Appropriated Of Instruction Of Instruction
Instructional Full Cost Of FTE FTE Student/ Per FTE Per FTE
Expenditures Instruction Students Faculty. Ratio Student Student
A. REGULAR INSTRUCTION
(1) (2) (3) (4) (5) (6)
1. Vocational Education 1,807,817 3,652,092 837 24.2 2,161 4,366
2. Lower Division 2,430,998 5,861,896 1,556 29.3 1,562 3,767
3. Upper Division 3,714,818 6,511,164 1,268 16.6 2,929 5,133
4. Basic Graduate 149,591 230,870 37 15.4 4,058 6,262
5. Advanced Graduate 0 0 0.0 0 0
6. TOTAL 8,103,224 16,256,021 3,698 22.2 2,191 4,396
B. OTHER INSTRUCTIONAL ACTIVITIES 0 0
C. TOTAL INSTRUCTION 8,103,224 16,256,021
160 "'4,34
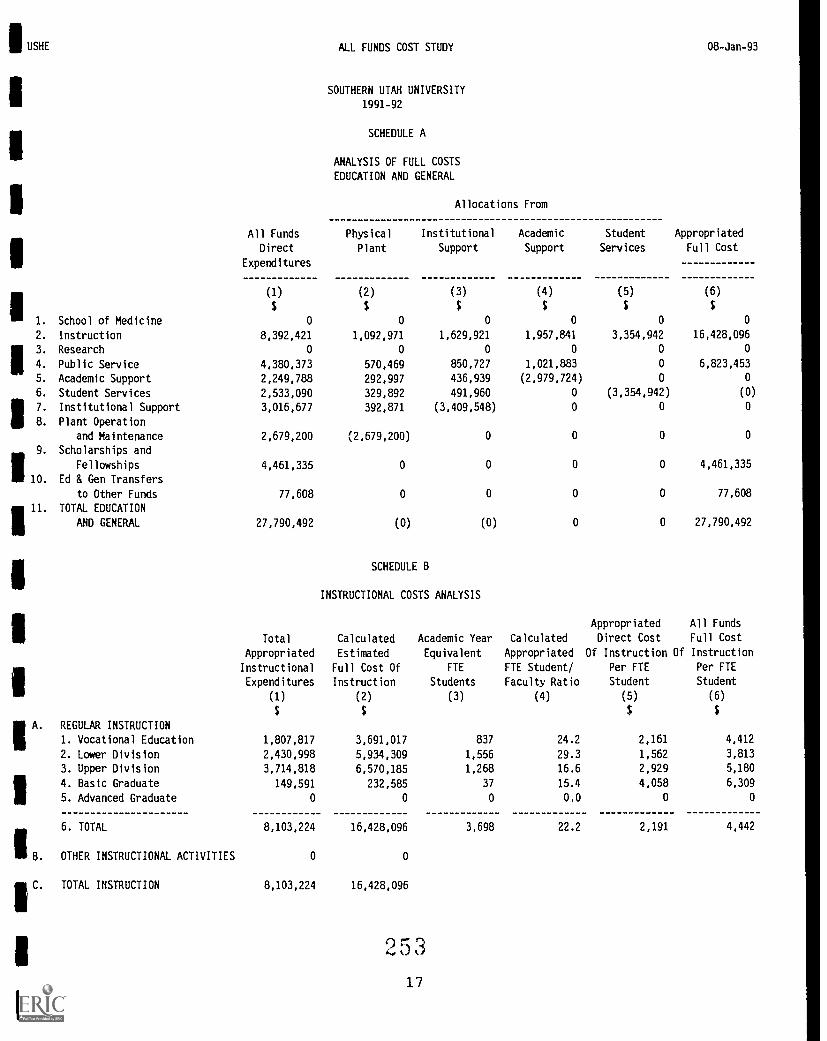
USHE ALL FUNDS COST STUDY
1. School of Medicine
2. Instruction
3. Research
4. Public Service
5. Academic Support
6. Student Services
7. Institutional Support
8. Plant Operation
and Maintenance
9. Scholarships and
iFellowships
10. Ed & Gen Transfers
to Other Funds
11. TOTAL EDUCATION
AND GENERAL
A.
1B
1
08-Jan-93
SOUTHERN UTAH UNIVERSITY
1991-92
SCHEDULE A
ANALYSIS OF FULL COSTS
EDUCATION AND GENERAL
Allocations From
All Funds
Direct
Expenditures
(1)
$
Physical
Plant
(2)
$
Institutional
Support
(3)
$
Academic
Support
(4)
S
Student
Services
(5)
$
Appropriated
Full Cost
(6)
0 0 0 0 0 0
8,392,421 1,092,971 1,629,921 1,957,841 3,354,942 16,428,096
0 o o o 0 0
4,380,373 570,469 850,727 1,021,883 0 6,823,453
2,249,788 292,997 436,939 (2,979,724) 0 0
2,533,090 329,892 491,960 0 (3,354,942) (0)
3,016,677 392,871 (3,409,548) 0 0 0
2,679,200 (2,679,200) o o 0
4,461,335 0 0 0 0 4,461,335
77,608 o o 0 0 77,608
27,790,492 (0) (0) 0 0 27,790,492
SCHEDULE
INSTRUCTIONAL COSTS ANALYSIS
REGULAR INSTRUCTION
Total
Appropriated
Instructional
Expenditures
(1)
Calculated
Estimated
Full Cost Of
Instruction
(2)
Academic Year
Equivalent
FTE
Students
(3)
Calculated
Appropriated
FTE Student/
Faculty Ratio
(4)
1. Vocational Education 1,807,817 3,691,017 837 24.2
2. Lower Division 2,430,998 5,934,309 1,556 29.3
3. Upper Division 3,714,818 6,570,185 1,268 16.6
4. Basic Graduate 149,591 232,585 37 15.4
5. Advanced Graduate 0 0 0 0.0
6. TOTAL 8,103,224 16,428,096 3,698 22.2
OTHER INSTRUCTIONAL ACTIVITIES 0 0
TOTAL INSTRUCTION 8,103,224 16,428,096
17
Appropriated
Direct Cost
Of Instruction Of
Per FTE
Student
(5)
2,161
1,562
2,929
4,058
0
2,191
All Funds
Full Cost
Instruction
Per FTE
Student
(6)
4,412
3,813
5,180
6,309
0
4,442

USHE APPROPRIATED FUNDS COST STUDY
SNOW COLLEGE
1991-92
SCHEDULE A
ANALYSIS OF FULL COSTS
EDUCATIONAL AND GENERAL
Allocations From
Appropriated Physical Institutional Academic Student
Direct Plant Support Support Services
Expenditures
(1)
$
(2)
$
(3)
$
(4)
$
(5)
$
1. School of Medicine 0 0 0 0 0
2. Instruction 3,972,579 749,352 1,207,389 1,288,197 1,933,877
3. Research 0 0 0 0 0
4. Public Service 0 0 0 0 0
5. Academic Support 863,078 162,803 262,316 (1.288,197) o
6. Student Services 1,295,676 244,405 393,796 0 (1,933,877)
7. Institutional Support 1,567,770 295,730 (1,863,500) o o
8. Plant Operation
and Maintenance 1,452,291 (1,452,291) o o o
9. Scholarships and
Fellowships 24,919 0 0 0 0
10. Ed & Gen Transfers
to Other Funds 0 0 0 0 0
11. TOTAL EDUCATION
AND GENERAL 9,176,313 o (0) 0 0
SCHEDULE B
INSTRUCTIONAL COSTS ANALYSIS
A. REGULAR INSTRUCTION
Total
Appropriated
Instructional
Expenditures
(1)
$
Calculated
Estimated
Full Cost Of
Instruction
(2)
$
Academic Year
Equivalent
FTE
Students
(3)
Calculated
Appropriated
FTE Student/
Faculty Ratio
(4)
Appropriated
Direct Cost Of
Instruction
Per FTE
Student
(5)
$
1. Vocational Education 1,063,574 1,939,585 335 12.3 3,171
2. Lower Division 2,909,005 7,211,809 1,647 20.5 1,766
3. Upper Division 0 o o 0.0 o
4. Basic Graduate 0 o o 0.0 o
5. Advanced Graduate 0 o o 0.0 o
6. TOTAL 3,972,579 9,151,394 1,983 18.4 2,003
B. OTHER INSTRUCTIONAL ACTIVITIES 0 o
C. TOTAL INSTRUCTION 3,972,579 9,151,394
2 5 4
18
08-Jan-93
Appropriated
Full Cost
(6)
$
0
9,151,394
0
0
0
(0)
0
0
24,919
0
9,176,313
Appropriated
Full Cost Of
Instruction
Per FTE
StudentI(6)
$
IIIIIIIIIIII
5,783
4,378
o
o
o
4,615
IIIIII

USHE ALL FUNDS COST STUDY 08-Jan-93
1.
2.
3.
4.
5.
6.
7.
8.
9.
10.
11.
A.
C.
SNOW COLLEGE
1991-92
SCHEDULE A
ANALYSIS OF FULL COSTS
EDUCATIONAL AND GENERAL
Allocations From
All Funds
Direct
Expenditures
(1)
$
Physical
Plant
(2)
$
Institutional
Support
(3)
$
Academic
Support
(4)
$
Student
Services
(5)
$
Appropriated
Full Cost
(6)
$
School of Medicine 0 0 0 0 0 0
Instruction 4,562,546 782,619 1,287,852 1,518,828 2,386,192 10,538,037
Research 16,572 2,843 4,678 5,517 0 29,609
Public Service 364,650 62,549 102,928 121,389 o 651,516
Academic Support 1,132,024 194,177 319,532 (1,645,733) 0 (0)
Student Services 1,641,351 281,543 463,298 0 (2,386,192) (0)
Institutional Support 1,859,351 318,937 (2,178,288) 0 0 0
Plant Operation
and Maintenance 1,642,668 (1,642,668) 0 0 0 0
Scholarships and
Fellowships 1,497,669 0 0 0 0 1,497,669
Ed & Gen Transfers
to Other Funds 0 0 0 0 0 0
TOTAL EDUCATION
AND GENERAL 12,716,831 0 (0) 0 0 12,716,831
SCHEDULE B
INSTRUCTIONAL COSTS ANALYSIS
Appropriated All Funds
Total Calculated Academic Year Calculated Direct Cost Of Full Cost Of
Appropriated Estimated Equivalent Appropriated Instruction Instruction
Instructional Full Cost Of FTE FTE Student/ Per FTE Per FTE
Expenditures Instruction Students Faculty Ratio Student Student
REGULAR INSTRUCTION
(1) (2) (3) (4) (5) (6)
1. Vocatio...:1 Education 1,063,574 2,174,140 335 12.3 3,171 6,482
2. Lower Division 2,909,005 8,363,897 1,647 20.5 1,766 5,077
3. Upper Division 0 0 0 0.0
4. Basic Graduate 0 0 0 0.0 0 0
5. Advanced Graduate 0 0 0 0.0 0 0
6. TOTAL 3,972,579 10,538,037 1,983 18.4 2,003 5,315
OTHER INSTRUCTIONAL ACTIVITIES
TOTAL INSTRUCTION 3,972,579 10,538,037
19

USHE APPROPRIATED FUNDS COST STUDY
1.
2.
3.
4.
5.
6.
7.
8.
9.
10.
11.
DIXIE COLLEGE
1991-92
SCHEDULE A
ANALYSIS OF FULL COSTS
EDUCATIONAL AND GENERAL
Appropriated
Direct
Expenditures
(1)
$
Physical
Plant
(2)
$
School of Medicine 0 0
Instruction 4,348,389 884,445
Research 0 0
Public Service 148,955 30,297
Academic Support 765,889 155.779
Student Services 1,458,672 296,688
Institutional Support 1,377,283 280,134
Plant Operation
and Maintenance 1,647,343 (1,647,343)
Scholarships and
Fellowships 15,100 0
Ed & Gen Transfers
to Other Funds 63,680 o
TOTAL EDUCATION
AND GENERAL 9,825,311 (0)
A.
B.
C.
Allocations From
Institutional
Support
SCHEDULE B
(3)
$
0
1,072,180
0
36,728
188,845
359,664
(1,657,417)
INSTRUCTIONAL COSTS ANALYSIS
REGULAR INSTRUCTIOHN
Total
Appropriated
Instructional
Expenditures
(1)
Calculated
Estimated
Full Cost Of
Instruction
(2)
1. Vocational Education 1,419,449 2,618,815
2. Lower Division 2,760,688 6,507,614
3. Upper Division 0
4. Basic Graduate 0 0
5. Advanced Graduate 0 0
6. TOTAL 4,180,137 9,126,429
OTHER INSTRUCTIONAL ACTIVITIES 168,252 367,342
TOTAL INSTRUCTION 4,348,389 9,493,770
2 0
0
0
0
0
Academic Year
Equivalent
FTE
Students
08-Jan-93 1
Academic
Support
(4)
$
Student
Services
(5)
$
Appropriated
Full Cost
(6)
$
0 0 0
1,073,732 2,115,024 9,493,770
0 0 0
36,781 0 252,761
(1,110,513) 0 (0)
0 (2,115,024) 0
0 0 0
0 0 0
0 0 15,100
o o 63,680
0 0 9,825,311
Calculated
Appropriated
FTE Student/
Faculty Ratio
Appropriated
Direct Cost Of
Instruction
Per FTE
Student
Appropriated
Full Cost Of
Instruction
Per FTE
Student
(3) (4) (5) (6)
557 14.8 2,549 4,702
1,740 23.7 1,587 3,740
0 0.0 0 0
0 0.0 0
0.0 0 0
2,297 20.7 1,C2C 3,973
,5 G

IIIUSHEALL FUNDS COST STUDY 08-Jan-93
1. School of Medicine
2. Instruction
3. Research
4. Public Service
5. Academic Support
6. Student Services
7. Institutional Support
8. Plant Operation
and Maintenance
9. Scholarships and
IFellowships
10. Ed & Gen Transfers
to Other Funds
TOTAL EDUCATION
AND GENERAL
DIXIE COLLEGE
1991-92
SCHEDULE A
ANALYSIS OF FULL COSTS
EDUCATIONAL AND GENERAL
Allocations From
All Funds
Direct
Expenditures
(1)
Physical
Plant
(2)
Institutional
Support
(3)
0
Academic
Support
(4)
Student
Services
(5)
Appropriated
Full Cost
(6)
5,468,428 901,639 1,145,613. 1,194,667 2,150,366 10,860,713
0
655,230 108,035 137,268 143,146 0 1,043,679
973,396 160,494 203,922 (1,337,813)
1,564,612 257,974 327,780 0 (2,150,366) (0)
1,557,742 256,842 (1,814,584)
1,684,984 (1,684,984) 0 0 0 0
2,512,337 0 0 0 2,512.337
(153,001) 0 0 0 (153,001)
14,263,728 (0) (0) (0) 0 14,263,728
SCHEDULE B
INSTRUCTIONAL COSTS ANALYSIS
Appropriated All Funds
Total Calculated Academic Year Calculated Direct Cost Of Full Cost Of
Appropriated Estimated Equivalent Appropriated Instruction Instruction
Instructional Full Cost Of FTE FTE Student/ Per FTE Per FTE
Expenditures Instruction Students Faculty Ratio Student Student
REGULAR INSTRUCTIOHN
(1) (2) (3) (4) (5) (6)
1. Vocational Education 1,419,449 2,937,444 557 14.8 2,549 5,274
2. Lower Division 2,760,688 7,503,037 1,740 23.7 1,587 4,312
3. Upper Division 0.0
4. Basic Graduate 0.0
5. Advanced Graduate 0.0
6. TOTAL 4,180,137 10,440,481 2,297 20.7 1,820 4,545
OTHER INSTRUCTIONAL ACTIVITIES 168,252 420,233
TOTAL INSTRUCTION 4,348,389 10,860,713
2572 1
1

USHE APPROPRIATED FUNDS COST STUDY
COLLEGE OF EASTERN UTAH
1991-92
SCHEDULE A
ANALYSIS OF FULL COSTS
EDUCATIONAL AND GENERAL
Allocations From
08-Jan-93
Appropriated
Direct
Expenditures
(1)
Physical
Plant
(2)
Institutional
Support
(3)
Academic
Support
(4)
$
Student
Services
(5)
$
Appropriated
Full Cost
(6)
$
1. School of Medicine 0 0 o o o
2. Instruction 3,619,301 613,320 1,117,050 1,382,324 1,686,449 8,418,444
3. Research 0 0 0 o o o
4. Public Service 0 0 0 o o o
5. Academic Support 935,206 158,478 288,639 (1,382,324) o (0)
6. Student Services 1,140,961 193,345 352,143 0 (1,686,449) (0)
7. Institutional Support 1,503,117 254,715 (1,757,832) o o 0
8. Plant Operation
and Maintenance 1,219,859 (1,219,859) 0 0 0 0
9. Scholarships and
Fellowships 152,126 0 0 0 0 152,1'6
10. Ed & Gen Transfers
to Other Funds 184,571 0 0 0 0 184,571
11. TOTAL EDUCATION
AND GENERAL 8,755,141 0 (0) 0 0 8,755,141
SCHEDULE 8
INSTRUCTIONAL COSTS ANALYSIS
Appropriated Appropriated
Total Calculated Academic Year Calculated Direct Cost Of Full Cost Of
Appropriated Estimated Equivalent Appropriated Instruction Instruction
Instructional Full Cost Of FTE FTE Student/ Per FTE Per FTE
Expenditures Instruction Students Faculty Ratio Student Student
A. REGULAR INSTRUCTION
(1) (2) (3) (4) (5) (6)
1. Vocational Education 1,723,249 3,407,404 597 14.9 2,887 5,709
2. Lower Division 1,895,052 5,011,040 1,104 21.3 1,718 4,539
3. Upper Division 0 0 0.0
4. Basic Graduate 0 0 0.0 0
5. Advanced Graduate 0 0.0
6. TOTAL 3,619,301 8,418,444 1,701 18.5 2,128 4,950
B. OTHER iNSTRUCTIONAL ACTIVITIES 0
C. TOTAL INSTRUCTION 3,619,301 8,418,444
2 5
2 2

1
1
USHE ALL FUNDS COST STUDY 08-Jan-93
1. School of Medicine
2. Instruction
3. Research
4. Public Service
5. Academic Support
6. Student Services
7. Institutional Support
8. Plant Operation
and Maintenance
Scholarships and
11Fellowships
10. Ed & Gen Transfers
to Other Funds
TOTAL EDUCATION
AND GENERAL
COLLEGE OF EASTERN UTAH
1991-92
SCHEDULE A
ANALYSIS OF FULL COSTS
EDUCATIONAL AND GENERAL
Allocations From
All Funds
Direct
Expenditures
(1)
Physical
Plant
(2)
Institutional
Support
(3)
$
Academic
Support
(4)
$
Student
Services
(5)
$
Appropriated
Full Cost
(6)
$
0 0 0 0 0 0
4,842,175 615,776 1,171,667 1,403,216 2,949,987 10,982,820
0 0 0 0 0 0
2,050 261 496 594 0 3,401
1,025,322 130,389 248,098 (1,403,810) 0 0
2,154,627 274,002 521,358 0 (2,949,987) (0)
1,722,562 219,057 (1,941,619) 0 0 0
1,239,485 (1,239,485) 0 0 0 0
2,204,919 0 0 0 0 2,204,919
284,786 0 0 0 0 284,786
13,475,926 0 (0) 0 0 13,475,926
SCHEDULE B
INSTRUCTIONAL COSTS ANALYSIS
Appropriated All Funds
Total Calculated Academic Year Calculated Direct Cost Of Full Cost Of
Appropriated Estimated Equivalent Appropriated Instruction Instruction
Instructional Full Cost Of FTE FTE Student/ Per FTE Per FTE
Expenditures Instruction Students Faculty Ratio Student Student
I A. REGULAR INSTRUCTION
1. Vocational Education
2. Lower Division
3. Upper Division
4. Basic Graduate
5. Advanced Graduate
16.
6. TOTAL
OTHER INSTRUCTIONAL ACTIVITIES
TOTAL INSTRUCTION
(1) (2) (3) (4) (5) (6)
1,723,249 4,307,316 597 14.9 2,887 7,217
1,896,052 6,675,504 1,104 21.3 1,718 6,047
0 0 0 0.0 0 0
0 0 0 0.0 0 0
0 0 0 0.0 0 0
3,619,301 10,982,820 1,701 18.5 2,128 6,457
0
3,619,301 10,982,820
2 5 32 3

USHE APPROPRIATED FUNDS COST STUDY
UTAH VALLEY COMMUNITY COLLEGE
1991-92
SCHEDULE A
ANALYSIS OF FULL COSTS
EDUCATION AND GENERAL
Allocations From
08-Jan-93
Appropriated
Direct
Expenditures
(1)
$
Physical
Plant
(2)
$
Institutional
Support
(3)
$
Academic
Support
(4)
$
Student
Services
(5)
$
Appropriated
Full Cost
(6)
$
1. School of Medicine 0 0 0 0 0 0
2. Instruction 12,526,025 2,069,374 3,489,863 3,501,631 3,050,332 24,637,225
3. Research 0 0 0 0 0 0
4. Public Service 0 0 0 0 0 0
5. Academic Support 2,425,263 400,668 675,700 (3,501,631) 0 0
6. Student Services 2,112,689 349,029 588,614 0 (3,050,332) (0)
8. Institutional Support 4,080,117 674,060 (4,754,177) 0 0 (0)
9. Plant Operation
and Maintenance 3,493,131 (3,493,131) 0 0 0 0
10. Scholarships and
Fellowships 0 0 0 0 0 0
11. Ed & Gen Transfers
to Other Funds 0 0 0 0 0 0
12. TOTAL EDUCATION
AND GENERAL 24,637,225 0 0 0 0 24,637,225
Total
Appropriated
Instructional
Expenditures
SCHEDULE B
INSTRUCTIONAL COSTS ANALYSIS
Calculated
Estimated
Full Cost Of
Instruction
Academic Year
Equivalent
FTE
Students
Calculated
Appropriated
FTE Student/
Faculty Ratio
Appropriated
Direct Cost Of
Instruction
Per FTE
Student
Appropriated
Full Cost Of
Instruction
Per FTE
Student
A. REGULAR INSTRUCTION
(1)
$
(2)
$
(3) (4) (5)
$
(6)
$
1. Vocational Education 7,026,809 11,234,417 2,371 14.4 2,963 4,738
2. Lower Division 5,403,712 13,214,963 4,402 24.2 1,228 3,002
3. Upper Division 0 0 0 0.0 0 0
4. Basic Graduate 0 0 0 0.0 0 0
5. Advanced Graduate 0 0 o 0.0 0 0
6. TOTAL 12,430,521 24,449,380 6,773 19.5 1,835 3,610
B. OTHER INSTRUCTIONAL ACTIVITIES 95,504 187,845
C. TOTAL INSTRUCTION 12,526,025 24,637,225
2 6 1 )
2 4

1
1
USHE ALL FUNDS COST STUDY 08-Jan-93
1. School of Medicine
2. Instruction
3. Research
4. Public Service
5. Academic Support
6. Student Services
8. Institutional Support
9. Plant Operation
and Maintenance
10. Scholarships and
Fellowships
11. Ed & Gen Transfers
to Other Funds
12. TOTAL EDUCATION
AND GENERAL
1.
IC
UTAH VALLEY COMMUNITY COLLEGE
1991-92
SCHEDULE A
ANALYSIS OF FULL COSTS
EDUCATION AND GENERAL
Allocations From
All Funds
Direct
Expenditures
(1)
$
Physical
Plant
(2)
$
Institutional
Support
(3)
$
Academic
Support
(4)
$
Student
Services
(5)
$
Appropriated
Full Cost
(6)
$
0 0 0 0 0 0
14,107,915 1,896,530 4,430,646 4,374,999 4,667,752 29,477,842
0 0 0 0 0 0
0 0 0 0 0 0
3,020,398 406,033 948,568 (4,374,999) 0 0
3,222,508 433,203 1,012,041 0 (4,667,752) (0)
5,633,890 757,365 (6,391,255) 0 0 0
3,493,131 (3,493,131) 0 0 0 0
6,139,519 0 0 0 0 6,139,519
92,810 0 0 0 0 92,810
35,710,171 0 0 0 0 35,710,171
SCHEDULE B
INSTRUCTIONAL COSTS ANALYSIS
Appropriated All Funds
Total Calculated Academic Year Calculated Direct Cost Of Full Cost Of
Appropriated Estimated Equivalent Appropriated Instruction Instruction
instructional Full Cost Of FTE FTE Student/ Per FTE Per FTE
Expenditures Instruction Students Faculty Ratio Student Student
REGULAR INSTRUCTION
1. Vocational Education
2. Lower Division
3. Upper Division
4. Basic Graduate
5. Advanced Graduate
6. TOTAL
OTHER INSTRUCTIONAL ACTIVITIES
TOTAL INSTRUCTION
(1) (2) (3) (4) (5) (6)
7,026,809 12,916,118 2,371 14.4 2,963 5,447
5,403,712 16,336,971 4,402 24.2 1,228 3,711
0 0 0 0.0 0 0
0 0 0 0.0 0 0
0 0 0 0.0 0 0
12,430,521 29,253,090 6,773 19.5 1,835 4,319
95,504 224,752
12,526,025 29,477,842
2261

USHE APPROPRIATED FUNDS COST STUDY 08-Jan-93
SALT LAKE COMMUNITY COLLEGE
[Excluding Skill Center]
1991-92
SCHEDULE A
ANALYSIS OF FULL COSTS
EDUCATION AND GENERAL
Allocations From
Appropriated
Direct
Expenditures
(1)
Physical
Plant
(2)
$
Institutional
Support
(3)
$
Academic
Support
(4)
$
Student
Services
(5)
$
Appropriated
Full Cost
(5)
1. School of Medicine 0 0 0 0 0 0
2. Instruction 20,685,305 3,100,962 5,841,853 3,559,014 4,518,443 37,705,577
3. Research 0 0 o o o 0
4. Public Service 0 o 0 o o 0
5. Academic Support 2,484,778 372,496 701,740 (3,559,014) 0 (0)
6. Student Services 3,154,617 472,913 890,913 0 (4,518,443) (0)
7. Institutional Support 6,465,286 969,220 (7,434,506) 0 0 0
8. Plant Operation
and Maintenance 4,915,591 (4,915,591) o 0 0 0
9. Scholarships and
Fellowships 55,762 0 o o o 55,762
10. Ed & Gen Transfers
to Other Funds 0 o o o 0
11. TOTAL EDUCATION
AND GENERAL 37,761,339 0 (0) 0 0
37,761,339
Total
Appropriated
Instructional
Expenditures
SCHEDULE B
INSTRUCTIONAL COSTS ANALYSIS
[Excluding Skill Center]
Calculated
Estimated
Full Cost Of
Instruction
Appropriated
Academic Year Calculated Direct Cost Of
Equivalent Appropriated Instruction
FTE FTE Student/ Per FTE
Students Faculty Ratio Student
Appropriated
Full Cost Of
Instruction
Per FTE
Student
A. REGULAR INSTRUCTION
(1) (2) (3) (4) (5) (5)
1. Vocational Education 13,106,601 19,904,286 4,169 14.4 3,144 4,774
2. Lower Division 7,190,040 17,092,826 6,074 27.7 1,184 2,814
3. Upper Division 0 0 0 0.0 0 0
4. Basic Graduate 0 0 0 0.0 0 0
5. Advanced Graduate 0 0 0 0.0 0 0
6. TOTAL 20,296,641 36,997,113 10,243 20.2 1,982 3,612
B. OTHER THSTRUCTIONAL ACTIVITIES 388,664 708,464
C. TOTAL INSTRUCTION 20,685,305 37,705,577
9622 6

1
USHE ALL FUNDS COST STUDY 08-Jan-93
1. School of Medicine
2. Instruction
3. Research
4. Public Service
5. Academic Support
6. Student Services
7. Institutional Support
8. Plant Operation
and Maintenance
9. Scholarships and
IFellowships
10. Ed & Gen Transfers
to Other Funds
TOTAL EDUCATION
AND GENERAL
1REGULAR INSTRUCTION
1. Vocational Education
2. Lower Division
3. Upper Division
4. Basic Graduate
5. Advanced Graduate
6. TOTAL
IIIB. OTHER INSTRUCTIONAL ACTINITIES
IC. TOTAL INSTRUCTION
SALT LAKE COMMUNITY COLLEGE
[Excluding Skill Center]
1991-92
SCHEDULE A
ANALYSIS OF FULL COSTS
EDUCATION AND GENERAL
Allocations From
All Funds
Direct
Expenditures
(1)
$
Physical
Plant
(2)
$
Institutional
Support
(3)
$
Academic
Support
(4)
$
Student
Services
(5)
$
Appropriated
Full Cost
(6)
0 0 0 0 0 0
22,720,122 3,144,501 6,315,231 4,568,556 7,303,088 44,051,498
0 0 0 0 0
0 0 0 0 0 0
3,225,563 446,423 896,570 (4,568,556) 0 (0)
5,156,240 713,632 1,433,216 0 (7,303,088) (0)
7,593,996 1,051,021 (8,645,017) 0 0 (0)
5,355,577 (5,355,577) 0 0 0
7,752,973 0 0 0 0 7,752,973
250,811 0 0 0 0 250,811
52,055,282 0 (0) 0 0
52,055,282
SCHEDULE B
INSTRUCTIONAL COSTS ANALYSIS
[Excluding Skill Center]
Appropriated All Funds
Total Calculated Academic Year Calculated Direct Cost Of Full Cost Of
Appropriated Estimated Equivalent Appropriated Instruction Instruction
Instructional Full Cost Of FTE FTE Student/ Per FTE Per FTE
Expenditures Instruction Students Faculty Ratio Student Student
(1) (2) (3) (4) (5) (6)
13,106,601 22,438,768 4,169 14.4 3,144 5,382
7,190,040 20,785,029 6,074 27.7 1,184 3,422
0 0 0 0.0 0 0
0 0 0.0 0 0
0 0 0.0 0 0
20,296,641 43,223,798 10,243 20.2 1,982 4,220
388,664 827,700
20,685,305 44,051,498
2 7

J. S
taffi
ng

TAB JSTAFFINGT I
TABLE 1 USHE Education and General Salaried Personnel 1
TABLE 2 USHE Summary of Faculty Positions and Average Faculty SalaryEducation and General 1991-92 and 1992-93 3
TABLE 3 USHE Faculty Salaries in Constant and Current DollarsEducation and General 5
TABLE 4 USHE Total Benefits as a Percentage of TotalSalaries and Wages 6
2 ti

Utah System ofHigher Education
University of Utah
TABLE 1Education and General Salaried Personnel
Full-Time-Equivalent (FTE) Positionsfor 1985-86 through 1992-93
1985-86 1986-87 1987-88
FTE % of Total FTE % of Total FTE % of Total
Page 1 of 2
1988-89FTE % of Total
Regular Faculty 930.0 31.96% 938.0 33.09% 913.0 33.10% 868.8 32.07%
Wage Rated Faculty# 179.8 6.184 147.7 5.21% 153.2 5.55% 146.7 5.42%
Teaching Assistants 293.8 10.09% 237.9 8.39% 220.7 8.00% 220.5 8.14;
Executive 87.3 3.00% 94.4 3.33% 91.5 3.32% 91.0 3.36%
Staff 1,419.2 48.77% 1,416.8 49.98% 1,380.2 50.03% 1,382.0 51.01%
Total 2,910.0 100.00% 2,834.7 100.00% 2,758.6 100.00% 2,709.0 100.00%
Utah State University*Regular Faculty 526.5 39.31% 505.5 37.71% 493.1 36.75% 503.0 37.90%
Wage Rated Faculty# 25.3 1.89% 44.2 3.30% 41.7 3.11% 35.8 2.70%
Teaching Assistants 21.3 1.1"..! 18.9 1.41% 38.7 2.89% 29.1 2.19%
Executive 48.3 3.61% 49.7 3.70% 51.2 3.81% 51.1 3.85%
Staff 718.0 53.61% 722.4 53.89% 717.0 53.44% 708.4 53.37%
Total 1,339.4 100.00% 1,340.7 100.00% 1,341.8 100.00% 1,327.2 100.00%
Weber State UniversityRegular Faculty 356.0 41.25% 337.4 39.56% 359.1 42.67% 360.5 42.44%
Wage Rated Faculty0 37.0 4.29% 49.4 5.79% 50.1 5.95% 54.6 6.43%
Executive 61.1 7.08% 61.0 7.15% 50.0 5.94% 46.7 5.50%
Staff 408.9 47.38% 405.1 47.50% 382.4 45.44% 387.6 45.63%
Total 863.1 100.00% 852.9 100.00% 841.6 100.00% 849.4 100.00%
Southern Utah UniversityRegular Faculty 124.6 49.38% 123.9 46.82% 113.0 42.98% 115.4 41.95%
Wage Rated Faculty# 0.0 0.00% 0.0 0.00% 12.4 4.72% 15.2 5.51%
Executive 17.6 6.98% 18.2 6.87% 18.3 6.96% 18.6 6.76%
Staff 110.1 43.64% 122.6 46.31% 119.2 45.34% 125.9 45.784
Total 252.4 100.00% 264.7 100.00% 262.9 100.00% 275.0 100.00%
Snow CollegeRegular Faculty 62.0 47.89% 61.0 47.06% 55.6 42.90% 57.6 43.02%
Wage Rated Faculty# 0.0 0.00% 0.0 0.00% 7.0 5.39% 7.0 5.23%
Executive 8.1 6.26% 8.1 6.26% 8.1 6.26% 8.1 6.05%
Staff 59.4 45.84% 60.5 46.684 58.9 45.44% 61.2 45.71%
Total 129.5 100.00% 129.6 100.00% 129.5 100.00% 133.9 100.00%
Dixie CollegeRegular Faculty 63.6 38.20% 67.2 38.91% 63.2 37.77% 67.3 38.39%
Wage Rated Faculty# 11.9 7.16% 11.9 6.89% 15.9 9.50% 15.2 8.65%
Executive 11.1 6.67% 10.7 6.21% 10.0 6.00% 10.1 5.77%
Staff 79.9 47.97% 82.9 47.99% 78.1 46.73% 82.8 47.19%
Total 166.5 100.00% 172.7 100.00% 167.2 100.00% 175.4 100.00%
College of Eastern UtahRegular Faculty 46.1 39.54% 47.0 40.02% 47.7 43.96% 45.0 41.69%
Wage Rated Faculty# 7.2 6.20% 8.5 7.24% 6.0 5.53% 5.6 5.17%
Executive 6.7 5.76% 7.5 6.37% 7.3 6.76% 7.2 6.68%
Staff 56.5 48.50% 54.4 46.37% 47.5 43.75% 50.1 46.46%
Total 116.6 100.00% 117.3 100.00% 108.6 100.00% 107.8 100.00%
Utah Valley Comm. CollegeRegular Faculty 179.0 43.984 175.4 42.77% 163.1 39.81% 161.8 39.01%
Wage Rated Faculty# 60.0 14.74% 57.5 14.02% 59.8 14.60% 63.8 15.384
Executive 23.0 5.65% 23.0 5.61% 21.5 5.25% 21.7 5.23%
Staff 145.0 35.63% 154.2 37.60% 165.3 40.35% 167.5 40.384
Total 407.0 100.00% 410.1 100.00% 409.7 100.00% 414.8 100.00%
Salt Lake Comm. CollegeRegular Faculty 179.7 41.89% 176.9 39.95% 171.6 39.86% 173.2 36.46%
Wage Rated Faculty# 66.6 15.51% 71.2 16.09% 80.4 18.67% 99.8 21.01%
Executive 16.0 3.73% 16.0 3.61% 16.0 3.72% 16.3 3.43%
Staff 166.8 38.87% 178.6 40.34% 162.5 37.76% 185.7 39.09%
Total 429.0 100.00% 442.8 100.00% 430.5 100.00% 475.0 100.00%
Nine Institution Total
Regular Faculty 2,467.5 37.31% 2,432.3 37.05% 2,379.4 36.89% 2,352.5 36.37%
Wage Rated Faculty# 387.8 5.86% 390.4 5.95% 426.5 6.61% 443.6 6.86%
Teaching Assistants 315.1 4.76% 256.8 3.91% 259.4 4.02% 249.6 3.86%
Executive Staff 279.3 4.22% 288.5 4.39% 274.0 4.25% 270.8 4.19%
Staff 3,163.8 47.84% 3,197.5 48.70% 3,111.1 48.23% 3,151.2 48.72%
Total 6,613.5 100.00% 6,565.4 100.00% 6,450.3 100.00% 6,467.7 100.00%
*Cooperative Masters with SUU included in USU figures for 1985-86 and thereafter.#Calculation of Wage-Rated FTE changed significantly beginning 1990-91.
1
A.,) 6 7

Utah System ofHigher Education
University of Utah
TABLE 1 (Cont.)Education and General Salaried Personnel
Full-Time-Equivalent (FTE) Positionsfor 1985-86 through 1992-93
1989-90 1990-91 1991-92
FTE % of Total FTE % of Total FTE % of Total
Page 2 of 2
1992-93 Budget BudgetFTE % of Total Change
Regular Faculty 869.9 32.17% 921.2 33.55% 896.7 32.25% 1,007.4 34.28% 110.7
Wage Rated Faculty# 144.4 5.34% 140.1 5.10% 131.4 4.73% 116.0 3.95% (15.4)
Teaching Assistants 221.0 8.17% 220.9 8.04% 245.5 8.83% 233.8 7.96% (11.7)
Executive 88.3 3.26% 88.6 3.23% 91.1 3.28% 94.0 3.20% 2.9
Staff 1,380.6 51.05% 1,375.2 50.084 1,415.6 50.92% 1,487.3 50.61% 71.7
Total 2,704.2 100.00% 2,746.0 100.00% 2,780.3 100.00% 2,938.5 100.00% 158.2
Utah State University*Regular Faculty 489.1 37.45% 488.7 36.12% 502.9 36.48% 569.8 37.02% 67.0
Wage Rated Faculty# 34.7 2.65% 47.3 3.50% 43.8 3.18% 49.8 3.24% 6.0
Teaching Assistants 26.9 2.06% 41.8 3.09% 26.5 1.92% 32.9 2.13% 6.4
Executive 51.5 3.94% 52.5 3.88% 53.9 3.91% 55.4 3.60% 1.5
Staff 704.0 53.90% 722.7 53.42% 751.4 54.51% 831.3 54.01% 79.9
Total 1,306.1 100.00% 1,353.0 100.00% 1,378.3 100.00% 1,539.2 100.00% 160.9
Weber State UniversityRegular Faculty 377.2 42.59% 390.7 39.34% 407.5 39.10% 411.0 36.88% 3.5
Wage Rated Faculty# 54.8 6.19% 91.4 9.20% 101.3 9.72% 115.3 10.35% 14.0
Executive 48.0 5.42% 49.7 5.00% 51.4 4.93% 51.6 4.63% 0.2
Staff 405.7 45.81% 461.3 46.45% 481.9 46.24% 536.5 48.14% 54.6
Total 885.7 100.00% 993.1 100.00% 1,042.1 100.00% 1,114.4 100.00% 72.3
Southern Utah UniversityRegular Faculty 118.8 39.73% 129.0 39.41% 132.7 38.85% 144.7 40.27% 12.0
Wage Rated Faculty# 26.5 8.86% 28.8 8.80% 33.8 9.89% 18.5 5.15% (15.3)
Executive 18.2 6.09% 20.0 6.11% 20.8 6.09% 21.2 5.90% 0.4
Staff 135.5 45.33% 149.5 45.684 154.3 45.17% 174.9 48.68% 20.6
Total 299.0 100.00% 327.3 100.00% 341.6 100.00% 359.3 100.00% 17.7
Snow CollegeRegular Faculty 58.0 40.85% 64.0 33.84% 69.0 34.02% 72.0 35.42% 3.0
Wage Rated Faculty# 8.8 6.20% 33.7 17.82% 39.6 19.52% 34.5 16.95% (5.1)
Executive 7.6 5.35% 8.4 4.44% 7.9 3.90% 7.9 3.89% 0.0
Staff 67.6 47.61% 83.0 43.89% 86.3 42.57% 88.9 43.74% 2.5
Total 142.0 100.00% 189.1 100.00% 202.8 100.00% 2v3.2 100.00% 0.4
Dixie CollegeRegular Faculty 68.5 37.61% 67.3 32.22% 69.7 32.08% 79.7 37.58% 10.0
Wage Rated Faculty# 17.5 9.59% 40.5 19.35% 45.2 20.804 24.0 11.32% (21.2)
Executive 10.1 5.56% 10.5 5.02% 9.5 4.37% 11.4 5.37% 1.9
Staff 86.0 47.23% 90.7 43.1% 92.9 42.75% 97.0 45.73% 4.1
Total 182.1 100.00% 209.0 100.00% 217.3 100.00% 212.1 100.00% (5.2)
College of Eastern UtahRegular Faculty 52.7 44.55% 55.5 41.02% 57.2 39.97% 58.4 40.14% 1.2
Wage Rated Faculty#Executive
8.16.7
6.85%5.66%
17.36.7
12.79%4.95%
15.26.7
10.62%4.68%
13.05.7
8.93%3.92% H.8
Staff 50.8 42.94% 55.8 41.24% 64.0 44.72% 68.4 47.01% 4.4
Total 118.3 100.00% 135.3 100.00% 143.1 100.00% 145.5 100.00% 2.4
Utah Valley Comm. CollegeRegular Faculty 166.2 36.20% 179.6 32.18% 185.5 30.97% 210.0 31.24% 24.5
Wage Rated Faculty# 80.8 17.60% 149.1 26.72% 170.2 28.41% 202.5 30.12% 32.3
Executive 23.2 5.05% 13.1 2.35% 13.7 2.29% 13.4 1.99% (0.3)
Staff 188.9 41.15% 216.3 38.76% 229.6 38.33% 246.4 36.65% 16.8
Total 459.1 100.00% 558.1 100.00% 599.0 100.00% 672.3 100.00% 73.3
Salt Lake Comm. CollegeRegular Faculty 188.8 36.31% 210.0 30.32% 253.3 28.30% 282.7 32.64% 29.4
Wage Rated Faculty# 113.3 21.79% 230.0 33.21% 296.8 33.16% 203.7 23.52% (93.1)
Executive 15.0 2.89% 14.5 2.09% 16.0 1.79% 16.0 1.85% 0.0
Staff 202.8 39.01% 238.1 34.38% 328.9 36.75% 363.7 41.9% 34.8
Total 519.9 100.00% 692.6 100.00% 895.0 100.00% 866.1 100.00% (28.9)
Nine Institution Total
Regular Faculty 2,389.2 36.11% 2,506.0 34.79% 2,574.5 33.884 2,835.7 35.22% 261.2
Wage Rated Faculty# 488.8 7.39% 778.2 10.80% 877.3 11.54% 777.3 9.65% (100.0)
Teaching Assistants 247.9 3.75% 262.7 3.65% 272.0 3.58% 266.7 3.31% (5.3)
Executive Staff 268.5 4.06% 264.0 3.67% 271.0 3.57% 276.6 3.44% 5.7I
Staff 3,221.9 48.70% 3,392.7 47.10% 3,604.9 47.44% 3,894.4 48.37% 289.5
Total 6,616.3 100.00% 7,203.5 100.00% 7,599.5 100.00% 8,050.6 100.00% 451.1
*Cooperative Masters with SUU included in USU figures for 1985-86 and thereafter.#Calculation of Wage-Rated FTE changed significantly beginning 1990-91.
2e-
A., r)

TABLE 2
UTAH SYSTEM OF HIGHER EDUCATION
SUMMARY OF FACULTY POSITIONS AND AVERAGE FACULTY SALARY
EDUCATION AND GENERAL
1991-92 AND 1992-93
University of Utah
1991-92 Actual
Number % of Average
of FTE Total FTE
Faculty FTE Salary
1992-93 Budgeted
Number % of Average
of FTE Total FTE
Faculty FTE Salary
Professors 388.1 30.484 57,194 401.7 29.60% 58,319
Associate Professors 248.1 19.48% 41,177 250.5 18.46% 42,616
Assistant Professors 211.5 16.61% 36,326 293.1 21.60% 36,767
Instructors & Lecturers 48.9 3.84% 28,057 62.1 4.57% 30,443
Subtotal Regular Faculty 896.7 70.41% 46,250 1,007.4 74.23% 46,426
Wage Rated Instructors 131.4 10.32% 27,580 116.0 8.55% 27,748
Teaching Assistants 245.5 19.284 13,770 233.8 17.23% 13,351
Total Teaching Faculty 1,273.6 100.00% 38,063 1,357.2 100.00% 39,132
Utah State University
Professors 159.6 27.84% 46,850 177.2 27.15% 49,056
Associate Professors 141.3 24.66% 37,420 177.8 27.24% 39,462
Assistant Professors 149.3 26.04% 33,129 160.1 24.53% 35,056
Instructors & Lecturers 52.7 9.20% 25,980 54.8 8.40% 27,490
Subtotal Regular Faculty 502.9 87.75% 37,939 569.8 87.33% 40,056
Wage Rated Instructors 43.8 7.64% 18,011 49.8 7.64% 18,000
Teaching Assistants 26.5 4.62% 19,980 32.9 5.04% 18,806
Total Teaching Faculty 573.1 100.00% 35,588 652.5 100.00% 37,302
Weber State University
Professors 138.3 27.18% 45,895 141.2 26.83% 47,653
Associate Professors 85.5 16.80% 37,548 88.7 16.84% 38,217
Assistant Professors 122.9 24.15% 31,917 133.1 25.29% 33,415
Instructors & Lecturers 60.8 11.95% 25,917 48.0 9.12% 26,483
Subtotal Regular Faculty 407.5 80.09% 36,947 411.0 78.09% 38,533
Wage Rated Instructors 101.3 19.91% 17,999 115.3 21.91% 18,004
Total Teaching Faculty 508.8 100.00% 33,175 526.3 100.00% 34,036
Southern Utah University
Professors 29.7 17.81% 38,381 29.7 18.18% 40,037
Associate Professors 43.6 26.20% 32,720 50.2 30.74% 33,235
Assistant Professors 45.3 27.22% 26,511 52.8 32.32% 27,563
Instructors & Lecturers 14.1 8.45% 24,145 12.1 7.42% 25,129
Subtotal Regular Faculty 132.7 79.69% 30,955 144.7 88.66% 31,884
Wage Rated Instructors 33.8 20.31% 16,189 18.5 11.34% 17,112
Total Teaching Faculty 166.5 100.00% 27,956 163.2 100.00% 30,209
Snow College
Professors 9.7 8.94% 39,715 11.7 10.99% 44,119
Associate Professors 14.4 13.26% 35,705 12.4 11.65% 37,169
Assistant Professors 23.6 21.77% 27,752 23.1 21.73% 30,492
Instructors & Lecturers 21.3 19.57% 26,743 24.8 23.25% 24,618
Subtotal Regular Faculty 69.0 63.54% 30,784 72.0 67.63% 31,838
Wage Rated Instructors 39.6 36.46% 8,149 34.5 32.37% 5,834
Total Teaching Faculty 108.6 100.00% 22,531 106.4 100.00% 23,421

TABLE 2
UTAH SYSTEM OF HIGHER EDUCATION
SUMMARY OF FACULTY POSITIONS AND AVERAGE FACULTY SALARY
EDUCATION AND GENERAL
1991-92 AND 1992-93
Dixie College
Professors
Associate Professors
Assistant Professors
Instructors & Lecturers
1991-92 Actual
Number % of Average
of FTE Total FIE
Faculty FTE Salary -
1992-93 Budgeted
Number % of Average
of FTE Total FTE
Faculty FTE Salary
Subtotal Regular Faculty 69.8 60.70% 30,549 79.7 76.86% 32,083
Wage Rated Instructors 45.2 39.30% 11,931 24.0 23.34% 12,059
fotal Teaching Faculty 115.0 100.00% 23,231 103.7 100.00% 27,448
College of Eastern Utah
Professors
Associate Professors
Assistant Professors
Instructors & Lecturers
Subtotal Regular Faculty 57.3 78.30% 29,254 58.4 81.79% 31,477
Wage Rated Instructors 15.9 21.70% 9,301 13.0 18.21% 17,242
Total Teaching Faculty 73.2 100.00% 24,924 71.4 100.00% 28,885
Utah Valley Community College
Professors
Associate Professors
Assistant Professors
Instructors & Lecturers
Subtotal Regular Faculty 185.5 52.15% 31,298 210.0 50.91% 31,632
Wage Rated Instructors 170.2 47.85% 11,191 202.5 49.09% 11,609
Total Teaching Faculty 355.7 100.00% 21,667 412.5 100.00% 21,803
Salt Lake Community College
Professors
Associate Professors
Assistant Profe-sors
Instructors & Lecturers
Subtotal Regular Faculty 232.3 45.33% 29,757 282.7 58.20% 29,520
Wage Rated Instructors 280.1 54.67% 13,565 203.1 41.80% 13,038
Total Teaching Faculty 512.4 100.00% 20,906 485.8 100.00% 22,630
°
4

1969 Actual
TABLE 3
UTAH SYSTEM OF HIGHER EDUCATION
FACULTY SALARIES IN CONSTANT AND CURRENT DOLLARS
EDUCATION AND GENERAL
1978-79 Actual 1988-89 Actual 1990-91 Actual 1991-92
Ave. FTE
Salary
University of Utah
Ave. FTE
Salary
in 1992
Dollars*
Ave. FTE
Salary
Ave. FTE
Salary
in 1992
Dollars*
Avg. FTE
Salary
Ave. FTE
Salary
in 1992
Dollars*
Avg. FTE
Salary
Ave. FTE
Salary
in 1992
Dollars*
Avg. FTE
Salary
Professors 16,253 61,391 28,554 53,013 47,729 56,404 53,434 56,868 57,194
Assoc. Professors 12,840 48,499 21,199 39,358 35,246 41,651 39,750 42,305 41,177
Assist. Professors 11,065 41,795 17,518 32,524 30,102 35,573 34,834 37,073 36,326
Instructors & Lecturers 9,223 34,837 14,282 26,516 21,015 24,834 26,610 28,320 28,057
Weighted Average 13,450 50,803 22,622 42,000 38,976 46,059 43,975 46,801 46,250
Utah State University
Professors 14,732 55,646 25,068 46,541 40,950 48,392 45,142 48,044 46,850
Assoc. Professors 12,228 46,187 20,111 37,338 32,580 38,501 35,838 38,141 37,420
Assist. Professors 10,513 39,710 16,877 31,334 27,753 32,797 31,504 33,529 33,129
Instructors & Lecturers 8,078 30,512 12,980 24,098 22,357 26,420 25,372 27,003 25,980
Weighted Average 17,139 45,851 20,098 37,314 33,065 39,074 36,740 39,101 37,939
Weber State University
Professors 13,969 52,764 22,440 41,662 40,678 48,071 44,220 47,062 45,895
Assoc. Professors 11,468 43,317 18,805 34,913 32,136 37,977 35,937 38,247 37,548
Assist. Professors 9,166 34,622 16,383 30,416 28,613 33,813 30,949 32,938 31,917
Instructors & Lecturers 8,161 30,826 14,431 26,792 22,558 26,658 25,007 26,614 25,917
Weighted Average 11,047 41,727 18,533 34,408 32,646 38,579 35,447 37,725 36,947
Southern Utah University
Professors 13,487 50,943 22,004 40,852 34,357 40,601 37,742 40,168 38,381
Assoc. Professors 11,032 41,670 17,521 32,529 28,595 33,792 31,122 33,122 32,720
Assist. Professors 8,748 33,043 14,864 27,596 23,718 28,029 25,912 27,577 26,511
Instructors & Lecturers 7,282 27,505 12,248 22,739 21,947 25,935 22,564 24,014 24,145
Weighted Average 10,241 38,682 16,769 31,133 27,717 32,754 29,461 31,355 30,955
Snow College
Professors 20,884 38,773 32,939 38,925 40,777 43,398 39,715
Assoc. Professors 18,355 34,078 31,478 37,199 35,444 37,722 35,705
Assist. Professors 15,397 28,586 25,810 30,501 27,447 29,211 27,752
Instructors & Lecturers 13,059 24,245 23,678 27,981 22,831 24,298 26,743
Weighted Average 9,233 34,875 15,657 29,069 27,849 32,910 29,449 31,342 30,784
Dixie College
Total Regular Faculty 9,417 35,570 16,005 29,715 26,231 30,998 29,737 31,648 30,549
College of Eastern Utah
Total Regular Faculty 9,565 36,129 15,929 29,574 25,520 30,158 28,751 30,599 29,254
Utah Valley Community College
Total Regular Faculty 8,807 33,266 15,400 28,591 27,706 32,741 30,620 32,588 31,298
Salt Lake Community College
Weighted Average 9,018 34,063 15,631 29,020 26,700 31,553 28,980 30,843 29,757
*December CPI (1982-82-100) used to conpute real dollars:
1969-37.7; 1979-76.7; 1989..126.1; 1991-137.9; 1992-142.4 (Est.)

TABLE 4
Utah System of Higher Education
Total Benefits as a Percentage of
Total Salaries and Wages
Budget
1978-79 1985-86 1986-87 1987-88 1988-89 1989-90 1990-91 1991-92 1992-93
University of Utah 18.96% 24.48% 24.76% 25.53% 26.25% 26.76% 27.77% 29.14% 28.76%
Utah State University 20.58% 25.55% 26.07% 25.96% 28.21% 29.54% 31.33% 32.24% 30.64%
Weber State University 22.49% 29.17% 28.98% 29.61% 29.90% 30.83% 30.97% 31.91% 34.47%
Southern Utah University 23.90% 27.99% 28.60% 29.66% 31.54% 32.58% 33.41% 34.78% 35.82%
Snow College 23.61% 30.67% 29.98% 31.02% 32.78% 35.06% 36.25% 38.72% 39.93%
Dixie College 26.79% 27.81% 27.62% 28.74% 31.63% 33.06% 33.78% 36.11% 36.13%
College of Eastern Utah 22.63% 27.38% 26.62% 27.56% 30.32% 33.484 33.94% 35.104 33.92%
Utah Valley Comm. College 24.99% 28.38% 27.37% 28.14% 30.25% 31.33% 33.53% 35.77% 36.16%
Salt Lake Comm. College 23.14% 28.18% 29.98% 31.98% 30.10% 30.96% 31.47% 31.50% 34.40%
State Board of Regents 21.73% 26.72% 26.13% 26.49% 27.35% 28.83% 30.22% 30.41% 30.50%
av I
6
1
1

K. S
alar
y an
dC
ompe
nsat
ion
074
L TAB KSALARY & COMPENSATION
PART 1: Comparative Recent History of Faculty Salaries and Compensationin Utah Public Higher Education
Figures 1 through 18 Represent Dollar CompensationAll Ranks Combined
FIGURES 1 & 2 University of Utah Current & Constant 2
FIGURES 3 & 4 Utah State University Current & Constant 3
FIGURES 5 & 6 Weber State University Current & Constant 4
FIGURES 7 & 8 Southern Utah University Current & Constant 5
FIGURES 9 & 10 Snow College Current & Constant 6
FIGURES 11 & 12 Dixie College Current & Constant 7
FIGURES 13 & 14 College of Eastern Utah Current & Constant 8
FIGURES 15 & 16 Utah Valley Community College Current & Constant 9
FIGURES 17 & 18 Salt Lake Community College Current & Constant 10
TABLE 1 Salaries 11
TABLE 2 Total Compensation 16
TABLE 3 Salaries in 1992 Constant Dollars 21
TABLE 4 Total Compensation in 1992 Constant Dollars 26
TABLE 5 Inflation 31
PART 2: 1992-93 Analysis of Faculty Salary and Compensation Comparability
TABLE I Percentage Salary Increases by Year 33
TABLE ll USHE E&G Percentage Increases and Compensation Differentials 33
TABLE III Summary of Faculty Salaries and Compensation Comparability1992-93 35

1
TAB KSALARY & COMPENSATION
--Continued--
TABLE 1 Analysis of Faculty Salary Comparability 37
TABLE 2 Analysis of Faculty Total Compensation Comparability 42
TABLE 3 Calculation of Competitive Faculty Salary Adjustment 47
PART 3: 1992-93 Analysis of Classified Staff Salary and CompensationComparability .
TABLE 1 History of Total Compensation Cost AnalysisIn Percents 54
Market Comparisons Using Average Base Salary Data 55
27;

COMPARATIVE RECENT HISTORY OF FACULTY SALARIES AND COMPENSATIONIN UTAH PUBLIC HIGHER EDUCATION
Background
The analysis presented in the following graphs and tables outlines recenthistorical relationships between average faculty salary and compensation data forUSHE institutions and for groups of schools similar to USHE institutions. Thepurpose of this analysis is to provide a historical context and a wide breadthof comparison for faculty salary and compensation data.
Explanation of Attachments
A twelve-year history (which includes the current fiscal year) of averagefaculty salary and compensation data for each USHE institution and for itscorresponding groups is included in Tables 1 and 2. These data are then adjustedto reflect constant 1992 dollars in Tables 3 and 4.
The University of Utah and Utah State University are compared to threegroups:
o Comparison Institutionso All Research 1 Institutions (U of U's classification)o A composite of Research 1 and 2 Institutions (USU's previous
classification was Research 2, but it presently meets criteriafor Research 1 status.)
Weber State University and Southern Utah University are also compared tothree groups:
o Comparison Institutionso All Comprehensive 1 Institutions (WSU's and SUU's current
classification)o A composite of Comprehensive 1 and 2 Institutions
The five community colleges are compared to two groups:O Comparison InstitutionsO Institutions Without Academic Ranks (almost all of which are
community colleges)
Figures 1 through 18 graph compensation (salary plus benefits) data foreach USHE institution. The top graph on each page comdares one USHE institutionto the above-mentioned groups on a current dollar basis. The bottom graph oneach page adjusts all data to constant dollar levels.
Trend Analysis
Trends in compensation increases, as shown on the graphs, indicate thatUSHE institutions have not kept pace with similar groups of schools, particularlysince 1985-86. The constant dollar graphs show that some institutions have faredbetter than others in regard to the inflation of the 1980's, but most have lostground since 1985-86. Some schools have gained ground in most recent years,primarily because of internal reallocation to faculty compensation and budgetdifficulties in other states.
1 277

FIGURES 1 & 2
University of UtahCurrent Dollar Compensation
Current Dollars (Thousands)
I60
50
40
30
20
10
...
......"....vior
, ,081 82 82-83 83-84 84-85 85-86 86-87 87-88 88-89 89-90 90-91 91-92 92-93
Year
/ \Carnegie 1 + Carnegie 1 &2 *Peer Grp --"U of U\
Ail Ranks Comblnod
University of UtahConstant Dollar Compensation
Constant Dollars (Thowands)70
60
5
40
30
20
1 0 TTTTT081-82 82-83 83-84 84-85 85-86 86-87 87-88 88-89 89-90 90-91 91-92 92-93
Year
/-e- Carnegie 1 +Carnegie 1 &2 *Peer Grp -I- U of U\
All Ranks Comblned
N
2
273
II
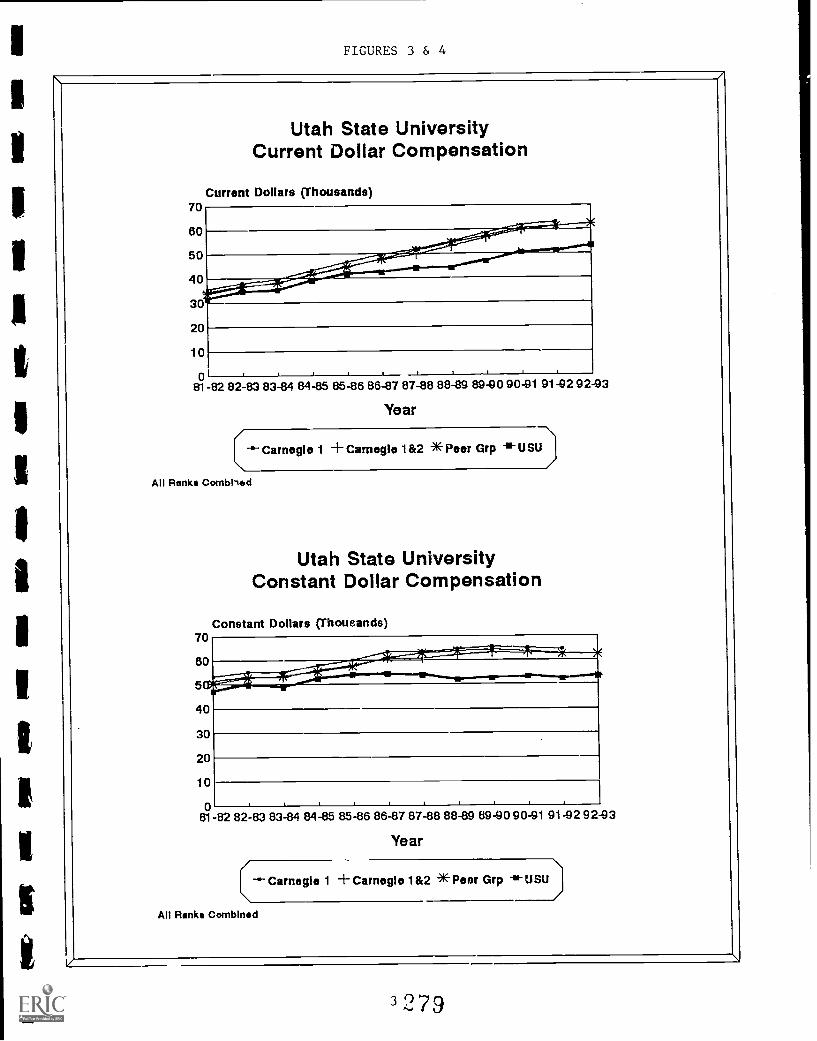
FIGURES 3 & 4
Utah State UniversityCurrent Dollar Compensation
70
60
50
40
30
20
10
081-82 82-83 83-84 84-85 85-86 86-87 87-88 88-89 89-90 90-91 91-02 92-93
\Carnegie 1 +Carnegie 1&2 *Peer Grp -11- USD\ /
All Ranks Combhed
Utah State UniversityConstant Dollar Compensation
Constant Dollars (Thousands)
081-82 82-83 83-84 84-85 85-86 86-87 87-88 88-89 89-90 90-91 91-92 92-93
Year
/-6- Carnegie 1 +Carnegie 1 &2 *Peer Grp -0- USU\
AU Rinks CornbIrmd
32 79

FIGURES 5 & 6
Weber State UniversityCurrent Dollar Compensation
Current Dollars (Thousands)
20
10
081 -82 82-83 83-84 84-85 85-86 86-87 87-88 88-89 89-90 90-91 91 -92 92-93
All Ranks Comb [nod
70
60
50
4G
30
20
1 0
Year
±Inst-III3 *Peer Grp 111-WSU
Weber State UniversityConstant Dollar Compensation
Constant Dollars (Thousands)
081-82 82-83 83-84
All Ranks Comblned
84-85 85-86 86-87 87-88 88-89 89-90 90-91 91-92 92-93
Year
Inst-IIA -1-Inst4IB *Peer Grp li-WSU

FIGURES 7 & 8
70
60
50
40
3
20
1 0
081-82 82-83 83-84 84-85 85-86 86-87 97-88 88-89 89-90 90-91
Southern Utah UniversityCurrent Dollar Compensation
Current Dollars (Thousands)
All Ranks Combined
70
60
Year
±lnst-IIB *Peer Grp -"-SUU
Southern Utah UniversityConstant Dollar Compensation
Constant Dollars (Thousands)
9142 92-93
50
30
20
1 0
-,WO
081 -62 82-83 83-84 84-85 85-86 88-87 87-88 88-89 89-90 90-91 91-92 92-93
Year
(--lnst-llA -1-lnst-IlB *Peer Grp 11. S UU
All Ranks Combined
2S1

FIGURES 9 & 10
70
60
50
40
3
20
1 0
082-83
Snow CollegeCurrent Dollar Compensation
Current Dollars (Thousands)
)4(t.
, , , , . , , . .
83-84 84-85 85-86 86-87 87-88 88-89 89-90 90-91 91-92 92-93
All Ranks Combined
70
60
5 0
4
30
20
10
082-83 83-84 84-85 85-86 86-87 87-88 88-89 89-90 90-91 91-92 92-93
Year
Inst w/o Ranks +Peer Grp *Snow
Snow CollegeConstant Dollar Compensation
Constant Dollars (Thousands)
Year
-*-Inst w/o Ranks +Peer Grp *Snow
All Ranks Combined
6 2.'12

FIGIJRES 11 & 12
/
Dixie CollegeCurrent Dollar Compensation
Current Dollars (Thousands)
20
10
082-83 83-84 84-85 85-86 86-87 87-88 88-89 89-90 9041 91 -92 92-93,
All Ranks Combined
70
60
50
40
30
20
1 0
Year
/\
\Ins! w/o Ranks +Peer Grp *Dixie/
Dixie CollegeConstant Dollar Compensation
Constant Dollars (Thousands)
082-83 83-84 84-85 85-86 86-87 87-88 88-89 89-90 90-91 91 -92 92-93
Year
-\-e-lnst w/o Ranks +Peer Grp *Dixie\ /
All Ranks Combined
7 283
>,

FIGURES 13 & 14
College of Eastern UtahCurrent Dollar Compensation
Currant Dollars (Thousands)70
60
50
40
31h
20
10
.---
rod111/111.5111111°.---1011111111010"'
-- -- -- ..'Imoi11111.160-..,---=--
I I , I I I082-83 83-84 84-85 85-86 86-87 87-88 88-89 89-90 90-91 91-92 92-93
Year
--"Inst w/o Ranks ±Peor Grp * CEU \( /All Ranks Comblned
College of Eastern UtahConstant Dollar Compensation
Constant Dollars (Thousands)70
60
50
40'
30
20
10
0
---alvo---"uINIIIIIII"lill.IP"'"" .........
82-83 83-84 84-85 85-86 86-87 87-88 88-89 89-90 90-91 91-92 92-93
Year
( --lnst w/o Ranks ± POW Grp *CEU
All Rinke Comblned
80 Li

FIGURES 15 & 16
70
60
50
40
Utah Valley Community CollegeCurrent Dollar Compensation
Current Dollars (Thousands)
20
10
082-83 83-84 84-85 85-86 86-87 87-88 88-89 89-90 90-91 91-92 92-03
All Ranks Combined
70
50
50
4
30
20
10
Year
Ins! w/o Ranks +Peer Grp *UVCC
Utah Valley Community CollegeConstant Dollar Compensation
Constant Dollars (Thousands)
082-83 83-84 84-85 85-86 86-87 87-88 88-89 89-90 90-91 91-92 92-03
Year
1mA w/o Ranks +Peer Grp *UVCC
All Rank* Combined
9 2S5

FIGURES 17 & 18
70
60
50
40
3
_..wVINIMPRompw-
Salt Lake Community CollegeCurrent Dollar Compensation
Current Dollars (Thousands)
20
1 0
082-83 83-84 84-85 85-86 86-87 87-88 88-89 89-90 90-91 91-92 92-Q3
All Ranks Comblned
Year
-"-lnst w/o Ranks + Peer Grp *SLCC
Salt Lake Community CollegeConstant Dollar Compensation
Constant Dollars (Thousands)
30
20
10
082-83 83-84 84-85 85-86 86-87 87-88 88-89 89-90 90-91 91-92 92-93
Year
(--lnst w/o Ranks +Peer Grp *SLCC
All Ranks Combined
10

COMPARATIVE HISTCMY OF
TABLE 1 --
1981-82
I. Research Un1v--Carnegie Class 1 and 2
(1) All Ranks Combined
(2) Professor
(3) Associate Professor
(4) Assistant Professor
(5) Instructor
2. Research Universities-Carnegie Class 1
(1) All Ranks Combined
(2) Professor
(3) Associate Professor
(4) Assistant Professor
(5) Instructor
3. University of Utah Peer Group *
(1) All Ranks Combined
(2) Professor
(3) Associate Professor
(4) Assistant Professor
(5) Instructor
$28,700
$36,300
$26,900
$21,900
$17,100
$29,400
$37,300
$27,300
$22,300
$17,400
$31,100
$37,600
$27,600
$22,400
$18,160
i4. UNIVERSITY OF UTAH
(1) All Ranks Combined $29,000
1
a. Diff from Res U 1+2 National Ave $300
b. Diff from Res Unv 1 National Ave ($400)
c. Difference from Peer Grp Ave ($2,100)
(2) Professor $35,100
a. Diff from Res U 1+2 National Ave ($1,200)
b. Diff from Res Unv 1 National Ave ($2,200)
c. Difference from Peer Grp Ave ($2,500)
(3) Associate Professor $25,500
a. Diff from Res U 1+2 National Ave ($1,400)
b. Diff frcm Res Unv 1 Natioms1 Ave ($1,800)
c. Difference from Peer Grp Ave ($2,100)
(4) Assistant Professor $20,900
a. Oiff from Res U 1+2 National Ave ($1,000)
b. Diff from Res Unv 1 National Ave ($1,400)
c. Difference from Peer Grp Ave ($1,500)
(5) Instructor $17,800
a. Diff from Res U 1+2 National Ave $700
b. Diff from Res Unv 1 National Ave $400
C. Difference from Peer Grp Ave ($300)
111*Peer Group,
University
University
FACULTY SALARIES AND CCMPEWSATION IN UTAH PUBLIC HIGHER EDUCATICM
SALARIESPagm 1-A
Estimated
1982-83 1983-84 1984-85 1985-86 1986-87 1987-88 1988-89 1989-90 1990-91 1991-92 1992-93
$30,900 $31,700 $34,400 $36,800 $39,300 $41,100 $43,600 $46,200 $48,600 $50,000
$38,700 $39,600 $42,900 $45,900 $48,1100 $51,100 $54,300 $57,400 $60,700 $62,300
$28,700 $29,200 $31,600 $33,800 $36,000 $37,600 $40,000 $42,200 $44,500 $45,700
$23,500 $24,200 $26,700 $28,700 $30,500 $31,900 $33,900 $35,800 $37,600 $38,700
$18,500 $18,900 $19,900 $21,700 $22,600 $24,300 $25,100 $26,300 $27,000 $28,200
$31,900 $32,800 $35,500 $38,200 $41,000 $42,800 $45,500 $47,900 $50,400 151,700
$39,900 $41,100 $44,400 $47,840 $51,000 $53,400 $56,700 $59,700 $63,100 $64,600
129,200 $29,900 $32,200 $34,600 $37,100 $38,500 $41,000 $43,000 $45,300 $46,600
$23,900 $24,900 $27,100 $29,300 $31,500 $32,800 $35,000 $36,700 $38,500 $39,600
$19,200 $19,500 $20,400 $22,000 $23,100 $24,600 $25,600 $26,700 $28,400 $29,300
$32,400 $34,600 $37,000 $39,700 $42,600 $45,800 148,100 $50,800 $52,200 $53,200 $53,900
$40,500 $42,400 $45,400 $48,700 $52,300 $56,100 $59,100 $61,900 164,400 165,700 166,500
$29,500 $30,600 $32,400 $34,600 $36,900 $39,400 $41,700 $44,700 $45,200 $46,100 $46,700
$23,800 $25,300 $27,100 $29,300 $31,400 $33,500 $35,600 $38,500 $38,400 $39,300 $39,800
$18,000 $19,100 $19,800 $21,400 $22,400 $23,600 $24,300 $28,600 $27,600 $29,000 $29,400
$31,500 $31,600 $34,400 $36,500 $36,600 $38,500 $39,400 $42,000 $45,000 $47,100 $49,000
$600 ($100) $0 ($300) ($2,700) ($2,600) ($4,200) ($4,200) ($3,600) ($2,900)
($400) ($1,200) ($1,100) ($1,700) ($4,400) ($4,300) ($6,100) ($5,900) ($5,400) ($4,600)
($900) ($3,000) ($2,600) ($3,200) ($6,000) ($7,300) ($8,700) ($8,800) ($7,200) ($6,100) ($4,900)
$38,34:0 $38,200 $41,600 $44,200 $44,500 $46,700 $47,900 $50,840 $54,700 $57,200 $59,500
($400) ($1,400) ($1,300) ($1,700) ($4,300) ($4,400) ($6,400) ($6,600) ($6,000) ($5,100)
($1,600) ($2,900) ($2,800) ($3,600) ($6,500) ($6,700) ($8,800) ($8,900) ($8,400) ($7,400)
($2,200) ($4,200) ($3,800) ($4,500) ($7,800) ($9,400)($11,200)($11,100) ($9,700) ($8,500) ($7,000)
$27,700 $27,600 $29,800 $31,300 $31,600 $33,800 $34,300 $36,700 $39,100 $41,000 $42,700
($1,000) ($1,600) ($1,800) ($2,500) ($4,400) ($3,800) ($5,700) ($5,500) ($5,400) ($4,700)
($1,500) ($2,300) ($2,400) ($3,300) ($5,500) ($4,700) ($6,700) ($6,300) ($6,200) ($5,600)
($1,800) ($3,000) ($2,600) ($3,300) ($5,300) ($5,600) ($7,400) ($8,000) ($6,100) ($5,100) ($4,000)
$22,300 $22,600 $25,400 $27,700 $28,000 $29,400 $31,000 $33,300 $35,100 $36,900 $38,400
($1,200) ($1,600) ($1,300) ($1,000) ($2,500) ($2,500) ($2,900) ($2,500) ($2,500) ($1,800)
($1,600) ($2,300) ($1,700) ($1,600) ($3,500) ($3,400) ($4,000) ($3,400) ($3,400) ($2,700)
($1,500) ($2,700) ($1,700) ($1,600) ($3,400) ($4,100) ($4,600) ($5,200) ($3,300) ($2,400) ($1,400)
$18,800 $19,000 $20,900 $23,100 $22,600 $24,900 $26,300 $26,500 $27,300 $28,600 $29,800
$300 $100 $1,000 $1,400 $O $600 $1,200 $200 $300 $400
($400) ($500) $500 $1,100 ($500) $300 $700 ($200) ($1,100) ($700)
$800 ($100) $1,100 $1,700 $200 $1,300 $2,000 ($2,100) ($300) ($400) $400
Prior to 1982-83: University of Arizona; University of Southern California; University of Colorado (Boulder);
of Florida; University of Iowa; University of Kentucky; University of North Carolina (Chapel Hill);
of Oklahoma; University of Pittsburgh; University of Virginia.
IIPeer Group, 1982-83 to 1988-89: University of Arizona; University of California, Los Angeles;
University of Cincinnati; University of Colorado (Boulder); University of Iowa; University of Michigan;
University of North Carolina; University of Pittsburgh; Purdue University; University of Texas (Austin);
University of Virginia; University of Washington.
It@Peer Group, 1989-90 and subsequent years: University of Iowa; University of Virginia (MC); University of Colorado (8culder);
University of Cincinnati (MC); University of Washington; University of North Carolina (Chapel Hill); Purdue University (MC);
University of Florida; University of California (Los Angeles); University of Arizona.
1 1
22 -Sep -92

CCMPARATIVE HISTORY OF FACULTY SALARIES AND COMPENSATION IN UTAH PUBLIC HIGHER EDUCATION 16-Sep-9111
TABLE
1981-82
5. Utah State University Peer Group * @
(1) All Ranks Combined $28,400
1 -- SALARIES
1982-83 1983-84
$30,600 $32,100
1984-85
$34,000
1985-86
$36,900
1986-87
$39,700
1987-88
$42,200
Page
Estimated
1988-89 1989-90 1990-91 1991-92
$44,500 $46,800 $49,200 $50,000
1-8
1992-93
$51,000(2) Professor $34,800 $38,600 $40,500 $42,900 $46,400 $49,900 $52,900 $58,200 $58,400 $61,300 $62,100 $83,300(3) Associate Professor $26,700 $28,900 $30,300 $31,800 $34,100 $36,600 $38,900 $41,200 $42,700 $44,600 $45,100 $46,000(4) Assistant Professor $21,900 $23,600 $24,900 $26,100 $28,400 $30,700 $32,500 $34,400 $35,900 $37,300 $38,100 $38,900(5) Instructor $16,700 $18,400 $18,000 $18,600 $19,900 $21,000 $22,000 $23,100 $24,500 $28,300 $26,700 $27,300
6. UTAH STATE UNIVERSITY
(1) All Ranks Combined $25,400 $27,300 $27,700 $30,400 $32,500 $33,000 $34,000 $33,900 $35,500 $37,900 $38,500 $40,200a. Diff from Res 0 1+2 National Ave ($3,300) ($3,600) ($4,000) ($4,000) ($4,300) ($6,300) ($7,100) ($9,700)($10,700)($10,700)($11,500)b. Diff from Res Unv 1 National Ave ($4,000) ($4,600) ($5,100) ($5,100) ($5,700) ($8,000) ($8,800)($11,600)($12,400)($12,500)($13,200)c. Difference from Peer Grp Ave ($3,000) ($3,300) ($4,400) ($3,600) ($4,400) ($6,700) ($8,200)($10,700)($11,300)($11,300)($11,500)($10,800)
(2) Professor $31,200 $33,500 $33,400 $36,800 $39,100 $40,400 $41,500 $41,500 $43,400 $45,400 $48,100 $48,100a. Diff from Res U 1+2 National Ave ($5,100) ($5,200) ($6,200) ($6,100) ($6,800) ($8,400) ($9,600)($12,800)($14,000)($15,300)($1e,200)b. Diff free Res Unv 1 National Ave ($6,100) ($6,400) ($7,700) ($7,600) ($8,700)($10,600)($11,900)($15,200)($16,300)($17,700)($18,500)c. Difference from Peer Grp Ave ($3,600) ($5,100) ($7,100) ($6,100) ($7,300) ($9,500)($11,400)($14,700)($15,000)($15,900)($16,000)($15,200)
(3) Associate Professor $24,400 $26,500 $26,500 $29,100 $31,400 $31,700 $33,000 $33,000 $34,500 $35,900 $36,800 $38,400a. Diff fres Res U 1+2 National Ave ($2,500) ($2,200) ($2,700) ($2,500) ($2,400) ($4,300) ($4,600) ($7,000) ($7,700) ($8,600) ($8,900)b. Diff from Res Unv 1 National Ave ($2,900) ($2,700) ($3,400) ($3,100) ($3,200) ($5,400) ($5,500) ($8,000) ($8,500) ($9,400) ($9,800)C. Difference from Peer Grp Ave ($2,300) ($2,400) ($3,800) ($2,700) ($2,700) ($4,900) ($5,900) ($8,200) ($8,200) ($8,700) ($8,300) ($7,800)
(4) Assistant Professor $19,700 $21,800 $22,100 $24,300 $25,800 $28,000 $27,400 $27,300 $29,200 $31,200 $32,900 $34,300a. Diff from Res U 1+2 National Ave ($2,200) ($1,700) ($2,100) ($2,400) ($2,900) ($4,500) ($4,500) ($8,600) ($6,600) ($6,400) ($5,800)b. Diff from Res Unv 1 National Ave ($2,600) ($2,100) ($2,800) ($2,800) ($3,500) ($5,500) ($5,400) ($7,700) ($7,500) ($7,300) ($6,700)c. Difference from Peer Grp Ave ($2,200) ($1,800) ($2,800) ($1,800) ($2,600) ($4,700) ($5,100) ($7,100) ($6,700) ($6,100) ($5,200) ($4,600)
(5) Instructor $15,900 $17,800 $19,200 $21,000 $21,900 $22,500 $22,500 $23,600 $25,300 $28,800 $28,400 $29,700a. Diff from Res U 1+2 National Ave ($1,200) ($700) $300 $1,100 $200 ($100) ($1,800) ($1,500) ($1,000) $1,600 $200b. Diff from Res Unv 1 National Ave ($1,500) ($1,400) ($300) $600 ($100) ($600) ($2,100) ($2,000) ($1,400) $200 ($900)c. Difference from Peer Grp Ave ($800) ($800) $1,200 $2,400 $2,000 $1,500 $500 $500 $800 $2,300 $1,700 $2,400
*Peer Group, prior to 1982-83: Colorado State University; Iowa State University; Kansas State University;
Mew Mexico State University; North Carolina State University (Raleigh); Oklahoma State University; Oregon State University;Texas A & I( University; Virginia Tech University; Washington State University.
Peer Group, 1982-83 to 1988-89: University of California, Davis; Colorado State University;
University of Connecticut; Iowa State University; New Mexico State University; North Carolina State University;
Oregon State University; Pennsylvania State University; Rutgers University; Texas A & N University;Virginia Tech University; Washington State University.
@Peer Group, 1989-90 aid subsequent years: New Mexico State University (MC); Oregon State University; Washington State University;
Colorado State University; North Carolina State University (Raleigh); Iowa State University; University of Maryland (College Park);Virginia Tech University; Texas A&M University; University of California (Davis).
S S
12

III8. Gen Baccalaureate Institutions--IIB
(1) All Ranks Combined
(2) Professor
(3) Associate Professor
(4) Assistant Professor
(5) Instructor
CCMPARATIVE HISTCRY OF FACULTY SALARIES AND CCMPENSATION IN UTAH PLEILIC HIGHER EDUCATION 22 -Sep -92
7. Comprehensive Institutions--IIA
(1) All Ranks Combined
(2) Professor
(3) Associate Professor
(4) Assistant Professor
(5) Instructor
9. Weber State University Peer Group * 0 @
III(1) All Ranks Combined
(2) Professor
(3) Associate Professor
(4) Assistant Professor
N@
(5) Instructor
110 So Utah University Peer Grp *. 00
(1) All Ranks Combined
(2) Professor
(3) Associate Professor
(4) Assistant Professor
11/
(5) Instructor
TABLE 1 -- SALARIES Page 1-C
Estimated
1981-82 1982-83 1983-84 1984-85 1985-86 1986-87 1987-88 1988-89 1989-90 1990-91 1991-92 1992-93
$25,300 $26,900 $28,200 $29,900 $32,100 $34,100 $35,300 $38,100 $40,100 $42,200 $43,500
$31,700 $33,500 $34,600 $37,100 $39,700 $42,300 $46,100 $46,900 $49,600 $52,200 $53,800
$25,200 $26,800 $27,800 $29,600 $31,600 $33,300 $34,700 $37,400 $39,700 $41,600 $43,000
$20,800 $22,000 $23,000 $24,400 $26,000 $27,500 $28,400 $30,900 $32,700 $34,500 $35,700
$16,900 $17,700 $19,100 $19,600 $20,800 $21,600 $21,800 $24,000 $25,100 $26,200 $27,200
$22,600 $24,500 $25,100 $26,900 $28,400 $29,700 $31,100 $32,900 $34,400 $36,400 $37,900
$28,900 $30,800 $31,600 $33,900 $35,600 $36,900 $38,700 $41,100 $43,300 $44,900 $47,500
$23,800 $25,500 $26,300 $28,200 $29,800 $31,200 $32,400 $34,300 $35,900 $37,600 $39,200
$20,100 $21,600 $22,200 $23,500 $24,900 $25,900 $27,100 $28,400 $29,700 $31,400 $32,600
$16,200 $18,200 $18,600 $19,000 $20,100 $21,600 $21,900 $23,000 $24,200 $26,500 $26,400
$24,800 $28,000 $28,800 $30,500 $32,400 $34,700 $36,800 $38,100 $39,200 $41,700 $43,100 $43,700
$30,600 $33,300 $34,300 $36,200 $38,500 $41,100 $43,600 $45,500 $46,400 $49,100 $50,600 $51,300
$25.100 $27,500 $28,200 $29,700 $31,300 $33,700 $35,900 $37,500 $37,100 $40,800 $42,100 $42,700
$20,900 $22,900 $23,400 $24,700 $26,300 $28,200 $29,800 $31,200 $32,100 $34,100 $35,500 $36,000
$11,700 $18,500 $19,100 $20,200 $21,300 $22,600 $24,200 $24,100 $25,300 $25,400 $24,600 $25,200
$24,400 $28,000 $28,800 $30,500 $32,400 $34,700 $36,800 $38,100 $39,200 $41,700 $43,100 $43,700
$29,900 $33,300 $34,300 $36,200 $38,500 $41,100 $43,600 $45,500 $46,400 $49,100 $50,600 $51,300
$24,400 $27,500 $28,200 $29,700 $31,300 $33,700 $35,900 $37,500 $37,100 $40,800 $42,100 $42,700
$21,100 $22,900 $23,400 $24,700 $26,300 $28,200 $29,800 $31,200 $32,100 $34,100 $35,500 $36,000
$17,600 $18,500 $19,100 $20,200 $21,300 $22,600 $24,200 $24,100 $25,300 $25,400 $24,600 $25,200
III*Peer Group, prior to 1982-83: University of Colorado at Colorado Springs; Metropolitan State College (Denver);
Boise State University; Indiana University, Northwest; University of Northern Iowa; Boston State College (MA);
Ferris State College (MI); Jersey City State College (NJ); Southern Oregon State College; West Chester University (PA);
Pan American University (TX); Central Washington University; University of Wisconsin, Oshkosh.
II//Peer Group, 1982-87. to 1988-39: Boise State University (ID); University of California, Hayward;
Eastern Washington University; Jersey City State College (NJ); Metropolitan State College (CO);
University of Nevada, Las Vegas; University of Northern Arizona; University of Northern Iowa; Portland State University
(OR); State University of New York, College at Brockport; West Chester University (PA); University of Wisconsin, Oshkosh.
I@Peer Group, 1989-90 and subsequent years: Indiana Univeristy Northwest; University of Southern Colorado;
Southern Oregon State College; Austin Peay State Univerity (TN); California State Univeristy (Dominguez Hills);
Eastern Washington University; Boise State University (ID); SUNY College at Brockport; University of Nevada (Las Vegas);
University of Wisconsin, Oshkosh.
III**Peer Group, prior to 1982-83: Adams State College (CO); Fort Lewis College (CO); Delaware State College (DE);
Lewis and Clark State College (ID); Indiana State University, Evansville; New Mexico Highlands University;
Pembroke State University (NC); Southwest State University (MX); Central State University (OH); Lock Haven University
(PA); Southern Oregon State College.
III
tOPeer Group, 1982-83 to 1988-89: WSU group used for salary and tuition cowarison purposes.
R@Peer Group, 1989-90 and subsequent years: WSU group used for salary and tuition comparison purposes.
9 si
13

CCMPARATIVE HISTORY OF FACULTY SALARIES AND COMPENSA.ION IN UTAH PUBLIC HIGHER EDUCAT:ON 16-Sep-91Ir
TABLE
1981-82
1 -- SALARIES
1982-83 1983-84 1984-85 1985-86 1986-87
Page 1-0
Estimated
1987-88 1988-89 1989-90 1990-91 1991-92 1992-93
11. WEBER STATE UNIVERSITY
(1) All Ranks Combined $23,500 $25,100 $25,100 $27,500 $28,700 $29,400 $28,900 $29,100 $30,300 $31,700 $36,400 $38,000
a. Diff from Comp Nat Ave (IIA) ($1,800) ($1,800) ($3,100) ($2,400) ($3,400) ($4,700) ($6,400) ($9,000) ($9,800)($10,500) ($7,100)
b. Diff from Bacc Nat Ave (IIB) $900 $600 $0 $600 $300 ($300) ($2,200) ($3,800) ($4,100) ($4,700) ($1,500)
c. Difference from Peer Grp Ave ($1,300) ($2,900) ($3,700) $27,500 ($3,700) ($5,300) ($7,900) ($9,000) ($8,900)($10,000) ($6,700) ($5,700)
(2) Professor $28,500 $30,500 $30,300 $33,600 $34,800 $35,500 $35,200 $35,400 $36,600 $38,700 $44,900 $46,800
a. 01ff from Comp Nat Ave (IIA) ($3,200) ($3,000) ($4,300) ($3,500) ($4,900) ($6,800)($10,900)($11,500)($13,000)($13,500) ($8,900)
b. Diff from Bacc Nat Ave (11B) ($400) ($300) ($1,300) ($300) ($800) ($1,400) ($3,500) ($5,700) ($6,700) ($6,200) ($2,600)
c. Difference from Peer Grp Ave ($2,100) ($2,800) ($4,000) ($2,600) ($3,700) ($5,600) ($8,400)($10,100) ($9,800)($10,400) ($5,700) ($4,500)
(3) Associate Professor $23,800 $25,500 $24,900 $28,000 $29,400 $29,400 $29,300 $29,000 $30,600 $32,100 $37,700 $39,300
a. Diff from Comp Nat Ave (IIA) ($1,400) ($1,300) ($2,900) ($1,600) ($2,2100) ($3,900) ($5,400) ($8,400) ($9,100) ($9,500) ($5,300)
b. Diff from Bacc Kat Ave (IIB) $0 $0 ($1,400) ($200) ($400) ($1,800) ($3,100) ($5,300) ($5,300) ($5,500) ($1,500)
c. Difference from Peer Grp Ave ($1,300) ($2,000) ($3,300) ($1,700) ($1,900) ($4,300) ($6,600) ($8,500) ($6,500) ($8,700) ($4,400) ($3,400)
(4) Assistant Professor $20,400 $22,300 $22,200 $24,300 $25,800 525,700 $25,800 526,100 *27,200 $28,200 $31,300 $32,600
a. Diff from Comp Nat Ave (IIA) ($400) $300 ($800) ($100) ($200) ($1,800) ($2,600) ($4,800) ($5,500) ($6,300) ($4,400)
b. Diff from Bacc Nat Ave (IIB) $300 $700 $0 $800 $900 ($200) ($1,300) ($2,300) ($2,500) ($3,200) ($1,300)
c. Difference from Peer Grp Ave ($500) ($600) ($1,200) ($400) ($500) ($2,500) ($4,000) ($5,100) ($4,900) ($5,900) ($4,200) ($3,400)
(5) Instructor $15,900 $17,500 $18,000 $19,600 $19,300 $20,900 $19,900 $20,100 $20,800 $22,400 $25,500 $26,600
a. Diff from Comp Nat Ave (IIA) ($1,000) ($200) ($1,100) $0 ($1,500) ($700) ($1,900) ($3,900) ($4,300) ($3,800) ($1,700)
b. Diff from Bacc Nat Ave (IIB) ($300) ($700) ($600) $600 ($800) ($700) ($2,000) ($2,900) ($3,400) ($4,100) ($900)
c. Difference from Peer Grp Ave ($1,800) ($1,000) ($1,100) ($600) ($2,000) ($1,700) ($4,300) ($4,000) ($4,500) ($3,000) $900 $1,400
12. SOUTHERN UTAH UNIVERSITY
(1) All Ranks Combined $22,200 $22,900 $23,100 $25,500 $27,100 $26,900 $28,100 $27,800 $29,000 $29,700 $31,300 $32,700
a. Diff from Comp Nat Ave (IIA) ($3,100) ($4,000) ($5,100) ($4,400) ($5,000) ($7,200) ($7,200)($10,300)($11,100)($12,500)($12,200)
b. Diff from Bacc Nat Ave (IIB) ($400) ($1,600) ($2,000) ($1,400) ($1,300) ($2,800) ($3,000) ($5,100) ($5,400) ($6,700) ($6,600)
c. Difference from Peer Grp Ave ($2,200) ($5,100) ($5,700) ($5,000) ($5,300) ($7,800) ($8,700)($10,300)($10,200)($12,C00)($11,800)($11,000)
(2) Professor $27,400 $28,100 $27,700 $30,800 $33,100 $33,300 $34,600 $34,600 $35,500 $37,100 $38,400 $40,100
a. Diff from Comp Nat Ave (IIA) ($4,300) (55,400) ($6,900) ($6,300) ($6,600) ($9,000)($11,500)($12,300)($14,100)($15,100)($15,400)
b. Diff from Bacc Nat Ave (11B) ($1,500) ($2,700) ($3,900) ($3,100) ($2,500) ($3,600) ($4,100) ($6,500) ($7,800) ($7,800) ($9,100)
c. Difference from Peer Grp Ave ($2,500) ($5,200) ($6,600) ($5,400) ($5,400) ($7,800) ($9,000)($10,900)($10,900)($12,000)($12,200)($11,200)
(3) Associate Professor $21,500 $23,100 $23,500 $25,500 $27,000 $26,800 $28,000 $27,700 $29,500 $30,700 $32,300 $33,800
a. Diff from Comp Nat Ave (IIA) ($3,700) ($3,700) ($4,300) ($4,100) ($4,600) ($6,500) ($6,700) ($9,700)($10,200)($10,900)($10,700)
b. Diff from Bacc Nat Ave (IIB) ($2,300) ($2,400) ($2,800) ($2,700) ($2,800) ($4,400) ($4,400) ($6,600) ($6,400) ($6,900) ($6,900)
c. Difference from Peer Grp Ave ($2,900) ($4,403) ($4,700) ($4,200) ($4,300) ($6,900) ($7,900) ($9,800) ($7,600)($10,100) ($9,800) ($8,900)
(4) Assistant Professor $19,100 $19,600 $19,900 $22,000 $22,700 $23,500 $23,500 $23,800 $25,100 $25,700 $27,600 $28,900
a. Diff from Comp Nat Ave (IIA) ($1,700) ($2,400) ($3,100) ($2,400) ($3,300) ($4,000) ($4,900) ($7,100) ($7,600) ($8,800) ($8,100)
b. Diff from Bacc Nat Ave (IIB) ($1,000) ($2,000) ($2,300) ($1,500) ($2,200) ($2,400) ($3,600) ($4,600) ($4,600) ($5,700) ($5,000)
c. Difference from Peer Grp Ave ($2,000) ($3,300) ($3,500) ($2,700) ($3,600) ($4,700) ($6,303) ($7,400) ($7,000) ($8,400) ($7,900) ($7,100)
(5) Instructor $17,300 $17,300 $17,030 $19,600 $20,300 $20,200 $20,500 $21,600 $23,300 $23,000 $23,500 $24,600
a. Diff from Comp Nat Ave (IIA) $400 ($400) ($2,100) $0 ($500) ($1,400) ($1,300) ($2,400) ($1,800) ($3,200) ($3,700)
b. Diff from Bacc Nat Ave (IIB) $1,100 ($900) ($1,600) $600 $200 ($1,400) ($1,400) ($1,400) ($900) ($3,500) ($2,900)
c. Difference from Peer Grp Ave ($300) ($1,200) ($2,100) ($600) ($1,000) ($2,400) ($3,700) ($2,500) ($2,000) ($2,400) ($1,100) ($600)
1 4

III14. Metro Community College Peer Grp * 0 "
(1) All Faculty Combined
CCMPARATIVE HISTORY Cf FACULTY SALARIES AND COMPENSATION IN UTAH PUBLIC HIGHER EDUCATION
13. Institutions Without Academic Ranks--IV
Essentially All Two-Year Institutions
(1) All Faculty Combined
III15. Rural Community College Peer Grp ** If
(1) All Faculty Combined
II/
16. Snow College * 0,
(1) All Faculty Combined
a. Jiff from National Ave (IV)
b. Difference from Peer Grp Ave
III
17. Dixie College
(1) All Faculty Combined
a. Diff from National Ave (IV)
b. Difference from Peer Grp Ave
III
18. College of Eastern Utah
(1) All Faculty Combined
a. Diff from National Ave (IV)
b. Difference from Peer Grp Ave
11/
19. Utah Valley Community College
(I) All Faculty Combined
a. Diff from National Ave (IV)
b. Difference from Peer Grp Ave
II/
20. Salt Lake Community College
(1) All Faculty Combined
a. Diff from National Ave (IV)
b. Difference from Peer Grp Ave
TABLE 1 -- SALARIES Page
Estimated
1-E
1981-82 1982-83 1983-84 1984-85 1985-86 1986-87 1987-88 1988-89 1989-90 1990-91 1991-92 1992-93
$23,000 $25,000 $24,400 $24,800 $28,600 $31,400 $29,100 $31,200 $34,500 $37,200 $38,200
N/A $25,700 $27,200 $28,700 $30,100 $31,100 $32,600 $34,300 $35,500 $37,400 $39,400 141,300
N/A $24,100 $25,100 $28,700 $30,100 $31,100 $32,600 $34,300 $35,500 $37,400 $39,400 $41,300
$20,100 121,500 $21,800 $23,300 $25,300 $25,700 $27,100 $26,3400 $27,600 $29,200 $29,200 $30,600
($2,900) ($3,500) ($2,600) ($1,500) ($3,300) ($5,700) ($2,000) ($4,900) ($6,900) ($8,000) ($9,000)
($2,600) ($3,300) ($5,400) ($4,800) ($5,400) ($5,500) ($8,000) ($7,900) ($8,200)($10,200)($10,700)
$21,100 $23,000 $22,200 $24,500 $25,700 $25,700 $25,800 $25,800 $26,700 $27,800 $28,800 $31,700
($1,900) ($2,000) ($2,200) ($300) ($2,900) ($5,700) ($3,300) ($5,400) ($7,800) ($9,400) ($9,400)
($1,100) ($2,900) ($4,200) ($4,400) ($5,400) ($6,800) ($8,500) ($8,800) ($9,600)($10,600) ($9,600)
$20,000 $22,200 $21,500 $23,200 $24,500 $25,700 $25,600 $25,200 $26,104 $27,900 $28,700 $30,900
($3,000) ($2,800) ($2,900) ($1,600) ($4,100) ($5,700) ($3,500) ($6,000) ($8,400) ($9,300) ($9,500)
($1,900) ($3,600) ($5,500) ($5,600) ($5,400) ($7,000) ($9,100) ($9,400) ($9,500)($10,700)($10,400)
$20,600 $22,000 $21,600 $24,400 $26,500 $26,600 $27,500 $27,600 $28,600 $30,000 $31,100 $32,500
($2,400) ($3,000) ($2,800) ($400) ($2,100) ($4,800) ($1,600) ($3,600) ($5,900) ($7,200) ($7,100)
($3,700) ($5,600) $24,400 ($3,600) ($4,500) ($5,100) ($6,700) ($6,900) ($7,400) ($8,300) ($8,80J)
$20,600 $21,600 $21,400 $23,800 $25,300 $24,800 $25,800 $25,600 $26,300 $27,500 $29,100 $31,300
($2,400) ($3,400) ($3,000) ($1,000) ($3,300) ($6,600) ($3,300) ($5,600) ($8,200) ($9,700) ($9,100)
($4,104) ($5,800) $23,800 ($4,800) ($6,300) ($6,800) ($8,700) ($9,200) ($9,900)($10,300)($10,000)
1/1 *Veer Group, prior to 1982-83: Clark Co CC (NY); Chemeketa CC (OR); College of Southern Idaho; CC of Denver (CO);
Des Moines Area CC (IA); Lee College (TX); Maricopa Co CC (AZ); North Dakota State School of Science;
- North Hennepin CC (MN); Penn Valley CC (M)); Pikes Peak CC (CO); Central Arizona College; Olympia Technical CC (WA);
Western Nevada CC.
III/Peer Group, 1982-83 to 1988-89: Ann Arundel CC (MD); Austin CC (TX); Bergen Cr (M)); Chemeketa CC (OR);
Clark Co CC (NV); College of Southern Idaho; Delaware CC (PA); Madison Area Tech Col (WI); Mount Hood CC (OR);
North Seattle CC (WA); Spokane CC (WA; [San Diego City College (CA)--I982-83 only].
**Peer Group, prior to 1982-83: Big Bend CC (WA); Blue Mountain CC (OR); Colorado Mt JC (CO); Flathead Valley CC (MT);
111
Miles CC (MT); Northern Nevada CC; North Idaho College; Northwest CC (WY); Northwestern JC (.. :; Treasure Valley CC (OR);
Wenatchee Valley CC (WA); Western Wyoming CC.
If Peer Group, 1982-83 and 1983-84: [Big Bend CC (WA)--1982-83 only]; Blue Mountain CC (OR);
College of the Siskiyous (CA); North Central Michigan College; Northeastern JC (CO); North Idaho College;
Northwest CC (WY); Treasure Valley CC (OR); Wenatchee Valley College (WA); Western Texas College;
IIIWestern Wyoming College; Yavapai College (AZ).
@Peer Group, 1984-85 to 1988-89: Metro Group used for faculty compensation and tuition and fee comparisons.
"Peer Group for All Community Colleges, 1989-90 and subsequent years: Western Wyoming Community College;
Danville Cormunity College (VA); Yavapai College (AZ); North Idaho College; Joliet Junior College (IL);
Chemeketa Cormunity College (OR); Anne Arundel Community College (M)); Spokane Community College (WA);
Onondaga Community College (NY); Grand Rapids Jr College (MI).
2
15
22 -Sep -92

CUIPARATIVE HISTCRY OF FACULTY SALARIES AND CCMPENSATICM IN UTAH PUBLIC HIGHER EDUCATION 16-Sep-9111
TABLE 2 -- TOTAL COMPENSATION Page
Estimated
2-A
1981-82 1982-83 1983-84 1984-85 1985-86 1986-87 1987-88 1988-89 1989-90 1990-91 1991-92Estimated
1, Research Univ-Carnegle Class 1 and 2
(1) All Ranks Combined $34,300 $36,800 $38,100 $41,700 $44,800 $47,700 $49,900 $53,100 $56,600 $59,800 $61,400(2) Professor $43,000 $45,800 $47,600 $51,700 $55,400 $58,900 $61,600 $65,500 $69,700 $73,800 $75,800(3) Associate Professor $32,200 $34,200 $35,100 $38,600 $41,300 $44,000 $46,100 $49,100 S52,200 $55,100 $56,500(4) Assistant Professor $26,300 $28,300 $29,100 $32,500 $35,000 $37,300 $39,200 $41,700 $44,400 $46,900 $48,100(5) Instructor $20,400 $22,000 $22,400 $24,800 $26,700 $27,900 $29,100 $31,300 $33,000 $34,200 $36,100
2. Research Universities-Carnegie Class 1(1) All Ranks Combined $35,500 $38,100 $39,600 $43,300 $46,600 $49,700 $51,900 $55,100 $58,600 $61,700 $63,100(2) Professor $44,300 $47,300 $49,600 $53,800 $57,700 $61,500 $64,200 $68,200 $72,300 $76,400 $78,200(3) Associate Professor $32,900 $34,900 $36,100 $39,500 $42,400 $45,300 $47,200 $50,100 $53,100 $56,000 $57,300(4) Assistant Professor $26,900 $28,800 $30,100 $33,400 $36,100 $38,500 140,300 $42,900 $45,600 $47,900 $48,900(5) Instructor $20,800 $22,800 $23,200 $25,300 $27,300 $28,600 $6,800 $31,800 $33,600 $36,000 $37,500
3. University of Utah Peer Group * f @
(1) All Ranks Combined $36,400 $39,100 $41,300 $45,000 $48,300 $51,400 $55,500 $58,900 $62,500 $64,500 $65,800 $66,900(2) Professor $43,900 $48,900 $50,700 $54,700 $58,700 $62,400 $67,300 $71,600 $75,300 $78,500 $80,400 $81,700(3) Associate Professor $32,600 $35,600 $36,600 $39,800 $42,500 $45,100 $48,500 $51,700 $55,600 $56,600 $57,800 $58,800(4) Assistant Professor $26,509 $28,700 $30,200 $33,400 $36,000 $38,500 $41,300 $44,300 $48,200 $48,600 $49,200 $50,100(5) Instructor $21,300 $21,700 $22,800 $25,000 $26,200 $27,200 $29,000 $29,900 $35,900 $35,600 $37,100 $37,600
4. UNIVERSITY OF UTAH
(1) All Ranks Combined $35,800 $39,600 $39,700 $43,800 $46,600 $46,900 $49,300 $50,900 $54,600 $57,900 $61,600 $64,100a. Diff from Res U 1+2 National Ave $1,500 $2,800 $1,600 $2,100 $1,800 ($800) ($600) ($2,200) ($2,000) ($1,900) $200b. Diff from Res Unv 1 Rational Ave $300 $1,500 $100 $500 $0 ($2,800) ($2,600) ($4,200) ($4,000) ($3,800) ($1,500)c. Difference from Peer Grp Ave ($600) $500 ($1,600) ($1,200) ($1,700) ($4,500) ($6,200) ($8,000) ($7,900) ($6,600) ($4,200) ($2,800)
(2) Professor $42,900 $47,700 $47,600 $52,500 $56,500 $66,500 $59,100 $61,300 $65,300 $69,400 $73,700 $76,700a. Diff from Res U 1+2 National Ave ($100) $1,900 $0 $800 $1,100 ($2,400) ($2,500) ($4,200) ($4,400) ($4,400) ($2,100)b. Diff from Res Unv 1 National Ave ($1,400) $400 ($2,000) ($1,300) ($1,200) ($5,000) ($5,100) ($6,900) ($7,000) ($7,000) ($4,500)c. Difference from Peer Grp Ave ($1,000) ($1,200) ($3,100) ($2,200) ($2,200) ($5,900) ($8,200)($10,300)($10,000) ($9,100) ($6,700) ($5,000)
(3) Associate Professor $31,800 $35,100 $35,000 $38,200 $39,900 $40,700 $43,600 $44,700 $48,100 $50,900 $54,400 $56,600a. Dlff from Res U 1+2 National Ave ($400) $900 ($100) ($400) ($1,400) ($3,300) ($2,500) ($4,400) ($4,100) ($4,200) ($2,100)b. Diff from Res Unv 1 National Ave ($1,100) $200 ($1,100) ($1,300) ($2,500) ($4,600) ($3,600) ($5,400) ($5,000) ($5,100) ($2,900)c. Difference from Peer Grp Ave ($800) ($500) ($1,600) ($1,600) ($2,600) ($4,400) ($4,900) ($7,000) ($7,500) ($5,700) ($3,400) ($2,200)
(4) Assistant Professor $26,300 128,500 128,900 132,800 135,400 $36,300 $38,400 $40,700 $44,000 $46,000 $49,400 $51,400a. Diff from Res U 1+2 National Ave $O $200 ($200) $300 $400 ($1,000) ($800) ($1,000) ($400) ($900) $1,300b. Diff from Res Unv 1 National Ave ($600) ($300) ($1,200) ($600) ($700) ($2,200) ($1,900) ($2,200) ($1,600) ($1,900) $500c. Difference from Peer Grp Ave ($200) ($200) ($1,300) ($600) ($600) ($2,200) ($2,900) ($3,600) ($4,200) ($2,600) $200 $1,300
(5) Instructor $22,500 $24,300 $24,600 $27,200 $29,600 $29,600 $32,900 $34,900 $35,800 $36,400 $39,300 $40,900a. Diff from Res U 1+2 National Ave $2,100 $2,300 $2,200 $2,440 $2,900 $1,700 $3,800 $3,600 $2,800 $2,200 $3,200b. Diff from Res Unv 1 rational Ave $1,700 $1,500 $1,400 $1,900 $2,300 $1,000 $3,100 $3,100 $2,200 $400 $1,800c. Difference from Peer Grp Ave $1,200 $2,600 $1,800 $2,200 $3,400 $2,400 $3,900 $5,000 ($100) $800 $2,200 $3,300
*Peer Group, Prior to 1982-83: University of Arizona; University of Southern California; University of Colorado (Boulder);
University of Florida; University of Iowa; University of Kentucky; University of North Carolina (Chapel Hill);
University of Oklahoma; University of Pittsburgh; University of Virginia.
/Peer Group, 1982-83 to 1988-89: University of Arizona; University of California, Los Angeles;
University of Cincinnati; University of Colorado (Boulder); University of Iowa; University of Michigan;
University of North Carolina; University of Pittsburgh; Purdue University; University of Texas (Austin);
University of Virginia; University of Washington.
@Peer Group, 1989-90 and subsequent years: University of Iowa; University of Virginia (MC); University of Colorado (Boulder);
University of Cincinnati (MC); Unlversity of Washington; University of North Carolina (Chapel Hill); Purdue University (MC);
University of Florida; University of California (Los Angeles); University of Arizona.
1 6

COMPARATIVE HISTORY OF FACULTY SALARIES AND COMPENSATION IN UTAH PUBLIC HIGHER EDUCATION
TABLE 2 -- TOTAL CMPEASATION Page
Estimated
1981-82 1982-83 1983-84 1984-85 1985-86 1986-87 1987-88 1988-89 1989-90 1990-91 1991-92
ESTIMATED
5. Utah State University Peer Group * @
(1) All Ranks Combined $33,600 $36,414 $38,400 $41,400 $44,600 $47,900 $51,400 $54,500 $57,400 $60,400 $61,200
2-0
1992-93
$62,300
(2) Professor $41,000 $45,934 $48,400 $51,800 $55,600 $59,500 $63,700 $67,800 $70,900 $74,300 $75,200 $76,600
(3) Associate Professor $31,800 $34,391 $36,200 $38,800 441,500 $44,500 $47,800 $50,700 $52,800 $55,400 $55,700 $56,800
(4) Assistant Professor $26,100 $28,084 $29,800 $32,100 $34,700 $37,300 $40,000 $42,500 $44,400 $46,500 $47,100 $48,100
(5) Instructor $20,100 $21,896 $21,500 $23,500 $24,900 $26,200 $27,800 $29,600 $01,700 $33,800 $34,600 $35,300
6. UTAA STATE UNIVERSITY
(I) All Ranks Combined $31,400 $34,503 $35,000 $39,000 $41,700 $42,400 $44,000 $44,200 $46,800 $50,400 $51,000 $53,200
a. Diff from Res U 1+2 National Ave ($2,900) ($2,300) ($3,100) ($2,700) ($3,100) ($5,900) ($5,900) ($8,900) ($9,800) ($9,400)($10,400)
b. Diff from Res Unv 1 National Ave ($4,100) ($3,600) ($4,600) ($4,300) ($4,900) ($7,300) ($7,900)($10,900)($11,800)($11,300)($12,100)
c. Difference from Peer Grp Ave ($2,200) ($1,914) ($3,400) ($2,400) ($2,900) ($5,500) ($7,400)($10,300)($10,600)($10,000)($10,200) ($9,100)
(2) Professor $38,400 $42,200 $42,100 $47,000 $50,200 $51,700 $53,400 $53,900 $56,900 $59,600 $59,800 $62,400
a. Diff from Res U )+2 National Ave ($4,600) ($3,600) ($5,500) ($4,700) ($5,200) ($7,200) ($8,200)($11,600)($12,800)($14,200)($16,000)
b. Diff from Res Unv 1 National Ave ($5,900) ($5,100) ($7,500) ($6,800) ($7,500) ($9,800)($10,800)($14,300)($15,400)($16,800)($18,400)
c. Difference from Peer Grp Ave ($2,600) ($3,734) ($6,300) ($4,800) ($5,400) ($7,800)($10,300)($13,900)($14,000)($14,700)($15,400)($14,200)
(3) Associate Professor $30,300 $33,600 $33,600 $37,300 $40,400 $41,000 $42,900 $43,300 $45,800 $47,900 $49,100 $51,300
a. Diff from Res U 1+2 National Ave ($1,900) ($600) ($1,500) ($1,300) ($900) ($3,000) ($3,200) ($5,800) ($6,400) ($7,200) ($7,400)
b. Diff from Res Unv I National Ave ($2,600) ($1,300) ($2,500) ($2,200) ($2,000) ($4,300) ($4,300) ($6,800) ($7,300) ($8,100) ($8,200)
c. Difference from Peer Grp Ave ($1,500) ($791) ($2,600) ($1,500) ($1,100) ($3,500) ($4,900) ($7,400) ($7,000) ($7,500) ($6,600) ($5,500)
(4) Assistant Professor $24,500 $27,800 $28,200 $31,200 $33,100 $33,600 $35,440 $15,800 $38,600 $42,000 $44,500 $46,500
a. Diff from Res U 1+2 National Ave ($1,800) ($500) ($900) ($1,300) ($1,900) ($3,700) ($3,800) ($5,900) ($5,800) ($4,900) ($3,600)
b. Diff from: Res Unv 1 National Ave ($2,400) ($1,000) ($1,900) ($2,200) ($3,000) ($4,900) ($4,900) ($7,100) ($7,000) ($5,900) ($4,400)
c. Difference from: Peer Grp Ave ($1,600) ($284) ($1,600) ($900) ($1,600) ($3,700) ($4,600) ($6,700) ($5,800) ($4,500) ($2,600) ($1,600)
(5) Instructor $19,600 $22,400 $24,200 $26,700 $28,100 $28,900 $29,100 $30,800 $33,300 $39,000 $39,000 $40,700
a. Diff from Res U 1+2 National Ave ($800) $400 $1,800 $1,900 $1,400 $1,000 $0 ($500) $300 $4,800 $2,900
b. Diff from Res Unv I National Ave ($1,200) ($400) $1,000 $1,400 $800 $300 ($700) ($1,000) ($300) $3,000 $1,500
C. Difference from Peer Grp Ave ($500) $504 $2,700 $3,200 $3,200 $2,700 $1,300 $1,200 $1,600 $5,200 $4,400 $5,400
*Peer Group, prior to 1982-83: Colorado State University; Iowa State University; Kansas State University;
New Mexico State University; North Carolina State University (Raleigh); Oklahoma State University; Oregon State
University; Texas A & M University; Virginia Tech University; Washington State University.
/Peer Group, 1982-83 and subsequent years: University of California, Davis; Colorado State University;
IIIUniversity of Connecticut; Iowa State University; New Mexico State University; North Carolina State University;
Oregon State University; Pennsylvania State University; Rutgers University; Texas A & M University;
Virginia Tech University; Washington State University.
@Peer Group, 1989-90 and subsequent years: New Mexico State University (MC); Oregon State University; Washington State University;
11/
Colorado State University; North C&rolina State University (Raleigh); Iowa State University; University of Maryland (College Park);
Virginia Tech University; Texas A&M University; University of California (Davis).
17
I6-Sep-92

COMPARATIVE HISTORY OF FACULTY SALARIES AND COMPENSATION IN UTAH PUBLIC HIGHER EDUCATION 16-Sep-911I
7. Comprehensive Institutions--IIA
(1) All Ranks Combined
(2) Professor
(3) Associate Professor
(4) Assistant Professor
(5) Instructor
8. Gen Baccalaureate Institutions--IIB
(1) All Ranks Combined
(2) Professor
(3) Associate Professor
(4) Assistant Professor
(5) Instructor
9. Weber State University Peer Group * I
(1) All Ranks Combined
(2) Professor(3) Associate Professor
(4) Assistant Professor
(5) Instructor
10. So Utah University Peer Grp ** if NI
(1) All Ranks Combined
(2) Professor
(3) Associate Professor
(4) Assistant Professor
(5) Instructor
TABLE 2 -- TOTAL COMPENSATION Page 2-C
Estimated1981-82 1982-83 1983-84 1984-85 1985-86 1986-87 1987-88 1988-89 1989-90 1990-91 1991-92 1992-93
Estimated
$30,600 $32,300 $34,300 $37,000 $39,100 $41,500 $43,000 $46,900 $49,700 $52,500 $54,500
$38,500 $40,100 $42,100 $45,900 $48,200 $51,200 $53,400 $57,300 $61,000 $64,400 $66,700
$30,500 $32,100 $33,800 $36,600 $38,600 $40,800 $42,500 $46,200 $49,400 $52,000 $54,100
$24,900 $26,400 $28,000 $30,100 $31,800 $33,700 $34,800 $38,300 $40,800 $43,300 $45,200
$20,100 $21,000 $23,200 $24,100 $25,500 $26,400 $26,900 $29,900 $31,400 $32,900 $34,500
$26,600 $29,000 $29,900 $32,500 $34,600 $36,100 $37,700 $40,300 $42,600 $45,200 $47,400
$34,000 $36,300 $37,700 $40,700 $43,200 $44,800 $46,700 $49,900 $53,200 $55,400 $58,900
$28,100 $30,400 $31,400 $34,000 $36,300 $38,200 $39,400 $41,900 $44,200 $46,800 $49,100
$23,600 $25,500 $26,500 $28,500 $30,300 $31,600 $32,900 $34,900 $37,000 $39,300 $41,000
$19,000 $21,600 $22,200 $23,100 $24,500 $26,200 $26,800 $28,300 $30,300 $32,300 $33,300
$30,100 $34,500 $34,400 $31,600 $39,500 $42,200 $44,900 $46,900 $49,200 $51,600 $53,400 $54,100
$36,900 $41,000 $41,000 $44,700 $46,900 $49,700 $52,900 $55,700 $57,300 $60,400 $62,500 $63,300
$30,600 $33,900 $33,500 $36,500 $38,200 $41,000 $44,000 $46,300 $47,800 $50,700 $52,400 $53,000
$25,500 $28,200 $28,000 $30,600 $32,200 $34,500 $36,600 $38,700 $40,100 $42,400 $43,800 $44,400
$21,800 $22,800 $22,800 $25,200 $26,100 $27,900 $29,900 $30,200 $32,100 $32,200 $31,800 $32,600
$29,100 $34,500 $34,400 $37,600 $39,500 $42,200 $44,900 $46,900 $49,200 $51,600 $53,400 $54,100
$35,400 $41,000 $41,000 $44,700 $46,900 $49,700 $52,900 $55,700 $57,300 $60,400 $62,500 $63,300
$29,200 $33,900 $33,500 $36,500 $38,200 $41,000 $44,000 $46,300 $47,800 $50,700 $52,400 $53,000
$25,300 $28,200 $28,000 $30,600 $32,200 $34,500 $36,600 $38,700 $40,100 $42,400 $43,800 $44,400
$21,300 $22,800 $22,800 $25,200 $26,100 $27,900 $29,900 $30,200 $32,100 $32,200 $31,800 $32,600
*Peer Group, prior to 1982-83: University of Colorado at Colorado Springs; Metropolitan State College (Denver);
Boise State University; Indiana University, Northwest; University of Northern Iowa; Boston State College (MA);
Ferris State College (MI); Jersey City State College (NJ); Southern Oregon State College; West Chester University (PA);
Pan American University (TX); Central Washington University; University of Wisconsin, Oshkosh.
/Peer Group, 1982-83 to 1988-89: Boise State University (ID); University of California, Hayward;
Eastern Washington University; Jersey City State College (NJ); Metropolitan State College (CO);
University of Nevada, Las Vegas; University of Northern Arizona; University of Northern Iowa; Portland State University
(OR); State University of New York, College at Brockport; West Chester University (PA); University of Wisconsin, Oshkosh.
@Peer Group, 1989-90 and subsequent years: Indiana Univerlsty Northwest; University of Southern Colorado;
Southern Oregon State College; Austin Peay State Univerity (TN); California State Univeristy (Dominguez Hills);
Eastern Washington University; Boise State University (ID); SUNY College at Brockport; University of Nevada (Las Vegas);University of Wisconsin, Oshkosh.
**Peer Group, prior to 1982-83: Adams State College (CO); Fort Lewis College (CO); Delaware State College (DE);
Lewis and Clark State College (ID); Indiana State University, Evansville; New Mexico Highlands University;
Pembroke State University (NC); Southwest State University (MN); Central State University (OH); Lock Haven University(PA); Southern Oregon State College.
lPeer Group, 1982-83 to 1988-89: WSU group used for salary and tuition cowarison purposes.
O@Peer Group, 1989-90 and subsequent years: WSU group used for salary and tuition comparison purposes.
91:cit
18

COMPARATIVE HISTORY Of FACULTY SALARIES ARO COMPENSATION IN UTAH PUBLIC HIGHER EDUCATION
11. WEBER STATE UNIVERSITY
(1) All Ranks Combined
a. Diff from Comp Kat Ave (IIA)
b. Diff from Bacc Nat Ave (IIB)
c. Difference from Peer Grp Ave
(2) Professor
a. Diff from Comp Nat Ave (HA',
b. Diff from Bacc Nat Ave (11B)
c. Difference from Peer Grp Ave
(3) Associate Professor
a. Diff from Comp Nat Ave (ILA)
b. Diff from Bacc Nat Ave (1IB)
c. Difference from Peer Grp Ave
(4) Assistant Professor
a. Diff from Comp Nat Ave (IIA)
b. Diff from Bacc Nat Ave (IIB)
c. Difference from Peer Grp Ave
(5) Instructor
a. Diff from Comp Nat Ave (IIA)
b. Diff from Bacc Nat Ave (1IB)
c. Difference from Peer Grp Ave
111
12. SOUTHERN UTAH UNIVERSITY
(1) All Ranks Combined
a. Diff from Comp Nat Ave (IIA)
b. Diff from Bacc Nat Ave (1IB)
c. Difference from Peer Grp Ave
(2) Professor
a. Diff from Comp Nat Ave (IIA)
b. Diff from Bacc Nat Ave (11B)
c. Difference from Peer Grp Ave
(3) Associate Professor
a. Diff from Comp Nat Ave (IIA)
b. Diff from Bacc Nat Ave (IIB)
c. Difference from Peer Grp Ave
(4) Assistant Professor
a. Diff from Comp Nat Ave (hA)
b. Diff from Bacc Nat Ave (IIB)
C. Difference from Peer Grp Ave
(5) Instructor
a. Diff from Comp Nat Ave (IIA)
b. Diff from Bacc Nat Ave (IIB)
c. Difference from Peer Grp Ave
TABLE 2 -- TOTAL COMPENSATION Page 2-0
Estimated
1981-82 1982-83 1983-84 1984-85 1985-86 1986-87 1987-88 1988-89 1989-90 1990-91 1991-92 1992-93
$29,500 $32,200 $32,200 $35,600 $37,100 $38,500 $38,100 $38,400 $40,200 $42,100 $48,300 $50,400
($1,100) ($100) ($2,100) ($1,400) ($2,000) ($3,000) ($4,900) ($8,500) ($9,500)($10,400) ($6,200)
$2,900 $3,200 $2,300 $3,100 $2,500 $2,400 $400 ($1,900) ($2,400) ($3,100) $900
($600) ($2,300) ($2,200) ($2,000) ($2,400) ($3,700) ($6,800) ($8,500) ($9,000) ($9,500) ($5,100) ($3,700)
$35,500 $38,800 $36,500 $43,300 $45,200 $46,100 $46,500 $46,200 $48,200 $50,800 $58,800 $61,300
($3,000) ($1,300) ($3,600) ($2,600) ($3,000) ($5,100) ($6,900)($11,100)($12,800)($13,600) ($7,900)
$1,500 $2,500 $800 $2,600 $2,000 $1,300 ($200) ($3,700) ($5,000) ($4,600) ($100)
($1.400) ($2,200) ($2,500) ($1,400) ($1,700) ($3,600) ($6,400) ($9,500) ($9,100) ($9,600) ($3,700) ($2,000)
$29,900 $32,700 $31,900 $36,300 $38,200 $38,300 $38,700 $38,300 $40,600 $42,900 $50,000 $52,100
($600) $600 ($1,900) ($300) ($400) ($2,500) ($3,800) ($7,900) ($8,800) ($9,100) (t4,100)
$1,800 $2,300 $500 $2,300 $1,900 $100 ($700) ($3,600) ($3,600) ($3,900) $900
($700) ($1,200) ($1,600) ($200) $0 ($2,700) ($5,300) ($8,000) ($7,200) ($7,800) ($2,400) ($900)
$25,800 $28,700 $28,600 $31,700 $33,200 $34,000 $34,100 $34,600 $36,300 $37,700 $41,800 $43,600
$900 $2,300 $600 $1,600 $1,400 $300 ($700) ($3,700) ($4,500) ($5,600) ($3,400)
$2,200 $3,200 $2,100 $3,200 $2,900 $2,400 $1,200 ($300) ($700) ($1,600) $800
$300 $500 $600 $1,100 $1,000 ($500) ($2,500) ($4,100) ($3,800) ($4,700) ($2,000) ($800)
$20,200 $22,800 $23,500 $25,700 $25,000 $27,800 $26,300 $27,000 $28,200 $30,700 $.5,000 $36,500
$100 $1,800 $300 $1,600 ($500) $1,400 ($600) ($2,900) ($3,200) ($2,200) $500
$1,200 $1,200 $1,300 $2,600 $500 $1,600 ($500) ($1,300) ($2,100) ($1,600) $1,700
($1,600) $0 $700 $500 ($1,100) ($100) ($3,600) ($3,200) ($3,900) ($1,500) $3,200 $3,900
$26,200 $30,300 $30,600 $33,200 $35,200 $35,200 $37,000 $37,100 $38,800 $40,300 $42,600 $44,500
($2,400) ($2,000) ($3,700) ($3,800) ($3,900) ($6,300) ($6,000) ($9,800)($10,900)($12,200)($11,900)
$1,600 $1,300 $700 $700 $600 ($900) ($700) ($3,200) ($3,800) ($4,900) ($4,800)
($900) ($4,200) ($3,800) ($4,400) ($4,300) ($7,000) ($7,900) ($9,800)($10,400)($11,300)($10,800) ($9,600)
$34,200 $36,600 $36,100 $39,900 $43,100 $43,200 $45,500 $45,300 $47,200 $49,700 $50,300 $52,600
($4,300) ($3,500) ($6,000) ($6,000) ($5,100) ($8,000) ($7,900)($12,000)($13,800)($14,700)(Z16,400)
$200 $300 ($1.600) ($800) ($100) ($1,600) ($1,200) ($4,600) ($6,000) ($5,700) ($8,600)
($1,200) ($4,400) ($4,900) ($4,800) ($3,800) ($6,500) ($7,400)($10,400)($11,100)($10,700)($2,200)($10,700)
$27,900 $31,000 $31,500 $33,000 $35,100 $35,100 $36,900 $36,800 $39,500 $41,900 $43,600 $45,600
($2,600) ($1,100) ($2,300) ($3,600) ($3,500) ($5,700) ($5,600) ($9,400) ($9,900)($10,100)($10,500)
($200) $600 $100 ($1,000) ($1,200) ($3,100) ($2,500) ($5,100) ($4,700) ($4,900) ($5,500)
($1,300) ($2,900) ($2,000) ($3,500) ($3,100) ($5,900) ($7,100) ($9,500) ($8,300) ($8,800) ($8,800) ($7,400)
$24,300 $25,800 $26,200 $28,800 $29,600 $30,900 $31,000 $32,400 $33,500 $35,000 $38,600 $40,300
($600) ($600) ($1,800) ($1,300) ($2,200) ($2,800) ($3,800) ($5,900) ($7,300) ($8,300) ($6,600)
$700 $300 ($300) $300 ($700) ($700) ($1,900) ($2,500) ($3,500) ($4,300) ($2,400)
($1,000) ($2,400) ($1,800) ($1,800) ($2,600) ($3,600) ($5,600) ($6,300) ($6,600) ($7,400) ($5,200) ($4,100)
$21,400 $23,100 $22,700 $26,800 $26,440 $26,900 $27,000 $29,600 $32,800 $31,400 $34,200 $35,700
$1,300 $2,100 ($500) $2,700 $900 $500 $100 ($300) $1,400 ($1,500) ($300)
$2,400 $1,500 $500 $3,700 $1,900 $700 $200 $1,300 $2,500 ($900) $900
$100 $300 ($100) $1,600 $300 ($1,000) ($2,900) ($600) $700 ($800) $2,400 $3,100
2 ;5
19
16-Sep-92

CCMPARATIVE HISTORY OF FACULTY SALARIES APC CCMPENSATION IN UTAH PUBLIC HIGHER EDUCATION
13. Institutions Without Academic Ranks--IV
Essentially All Two-Year Institutions
TABLE 2 -- TOTAL CCMPENSATION
1981-82 1982-83 1983-84 1984-85
Estimated
1985-86 1986-87 1987-e8 1988-89 1989-90 1990-91
Page
Estimated
1991-92
2-E
1992-93
(1) All Faculty Combined $27,01:0 $29,300 $29,156 $30,200 $34,700 $37,800 $35,600 $38,200 $42,300 $45,700 $47,000
14. Metro Community College Pear Grp * "
(1) All Faculty Combined N/A $31,457 $32,502 $35,900 $37,900 $38,300 $41,300 $44,000 $45,400 $48,200 $50,800 $53,300
15. Rural Community College Peer Grp ** SI 4111 -
(1) All Faculty Combined N/A $29,788 $31,427 $35,900 $37,900 $38,300 $41,300 $44,000 $45,400 $48,200 $50,800 $53,300
16. Snow College ** /I
(1) All Faculty Combined $25,400 $20,w0 $28,400 $30,800 $33,400 $33,900 $35,900 $34,600 $37,700 $40,200 $40,500 $42,400
a. Diff from National Ave (IV) ($1,600) ($1,300) ($756) $600 ($1,300) ($3,900) $300 ($3,600) ($4,600) ($5,500) ($6,500)
b. Difference from Peer Grp Ave ($1,788) ($3,027)($5,100) ($4,500) ($4,400) ($5,400) ($9,400) ($7,700) ($8,000)($10,300)($10,900)
17. Dixie College
(1) All Faculty Combined $27,000 $30,400 $29,300 $31,700 $33,200 $33,400 $33,700 $34,100 $35,800 $37,800 $39,700 $43,700
a. Diff from National Ave (IV) $0 $1,100 $144 $1,500 ($1,500) ($4,400) ($1,900) ($4,100) ($6,500) ($7,900) ($7,300)
b. Difference from Peer Grp Ave $612 ($2,127) ($4,200) ($4,700) ($4,900) ($7,600) ($9,900) ($9,600)($10,400)($11,100) ($9,600)
18. College of Eastern Utah
(1) All Faculty Combined $24,800 $28,800 $27,900 $30,600 $32,000 $33,100 $33,800 $34,600 $35,700 $38,400 $39,200 $42,200
a. Diff from National Ave (IV) ($2,200) ($500) ($1,256) $400 ($2,700) ($4,700) ($1,800) ($3,600) ($6,600) ($7,300) ($7,800)
b. Difference from Peer Grp Ave ($988) ($3,527) ($5,300) ($5,900) ($5,200) ($7,500) ($9,400) ($9,700) ($9,800)($11,600)($11,100)
19. Utah Valley Community College
(1) All Faculty Combined $26,300 $29,300 $28,800 $32,000 $34,400 $34,700 $36,000 $36,800 $38,800 $40,800 $42,500 $44,400
a. Diff from National Ave (IV) ($700) $0 ($356) $1,800 ($300) ($3,100) $400 ($1,400) ($3,500) ($4,900) ($4,500)
b. Difference from Peer Grp Ave ($2,157) ($3,702) ($3,900) ($3,500) ($3,600) ($5,300) ($7,200) ($6,600) ($7,400) ($8,300) ($8,900)
20. Salt Lake Community College
(1) All Faculty Combined $26,000 $28,600 $28,300 $31,100 $33,100 $32,700 $34,440 $34,600 $36,100 $38,200 $40,200 $43,400a. Diff from National Ave (IV) ($1,000) ($700) ($856) $900 ($1,600) ($5,100) ($1,200) ($3,600) ($6,200) ($7,500) ($6,800)
b. Difference from Peer Grp Ave ($2,857) ($4,202) ($4,800) ($4,800) ($5,600) ($6,900) ($9,400) ($9,300)($10,000)($10,600) ($9,900)
*Peer Group, prior to 1982-83: Clark Co CC (KV); Chemeketa CC (OR); College of Southern Idaho; CC of Denver (CO);
Des hoines Area CC (IA); Lee College (TX); Maricopa Co CC (AZ); North Dakota State School of Science;
North Hennepin CC (KN); Penn Valley CC (M)); Pikes Peak CC (CO); Central Arizona College; Olympia Technical CC (WA);
Western Nevada CC.
!Peer Group, 1982-83 to 1988-89: Ann Arundel CC (MD); Austin CC (TX); Bergen CC (MD); Cheseketa CC (CR);
Clark Co CC (NY); College of Southern Idaho; Delaware CC (PA); Madison Area Tech Col (WI); Mount Hood CC (CR);
North Seattle CC (WA); Spokane CC (WA; [San Diego City College (CA) - -1982 -83 only].
**Peer Group, prior to 1982-83: Big Bend CC (WA); Blue Mountain CC (OR); Colorado Mt JC (CO); Flathead Valley CC (MT);
Miles CC (MT); Northern Nevada CC; North Idaho College; Northwest CC (WY); Northwestern JC (CO); Treasure Valley CC (CR);
Wenatchee Valley CC (WA); hestern Wyoming CC.
II Peer Group, 1982-83 and 1983-84: [Big Bend CC (WA)--1982-83 only]; Blue Mountain CC (CR);
College of the Siskiyous (CA); North Central Michigan College; Northeastern JC (CO); North Idaho College;
Northwest nc (WY); Treasure Valley CC (OR); Wenatchee Valley College (WA); Western Texas College;
Western Wyoming College; Yavapai College (AZ).
80Peer Group, 1984-85 to 1988-89: Metro Group used for faculty compensation and tuition and fee comparisons.
"Peer Group for All Community Colleges, 1989-90 and subsequent years: Western Wyoming Community College;
Danville Community Collece (VA); Yavapai College (AZ); North Idaho College; Joliet Jun:or College (IL);
Chemeketa Community College (OR); Anne Arundel Community College (M)); Spokane Community College (WA);
Onandaga Community College (NY); Grand Rapids Jr College (MI).
20
22-Stp-911

COMPARATIVE HISTCRY OF FACULTY SALARIES AND COMPENSKIION IN UTAH PUBLIC HIGHER EDUCATION
III 1. Research Univ--Carnegie Class 1 and 2
(1) All Ranks Combined
(2) Professor
(3) Associate Professor
(4) Assistant Professor
(5) Instructor
2. Research Universities-Carnegie
(I) All Ranks Combined
(2).Professor
(3) Associate Professor
(4) Assistant Professor
(5) Instructor
TABLE 3 -- SALARIES
IN 1992 CONSTANT DOLLARS
1981-82
$43,000
$54,400
$40,300
$32,800
$25,600
Class 1
$44,100
$55,900
$40,900
$33,400
$26,100
II/
3. University of Utah Peer Group + # IP
(I) All Ranks Combined
(2) Professor
(3) Associate Professor
(4) Assistant Professor
i(5) Instructor
4. UNIVERSITY OF UTAH
(1) All Ranks Combined $43,500
a. Diff from Res U 1+2 National Ave $500
b. Diff from Res Unv 1 National Ave ($600)
c. Difference from Peer Grp Ave ($3,100)
$46,600
$56,400
$41,400
$33,600
$27,100
(2) Professor $52,600
e. Diff from Res U 1+2 National Ave ($1,800)
b. Diff from Res Unv I National Ave ($3,300)
c. Difference from Peer Grp Ave ($3,800)
Associate Professor $38,200
a. Diff from Res U 1+2 National Ave ($2,100)
b. Diff from Res Unv 1 National Ave ($2,700)
c. Difference from Peer Grp Ave ($3,200)
(4) Assistant Professor $31,300
a. Diff from Res U 1+2 National Ave ($1,500)
b. Diff from Res Unv 1 National Ave ($2,100)
C. Difference from Peer Grp Ave ($2,300)
Instructor $26,700
a. Diff from Res U 1+2 National Ave $1,100
b. Diff from Res Unv I National Ave $600
IIIc. Difference from Peer Grp Ave ($400)
*Peer Group, Prior to 1982-83: University of Arizona; University of Southern California; University of Colorado (Boulder);
University of Florida; university of Iowa; University of Kentucky; University of North Carolina (Chapel Hill);
IIIUniversity of Oklahoma; University of Pittsburgh; University of Virginia.
Page 3-A
Estimated
1982-83 1983-84 1984.85 1985-86 1986-87 1987-88 1988-89 1989-90 1990-91 1991-92 1992-93
$44,600 $44,100 $46,000 $47,400 $50,100 $50,200 $51,000 $51,600 $51,200 $51,100
$55,900 $55,100 $57,400 $59,200 $62,200 $62,400 $63,500 $64,100 $63,900 $63,700
$41,400 $40,600 $42,300 $43,600 $45,900 $45,900 $46,800 $47,200 $46,900 $46,700
$33,900 $33,700 $35,700 $37,000 $38,900 $38,900 $39,600 540,000 $39,600 $39,500
$26,700 $26,300 $26,600 $28,000 $28,800 $29,700 $29,300 $29,400 $28,400 $28,800
$46,100 $45,600 $47,500 $49,200 $52,300 $52,300 $53,200 $53,500 $53,100 $52,800
$57,600 $57,200 $59,400 $61,600 $65,000 $65,200 $66,300 $66,700 $66,400 $66,000
$42,200 $41,600 $43,100 $44,600 $47,300 $47,000 $47,900 $48,000 $47,700 $47,600
$34,500 $34,600 $36,300 $37,800 $40,200 $40,000 $40,900 $41,000 $40,500 $40,500
$27,700 $27,100 $27,300 $28,400 $29,500 $30,000 $29,900 $29,800 $29,900 $29,900
$46,800 $48,100 $49,500 $51,200 $54,300 $55,900 $56,200 $56,800 $55,000 $54,400 $53,900
$58,500 $59,000 $60,700 $62,800 $66,700 $68,500 $69,100 $69,200 $67,800 $67,100 $66,500
$42,600 $42,600 $43,400 $44,600 $47,100 $48,100 $48,800 $49,900 $47,600 $47,100 $46,700
$34,400 $35,200 $36,300 $37,800 $40,000 $40,900 $41,600 $43,000 $40,400 $40,200 $39,800
$26,000 $26,600 $26,500 $27,600 $28,600 $28,800 $28,400 $32,000 $29,100 $29,600 $29,400
$45,500 $44,000 $46,000 $47,100 $46,700 $47,000 $46,100 $46,900 $47,400 $48,100 $49,000
$900 ($100) $0 ($300) ($3,400) ($3,200) ($4,900) ($4,700) ($3,800) ($3,000)
($600) ($1,600) ($1,500) ($2,100) ($5,600) ($5,300) ($7,100) ($6,600) ($5,700) ($4,700)
($1,300) ($4,100) ($3,500) ($4,100) ($7,600) ($8,900)($10,100) ($9,900) ($7,600) ($6,300) ($4,900)
$55,300 $53,100 $55,700 $57,000 $56,7C0 $57,000 $56,000 $56,800 $57,600 $58,400 $59,500
($600) ($2,000) ($1,700) ($2,200) ($5,500) ($5,400) ($7,500) ($7,300) ($6,300) ($5,300)
($2,300) ($4,100) ($3,700) ($4,600) ($8,300) ($8,200)($10,300) ($9,900) ($8,800) ($7,600)
($3,200) ($5,900) ($5,000) ($5,800)($10,000)($11,500)($13,100)($12,400)($10,200) ($8,700) ($7,000)
$40,000 $38,400 $39,900 $40,300 $40,300 $41,300 $40,100 $41,000 $41,200 $41,900 $42,700
($1,400) ($2,200) ($2,400) ($3,300) ($5,600) ($4,600) ($6,700) ($6,200) ($5,700) ($4,800)
($2,200) ($3,200) ($3,200) ($4,300) ($7,000) ($5.700) ($7,800) ($7,000) ($6,500) ($5,700)
($2,600) ($4,200) ($3,500) ($4,300) ($6,800) ($6,800) ($8,700) ($8,900) ($6,400) ($5,200) ($4,000)
$32,200 $31,400 $34,000 $35,700 $35,700 $35,900 $36,200 $37,200 $37,000 $37.700 538,400
($1,700) ($2,300) ($1,700) ($1,300) ($3,200) ($3,000) ($3,400) ($2,800) ($2,600) ($1,800)
($2,300) ($3,200) ($2,300) ($2,100) ($4,500) ($4,100) ($4,700) ($3,800) ($3,500) ($2,800)
($2,200) ($3,800) ($2,300) ($2,100) ($4,300) ($5,000) ($5,400) ($5,800) ($3,400) ($2.500) ($1,400)
$27,100 $26,400 $28,000 $29,800 $28,800 $30,400 $30,800 $29,600 $28,700 $29,200 $29,800
$400 $100 $1,400 $1,800 $0 $700 $1,500 $200 $300 $400
($600) ($700) $700 $1,400 ($700) $400 $900 ($200) ($1,200) ($700)
$1,100 ($200) $1,500 $2,200 $200 $1,600 $2,400 ($2,400) ($400) ($400) $400
OPeer Group, 1982-83 to 1988-89: University of Arizona; University of California, Los Angeles;
University of Cincinnati; University of Colorado (Boulder); University of Iowa; University of Michigan;
University of Korth Carolina; University of Pittsburgh; Purdue University; University of Texas (Austin);
iUniversity of Virginia; University of Washington.
OPeer Group, 1989-90 and subsequent years: University of Iowa; University of Virginia (MC); University of Colorado (Boulder);
University of Cincinnati (MC); University of Washington; University of North Carolina (Chapel Hill); Purdue University (MC);
University of Florida; University of California (Los Angeles); University of Arizona.
2 9 7
2 1
22 -Sep -92

CCCPARATIVE HISTORY Cf FACULTY SALARIES AND COMPENSATION IN UTAH PUBLIC HIGHER EDUCATION
5. Utah State University Peer Group * 0 0
(1) All Ranks Combined
(2) Professor
(3) Associate Professor
(4) Assistant Professor
(5) Instructor
TABLE 3 -- SALARIES Page 3-8
IN 1992 CONSTANT DOLLARS
Estimated1981-82 1982-83 1983-84 1984-85 1985-86 1986-87 1987-88 1988-89 1989-90 1990-91 1991-92 1992-93
$42,600 $44,200 $44,600 $45,500 $47,600 $50,600 $51,500 $52,200 $52,300 $51,800 $51,100 $51,000
$52,200 $55,700 $56,300 $57,400 $59,800 $63,600 $64,600 $65,700 $65,300 $64,600 $63,500 $63,300
$40,000 $41,700 $42,100 $42,600 $44,000 $46,700 $47,500 $48,200 $47,700 $47,000 $46,100 $46,000
$32,800 $34,100 $34,600 $34,900 $36,600 $39,100 $39,700 $40,200 $40,100 $39,300 $38,900 $38,900
$25,000 $26,600 $25,000 $24,900 $25,700 $26,800 $26,900 $27,000 $27,400 $27,700 $27,300 $27,300
6. UTAH STATE UNIVERSITY
(1) All Ranks Combined $38,100 $39,400 $38,500 $40,700 $41,900 $42,100 $41,500 $39,600 $39,700 $39,900 $39,300 $40,200
a. Diff from Res U 1+2 National Ave ($4,900) ($5,200) ($5,600) ($5,300) ($5,500) ($8,000) ($8,700)($11,400)($11,900)($11,300)($11,800)
b. Diff from Res Unv I National Ave ($6,000) ($6,700) ($7,100) ($6,800) ($7,300)($10,200)($10,800)($13,600)($13,800)($13,200)($13,500)
c. Difference from Peer Grp Ave ($4,500) ($4,800) ($6,100) ($4,800) ($5,700) ($8,500)($10,000)($12,600)($12,600)($11,900)($11,800)($10,800)
(2) Professor $46,800
a. Diff from Res U 1+2 National Ave ($7,600)
b. Diff from Res Unv 1 National Ave ($9,100)
$48,400 $46,500 $49,200 $50,400 $51,500 $50,700 $48,500 $48,500 $47,800 $47,100 $48,100
($7,500) ($8,600) ($8,200) ($8,800)($10,700)($11,700)($15,000)($15,600)($16,100)($16,600)
($9,200)($10,700)($10,200)($11,200) ($13,500)($14,500)($17,800)($18,200)($18,600)($18,900)c. Difference from Peer Grp Ave ($5,400) ($7,300) ($9,800) ($8,200) ($9,400)($12,100)($13,900)($17,200)($16,800)($16,800)($16,400)($15,200)
(3) Arsociate Professor $36,600 $38,300 $36,900 $38,900 $40,500 $40,400 $40,300 $38,600 $38,500 $37,800 $37,600 $38,400
a. Diff from Res U 1+2 National Ave ($3,700) ($3,100) ($3,700) ($3,400) ($3,100) ($5,500) ($5,600) ($8,200) ($8,700) ($9,100) ($9,100)
b. Diff from Res Unv 1 National Ave ($4,300) ($3,900) ($4,700) ($4,200) ($4,100) ($6,900) ($6,700) ($9,300) ($9,500) ($9,900)($10,000)
C. Difference from Peer Grp Ave ($3,400) ($3,400) ($5,200) ($3,700) ($3,500) ($6,300) ($7,200) ($9,600) ($9,200) ($9,200) ($8,500) ($7,600)
(4) Assistant Professor $29,500 $31,50t $30,700 $32,500 $33,300 $33,200 $33,500 $31,900 $32,600 $32,900 $33,600 $34,300
a. Diff from Res U 1+2 National Ave ($3,300) ($2,400) ($3,000) ($3,200) ($3,700) ($5,700) ($5,400) ($7,700) ($7,400) ($6,700) ($5,900)
b. Diff from Res Unv 1 National Ave ($3,900) ($3,000) ($3,900) ($3,800) ($4,500) ($7,000) ($6,500) ($9,000) ($8,400) ($7,600) ($6,900)
c. Difference from Peer Grp Ave ($3,300) ($2,600) ($3,900) ($2,400) ($3,300) ($5,900) ($6,200) ($8,300) ($7,500) ($6,400) ($5,300) ($4,600)
(5) Instructor $23,800 $25,700 $26,700 $28,100 $28,200 $28,700 $27,500 $27,600 $28,300 $30,100 $29,000 $29,700
a. Diff from Res U 1+2 Nationrl Ave ($1,800) ($1,000) $400 $1,500 $200 ($100) ($2,200) ($1,700) ($1,100) $1,700 $200
b. Diff from Res Unv 1 National Ave ($2,300) ($2,000) ($400) $800 ($200) ($800) ($2,500) ($2,300) ($1,500) $200 ($900)
c. Difference from Peer Grp Ave ($1,200) ($900) $1,700 $3,200 $2,500 $1,900 $600 $600 $900 $2,400 $1,700 $2,400
*Peer Group, prior to 1982-83: Colorado State University; Iowa State University; Kansas State University;
New Mexico State University; North Carolina State University (Raleigh); Oklahoma State University; Oregon State
University; Texas A & M University; Virginia Tech University; Washington State University.
SPeer Group, 1982-83 to 1988-89: University of California, Davis; Colorado State University;
University of Connecticut; Iowa State University; New Mexico State University; North Carolina State University;
Oregon State University; Pennsylvania State University; Rutgers University; Texas A & M University;
Virginia Tech University; Washington State University.
Peer Group, 1989-90 and subsequent years: New Mexico State University (MC); Oregon State University; Washington State University;
Colorado State University; North Carolina State University (Raleigh); Iowa State University; University of Maryland (College Dark);
Virginia Tech University; Texas A&M University; University of California (Davis).
22

I8. Gen Baccalaureate Institutions--IIB
(1) All Ranks Combined
(2) Professor
(3) Associate Professor
(4) Assistant Professor
(5) Instructor
COMPARATIVE HISTORY Cf FACULTY SALARIES AND COWENSATIC41 IN UTAH PUBLIC HIGHER EDUCATION
7. Comprehensive Institutions--IIA
(1) All Ranks Combined
(2) Professor
(3) Associate Professor
(4) Assistant Professor
(5) Instructor
III10. So Utah University Peer Grp ** if 14
(1) All Ranks Combined
(2) Professor
(3) Associate Professor
(4) Assistant Professor
(5) Instructor
9. Weber State University Peer Group * I I
(1) All Ranks Combined
(2) Professor
(3) Associate Professor
(4) Assistant Professor
(5) Instructor
TABLE 3 -- SALARIES
IN 1992 CONSTANT DOLLARS
Page 3-C
Estimated
1981-82 1982-83 1983-84 1P84-85 1985-86 1986-87 1987-88 1988-89 1989-90 1990-91 1991-92 1992-93
$37.900 $38,800 $39,200 $40,000 $41,400 $43,500 $43,100 $44,600 $44,800 $44,403 $44,400
$47,500 $48,400 $48,100 $49,600 $51,200 $53,900 $56,300 $54,800 $55,400 $55,000 $55,000
$37,800 $38,700 $38,700 $39,600 $40,700 $42,500 $42,400 $43,700 $44,400 $43,800 $43,900
$31,200 $31,800 $32,000 $32,600 $33,500 $35,100 $34,700 $36,100 $36,500 $36,300 $36,500
$25,300 $25,600 $26,600 $26,200 $26,800 $27,500 $26,600 $28,100 $28,000 $27,600 $27,800
$33,900 $35,400 $34,900 $36,000 $36,600 $37,900 $38,000 $38,500 $38,400 $38,300 $38,700
$43,300 $44,500 $44,000 $45,400 $45,900 $47,100 $47,300 $48,100 $48,400 $47,300 $48,500
$35,700 $36,800 $36,600 $37,700 $38,400 $39,800 $39,600 $40,100 $40,100 $39,600 $40,100
$30,100 $31,200 $30,900 $31,400 $32,100 $33,000 $33,100 $33,200 $33,200 $33,100 $33,300
$24,300 $26,300 $25,900 $25,400 $25,900 $27,500 $26,700 $26,900 $27,000 $27,900 $27,000
$37,200 $40,400 $40,100 $40,800 $41,800 $44,200 $44,900 $44,600 $43,800 $43,900 $44,000 $43,700
$45,900 $48,100 $47,700 $48,400 $49,600 $52,400 $53,200 $53,200 $51,800 $51,700 $51,700 $51,300
$37,600 $39,700 $39,200 $39,700 $40,300 $43,000 $43,800 $43,800 $41,500 $43,000 $43,000 $42,700
$31,300 $33,100 $32,500 $33,100 $33,900 $36,000 $36,400 $36,500 $35,900 $35,900 $36,300 $36,000
$26,500 $26,700 $26,600 $27,000 $27,500 $28,800 $29,500 $28,200 $28,300 $2G,700 $25,100 $25,200
$36,600 $40,400 $40,100 $40,800 $41,800 $44,200 $44,900 $44,600 $43,800 $43,900 $44,000 $43,700
$44,800 $48,100 $47,700 $48,400 $49,600 $52,440 $53,200 $53,200 $51,800 $51,700 $51,700 $51,300
$36,600 $39,700 $39,200 $39,700 $40,300 $43,000 $43.800 $43,800 $41,500 $43,000 $43,000 $42,700
$31,600 $33,100 $32,500 $33,100 $33,900 $36,000 $36,400 $36,500 $35,900 $35,900 $36,300 $36,000
$26,400 $26,700 $26,600 $27,000 $27,500 $28,800 $29,500 $28,200 $28,300 $26,700 $25,100 $25,200
III*Peer Group, prior to 1982-83: University of Colorado at C. orado Springs; Metropolitan State College (Denver);
Boise State University; Indiana University, Northwest; University of Northern Iowa; Boston State College (MA);
Ferris State College (MI); Jersey City State College (NJ); Southern Oregon State College; West Chester University (PA);
Pan American University (TX); Central Washington University; University of Wisconsin, Oshkosh.
III/Peer Group, 1982-83 to 1988-89: Boise State University (ID); University of California, Hayward;
Eastern Washington University; Jersey City State College (NJ); Metropolitan State College (CO);
University of Nevada, Las Vegas; University of Northern Arizona; University of Northern Iowa; Portland State University
(OR); State University of New York, College at Brockport; West Chester University (PA); University of Wisconsin, Oshkosh.
I@Peer Group, 1989-90 and subsequent years: Indiana Univeristy Northwest; University of Southern Colorado;
Southern Oregon State College; Austin Peay State Univerity (TN); California State Univeristy (Dominguez Hills);
Eastern Washington University; Boise State University (ID); SUNY College at Brockport; University of Nevada (Las Vegas);
Ur.:-2rsity of Wisconsin, Oshkosh.
111
**Peer Group, prior to 1982-83: Adams State College (CO): Fort Lewis College (CO); Delaware State College (DE);
Lewis and Clark State College (ID); Indiana State University, Evansville; New Mexico Highlands University;
Pembroke State University (NC); Southwest State University (MN); Central State University (OH); Lock Haven University
(PA); Southern Oregon State College.
Meer Group, 1982-83 to 1988-89: WSU group used for salary and tuition comparison purposes.
111@Peer Group, 1989-90 and subsequent years: WSU group used for salary and tuition comparison purposes.
299
2 3
22 -Sep -92

COMPARATIVE HISTORY OF FACULTY SALARIES AND CCMPENSATION IN UTAH PUBLIC HIGHER EDUCATION 22-Sep-91
TABLE 3 --
IN 1992 CONST
1981-82 1982-83
SALARIES
ANT DOLLARS
1983-84 1984-85 1985-86
Page 3-D
Estimated
1986-87 1987-88 1988-89 1989-90 1990-91 1991-92 1992-93
11. WEBER STATE UNIVERSITY
(1) All Ranks Combined $35,200 $36,200 $34,900 $36,800 $37,000 $37,500 $35,300 $34,000 $33,900 $33,400 $37,200 $38,000
a. Diff from Comp Nat Ave (IIA) ($2,700) ($2,600) ($4,300) ($3,200) ($4,400) ($6,000) ($7,800)($10,600)($10,900)($11,000) ($7,200)
b. Diff from Bacc Kat Ave (IIB) $1,300 $800 $0 .2,C0 $400 ($400) ($2,700) ($4,500) ($4,500) ($4,900) ($1,500)
c. Difference from Fear Grp Ave ($2,000) ($4,200) ($5,200) ($4,000) ($4,800) ($6,700) ($9,600)($10,600) ($9,900)($10,500) ($6,800) ($5,700)
(2) Professor $42,700 $44,000 $42,100 $45,000 $44,900 $45,300 $43,000 $41,400 $40,900 $40,800 $45,900 $46,800
a. Diff from Comp Nat Ave (IIA) ($4,800) ($4,400) ($6,000) ($4,600) ($6,300) ($8,600)($13,300)($13,400)($14,500)($14,200) ($9,100)b. Diff from Bacc Nat Ave (1IB) ($600) ($500) ($1,900) ($400) ($1,000) ($1,800) ($4,300) ($6,700) ($7,500) ($6,500) ($2,600)
c. Difference from Peer Grp Ave ($3,200) ($4,100) ($5,600) ($3,400', ($4,700) ($7,100)($10,200)($11,800)($10,900)($10,900) ($5,800) ($4,500)
(3) Associate Professor $35,700 $36,800 $34,600 $37,500 $37,900 $37,500 $35,800 $33,900 $34,200 $33,800 $38,500 $39,300
a. Diff from Comp Nat Ave (IIA) ($2,100) ($1,900) ($4,100) ($2,100) ($2,800) ($5,000) ($6,600) ($9,800)($10,200)($10,000) ($5,400)
b. Diff from Bacc Nat Ave (11B) $0 $0 ($2,000) ($200) ($500) ($2,300) ($3,800) ($6,200) ($5,900) ($5,800) ($1,600)c. Difference from Peer Grp Ave ($1,900) ($2,900) ($4,600) ($2,200) ($2,400) ($5,500) ($8,000) ($9,900) ($7,300) ($9,200) ($4,500) ($3,400)
(4) Assistant Professor $30,600 $32,200 $30,900 $32,500 $33,300 $32,800 $31,500 $30,500 $30,400 $29,700 $32,000 $32,600
a. Diff from Comp Kat Ave (IIA) ($600) $400 ($1,100) ($100) ($200) ($2,300) ($3,200) ($5,600) ($6,100) ($6,600) ($4,500)
b. Diff from Bacc Nat Ave (IIB) $500 $1,000 $0 $1,100 $1,200 ($200) ($1,640) ($2,700) ($2,800) ($3,400) ($1,300)
c. Difference from Peer Grp Ave ($700) ($900) ($1,600) ($600) ($RO) ($3,200) ($4,900) ($6,000) ($5,500) ($6,200) ($4,300) ($3,400)
(5) Instructor $23,800 $25,300 $25,000 $26,200 $24,900 $26,600 $24,300 $23,500 $23,200 $23,600 $26,100 $26,600
a. Diff from Comp Nat Ave (IIA) ($1,500) ($300) ($1,600) $0 ($1,900) ($900) ($2,300) ($4,600) ($4,8001 ($4,000) ($1,700)
b. Diff from Bacc Nat Ave (IIB) ($500) ($1,000) ($900) $800 ($1,000) ($900) ($2,400) ($3,400) ($3,800) ($4,300) ($900)
c. r oference from Peer Grp Ave ($2,700) ($1,400) ($1,600) ($800) ($2,600) ($2,200) ($5,200) ($4,700) ($5,100) ($3,100) $1,000 $1,400
12. SOUTHERN UTAH UNIVERSITY
(1) All Ranks Combined $33,300 $33,100 $32,100 $34,100 $34,900 $34,300 $34,300 $32,500 $32,400 $31,300 $32,000 $32,700
a. Diff from Comp Nat Ave (IIA) ($4,600) ($5,700) ($7,100) ($5,900) ($6,500) ($9,200) ($8,800)($12,100)($12,400)($13,100)($12,400)
b. Diff from Bacc Nat Ave ($500) ($2,300) ($2,800) ($1,900) ($1,700) ($3,600) ($3,700) ($6,000) ($6,000) ($7,000) ($6,700)
c. Difference from Peer Grp Ave ($3,300) ($7,300) ($8,000) ($6,700) ($6,900) ($9,900)($10,600)($12,100)($11,400)($12,600)($12,000)($11,000)
(2) Professor $41,100 $40,600 $38,500 $41,200 $42,700 $42,500 $42,200 $40,500 $39,700 $39,100 $39,200 $40,100
a. Diff from Comp kat Ave (IIA) ($6,400) ($7,800) ($9,600) ($8,400) ($8,500)($1L,400)($14,100)($14,300)($15,700)(15,900)($15,800)
b. Diff from Bacc Nat Ave (IIB) ($2,200) ($3,900) ($5,500) ($4,200) ($3,200) ($4,600) ($5,100) ($7,600) ($8,700) ($8,200) ($9,300)
c. Difference from Peer Grp Ave ($3,700) ($7,500) ($9,200) ($7,200) ($6,900) ($9,900)($11,000)($12,700)($12,100)($12,600)($12,500)($11,200)
(3) Associate Professor $32,200 $33,300 $32,700 $34,100 $34,800 $34,200 $34,200 $32,400 $33,000 $32,300 $33,000 $33,800
a. Diff from Comp Nat Ave (IIA) ($5,600) ($5,400) ($6,000) ($5,500) ($5,900) ($8,300) ($8,200)($11,300)($11,400)($11,500)($10,900)
b. Diff from Bacc Kat Ave (IIB) ($3,500) ($3,500) ($3,900) ($3,600) ($3,600) ($5,600) ($5,400) ($7,700) ($7,100) ($7,300) ($7,100)
c. Difference from Peer Grp Ave ($4,400) ($6,400) ($6,500) ($5,600) ($5,500) ($8,800) ($9,600)($11,400) ($8,500)($10,700)($10,000) ($8,900)
(4) Assistant Professor $28,600 $28,300 $27,700 $29,440 $29,300 $30,000 $28,700 $27,800 $28,000 $27,100 $28,200 $28,900
a. Diff from Comp Hat Ave (IIA) ($2,600) ($3,500) ($4,300) ($3,200) ($4,200) ($5,100) ($6,000) ($8,300) ($8,500) (19,200) ($8,300)
b. Diff from Bacc Nat Ave (11B) ($1,500) ($2,900) ($3,2110) ($2,000) ($2,800) ($3,000) ($4,400) ($5,400) ($5,200) ($6,000) ($5,100)
c. Difference from Peer Grp Ave ($3,000) ($4,800) ($4,800) ($3,700) ($4,600) ($6,000) ($7,700) ($8,700) ($7,900) ($8,800) ($8,100) ($7,100)
(5) Instructor $25,900 $25,000 $23,600 $26,200 $26,200 $25,800 $25,000 $25,300 $26,000 $24,200 $24,000 $24,600a. Diff from Coop Nat Ave (I11) $600 ($600) ($3,000) $0 ($600) ($1,700) ($1,600) ($2,800) ($2,000) ($3,400) ($3,800)
b. Di?f from Bacc Nat Ave (IIB) $1,600 ($1,300) ($2,300) $800 $300 ($1,700) ($1,700) ($1,600) ($1,000) ($3,700) ($3,000)
c. Difference from Peer Grp Ave ($500) ($1,700) ($3,000) ($800) ($1,300) ($3,000) ($4,500) ($2,900) ($2,300) ($2,500) ($1,100) ($600)
3
324

COWARATIVE 'AISTORY OF FACULTY SALARIES AND COMPENSATIDN IN UTAH PLSLIC HIGHER EDUCATION
13. Institutions Without Academic Ranks--IV
IIIEssentially
(1) All Faculty Combined
All Two-Year institutions
.- 14. Metro Coonvslty College Peer Grp * "
(I) All raculty Combina
I15. Rural Coanunity College Peer Grp ** Of
(1) All Faculty Combined
11116. Snow College ** II
(1) All Faculty Combined
a. Diff from National Ave (IV)
b. Difference from Peer Grp Ave
11117. Dixie College
(1) All Faculty Combined
a. Diff from National Ave (IV)
b. Difference from Oeer Grp Ave
II/
18. College of Eastern Utah
(1) All Faculty Combined
a. Diff from National Ave (IV)
b. Difference from Peer Grp Ave
III
19. Utah Valley Cnamunity College
(1) All Faculty Combined
a. Diff from National Ave (IV)
b. Difference from Peer Grp Ave
III
20. Salt Lake Community College
(1) All Faculty Combined
a. Diff from National Ave (IV)
b. Difference from Peer Grp Ave
TABLE 3 -- SALARIES
IN 1992 CONSTANT DOLLARS
Page
Estimated
3-E
1981-82 1982-83 1983-84 1984-85 1985-86 1966-87 1987-88 1988-89 1909-90 1990-91 1991-92 1992-93
$34,500 $36,100 $33,900 $33,200 $36,900 $40,000 $35,500 $36,500 $38,500 $39,200 $39,000
N/A $37,100 $37,800 $38,400 $38,800 $39,700 $39,800 $40,100 $39,700 $39,400 $40,300 $41,300
N/A $34,800 $34,900 $38,400 $38,800 $39,700 $39,800 $40,100 $39,700 $39,400 $40.300 $41,300
$30,100 $31,000 $30,300 531.200 $32,600 $32,800 $33,100 $30,800 $30,800 $30,700 $29,800 $30,600
($4,400) ($5,100) ($3,600) ($2,000) ($4,300) ($7,200) ($2,400) ($5,700) ($7,700) ($8,500) ($0,200)
($3,800) ($4,600) ($7,200) ($6,200) ($6,900) ($6,700) ($9,300) ($8,900) ($8,700)($10,500)($10,700)
$31,600 $33,200 $30,900 $32,800 $33,100 $32,800 $31,500 $30,200 $29,800 $29,300 $29,400 $31,700
($2,900) ($2,900) ($3,000) ($400) ($3,800) ($7,200) ($4,000) ($6,300) ($8,700) ($9,900) ($9,600)
($1,600) ($4,000) ($5,600) ($5,700) ($6,900) ($8,300) ($9,900) ($9,900)($10,100)($10,900) ($9,600)
$30,000 $32,000 $29,900 $31,000 $31,600 $32,800 $31,300 $29,500 $29,200 $29,400 $29,300 $30,900
($4,500) ($4,100) ($4,000) ($2,200) ($5,300) ($7,200) ($4,200) ($7,000) ($9,300) ($9,800) ($9,700)
($2,800) ($5,000) ($7,400) ($7,200) ($6,900) ($8,500)($10,600)($10,500)($10,003)($11,000)($10,400)
$30,900 $31,800 $30,000 $32,600 $34,200 $33,900 $33,600 $32,300 $32,000 $31,600 $31,800 $32,500
($3,600) ($4,300) ($3,900) ($600) ($2,700) ($6,100) ($1,900) ($4,200) ($6,500) ($7,600) ($7,200)
($5,300) ($7,800) ($5,800) ($4,600) ($5,800) ($6,200) ($7,800) ($7,700) ($7,800) ($8,500) ($8,800)
$30,900 $31,200 $29,800 $31,800 $32,600 $31,600 $31,500 $29,900 $29,400 $29,000 $29,700 $31,300
($3,600) ($4,900) ($4,100) ($1,400) ($4,300) ($8,409) ($4,000) ($6,600) ($9,100)($10,91) ($9,300)
($5,900) ($8,000) ($6,600) ($6,200) ($8,100) ($8,300)($10,200)($10,300)($10,400)($10,600)($10,000)
111 *Peer Group. prior to 1982-83: Clark Co CC (NV); Chemeketa CC (CR); College of Southern Idaho; CC of Denver (CO);
Des Moines Area CC (IA); Lce College (TX); Maricopa Co CC (AZ); North Dakota State School of Science;
North Hennepin CC (MN); Penn Valley CC (R)); Pikes Peak CC (CO); Central Arizona College: Olympia Technical CC (WA);
Western Nevada CC.
I/Peer Group, 1982-83 to 1988-89: Ann Arundel CC (MD); Austin CC (TX); Bergen CC (MD); Chemeketa CC (OR);
Clark Co CC (NV); College of Southern Idaho; Delaware CC (PA); Madison Area Tech Col (WI); Mount Hood CC (CR);
North Seattle CC (WA); Spokane CC (WA; [San Diego City College (CA) - -1982-83 only].
**Peer G.oup, prior to 1982-83: Big Bend CC (WA); Blue Mountain CC (CR); Colorado Mt JC (CO); Flathead Valley CC (KT);
IIIMiles CC (KT); Northern Nevada CC; North Idaho College; Northwest CC (WY); Northwestern JC (CO); Treasure Valley CC (OR);
Wenatchee Valley CC (WA); Western Wyoming CC.
AO Peer Group, 1982-83 and 1983-84: [Big Bend CC (WA) - -1982 -83 only]; Blue Mountain CC (OR);
College of the Siskiyous (CA); North Central Michigan College; Northeastern JC (CO); North Idaho College;
Northwest CC (WY); Treasure Valley CC (CR); Wenatchee Valley College (WA); Western Texas College;
IIIWestern Wyoming College; Yavapai College (Al).
(*Peer Group, 1984-85 to 1988-89: Metro Group used for faculty compensation and tuition and fee comparisons.
"Peer Group for All Community Colleges, 1989-90 and subsequent years: Western Wyoming Community College;
Danville Community College (VA); Yavapai College (AZ); North Idaho College; Joliet Junior College (IL);
Chemeketa Community College (OR); Anne Arundel Community College (MD); Spokane Community College (WA);
3
25
22-Sep-92

COMPARATIVE HISTORY OF FACULTY SALARIES AND CCMPENSATICO IN UTAH PUBLIC HIGHER EDOCATICC
TABLE 4 -- TOTAL COMPENSATION
IN 1992 CONSTANT DOLLARS
1981-82 1982-83 1983-84 1984-85
Estimuted
1985-86 1986-87 1987-88 1988-89 1989-90 1990-91
Page
Estimated
1991-92
4-A
1992-93
1, Research Univ--Carnegle Class 1 and 2
(1) All Ranks Combined $51,400 $53,100 $53,000 $55,800 $57,800 $60,800 $60,900 $62,100 $63,200 $63,000 $62,700
(2) Professor $64,500 $66,100 $66,200 $69,200 $71,400 $75,100 $75,200 $76,600 $77,900 $77,700 $77,400
(3) Associate Professor $48,300 $49,400 $48,800 $51,600 $53,200 $56,100 $55,300 $57,400 $58,300 $58,000 $57,700
(4) Assistant Pro $39,400 $40,900 $40,500 $43,500 $45,100 $47,600 $47,900 $48,800 $49,600 $49,400 $49,100
(5) Instructor $30,600 $31,800 $31,200 $33,200 $34,400 $35,600 $35,500 $36,600 $36,900 $36,000 $36,900
2. Research Universities--Carnegie Class 1
(1) All Ranks Combined $53.200 $55,000 $55,100 $57,900 $60,100 $63,400 $63,400 $64,400 $65,500 $65,000 $64,500
(2) Professor $66,400 $68,300 $69,000 $72,000 $74,400 $78,400 $78,400 $79,700 $80,800 $80,500 $79,900
(3) Associate Professor $49,300 $50,400 $50,200 $52,900 $54,700 $57,800 $57,600 $58,600 $59,300 $59,000 $58,500
(4) Assistant Professor $40,300 $41,600 $41,900 $44,700 $46,500 $49,100 $49,200 $50,200 $51,000 $50,400 $50,000
(5) Instructor $31,200 $32,900 $32,300 $33,900 $35,200 $36,500 $36,400 $37,200 $37,500 $37,900 $38,300
3. University of Utah Peer Group * I ki
(1) All Ranks Combined $54,600 $56,400 $57,400 $60,200 $62,300 $65,500 $67,800 $68,900 $69,800 $67,900 $67,200 $66,900
(2) Professor $65,800 $70,600 $70,500 $73,200 $75,700 $79,600 $82,200 $83,700 $84,100 $82,700 $82,100 $61,700
(3) Associate Professor $48,900 $51,400 $50,900 $53,300 $54,800 $57,500 $59,200 $60,500 $62,100 $59,600 $59,100 $58,800
(4) Assistant Professor $39,700 $41,400 $42,000 $44,700 $46,400 $49,100 $50,440 $51,800 $53,900 $51,200 $50,300 $50,100
(5) Instructor $31,900 $31,300 $31,700 $33,500 $33,800 $34,700 $35,400 $35,000 $40,100 $37,500 $37,900 $37,600
4. UNIVERSITY OF UTAH
(1) All Ranks Combined $53,700 $57,200 $55,200 $58,600 $60,100 $59,800 $60,200 $59,500 $61,000 ;31,000 $62,900 $64,100
a. Diff from Res U 1+2 National Ave $2,300 $4,100 $2,200 $2,800 $2,300 ($1,000) ($700) ($2,600) ($2,200) ($2,000) $200
b. Diff from Res Unv 1 National Ave $500 $2,200 $100 $700 $0 ($3,600) ($3,200) ($4,900) ($4,500) ($4,000) ($1,600)
c. Difference from Peer Grp Ave ($900) $800 ($2,200) ($1,600) ($2,200) ($5,700) ($7,600) ($9,400) ($8,800) ($6,900) ($4,300) ($2,800)
(2) Professor $64,300 $68,900 $66,200 $70,200 $72,800 $72,000 $72,200 $71,700 $73,000 $73,100 $75,300 $76,700
a. Diff from Res U 1+2 National Ave ($200) $2,800 $0 $1,000 $1,400 ($3,100) ($3,000) ($4,900) ($4,900) ($4,600) ($2,100)
b. Diff from Ras Unv 1 National Ave ($2,100) $600 ($2,800) ($1,800) ($1,600) ($6,400) ($6,200) ($8,000) ($7,800) ($7,400) ($4,600)
c. Difference from Peer Grp Ave ($1,500) ($1,700) ($4,300) ($3,000) ($2,900) ($7,600)($10,000)($12,000)($11,100) ($9,600) ($6,800) ($5,000)
(3) Associate Professor $47,700 $50,700 $48,700 $51,100 $51,400 $51,900 $53,200 $52,300 $53,700 $53,600 $55,600 $56,600
s. Diff from Res U 1+2 National Ave ($600) $1,300 ($100) ($500) ($1,800) ($4,200) ($3,100) ($5,100) ($4,600) ($4,400) ($2,100)
b. Diff from Res Unv 1 National Ave ($1,600) $300 ($1,500) ($1,800) ($3,300) ($5,900) ($4,400) ($6,300) ($5,600) ($5,400) ($2,900)
c. Difference from Peer Grp Ave ($1,200) ($700) ($2,200) ($2,200) ($3,400) ($5,600) ($6,000) ($8,200) ($8,400) ($6,000) ($3,500) ($2,200)
(4) Assistant Professor $39,400 $41,100 $40,200 $43,900 $45,600 $46,300 $46,900 $47,600 $49,200 $48,400 $50,500 $51,400
a. Diff from Res U 1+2 National Ave $0 $200 ($300) $400 $500 ($1,300) ($1,000) ($1,200) ($400) ($1,000) $1,400
b. Diff from Res Unv 1 National Ave ($900) ($500) ($1,700) ($800) ($900) ($2,800) ($2,300) ($2,600) ($1,800) ($2,000) $500
c. Difference from Peer Grp Ave ($300) ($300) ($1,800) ($800) ($800) ($2,800) ($3,500) ($4,200) ($4,700) ($2,800) $200 $1,300
(5) Instructor $33,700 $35,100 $34,200 $36,400 $38,200 $37,700 $40,200 $40,800 $40,000 $38,300 $40,200 $40,900
a. Diff from Res U 1+2 National Ave $3,100 $3,300 $3,000 $3,200 $3,800 $2,100 $4,700 $4,200 $3,100 $2,300 $3,300
b. Diff from Res Unv 1 National Ave $2,500 $2,200 $1,900 $2,500 $3,000 $1,200 $3,800 $3,600 $2,500 $400 $1,900
c. Difference from Peer Grp Ave $1,800 $3,800 $2,500 $2,900 $4,400 $3,000 $4,800 $5,800 ($100) $800 $2,300 $3,300
*Peer Group, Prior to 1982-83: University of Arizona; University of Southern California; University of Colorado (Boulder);
University of Florida; University of !ma; University of Kentucky; University of North Carolina (Chapel Hill);
University of Oklah:ca; University of Pittsburgh; University of Virginia.
#Peer Group, 1982-83 and subsequent years: University of Arizona; University of California, Los Angeles;
University of Cincinnati; University of Colorado (Boulder); University of Iowa; University of Michigan;
University of North Carolina; University of Pittsburgh; Purdue University; University of Texas (Austin);
Universlcy of Virginia; University of Washington.
(Weer Group, 1989-90 and subsequent years: University of Iowa; University of Virginia (MC); University of Colorado (Boulder);
University of Cincinnati (MC); University of Washington; University of North Carolina (Chapel Hill); Purdue University (MC);
University of Florida; University of California (Los Angeles); University of Arizona.
3 2
26

COMPARATIVE HISTORY OF FACULTY SALARIES AM) COMPENSATICM IN UTAH PUBLIC HIGHER EDUCATION
I 5. Utah State University Peer Group * O
(1) All Ranks Combined
(2) Professor
(3) Associate Professor
I(4) Assistant Professor
(5) Instructor
6. UTAH STATE UNIVERSITY
(1) All Ranks Combined
a. Diff from Res U 1+2 National Av
b. Diff from Res Unv 1 National Av
c. Difference from Peer Grp Ave
TABLE 4 -- TOTAL CCMPENSATION
IN 1992 CONSTANT DOLLARS
1981-82
$50,400
$61,500
$47,700
$39,100
$30,100
$47,100e ($4,300)
e ($6,100)
($3,300)
$57,600
e ($6,900)
e (18,800)
($3,900)
$45,440
e ($2,900)
e ($3,900)
($2,300)
$36,700
e ($2,700)
e ($3,600)
($2,400)
(2) Professor
a. Diff from Res U 1+2 National Av
b. Diff from Res Unv 1 National Av
c. Difference from Peer Grp Ave
(3) Associate Professor
a. Dlff from Res U 1+2 National Av
b. Diff from Res Unv 1 National Av
c. Difference from Peer Grp Ave
(4) Assistant Professor
a. Diff from Res U 1+2 National Av
b. Diff from Res Unv 1 National Av
c. Difference from Peer Grp Ave
(5) Instructor $29,400
a. Diff from Res U 1+2 National Ave ($1,200)
b. Diff from Res Unv 1 National Ave ($1,800)
E. Difference from Peer Grp Ave ($700)
Paoe 4-6
Estimated
1982-83 1983-84 1984-85 1985-86 1986-87 1987-88 1988-89 1989-90 1990-91 1991-92 1992-93
ESTIMATED
$52,600 $53,400 $55,400 $57,500 $61,100 $62,800 $63,700 $64,100 $63,600 $62,500 $62,300
$66,300 $67,300 $69,300 $71,700 $75,900 $77,84 $79,300 $79,200 $78,200 $76,800 $76,600
$49,600 $50,400 $51,900 $53,500 $56,700 $88,400 $59,300 $59,000 $58,300 $56,900 $56,800
$40,500 $41,400 $43,000 $44,700 $47,600 $48,800 $49,700 $49,600 $49,000 $48,100 $48,100
$31,600 $29,900 $31,400 $32,100 $33,400 $33,900 $34,600 $35,400 $35,600 $35,400 $35,300
$49,800 $48,700 $52,200 $53,800 $54,100 $53,700 $51,700 $52,300 $53,100 $52,100 $53,200
($3,300) ($4,300) ($3,600) ($4,000) ($6,700) ($7,200)($10,400)($10,900) ($9,900)($10,600)
($5,200) ($6,400) ($5,700) ($6,300) ($9,300) ($9,700)($12,700)($13,200)($11,900)($12,400)
($2,800) ($4,700) ($3,200) ($3,700) ($7,000) ($9,100)($12,600)($11,800)($10,500)($10,400) ($9,100)
$60,900 $58,600 $62,900 $64,700 $65,900 $65,200 $63,000 $63,600 $62,800 $61,100 $62,400
($5,200) ($7,600) ($6,300) ($6,700) ($9,200)($10,000)($13,600)($14,300)($14,900)($16,300)
($7,400)($10,400) ($9,100) ($9,700)($12,500)($13,200)($16,700)($17,200)($17,700)($18,800)
($5,400) ($8,700) ($6,400) ($7,000)($10,000)($12,600)($16,300)($15,600)($15,400)($15,700)($14,200)
$48,500 $46,700 $49,900 $52,100 $52,300 $52,400 $50,600 $51,200 $50,400 $50,200 $51,300
($900) ($2,100) ($1,700) ($1,100) ($3,800) ($3,900) ($6,800) ($7,100) ($7,600) ($7,500)
($1,900) ($3,500 ($3,000) ($2,600) ($5,500) ($5,200) ($8,000) ($8,100 ($8,600) ($8,300)
($1,100) ($3,700) ($2,000) ($1,400) ($4,400) ($6,000) ($8,700) ($7,800) ($7,900) ($6,700) ($5,500)
$40,100 $39,200 $41,700 $42,700 $42,800 $43,200 $41,900 $43,100 $44,200 $45,500 $46,500
($800) ($1,300) ($1,800) ($2,400) (14,800) ($4,700) ($6,900) ($6,500) ($5,200) ($3,600)
($1,500) ($2,700) ($3,000) ($3,800) ($6,300) ($6,000) ($8,300) ($7,900) ($6,200) ($4,500)
($400) ($2,200) ($1,300) ($2,000) ($4,800) ($5,600) ($7,800) ($6,500) ($4,800) ($2,600) ($1,600)
$32,300 $33,700 $35,700 $36,200 $36,900 $35,500 $36,000 $37,200 $41,100 $39,800 $40,700
$500 $2,500 $2,500 $1,800 $1,300 $0 ($600) $300 $5,100 $2,900
($600) $1,400 $1,800 $1,000 $400 ($900) ($1,200) ($300) $3,200 $1,500
$700 $3,800 $4,300 $4,100 $3,500 $1,600 $1,400 $1,800 $5,500 $4,400 $5,400
111 *Peer Group, prior to 1982-113: Colorado State University; Iowa State University; Kansas State University;
New Mexico State University; Worth Carolina State University (Raleigh); Oklahoma State University; Oregon State
University; Texas A & M University; Virginia Tech University; Washington State University.
IOPeer Group, 1982-83 to 1988-89: University of California, Davis; Colorado State University;
University of Connecticut; Iowa State University; New Mexico State University; North Carolina State University;
Oregon State University; Pennsylvania State University; Rutgers University; Texas A & M University;
Virginia Tech University; Washington State University.
II/@Peer Group, 1989-90 and subsequent years: New Mexico State University (MC); Oregon State University; Washington State University;
Colorado State University; North Carolina State University (Raleigh); Iowa State University; University of Maryland (College Park);
Virginia Tech University; Texas A&M University; University of California (Davis).
3 1 3
2 7
22-Sep-92

7. Comprehensive Institutions--IIA
(1) All Ranks Combined
(2) Professor
(3) Associate Professor
(4) Assistant Professor
(5) Instructor
8. Gen Baccalaureate Institutions-11B
(1) All Ranks Combined
(2) Professor
(3) Associate Professor
(4) Assistant Professor
(5) Instructor
9. Weber State University Peer
(1) All Ranks Combined
(2) Professor
(3) Associate Professor
(4) Assistant Professor
(5) Instructor
COMPARATIVE HISTCRY OF FACULTY SALARIES AND COMPENSATION IN UTAH PUBLIC HIGHER EDUCATION
TABLE 4 -- TOTAL COMPENSATION
IN 1952 CONSTANT DOLLARSPage 4-C
Estimated1981-82 1982-83 1983-84 1984-85 1985-86 1986-87 1987-88 1988-89 1989-90 1990-91 1991-92 1992-93
Estlimited
$45,900 $46,600 $47,700 $49,500 $50,400 $52,900 $52,500 $54,800 $55,500 $55,300 $55,700$57,700 $57,900 $58,600 $61,400 $62,100 $65,300 $65,200 $67,000 $68,200 $67,800 $68,200
$45,700 $46,300 $47,000 $49,000 $49,800 $52,000 $51,900 $54,000 $55,200 $54,800 $55,300
$37,300 $38,100 $38,900 $40,300 $41,000 $43,000 $42,500 $44,800 $45,600 $45,600 $46,200$30,100 $30,300 $32,300 $32,200 $32,900 $33,700 $32,800 $35,000 $35,100 $34,600 $35,300
$39,900 $41,900 $41,600 $43,500 $44,600 $46,000 $46,000 $47,100 $47,600 $47,600 $48,400
$51,000 $52,400 $52,400 $54,500 $55,700 $57,100 $57,000 $58,300 $59,400 $58,300 $60,200$42,100 $43,900 $43,700 $45,500 $46,800 $48,700 $48,100 $49,000 $49,400 $49,300 $50,200
$35,400 $36,800 $36,900 $38,100 $39,100 $40,300 $40,200 $40,800 $41,300 $41,400 $41,900
$28,500 $31,200 $30,900 $30,900 $31,600 $33,400 $32,700 $33,100 $33,900 $34,000 $34,000
Group * f
$45,100 $49,800 $47,800 $50,300 $50,900 $53,800 $54,800 $54,800 $55,000 $54,300 $54,600
$55,,00 $59,200 $57,000 $59,800 $60,500 $63,400 $64,600 $65,100 $64,000 $63,600 $63,900$45,900 $48,900 $46,600 $48,800 $49,200 $52,300 $53,700 $54,100 $53,400 $53,400 $53,500
$38,200 $40,700 $38,900 $40,900 $41,500 $44,000 $44,700 $45,300 $44,800 $44,600 $44,800
$32,700 $32,900 $31,700 $33,700 $33,600 $35,600 $36,500 $35,300 $35,900 $33,900 $32,500
10. So Utah University Peer Grp ** ff
(1) All Ranks Combined
(2) Professor
(3) Associate Professor
(4) Assistant Professor
(5) Instructor
$43,600 $49,800 $47,800 $50,300 $50,900 $53,800 $54,800 $54,800 $55,000 $54,300
$53,100 $59,200 $57,000 $59,800 $60,500 $63,400 $64,600 $65,100 $64,000 $63,600
$43,800 $48,900 $46,600 $48,800 $49,200 $52,300 $53,700 $54,100 $53,400 $53,400
$37.900 $40,700 $38,900 $40,900 $41,500 $44,000 $44,700 $45,300 $44,800 $44,600
$31,900 $32,900 $31,700 $33,700 $33,600 $35,600 $36,500 $35,300 $35,900 $33,900
*Peer Group, prior to 1982-83: University of Colorado at Colorado Springs; Metropolitan State College (Denver);
Boise State University; Indiana University, Northwest; University of Northern Iowa; Boston State College (MA);
Ferris State College (MI); Jersey City State College (NJ); Southern Oregon State College; West Chester University (PA);
Pan American University (TX); Central Washington University; University of Wisconsin, Oshkosh.
!Peer Group, 1982-83 to 1988-89: Boise State University (ID); University of California, Hayward;
Eastern Washington University; Jersey City State College (NJ); Metropolitan State College (CO);
University of Nevada, Las Vegas; University of Northern Arizona; University of Northern Iowa; Portland State University
(OR); State University of New York, College at Brockport; West Chester University (PA); University of Wisconsin, Oshkosh.
@Peer Group, 1989-90 and subsequent years: Indiana Univeristy Northwest; University of Southern Colorado;
Southern Oregon State College; Austin Peay State Univerity (TN); California State Univeristy (Dominguez Hills);
Eastern Washington University; Boise State University (ID); SUNY College at Brockport; University of Nevada (Las Vegas);
University of Wisconsin, Oshkosh.
**Peer Group, prior to 1982-83: Adams State College (CO); Fort Lewis College (CO); Delaware State College (DE);
Lewis and Clark State College (ID); Indiana State University, Evansville; New Mexico Highlands University;
Pembroke State University (NC); Southwest State University (MN); Central State University (OH); Lock Haven University(PA): Southern Oregon State College.
ffPeer Group, 1982-83 to 1988-89: WSU group used for salary and tuition comparison purposes.
P@Peer Group, 1989-90 and subsequent years: WSU group used for salary and tuition comparison purposes.
3i 14
28
$54,100
$63,300
$53,000
$44,400
$32,600
$54,600 $54,100
$63,900 $63,300
$53,500 $53,000
$44,800 $44,400
$32,500 $32,600
22-Sep'9111

a
11. WEBER STATE UNIVERSITY
(1) All Ranks Combined
a. Diff from Comp Nat Ave (ILA)
b. Diff from Bacc Nat Ave (IIB)
c. Difference from Peer Grp Ave
(2) Professor
a. Diff from Comp Nat Ave (ILA)
b. Diff from Bacc Nat Ave (II13)
c. Difference from Peer Grp Ave
(3) Associate Professor
a. Diff from Comp Nat Ave (IIA)
b. Diff from Bacc Nat Ave (1IB)
c. Difference from Peer Grp Ave
(4) Assistant Professor
a. Diff from Comp Nat Ave (IIA)
b. Dlff from Bacc Nat Ave (IIB)
c, Difference from Peer Grp Ave
(5) Instructor
a. Diff from Comp Nat Ave (IIA)
b. DIff from Bacc Nat Ave (IIB)
c. Difference from Peer Grp Ave
.
III
12. SOUTHERN UTAH UNIVERSITY
(1) All Ranks Combined
a. Diff from Comp Nat Ave (IIA)
b. Diff from Bacc Nat Ave (11B)
c. Difference from Peer Grp Ave
(2) Professor
a. Diff from Comp Nat Ave (IIA)
b. Diff from Bea Nat Ave (118)
c. Difference from Peer Grp Ave
(3) Associate Professor
a. Diff from Comp Nat Ave (IIA)
b. Diff from Bacc Nat Ave (IIB)
C. Difference from Peer Grp Ave
(4) Assistant Professor
a. Diff from Comp Nat Ave (IIA)
b. Diff from Bacc Nat Ave (IIB)
c. Difference from Peer Grp Ave
(5) Instructor
a. Diff from Comp Nat Ave (ILA)
b. Diff from Bacc Nat Ave (IIB)
c. Difference from Peer Grp Ave
a
COMPARATIVE HISTORY CF FACULTY SALARIES AND CCMPENSATION IN UTAH PUBLIC HIGHER EDUCATION
TABLE 4 -- TOTAL CCMPENSATION
IN 1992 CONSTANT DOLLARS
Page 4-D
Estimated
1981-82 1982-83 1983-84 1984-85 1985-86 1986-87 1987-88 1988-89 1989-90 1990-91 1991-92 1992-93
$44,200 $46,500 844,800 $47,600 $47,800 $49,100 $46,500 $44,900 $44,900 $44,300 $49,400 $50,400
($1,700) ($100) ($2,900) ($1,900) ($2,600) ($3,800) ($6.000) ($9,900)($10,600)($11,000) ($6,300)
$4,300 $4,600 $3,200 $4,100 $3,200 $3,100 $500 ($2,200) ($2,700) ($3,300) '1,000
($900) ($3,300) ($3,000) ($2,700) ($3,100) ($4,700) ($8,300) ($9,900)($10,100)($10,000) ($5,200) ($3,100)
$53,200 $56,000 $53,600 $57,900 $58,300 $58,800 $56,800 $54,000 $53,900 $53,500 $60,100 $61,300
($4,500) ($1,900) ($5,000) ($3,500) ($3,800) ($6,500) ($8,400)($13,000($14,300)($14,300) ($8,100)
$2,200 $3,600 $1,200 $3,400 62,600 $1,700 ($200) ($4,300) ($5,500) ($4,800) ($100)
($2,100) ($3,200) ($3,400) ($1,900) ($2,200) ($4,600) ($7,800)($11,100)($10,100)($10,100) ($3,800) ($2,000)
$44,800 $47,200 $44,400 T48,600 $49,200 $48,800 $47,300 $44,800 $45,400 $45,200 $51,100 $52,100
($900) $900 ($2,600) ($400) ($600) ($3,200) ($4,600) ($9,200) ($9,800) ($9,600) ($4,200)
$2,700 $3,300 $700 $3,100 $2,400 $100 ($800) ($4,200) ($4,000) ($4,100) $900
($1,100) ($1,700) ($2,230) ($200) $0 ($3,500) ($6,400) ($9,300) ($8,000) ($8,200) ($2,400) ($900)
$38,700 $41,400 $39,800 $42,400 $42,800 $43,400 $41,600 $40,500 $40,600 $39,700 $42,700 $43,600
$1,400 $3,300 $900 $2,100 $1,800 $400 ($900) ($4,300) ($5,000) ($5,900) ($3,500)
$3,300 $4,600 $2,900 $4,300 $3,700 $3,100 $1,400 ($300) ($700) ($1,700) $800
$500 $700 $900 $1,500 $1,300 ($600) ($3,100) ($4,800) ($4,200) ($4,900) ($2,100) ($800)
$30,300 $32,900 $32,700 $34,400 $32,200 $35,400 $32,100 $31,600 $31,500 $32,300 $35,800 $36,500
$200 $2,600 $400 $2,200 ($700) $1,700 ($100) ($3,400) ($3,600) ($2,300) $500
$1,840 $1,700 $1,800 $3,500 $600 $2,000 ($600) ($1,500) ($2,400) ($1,700) $1,800
($2,400) $0 $1,000 $700 ($1,400) ($200) ($4,400) ($3,700) ($4,400) ($1,600) $3,300 $3,900
$42,300 $43,700 $42,600 $44,400 $45,400 $44,900 $45,200 $43,400 $43,400 $42,400 $43,500 $44,500
($3,600) ($2,900) ($5,100) ($5,100) ($5,000) ($8,000) ($7,300)($11,400)($12,100)($12,900)($12,200)
$2,400 $1,800 $1,000 $900 $800 ($1,100) ($800) ($3,100) ($4,200) ($5,200) ($4,900)
($1,300) ($6,100) ($5,200) ($5,900) ($5,500) ($8,900) ($9,600)($11,4C0)($11,600)($11,900)($11,100) ($9,600)
$51,300 $52,800 $50,200 $53,400 $55,600 $55,100 $55,600 $53,000 $52,700 $52,300 $51,400 $52,600
($6,400) ($5,100) ($8,400) ($8,000) ($6,500)($10,200) ($9,600)($14,000)($15,500)($15,500)($16,800)
t300 $400 ($2.200) ($1.100) ($100) ($2,000) ($1,400) ($5,300) ($6,100) ($6,000) ($8,800)
($1,000) ($6,400) ($6,800) ($6,400) ($4,900) ($8,300) ($9,000)($12,100)($11,300)($11,300)($12,500)($10,700)
$41,800 $44,800 $43,800 $44,200 $45,200 $44,800 $45,100 $43,000 $44,100 $44,100 $44,500 $45,600
($3,900) ($1,500) ($3,200) ($4,800) ($4,600) ($7,200) ($6,800)($11,000)($11,100)($10,700)($10,800)
($300) $900 $100 ($1,300) ($1,600) ($3,900) ($3,000) ($6,000) ($5,300) ($5,200) ($5,100)
($2,000) ($4,100) ($2,800) ($4,600) ($4,000) ($7,500) ($8,600)($11,100) ($9,300) ($9,300) ($9,000) ($7,400)
$36,400 $37,200 $36,400 $38,500 $38,200 $39,400 $31,900 $31,900 $37,400 $36,900 $39,400 $40,300
($900) ($900) ($2,500) ($1,800) ($2,800) ($3,600) ($4,600) ($6,900) ($8,200) ($8,100) ($6,800)
$1,000 $400 ($500) $400 ($900) ($900) ($2,300) ($2,900) ($3,900) ($4,500) ($2,500)
($1,500) ($3,500) ($2,500) ($2,400) ($3,300) ($4,600) ($6,800) ($7,400) ($7,400) ($7,700) ($5,400) ($4,100)
$32,100 $33,300 $31,600 $35,900 $34,000 $34,300 $33,000 $34,600 $36,600 $33,100 $34,900 $35,700
$2,000 $3,000 ($700) $3,700 $1,100 $600 $200 ($400) $1,500 ($1,500) ($400)
$3,600 $2,100 $700 $5,000 $2,400 $900 $300 $1,500 $2,700 ($900) $900
$200 $400 ($100) $2,200 $400 ($1,300) ($3,500) ($700) $700 ($800) $2,400 $3,100
3115
29
22-Sep-92

CCMPARATIVE HISTCRY OF FACULTY SALARIES AND CCMPENSATION IN UTAH PUBLIC HIGHER EDUCATION 22 -Sep -9111
TABLE 4 -- TOTAL CCHPENSATION
IN 1992 CONSTANT DOLLARS
1981-82 1982-83 1933-84 1984-85
13, Institutions Without Academic Ranks--IV Estimated
Essentially All Two-Year Institutions
(1) All Faculty Combined $40,500 $42,300 $40,600 $40,400
14. Metro Community College Peer Grp * I "
(1) All Faculty Combined N/A $45,400 $45,200 $48,000
15. Rural Community College Peer Grp ** II "
(1) All Faculty Combined N/A $43,000 143,700 $48,000
16. Snow College ** II
(1) All Faculty Combined $38,100 $40,400 $39,500 $41,200
a. Diff from National Ave (IV) ($2,400) ($1,900) ($1,100) $800
b. Difference from Peer Grp Ave ($2,600) ($4,200) ($6,800)
17. Dixie College
(1) All Faculty Combined $40,500 $43,900 $40,800 $42,400
a. Diff from National Ave (IV) $0 $1,600 $200 $2,0120
b. Difference from Peer Grp Ave $900 ($2,900) ($5,600)
18. College of Eastern Utah
(1) All Faculty Combined $37,200 $41,600 $38,800 $40,900
a. Diff from National Ave (IV) ($3,300) ($700) ($1,800) $500
b. Difference from Peer Grp Ave ($1,400) ($4,900) ($7,100)
19. Utah Valley Community College
(1) All Faculty Combined $39,400 $42,300 $40,100 $42,8410
a. Diff from National Ave (IV) ($1,100) $0 ($540) $2,400
b. Difference from Peer Grp Ave ($3,100) ($5,100) ($5,201)
21. Salt Lake Community Coller
(1) All Faculty Combined $39,000 $41,300 $39,400 $41,600
a. Diff from National Ave (IV) ($1,500) ($1,000) ($1,200) $1,200
b. Difference from P.,tr Grp Ave ($4,100) ($5,800) ($6,400)
Page 4-E
Estimated1985-86 1986-87 1987-88 1988-89 1989-90 1990-91 1991-92 1992-93
$44,700 $48,2(10 $43,500 $44,700 $47,300 $48,100 $48,000
$48,900 $48,800 $50,400 $51,400
$48,900 $48,800 $50,400 $51,400
$50,700 $50,e00 $51,900 $53,300
$50,700 $50,800 $51,900 $53,300
$43,100 $43,200 $43,800 $40,500 $42,100 $42,300 $41,400 $42,400
($1,600) ($5,000) $300 ($4,200) ($5,200) ($5,800) ($6,600)
($5,800) ($5,600) ($6,600)($10,900) ($8,600) ($8,500)($10,500)($10,900)
$42,800 $42,600
($1,900) ($5,600)
($6,100) ($6,200)
$41,300 $42,200
($3,400) ($6,000)
($7,600) ($6,600)
$41,100 $39,900 $40,000 $39,800 $40,600 $43,700
($2,400) ($4,800) ($7,300) ($8,300) ($7,400)
($9,300)($11,500)($10,700)($11,000)($11,300) ($9,600)
141,300 140,500 $39,900 $40,400 $40,100 $42,200
($2,200) ($4,200) ($7,400) ($7,700) ($7,900)
($9,100)($10,900)($10,800)($10,400)($11,800)($11,100)
$44,300 $44,200 $44,000 $43,000 $43,400 $43,00A $43,400
($400) ($4,000) $500 ($1,700) ($3,900) ($5,100) ($4,600)
($4,600) ($4,600) ($6,400) ($8,400) ($7,300) ($7,800) ($8,500)
$42,700 $41,700 $42,000 $40,500 $40,300 $40,200 $41,100
($2,000) ($6,600) ($1,500) ($4,200) ($7,000) ($7,900) ($6,900)
($6,200) ($7,100) ($8,400)($10,900)($10,400)($10,600)($10,800)
*Peer Group, prior to 1982-83: Clark Co CC (NV); Chemeketa CC (OR); College of Southern Idaho; CC of Denver (CO);
Des Moines Area CC (IA); Lee College (TX); Maricopa Co CC (AZ); North Dakota State School of Science;
North Hennepin CC (MN); Penn Valley CC (MO); Pikes Peak CC (CO); Central Arizona College; Olympia Technical CC (WA);
Western Nevada CC.
/Peer Group, 1982-83 to 1988-89: Ann Arundel CC (MD); Austin CC (TX); Bergen CC (M)); Chemeketa CC ((iR);
Clark Co CC (NV); College of Southern Idaho; Delaware CC (PA); Madison Area Tech Col (WI); Mount Hood CC (OR);
North Seattle CC (WA); Spokane CC (WA; [San Diego City College (CA)--1982-83 only].
**Peer Group, prior to 1982-83: Big Bend CC (WA); Blue Mountain CC (OR); Colorado Mt JC (CO); Flathead Valley CC (MT);
Miles CC (MIT); Northern Nevada CC; North Idaho College; Northwest CC (WY); Northwestern JC (CO); Treasure Valley CC (OR);
Wenatchee Valley CC (WA); Western Wyoming CC.
/0 Peer Group, 1982-83 and 1983-84: [Big Bend CC (WA)--1982-83 only]; Blue Mountain CC (OR);
College of the Siskiyoes (CA); North Central Michigan College; Northeastern JC (CO); North Idaho College;
Northwest CC (WY); Treasure Valley CC (OR); Wenatchee Valley College (WA); Western Texas College;
Western Wyoming College; Yavapai College (AZ).
@Peer Group, 1984-85 to 1988-89: Metro Group used for faculty compensation and tuition and fee comparisons.
"Peer Group for All Community Colleges, 1989-90 and subsequent years: Western Wyoming Community College;
Danville Community College (VA); Yavapai College (AZ); North Idaho College; Joliet Junior College (IL);
Chemeketa Community College (OR); Anne Arundel Community College (MP); Spokane Community College (WA);
30
$44,400
($8,100)
$43,400
($9,900)

I(1982-84 - 100)
Consumer Price Index
% Increase over previous year
COMPARATIVE HISTORY OF FACULTY SALARIES AND COMPENSATION IN UTAH PUBLIC HIGHER EDUCATION 22-Sep-92
TABLE 5 -- INFLATION
Estimated
1981-82 1932-83 1983-84 1984-85 1985.36 1986-87 1987-88 1988-89 1989-90 1990-91 1991-92 1992-93
94.0 97.6 101.3 105.3 109.3 110.5 115.4 120.5 126.1 133.8 137.9 140.9
3.834 3.79% 3.954 3.804 1.104 4.434 4.42% 4.65% 6.11% 3.06% 2.18%
I' August CPI used for 1992-93. December CPI used for all other years.

1992-93 ANALYSIS OF FACULTY SALARYAND COMPENSATION COMPARABILITY
Methodology
Each year the Office of the Commissioner prepares an analysis that comparesfaculty salaries and compensation at USHE institutions to faculty data atcomparison institutions. The report helps determine recommendations made by theCommissioner, in consultation with USHE Presidents, for competitive equityadjustments.
The primary source of information used in the analysis is "The AnnualReport on the Economic Status of the Profession 1991-92," published by theAmerican Association of University Professors (AAUP) in Academe, March-April1992.
In order to update the AAUP data to 1992-93 levels, each comparisoninstitution was surveyed for its 1992-93 percentage faculty salary increase.Percentage increases reported for a segment of the year were apportioned toreflect the shorter time period. Dollar increases reported were compared toaverage salary figures to determine percentage increases. Four of the peerinstitutions had not yet ascertained increases, therefore their percentageincreases were estimated using an average of the other responding comparisoninstitutions.1
Because the average percentage increases were not reported by rank, it hasbeen assumed that average increases are the same for all ranks. This assumptionwill cause the estimated comparisons to differ slightly from actual numbers whenreported by individual rank.
The data are analyzed by individual faculty rank for the four-yearinstitutions and by all faculty combined for the two-year institutions. Thefour-year institutions are analyzed in this manner because each institution hasa unique distribution of faculty members across ranks; use of all-rank averagesin determining equity comparisons for a specific college or university woulddistort the comparison. Averages are used for two-year institutions., however,because comparable data by rank are not available at all of these institutions.
Findings
The following table shows percentage increases in faculty salary for thepast six years at both USHE institutions and their relative comparison groups.
North Carolina State University, University of Cincinnati, Chemeketa Community College and SpokaneCommunity College.
:332

TabPercentage Salary
a Increases By Year
Institution 87-88 88-89 89-90 90-912 91-92 92-93
U of U 5.4% 3.33% 6.21% 6.61% 4.50% 4.10%Comparison Group 6.5% 5.36% 5.58% 5.77% 2.03% 1.68%
SU 4.1% 0.79% 6.70% 5.50% 4.12% 4.40%marlson Grou ... 6. 6 . . 1% 1.1 % 1.95%
WSU 2.4% 0.79% 5.65% 6.26% 4.62% 4.21%SUU 3.8% 1.47% 6.15% 5.99% 5.81% 4.53%Comparison Group 5.1% 4.83% 5.18% 5.41% 2.57% 1.40%
Snow 9.9% 0.95% 6.41% 9.49% 4.25% 4.68%Dixie 5.1% 1.23% 4.76% 5.50% 4.16% 10.14%CEU 5.9% 1.56% 6.67% 7.80% 4.57% 7.63%UVCC 4.5% 0.52% 4.15% 6.07% 3.36% 4.41%SLCC 5.2% 0.34% 5.10% 6.12% 5.18% 7.79%Comparison Group 4.3% 4.76% 5.04% 5.46% 4.34% 4.84%
Increases for USHE institutions were funded for these years as follows:O In 1987-88, from reallocation of institutional budgets.O In 1988-89, by institutional internal reallocations.O For 1989-90, three percent by the Appropriations Act and balances through
internal reallocations.O In 1990-91, 4.5 percent by the legislature for most institutions with 5.5
percent for Dixie and 5 percent for CEU. Additional increases funded byinternal reallocations.
O In 1991-92, 3.15 percent from the legislature and additional increases frominternal reallocation.
O And in 1992-93, approximately 3 percent from the legislature afterdeductions for health insurance with an additional 5 percent for Dixie, 3percent for SLCC and CEU, and 1 percent for Snow and UVCC. Additionalincreases funded by internal reallocation.
Table II displays Utah's actual compensation standing in relation tocomparison institutions. Represented in Table II is a five year history ofpercentage increases and net percentage differences in total com ensation.
Table IIUSHE E&G Percentage Increases
and Compensation Differentials By Yearr-
Insti-tution %
I c% Net
D ff
1 ,::
(rii6c
,,t
CM*L.-.01
, Iffll1 /-
.%0i
-2Enos1 v.2-: Est.
%iNet
of IINIIIIIIMMIll -14.I1 111111111111111111E11111119111,1111111,111111111111111111111M11111111111,111110111111111111111111111,111M111111,1IMINIIIINIIIMIIIIIMIENERIMIIIIIIIIIVIIIIIIIIIIIIIIII
SUU 1,47 -21,44 6.15 -19.23 5.99 -19,74 5.81 -17.22 4.53 -13,69
Snow 0.95 -19.43 6.41 -20.34 9.49 -19.80 4.25 -25.42 4.68 -25.74
Dixie 1.2 -2 . 7 4.7 -2 .7 . I -27.41 4.1 -27. 1 .14 -21. 2
1111111111MMIII . :.. -2 .4 IffillIMIIIIMIIIMIUVCC 0.52 -19.61 4.15 -17.03 6.Q7 -18.04 3.36 -19.48 4.41 -20.09
SLCC 0 34 -25.39 5.10 -25.68 6.12 -26.08 5.18 -29.25 7.79 -22.91
2New comparison groups were used for 1990-91 and subsequent years.
333 19

Minimal salary increases in 1988-89 caused wider -ompensation gaps todevelop while 1989-90 salary increases were enough to avoid furtherdeterioration. Higher percentage increases in 1990-91 and the introduction ofnew comparison groups narrowed the gap in 1990-91 and subsequent years. The1991-92 percentage increases were enough to narrow the gap for some USHEinstitutions; many of the comparison institutions faced serious budgetrestrictions and were unable to provide any salary increases for their faculty.
Because the four universities increased salaries in varying degrees morethan their comparison group, 1992-93 compensation gaps for these institutionswere lower than gaps for the previous year. Many of the universities' comparisoninstitutions were able to provide only small salary increases, if any. USHE'scommunity colleges and several of the community colleges in the comparison groupprovided solid sali44 increases. Institutions with the largest salary increases,Dixie, CEU and SLCC, saw a reduction in their gaps while Snow and UVCC saw aslight expansion in their gaps.
For 1991-92 and 1992-93, Weber State University's salary and compensationfigures include "rollover" amounts. Beginning in 1984, WSU chose to requireadditional teaching loads of its faculty in return for additional pay, resultingin "rollover" dollars. Because these numbers were considered overload, they werenot included in the salary and compensation figures that were reported to theCommissioner's office. Since then, the line between regular teaching load andoverload has become less distinct. Accordingly, the reported salary andcompensation figures now include "rollover" pay.
A summary of actual salary and compensation dollars for all institutionsis provided in Table III. The first section on each page shows comparisons ofsalaries only. The second section shows total compensation. And the thirdsection shows the composite equity gap percentages for each institution. Thedata confirms that faculty salaries in Utah institutions trail their comparisongroups and that total compensation equity differences are less because of aboveaverage fringe benefits offered by Utah institutions.
The detail for the individual comparison institutions and the Utahinstitutions are provided in the following tables.
UofU Tables 1-A to 3-A SUU Tables 1-D to 3-0 CEU Tables 1-E to 3-EUSU Tables 1-B to 3-B Snow Tables 1-E to 3-E UVCC Tables 1-E to 3-EWSU Tables 1-C to 3-C Dixie Tables 1-E to 3-E SLCC Tables 1-E to 3-E
For each institution, Table 1 represents salary comparisons; Table 2represents compensation comparisons; and Table 3 shows the calculation ofcompetitive faculty salary adjustment for consideration in the 1993-94 operatingbudget request.
3
34

Estimated 1992-93 AverageSalaries, By Rank
Professor
Table IIISummary of Farulty Salaries
And Compensation Comparability 1992-93
U of U USU WSU SUU
Utah Institution $59,545 $48,128 $46,790 $40,140Comp Inst Wtd Ave $66,480 $63,267 $51,255 $51,256Difference ($6,935) ($15,139) ($4,465) ($11,116)
Associate ProfessorUtah Institution $42,681 $38,419 $39,287 $33,763Comp Inst Wtd Ave $46,683 $45,957 $42,671 $42,671Difference ($4,002) ($7,538) ($3,384) ($8,908)
Assistant ProfessorUtah Institution $38,413 $34,348 $32,618 $28,850Comp Inst Wtd Ave $39,836 $38,881 $35,954 $35,954Difference ($1,423) ($4,533) ($3,336) ($7,104)
InstructorUtah Institution $29,773 $29,650 $26,574 $24,565Comp Inst Wtd Ave $29,358 $27,291 $25,239 $25,239Difference $415 $2,359 $1,335 ($674)
Estimated 1992-93 AverageCompensation, By Rank
ProfessorUtah Institution $76,722 $62,431 $61,275 $52,579Comp Inst Wtd Ave $81,686 $76,551 $63,285 $63,285Difference ($4,964) ($14,120) ($2,010) ($10,706)
Associate ProfessorUtah Institution $56,630 $51,260 $52,105 $45,575Comp Inst Wtd Ave $58,840 $56,782 $53,044 $53,044Difference ($2,210) ($5,522) ($939) ($7,469)
Assistant ProfessorUtah Institution $51,425 $46,458 $43,560 $40,349Comp Inst Wtd Ave $50,074 $48,076 $44,442 $44,443Difference $1,351 ($1,618) ($882) ($4,094)
InstructorUtah Institution $40,911 $40,716 $36,474 $35,749Comp Inst Wtd Ave $37,615 $35,304 $32,575 $32,575Difference $3,296 $5,412 $3,899 $3,174
Composite Equity GapSalaries -9.43% -22.10Z -7.99% -24.58%Total Comp -3.88% -12.93% -1.12% -13.69%

Table IIISummary of Faculty Salaries
And Compensation Comparability 1992-93
Estimated 1992-93 AverageSalaries, By Rank
All Faculty
Snow Dixie CEU UVCC SLOC
Utah Institution $30,567 $31,720 $30,890 $32,472 $31,332Comp Inst Wtd Ave $41,307 $41,307 $41,307 $41,307 $41,307Difference ($10,740) ($9,587) ($10,417) ($8,835) ($9,975)===== 7...=======1============
Estimated 1992-93 AverageCompensstion, By Rank
All FacultyUtah Institution $42,395 $43,726 $42,191 $44,390 $43,374Comp Inst Wtd Ave $53,308 $53,308 $53,308 $53,308 $53,308Difference ($10,913) ($9,582) ($11,117) ($8,918) ($9,934)
=========..====3=.=. =================== i=====20=2.=.===========Composite Equity Gap
Salaries -35.14Z -30.22Z -33.72Z -27.21%Total Comp -25.74Z -21.92X -26.35Z -20.09%
3L236
-31.84% II-22.90%
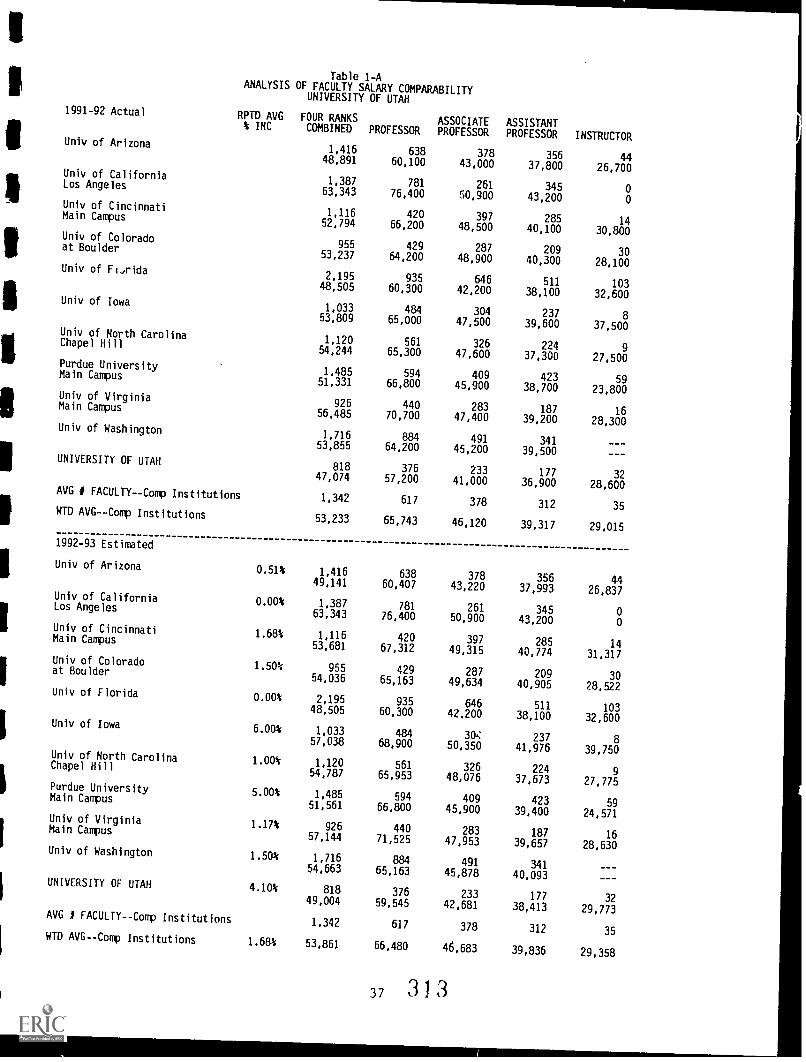
Table 1-AANALYSIS OF FACULTY SALARY COMPARABILITY
UNIVERSITY OF UTAH
1991-92 Actual RPTD AVG FOUR RANKS ASSOCIATE% INC COMBINED PROFESSOR PROFESSORASSISTANTPROFESSOR
Univ of Arizona1,416 638 378 356
48,891 60,100 43,000 37,800Univ of California
1,387 781 261 345Los Angeles63,343 76,400 50,900 43,200
Univ of Cincinnati1,116 420 397 285Main Campus
52,794 66,200 48,500 40,100Univ of Colorado
955 429 287 209at Boulder53,237 64.200 48,900 40,300
Univ of Fi,rida2,195 935 646 51148,505 60,300 42,200 38,100
Univ of Iowa1,033 484 304 237
53,809 65,000 47,500 39,600Univ of North Carolina
1,120 561 326 224Chapel Hill54,244 65,300 47,600 37,300
Purdue University1,485 594 409 423Main Campus51,331 66,800 45,900 38,700
Univ of Virginia926 440 283 187Main Campus
56,485 70,700 47,400 39,200Univ of Washington
1,716 884 491 34153,855 64,200 45,200 39,500
UNIVERSITY OF UTAH818 376 233 17747,074 57,200 41,000 36,900
AVG # FACULTY--Comp Institutions 1.342 617 378 312WTD AVG--Comp Institutions
53.233 65,743 46,120 39,317
1992-93 Estimated
Univ of Arizona0.51% 1,416 638 378 35649,141 60.407 43.220 37,993
Univ of California0.00% 1,387 781 261 345Los Angeles
63,343 76,400 50,900 43,200Univ of Cincinnati
1.684 1,116 420 397 285Main Campus53,681 67,312 49,315 40,774
Univ of Colorado1.50% 955 429 287 209at Boulder
54,036 65,163 49,634 40,905Univ of Florida
0.00% 2,195 935 646 51148,505 60,300 42.200 38,100Univ of Iowa
6.00% 1,033 484 304 23757,038 68,900 50,350 41,976Univ of North Carolina
1.00% 1,120 561 326 224Chapel Hill54,787 65,953 48,076 37,673
Purdue University5.004 1,485 594 409 423Main Campus
51,561 66,800 45,900 39,400Univ of Virginia
1.174 926 440 283 187Main Campus57,144 71.525 47,953 39,657
Univ of Washington1.50% 1,716 884 491 34154,663 65,163 45,878 40,093
UNIVERSITY OF UTAH 4.10% 818 376 233 17749,004 59,545 42,681 38,413AVG I FACULTY--Comp Institutions
1,342 617 378 312WTO AVG--Comp Institutions 1.684 53,861 66,480 46,683 39,836
3 7 313
INSTRUCTOR
4426,700
o0
1430,800
3028,100
10332,600
837,500
927.500
5923,800
1628,300
3228,600
35
29,015
4426,837
00
1431,317
3028,522
10332,600
839,750
927,775
5924,571
1628,630
3229,773
35
29,358

Table 1-8ANALYSIS OF FACULTY SALARY COMPARABILITY
UTAH STATE UNIVERSITY
1991-92 Actual RPM AVG% INC
FOUR RANKSCOMBINED PROFESSOR
ASSOCIATEPROFESSOR
ASSISTANTPROFESSOR INSTRUCTOR
Univ of California971 527 189 255 o
Davis57,647 68,700 48,100 41,500 0
Colorado State Univ932 477 279 176
48,443 55,800 42,200 38,400
Iowa State Univ1,207 491 339 306 71
50,278 63,800 47,100 38,200 24,000
Univ of Maryland1,231 527 392 224 88
College Park54,239 68,600 48,300 40,800 28,900
New Mexico State Univ575 193 169 186 27
Main Campus40,763 49,300 40,800 34,100 25,400
North Carolina State Univ1,008 447 347 201 13
Raleigh52,065 63,900 45,600 38,300 30,500
Oregon State Univ600 213 195 145 47
43,190 52,900 42,100 35,900 26,200
Texas A & M Univ1,370 599 400 362 9
50,002 61,400 44,700 37,500 29,900
Virginia Tech Univ1,468 583 535 283 67
51,047 64,900 45,900 38,100 26,300
Washington State Univ962 334 276 292 60
44,323 55,600 42,000 37,2(10 26,900
UTAH STATE UNIVERSITY478 166 140 157 15
38,485 46,100 36,800 32,900 28,400
AVG # FACULTY--Comp Institutions 1,042 439 312 243 48
WTD AVG--Comp Institutions50,019 62,134 45,089 38,122 26,718
1992-93 Estimated
Univ of California0.00% 971 527 189 255 0
Davis57,547 68,700 48,100 41,500 0
Colorado State Univ 3.40% 932 477 279 176
50,090 57,697 43,635 39,706
Iowa State Univ 6.004 1,207 491 339 306 71
53,295 67,628 49,926 40,492 25,440
Univ of Maryland0.00% 1,231 527 392 224 as
College Park54,239 68,600 48,300 40,800 28,900
New Mexico State Univ 2.00% 575 193 169 186 27
Main Campus41,578 50,286 41,616 34,782 25,908
North Carolina State Univ 1.95% 1,008 447 347 201 13
Raleigh53,080 65,146 46,489 39,047 31,095
Oregon State Univ 2.00% 600 213 195 145 47
44,054 53,958 42,942 36,618 26,724
Texas A & M Univ 0.60% 1,370 599 400 362 9
50,302 61,768 44,968 37,725 30,079
Virgin;- Tech Univ 1.17% 1,468 583 535 283 67
51,643 65,657 46,436 38,545 26,607
Washington State Univ 3.00% 962 334 276 292 60
State Univ45,653 57,268 43,260 38,316 27,707
UTAH STATE UNIVERSITY 4.40% 478 166 140 157 15
40,178 48,128 38,419 34,348 29,650
AVG # FACULTY--Comp Institutions 1,042 439 312 243 48
WTO AVG--Comp Aitutions 1.95% 50,963 63,267 45,957 38,881 27,291
38
a
Era

Table 1-COF FACULTY SALARY COMPARABILITYWEBER STATE UNIVERSITY
1991-92 Actual RPTD AVG FOUR RANKS ASSOCIATE% INC COMBINED PROFESSOR PROFESSOR
ASSISTANTPROFESSOR INSTRUCTOR
California State Univ 280 180 58 42Dominguez Hills 55,264 61,000 48,300 40,300
Univ of Southern Colorado 171 52 50 58 1138,354 45,000 39,300 34,000 25,600
Boise State Univ 359 159 96 95 9
Idaho 38,738 43,300 37,300 33,600 27,700
Indiana University 110 21 63 26 0
Northwest 41,764 51,900 41,300 34,700 0
Uliv of Nevada Las Vegas 507 135 166 206 0
47,718 60,000 48,300 39,200 0
SUNY College at Brockport 289 91 116 8248,631 58,400 48,200 38,400
So. Oregon State Univ 173 68 61 33 11
35,972 42,200 34,400 29,100 26,800
Austin Peay State Univ 201 83 47 71
Tennessee 37,089 45,700 33,800 29,200
Eastern Washington Univ 358 185 79 78 1638,162 43,400 35,900 32,000 18,800
Univ of Wisconsin Oshkosh 370 120 97 145 841,559 50,000 41,400 35,400 28,500
WEBER STATE UNIVERSITY 427 146 90 127 6436,430 44,900 37,700 31,300 25,500
AVG # FACULTY--Comp Institutions 287 109 83 84 11
WTD AVG--Comp Institutions 43,115 50,640 42,133 35,461 24,627
1992-93 Estimated
California State Univ 0.00% 280 180 58 42Dominguez Hills 55,264 61,000 48,300 40,300
Univ of Southern Colorado 3.00% 171 52 50 58 1139,505 46,350 40,479 35,020 26,368
Boise State Univ 0.01% 359 159 96 95 9Idaho 38,740 43,303 37,302 33,602 27,702
Indiana University 3.10% 110 21 63 26 0Northwest 43,058 53,509 42,580 35,776 0
Univ of Nevada Las Vegas 0.00% 507 135 166 20647,718 60,000 48,300 39,200
SUNY College at Brockport 0.00% 289 91 116 8248,631 58,400 48,200 38,400
So. Oregon State Univ 2.00% 173 68 61 33 1136,691 43,044 35,088 29,682 27,336
Austin Peay State Univ 0.00% 201 83 47 71Tennessee 37,089 45,700 33,800 29,200
Eastern Washington riiv 3.004 358 185 79 78 1639,307 44,702 36,977 32,960 19,364
Univ of Wisconsin Oshkosh 4.504 370 120 97 145 843,429 52,250 43,263 36,993 29,783
WEBER STATE UNIVERSITY 4.21% 427 146 90 127 6437,963 46,790 39,287 32,618 26,574
AVG # FACULTY-Comp Institutions 287 109 83 84 11
WTD AVG--Comp Institutions 1.40% 43,671 51,255 42,671 35,954 25,239
39
3 1 5
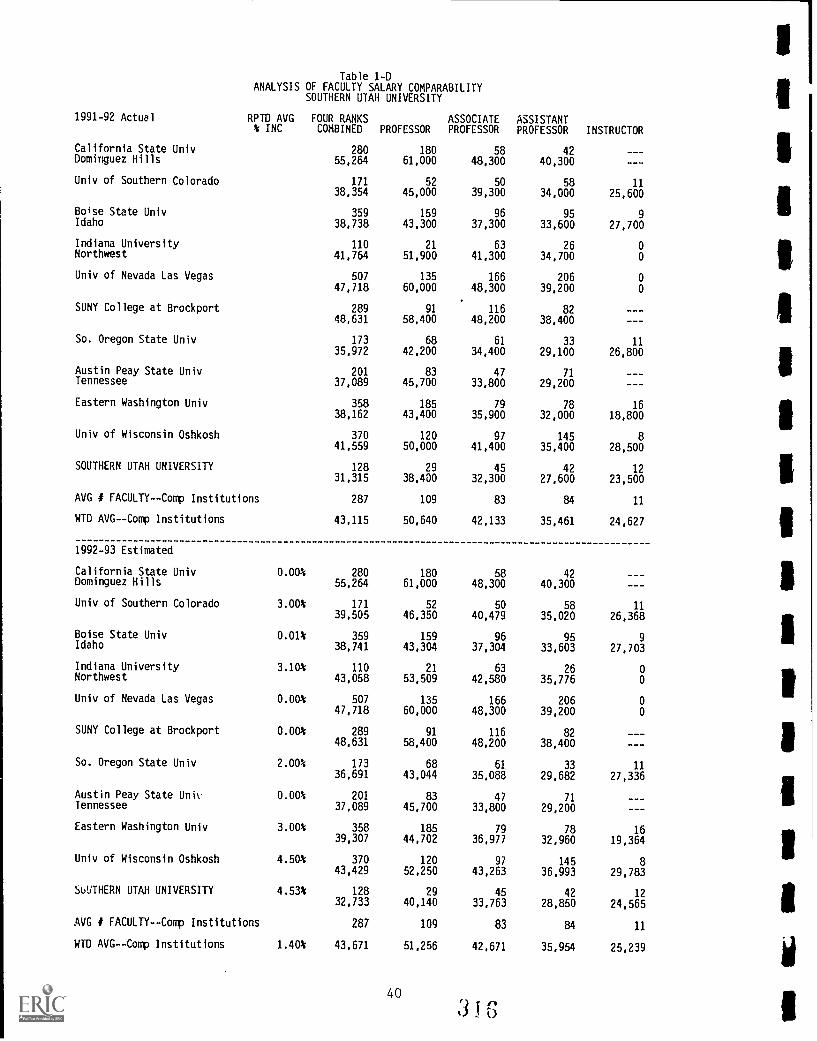
Table 1-DANALYSIS OF FACULTY SALARY COMPARABILITY
SOUTHERN UTAH UNIVERSITY
1991-92 Actual RPTD AVG% INC
FOUR RANKSCOMBINED PROFESSOR
ASSOCIATEPROFESSOR
ASSISTANTPROFESSOR INSTRUCTOR
California State Univ 280 180 58 42Dominguez Hills 55,264 61,000 48,300 40,300
Univ of Southern Colorado 171 52 50 58 1138,354 45,000 39,300 34,000 25,600
Boise State Univ 359 159 96 95 9Idaho 38,738 43,300 37,300 33,600 27,700
Indiana University 110 21 63 26 0Northwest 41,764 51,900 41,300 34,700 0
Univ of Nevada Las Vegas 507 135 166 206 047,718 60,000 48,300 39,200 0
SUNY College at Brockport 289 91 116 8248,631 58,400 48,200 38,400
So. Oregon State Univ 173 68 61 33 1135,972 42,200 34,400 29,100 26,800
Austin Peay State Univ 201 83 47 71Tennessee 37,089 45,700 33,800 29,200
Eastern Washington Univ 358 185 79 78 1638,162 43,400 35,900 32,000 18,800
Univ of Wisconsin Oshkosh 370 120 97 145 841,559 50,000 41,400 35,400 28,500
SOUTHERN UTAH UNIVERSITY 128 29 45 42 1231,315 38,400 32,300 27,600 23,500
AVG # FACULTY-Comp Institutions 287 109 83 84 11
WTD AVG-Comp Institutions 43,115 50,640 42,133 35,461 24,627
1992-93 Estimated
California State Univ 0.00% 280 180 58 42Dominguez Hills 55,264 61,000 48,300 40,300
Univ of Southern Colorado 3.00% 171 52 50 58 1139,505 46,350 40,479 35,020 26,368
Boise State Univ 0.01% 359 159 96 95 9Idaho 38,741 43,304 37,304 33,603 27,703
Indiana University 3.10% 110 21 63 26 0Northwest 43,058 53,509 42,580 35,776 0
Univ of Nevada Las Vegas 0.004 507 135 166 206 047,718 60,000 48,300 39,200 0
SUNY College at Brockport 0.00% 289 91 116 8248,631 58,400 48,200 38,400
So. Oregon State Univ 2.00% 173 68 61 33 1136,691 43,044 35,088 29,682 27,336
Austin Peay State Unik 0.00% 201 83 47 71Tennessee 37,089 45,700 33,800 29,200
Eastern Washington Univ 3.00% 358 185 79 78 1639,307 44,702 36,977 32,960 19,364
Univ of Wisconsin Oshkosh 4.504 370 120 97 145 843,429 52,250 43,263 36,993 29,783
SuUTHERN UTAH UNIVERSITY 4.53% 128 29 45 42 1232,733 40,140 33,763 28,850 24,565
AVG # FACULTY-Comp Institutions 287 109 83 84 11
WTD AVG-Coffp Institutions 1.40% 43,671 51,256 42,671 35,954 25,239
40
:3 G

Table 1-EANALYSIS OF FACULTY SALARY COMPARABILITY
COMMUNITY COLLEGES
1991-92 Actual RPT AVG% INC
ALLRANKS
Anne Arundel Comm 194College, MD 41,600
Onandaga Community 194College, NY 41,500
Chemetaka Community 226College, OR 35,300
Spokane Community 198College, WA 35,100
Danville Community 56College, VA 36,200
Yavapai College 76AZ 39,300
North Idaho 95College 33,680
Joliet Junior 144College, IL 43,900
Grand Rapids Junior 226College, MI 45,700
Western Wyoming 56Community College 31,200
**UTAH INST** SNOW DIXIE CEU UVCC SLCC
7529,200
72
28,80074
28,700175
31,100229
29,068
AVG f FACULTY--Coup Institutions 147 147 147 147 147
WTD AVG-Coup Institutions 39,358 39,358 39,358 39,358 39,358
1992-93 Estimated
Anne Arundel Comm 4.004 194College, MD 43,264
Onandaga Community 6.50% 194College, NY 44,198
Chemetaka Community 4.84% 226College, OR 37,008
Spokane Community 4.844 198College, WA 36,799
Danville Community 1.17% 56College, VA 36,622
Yavapai College 1.90% 76
AZ 40,047
North Idaho 4.50% 95College 35,196
Joliet Junior 7.00% 144College, IL 46,973
Grand Rapids Junior 6.00% 226College, MI 48,442
Western Wyoming 0.00% 56Community College 31,200
**UTAH INST** SNOW DIXIE CEU UVCC SLCC4.684 10.144 7.63% 4.41% 7.79%
75 72 74 175 22930,567 31,720 30,890 32,472 31,332
AVG f FACULTY--Comp Institutions 147 147 147 147 147
WTD AVG--Comp Institutions 4.84% 41,307 41,307 41,307 41,307 41,307
at7

Table 2-AANALYSIS OF FACULTY TOTAL COMPENSATION COMPARABILITY
UNIVERSITY OF UTAH
1991-92 Actual RPTD AVG% INC
FOUR RANKSCOMBINED PROFESSOR
ASSOCIATEPROFESSOR
ASSISTANTPROFESSOR INSTRUCTOR
Univ of Arizona 1,416 638 378 356 4460,880 73,200 54,500 48,700 35,600
Univ of California 1,387 781 261 345 0Los Angeles 72,084 86,900 58,000 49,2e0 0
Univ of Cincinnati 1,116 420 397 285 14Main Campus 67,861 85,000 62,400 51,600 39,600
Univ of Colorado 955 429 287 209 30at Boulder 64,367 77,400 59,500 48,700 33,700
Univ of Florida 2,195 935 646 511 10362,319 76,700 54,600 49,700 42,800
Univ of Iowa 1,033 484 304 237 867,119 80,200 60,000 50,200 47,500
Univ of North Carolina 1,120 561 326 224 9Chapel Hill 64,669 77,300 57,300 45,000 33,800
Purdue University 1,485 594 409 423 59Main Campus 65,420 84,900 59,200 49,200 28,700
Univ of Virginia 926 440 283 187 16Main Campus 70,454 86,800 60,300 50.300 36,100
Univ of Washington 1,716 884 491 34166,320 78,700 56,200 48,800
UNIVERSITY OF UTAH 818 376 233 177 3261,599 73,700 54,400 49,400 39,300
AVG # FACULTY--Comp Institutions 1,342 617 378 312 35
WTD AVG--Comp Institutions 65,783 80,371 57,814 49,207 37,086
1992-93 Estimated
Univ of Arizona 0.51% 1,416 638 378 356 4461,191 73,574 54,779 48,949 35,782
Univ of California 0.00% 1,387 781 261 345 0Los Angeles 72,084 86,900 58,000 49,200 0
Univ of Cincinnati 1.684 1,116 420 397 285 14Main Campus 69,001 86,428 63,448 52,467 40,265
Univ of Colorado 1.504 955 429 287 209 30at Boulder 65,332 78,561 60,393 49,431 34,206
Univ of Florida 0.00% 2,195 935 646 511 10362,319 76,700 54,600 49,700 42,800
Univ of Iowa 6.004 1,033 484 304 237 871,146 85,012 63,600 53,212 50,350
Univ of North Carolina 1.00% 1,120 561 326 224 9Chapel Hill 65,316 78,073 t,7,873 45,450 34,138
Purdue University 5.00% 1,485 594 409 423 59Main Campus 68,691 89,145 62,160 51,660 30,135
Univ of Virginia 1.17% 926 440 283 187 16Main Campus 71,276 87,813 61,004 50,887 36,521
Univ of Washington 1.50% 1,716 884 491 34167,315 79,881 57,043 49,532
UNIVERSITY OF UTAM 4.10% 818 376 233 177 3264,124 76,722 56,630 51,425 40,911
AVG # FACULTY--Comp Institutions 1,342 617 378 312 35
WTD AVG--Comp Institutions 1.68% 66,895 81,686 58,840 50,074 37,615
4 2
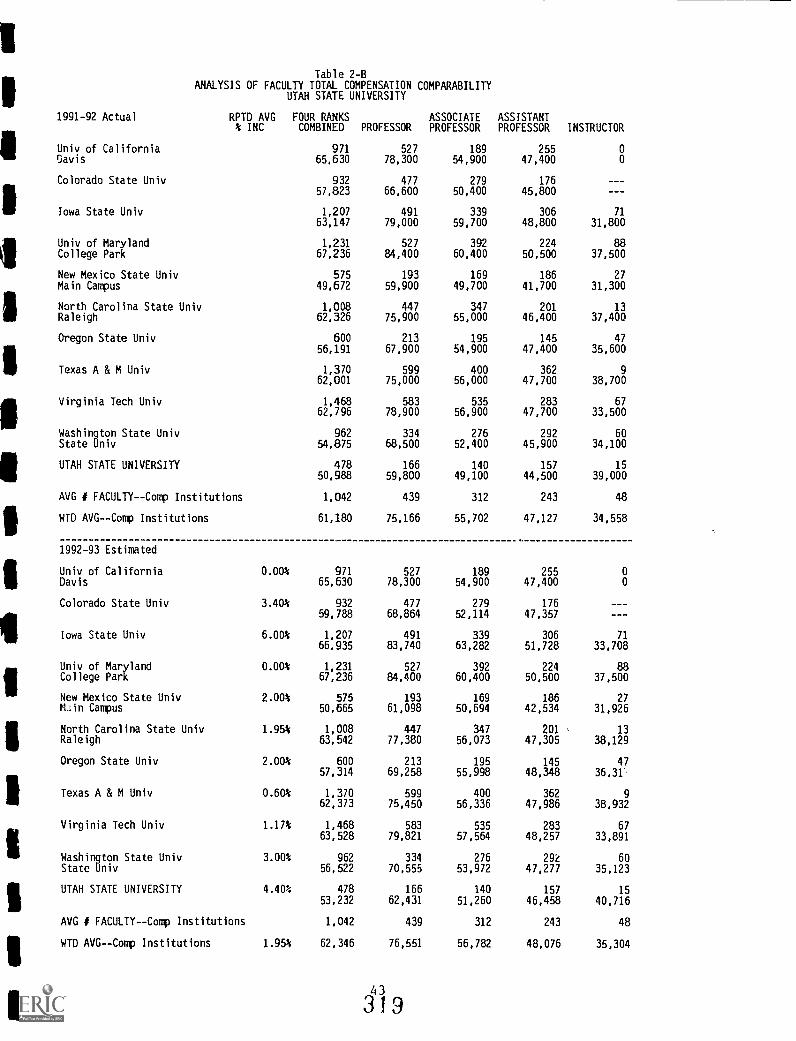
Table 2-8ANALYSIS OF FACULTY TOTAL COMPENSATION COMPARABILITY
UTAH STATE UNIVERSITY
1991-92 Actual RPTD AVG% INC
FOUR RANKSCOMBINED PROFESSOR
ASSOCIATEPROFESSOR
ASSISTANTPROFESSOR INSTRUCTOR
Univ of California 971 527 189 255 0Davis 65,630 78,300 54,900 47,400 0
Colorado State Univ 932 477 279 17657,823 66,600 50,400 45,800
Iowa State Univ 1,207 491 339 306 7163,147 79,000 59,700 48,800 31,800
Univ of Maryland 1,231 527 392 224 88College Park 67,236 84,400 60,400 50,500 37,500
New Mexico State Univ 575 193 169 186 27Main Campus 49,672 59,900 49,700 41,700 31,300
North Carolina State Univ 1,008 447 347 201 13Raleigh 62,326 75,900 55,000 46,400 37,400
Oregon State Univ 600 213 195 145 4756,191 67,900 54,900 47,400 35,600
Texas A & M Univ 1,370 599 400 362 962,001 75,000 56,000 47,700 38,700
Virginia Tech Univ 1,468 583 535 283 6762,796 78,900 56,900 47,700 33,500
Washington State Univ 962 334 276 292 60State Univ 54,875 68,500 52,400 45,900 34,100
UTAH STATE UNIVERSITY 478 166 140 157 1550,988 59,800 49,100 44,500 39,000
AVG # FACULTY--Comp Institutions 1,042 439 312 243 48
WTD AVG--Comp Institutions 61,180 75,166 55,702 47,127 34,558
1992-93 Estimated
Univ of California 0.00% 971 527 189 255 0Davis 65,630 78,300 54,900 47,400 0
Colorado State Univ 3.40% 932 477 279 17659,788 68,864 52,114 47,357
Iowa State Univ 6.00% 1,207 491 339 306 7166,935 83,740 63,282 51,728 33,708
Univ of Maryland 0.008 1,231 527 392 224 88College Park 67,236 84,400 60,400 50,500 37,500
New Mexico State Univ 2.00% 575 193 169 186 27Mdin Campus 50,665 61,098 50,694 42,534 31,926
North Carolina State Univ 1.95% 1,008 447 347 201 13Raleigh 63,542 77,380 56,073 47,305 38,129
Oregon State Univ 2.00% 600 213 195 145 4757,314 69,258 55,998 48,348 36,31
Texas A & M Univ 0.60% 1,370 599 400 362 962,373 75,450 56,336 47,986 38,932
Virginia Tech Univ 1.17% 1,468 583 535 283 6763,528 79,821 57,564 48,257 33,891
Washington State Univ 3.00% 962 334 276 292 60State Univ 56,522 70,555 53,972 47,277 35,123
UTAH STATE UNIVERSITY 4.40% 478 166 140 157 1553,232 62,431 51,260 46,458 40,716
AVG 4, FACULTY--Comp Institutions 1,042 439 312 243 48
WID AVG--Comp Institutions 1.958 62,346 76,551 56,782 48,076 35,304

Table 2-CANALYSIS OF FACULTY TOTAL COMPENSATION COMPARABILITY
WEBER STATE UNIVERSITY
1991-92 Actual RPTD AVG4 INC
FOUR RANKSCOMBINED PROFESSOR
ASSOCIATEPROFESSOR
ASSISTANTPROFESSOR INSTRUCTOR
California State Univ 280 180 58 42Dominguez Hills 69,368 75,900 61,600 52,100
Univ of Southern Colorado 171 52 50 58 1144,999 52,800 46,100 39,900 30,000
Boise State Univ 359 159 96 95 9Idaho 48,212 53,700 46,500 42,000 35,100
Indiana University 110 21 63 26 oNorthwest 53,220 65,400 52,800 44,400 0
Univ of Nevada Las Vegas 507 135 166 206 055,544 69,300 56,200 46,000 0
SUNY College at Brockport 289 91 116 8261,944 74,100 61,700 48,800
So. Oregon State Univ 173 68 61 33 1147,281 54,600 45,600 39,000 36,200
Austin Peay State Univ 201 83 47 71Tennessee 44,979 54,800 41,200 36,000
Eastern Washington Univ 358 185 79 78 1647,748 54,600 45,500 38,400 25,200
Univ of Wisconsin Oshkosh 370 120 97 145 853,323 63,400 53,100 46,000 37,600
WEBER STATE UNIVERSITY 427 146 90 127 6448,322 58,800 50,000 41,800 35,000
AVG # FACULTY--Comp Institutions 287 109 83 &I 11
WTD AVG--Comp Institutions 53,366 62,512 52,362 43,819 31,784
1992-93 Estimated
California State Univ 0.00% 280 180 58 42Dominguez Hills 69,368 75,900 61,600 52,100
Univ of Southern Colorado 3.00% 171 52 50 58 1146,349 54,384 47,483 41,097 30,900
Boise State Univ 0.01% 359 159 96 95 9Idaho 48,215 53,704 46,503 42,003 35,102
Indiana University 3.10% 110 21 63 26 0Northwest 54,870 67,427 54,437 45,776 0
Univ of Nevada Las Vegas 0.00% 507 135 166 206 055,544 69,300 56,200 46,000 o
SUNY College at Brockport 0.004 289 91 116 8261,944 74,100 61,700 48,800
So. Oregon State Univ 2.004 173 68 61 33 1148,227 55,692 46,512 39,780 36,924
Austin Peay State Univ 0.00% 201 83 47 71Tennessee 44,979 54,800 41,200 36,000
Eastern Washington Univ 3.00% 358 185 79 78 1649,181 56,238 46,865 39,552 25,956
Univ of Wisconsin Oshkosh 4.50% 370 120 97 145 855,723 66,253 55,490 48,070 39,292
WEBER STATE UNIVERSITY 4.21% 427 146 90 127 6450,356 61,275 52,105 43,560 36,474
AVG # FACULTY--Comp Institutions 287 109 83 84 11
WTD AVG--Comp Institutions 1.40% 54,068 63,285 53,044 44,442 32,575
344

Table 2-DANALYSIS OF FACULTY TOTAL COMPENSATION COMPARABILITY
SOUTHERN UTAH UNIVERSITY
1991-92 Actual RPTD AVG FOUR RANKS% INC COMBINED PROFESSOR
ASSOCIATEPROFESSOR
ASSISTANTPROFESSOR INSTRUCTOR
California State Univ 280 180 58 42Dominguez Hills 69,368 75,900 61,600 52,100
Univ of Southern Colorado 171 52 50 58 11
44,999 52,800 46,100 39,900 30,000
Boise State Univ 359 159 96 95 9
Idaho 48,212 53,700 46,500 42,000 35,100
Indiana University 110 21 63 26 0
Northwest 53,220 65,400 52,800 44,400 0
Univ of Nevada Las Vegas 507 135 166 206 0
55,544 69,300 56,200 46,000 0
SUNY College at Brockport 289 91 116 82
61,944 74,100 61,700 48,800
So. Oregon State Univ 173 68 61 33 11
47,281 54,600 45,600 39,000 36,200
Austin Peay State Univ 201 83 47 71
Tennessee 44,979 54,800 41,200 36,000
Eastern Washington Univ 358 185 79 78 16
47,748 54,600 45,500 38,400 25,200
Univ of Wisconsin Oshkosh 370 120 97 145 853,323 63,400 53,100 46,000 37,600
SOUTHERN UTAH UNIVERSITY 128 29 45 42 12
42,596 50,300 43,600 38,600 34,200
AVG # FACULTY-Comp Institutions 287 109 83 84 11
WTD AVG--Comp Institutions 53,366 62,512 52,362 43,819 31,784
1992-93 Estimated
California State Univ 0.00% 280 180 58 42Dominguez Hills 69,368 75,900 61,600 52,100
Univ of Southern Colorado 3.00% 171 52 50 58 11
46,349 54,384 47,483 41,097 30,900
Boise State Univ 0.01% 359 159 96 95 9
Idaho 48,217 53,705 46,505 42,004 35,104
Indiana University 3.10% 110 21 63 26 0
Northwest 54,870 67,427 54,437 45,776 0
Univ of Nevada Las Vegas 0.00% 507 135 166 206 0
55,544 69,300 56,200 46,000 0
SUNY College at Brockport 0.00% 289 91 116 8261,944 74,100 61,700 48,800
So. Oregon State Univ 2.00% 173 68 61 33 11
48,227 55,692 46,512 39,780 36,924
Austin Peay State Univ 0.00% 201 83 47 71
Tennessee 44,979 54,800 41,200 36,000
Eastern Washington Univ 3.00% 358 185 79 78 1649,181 56,238 46,865 39,552 25,956
Univ of Wisconsin Oshkosh 4.50% 370 120 97 145 855,723 66,253 55,490 48,070 39,292
SOUTHERN UTAH UNIVERSITY 4.53% 128 29 45 42 12
44,526 52,579 45,575 40,349 35,749
AVG # FACULTY-Comp Institutions 287 109 83 84 11
WTD AVG--Comp Institutions 1.40% 54,068 63,285 53,044 44,443 32,575
32.145

Table 2-EANALYSIS OF FACULTY TOTAL COMPENSATION COMPARABILITY
COMMUNITY COLLEGES
1991-92 Actual RPT AVG% INC
ALLRANKS
Anne Arundel Comm. 194College, MD 56,200
Onandaga Community 194College, NY 55,900
Chemetaka Community 226College, OR 48,700
Spokane Community 198College, WA 45,300
Danville Community 56College. VA 47,100
Yavapai College 76AZ 45,300
North Idaho 95College 42,255
Joliet Junior 144College, IL 51,800
Grand Rapids Junior 226College, MI 57,100
Western Wyoming 56Community College 39,900
**UTAH INST** SNOW DIXIE CEU UVCC SLCC
7540,500
7239,700
7439,200
17542,515
22940,239
AVG # FACULTY--Comp Institutions 147 147 147 147 147
WTD AVG--Comp Institutions 50,796 50,796 50,796 50,796 50,796
1992-93 Estimated
Anne Arundel Comm. 4.00% 194College, MD 58,448
Onandaga Community 6.50% 194College, NY 59,534
Chemetaka Community 4.84% 226College, OR 51,057
Spokane Community 4.84% 198College, WA 47,493
Danville Community 1.17% 56College, VA 47,650
Yavapai College 1.904 76AZ 46,161
North Idaho 4.50% 95College 44,156
Joliet Junior 7.004 144College, IL 55,426
Grand Rapids Junior 6.00% 226College, MI 60,526
Western Wyoming 0.00% 56Community College 39,900
SNOW DIXIE CEU UVCC SLCCUT Inst 4 Inc 4.68% 10.14% 7.63% 4.41% 7.79%Ave 0 Fac 75 72 74 175 229Ave Sal 42,395 43,726 42,191 44,390 43,374
AVG # FACULTY--Comp Institutions 147 147 147 147 147
WTD AVG--Comp Institutions 4.84% 53,308 53,308 53,308 53,308 53,308

Table 3-ACALCULATION OF COMPETITIVE FACULTY SALARY ADJUSTMENT
UNIVERSITY OF UTAH
Estimated1992-93
a. Total Salariesof Continuing
PROFESSORASSOCIATE ASSISTANTPROFESSOR PROFESSOR INSTRUCTOR
FOUR RANKSCOMBINED
Faculty Mmbrs
b. Compensationto Salary Ratio
c. Total Compof Continuing
22,388,995
1.29
9,944,673
1.33
6,799,083
1.34
952,723
1.37
40,085,475
Faculty Mmbrs
d. Ave Fac Salof U of U
e. Ave Fac Compof U of U
f. Wghtd Ave Salof Comp Inst
g. Wghtd Ave Compof Comp Inst
h. Average Salary
28,847,359
59,545
76,722
66,480
81,686
13,194,883
42,681
56,630
46,683
58,840
9,102,296
38,413
51,425
39,836
50,074
1,309,162
29,773
40,911
29,358
37,615
52,453,700
Difference(d. minus f.)
i. Average Comp
(6,935) (4,002) (1,423) 414
Difference(e. minus g.)
j. Number of
(4,964) (2,210) 1,351 3,296
ContinuingFaculty Mmbrs
k. Total Salary
376 233 177 32
Difference(h. times j.) (2,607,520) (932,464) (251,919) 13,252 (3,778,651)
1. Total CompDifference(i. times j.)
m. Salary Gap %(k / a)
n. Comp Gap %(1 / c)
(1,866,527)
-11.65%
-6.47%
(514,913)
-9.384
-3.90%
239,179
-3.71%
2.63%
105,483
1.39%
8.06%
(2,036,778)
-9.43%
-3.884
3)347

Table 34CALCULATION OF COMPETITIVE FACULTY SALARY ADJUSTMENT
UTAH STATE UNIVERSITY
Estimated1992-93
a. Total Salariesof Continuing
PROFESSORASSOCIATEPROFESSOR
ASSISTANTPROFESSOR INSTRUCTOR
FOUR RANKSCOMBINED
Faculty Mubrs
b. Compensationto Salary Ratio
c. Total Coupof Continuing
7,989,314
1.30
5,378,688
1.33
5,392,573
1.35
444,744
1.37
19,205,320
Faculty Mmbrs
d. Ave Fac Salof USU
e. Ave Fac Compof USU
f. Wghtd Ave Salof Comp Inst
g. Wghtd Ave Compof Comp Inst
h. Average Salary
10,363,579
48,128
62,431
63,267
76,551
7,176,456
38,419
51,260
45,957
56,782
7,293,906
34,348
46,458
38,881
48,076
610,740
29,650
40,716
27,291
35,304
25,444,681
Difference(d. minus f.)
i. Average Comp
(15,139) (7,538) (4,533) 2,359
Difference(e. minus g.)
j. Number of
(14,120) (5,522) (1,618) 5,412
ContinuingFaculty Mmbrs
k. Total Salary
166 140 157 15
Difference(h. times j.) (2,513,086) (1,055,306) (711,737) 35,385 (4,244,744)
1. Total CompDifference(i. times j.)
m. Salary Gap %(k / a)
n. Comp Gap %(1 / c)
(2,343,892)
-31.464
-22.62%
(773,022)
-19.62%
-10.77%
(254,057)
-13.20%
-3.484
81,182
7.96%
13.29%
(3,289,789)
-22.10%
-12.93%
:3 ) 4
48

1
Table 3-CCALCULATION OF COMPETITIVE FACULTY SALARY ADJUSTMENT
WEBER STATE UNIVERSITY
Estimated1992-93
a. Total Salariesof ContinuingFaculty Mmbrs
b. Compensationto Salary Ratio
c. Total Compof ContinuingFaculty Mmbrs
d. Ave Fac Salof WSU
e. Ave Fac Compof WSU
f. Wghtd Ave Salof Comp Inst
g. Wghtd Ave Coupof Comp Inst
h. Average SalaryDifference(d. minus f.)
i. Average CompDifference(e. minus g.)
j. Number ofContinuingFaculty Mmbrs
k. Total SalaryDifference(h. times j.)
I. Total CoMpDifference(i. times j.)
m. Salary Gap %(k / a)
n. Comp Gap %(1 / c)
PROFESSOR
6,831,382
1.31
8,946,220
46,790
61,275
51,255
63,285
(4,465)
(2,009)
146
(651,906)
(293,319)
-9.54%
-3.284
ASSOCIATEPROFESSOR
3,535,845
1.33
4,689,450
39,287
52,105
42,671
53,044
(3,383)
(939)
90
(304,509)
(84,506)
-8.61%
-1.80%
ASSISTANTPROFESSOR
4,142,452
1.34
5,532,092
32,618
43,560
35,954
44,442
(3,336)
(883)
127
(423,732)
(112,090)
-10.23%
-2.03%
INSTRUCTOR
1,700,707
1.37
2,334,304
26,574
36,474
25,239
32,575
1,335
3,899
64
85,412
249,513
5.02%
10.69%
FOUR RANKSCOMBINED
16,210,387
21,502,066
(1,294,736)
(240,402)
-7.99%
-1.12%
49
3 .2 5

Table 3-0CALCULATION OF COMPETITIVE FACULTY SALARY ADJUSTMENT
SOUTHERN UTAH UNIVERISTY
Estimated1992-93
a. Total Salariesof Continuing
PROFESSORASSOCIATEPROFESSOR
ASSISTANTPROFESSOR INSTRUCTOR
FOUR RANKSCOMBINED
Faculty Mmbrs
b. Compensationto Salary Ratio
c. Total Compof Continuing
1,164,046
1.31
1,519,344
1.35
1,211,712
1.40
294,775
1.46
4,189,876
Faculty Mmbrs
d. Ave Fac Salof SUU
e. Ave Fac Compof SUU
f. Wghtd Ave Salof Comp Inst
g. Wghtd Ave Compof Comp lnst
h. Average Salary
1,524,779
40,140
52,579
51,256
63,285
2,050,879
33,763
45,575
42,671
53,044
1,694,140
28,850
40,349
35,954
44,443
428,991
24,565
35,749
25,239
32,575
5,699,289
Difference(d. minus f.) (11,116) (8,908) (7,104) (675)
I. Average CompDifference(e. minus g.)
j. Number of
(10,706) (7,469) (4,094) 3,174
ContinuingFaculty Mmbrs
k. Total Salary
29 45 42 12
Difference(h. times j.) (322,367) (400,840) (298,370) (8,095) (1,029,672)
1. Total CompDifference(i. times j.)
m. Salary Gap 9:
(310,479) (336,107) (171,946) 38,091 (780,442)
(k / a)
n. Comp Gap %(1 / c)
-27.69%
-20.36%
-26.384
-16.39%
-24.62%
-10.15%
-2.75%
8.888
-24.588
-13.69%

Table 3-ECALCULATION OF COMPETITIVE FACULTY SALARY ADJUSTMENT
COMMUNITY COLLEGES
Estimated1992-93
a. Total Salariesof ContinuingFaculty Mmbrs
b. Compensationto Salary Ratio
c. Total Compof ContinuingFaculty Mmbrs
d. Ave Fac Sal,of Utah Inst
e. Ave Fac Comp,of Utah Inst
f. Wghtd Ave Salof Comp Inst
g. Wghtd Ave Compof Comp Inst
h. Average SalaryDifference[d. minus f.]
i. Average CompDifference[e. minus g.]
j. Number ofContinuingFaculty Members
k. Total SalaryDifference[h. times j.]
1. Total CompDifference[i. times j.]
m. Salary Gap %[k / a]
n. Comp Gap %[1 / c]
SNOW
2,292,492
1.39
3,179,655
30,567
42,395
41,307
53,308
(10,740)
(10,913)
75
(805,531)
(818,480)
-35.144
-25.74*
DIXIE
2,283,863
1.38
3,148,242
31,720
43,726
41,307
53,308
(9,587)
(9,583)
72
(690,239)
(689,958)
-30.22%
-21.92%
CEU
2,285,846
1.37
3,122,131
30,890
42,191
41,307
53,308
(10,417)
(11,118)
74
(770,870)
(822,695)
-33.72%
-26.35%
UVCC
5,682,514
1.37
7,768,235
32,472
44,390
41,307
53,308
(8,835)
(8,919)
175
(1,546,206)
(1,560,747)
-27.21%
-20.09%
SLCC
7,175,119
1.38
9,932,559
31,332
43,374
41,307
53,308
(9,975)
(9,935)
229
(2,284,178)
(2,275,080)
-31.83%
-22.91%
3275 1

1992-93 ANALYSIS OF CLASSIFIED STAFFSALARY AND COMPENSATION COMPARABILITY
Methodology
This report constitutes the annual update of the Classified Staff SalarySurvey. It compares salary and compensation levels of classified staff at Utahinstitutions to salary and compensation levels of classified staff in local andstatewide area markets.
Salary data from USHE institutions are obtained yearly. Marketplace dataare also gathered yearly for northern Utah by USU, for the greater Ogden area byWSU, for the greater Salt Lake area by the U of U and SLCC, and for Utah Countyby UVCC. Every three years all local marketplaces for the nine institutions aresurveyed. Survey responses are entered into Salary Survey Expert software by theinstitutions and forwarded to the Commissioner's office for consolidation andanalysis.
In the past, local marketplace data has been used for the U of U, WSU andSLCC, and statewide marketplace data has been used for the other USHEinstitutions. Because of a reduced response rate in the Salt Lake market thisyear, all institutions have also been compared to a statewide market.
In addition to salary data, this analysis provides benefits information;but rather than gather benefits figures yearly and impose a substantial extraburden on respondents, the data is gathered once every three years. Therelationship between benefits and salaries for institutions is estimated ininterim years. Benefits data was last collected in 1991-92. Therefore, thosefigures are used to estimate benefits and total compensation for 1992-93. Thepercentage relationship between salaries and benefits for both institutions andtheir markets in the survey year is applied to the actual average salaries forthe current year. A change this year results in salary-related benefits beinglinked directly to actual average salary while constant benefits are heldconstant regardless of salary level. Compensation gaps for 1991-92 and for 1992-93 have been updated to reflect this change.
Findings
Comparisons from 1986-87 through 1992-93 by institution are summarized inTable 1. Using percentages, the table shows salary, benefits and totalcompensation comparisons for each institution as compared to its relativemarketplace. 1992-93 differentials calculated (1) using statewide marketplacedata for USU, SUU, Snow, Dixie, CEU and UVCC and local marketplace data for theU of U, WSU and SLCC and (2) using statewide marketplace data for all
institutions are summarized below:
3 )3
52

CLASSIFIED STAFF SALARY SURVEY
1192m93 SALARLANISMEEMAII2LIIEEERERLIAL5
Institution
Statewide Market-USU, SUU,Snow, Dixie. CEU. UVCC Statewide Market-Ai.
CompensationSalary Compensation Salary
U of U -18.69% -6.59% -24.55% -11.13%
USU -23.39% -5 JO% -23.39% -5.80%
WSU -34.96%
-26.45%
-16.47%
-8.91%
-28.14%
-26.45%
-11.38%
-8.91%SUU
Snow -12.58% 2.70% -12.58% 2.70%
Dixie -21.47% -4.24% -21.47% -4.24%
CEU -15.45% -0.87% -15.45% -0.87%
UVCC -26.20% -3.42% -Z.6.20%
-14.10%
-3.42%
1.12%SLCC -7.16% 6.33%
Figuring gaps with local marketplace data for the U of U, WSU and SLCC, theaverage salary gaps for 1992-93 range from -34.96% at WSU to -7.16% at SLCC.After considering the impact of fringe benefits on total compensation, the gapsnarrow to -16.47% and 6.33% at these institutions. Using statewide data for allinstitutions produces average salary gaps that range from -28.14% at WSU to-12.58% at Snow. These gaps narrow to -11.38% and 2.70% respectively oncebenefits data are included.
Salary increases provided by the legislature and internal reallocations byinstitutions have served to decrease the gaps to some extent. For example, WSUused an extra $101,000 from fuel and power money as part of their two percentreallocation process to fund staff salary increases in 1992-93. The percentagesalary increases for 1992-93 are listed below:
CLASSIFIED STAFFPERCENTAGE SALARY INCREASES
Institution 1992-93
University of Utah 4.27%
Utah State University
Weber S
4.21%
4.72%
Southern Utah University
Snow College 3.70%
Dixie College 5.00%
College of Eastern Utah
Utah Valley Community College
Salt Lake Community College
5.1_41_
4.05%
4.70%
3)953

TABLE 11986-87 TO 1992-93 CLASSIFIED SALARY SURVEY
TOTAL COMPENSATION COST ANALYSIS
Salary & BenefitDifferentials
Institution From Market
University of Utah a. Salaryb. Benefitsc. Compensation
Utah State University a. Salaryb. BenefitsC. Compensation
Weber State University a. Salaryb. Benefitsc. Compensation
So. Utah University a. Salaryb. Benefitsc. Compensation
Snow College a. Salaryb. Benefitsc. Compensation
Dixie College a. Salaryb. Benefitsc. Compensation
College of Eastern Utah a. Salaryb. Benefitsc. Compensation
Utah Valley Comm. College a. Salaryb. Benefitsc. Compensation
Salt Lake Comm. College a. Salaryb. Benefitsc. Total
1992-931986-87 1987-88 1988-89 1989-90 1990-91 1991-92 1992-93 State Mkt
-21.07% -19.81% -26.10% -17.00% -21.20% -18.70 -18.69% -24.55%27.58% 28.33% 30.86% 33.03% 32.73% 23.03% 23.07% 21.80%-11.37% -10.21% -15.18% -7.74% -10.86% -6.61% -6.59% -11.13%
-24.74% -17.964 -26.10* -23.40% -23.90% -26.00% -23.39% -23.39%21.35% 25.63% 23.35% 24.99% 27.09% 31.064 31.51% 31.51%-15.184 -8.91% -15.60% -13.12% -13.07% -7.434 -5.80% -5.80%
-25.14% -28.17% -30.10% -25.00% -32.10% -36.89% -34.96% -28.14%26.57% 24.79% 31.42% 34.11% 29.39% 23.66% 24.03% 25.34%-14.34% -17.12% -16.89% -12.31% -18.90% -17.74% -16.47% -11.384
-28.584 -24.99% -30.30% -24.10% -26.10% -30.94% -26.45% -26.45%28.84% 30.83% 33.14% 36.32% 38.99% 29.51% 30.37% 30.37%-16.81% -13.54% -16.37% -10.84% -11.81% -12.13% -8.91% -8.91%
-17.39% -16.06% -22.80% -16.10% -8.90% -18.05% -12.58% -12.58432.084 32.864 36.36% 39.83% 50.40% 34.94% 35.95% 35.95%-7.49% -6.27% -9.15% -3.20% 4.78% -0.91% 2.70% 2.70%
-17.654 -15.21% -30.20% -19.60% -26.10% -22.17% -21.47% -21.47%24.91% 26.47% 25.32% 31.40% 32.02% 31.984 32.11% 32.11%-9.03% -6.77% -18.53% -8.884 -13.89% -4.75% -4.24% -4.24%
-14.634 -7.80% -17.90% -19.10% -18.10% -12.81% -15.45% -15.45%26.01% 30.42% 29.45% 28.73% 31.69% 31.39% 30.87% 30.87%-7.03% -0.654 -8.13% -9.22% -7.82% 1.064 -0.87% -0.87%
-18.70 -14.35% -22.40% -21.00% -26.80% -32.64% -26.20% -26.20%27.87% 30.534 28.92% 29.74% 29.49% 37.87% 38.884 38.884-9.04% -5.01% -11.15% -9.87% -14.46% -7.83% -3.42% -3.42%
-14.584 -11.11% -22.70% -20.40% -16.50% -13.62% -7.16% -14.10%29.13% 31.28% 38.73% 39.88% 48.43% 35.13% 36.40% 35.04%-5.66% -2.46% -9.06% -7.02% -2.09% 1.78% 6.33% 1.12%
Footnote:
a. Local Markets were used for University of Utah. Weber State University, and Salt Lake Community College.Statewide Markets were used for all others.1992-93 data is presented both in this format and with all institutions compared to a statewide market.
b. Benefit costs were estimated during 1986-87 and 1987-88 based on 1985-86 actuals.Benefit costs were estimated during 1989-90 and 1990-91 based on 1988-89 actuals.Benefit costs were estimated during 1992-93 based on 1991-92 actuals.
3)11.)k 7
54
1
1
1
1

1
Job
Working Totals:Position Against Market:
BaseEmployees
1992-93 Classified Salary SurveyMarket Camparison for University of Utah
Using Average Base Salary Data
ParticipantAv Salary12,468.00
13,684.0012,193.00
12,837.0015,140.00
18,014.0021,884.0017,163.0013,975.00
14,609.00
15,498.00
12,462.0012,356.0011,711.00
13,138.00
14,828.0013,932.0024,853.0015,234.0021,342.0022,480.0021,113.0019,748.00
20,047.0019,623.0015,667.0027,098.0023,025.0014,641.0019,920.0010,873.0014,107.0015,272.00
11,405.0013,037.0010,604.0010,868.00
12,506.0019,999.00
16,403.00
Low.
9,880.0011,954.8411,170.0011,440.0P13,367.64
15,054.0013,321.00
12,979.2012,272.00
12,589.5014,416.50
11,881.0010,729.6812,339.0014,458.00
16,725.0012,827.00
22,724.0013,707.00
19,413.6819,053.00
22,851.2522,147.2824,410.6923,577.4417,243.0022,853.8420,093.0014,144.0017,543.4610,481.004,890.7211,960.00
13,135.6515,847.91
10,358.0013,200.44
10,920.0013,466.96
16,748.68
1296 $21,405,909.00*
High@15,595.4019,294.0022,391.2519,755.0021,449.1224,948.0035,371.0026,560.8023,800.0028,103.0023,695.61
22,956.1519,812.2517,957.00
28,211.4036,036.0028,350.0035,264.1034,081.6343,015.3337,569.8432,475.4536,441.2428,016.4530,873.0031,775.1032,915.0030,265.2024,169.5026,520.0016,350.00
23,756.7227,337.20
22,336.8035,488.2012,109.4617,010.0017,675.0027,532.6030,028.95
Weighted MarketAverage
12,942.65
13,940.7913,364.5114,913.1418,026.95
20,950.6623,993.8317,211.3118,689.88
17,244.3820,646.5014,841.7213,684.1413,728.20
16,720.74
18,861.7219,200.48
27,218.1225,926.4534,777.1328,952.8227,904.4627,728.31
25,872.5927,052.8224,262.2324,816.0625,460.84
17,751.4720,639.1412,458.47
16,110.3616,823.21
16,826.4518,683.04
11,934.9214,003.52
13,431.9022,777.2222,860.68
Difference-474.65-256.79
- 1,171.51
-2,076.14-2,886.95- 2,936.66
- 2,109.83
-48.31-4,714.88- 2,635.38
-5,148.50
- 2,379.72
- 1,328.14
-2,017.20-3,582.74
-4,033.72-5,268.48-2,365.12
- 10,692.45
- 13,435.13
-6,472.82-6,791.46- 7,980.31
-5,825.59-7,429.82-8,595.232,281.94
-2,435.84-3,110.47
-719.14-1,585.47-2,003.36-1,551.21-5,421.45-5,646.04
-1,330.92-3,135.52
-925.90-2,778.22-6,457.68
Pent-3.8
-1.9-9.6
- 16.2
-19.1
- 16.3
-9.6-0.3
-33.7
-18.0-33.2
-19.1
-10.7-17.2-27.3-27.2
- 37.8
-9.5- 70.2
- 63.0
-28.8- 32.2
- 40.4
-29.1-37.9-54.98.4
-10.6- 21.2
-3.6-14.6
-14.2- 10.2
-47.5- 43.3
-12.6-28.9
-7.4-13.9
-39.4
-3,999,791.27*Weighted: -18.7%
Lowest Average Base value reported by selected respondents.
@ Highest Average Base value reported by selected respondents.
* Working totals weighted by base employee counts.
331
55
Stnd DevMrktEmps
1,217.09 280
1,049.77 163
1,590.95 156
662.33 698
1,274.98 653
2,095.30 3553,418.12 68
2,096.45 56
2,338.02 58
3,405.18 21
3,561.20 12
1,346.06 194
1,482.09 286
1,912.64 147
3,058.79 322
2,977.90 225
3,265.97 129
3,010.04 45
5,403.03 65
6,621.64 78
2,878.04 60
2,957.12 29
4,865.72 16
1,170.41 20
1,358.37 94
3,467.23 130
2,963.50 65
1,952.49 78
4,348.64 29
3,027.61 17
878.77 236
2,349.69 25
3,901.25 81
3,685.37 36
4,909.56 17
502.62 171
1,277.07 25
1,603.49 59
4,941.53 220
2,358.36 37
5456

1992-93 Classified Salary Survey (Statewide Mkt)Market Comparison for University of Utah
Using Average Base Salary Data
Base ParticipantJob Employees Av Salary Lowt High@
Weighted MaAetAverage Difference Pcnt Stnd Dev
12,468.00 9,880.00 19,554.00 15,885.14 -3,417.14 -27.4 2,313.3313,684.00 9,360.00 24,400.00 13,699.35 -15.35 -0.1 1,500.0912,193.00 9,360.00 22,391.25 14,692.79 -2,499.79 -20.5 2,929.0412,837.00 9,360.00 21,684.00 15,847.80 -3,010.80 -23.5 1,746.0115,140.00 12,688.00 24,096.00 18,593.83 -3,453.83 -22.8 1,789.9218,014.00 9,594.00 26,689.00 21,843.37 -3,829.37 -21.3 2,458.3721,884.00 13,321.00 43,824.00 23,585.37 -1,701.37 -7.8 3,703.8917,163.00 12,480.00 30,100.00 18,940.07 -1,777.07 -10.4 3,379.1813,975.00 12,272.00 29,388.00 19,175.28 -5,200.28 -37.2 2,917.3214,609.00 10,920.00 30,000.00 20,053.84 -5,444.84 -37.3 4,452.2915,498.00 13,730.00 28,863.00 24,153.43 -8,655.43 -55.8 5,432.7912,462.00 9,880.00 25,500.00 16,482.41 -4,020.41 -32.3 1,599.2612,356.00 9,464.00 19,812.25 14,032.16 -1,676.16 -13.6 1,548.3711,711.00 11,600.00 25,500.00 15,399.94 -3,688.94 -31.5 3,568.0413,138.00 12,480.00 28,211.40 16,767.95 -3,629.95 -27.6 2,992.7914,828.00 12,688.00 36,036.00 18,957.67 -4,129.67 -27.9 2,919.4313,932.00 12,827.00 37,800.00 20,776.67 -6,844.67 -49.1 4,203.5724,853.00 13,228.00 41,528.00 28,347.94 -3,494.94 -14.1 3,859.5915,234.00 13,707.00 62,100.00 30,089.14 -14,855.14 -97.5 5,082.5321,342.00 19,413.68 43,015.33 33,584.93 -12,242.93 -57.4 4,171.4822.480.00 15,322.00 58,000.00 31,916.69 -9,436.69 -42.0 7,279.0521,113.00 21,278.00 35,120.00 29,043.14 -7,930.14 -37.6 3,625.9919,748.00 22,147.28 36,441.24 30,117.32 -10,369.32 -52.5 3,285.5220,047.00 21,611.00 31,758.00 26,493.55 -6,446.55 -32.2 2,767.4119,623.00 17,992.00 33,072.00 27,179.72 -7,556.72 -38.5 3,314.2015,667.00 13,520.00 57,500.00 26,092.68 -10,425.68 -66.5 8,865.2127,098.00 22,526.00 48,200.00 31,053.34 -3,955.34 -14.6 4,338.9223,025.00 20,010.00 31,055.00 26,001.87 -2,976.87 -12.9 2,890.3114,641.00 3,785.60 28,221.00 22,987.66 -8.346.66 -57.0 5,358.3619,920.00 17,543.46 33,262.00 27,181.05 -7,261.05 -36.5 5,025.7110,873.00 10,481.00 20,300.00 14,109.74 -3,236.74 -29.8 2,935.5214,107.00 13,998.40 23,756.72 18,509.29 -4,402.29 -31.2 2,299.5515,272.00 11,960.00 35,200.00 16,891.15 -1,619.15 -10.6 5,490.9411,405.00 10,129.60 24,170.00 16,050.61 -4,645.61 -40.7 4,427.4713,037.00 15,847.91 35,488.20 20,697.58 -7,660.58 -58.8 5,744.2210,604.00 9,880.00 18,824.00 12,091.86 -1,487.86 -14.0 887.4010,868.00 10,920.00 17,992.00 14,920.62 -4,052.62 -37.3 1,287.7012,506.00 10,628.00 22,118.00 15,854.27 -3,348.27 -26.8 2,477.3019,999.00 13,466.96 29,704.00 24,697.56 -4,698.56 -23.5 4,570.3516,403.00 13,915.20 44,700.00 24,239.61 -7,836.61 -47.8 7,141.27
MrktEmps
I1000277
2891117
1156
814
149
121
123
I65
54
765
512
287
401
346
247
124
I323
348
276
54
66
83
276320 I434140
116
53
612
146
83464
26
325
1149
260
419138
Working Totals: 1296 $21,405,909.00* -5,254,795.00* 13309Position Against Market: Weighted: -24.5%
t Lowest Average Base value reported by selected respondents.
@ Highest Average Base value reported by selected respondents.
* Working totals weighted by base employee counts
332
56
1
1

1992-93 Classified Salary SurveyMarket Comparison for Utah State University
Using Average Base Salary Data
JobBase
EmployeesParticipantAv Salary Lowt High@
Weighted MarketAverage Difference Pcnt Stnd Dev
MrktEmps
11,461.27 9,880.00 19,554.00 15,885.14 -4,423.87 -38.6 2,313.33 1000
19,163.00 9,360.00 24,400.00 13,699.35 5,463.65 28.5 1,500.09 277
12,680.00 9,360.00 22,391.25 14,692.79 -2,012.79 -15.9 2,929.04 289
12,904.00 9,360.00 21,684.00 15,847.80 -2,943.80 -22.8 1,746.01 1117
14,645.00 12,688.00 24,096.00 18,593.83 -3,948.83 -27.0 1,789.92 1156
16,369.00 9,594.00 26,689.00 21,843.37 -5,474.37 -33.4 2,458.37 814
20,267.00 17,607.00 32,500.00 26,241.56 -5,974.56 -29.5 3,070.06 375
18,386.00 13,321.00 43,824.00 23,585.37 -5,199.37 -28.3 3,703.89 149
16,543.00 12,480.00 30,100.00 18,940.07 -2,397.07 -14.5 3,379.18 121
14,733.00 12,272.00 29,388.00 19,175.28 -4,442.28 -30.2 2,917.32 123
20,292.00 13,730.00 28,863.00 24,153.43 -3,861.43 -19.0 5,432.79 54
12,351.00 9,880.00 25,500.00 16,482.41 -4,131.41 -33.4 1,599.26 765
13,002.83 9,464.00 19,812.25 14,032.16 -1,029.33 -7.9 1,548.37 512
12,171.00 11,600.00 25,500.00 15,399.94 -3,228.94 -26.5 3,568.04 287
19,563.00 12,480.00 28,211.40 16,767.95 2,795.05 14.3 2,992.79 401
22,130.00 12,688.00 36,036.00 18,957.67 3,172.33 14.3 2,919.43 346
17,808.00 12,827.00 37,800.00 20,776.67 -2,968.67 -16.7 4,203.57 247
25,523.00 13,228.00 41,528.00 28,347.94 -2,824.94 -11.1 3 859.59 124
20,442.00 19,413.68 43,015.33 33,584.93 -13,142.93 -64.3 4,171.48 348
20,899.00 15,322.00 58,000.00 31,916.69 -11,017.69 -52.7 7,279.05 276
22,933.00 21.278.00 35,120.00 29,043.14 -6,110.14 -26.6 3,625.99 54
20,764.00 22,147.28 36,441.24 30,117.32 -9,353.32 -45.0 3,285.52 66
20,463.00 21,611.00 31,758.00 26,493.55 -6,030.55 -29.5 2,767.41 83
24,207.00 17,992.00 33,072.00 27,179.72 -2,972.72 -12.3 3,314.20 276
20,280.00 13,520.00 57,500.00 26,092.68 -5,812.68 -28.7 8,865.21 320
25,719.00 22,526.00 48,200.00 31,053.34 -5,334.34 -20.7 4,338.92 434
22,245.00 20,010.00 31,055.00 26,001.87 -3,756.87 -16.9 2,890.31 140
21,106.00 3,785.60 28,221.00 22,987.66 -1,881.66 -8.9 5,358.36 116
21,175.00 17,543.46 33,262.00 27,181.05 -6,006.05 -28.4 5,025.71 53
13,594.00 10,481.00 20,300.00 14,109.74 -515.74 -3.8 2,935.52 612
16,586.00 13,998.40 23,756.72 18,509.29 -1,923.29 -11.6 2,299.55 146
19,830.00 13,956.00 34,320.00 22,465.78 -2,635.78 -13.3 4,561.35 44
14,190.00 11,960.00 35,200.00 16,891.15 -2,701.15 -19.0 5,490.94 834
15,974.00 10,129.60 24,170.00 16,050.61 -76.61 -0.5 4,427.47 64
20,032.00 15,847.91 35,488.20 20,697.58 -665.58 -3.3 5,744.22 26
9,256.00 9,880.00 18,824.00 12,091.86 -2,835.86 -30.6 887.40 325
11,003.20 10,920.00 17,992.00 14,920.62 -3,917.42 -35.6 1,287.70 149
12,590.00 10,628.00 22,118.00 15,854.27 -3,264.27 -25.9 2,477.30 260
20,940.00 13,466.96 29,704.00 24,697.56 -3,757.56 -17.9 4,570.35 419
16,256.00 13,915.20 44,700.00 24,239.61 -7,983.61 -49.1 7,141.27 138
Working Totals: 470 $7,571,284.40* -1,770,810.05* 13340
Position Against Market: Weighted: -23.4%
t Lowest Average Base value reported by selected respondents.
@ Highest Average Base value reported by selected respondents.
* Working totals weighted by base employee counts.
3335 7

1992-93 Classified Salary SurveyMarket Comparison for Weber State University
Using Average Base Salary Data
Base ParticipantJob Employees Av Salary Low/ High@
Weighted MarketAverage Difference Pcnt Stnd Dev
13,751.00 11,528.00 18,984.00 17,192.89 -3,441.89 -25.0 1,283.15
12,321.00 10,681.00 21,365.00 17,072.16 -4,751.16 -38.6 2,964.96
14,056.00 12,688.00 24,096.00 19,621.01 -5,565.01 -39.6 1,833.01
16,995.00 16,846.00 26,689.00 22,307.51 -5,312.51 -31.3 2,424.76
18,701.00 17,607.00 31,543.00 26,657.83 -7,956.83 -42.5 3,073.92
21,030.00 12,480.00 30,100.00 20,803.77 226.23 1.1 3,157.22
14,977.00 12,480.00 28,944.00 20,361.43 -5,384.43 -36.0 2,483.73
15,237.00 13,730.00 28,863.00 18,026.27 -2,789.27 -18.3 6,637.10
13,155.00 12,779.00 19,213.00 14,466.13 -1,311.13 -10.0 834.26
14,097.00 11,600.00 23,400.00 18,640.02 -4,543.02 -32.2 3,849.13
21,503.00 16,657.00 50,830.00 30,935.86 -9,432.86 -43.9 3,372.16
29,012.00 23,426.00 38.482.00 33,039.06 -4,027.06 -13.9 2,322.58
18,601.00 21,278.00 34,901.00 31.645.98 -13,044.98 -70.1 1,898.55
19,735.00 21,278.00 35.120.00 31,067.13 -11,332.13 -57.4 4,461.94
20,498.00 21,611.00 31,758.00 26,249.83 -5.751.83 -28.1 2,974.15
20,309.00 17,992.00 33,072.00 26,221.58 -5,912.58 -29.1 3,701.86
17,370.00 24,639.00 33,262.00 30,553.07 -13,183.07 -75.9 1,498.39
12,478.00 11,440.00 20,154.00 14,835.42 -2,357.42 -18.9 3,196.72
15,237.00 14,331.00 21,287.00 19,545.27 -4,308.27 -28.3 2,350.47
18,222.00 13,956.00 29,875.00 20,805.70 -2,583.70 -14.2 5,119.04
11,671.00 13,718.00 24,170.00 20,074.57 -8,403.57 -72.0 2,945.33
17,527.00 16,681.00 35,210.00 25,923.17 -8,396.17 -47.9 5,657.86
14,354.00 11,954.00 22,118.00 17,037.57 -2,683.57 -18.7 1,580.24
19,611.00 20,168.00 29,061.00 26,865.71 -7,254.71 -37.0 3,209.30
MrktEmps
I67395
318261
103
43
4011
151
I52
169
132
221
16
47
139
30 I225
37
10
7
6
160
126
Working Totals: 266 $4,028,996.00* -1,408,613.83* 3072 IPosition Against Market: Weighted: -35.0%
# Lowest Average Base value reported by selected respondents.
@ Highest Average Base value reported by selected respondents. I* Working totals weighted by base employee counts.
3 4
58

1992-93 Classified Salary Survey (Statewide Mkt)Market Comparison for Weber State University
Using Average Base Salary Data
Job
BaseEmployees
ParticipantAv Salary Low# High@
Weighted MarketAverage Difference Pcnt Stnd Dev
MrktEmps
13,751.00 9,880.00 19,554.00 15,885.14 -2,134.14 -15.5 2,313.33 1000
12,321.00 9,360.00 22,391.25 14,692.79 -2,371.79 -19.2 2,929.04 289
14,056.00 12,688.00 24,096.00 18,593.83 -4,537.83 -32.3 1,789.92 1156
16,995.00 9,594.00 26,689.00 21,843.37 -4,848.37 -28.5 2,458.37 814
18,701.00 17,607.00 32,500.00 26,241.56 -7,540.56 -40.3 3,070.06 375
21,030.00 12,480.00 30,100.00 18,940.07 2,089.93 9.9 3,379.18 121
14,977.00 12,272.00 29,388.00 19,175.28 -4,198.28 -28.0 2,917.32 123
15,237.00 13,730.00 28,863.00 24,153.43 -8,916.43 -58.5 5,432.79 54
13,155.00 9,464.00 19,812.25 14,032.16 -877.16 -6.7 1,548.37 512
14,097.00 11,600.00 25,500.00 15,399.94 -1,302.94 -9.2 3,568.04 287
21,503.00 13,707.00 62,100.00 30,089.14 -8,586.14 -39.9 5,082.53 323
29,012.00 19,413.68 43,015.33 33,584.93 -4,572.93 -15.8 4,171.48 348
18,601.00 15,322.00 58,000.00 31,916.69 -13,315.69 -71.6 7,279.05 276
19,735.00 21,278.00 35,120.00 29,043.14 -9,308.14 -47.2 3,625.99 54
20,498.00 21,611.00 31,758.00 26,493.55 -5,995.55 -29.2 2,767.41 83
20,309.00 17,992.00 33,072.00 27,179.72 -6,870.72 -33.8 3,314.20 276
17,370.00 17,543.46 33,262.00 27,181.05 -9,811.05 -56.5 5,025.71 53
12,478.00 10,481.00 20,300.00 14,109.74 -1,631.74 -13.1 2,935.52 612
15,237.00 13,998.40 23,756.72 18,509.29 -3,272.29 -21.5 2,299.55 146
18,222.00 13,956.00 34,320.00 22,465.78 -4,243.78 -23.3 4,561.35 44
11,671.00 10,129.60 24,170.00 16,050.61 -4,379.61 -37.5 4,427.47 64
17,527.00 15,847.91 35,488.20 20,697.58 -3,170.58 -18.1 5,744.22 26
14,354.00 10,628.00 22,118.00 15,854.27 -1,500.27 -10.5 2,477.30 260
19,611.00 13,466.96 29,704.00 24,697.56 -5,086.56 -25.9 4,570.35 419
Working Totals: 266 $4,028,996.00* -1,133,902.98* 7715
Position Against Market: Weighted: -28.1%
Lowest Average Base value reported by selected respondents.
@ Highest Average Base value reported by selected respondents.
* Working totals weighted by base employee counts.
3 3
59

1
1992-93 Classified Salary SurveyMarket Comparison for Southern Utah University
Using Average Base Salary Data
Base ParticipantJob Employees Av Salary Lowi High@
Weighted MarketAverage Difference Pcnt Stnd Dev
MrktEmps
12,725.00 12,688.00 24,096.00 18,593.83 -5,868.83 -46.1 1,789.92 1156
15 039.00 9 594.00 26 689.00 21,843.37 -6,804.37 -45.2 2,458.37 814
17,994.00 17,607.00 32,500.00 26,241.56 -8,247.56 -45.8 3,070.06 375
22,077.00 13,321.00 43,824.00 23,585.37 -1,508.37 -6.8 3,703.89 149
16,872.00 9,880.00 25,500.00 16,482.41 389.59 2.3 1,599.26 765
16,752.00 12,480.00 28,211.40 16,767.95 -15.95 -0.1 2,992.79 401
24,876.0029,512.0024,036.00
21,278.0022,147.2821,611.00
35,120.0036,441.2431,758.00
29,043.1430,117.3226,493.55
-4,167.14-605.32
-2,457.55
-16.8-2.1
-10.2
3,625.993,285.52
2,767.41
54
I83
26,994.00 17,992.00 33,072.00 27,179.72 -185.72 -0.7 3,314.20 276
20,412.00 17,543.46 33,262.00 27,181.05 -6,769.05 -33.2 5,025.71 53
18,709.00 13,956.00 34,320.00 22,465.78 -3,756.78 -20.1 4,561.35 44
16,302.00 10,129.60 24,170.00 16,050.61 251.39 1.5 4,427.47 64
16,700.00 10,628.00 22,118.00 15,854.27 845.73 5.1 2,477.30 260
Working Totals:Position Against Market:
65 $1,126,030.00* $-297,814.89*Weighted: -26.4%
# Lowest Average Base value reported by selected respondents.
@ Highest Average Base value reported by selected respondents.
* Working totals weighted by base employee counts.
60
3:4 G
4560
1
1

1992-93 Classified Salary SurveyMarket Comparison for Snow College
Using Average Base Salary Data
Base Participant
Job Employees Av Salary Low.8,251.00 9,880.0014,222.00 9,360.00
18,375.00 12,688.0019,408.00 9,594.0023,208.00 17,607.0016,727.00 12,480.00
16,848.00 10,920.0016,336.00 9,464.0020,820.00 11,600.0023,631.00 13,707.0022,670.00 22,147.2814,722.00 21,611.0025,081.00 17,992.0023,245.00 13,520.0025,945.00 20,010.0014,157.00 17,543.4611,472.00 10,481.0022,245.00 13,998.4027,465.00 13,956.0017,581.00 10,129.6020,165.00 15,847.91
21,546.00 10,628.00
Working Totals:Position Against Market:
60 $1,060,839.00*
- Weighted MarketHigh@ Average Difference Pcnt
19,554.00 15,885.14 -7,634.14 -92.5
21,684.00 15,847.80 -1,625.80 -11.4
24,096.00 18,593.83 -218.83 -1.2
26,689.00 21,843.3732,500.00 26,241.5630,300.00 18,940.07
30,000.00 20,053.8419,812.25 14,032.16
25,500.00 15,399.9462,100.00 30,089.1436,441.24 30,117.3231,758.00 26,493.5533,072.00 27,179.7257,500.00 26,092.6831,055.00 26,001.8733,262.00 27,181.0520,300.00 14,109.7423,756.72 18,509.2934,320.00 22,465.7824,170.00 16,050.6135,488.20 20,697.5822,118.00 15,854.27
-2,435.37 -12.5
-3,033.56 -13.1
-2,213.07 -13.2
-3,205.84 -19.0
2,303.84 14.1
5,420.06 26.0
-6,458.14 -27.3
-7,447.32 -32.9- 11,771.55 -80.0
-2,098.72 -8.4
-2,847.68 -12.3
-56.87 -0.2
- 13,024.05 -92.0
-2,637.74 -23.03,735.71 16.84,999.22 18.2
1,530.39 8.7
-532.58 -2.6
5,691.73 26.4
Mrkt
Stnd Dev Emps
2,313.33 1000
1,746.01 1117
1,789.92 1156
2,458.37 814
3,070.06 375
3,379.18 121
4,452.29 65
1,548.37 512
3,568.04 287
5,082.53 323
3,285.52 66
2,767.41 83
3,314.20 276
8,865.21 320
2,890.31 140
5,025.71 53
2,935.52 612
2,299.55 146
4,561.35 44
4,427.47 64
5,744.22 26
2,477.30 260
$-133,496.81*Weighted: -12.6%
# Lowest Average Base value reported by selected respondents.
@ Highest Average Base value reported by selected respondents.
* Working totals weighted by base employee counts.
61
3 3 7
7860

1992-93 Classified Salary SurveyMarket Comparison for Dixie College
Using Average Base Salary Data
Base ParticipantJob Employees Av Salary Low# High@
Weighted MarketAverage Difference Pcnt Stnd Dev
13,932.00 9,360.00 24,400.00 13,699.35 232.65 1.7 1,500.0913,377.00 9,360.00 21,684.00 15,847.80 -2,470.80 -18.5 1,746.0115,017.00 12,688.00 24,096.00 18,593.83 -3,576.83 -23.8 1,789.9215,810.00 9,594.00 26,689.00 21,843.37 -6,033.37 -38.2 2,458.3718,097.00 17,607.00 32,500.00 26,241.56 -8,144.56 -45.0 3,070.0618,271.00 12,480.00 30,100.00 18,940.07 -669.07 -3.7 3,379.1818,340.00 12,272.00 29,388.00 19,175.28 -835.28 -4.6 2,917.3212,891.00 9,880.00 25,500.00 16,482.41 -3,591.41 -27.9 1,599.2614,002.00 9,464.00 19,812.25 14,032.16 -30.16 -0.2 1,548.3714,709.00 12,480.00 28,211.40 16,767.95 -2,058.95 -14.0 2,992.7917,697.00 12,688.00 36,036.00 18,957.67 -1,260.67 -7.1 2,919.4317,132.00 13,228.00 41,528.00 28,347.94 -11,215.94 -65.5 3,859.5925,200.00 15,322.00 58,000.00 31,916.69 -6,716.69 -26.7 7,279.0521,558.00 21,278.00 35,120.00 29,043.14 -7,485.14 -34.7 3,625.9927,077.00 22,147.28 36,441.24 30,117.32 -3,040.32 -11.2 3,285.5221,558.00 20,010.00 31,055.00 26,001.87 -4,443.87 -20.6 2,890.3118,615.00 17,543.46 33,262.00 27,181.05 -8,566.05 -46.0 5,025.7113,774.00 10,481.00 20,300.00 14,109.74 -335.74 -2.4 2,935.5227,224.00 13,956.00 34,320.00 22,465.78 4,758.22 17.5 4,561.3514,189.00 10,129.60 24,170.00 16,050.61 -1,861.61 -13.1 4,427.4721,956.00 15,847.91 35,488.20 20,697.58 1,258.42 5.7 5,744.2210,483.00 9,880.00 18,824.00 12,091.86 -1,608.86 -15.3 887.4013,781.00 10,920.00 17,992.00 14,920.62 -1,139.62 -8.3 1,287.7016,380.00 10,628.00 22,118.00 15,854.27 525.73 3.2 2,477.3021,727.00 13,466.96 29,704.00 24,697.56 -2,970.56 -13.7 4,570.35
Working Totals:Position Against Market:
1
Mrkt IEmps
277
1117
1156814
375
121
123
765 I512
401
346
124
276
54
66
140
53 1612
44
64
26
325
149
260
419-......- ......-......- -
70 $1,125,919.00* $-241,762.07* 8619 IWeighted: -21.5%
# Lowest Average Base value reported by selected respondents.
I@ Highest Average Base value reported by selected respondents.
* Working totals weighted by base employee counts.
111
62

1992-93 Classified Salary SurveyMarket Comparison for College of Eastern Utah
Using Average Base Salary Data
JobBase
EmployeesParticipantAv Salary Low# High@
-- Weighted MarketAverage Difference Pcnt Stnd Dev
MrktEmps
14,235.00 9,880.00 19,554.00 15,885.14 -1,650.14 -11.6 2,313.33 1000
14,713.00 9,360.00 24,400.00 13,699.35 1,013.65 6.9 1,500.09 277
11,612.00 9,360.00 22,391.25 14,692.79 -3,080.79 -26.5 2,929.04 289
13,640.00 9,360.00 21,684.00 15,847.80 -2,207.80 -16.2 1,746.01 1117
15,785.00 12,688.00 24,096.00 18,593.83 -2,808.83 -17.8 1,789.92 1156
21,126.00 9,594.00 26,689.00 21,843.37 -717.37 -3.4 2,458.37 814
23,517.00 17,607.00 32,500.00 26,241.56 -2,724.56 -11.6 3,070.06 375
17,486.00 12,480.00 30,100.00 18,940.07 -1,454.07 -8.3 3,379.18 121
15,507.00 9,880.00 25,500.00 16,482.41 -975.41 -6.3 1,599.26 765
14,439.00 9,464.00 19,812.25 14,032.16 406.84 2.8 1,548.37 512
15,649.00 12,480.00 28,211.40 16,767.95 -1,118.95 -7.2 2,992.79 401
15,640.00 12,688.00 36,036.00 18,957.67 -3,317.67 -21.2 2,919.43 346
13,549.00 12,827.00 37,800.00 20,776.67 -7,227.67 -53.3 4,203.57 247
24,097.00 15,322.00 58,000.00 31,916.69 -7,819.69 -32.5 7,279.05 276
19,714.00 13,520.00 57,500.00 26,092.68 -6,378.68 -32.4 8,865.21 320
14,378.00 10,481.00 20,300.00 14,109.74 268.26 1.9 2,935.52 612
Working Totals: 51 $815,060.00* $-125,965.89* 8628
Position Against Market: Weighted: -15.5%
# Lowest Average Base value reported by selected respondents.
@ Highest Average Base value reported by selected respondents.
* Working totals weighted by base employee counts.
339
6 3
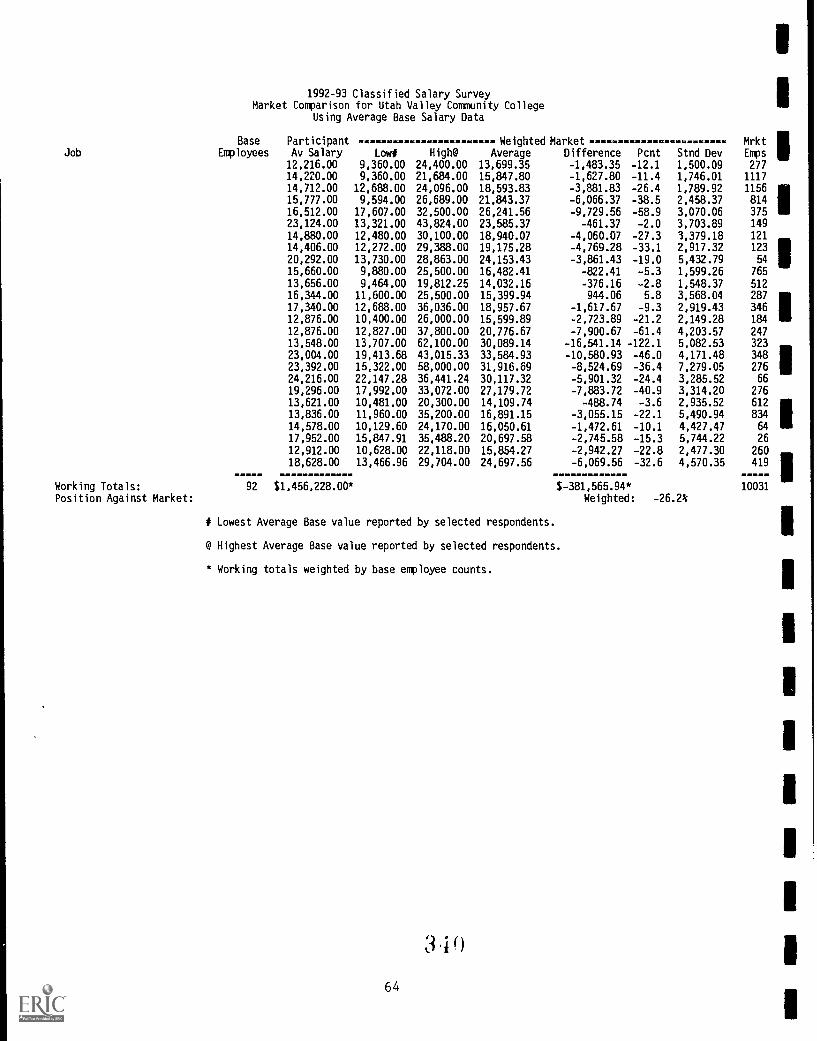
1992-93 Classified Salary SurveyMarket Comparison for Utah Valley Community College
Using Average Base Salary Data
Base ParticipantJob Employees Av Salary Lowl
12,216.00 9,360.0014,220.00 9,360.0014,712.00 12,688.0015,777.00 9,594.0016,512.00 17,607.0023,124.00 13,321.0014,880.00 12,480.0014,406.00 12,272.0020,292.00 13,730.0015,660.00 9,880.0013,656.00 9,464.0016,344.00 11,600.0017,340.00 12,688.0012,876.00 10,400.0012,876.00 12,827.0013,548.00 13,707.0023,004.00 19,413.6823,392.00 15,322.0024,216.00 22,147.2819,296.00 17,992.0013,621.00 10,481.0013,836.00 11,960.0014,578.00 10,129.6017,952.00 15,847.91
12,912.00 10,628.0018,628.00 13,466.96
Working Totals:Position Against Market:
1
Weighted Market MrktHigh@ Average Difference Pcnt Stnd Dev Emps
24,400.00 13,699.35 -1,483.35 -12.1 1,500.09 27721,684.00 15,847.80 -1,627.80 -11.4 1,746.01 1117
24,096.00 18,593.83 -3,881.83 -26.4 1,789.92 115626,689.00 21,843.37 -6,066.37 -38.5 2,458.37 81432,500.00 26,241.56 -9,729.56 -58.9 3,070.06 37543,824.00 23,585.37 -461.37 -2.0 3,703.89 149
30,100.00 18,940.07 -4,060.07 -27.3 3,379.18 121
-4,769.28 -33.1 2,917.32 123
28,863.00 24,153.43 -3,861.43 -19.0 5,432.79 54
I29,388.00 19,175.28
25,500.00 16,482.41 -822.41 -5.3 1,599.26 765
19,812.25 14,032.16 -376.16 -2.8 1,548.37 512
25,500.00 15,399.94 944.06 5.8 3,568.04 287
36,036.00 18,957.67 -1,617.67 -9.3 2,919.43 34626,000.00 15,599.89 -2,723.89 -21.2 2,149.28 184
37,800.00 20,776.67 -7,900.67 -61.4 4,203.57 247
62,100.00 30,089.14 -16,541.14 -122.1 5,082.53 323
43,015.33 33,584.93 -10,580.93 -46.0 4,171.48 34858,000.00 31,916.69 -8,524.69 -36.4 7,279.05 276
36,441.24 30,117.32 -5,901.32 -24.4 3,285.52 66
33,072.00 27,179.72 -7,883.72 -40.9 3,314.20 276
20,300.00 14,109.74 -488.74 -3.6 2,935.52 612
35,200.00 16,891.15 -3,055.15 -22.1 5,490.94 834
24,170.00 16,050.61 -1,472.61 -10.1 4,427.47 64
35,488.20 20,697.58 -2,745.58 -15.3 5,744.22 26
22,118.00 15,854.27 -2,942.27 -22.8 2,477.30 260
29,704.00 24,697.56 -6,069.56 -32.6 4,570.35 419 111
92 $1,456,228.00* $-381,565.94* 10031Weighted: -26.2%
# Lowest Average Base value reported by selected respondents.
@ Highest Average Base value reported by selected respondents.
* Working totals weighted by base employee counts.
11
64

Job
1992-93 Classified Salary SurveyMarket Comparison for Salt Lake Community College
Using Average Base Salary Data
Base Participant Weighted Market Mrkt
Employees Av Salary Low# High@ Average Difference Pcnt Stnd Dev Emps
14,885.00 9,880.00 15,595.40 12,942.65 1,942.35 13.0 1,217.09 280
17,022.00 11,954.84 19,294.00 13,940.79 3,081.21 18.1 1,049.77 163
14,522.00 11,170.00 22,391.25 13,364.51 1,157.49 8.0 1,590.95 156
14,912.00 11,440.00 19,755.00 14,913.14 -1.14 -0.0 662.33 698
15,168.00 13,367.64 21,449.12 18,026.95 -2,858.95 -18.8 1,274.98 653
17,756.00 15,054.00 24,948.00 20,950.66 -3,194.b6 -18.0 2,095.30 355
19,898.00 19,032.00 31,532.80 25,561.61 -5,663.61 -28.5 3,154.49 173
21,644.00 13,321.00 35,371.00 23,993.83 -2,349.83 -10.9 3,418.12 68
16,583.00 12,979.20 26,560.80 17,211.31 -628.31 -3.8 2,096.45 56
15,566.00 12,589.50 28,103.00 17,244.38 -1,678.38 -10.8 3,405.18 21
14,399.00 11,881.00 22,956.15 14,841.72 -442.72 -3.1 1,346.06 194
12,139.00 10,729.68 19,812.25 13,684.14 -1,545.14 -12.7 1,482.09 286
16,756.00 12,339.00 17,957.00 13,728.20 3,027.80 18.1 1,912.64 147
16,407.00 14,458.00 28,211.40 16,720.74 -313.74 -1.9 3,058.79 322
18,237.00 16,725.00 36,036.00 18,861.72 -624.72 -3.4 2,977.90 225
17,527.00 14,285.00 21,994.12 15,478.36 2,048.64 11.7 1,911.28 160
22,981.00 13,707.00 34,081.63 25,926.45 -2,945.45 -12.8 5,403.03 65
27,984.00 19,413.68 43,015.33 34,777.13 -6,793.13 -24.3 6,621.64 78
21,750.00 19,053.00 37,569.84 28,952.82 -7,202.82 -33.1 2,878.04 60
24,338.00 22,851.25 32,475.45 27,904.46 -3,566.46 -14.7 2,957.12 29
19,899.00 24,410.69 28,016.45 25,872.59 -5,973.59 -30.0 1,170.41 20
21,702.00 23,577.44 30,873.00 27,052.82 -5,350.82 -24.7 1,358.37 94
22,469.00 17,543.46 26,520.00 20,639.14 1,829.86 8.1 3,027.61 17
14,666.00 10,481.00 16,350.00 12,458.47 2,207.53 15.1 878.77 236
17,378.00 14,890.72 23,756.72 16,110.36 1,267.64 7.3 2,349.69 25
17,355.00 16,913.46 22,495.72 19,435.88 -2,080.88 -12.0 1,946.98 16
14,983.00 11,960.00 27,337.20 16,823.21 -1,840.21 -12.3 3,901.25 81
16,434.00 13,135.65 22,336.80 16,826.45 -392.45 -2.4 3,685.37 36
18,057.00 15,847.91 35,488.20 18,683.04 -626.04 -3.5 4,909.56 17
12,371.00 10,358.00 12,109.46 11,934.92 436.08 3.5 502.62 171
12,686.00 10,920.00 17,675.00 13,431.90 -745.90 -5.9 1,603.49 59
21,473.00 13,466.96 27,532.60 22,777.22 -1,304.22 -6.1 4,941.53 220.M..=.....=.= QIIRMOCWIMICM=VE.6
Working Totals: 155 $2,803,577.00* $-200,738.56*
Position Against Market: Weighted: -7.2%
# Lowest Average Base value reported by selected respondents.
@ Highest Average Base value reported by selected respondents.
* Working totals weighted by base employee counts.
3416 5
5181
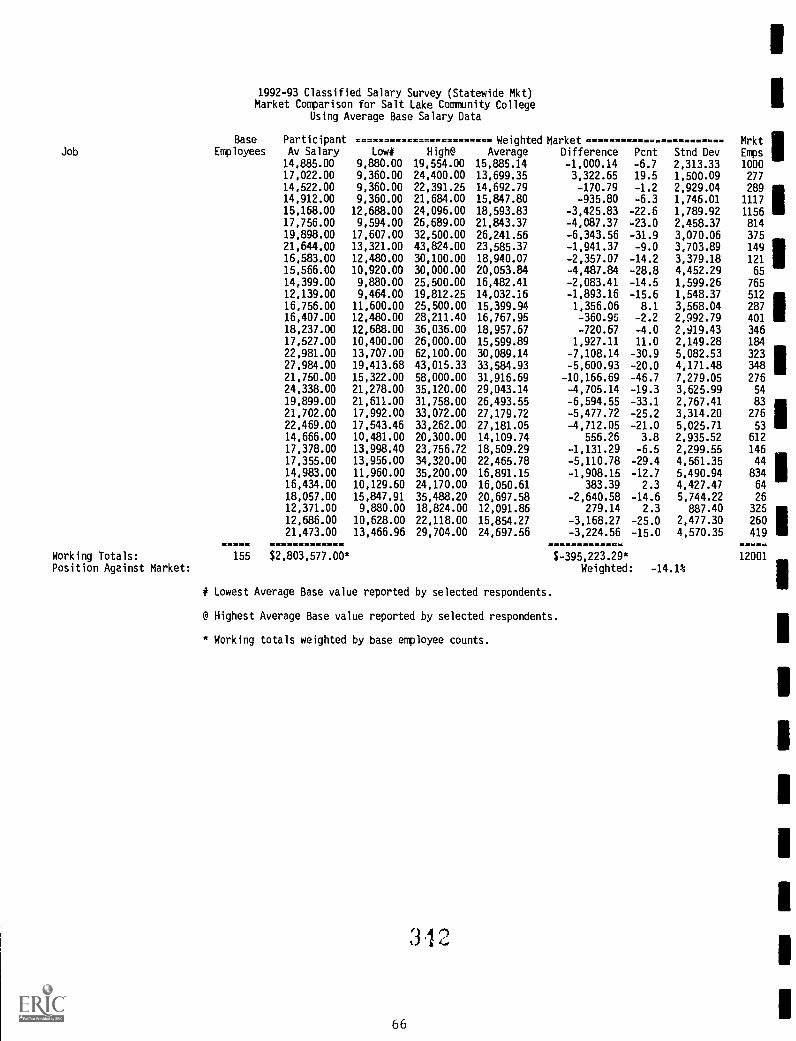
1992-93 Classified Salary Survey (Statewide Mkt)Market Comparison for Salt Lake Community College
Using Average Base Salary Data
Base ParticipantJob Employees Av Salary Low# High@
Weighted MarketAverage Difference Pent Stnd Dev
14,885.00 9,880.00 19,554.00 15,885.14 -1,000.14 -6.7 2,313.3317,022.00 9,360.00 24,400.00 13,699.35 3,322.65 19.5 1,500.0914,522.00 9,360.00 22,391.25 14,692.79 -170.79 -1.2 2,929.0414,912.00 9,360.00 21,684.00 15,847.80 -935.80 -6.3 1,746.0115,168.00 12,688.00 24,096.00 18,593.83 -3,425.83 -22.6 1,789.9217,756.00 9,594.00 26,689.00 21,843.37 -4,087.37 -23.0 2,458.3719,898.00 17,607.00 32,500.00 26,241.56 -6,343.56 -31.9 3,070.0621,644.00 13,321.00 43,824.00 23,585.37 -1,941.37 -9.0 3,703.8916,583.00 12,480.00 30,100.00 18,940.07 -2,357.07 -14.2 3,379.1815,566.00 10,920.00 30,000.00 20,053.84 -4,487.84 -28.8 4,452.2914,399.00 9,880.00 25,500.00 16,482.41 -2,083.41 -14.5 1,599.2612,139.00 9,464.00 19,812.25 14,032.16 -1,893.16 -15.6 1,548.3716,756.00 11,600.00 25,500.00 15,399.94 1,356.06 8.1 3,568.0416,407.00 12,480.00 28,211.40 16,767.95 -360.95 -2.2 2,992.7918,237.00 12,688.00 36,036.00 18,957.67 -720.67 -4.0 2,919.4317,527.00 10,400.00 26,000.00 15,599.89 1,927.11 11.0 2,149.2822,981.00 13,707.00 62,100.00 30,089.14 -7,108.14 -30.9 5,082.5327,984.00 19,413.68 43,015.33 33,584.93 -5,600.93 -20.0 4,171.4821,750.00 15,322.00 58,000.00 31,916.69 -10,166.69 -46.7 7,279.0524,338.00 21,278.00 35,120.00 29,043.14 -4,705.14 -19.3 3,625.9919,899.00 21,611.00 31,758.00 26,493.55 -6,594.55 -33.1 2,767.4121,702.00 17,992.00 33,072.00 27,179.72 -5,477.72 -25.2 3,314.2022,469.00 17,543.46 33,262.00 27,181.05 -4,712.05 -21.0 5,025.7114,666.00 10,481.00 20,300.00 14,109.74 556.26 3.8 2,935.5217,378.00 13,998.40 23,756.72 18,509.29 -1,131.29 -6.5 2,299.5517,355.00 13,956.00 34,320.00 22,465.78 -5,110.78 -29.4 4,561.3514,983.00 11,960.00 35,200.00 16,891.15 -1,908.15 -12.7 5,490.9416,434.00 10,129.60 24,170.00 16,050.61 383.39 2.3 4,427.4718,057.00 15,847.91 35,488.20 20,697.58 -2,640.58 -14.6 5,744.2212,371.00 9,880.00 18,824.00 12,091.86 279.14 2.3 887.4012,686.00 10,628.00 22,118.00 15,854.27 -3,168.27 -25.0 2,477.3021,473.00 13,466.96 29,704.00 24,697.56 -3,224.56 -15.0 4,570.35
Working Totals:Position Against Market:
Mrkt IEmps
1000
277
2891117
1156
814
375149 I121
65
765
512
287401
346184
323 1348
27654
83276
53
612
1464483464
26325
260419
155 $2,803,577.00* $-395,223.29* 12001
Weighted: -14.1%
# Lowest Average Base value reported by selected respondents.
@ Highest Average Base value reported by selected respondents.
* Working totals weighted by base employee counts.
66
312

L. C
ompa
rison
s
343

TAB LCOMPARISONS
Explanation and Analysis 1
FIGURE 1 & 2 Financial Indicators Profile 1989-90, UofU and USU 2
FIGURE 3 & 4 Financial Indicators Profile 1989-90, WSU and SUU 3
FIGURE 5 & 6 Financial Indicators Profile 1989-90, Snow and Dixie 4
FIGURE 7 & 8 Financial Indicators Profile 1989-90, CEU and UVCC 5
FIGURE 9 Financial Indicators Profile 1989-90, SLCC 6
Fall FTE Enrollment, 1984-85 to 1989-90 7
Tax Funds Appropriations per FTE 9
Tax Appropriations % of Education & General Revenues 11
Tuition and Fees per FTE 13
Tuition and Fees % of Instruction Direct Expenditures 15
Endowment Revenue per FTE 17
Government Grants & Contracts per FTE 19
Private Gifts, Grants & Contracts per FTE 21
Total Revenues per FTE 23
Instruction Expenditures per FTE 25
Research Expenditures per FTE 27
Research Expenditures % of Instruction Expenditures 29
Academic Support Expenditures per FTE 31
Student Services Expenditures per FTE 33
Scholarships & Fellowships per FTE 35
345

I
TAB LCOMPARISONS
--Continued-- I
Institutional Support Expenditures per FTE 37
Physical Plant 0 & M Expenditures per FTE 39
Total Expenditures and Transfers per FTE 41

COMPARISON GROUP FINANCIAL COMPARISONS
Background
The Commissioner's Office develops annual analyses of faculty compensationand of tuition and fees for USHE institutions compared to selected sets ofcomparison institutions. The comparison institution sets were updated in 1990to correct for changes in the status of some of the institutions on previouscomparison lists. In every case, the result of the changes was a closercorrelation for faculty salaries and total compensation between USHE institutions
and their comparison groups. In the above-mentioned analyses, four sets ofcomparison institutions are used: one each for the University of Utah and UtahState University, a single set for both Weber State University and Southern UtahUniversity and one set for all five community colleges.
The following analysis uses these same comparison groups in evaluatingrevenues and expenditures per FTE students at each USHE institution. The data
for Fiscal Years 1985 through 1989 are obtained from the U.S. Department ofEducation, Center for Education Statistics. Comparisons based on the nationaldatabase are edited and processed by the National Center for Higher EducationManagement Systems (NCHEMS).
Description of Data Presented
Figures 1 through 9 provide individual Financial Indicators Profiles for
the latest available year for each USHE institution, comparing the Utah
institution to the appropriate comparison group on eleven of the most relevant
indicators. The first three indicators are key revenue relationships and theremaining eight are key expenditure relationships. These eleven indicators and
additional indicators are presented in greater detail in the tables following the
figures. Institutions are listed in each table from high to low according to the
most recent year.
Findings
University of Utah: Below average appropriations and tuition/fees. Above
average performance in obtaining government grant and contract funding. Below
average expenditures across the board, especially in instruction and in
scholarships/fellowships.
Utah State University: Below average appropriations and tuition/fees, butsubstantially above average performance in obtaining grant and contract funds.Below average expenditures in most categories, with the notable exceptions ofresearch and scholarships/fellowships.
Weber State University & Southern Utah University: Below average taxappropriations and tuition and fees. Below average instructional expenditures.
Community Colleges: Average tax appropriations at Snow and CEU, belowaverage at the other colleges. Below average tuition/fees at Snow and CEU andabove average at Dixie, UVCC and SLCC. Above average performance in obtaining
grants and contracts. Below average instruction expenditures at all five
colleges, markedly so at UVCC.
134 7

Figures 1 & 2
FINANCIAL INDICATORS PROFILEUniversity of Utah 1989-90
$ P er FTE
21,000
18,000
16,000
12,000
9,000
6,000 -3.000 -
Li -ol-U- C omp Group
U ol U 6,638 2.209 5,637 5,725 3.740 1,608 532 798 1,155 1,030 18,948
Comp Group 8,260 3,331 4,838 7,727 4,511 1,984 611 1,033 1,322 1,306 20,601
U of U % BO 66 117 74 83 81 87 72 87 79 92
21.000
18,000
16.000
12,000 -9.000 -6,000
3, 000
FINANCIAL INDICATORS PROFILEUtah State University 1989-90
$ Per FTE
0
USW 0-Comp 1--oup
111111-1
C3
cc
USU 6235 1973, 7,337 4.400 6,570 1,024 423 1,191 982 8E6 17,339
Comp Group 8,369 2.677 3,600 5,453 4,427 1,395 550 936 1,247 1, 162 17,559
USU % 75 74 204 81 148 73 77 127 79 76 99
2 3 13

1
1
Figures 3 & 4
FINANCIAL INDICATORS PROFILEWeber State University 1989-90
$ Per FTE8,000
6,000
4,000
2,000
Uwsu OComp Group
00 84 4c *
u_
"g
INT-6 -0 aea e 1 1c c .c 1x x 1
o.x x xaUi
a.W IL tal W LU
g 1CL.
o,0 = t 0 LUi 04.c
(1) at
o 0 ."E =cc o 'a 0 jf a 0
65CI4 = to Ic
WSU 3,524 1,543 1,003 3,014 38 489 4 28 836 616 582 6,247
Comp Group 4,528 1,816 1,087 3,480 155 718 636 774 880 74 7 7,783
WSU % 78 85 92 87 25 68 6 7 108 70 78 80
8,000
FINANCIAL INDICATORS PROFILESouthern Utah University 1989-90
$ Per FTE
6,000
4,000
2,000
NSUU OComp Group
-o
e
LU
r.
4a
.c
SUU 3,743 1,366 1,540 2,508 0 719 628 1,179 792 780 7,6 77
Comp Group 4,528 1,816 1,087 3,480 155 718 636 774 880 74 7 7,783
SUU % 83 76 142 72 0 100 98 152 90 104 99
349

o) o
o)
0 3
o1
, *e
0 3 c -00
Tax
Fun
ds A
ppro
p
Tui
tion
& F
ees
Gov
t Gra
nts
& C
ont
Inst
ruct
ion
Exp
end
Res
earc
h E
xpen
d
Ace
d S
upp
Exp
end
Stu
dent
Svc
Exp
end
Sch
irshp
& F
iwsh
p
Inst
lt S
upp
Exp
end
Pla
nt O
&M
Exp
end
Tot
al E
&G
Exp
end
IV0.
0)C
O -
-8-8
80
oo
0
-o-1
1 Zrn
>I Z
Y?0
-. 0 0 z
o0
el 0
0..4
" 0
(0 D
3...
.%
re.
w s (CO
13
0 33 0 1-
-rn
0 0
o
e6.
)
<3 c -a
Tea
Fun
ds A
ppro
p
Tui
tion
& F
ees
Gov
t Gra
nts
& C
ont
Inst
ruct
ion
Exp
end
Res
earc
h E
xpen
d
Aca
d S
upp
Exp
end
Stu
dent
Svc
Exp
end
Sch
lrshp
& F
iwsh
p
Inst
il S
upp
Exp
end
Pla
nt O
&M
Exp
end
Tot
al E
&G
Exp
end
IV4:
b0)
CO
-8-8
-8"8
oo
oo
o4e
71'1
, -nZ
-I rn):
:31 Z
ED
0 . X >
Im
r-
0z
o,-
,
J /4: C
° 0
%.1
,4 a) e
n Ii.
0C
OC
OM
cp c
nel
) 0 M 0 71 II IT
I
_ P
5-3
8 (6
: 2 -, -
.
1111
1111
1111
1113
111
'
4.)
CO
--4
ZS
som
inm
ie.
IS,
.
.. .
11.
.
' 1. "
' " '
-...
.-.,,
CO
i \ 3
_.ch
8c-
--""
-c)
-g
_ _,
, -s
s -,
S, -..,
gri.3
,
N N
8 gi -.
, -N
N2
s; 2
-, iv
111,
111.
1111
'
q CT 0 0 I 0 3 c
waw
a.
o * 0 o i 0 3 . -la
, . .
Al
. '' II
, . ,
II' .
..
.. I
.. .
..
..
. :-.
0
§ t:t
,cY
,g
rQ't
cog
k-3)
c'ID
;-6
1.52
il
E g
, a, _
--8
8 2
El
'
,.
..
.. ,
W 0 I
LW
I I
LI
I I
MI
_(-
65 g
-8 ...
.
III.
011.
1111
1101
1111
1111
.111
FR g
@
Z6.
3 2
2
-__C
I5
E.3
S W
8 2
Nco
0
OM
IMM
Mr
OM
IN
N O
M M
N O
M U
N M
R

I I
I IM
MIN
OIN
E I
NO
NIN
IMI
I I
IO
WI
III
a I
I II
MN
I I
I I
1 I
NM
MO
M
C O
C<
o <
0 3
00
p 0
e 0 -(
3 c '0 C.)
N )
ci1
1°0
-c4;
n.,
4..
Cr)
co
-8-8
-88
00
00
0C i
0 0
0m
o m
c 3
cp
e0 z; c P
0
Tax
Fun
ds A
ppro
p
Tui
tion
& F
ees
Gov
t Gra
nts
& C
ont
Inst
ruct
ion
Exp
end
Res
earc
h E
xpen
d
Ace
d S
upp
Exp
end
Stu
dent
Svc
Exp
end
Sch
lrshp
& F
lwsh
p
Inst
il S
upp
Exp
end
Pla
nt O
&M
Exp
end
Tot
al E
&G
Exp
end
N)
Aa)
co
8-8
8-8
00
00
in -0-n
0P
to, 0 ,i, - >
0 .....
1--
eArn
Z0/
0,..
4. 0 0
c 0
ri)
M=
0)
...L
"U
CD
53
"C°
.0
%...
.i
TI
0ni
Tax
Fun
ds A
ppro
p
Tuo
n &
Fee
siti
.
Gov
t Gra
nts
& C
ont
inst
ruct
ion
Exp
end
Res
earc
h E
xpen
d
Aca
d S
upp
Exp
end
Stu
dent
Svc
Exp
end
Sch
irshp
& F
twah
p
inst
it S
upp
Exp
d
Pla
nt O
&M
Exp
end
Tot
al E
&G
Exp
end
41ID
.....
-0n-
ii
<z
---'
Z0 T
> 0_.
....,
oI-
3z
3 o
C ;:
k.=
l J
7-1:
PI
r,0
r -r
ir.
..IJ
- , ,
,0
-0IS
Im
00
,,,,,
-n
1) m
0
")f"
)4, ,
8pi
g_.
., m
.
WIL
IMI'l
l'
mw
al,
1011
1.
.
,.
,.
. '
mil
,. .
,. ." " '
I
- ' 8 1"1"2
-N) 8
....
sg -
g
10...
..---
....,
ch
IN)
N8
81 ..., .
'
im c < 0 0 -4 0 -ti
-a
SWIM
il 0 m c 6 v 0 3 c
IRM
IR
,, ' , . . . .
I
o f"
.o
o 'i"
.o
2..
cr,
43 O
D23
ii:t3
.1
, 2(1
8,
C.'
(1..
CI)
cil
-7.*
2 8
8 -4
im OM
IL
IMIL
ILIN
. . :
a
E3
g1.
1
cocr
i
. . - ° co
--,
kl W
all M
IA la

Tax
Fun
dat A
ppro
p
Tui
tion
& F
ees
Gev
t Gra
nts
& C
ont
I ns
t ruc
tion
Exp
end
Res
earc
h E
xpen
d
Aca
d Su
pp E
xpen
d
Stud
ent S
vc E
xpen
d
Schl
rshp
& F
lwsh
p
Inst
it Su
pp E
xpen
d
Plan
t O&
M E
xpen
d
Tot
al E
&G
Exp
end
MM
IIIIM
ILW
1111
1111
11
MI M
IM
IM
I MI 1
11M
ali M
O M
N

INDCTRS FINANCIAL COMPARISON INDICATORS 30-Jul-
Indicator: FALL FTE ENROLLMENT, 1984-85 TO 1988-89 Comparison Group: UNIVERSITY OF UTAH
1989-90
Amount Rank
1988-89
Amount Rank
1987-88
Amount Rank
1986-87
Amount Rank
1985-86
Amount Rank
1984-85
Amount Rank
Purdue University, Main Campus 33,394 1 32,623 1 30,786 2 30,001 3 29,750 3 29,184 4
Univ California, Los Angeles 32,609 2 32,266 2 33,802 1 32,727 1 32,645 1 32,645 1
University of Florida 30,340 3 29,845 3 29,823 3 31,213 2 31,666 2 31,611 2
University of Arizona 30,015 4 28,392 5 27,147 5 25,793 5 25,418 6 24,869 6
University of Washington 28,885 5 29,123 4 29,010 4 29,177 4 29,384 4 29,445 3
University of Iowa 25,111 6 25,165 6 25,071 6 25,611 6 25,637 5 25,776 5
Univ Cincinnati, Main Campus 23,652 7 24,619 7 24,123 7 22,366 7 22,518 7 22,826 7
Univ of Colorado, Boulder 22,964 8 22,463 8 22,006 8 20,987 8 20,997 8 20,650 8
Univ North Carolina (Ch Hill) 20,812 9 20,825 9 20,207 9 20,228 9 19,733 9 19,365 9
UNIVERSITY OF UTAH 18,390 10 18,067 10 18,504 10 18,417 10 18,359 10 18,481 10
Univ of Virginia, Main Campus 17,972 11 17,816 11 17,817 11 17,972 11 16,462 11 16,168 11
COMPARISON GROUP AVERAGE 26,575 26,314 25,979 25,608 25,421 25,254
PERCENT OF COMP GROUP AVE:
University of Utah 69.20% 68.66% 71.23% 71.92% 72.22% 73.18%
Indicator: FALL FTE ENROLLMENT, 1984-85 TO 1988-89
1989-90 1988-89
Amount Rank Amount Rank
1987-88
Amount Rank
Comparison Group:
1985-87
Amount Rank
UTAH STATE UNIVERSITY
1985-86 1984-85
Amount Rank Amount Rank
Texas A & M University 37,569 1 36,317 1 36,196 1 33,763 1 32,820 1 33,835 1
Univ of Maryland, College Pk 29,660 2 30,374 2 31,576 2 31,989 2 32,118 2 31,700 2
Iowa State University 23,531 3 23,667 3 23,817 3 24,502 3 24,569 3 24,463 3
Virginia Tech University 22,612 4 22,037 4 22,587 4 22,264 4 21,888 4 21,288 4
North Carolina State Univ 20,563 5 19,956 5 19,182 6 19,633 5 19,340 5 19,083 5
Univ of California, Davis 19,979 6 19,242 6 19,319 5 18,421 6 18,205 6 18,205 6
Colorado State University 18,735 7 17,675 7 17,695 7 17,350 7 16,698 7 16,722 7
Washington State University 16,095 8 15,403 8 15,489 8 15,286 8 15,357 8 15,721 8
Oregon State University 14,943 9 14,789 9 13,800 9 14,295 9 14,376 9 14,784 9
New Mexico State University 11,742 10 11,919 10 11,878 10 11,538 10 11,282 10 11,271 10
UTAH STATE UNIVERSITY 10,399 11 9,979 11 9,719 11 9,649 11 9,147 11 9,262 11
COMPARISON GROUP AVERAGE 21,543 21,138 21,154 20,904 20,665 20,707
PERCENT OF COMP GROUP AVE:
Utah State University 48.27% 47.21% 45.94% 46.16% 44.26% 44.73%

INDCTRS FINANCIAL COMPARISON INDICATORS 30-Jul-92
Indicator: FALL FTE ENROLLMENT, 1984-85 TO 1988-89 Comparison Group: COMPREHENSIVE INSTITUTIONS
1989-90
Amount Rank
1988-89
Amount Rank
1987-88
Amount Rank
1986-87
Amount Rank
1985-86
Amount Rank
1984-85
Amount Rank
Univ of Nevada, Las Vegas 10,394 1 9,303 1 8,565 3 7,950 3 7,521 4 7,006 4
WEBER STATE UNIVERSITY 9,424 2 8,957 3 8,706 2 8,299 2 8,029 2 7,685 3
Univ of Wisconsin, Oshkosh 9,274 3 9,274 2 9,339 1 9,375 1 9,242 1 9,058 1
Boise State University 8,998 4 7,717 4 8,096 4 7,717 4 7,667 3 8,109 2
Eastern Washington University 7,062 5 6,967 5 6,889 5 6,967 5 7,422 5 7,422 5
SUNY College at Brockport 6,995 6 6,701 6 6,072 6 5,826 6 5,715 6 5,795 6
Calif St Univ, Dominguez Hills 5,437 7 4,949 7 4,975 7 4,764 7 5,555 7 5,555 7
Austin Peay State University 4,629 8 3,993 9 2,857 10 3,886 8 3,947 8 4,161 9
Southern Oregon State College 4,077 9 4,120 8 3,960 8 3,595 9 3,678 9 3,631 10
Univ of Southern Colorado 3,686 10 3,503 10 3,450 9 3,257 10 3,653 10 4,197 8
Indiana University Northwest 3,061 11 3,009 11 2,841 11 2,769 11 2,745 11 2,813 11
SOUTHERN UTAH UNIVERSITY 2,936 12 2,689 12 2,644 12 2,522 12 2,280 12 2,265 12
COMPARISON GROUP AVERAGE 6,361 5,954 5,704 5,611 5,715 5,775
PERCENT OF COMP GROUP AVE:
Weber State University 148.15% 150.44% 152.63% 147.91% 140.49% 133.07%
Southern Utah University 46.16% 45.16% 46.35% 44.95% 39.90% 39.22%
Indicator: FALL FTE ENROLLMENT, 1984-85 TO 1988-89
1989-90 1988-89
Amount Rank Amount Rank
1987-88
Amount Rank
Comparison Group:
1986-87
Amount Rank
COMMUNITY COLLEGES
1985-86 1984-85
Amount Rank Amount Rank
Grand Rapids Junior College 6,659 1 6,277 1 6,190 1 6,005 1 5,693 1 5,472 1
SALT LAKE COMMUNITY COLLEGE 6,546 2 5,502 3 5,551 2 5,437 2 5,162 2 5,068 2
Anne Arundel COM College 6,077 3 5,842 2 5,225 3 4,943 3 4,544 6 4,415 7
UTAH VALLEY COMMUNITY COLLEGE 5,590 4 4,966 6 5,043 4 4,544 6 4,697 5 4,584 6
Joliet Junior College 5,182 5 5,069 5 4.991 5 4,793 4 5,161 3 5,042 3
Chemeketa Community College 5,137 6 5,181 4 4,325 8 4,276 8 4,420 8 4,395 8
Onandaga Community College 4,987 7 4,634 8 4,626 6 4,534 7 4,527 7 4,685 5
Spokane Community College 4,860 8 4,705 7 4,617 7 4,595 5 4,785 4 4,938 4
Yavapai College 2,646 9 2,638 9 2,404 9 2,159 9 2,172 9 2,181 9
North Idaho College 1,977 10 1,951 10 1,937 10 1,778 11 1,710 10 1,766 10
DIXIE COLLEGE 1,928 11 1,799 11 1,804 11 1,811 10 1,705 11 1,556 11
Danville Community College 1,700 12 1.521 12 1,307 12 1,146 14 1,138 12 1,235 12
SNOW COLLEGE 1,540 13 1,355 14 1,241 14 1,295 12 1,143 13 1,168 13
COLLEGE OF EASTERN UTAH 1,525 14 1,441 13 1,303 13 1,241 13 1,114 14 892 14
Western Wyoming Comm College 1,060 15 891 15 890 15 779 15 873 15 839 15
COMPARISON GROUP AVERAGE 4,029 3,871 3,651 3,501 3,502 3,497
PERCENT OF COMP GROUP AVE:
Salt Lake Comm College 162.47% 142.13% 152.04% 155.30% 147.40% 144.92%
Utah Valley Comm College
Dixie College
138.74%
47.85%
128.29%
46.47%
138.13%
49.41%
129.79%
51.73%
134.12%
48.69%
131.08%
44.50%
Snow College 38.22% 35.00% 33.99% 36.99% 32.64% 33.40%
College of Eastern Utah 37.85% 37.23% 35.69% 35.45% 31.81% 25.51%
II
!I(.4
I
I
I
I
111
I
I
I
354

INDCTRS FINANCIAL COMPARISON INDICATORS 30-Jul-92
Indicator: TAX FUNDS APPROPRIATIONS PER FTE Comparison Group: UNIVERSITY OF UTAH
1989-90
Amount Rank
1988-89
Amount Rank
1987-88
Amount Rank
1986-87
Amount Rank
1985-86
Amount Rank
1984-85
Amount Rank
Univ California, Los Angeles $13,372 1 $13,290 1 $12,473 1 $12,128 1 $11,455 1 $10,493 1
University of Florida $12,865 2 $12,120 2 $10,842 3 $9,700 3 $8,544 3 $8,157 3
Univ North Carolina (Ch Hill) $12,132 3 $11,512 3 $11,421 2 $10,618 2 $10,140 2 $9,453 2
University of Washington $8,346 4 $8,048 4 $6,760 5 $6,198 5 $5,941 8 $5,626 8
University of Arizona $7,685 5 $8,001 5 $7,774 4 $7,527 4 $7,350 5 $6,639 5
Univ of Virginia, Main Campus $7,129 6 $6,875 6 $6,360 6 $5,922 6 $7,706 4 $7,082 4
University of Iowa $6,755 7 $6,324 8 $5,736 8 $5,493 8 $6,437 6 $6,524 6
UNIVERSITY OF UTAH $6,638 8 $6,458 7 $6,094 7 $5,819 7 $6,064 7 $5,701 7
Purdue University, Main Campus $5,840 9 $5,628 9 $5,467 9 $5,255 10 $4,865 10 $4,498 10
Univ Cincinnati, Main Campus $5,835 10 $5,334 10 $5,010 10 $5,273 9 $5,686 9 $5,441 9
Univ of Colorado, Boulder $2,640 11 $2,399 11 $2,458 11 $2,315 11 $2,213 11 $2,161 11
COMPARISON GROUP AVERAGE $8,260 $7,953 $7,430 $7,043 $7,034 $6,608
PERCENT OF COMP GROUP AVE:
University of Utah 80.36% 81.20% 82.02% 82.62% 86.21% 86.27%
Indicator: TAX FUNDS APPROPRIATIONS PER FTE
1989-90
Amount Rank
1988-89
Amount Rank
1987-88
Amount Rank
Comparison Group:
1986-87
Amount Rank
UTAH STATE UNIVERSITY
1985-86 1984-85
Amount Rank Amount Rank
Univ of California, Davis $15,165 1 $14,912 1 $14,274 1 $14,267 1 $13,621 1 $12,334 1
North Carolina State Univ $11,078 2 $10,767 2 $10,638 2 $9,592 2 $9,113 2 $8,293 2
Washington State University $8,497 3 $8,191 3 $7,639 4 $7,174 3 $6,848 4 $6,565 4
Texas A & M University $8,489 4 $7,532 6 $7,777 3 $6,889 4 $8,109 3 $7,933 3
Virginia Tech University $8,061 5 $7,794 5 $7,159 5 $6,828 5 $6,283 6 $5,943 5
Univ of Maryland, College Pk $7,581 6 $7,812 4 $6,424 7 $5,739 8 $5,213 10 $4,735 9
Iowa State University $7,478 7 $6,855 7 $6,196 9 $5,607 9 $5,278 9 $5,276 7
Oregon State University $6,949 8 $6,360 9 $6,528 6 $5,925 7 $5,288 8 $4,633 10
UTAH STATE UNIVERSITY $6,295 9 $6,371 8 $6,372 8 $6,132 6 $6,423 5 $5,924 6
New Mexico State University $5,921 10 $5,354 10 $5,046 10 $5,088 10 $5,303 7 $5,045 8
Colorado State University $4,471 11 $4,216 11 $3,917 11 $3,668 11 $3,590 11 $3,457 11
COMPARISON GROUP AVERAGE $8,369 $7,979 $7,560 $7,078 $6,865 $6,421
PERCENT OF COMP GROUP AVE:
Utah State University 75.22% 79.85% 84.29% 86.63% 93.56% 92.26%

INDCTRS FINANCIAL COMPARISON INDICATORS 30-Jul-92
Indicator: TAX FUNDS APPROPRIATIONS PER FTE Comparison Group: COMPREHENSIVE INSTITUTIONS
1989-90
Amount Rank
1988-89
Amount Rank
1987-88
Amount Rank
1986-87
Amount Rank
1985-86
Amount Rank
1984-85
Amount Rank
Calif St Univ, Dominguez Hills $7,R17 1 $9,439 1 $7,153 1 $8,256 1 $6,706 1 $6,050 2
SUNY College at Brockport $5,869 2 $5,997 2 $6,543 2 $6,530 2 $6,526 2 $6,271 1
Eastern Washington University $4,874 3 $4,824 3 $4,620 4 $4,370 3 $3,874 4 $3,990 3
Univ of Nevada, Las Vegas $4,562 4 $4,004 6 $4,050 5 $3,925 5 $3,802 5 $3,495 6
Boise State University $4,124 5 $4,300 '1 $3,952 6 $3,714 6 $3,505 8 $3,099 8
Indiana University Northwest $3,930 6 $3,746 7 $3,567 8 $3,605 7 $3,546 7 $3,221 7
Austin Peay State University $3,757 7 $4,229 5 $5,744 3 $4,093 4 $3,491 9 $2,963 9
SOUTHERN UTAH UNIVERSITY $3,743 8 $3,638 8 $3,558 9 $3,554 8 $3,964 3 $3,756 4
Southern Oregon State College $3,565 9 $3,165 12 $3,102 12 $3,123 11 $2,935 11 $2,554 11
Univ of Wisconsin, Oshkosh $3,529 10 $3,319 11 $3,283 11 $3,019 12 $3,116 10 $2,912 10
WEBER STATE UNIVERSITY $3,524 11 $3,579 9 $3,605 7 $3,496 9 $3,661 6 $3,608 5
Univ of Southern Colorado $3,257 12 $3,370 10 $3,434 10 $3,236 10 $2,863 12 $2,344 12
COMPARISON GROUP AVERAGE $4,528 $4,639 $4,545 $4,387 $4,036 $3,690
PERCENT OF COMP GROUP AVE:
Southern Utah University 82.66% 78.42% 78.28% 81.01% 98.22% 101.79%
Weber State University 77.83% 77.15% 79.32% 79.69% 90.71% 97.78%
Indicator: TAX FUNDS APPROPRIATIONS PER FTE
1989-90
Amount Rank
1988-89
Amount Rank
1987-88
Amount Rank
Comparison Group:
1986-87
Amount Rank
COMMUNITY COLLEGES
1985-86 1984-85
Amount Rank Amount Rank
Western Wyoming Comm College $6,595 1 $6,587 1 $6,902 1 $8,122 1 $7,495 1 $7,080 1
North Idaho College $4,589 2 $4,219 2 $4,102 4 $4,143 3 $4,066 3 $3,717 5
Chemeketa Community College $4,318 3 $4,007 4 $4,663 2 $4,455 2 $3,904 5 $3,796 4
Yavapai College $4,189 4 $3,783 5 $3,503 6 $3,495 7 $3,235 7 $3,147 7
SNOW COLLEGE $3,911 5 $4,034 3 $4,287 3 $3,919 4 $4,417 2 $4,229 3
COLLEGE OF EASTERN UTAH $3,805 6 $3,621 6 $3,658 5 $3,643 6 $3,944 4 $4,321 2
Danville Community College $3,286 7 $3,195 10 $3,496 7 $3,754 5 $3,581 6 $3,206 6
Onandaga Community College $3,271 8 $3,454 7 $3,212 8 $3,072 8 $3,011 9 $2,728 11
DIXIE COLLEGE $3,219 9 $3,271 9 $3,127 9 $2,973 10 $2,971 10 $2,984 8
Grand Rapids Junior College $3,065 10 $2,705 13 $2,715 13 $2,373 15 $2,265 14 $2,136 15
Anne Arundel Comm College $2,950 11 $2,838 12 $2,940 11 $2,972 11 $3,093 8 $2,772 9
Joliet Junior College $2,901 12 $2,686 14 $2,522 14 $2,811 12 $2,159 15 $2,461 13
SALT LAKE COMMUNITY COLLEGE $2,785 13 $2,976 11 $2,816 12 $2,706 13 $2,731 12 $2,665 12
UTAH VALLEY COMMUNITY COLLEGE $2,370 14 $2,448 15 $2,291 15 $2,471 14 $2,370 13 $2,217 14
Spokane Community College 15 $3,327 8 $3,107 10 $3,071 9 $2,916 11 $2,761 10
COMPARISON GROUP AVERAGE $3,907 $3,680 $3,716 $3,827 $3,572 $3,380PERCENT OF COMP GROUP AVE:
Snow College 100.10% 109.62% 115.37% 102.40% 123.66% 125.12%
College of Eastern Utah 97.39% 98.40% 98.44% 95.19% 110.41% 127.84%
Dixie College 82.39% 88.89% 84.15% 77.68% 83.17% 88.28%
Salt Lake Community College 71.28% 80.87% 75.78% 70.71% 76.46% 78.85%
Utah Valley Community Colleg 60.66% 66.52% 61.65% 64.57% 66.35% 65.59%
30 0
10

INDCTR: FINANCIAL COMPARISON INDICATORS 30-Jul-92
Indicator: TAX APPROPRIATIONS % OF EDUCATION & GENERAL REVENUES Comparison Group: UNIVERSITY OF UTAH
1989-90
Amount Rank
1988-89
Amount Rank
1987-88
Amount Rank
1986-87
Amount Rank
1985-86
Amount Rank
1984-85
Amount Rank
University of Florida 57.45% I 56.61% 1 57.65% 1 58.34% 1 57.51% 1 59.35% 1
University of Arizona 44.91% 2 47.51% 2 48.95% 2 49.81% 2 51.35% 2 51.97% 3
Univ North Carolina (Ch Hill) 44.44% 3 45.08% 3 46.71% 3 47.77% 3 46.27% 4 46.73% 4
Univ California, Los Angeles 42.49% 4 44.26% 4 46.41% 4 46.92% 4 44.27% 5 45.18% 6
Purdue University, Main Campus 41.40% 5 41.73% 5 40.82% 6 41.18% 6 40.00% 9 40.61% 9
University of Iowa 38.74% 6 39.45% 6 41.10% 5 43.82% 5 49.42% 3 52.57% 2
Univ Civ.innati, Main Campus 37.49% 7 38.27% 7 38.80% 7 40.07% 7 42.25% 7 41.84% 7
Univ of Virginia, Main Campus 35.16% 8 36.93% 8 37.85% 8 39.40% 8 45.40% 6 46.13% 5
UNIVERSITY OF UTAH 34.33% 9 35.19% 9 36.91% 9 37.62% 9 40.28% 8 41.18% 8
University of Washington 31.65% 10 32.90% 10 31.24% 10 30.25% 10 31.55% 10 33.41% 10
Univ of Colorado, Boulder 20.31% 11 19.48% 11 21.29% 11 21.85% 11 22.91% 11 23.95% 11
COMPARISON GROUP AVERAGE 40.29% 41.28% 42.15% 42.84% 43.67% 44.75%
PERCENT OF COMP GROUP AVE:
University of Utah 85.21% 85.25% 87.57% 87.81%/ 92.24% 92.02%
Indicator: TAX APPROPRIATIONS % OF EDUCATION & GENERAL REVENUES
1989-90 1988-89
Amount Rank Amount Rank
1987-88
Amount Rank
Comparison Group:
1986-87
Amount Rank
UTAH STATE UNIVERSITY
1985-86 1984-85
Amount Rank Amount Rank
North Carolina State Univ 59.53% 1 59.30% 1 60.55% 1 60.76% I 60.33% I 60.05% I
Univ of California, Davis 53.26% 2 55.46% 2 57.42% 2 59.76% 2 57.45% 2 58.36% 2
Texas A & M University 52.65% 3 50.75% 5 55.80% 3 45.74% 7 49.79% 6 53.81% 4
Washington State University 50.92% 4 51.75% 3 55.22% 4 54.52% 3 54.55% 3 55.97% 3
Univ of Mary' id, College Pk 50.57% 5 51.66% 4 49.83% 5 49.16% 5 48.67% 7 49.06% 7
Iowa State University 48.79% 6 47.88% 7 49.65% 7 46.17% 6 51.34% 4 53.00% 5
Virginia Tech University 47.25% 7 49.60% 6 49.71% 6 50.64% 4 49.80% 5 51.07% 6
Oregon State University 41.25% 8 41.01% 8 40.87% 9 40.96% 9 38.64% 10 36.49% 10
New Mexico State University 39.17% 9 40.17% 9 39.45% 10 39.82% 10 41.82% 9 43.42% 9
UTAH STATE UNIVERSITY 35.64% 10 39.23% 10 42.76% 8 44.65% 8 46.14% 8 47.89% 8
Colorado State University 31.54% 11 30.65% 11 31.78% II 31.43% 11 32.50% 11 33.08% 11
COMPARISON GROUP AVERAGE 48.26% 48.81% 50.05% 49.12% 49.51% 50.39%
PERCENT OF COMP GROUP AVE:
Utah State University 73.85% 80.37% 85.44% 90.90% 93.19% 95.04%
11

INDCTRS FINANCIAL COMPARISON INDICATORS 30-Jul-92
Indicator: TAX APPROPRIATIONS % OF EDUCATION & GENERAL REVENUES Comparison Group: COMPREHENSIVE INSTITUTIONS
1989-90
Amount Rank
1988-89
Amount Rank
1987-88
Amount Rank
1986-87
Amount Rank
1985-86
Amount Rank
1984-85
Amount Rank
Calif St Univ, Dominguez Hills 75.78% 1 79.37% 1 79.50% 1 77.63% 1 74.68% 1 72.78% 1
SUNY College at Brockport 65.39% 2 66.87% 2 68.84% 2 68.50% 2 71.31% 2 69.76% 2
Indiana University Northwest 57.03% 3 55.15% 6 56.52% 8 5',40% 6 59.74% 7 63.51% 4
Austin Peay State University 56.63% 4 58.90% 3 62.47% 4 63.78% 3 63.94% 3 61.52% 6
Boise State University 56.50% 5 56.97% 5 62.70% 3 61.69% 4 57.67% 8 59.14% 7
Eastern Washington University 54.55% 6 57.09% 4 58.25% 7 60.23% 5 60.40% 6 64.68% 3
Univ of Wisconsin, Oshkosh 54.06% 7 54.63% 8 58.63% 5 58.84% 7 60.86% 4 57.59% 9
WEBER STATE UNIVERSITY 53.18% 8 55.10% 7 58.58% 6 57.76% 8 60.78% 5 62.45% 5
Southern Oregon State College 50.86% 9 48.79% 10 49.73% 10 49.50% 10 49.89% 11 48.06% 11
Univ of Nevada, Las Vegas 49.86% 10 46.85% 11 49.13% 11 48.82% 11 51.07% 10 49.62% 10
SOUTHERN UTAH UNIVERSITY 47.75% 11 50.07% 9 52.96% 9 53.95% 9 57.11% 9 58.17% 8
Univ of Southern Colorado 42.65% 12 44.69% 12 47.10% 12 43.93% 12 44.22% 12 42.73% 12
COMPARISON GROUP AVERAGE 57.04% 58.37% 60.10% 60.28% 60.29% 60.00%
PERCENT OF COMP GROUP AVE:
Weber State University 93.23% 94.40% 97.47% 95.82% 100.81% 104.08%
Southern Utah University 83.71% 85.78% 88.12% 89.50% 94.73% 96.95%
Indicator: TAX APPROPRIATIONS % OF EDUCATION & GENERAL REVENUES
1989-90 1988-89
Amount Rank Amount Rank
1987-88
Amount Rank
Comparison Group:
1986-87
Amount Rank
COMMUNITY COLLEGES
1985-86 1984-85
Amount Rank Amount Rank
Western Wyoming Comm College 75.94% 1 76.25% 1 79.80% 1 75.76% 1 68.95% 4 78.00% 1
Danville Community College 68.79% 2 65.97% 4 70.58% 3 72.49% 2 70.33% 2 69.15% 6
Yavapai College 68.19% 3 69.58% 2 70.75% 2 68.72% 4 69.39% 3 70.58% 3
Anne Arundel Comm College 65.86% 4 67.30% 3 69.23% 4 70.96% 3 71.46% 1 69.91% 4
Chemeketa Community College 63.77% 5 63.68% 5 68.64% 5 67.61% 5 67.28% 5 69.55% 5
North Idaho College 62.44% 6 60.38% 7 62.89% 6 62.75% 7 58.83% 10 60.55% 10
Joliet Junior College 61.36% 7 57.44% 8 57.42% 10 65.91% 6 57.73% 12 61.46% 9
COLLEGE OF EASTERN UTAH 55.50% 8 57.16% 9 57.66% 9 55.49% 13 54.99% 14 56.15% 14
SNOw COLLEGE 54.68% 9 55.65% 10 58.12% 8 60.29% 10 64.47% 7 65.11% 7
Grand Rapids Junior College* 53.84% 10 47.91% 15 26.55% 15 47.68% 15 47.99% 15 44.94% 15
DIXIE COLLEGE 52.19% 11 55.14% 11 56.46% 11 61.71% 9 62.39% 8 63.65% 8
Onondaga Community College 50.16% 12 53.07% 12 53.71% 12 56.20% 12 59.68% 9 57.82% 12
SALT LAKE COMMUNITY COLLEGE 48.30% 13 50.21% 13 53.14% 13 56.62% 11 58.07% 11 59.47% 11
UTAH VALLEY COMMUNITY COLLEGE 46.81% 14 49.16% 14 51.88% 14 54.96% 14 56.60% 13 56.33% 13
Spokane Community College 15 60.49% 6 59.67% 7 62.32% 8 65.05% 6 72.30% 2
"College has 7 times ave "Other Funds," in 87-88
COMPARISON GROUP AVERAGE 63.75% 62.64% 60.01% 65.98% 64.18% 66.24%PERCENT OF COMP GROUP AVE:
College of Eastern Utah 87.05% 91.25% 96.08% 84.10% 85.68% 84.77%Snow College 85.77% 88.84% 96.85% 91.38% 100.45% 98.29%
Dixie College 81.86% 88.03% 94.08% 93.53% 97.21% 96.09%Salt Lake Community College 75.76% 80.16% 88.55% 85.81% 90.48% 89.78%Utah Valley Community Colleg 73.42% 78.48% 86.45% 83.30% 88.19% 85.04%
12
3D0

1
1
1
1
INDCTRS FINANCIAL COMPARISON INDICATORS 30-Jul-92
Indicator: TUITION AND FEES PER FTE Comparison Group: UNIVERSITY OF UTAH
1989-90
Amount Rank
1988-89
Amount Rank
1987-88
Amount Rank
1986-87
Amount Rank
1985-86
Amount Rank
1984-85
Amount Rank
Univ of Colorado, Boulder $4,737 1 $4,519 1 $4,239 1 $3,900 $3,436 1 $3,119 1
Univ of Virginia, Main Campus $4,374 2 $4,024 2 $3,695 2 $3,464 2 $3,378 2 $2,980 2
Univ Cincinnati, Main Campus $3,687 3 $3,310 4 $2,984 5 $2,953 4 $2,740 5 $2,657 3
University of Washington $3,670 4 $3,549 3 $3,538 3 43,384 3 $2,740 5 $2,242 6
Univ California, Los Angeles $3,345 5 $3,115 5 $2,794 6 $2,632 6 $2,787 3 $2,654 4
Purdue University, Main Campus $3,319 6 $3,095 6 $3,111 4 $2,941 5 $2,744 4 $2,442 5
University of Arizona $3,068 7 $2,787 8 $2,568 7 $2,393 7 $2,056 7 $1,795 8
University of Iowa $3,055 8 $2,858 7 $2,476 8 $2,100 8 $1,959 8 $1,812 7
Univ North Carolina (Ch Hill) $2,245 9 $1,938 10 $1,846 10 $1,792 10 $1,556 10 $1,441 10
UNIVERSITY OF UTAH $2,209 10 $2,046 9 $1,905 9 $1,865 9 $1,683 9 $1,465 9
University of Florida $1,805 11 $1,584 11 $1,513 11 $1,314 11 $1,150 11 $1,029 11
COMPARISON GROUP AVERAGE $3,331 $3,078 $2,876 $2,687 $2,455 $2,217
PERCENT OF COMP GROUP AVE:
University of Utah 66.32% 66.47% 66.24% 69.41% 68.55% 66.08%
Indicator: TUITION AND FEES PER FTE
1989-90
Amount Rank
1988-89
Amount Rank
1987-88
Amount Rank
Comparison Group:
1986-87
Amount Rank
UTAH STATE UNIVERSITY
1985-86 1984-85
Amount Rank Amount Rank
Colorado State University $3,844 1 $3,528 1 $3,154 1 $2,880 1 $2,673 1 $2,569 1
Virginia Tech University $3,517 2 $3,226 2 $3,146 2 $2,865 2 $2,620 2 $2,395 2
Univ of Maryland. College Pk $3,262 3 $3,035 3 $2,772 3 $2,520 3 $2,302 3 $2,189 3
Iowa State University $2,941 4 $2,660 4 $2,381 4 $2,171 4 $1,559 8 $1,613 6
Washington State University $2,646 5 $2,637 5 $1,740 8 $1,656 8 $1,599 7 $1,353 8
Univ of California, Davis $2,541 6 $2,428 6 $2,173 5 $1,962 5 $2,071 4 $1,975 4
Texas A 8, M University $2,528 7 $2,301 7 $2,099 6 $1,785 7 $1,999 5 $1,236 9
Oregon State University $2,270 8 $2,048 8 $2,003 7 $1,922 6 $1,940 6 $1,834 5
UTAH STATE UNIVERSITY $1,973 9 $1,814 9 $1,652 9 $1,613 9 $1,511 9 $1,411 7
North Carolina State Univ $1,752 10 $1,586 10 $1,536 10 $1,412 10 $1,341 10 $1,231 10
New Mexico State University $1,473 11 $1,400 11 $1,406 11 $1,259 11 $1,131 11 $1,027 11
COMPARISON GROUP AVERAGE $2,677 $2,485 $2,241 $2,043 $1,924 $1,742
PERCENT OF COMP GROUP AVE:
Utah State University 73.70% 73.00% 73.72% 78.95% 78.53% 81.00%
3 59

INDCTRS FINANCIAL COMPARISON INDICATORS 30-Jul-92
Indicator: TUITION AND FEES PER FTE Comparison Group: COMPREHENSIVE INSTITUTIONS
1989-90
Amount Rank
1988-89
Amount Rank
1987-88
Amount Rank
1986-87
Amount Rank
1985-86
Amount Rank
1984-85
Amount Rank
Eastern Washington University $2,292 1 $2,040 1 $1,956 2 $1,607 4 $1,477 4 $1,255 6
Univ of Southern Colorado $2,107 2 $1,888 3 $1,833 3 $1,905 1 $1,739 1 $1,643 1
Calif St Univ, Dominguez Hills $1,954 3 $1,809 5 $1,368 8 $1,353 8 $1,430 5 $1,323 4
Indiana University Northwest $1,931 4 $1,896 2 $1,822 4 $1,499 5 $1,355 7 $1,158 7
Southern Oregon State College $1,866 5 $1,833 4 $1,701 5 $1,687 2 $1,559 3 $1,484 3
Univ of Wisconsin, Oshkosh $1,719 6 $1,621 7 $1,498 7 $1,385 7 $1,244 8 $1,147 8
Austin Peay State University $1,674 7 $1,664 6 $2,095 1 $1,413 6 $1,146 11 $1,036 11
SUNY College at Brockport $1,588 8 $1,589 8 $1,585 6 $1,608 3 $1,570 2 $1,561 2
Univ of Nevada, Las Vegas $1,562 9 $1,491 9 $1,339 9 $1,314 9 $1,423 6 $1,266 5
WEBER STATE UNIVERSITY $1,543 10 $1,452 11 $1,334 10 $1,286 10 $1,161 10 $1,137 9
Boise State University $1,462 11 $1,463 10 $1,275 11 $1,228 11 $1,198 9 $1,051 10
SOUTHERN UTAH UNIVERSITY $1,385 12 $1,249 12 $1,129 12 $1,097 12 $972 12 $935 12
COMPARISON GROUP AVERAGE $1,816 $1,729 $1,647 $1,500 $1,414 $1,292
PERCENT OF COMP GROUP AVE:
Weber State University 84.97% 83.98% 81.00% 85.73% 82.11% 88.00%Southern Utah University 76.27% 72.24% 68.55% 73.13% 68.74% 72.37%
Indicator: TUITION AND FEES PER FTE
1989-90
Amount Rank
1988-89
Amount Rank
1987-88
Amount Rank
Comparison Group:
1986-87
Amount Rank
COMMUNITY COLLEGES
1985-86 1984-85
Amount Rank Amount Rank
Onandaga Community College $1,812 1 $1,762 2 $1,625 2 $1,485 2 $1,411 2 $1,401 2
Grand Rapids Junior College $1,735 2 $1,892 1 $1,827 1 $1,531 1 $1,531 1 $1,580 1
SALT LAKE COMMUNITY COLLEGE $1,517 3 $1,457 3 $1,311 3 $1,136 4 $1,057 4 $909 5
UTAH VALLEY COMMUNITY COLLEGE $1,374 4 $1,267 5 $1,056 5 $1,060 5 $852 7 $762 8
DIXIE COLLEGE $1,365 5 $1,205 6 $1,053 6 $822 8 $754 10 $673 11
Anne Arundel Comm College $1,247 6 $1,102 7 $1,043 7 $980 6 $904 6 $943 4
SNOW COLLEGE $1,165 7 $1,003 9 $945 8 $785 13 $791 9 $681 10
Yavapai College $1,143 8 $907 12 $849 11 $794 11 $696 13 $671 12
North Idaho College $1,132 9 $1,403 4 $1,220 4 $1,184 3 $1,120 3 $955 3
Joliet Junior College $1,061 10 $1,017 8 $913 9 $818 9 $723 11 $748 9
Chemeketa Community College $943 11 $814 13 $844 12 $815 lu $709 12 $657 13
Western Wyoming Comm College $932 12 $943 11 $666 15 $693 14 $564 14 $521 14
Danville Community College $875 13 $992 10 $906 10 $902 7 $916 5 $817 7
COLLEGE OF EASTERN UTAH $804 14 $726 14 $742 13 $786 12 $799 8 $881 6
Spokane Community College 15 $632 15 $727 14 $673 15 $554 15 $449 15
COMPARISON GROUP AVERAGE $1,209 $1.146 $1,062 $987 $913 $874PERCENT OF COMP GROUP AVE:
Salt Lake Community College 125.48% 127.14% 123.45% 115.10% 115.77% 104.00%Utah Valley Community Colleg 113.65% 110.56% 99.44% 107.40% 93.32% 87.19%Dixie College 112.90% 105.15% 99.15% 83.28% 82.58% 77.00%Snow College 96.36% 87.52% 88.98% 79.53% 86.64% 77.92%College of Eastern Utah 66.50% 63.35% 69.87% 79.64% 87.51% 100.80%
14 3Gf)
1

INDCTRS FINANCIAL COMPARISON INDICATORS 30-Jul-92
Indicator: TUITION AND FEES % OF INSTRUCTION DIRECT EXPENDITURES Comparison Group: UNIVERSITY OF UTAH
1989-90
Amount Rank
1988-89
Amount Rank
1987-88
Amount Rank
1986-87
Amount Rank
1985-86
Amount Rank
1984-85
Amount Rank
Univ of Colorado, Boulder 105.06% 1 103.60% 1 106.32% 1 104.03% 1 97.98% 1 96.89% 1
Univ Cincinnati, Main Campus 58.97% 2 58.04% 4 57.50% 3 53.39% 4 53.62% 4 59.53% 2
Purdue University, Main Campus 57.92% 3 58.52% 2 58.19% 2 55.74% 3 56.67% 3 55.60% 4
Univ of Virginia, Main Campus 57.42% 4 58.24% 3 56.65% 4 58.81% 2 59.97% 2 58.63% 3
University of Arizona 54.42% 5 51.14% 5 48.27% 5 46.58% 5 41.10% 6 37.85% 7
University of Iowa 45.54% 6 47.29% 6 43.21% 6 40.86% 7 39.83% 7 38.38% 5
UNIVERSITY OF UTAH 38.59% 7 37.02% 8 36.18% 8 36.36% 8 32.75% 8 31.25% 9
University of Washington 38.19% 8 38.22% 7 43.20% 7 44.33% 6 43.75% 5 37.94% 6
Univ California, Los Angeles 26.00% 9 26.54% 10 26.37% 9 26.05% 9 29.10% 9 31.84% 8
University of Florida 24.93% 10 28.17% 9 23.92% 10 23.74% 10 20.35% 10 19.02% 10
Univ North Carolina (Ch Hill) 20.22% 11 19.30% 11 19.24% 11 19.33% 11 17.76% 11 17.44% 11
COMPARISON GROUP AVERAGE 43.10% 43.69% 43.05% 42.47% 41.42% 40.65%
PERCENT OF COMP GROUP AVE:
University of Utah 89.55% 84.73% 84.03% 85.61% 79.07% 76.88%
Indicator: TUITION AND FEES % OF INSTRUCTION DIRECT EXPENDITURES
1989-90 1988-89 1987-88
Amount Rank Amount Rank Amount Rank
Comparison Group:
1986-87
Amount Rank
UTAH STATE UNIVERSITY
1985-86 1984-85
Amount Rank Amount Rank
Colorado State University 78.64% 1 76.40% 1 75.76% 1 71.55% 1 66.18% 2 68.40% 1
Univ of Maryland, College Pk 63.60% 2 67.72% 2 69.30% 2 67.45% 2 67.69% 1 66.09% 2
Iowa State University 62.11% 3 64.47% 3 63.73% 3 61.17% 4 45.81% 6 47.40% 5
Virginia Tech University 61.08% 4 60.62% 4 62.84% 4 61.30% 3 60.78% 3 59.92% 3
Oregon State University 54.41% 5 50.54% 6 48.49% 6 48.76% 5 53.70% 4 55.39% 4
Washington State University 52.75% 6 52.80% 5 38.70% 9 38.54% 9 39.36% 7 35.37% 8
Texas A & M University 52.42% 7 43.49% 8 49.76% 5 43.34% 6 47.83% 5 31.22% 9
UTAH STATE UNIVERSITY 44.84% 8 42.08% 9 39.06% 8 39.40% 8 36.38% 9 38.50% 6
New Mexico State University 43.61% 9 43.71% 7 47.20% 7 43.19% 7 38.42% 8 38.38% 7
North Carolina State Univ 28.14% 10 26.50% 10 26.06% 10 26.55% 10 26.76% 10 26.99% 10
Univ of California, Davis 24.43% 11 25.41% 11 24.53% 11 22.64% 11 25.61% 11 26.93% 11
COMPARISON GROUP AVERAGE 49.09% 48.13% 47.20% 45.16% 44.69% 43.41%
PERCENT OF COMP GROUP AVE:
Utah State University 91.34% 87.43% 82.76% 87.25% 81.41% 88.59%
3611 5

INDCTRS FINANCIAL COMPARISON INDICATORS 30-Jul-92
Indicator: TUITION AND FEES % OF INSTRUCTION DIRECT EXPENDITURES Comparison Group: COMPREHENSIVE INSTITUTIONS
1989-90
Amount Rank
1988-89
Amount Rank
1987-88
Amount Rank
1986-87
Amount Rank
1985-86
Amount Rank
1984-85
Amount Rank
Univ of Southern Colorado 85.824 1 71.35% 1 73.38% 1 79.54% 1 83.37% 1 84.21% 1
Indiana University Northwest 66.96% 2 61.88% 3 62.91% 2 51.78% 4 49.40% 5 47.75% 4
Eastern Washington University 61.20% 3 58.72% 4 57.87% 4 50.61% 5 52.45% 4 46.31% 5
Southern Oregon State Colleae 58.68% 4 63.45% 2 60.11% 3 59.19% 2 62.06% 2 64.69% 2
Univ of Wisconsin, Oshkosh 55.34% 5 55.04% 6 48.76% 7 47.94% 6 45.27% 6 45.03% 6
SOUTHERN UTAH UNIVERSITY 55.22% 6 56.80% 5 53.00% 5 53.02% 3 41.97% 9 43.21% 9
Austin Peay State University 54.35% 7 48.97% 8 49.18% 6 46.13% 8 43.07% 8 44.18% 8
WEBER STATE UNIVERSITY 51.19% 8 48.30% 9 45.64% 9 42.72% 10 38.86% 11 40.32% 11
Boise State University 43.93% 9 41.60% 11 40.61% 11 40.28% 11 41.64% 10 42.59% 10
Univ of Nevada, Las Vegas 43.88% 10 49.93% 7 46.59% 8 47.40% 7 54.07% 3 51.01% 3
SUNY College at Brockport 41.03% 11 45.12% 10 41.86% 10 42.89% 9 44.10% 7 44.64% 7
Calif St Univ, Dominguez Hills 34.50% 12 33.74% 12 27.94% 12 29.12% 12 37.61% 12 36.83% 12
COMPARISON GROUP AVERAGE 52.16% 51.15% 48.97% 47.65% 49.72% 49.11%
PERCENT OF COMP GROUP AVE:
Southern Utah University 105.88% 111.04% 108.22% 111.27% 84.41% 87.99%
Weber State University 98.15% 94.42% 93.19% 89.65% 78.16% 82.10%
Indicator: TUITIION AND FEES % OF INSTRUCTION DIRECT EXPENDITURES
1989-90 1988-89 1987-88
Amount Rank Amount Rank Amount Rank
Comparison Group:
1986-87
Amount Rank
COMMUNITY COLLEGES
1985-86 1984-85
Amount Rank Amount Rank
UTAH VALLEY COMMUNITY COLLEGE 68.84% 1 65.41% 1 56.84% 3 55.32% 3 45.15% 3 42.55% 4
SALT LAKE COMMUNITY COLLEGE 63.66% 2 56.04% 4 54.67% 4 45.79% 4 43.97% 4 40.10% 6
Onandaga Community College 62.38% 3 61.20% 2 62.81% 1 68.18% 1 66.90% 1 70.72% 1
DIXIE COLLEGE 58.28% 4 55.66% 5 54.39% 5 45.09% 5 40.73% 5 36.34% 7
Yavapai College 53.69% 5 44.44% 8 38.66% 8 36.71% 8 37.62% 8 31.71% 11
Grand Rapids Junior College 53.01% 6 58.83% 3 61.81% 2 58.55% 2 62.24% 2 57.64% 2
SNOW COLLEGE 51.07% 7 43.23% 9 38.23% 9 34.284 10 28.72% 11 30.04% 12
Anne Arundel Comm College 50.55% 8 48.33% 6 44.55% 6 40.75% 6 40.18% 7 45.12% 3
Joliet Junior College 40.82% 9 40.91% 10 36.02% 10 35.70% 9 40.62% 6 40.63% 5
North Idaho College 38.71% 10 45.67% 7 41.08% 7 39.89% 7 35.10% 10 33.45% 9
Danville Community College 35.48% 11 38.04% 11 34.53% 11 33.71% 11 37.40% 9 33.51% 8
COLLEGE OF EASTERN UTAH 31.78% 12 36.43% 12 32.32% 12 33.66% 12 29.80% 12 32.78% 10
Chemeketa Community College 29.86% 13 27.84% 13 28.79% 14 25.34% 14 23.52% 14 23.17% 14
Western Wyoming Comm College 24.58% 14 25.65% 14 16.96% 15 14.84% 15 11.184 15 17.31% 15
Spokane Community College 15 24.02% 15 30.02% 13 29.06% 13 25.49% 13 23.26% 13
COMPARISON GROUP AVERAGE 43.10% 43.69% 38.63% 35.89% 35.03% 36.66%
PERCENT OF COMP GROUP AVE:
Utah Valley Community Colleg 159.74% 149.71% 147.13% 154.13% 128.89,< 116.07%
Salt Lake Community College 147.72% 128.27% 141.51% 127.58% 125.52% 109.38%
Dixie College 135.23% 127 40% 140.79% 125.63% 116.27% 99.13%
Snow College 118.50% 98.95% 98.96% 95.51% 81.99% 81.94%
College of Eastern Utah 73.74% 83.384 83.66% 93.78% 85.07% 89.42%
36216

INDCTRS
Indicator: ENDOWMENT REVENUE PER FTE
FINANCIAL COMPARISON INDICATORS 30-Jul-92
Comparison Group: UNIVERSITY OF UTAH
1989-90
Amount Rank
1988-89
Amount Rank
1987-88
Amount Rank
1986-87
Amount Rank
1985-86
Amount Rank
Univ of Virginia, Main Campus $1,060 1 $1,010 1 $759 1 $675 1 $685 1
Univ Cincinnati, Main Campus $478 2 $467 2 $481 2 $520 2 $491 2
UNIVERSITY OF UTAH $473 3 .:,345 3 $274 3 $264 3 $264 4
Univ North Carolina (Ch Hill) $354 4 $248 4 $223 4 $203 4 $200 5
University of Arizona $228 5 $168 6 $190 5 $124 7 $171 6
University of Washington $202 6 $175 5 $173 6 $171 5 $150 7
Purdue University, Main Campus $168 7 $139 7 $131 7 $146 6 $139 8
University of Iowa $21 8 $94 8 $94 8 $56 8 $60 9
Univ of Colorado, Boulder $16 9 $15 9 $11 9 $11 9 $11 10
University of Florida $1 10 $1 10 $1 10 $1 10 $0 11
Univ California. Los Angeles $O 11 $0 11 SO 11 $0 11 $371 3
COMPARISON GROUP AVERAGE $253 $232 $206 $191 $228
PERCENT OF COMP GROUP AVE:
University of Utah 186.96% 148.71% 133.01% 138.22% 115.79%
Indicator: ENDOWMENT REVENUE PER FTE
1989-90
Amount Rank
1988-89
Amount Rank
1987-88
Amount Rank
Comparison Group:
1986-87
Amount Rank
Oregon State University $278 1 $196 1 $168 2 $145 2
Univ of Maryland, College Pk $260 2 $35 7 $33 9 $25 9
Texas A & M University $179 3 $152 3 $132 3 $131 3
New Mexico State University $142 4 $158 2 $117 4 $114 4
Virginia Tech University $72 5 $18 8 $44 6 $35 7
UTAH STATE UNIVERSITY $56 6 $44 5 $36 8 $32 8
North Carolina State Univ $52 7 $44 5 $44 6 $41 6
Washington State University $26 8 $79 4 $67 5 $60 5
Iowa State University $3 9 $11 9 $10 10 $10 10
Colorado State University $0 10 $0 10 $360 1 $367 1
Univ of California, Davis $0 10 $0 10 $0 11 $0 11
COMPARISON GROUP AVERAGE $101 $69 $98 $93
PERCENT OF COMP GROUP AVE:
Utah State University 55.45% 63.77% 36.73% 34.41%
11363
1984-85
Amount Rank
$651 1
$449 2
$225 4
$182 5
$31 8
$130 6
$105 7
$25 9
$9 10
$0 11
$309 3
$189
119.05%
UTAH STATE UNIVERSITY
1985-86 1984-85
Amount Rank Amount Rank
$76 8 $96 4
$21 10 $26 10
$118 4 $74 5
$121 3 $114 3
$30 8
1333 ;$289
$$38 6 49 6
$34 7 $30 9
$3 11 $4 11
$224 2 $244 2
$346 1 $288 1
$101 $96
27.72% 34.38%
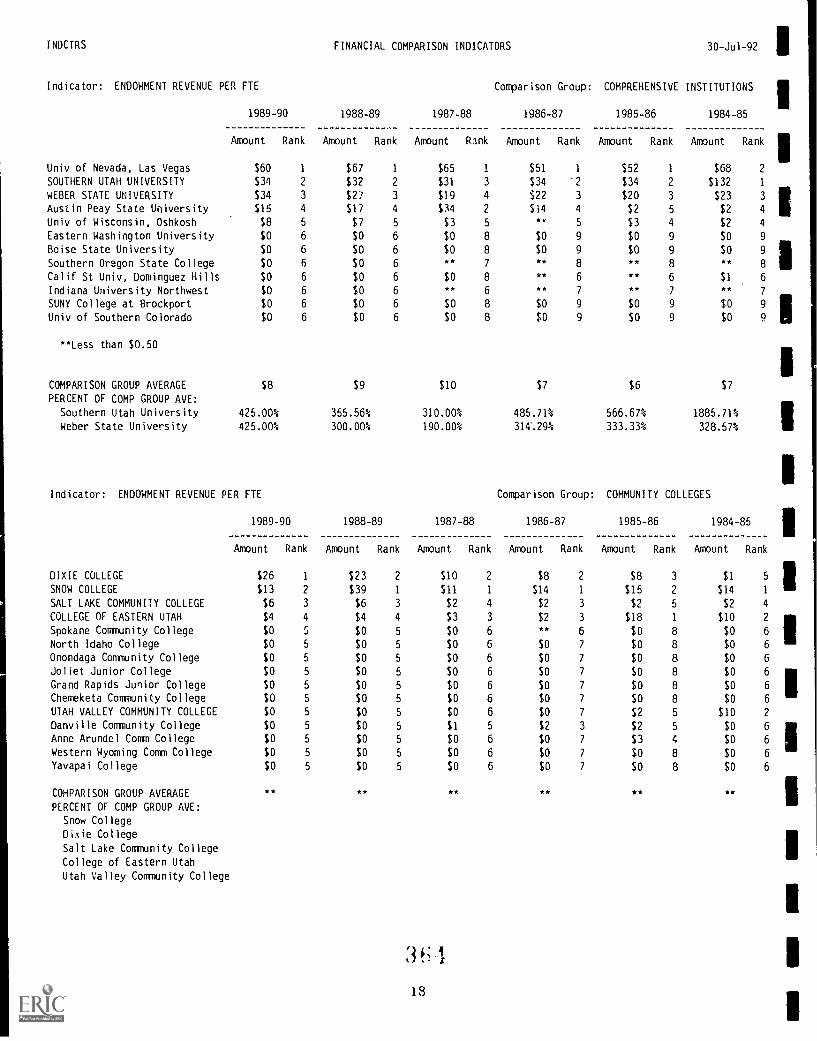
INDCTRS FINANCIAL COMPARISON INDICATORS 30-Jul-92
Indicator: ENDOWMENT REVENUE PER FTE Comparison Group: COMPREHENSIVE INSTITUTIONS
1984-851989-90
Amount Rank
1988-89
Amount Rank
1987-88
Amount Rank
1986-87
Amount Rank
1985-86
Amount Rank
Univ of Nevada, Las Vegas $60 1 $67 1 $65 1 $51 1 $52 1
SOUTHERN UTAH UNIVERSITY $34 2 $32 2 $31 3 $34 '2 $34 2
WEBER STATE UNIVERSITY $34 3 $2? 3 $19 4 $22 3 $20 3
Austin Peay State University $15 4 $17 4 $34 2 $14 4 $2 5
Univ of Wisconsin, Oshkosh $8 5 $7 5 $3 5** 5 $3 4
Eastern Washington University $0 6 $0 6 $0 8 $0 9 $0 9
Boise State University $0 6 $0 6 $0 8 $0 9 $0 9
Southern Oregon State College $0 6 $0 6**
7** 8 ** 8
Calif St Univ, Dominguez Hills $0 6 $0 6 $0 8 ** 6 ** 6
Indiana University Northwest $0 6 $0 6 ** 6 **7 ** 7
SUNY College at Brockport $0 6 $0 6 $0 8 $0 9 $0 9
Univ of Southern Colorado $0 6 $0 6 $0 8 $0 9 $0 9
**Less than $0.50
COMPARISON GROUP AVERAGE $8 $9 $10 $7 $6
PERCENT OF COMP GROUP AVE:
Southern Utah University 425.00% 355.56% 310.00% 485.71% 566.67%
Weber State University 425.00% 300.00% 190.00% 314.29% 333.33%
Amount Rank
$68 2
$132 1
$23 3
$2 4 I$2 4
$O 9
$0 9
I** 8
$1 6**
7
$0 9
$0 9 I
$7
1885.71%
328.57% 111
IIndicator: ENDOWMENT REVENUE PER FTE Comparison Group: COMMUNITY COLLEGES
1989-90
Amount Rank
1988-89
Amount Rank
1987-88
Amount Rank
1986-87
Amount Rank
1985-86
Amount Rank
DIXIE COLLEGE $26 1 $23 2 $10 2 $8 2 $8 3
SNOW COLLEGE $13 2 $39 1 $11 1 $14 1 $15 2
SALT LAKE COMMUN1IY COLLEGE $6 3 $6 3 $2 4 $2 3 $2 5
COLLEGE OF EASTERN UTAH $4 4 $4 4 $3 3 $2 3 $18 1
Spokane Community College $0 5 $0 5 $0 6 ** 6 $0 8
North Idaho College $0 5 $0 5 $0 6 $0 7 $0 8
Onondaga Community College $0 5 $0 5 $0 6 $0 7 $0 8
Joliet Junior College $0 5 $0 5 $0 6 $0 7 $0 8
Grand Rapids Junior College $0 5 $0 5 $0 6 $0 7 $0 8
Chemeketa Community College $0 5 $0 5 $0 6 $0 7 $0 8
UTAH VALLEY COMMUNITY COLLEGE $0 5 $0 5 $0 6 $0 7 $2 5
Danville Community College $0 5 $0 5 $1 5 $2 3 $2 5
Anne Arundel Comm College $0 5 $0 5 $0 6 $0 7 $3 4
Western Wyoming Comm College $0 5 $0 5 $0 6 $0 7 $0 8
Yavapai College $0 5 $0 5 $0 6 $0 7 $0 8
COMPARISON GROUP AVERAGE .. ** ** ** **
1984-85111
Amount Rank
$1 5 1$14 1
$2 4
$10 2
$0 6 I$0 6
$0 6
$0 6
$0 6 I$0 6
$10 2
$O 6
$O 6 I$0 6
$0 6
**
IPERCENT OF COMP GROUP AVE:
Snow College
Dixie College
ISalt Lake Community College
College of Eastern Utah
Utah Valley Community College
I
3 .1
18

INDCTRS FINANCIAL COMPARISON INDICATORS 30-Jul-92
Indicator: GOVERNMENT GRANTS AND CONTRACTS PER FTE Comparison Group: UNIVERSITY OF UTAH
1989-90
Amount Rank
1988-89
Amount Rank
1987-88
Ampunt Rank
1986-87
Amount Rank
1985-86
Amount Rank
1984-85
Amount Rank
University of WashingLon $9,534 1 $8,792 1 $7,635 1 $7,036 1 $6,610 1 $5,959 1
Univ California, Los Angeles $6,799 2 $6,707 2 $5,511 2 $5,684 2 $5,278 2 $4,609 3
Univ North Carolina (Ch Hill) $6,389 3 $6,033 3 $5,410 3 $4,877 3 $4,603 3 $4,805 2
UNIVERSITY OF UTAH $5,637 4 $4,516 4 $4,437 4 $3,818 4 $3,650 4 $3,444 4
University of Arizona $4,325 5 $3,961 6 $3,753 5 $3,514 5 $3,244 5 $2,910 5
Univ of Virginia, Main Campus $4,296 6 $3,854 8 $3,558 7 $3,114 6 $3,238 6 $2,822 6
University of Iowa $4,208 7 $3,936 7 $3,494 8 $2,990 8 $2,880 7 $2,604 7
Univ of Colorado, Boulder $3,818 8 $3,678 9 $3,063 9 $2,793 9 $2,713 9 $2,588 8
University of Florida $3,534 9 $4,000 5 $3,665 6 $3,096 7 $2,850 8 $2,441 9
Univ Cincinnati, Main Campus $3,020 10 $2,501 10 $2,121 11 $2,075 11 $1,894 11 $1,732 11
Purdue University, Main Campus $2,460 11 $2,369 11 $2,37C 10 $2,219 10 $2,184 10 $1,953 10
COMPARISON GROUP AVERAGE $4,838 $4,583 $4,059 $3,740 $3,549 $3,242
PERCENT OF COMP GROUP AVE:
University of Utah 116.52% 98.54% 109.31% 102.09% 102.85% 106.23%
Indicator: GOVERNMENT GRINNTS AND CONTRACTS PER FTE
1989-90 1988-89
Amount Rank Amount Rank
1987-88
Amount Rank
Comparison Group:
1986-87
Amount Rank
UTAH STATE UNIVERSITY
1985-86 1984-85
Amount Rank Amount Rank
UTAH STATE UNIVERSITY $7,337 1 $5,865 1 $5,065 1 $4,193 2 $4,105 2 $3,491 3
Univ of California, Davis $5,600 2 $5,027 2 $4,362 3 $4,170 3 $3,826 3 $3,252 4
New Mexico State University $5,344 3 $4,493 3 $4,276 4 $3,929 4 $3,419 4 $3,527 2
Oregon State University $4,807 4 $4,301 4 $4,587 2 $4,430 1 $4,350 1 $4,255 1
Coiorado State University $3,680 5 $3,773 5 $3,430 5 $3,158 5 $2,647 5 $2,347 5
Virginia Tech University $3,451 6 $3,098 6 $2,522 7 $2,292 8 $2,314 7 $1,957 8
Washington State University $3,177 7 $2,707 8 $2,378 8 $2,302 7 $2,242 8 $2,114 7
Univ of Maryland, College Pk $3,110 8 $3,042 7 $2,844 6 $2,767 6 $2,510 6 $2,199 6
Iowa State University $2,731 9 $2,371 9 $1,693 10 $1,780 10 $1,455 10 $1,692 10
North Carolina State Univ $2,448 10 $2,204 10 $1,955 9 $1,900 9 $1,792 9 $1,775 9
Texas A & M University $1,650 11 $1,363 11 $1,132 11 $1,170 11 $793 11 $626 11
COMPARISON GROUP AVERAGE $3,600 $3,238 $2,918 $2,790 $2,535 $2,374
PERCENT OF COMP GROUP AVE:
Utah State University 203.81% 181.13% 173.58% 150.29% 161.93% 147.05%
36°19

INDCTRS FINANCIAL COMPARISON INDICATORS 30-Jul-92
Indicator: GOVERNMENT GRANTS AND CONTRACTS PER FTE Comparison Group: COMPREHENSIVE INSTITUTIONS
1989-90
Amount Rank
1988-89
Amount Rank
1987-88
Amount Rank
1986-87
Amount Rank
1985-86
Amount Rank
1984-85
Amount Rank
Univ of Southern Colorado $2,098 1 $2,091 1 $1,904 1 $2,034 1 $1,771 1 $1,452 1
SOUTHERN UTAH UNIVERSITY $1,540 2 $1,278 4 $1,103 4 $1,082 4 t1,116 2 $1,041 2
Eastern Washington University $1,435 3 $1,293 3 $1,130 3 $1,015 6 $860 6 $731 6
Boise State University $1,179 4 $1,298 2 $629 9 $556 12 $960 4 $677 8
SUNY College at Brockport $1,142 5 $1,070 6 $1,024 5 $1,133 2 $879 5 $875 4
Univ of Nevada, Las Vegas $1,099 6 $1,275 5 $1,173 2 $1,038 5 $859 7 $769 5
Southern Oregon State College $1,045 7 $1,032 8 $980 6 $1,101 3 $1,091 3 $982 3
WEBER STATE UNIVERSITY $1,003 8 $1,047 7 $897 7 $808 7 $781 8 $705 7
Austin Peay State University $851 9 $909 9 $884 8 $631 10 $630 11 $638 9
Indiana University Northwest $791 10 $744 11 $584 11 $632 9 $719 9 $546 12
Univ of Wisconsin, Oshkosh $735 11 $761 10 $609 10 $583 11 $621 12 $578 10
Calif St Univ, Dominguez Hills $493 12 $540 12 $461 12 $699 8 $633 10 $569 11
COMPARISON GROUP AVERAGE $1,087 $1,101 $938 $942 $902 $782
PERCENT OF COMP GROUP AVE:
Southern Utah University 141.67% 116.08% 117.59% 114.86% 123.73% 133.12%
Weber State University 92.27% 95.10% 95.63% 85.77% 86.59% 90.15%
Indicator: GOVERNMENT GRANTS AND CONTRACTS PER FTE
1989-90 1988-89
Amount Rank Amount Rank
1987-88
Amount Rank
Comparison Group:
1986-87
Amount Rank
COMMUNITY COLLEGES
1985-86 1984-85
Amount Rank Amount Rank
COLLEGE OF EASTERN UTAH $1,763 1 $1,546 1 $1,450 1 $1,631 1 $1,705 1 $1,680 1
SNOW COLLEGE $1,307 2 $1,170 5 $1,232 2 $1,031 2 $1,103 3 $1,116 2
DIXIE COLLEGE $1,303 3 $1,118 6 $1,002 5 $767 9 $758 9 $735 5
Chemeket. Community College $1,195 4 $1,258 4 $1,060 4 $1,050 3 $914 4 $729 6
SALT LAKE COMMUNITY COLLEGE $1,164 5 $1,288 3 $973 6 $778 8 $765 8 $711 7
UTAH VALLEY COMMUNITY COLLEGE $976 6 $877 9 $738 10 $575 12 $650 10 $528 9
Onandaga Community College $965 7 $1,029 7 $907 7 $633 11 $385 14 $318 13
',,th Idaho College $873 8 $955 8 838 8 $903 6 $1,321 2 $1,069 3
Western Wyoming Comm College $789 9 $876 10 $804 9 $847 7 $800 6 $525 10
Grand Rapids Junio, College 694 10 $822 11 $591 11 $1,001 5 $808 5 $907 4
Yavapai College $640 11 $632 12 $465 13 $687 10 $578 11 $481 11
Danville Community College $518 12 $605 13 $496 12 $461 13 $459 12 $454 12
Joliet Junior College $475 13 $421 14 $420 14 $111 15 $432 13 $375 14
Anne Arundel Comm College $194 14 $243 15 $208 15 $199 14 $212 15 $16C 15
Spokane Community College 15 $1,382 2 $1,138 3 $1,008 4 $780 7 $550 8
COMPARISON GROUP AVERAGE $705 $822 $693 $690 $669 $557
PERCENT OF COMP GROUP AVE:
College of Eastern Utah 250.07% 188.08% 209.24% 236.384 254.86% 301.62%
Snow College 185.39% 142.34% 177.78% 149.42% 164.87% 200.36%
Dixie College 184.82% 136.01% 144.59% 111.16% 113.30% 131.96%
Salt Lake Community College 165.11% 156.69% 140.40% 112.75% 114.35% 127.65%
Utah Valley Community Colleg 138.44% 106.69% 106.49% 83.33% 97.16% 94.79%
36)
20

INDCTRS FINANCIAL COMPARISON INDICATORS 30-Jul-92
Indicator: PRIVATE GIFTS, GRANTS, & CONTRACTS PER FTE Comparison Group: UNIVERSITY OF UTAH
1989-90
Amount Rank
1988-89
Amount Rank
1987-88
Amount Rank
1986-87
Amount Rank
1985-86
Amount Rank
1984-85
Amount Rank
University of Florida $3,364 1 $2,823 1 $1,968 3 $1,464 1 $1,708 2 $1,495 2
Univ California, Los Angeles $3,036 2 $2,469 2 $2,121 1 $1,887 1 $1,789 1 $1,509 1
Univ of Virginia, Main Campus $2,697 3 $2,038 4 $1,697 4 $1,253 2 $1,200 5 $1,067 5
Univ North Carolina (Ch Hill) $2,361 4 $2,158 3 $2,020 2 $1,644 3 $1,498 3 $1,470 3
University of Washington $1,760 5 $1,704 5 $1,585 5 $1,702 2 $1,408 4 $1,209 4
University of Iowa $1,202 6 $1,061 8 $944 8 $746 10 $715 10 $582 9
University of Arizona $1,200 7 $1,404 7 $1,182 6 $1,172 6 $1,142 6
Univ Cincinnati, Main Campus $1,018 8 $954 10 $891 9 $913 8 $800 9 1946407 160
Purdue University, Main Campus $991 9 $992 9 $1,046 7 $898 9 $936 7 $906 7
Univ of Colorado, Boulder $845 10 $749 11 $773 10 $583 11 $553 11 $428 11
UNIVERSITY OF UTAH $447 11 $1,466 6 $758 11 $1,029 7 $905 8 $771 8
COMPARISON GROUP AVERAGE $1,847 $1,635 $1,423 $1,226 $1,175 $1,006
PERCENT OF COMP GROUP AVE:
University of Utah 24.20% 89.66% 53.27% 83.93% 77.02% 76.64%
Indicator: PRIVATE GIFTS, GRANTS, & CONTRACTS PER FTE
1989-90 1988-89
Amount Rank Amount Rank
1987-88
Amount Rank
Comparison Group:
1986-87
Amount Rank
UTAH STATE UNIVERSITY
1985-86 1984-85
Amount Rank Amount Rank
North Carolina State Univ $1,732 1 $1,747 1 $1,585 1 $1,256 1 $1,150 1 $891 2
Univ of California, Davis $1,652 2 $1,354 3 $1,191 4 $939 4 $1,054 3 $876 3
Texas A & M University $1,617 3 $1,463 2 $1,497 2 $1,187 2 $1,237 2 $1,121 1
Oregon State University $1,236 4 $1,264 4 $1,366 3 $826 6 $800 6 $759 4
Virginia Tech University $1,212 5 $891 6 $806 6 $747 7 $636 9 $558 8
Washington State University $1,152 6 $1,112 5 $999 5 $903 5 $830 5 $601 7
Iowa State University $898 7 $792 8 $661 8 $695 8 $784 7 $725 5
UTAH STATE UNIVERSITY $809 8 $792 7 $599 9 $557 9 $649 8 $539 9
New Mexico State University $697 9 $640 9 $779 7 $1,115 3 $973 4 $663 6
Univ of Maryland, College Pk $568 10 $470 10 $411 10 $287 10 $289 11 $252 11
Colorado State University $383 11 $403 11k
$0 11 $0 11 $503 10 $414 10
COMPARISON GROUP AVERAGE $1,115 $1,014 $930 $796 $826 $686
PERCENT OF COMP GROUP AVE:
Utah State University 72.56% 78.11% 64.41% 69.97% 78.:)7% 78.57%
:3 6 721

1NDCTRS FINANCIAL COMPARISON INDICATORS 30-Jul-92
Indicator: PRIVATE GIFTS, GRANTS, & CONTRACTS PER FTE Comparison Group: COMPREHENSIVE INSTITUTIONS
1989-90
Amount Rank
1988-89
Amount Rank
1987-88
Amount Rank
1986-87
Amount Rank
1985-86
Amount Rank
1984-85
Amount Rank
Univ of Nevada, Las Vegas $513 1 $532 1 $463 1 $498 1 $317 1 $426 1
SUNY College at Brockport $297 2 $282 2 $290 2 $217 2 $178 2 $124 3
Eastern Washington University $284 3 $240 4 $168 4 $180 5 $99 7 $89 7
Southern Oregon State College $279 4 $231 5 $223 3 $193 4 $153 3 $125 2
WEBER STATE UNIVERSITY $265 5 $184 6 $166 5 $205 3 $127 6 $104
Boise State University $187 6 $270 3 $147 6 $149 6 $133 4 $108 5
SOUTHERN UTAH UNIVERSITY $143 7 $105 8 $140 7 $133 7 $132 5 $123 4
Austin Peay State University $125 8 $102 9 $108 8 $61 9 $49 8 $46
Indiana University Northwest $115 9 $163 7 $51 10 $52 10 $26 10 $36 9
Univ of Wisconsin, Oshkosh $81 10 $46 10 $52 9 $25 11 $21 11 $14 11
Calif St Univ, Dominguez Hills $32 11 $45 11 $0 11 $114 8 $30 9 $31 10
Univ of Southern Colorado $0 12 $0 12 $0 11 $0 12 $0 12 $0 12
COMPARISON GROUP AVERAGE $191 $191 $150 $149 $100 $100
PERCENT OF COMP GROUP AVE:
Weber State University 138.74% 96.34% 110.67% 137.58% 127.00% 104.00%
Southern Utah University 74.87% 54.97% 93.33% 89.26% 132.00% 123.00%
Indicator: PRIVATE GIFTS, GRANTS, & CONTRACTS PER FTE
1989-90 1988-89
Amount Rank Amount Rank
1987-88
Amount Rank
Comparison Group:
1986-87
Amount Rank
COMMUNITY COLLEGES
1985-86 1984-85
Amount Rank Amount Rank
SNOW COLLEGE $136 1 $57 4 $127 2 $73 3 $32 7 $44 7
DIXIE COLLEGE $126 2 $142 1 $132 1 $77 2 $160 2 $129 2
North Idaho College $95 3 $56 5 $44 5 $51 4 $53 6 $50 6
SALT LAKE COMMUNITY COLLEGE $80 4 $14 8 $24 7 $22 9 $21 8 $12 8
Danville Community College $65 5 $29 6 $25 6 $23 8 $74 4 $107 3
COLLEGE OF EASTERN UTAH $49 6 $79 2 $96 3 $78 1 $84 3 $95 4
Western Wyoming Comm College $21 7 $16 7 $15 9 $26 7 $18 9 $0 11
Anne Arundel Comm College $16 8 $0 14 $0 13 $O 12 $62 5 $67 5
Yavapai College $12 9 $5 11 $20 8 $6 11 $0 12 $0 11
UTAH VALLEY COMMUNITY COLLEGE $7 10 $6 10 $11 11 $13 10 $2 11 $5 10
Onondaga Community College $3 11 $5 11 $4 12 $0 12 $0 12 $0 11
Grand Rapids Junior College $2 12 $8 9 $0 13 $0 12 $0 12 $0 11
Joliet Junior College $0 13 $4 13 $12 10 $32 6 $273 1 $232 1
Chemeketa Community College $0 13 $0 14 $0 13 $0 12 $0 12 $0 11
Spokane Community College 15 $73 3 $68 4 $39 5 $7 10 $8 9
COMPARISON GROUP AVERAGE $24 $20 $19 $18 $49 $46
PERCENT OF COMP GROUP AVE:
Snow College 566.67% 285.00% 668.42% 405.56% 65.31% 95.65%
Dixie College 525.00% 710.00% 694.74% 427.78% 326.53% 280.43%
Salt Lake Community College 333.33% 70.00% 126.32% 122.22% 42.86% 26.09%
College of Eastern Utah 204.17% 395.00% 505.26% 433.33% 171.43% 206.52%Utah Valley Community Colleg 29.17% 30.00% 57.89% 72.22% 4.08% 10.87%
I
1
I
I
I
I
I
I
22

INDCTRS FINANCIAL COMPARISON INDICATORS 30-Jul-92
Indicator: TOTAL REVENUES PER FTE Comparison Group: UNIVERSITY OF UTAH
1989-90
Amount Rank
1988-89
Amount Rank
1987-88
Amount Rank
1986-87
Amount Rank
1985-86
Amount Rank
1984-85
Amount Rank
Univ California, Los Angeles $31,469 1 $30,026 1 $26,874 1 $25,847 1 $25,877 1 $23,224 1
Univ North Carolina (Ch Hill) $27,298 2 $25,534 2 $24,450 2 $22,227 2 $21,915 2 $20,227 2
University of Washington $26,368 3 $24,465 3 $21,642 3 $20,489 3 $18,830 3 $16,837 3
University of Florida $22,394 4 $21,408 4 $18,806 4 $16,628 4 $14,856 6 $13,745 6
Univ of Virginia, Main Campus $20,275 5 $18,619 5 $16,803 5 $15,031 7 $16,975 4 $15,351 4
UNIVERSITY OF UTAH $19,337 6 $18,351 6 $16,512 6 $15,466 5 $15,056 5 $13,845 5
University of Iowa $17,434 7 $16,030 8 $13,956 8 $12,535 10 $13,025 9 $12,410 9
University of Arizona $17,111 8 $16,842 7 $15,882 7 $15,111 6 $14,313 7 $12,774 8
Univ Cincinnati, Main Campus $15,565 9 $13,939 9 $12,913 10 $13,160 8 $13,457 8 $13,004 7
Purdue University, Main Campus $14,106 10 $13,486 10 $13,392 9 $12,761 9 $12,161 10 $11,076 10
Univ of Colorado, Boulder $13,000 11 $12,313 11, $11,548 11 $10,596 11 $9,661 11 $9,024 11
COMPARISON GROUP AVERAGE $20,502 $19,266 $17,627 $16,439 $16,107 $14,767
PERCENT OF COMP GROUP AVE:
University of Utah 94.32% 95.25% 93.67% 94.08% 93.47% 93.76%
Indicator: TOTAL REVENUES PER FTE
1989-90
Amount Rank
1988-89
Amount Rank
1987-88
Amount Rank
Comparison Group:
1986-87
Amount Rank
UTAH STATE UNIVERSITY
1985-86 1984-85
Amount Rank Amount Rank
Univ of California, Davis $28,474 1 $26,885 1 $24,857 1 $23,873 1 $23,708 1 $21,135 1
North Carolina State Univ $18,609 2 $18,156 2 $17,568 2 $15,787 2 $15,106 3 $13,811 3
UTAH STATE UNIVERSITY $17.660 3 $16,239 3 $14,901 4 $13,732 5 $13,950 4 $12,370 5
Virginia Tech University $17,062 4 $15,715 5 $14,401 5 $13,483 6 $12,617 7 $11,637 7
Oregon State University $16,847 5 $15,509 6 $15,971 3 $14,467 4 $13,684 5 $12,696 4
Washington State University $16,685 6 $15,827 4 $13,833 7 $13,158 7 $12,553 8 $11,729 6
Texas A & M University $16,124 7 $14,843 8 $13,938 6 $15,062 3 $16,285 2 $14,742 2
Iowa State University $15,326 8 $14,315 9 $12,479 10 $12,143 9 $10,281 11 $9,955 10
New Mexico State University $15,115 9 $13,328 11 $12,791 9 $12,777 8 $12,682 6 $11,618 8
Univ of Maryland, College Pk $14,992 10 $15,120 7 $12,893 8 $11,674 10 $10,711 10 $9,652 11
Colorado State University $14,176 11 $13,758 10 $12,326 11 $11,671 11 $11,045 9 $10,450 9
COMPARISON GROUP AVERAGE $17,341 $16,346 $15,106 $14,409 $13,867 $12,742PERCENT OF COMP GROUP AVE:
Utah State University 101.84% 99.35% 98.64% 95.30% 100.60% 97.08%
36923

1NDCTRS FINANCIAL COMPARISON INDICATORS 30-Jul-92
Indicator: TOTAL REVENUES PER FTE Comparison Group: COMPREHENSIVE INSTITUTIONS
1989-90
Amount Rank
1988-89
Amount Rank
1987-88
Amount Rank
1986-87
Amount Rank
1985-86
Amount Rank
1984-85
Amount Rank
Calif St Univ, Dominguez Hills $10,315 1 $11,892 1 $8,997 3 $10,635 1 $8,980 2 $8,313 2
Univ of Nevada, Las Vegas $9,149 2 $8,547 3 $8,244 4 $8,039 3 $7,444 3 $7,044 3
SUNY College at Brockport $8,975 3 $8,967 2 $9,505 1 $9,533 2 $.9,152 1 $8,990 1
Eastern Washington University $8,935 4 $8,449 4 $7,931 5 $7,256 5 $6,414 6 $6,169 5
SOUTHERN UTAH UNIVERSITY $7,840 5 $7,266 7 $6,718 7 $6,588 6 $6,941 4 $6,457 4
Univ of Southern Colorado $7,637 6 $7,542 6 $7,291 6 $7,366 4 $6,475 5 $5,485 7
Boise State University $7,300 7 $7,548 5 $6,303 9 $6,020 11 $6,078 7 $5,240 9
Southern Oregon State College $7,010 8 $6,487 11 $6,238 10 $6,309 8 $5,883 10 $5,314 8
Indiana University Northwest $6,892 9 $6,793 9 $6,311 8 $6,069 9 $5,936 9 $5,072 10
Austin Peay State University $6,634 10 $7,179 8 $9,195 2 $6,417 7 $5,460 11 $4,816 12
WEBER STATE UNIVERSITY $6,627 11 $6,496 10 $6,154 11 $6,053 10 $6,023 8 $5,777 6
Univ of Wisconsin, Oshkosh $6,528 12 $6,076 12 $5,600 12 $5,131 12 $5,120 12 $5,056 11
COMPARISON GROUP AVERAGE $7,938 $7,948 $7,562 $7,278 $6,694 $6,150
PERCENT OF COMP GROUP AVE:
Southern Utah University 98.77% 91.42% 88.84% 90.52% 103.69% 104.99%
Weber State University 83.48% 81.73% 81.38% 83.17% 89.98% 93.93%
Indicator: TOTAL REVENUES PER FTE
1989-90
Amount Rank
1988-89
Amount Rank
1987-88
Amount Rank
Comparison Group:
1986-87
Amount Rank
COMMUNITY COLLEGES
1985-86 1984-85
Amount Rank Amount Rank
Western Wyoming Comm College $8,685 1 $8,638 1 $8,649 2 $10,721 1 $10,870 1 $9,077 1
North Idaho College $7,350 2 $6,987 3 $6,522 5 $6,602 2 $6,911 3 $6,139 4
SNOW COLLEGE $7,152 3 $7,250 2 $7,376 3 $6,500 5 $6,851 4 $6,495 3
COLLEGE OF EASTERN UTAH $6,856 4 $6,336 5 $6,344 6 $6,565 4 $7,172 2 $7,695 2
Chemeketa Community College $6,771 5 $6,292 6 $6,793 4 $6,589 3 $5,803 5
154,T3
5
Onondaga Community College $6,521 6 $6,509 4 $5,980 7 $5,466 6 $5,045 7 7
DIXIE COLLEGE $6,168 7 $5,933 7 $5,538 8 $4,818 11 $4,762 8 $4,688 8
Yavapai College $6,142 8 $5,437 11 $4,951 12 $5,086 8 $4,662 11 $4,459 11
SALT LAKE COMMUNITY COLLEGE $5,767 9 $5,928 8 $5,299 9 $4,779 12 $4,703 10 $4,481 10
Grand Rapids Junior College $5,693 10 $5,647 9 $10,226 1 $4,977 9 $4,720 9 $4,753 6
UTAH VALLEY COMMUNITY COLLEGE $5,063 11 $4,979 12 $4,416 13 $4,496 13 $4,187 14 $3,936 14
Danville Community College $4,776 12 $4,843 13 $4,953 11 $5,179 7 $5,092 6 $4,636 9
Joliet Junior College $4,728 13 $4,676 14 $4,392 14 $4,265 14 $3,740 15 $4,004 12
Anne Arundel Comm College $4,479 14 $4,217 15 $4,247 15 $4,188 15 $4,328 13 $3,965 13
Spokane Community College 15 $5,500 10 $5,207 10 $4,928 10 $4,483 12 $3,819 15
COMPARISON GROUP AVERAGE $6,127 $5,875 $6,192 $5,800 $5,566 $5,103
PERCENT OF COMP GROUP AVE:
Snow College 116.73% 123.40% 119.12% 112.07% 123.09% 127.28%
College of Eastern Utah 111.90% 107.85% 102.45% 113.19% 128.85% 150.79%
Dixie College 100.67% 100.99% 89.44% 83.07% 85.56% 91.87%
Salt Lake Community College 94.12% 100.90% 85.58% 82.40% 84.50% 87.81%
Utah Valley Community Colleg 82.63% 84.75% 71.32% 77.52% 75.22% 77.13%
(3 1 )
24
I
P
1

INDCTRS FINANCIAL COMPARISON INDICATORS 30-Jul-92
Indicator: INSTRUCTION EXPENDITURES PER FTE Comparison Group: UNIVERSITY OF UlAH
1989-90
Amount Rank
1988-89
Amount Rank
1987-88
Amount Rank
1986-87
Amount Rank
1985-86
Amount Rank
1984-85
Amount Rank
Univ California, Los Angeles $12,867 1 $11,739 1 $10.595 1 $10,104 1 $9,576 1 $8,336 1
Univ North Carolina (Ch Hill) $11,103 2 $10,044 2 $9,597 2 $9,271 2 $8,761 2 $8,261 2
University of Washington $9,610 3 $9,286 3 $8,189 3 $7,633 3 $6,263 3 $5,909 3
Univ of Virginia, Main Campus $7,618 4 $6,909 4 $6,523 4 $5,890 4 $5,633 5 $5,083 5
University of Florida $7,239 5 $5,624 7 $6,326 5 $5,534 5 $5,652 4 $5,411 4
University of Iowa $6,708 6 $6,043 5 $5,730 6 $5,140 8 $4,919 9 $4,721 7
Univ Cincinnati, Main Campus $6,252 7 $5 703 6 $5,190 10 $5,531 6 $5,110 7 $4,463 9
Purdue University, Main Campus $5,730 8 $5,289 10 $5,346 7 $5,276 7 $4,842 10 $4,392 10
UNIVERSITY OF UTAH $5,725 9 $5,527 8 $5,265 9 $5,129 10 $5,139 6 $4,688 8
University of Arizona $5,638 10 $5,450 9 $5,320 8 $5,137 9 $5,002 8 $4,742 6
Univ of Colorado, Boulder $4,509 11 $4,362 11 $3,987 11 $3,749 11 $3,507 11 $3,219 11
COMPARISON GROUP AVERAGE $7,727 $7,045 $6,680 $6,327 $5,927 $5,454
PERCENT OF COMP GROUP AVE:
University of Utah 74.09% 78.45% 78.82% 81.07% 86.70% 85.96%
Indicator: INSTRUCTION EXPENDITURES PER FTE
1989-90
Amount Rank
1988-89
Amount Rank
1987-88
Amount Rank
Comparison Group:
1986-87
Amount Rank
UTAH STATE UNIVERSITY
1985-86 1984-85
Amount Rank Amount Rank
Univ of California, Davis $10,401 1 $9,554 1 $8,858 1 $8,665 1 $8,088 1 $7,333 1
North Carolina State Univ $6,226 2 $5,986 2 $5,893 2 $5,319 2 $5,012 2 $4,561 2
Virginia Tech University $5,758 3 $5,322 3 $5,006 3 $4,674 3 $4,311 3 $3,997 3
Univ of Maryland, College Pk $5,129 4 $4,482 7 $4,000 9 $3,736 9 $3,401 10 $3,312 9
Washington State University $5,016 5 $4,994 5 $4,496 4 $4,297 4 $4,063 6 $3,825 5
Colorado State University $4,888 6 $4,618 6 $4,163 7 $4,025 7 $4,039 7 $3,756 6
Texas A & M University $4,823 7 $5,291 4 $4,218 6 $4,119 5 $4,179 4 $3,959 4
Iowa State University $4,735 8 $4,126 9 $3,736 10 $3,549 10 $3,403 9 $3,403 8
UTAH STATE UNIVERSITY $4,400 9 $4,311 8 $4,229 5 $4,094 6 $4,154 5 $3,665 7
Oregon State University $4,172 10 $4,052 10 $4,131 8 $3,942 8 $3,613 8 $3,311 10
New Mexico State University $3,378 11 $3,203 11 $2,979 11 $2,915 11 $2,944 11 $2,676 11
COMPARISON GROUP AVERAGE $5,453 $5,163 $4,748 $4,524 $4,305 $4,013
PERCENT OF COMP GROUP AVE:
Utah State University 80.69% 83.50% 89.07% 90.50% 96.49% 91.33%
371
25

INDCTRS FINANCIAL COMPARISON INDICATORS 30-Jul-92
Indicator: INSTRUCTION EXPENDITURES PER FTE Comparison Group: COMPREHENSIVE INSTITUTIONS
1989-90
Amount Rank
1988-89
Amount Rank
1987-88
Amount Rank
1986-87
Amount Rank
1985-86
Amount Rank
1984-85
Amount Rank
Calif St Univ. Dominguez Hills $5,663 1 $5,362 1 $4,896 1 $4,646 1 $3,802 1 $3,592 1
SONY College at Brockport $3,797 2 $3,522 2 $3,786 3 $3,749 2 $3,560 2 $3,497 2
Eastern Washington University $3,745 3 $3,474 4 $3,380 4 $3,175 3 $2,816 5 $2,710 4
Univ of Nevada, Las Vegas $3,560 4 $2,986 8 $2,874 9 $2,772 10 $2,632 9 $2,482 6
Boise State University $3,328 5 $3,517 3 $3,140 5 $3,049 5 $2,877 4 $2,468 7
Southern Oregon State College $3,180 6 $2,889 10 $2,830 10 $2,850 9 $2,512 10 $2,294 9
Univ of Wisconsin, Oshkosh $3,106 7 $2,945 9 $3,072 6 $2,889 8 $2,748 6 $2,547 5
Austin Peay State University $3,080 8 $3,398 5 $4,260 2 $3,063 4 $2,661 8 $2,345 8
WEBER STATE UNIVERSITY $3,014 9 $3,006 7 $2,923 7 $3,010 6 $2,988 3 $2,820 3
Indiana University Northwest $2,884 10 $3,064 6 $2,896 8 $2,895 7 $2,743 7 $2,164 10
SOUTHERN UTAH UNIVERSITY $2,508 11 $2,199 12 $2,130 12 $2,069 12 $2,316 11 $2,164 10
Univ of Southern Colorado $2,455 12 $2,646 11 $2,498 11 $2,395 11 $2,086 12 $1,951 12
COMPARISON GROUP AVERAGE $3,480 $3,380 $3,363 $3,148 $2,844 $2,631
PERCENT OF COMP GROUP AVE:
Weber State University 86.61% 88.93% 86.92% 95.62% 105.06% 107.18%
Southern Utah University 72.07% 65.06% 63.34% 65.72% 81.43% 82.25%
Indicator: INSTRUCTION EXPENDITURES PER FTE
1989-90
Amount Rank
1988-89
Amount Rank
1987-88
Amount Rank
Comparison Group:
1986-87
Amount Rank
COMMUNITY COLLEGES
1985-86 1984-85
Amount Rank Amount Rank
Western Wyoming Comm College $3,791 1 $3,676 1 $3,927 1 $4,670 1 $4,776 I $3,010 I
Grand Rapids Junior College $3,273 2 $3,216 2 $2,956 3 $2,615 5 $2,460 6 $2,741 4
Chemeketa Community College $3,158 3 $2,924 4 $2,932 4 $3,216 2 $3,015 3 $2,836 3
North Idaho College $2,924 4 $3,072 3 $2,970 2 $2,968 3 $3,191 2 $2,855 2
Onondaga Community ".ollege $2,905 5 $2,879 5 $2,587 6 $2,178 12 $2,109 11 $1,981 11
Joliet Junior College $2,599 6 $2,486 9 $2,535 7 $2,291 10 $1,780 15 $1,841 14
COLLEGE OF EASTERN UTAH $2,530 7 $1,993 14 $2,296 12 $2,335 8 $2,681 5 $2,688 5
Anne P.vundel Comm College $2,467 8 $2,280 11 $2,341 11 $2,405 7 $2,250 9 $2,090 10
Danville Community College $2,466 9 $2,608 7 $2,624 5 $2,676 4 $2,449 7 $2,438 6
SALT LAKE COMMUNITY COLLEGE $2,383 10 $2,600 8 $2,398 10 $2,481 6 $2,404 8 $2,267 7
DIXIE COLLEGE $2,342 11 $2,165 12 $1,936 14 $1,823 15 $1,851 13 $1,852 13
SNOW COLLEGE $2,281 12 $2,320 10 $2,472 8 $2,290 11 $2,754 4 $2,267 7
Yavapai College $2,129 13 $2,041 13 $2,196 13 $2,163 13 $1,850 14 $2,116 9
UTAH VALLEY COMMUNITY COLLEGE $1,996 14 $1,937 15 $1,858 15 $1,916 14 $1,887 12 $1,791 15
Spokane Community College 15 $2,631 6 $2,422 9 $2,316 9 $2,173 10 $1,930 12
COMPARISON GROUP AVERAGE $2,857 $2,781 $2,749 $2,750 $2,606 $2,384
PERCENT OF COMP GROUP AVE:
College of Eastern Utah 88.55% 71.66% 83.52% 84.91% 102.88% 112.75%
Salt Lake Community College 83.41% 93.49% 87.23% 90.22% 92.25% 95.09%
Dixie College 81.97% 77.85% 70.43% 66.29% 71.03% 77.68%
Snow College 79.84% 83.42% 89.92% 83.27% 105.68% 95.09%
Utah Valley Community Colleg 69.86% 69.65% 67.59% 69.67% 72.41% 75.13%

INDCTRS FINANCIAL COMPARISON INDICATORS 30-Jul-92
Indicator: RESEARCH EXPENDITURES PER FTE Comparison Group: UNIVERSITY OF UTAH
1989-90
Amount Rank
1988-89
Amount Rank
1987-88
Amount Rank
1986-87
Amount Rank
1985-86
Amount Rank
1984-85
Amount Rank
University of Washington $6,964 1 $6,594 1 $5,666 1 $5,588 1 $5,776 1 $5,289 1
University of Florida $6,936 2 $6,470 2 $5,615 2 $4,760 3 $4,377 3 $3,835 3
Univ California, Los Angeles $6,542 3 $5,992 3 $5,231 3 $4,905 2 $4,626 2 $4,426 2
University of Arizona $4,692 4 $4,358 4 $4,142 4 $3,921 4 $3,529 4 $3,129 5
Univ North Carolina (Ch Hill) $4,541 5 $4,255 5 $3,868 5 $3,437 5 $3,218 5 $3,727 4
Univ of Virginia, Main Campus $4,088 6 $3,582 7 $3,202 6 $2,751 7 $2,716 6 $2,363 8
UNIVERSITY OF UTAH $3,740 7 $3,589 6 $3,135 7 $2,923 6 $2,620 7 $2,403 7
University of Iowa $3,255 8 $3,012 8 $2,583 9 $2,135 10 $1,965 10 $1,783 10
Univ of Colorado, Boulder $3,107 9 $2,803 9 $2,547 10 $2,310 9 $2,038 9 $1,897 9
Purdue University, Main Campus $2,729 10 $2,700 10 $2,796 8 $2,578 8 $2,614 8 $2,410 6
Univ Cincinnati, Main Campus $2,253 II $1,986 11 $1,729 11 $1,620 11 $1,337 11 $1,263 11
COMPARISON GROUP AVERAGE $4,511 $4,175 $3,738 $3,401 $3,220 $3,012
PERCENT OF COMP GROUP AVE:
University of Utah 82.91% 85.96% 83.87% 85.95% 81.37% 79.78%
Indicator: RESEARCH EXPENDITURES PER FTE
1989-90
Amount Rank
1988-89
Amount Rank
1987-88
Amount Rank
Comparison Group:
1986-87
Amount Rank
UTAH STATE UNIVERSITY
1985-86 1984-85
Amount Rank Amount Rank
Univ of California, Davis $7,136 1 $6,804 1 $6,157 1 $5,987 1 $5,622 1 $5,145 1
UTAH STATE UNIVERSITY $6,570 2 $5,487 2 $4,841 4 $3,765 5 $3,939 5 $3,449 5
New Mexico State University $6,219 3 $5,293 3 $5,260 2 $5,091 2 $4,941 2 $4,227 2
Oregon State University $5,264 4 $4,991 5 $5,127 3 $4,643 3 $4,294 3 $4,132 3
North Carolina State Univ $5,155 5 $5,027 4 $4,737 5 $4,216 4 $3,948 4 $3,642 4
Virginia Tech University $4,238 6 $3,627 6 $3,194 7 $2,880 7 $2,779 7 $2,429 7
Texas A & M University $4,090 7 $3,273 9 $3,501 6 $3,365 6 $2,912 6 $2,584 6
Iowa State University $3,582 8 $3,407 8 $3,010 8 $2,395 10 $2,335 8 $2,260 9
Washington State University $3,039 9 $2,886 10 $2,664 10 $2,614 8 $2,503 9 $2,394 8
Univ of Mar. land, College Pk $2,885 10 $3,456 7 $2,820 9 $2,526 9 $2,104 10 $1,847 11
Colorado State University $2,657 11 $2,446 11 $2,293 11 $2,167 11 $2,089 11 $1,961 10
COMPARISON GROUP AVERAGE $4,427 $4,121 $3,876 $3,588 $3,353 $3,062
PERCENT OF COMP GROUP AVE:
Utah State University 148.41% 133.15% 124.90% 104.93% 117.48% 112.64%
27 3 7 3

INDCTRS FINANCIAL COMPARISON INDICATORS 30-Jul-92 I
Indicator: RESEARCH EXPENDITURES PER FTE Comparison Group: COMPREHENSIVE INSTITUTIONS
I1989-90
Amount Rank
1988-89
Amount Rank
1987-88
Amount Rank
1986-87
Amount Rank
Univ of Nevada, Las Vegas $629 1 $664 1 $593 1 $553 1
Eastern Washington University $247 2 $202 2 $192 3 $212 3
Boise State University $207 3 $184 3 $133 5 $104 5
Univ of Southern Colorado $180 4 $131 5 $185 4 $168 4
SUNY College at Brockport $109 5 $81 6 $95 6 $79 6
!ndiana University Northwest $98 6 $149 4 $204 2 $49 7
Univ of Wisconsin, Oshkosh $50 7 $34 8 $23 8 $18 8
WEBER STATE UNIVERSITY $38 8 $48 7 $56 7 $17 9
Austin Peay State University $19 9 $27 9 $21 9 $2 10
Southern Oregon State College $14 10 $7 10 .. 10 .. 11
Calif St Univ, Dominguez Hills $O 11 $0 11 $0 11 $290 2
SOUTHERN UTAH UNIVERSITY $0 11 $0 11 $0 11 $0 12
**Less than $0.50
COMPARISON GROUP AVERAGE $155 $148 $145 $147
PERCENT OF COMP GROUP AVE:
Weber State University 24.52% 32.43% 38.62% 11.56%
Southern Utah University 0.00% 0.00% 0.00% 0.00%
Indicator: RESEARCH EXPENDITURES PER FTE Comparison Group:
1989-90 1988-89 1987-88 1986-87
Amount Rank Amount Rank Amount Rank Amount Rank
Onandaga Community College $368 1 $383 1 $28 1 $25 3
SNOW COLLEGE $5 2 $5 2 $7 2 $7 4
Anne Arundel Comm College $0 3 $0 3 $0 3 $37 2
UTAH VALLEY COMMUNITY COLLEGE $0 3 $0 3 $O 3 $92 1
North Idaho College $0 3 $0 3 $0 3 $0 5
COLLEGE OF EASTERN UTAH SO 3 $0 3 $O 3 $0 5
SALT LAKE COMMUNITY COLLEGE $0 3 $0 3 $0 3 $0 5
Joliet Junior College $0 3 $O 3 SO 3 $O 5
Yavapai College $O 3 $0 3 $0 3 $0 5
DIXIE COLLEGE $0 3 $0 3 $0 3 $O 5
Chemeketa Community College $0 3 $0 3 $0 3 $0 5
Grand Rapids Junior College $0 3 $0 3 $0 3 $0 5
Danville Community College $0 3 $0 1.. $0 3 $0 5
Western Wyoming Comm College $0 3 $0 3 $0 3 $0 5
Spokane Community College 15 SO 3 $0 3 $0 5
COMPARISON GROUP AVERAGE $41 $38 $3 $6
PERCENT OF COMP GROUP AVE:
Snow College 12.20% 13.16% 233.33% 116.67%
Utah Valley Community Colleg 0.00% 0.00% 0.00% 1533.33%College of Eastern Utah 0.00% 0.00% 0.00% 0.00%Salt Lake Community College 0.00% 0.00% 0.00% 0.00%Dixie College 0.00% 0.00% 0.00% 0.00%
1985-86 1984-85
Amount Rank Amount Rank
I$421 1 $344 1
$196 2 $139 3
$101 5 $82 5
II$134 4 $123 4
$73 6 $50 6
$34 7 $26 7
$16 8 $16 8
I$12 9 $13 9
$1 10 $1 10
$1 10 $I 10
$189 3 $148 2
I$0 12 $0 12
$117 $93
10.26% 13.984II0.00% 0.00%
II
COMMUNITY COLLEGES
1985-86 1984-85 IAmount Rank Amount Rank
$35 1 $31 1
$13 2 $5 2
$0 3 $0 3
$0 3 $0 3
$0 3 $0 3
$0 3 $0 3
$0 3 $0 3
$O 3 $0 3
$0 3 $0 3
$0 3 $0 3
$0 3 $0 3
$0 3 $03
$0 3 $0 3
SO 3 $0 3
$0 3 $0 3
$3 $3
433.33% 166.67%
0.00% 0.00%
0.00% 0.00%
0.00% 0.00%
0.00% 0.00%
I
II
I
IIII
II
II
I
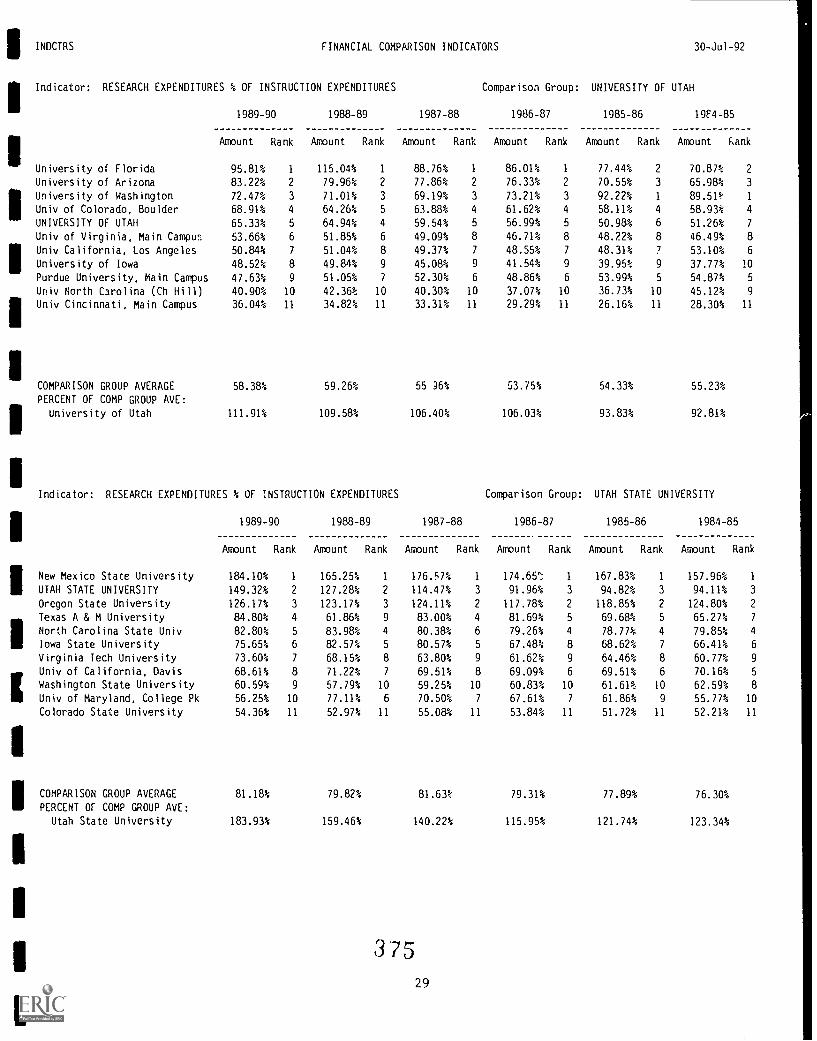
INDCTRS FINANCIAL COMPARISON INDICATORS 30-Jul-92
Indicator: RESEARCH EXPENDITURES % OF INSTRUCTION EXPENDITURES Comparison Group: UNIVERSITY OF UTAH
1989-90
Amount Rank
1988-89
Amount Rank
1987-88
Amount Rank
1986-87
Amount Rank
1985-86
Amount Rank
19F4-85
Amount kank
University of Florida 95.81% 1 115.04% 1 88.76% 1 86.01% 1 77.44% 2 70.87% 2
University of Arizona 83.22% 2 79.96% 2 77.86% 2 76.33% 2 70.55% 3 65.98% 3
University of Washington 72.47% 3 71.01% 3 69.19% 3 73.21% 3 92.22% 1 89.51% 1
Univ of Colorado, Boulder 68.91% 4 64.26% 5 63.88% 4 61.62% 4 58.11% 4 58.93% 4
UNIVERSITY OF UTAH 65.33% 5 64.94% 4 59.54% 5 56.99% 5 50.98% 6 51.26% 7
Univ of Virginia, Main Campufl 53.66% 6 51.85% 6 49.09% 8 46.71% 8 48.22% 8 46.49% 8
Univ California, Los Angeles 50.84% 7 51.04% 8 49.37% 7 48.55% 7 48.31% 7 53.10% 6
University of Iowa 48.52% 8 49.84% 9 45.08% 9 41.54% 9 39.95% 9 37.77% 10
Purdue University, Main Campus 47.63% 9 51.05% 7 52.30% 6 48.86% 6 53.99% 5 54.87% 5
Univ North Carolina (Ch Hill) 40.90% 10 42.36% 10 40.30% 10 37.07% 10 36.73% 10 45.12% 9
Univ Cincinnati, Main Campus 36.04% 11 34.82% 11 33.31% 11 29.29% 11 26.16% 11 28.30% 11
COMPARISON GROUP AVERAGE 58.38% 59.26% 55 36% 53.75% 54.33% 55.23%
PERCENT OF COMP GROUP AVE:
University of Utah 111.91% 109.58% 106.40% 106.03% 93.83% 92.81%
Indicator: RESEARCH EXPENDITURES % OF INSTRUCTION EXPENDITURES
1989-90 1988-89
Amount Rank Amount Rank
1987-88
Amount Rank
Comparison Group:
1986-87
Amount Rank
UTAH STATE UNIVERSITY
1985-86 1984-85
Amount Rank Amount Rank
New Mexico State University 184.10% 1 165.25% 1 176.57% 1 174.65; 1 167.83% 1 157.96% 1
UTAH STATE UNIVERSITY 149.32% 2 127.28% 2 114.47% 3 91.96% 3 94.82% 3 94.11% 3
Oregon State University 126.17% 3 123.17% 3 124.11% 2 117.78% 2 118.85% 2 124.80% 2
Texas A & M University 84.80% 4 61.86% 9 83.00% 4 81.69% 5 69.68% 5 65.27% 7
North Carolina State Univ 82.80% 5 83.98% 4 80.38% 6 79.26% 4 78.77% 4 79.85% 4
Iowa State University 75.65% 6 82.57% 5 80.57% 5 67.48% 8 68.62% 7 66.41% 6
Virginia Tech University 73.60% 7 68.15% 8 63.80% 9 61.62% 9 64.46% 8 60.77% 9
Univ of California, Davis 68.61% 8 71.22% 7 69.51% 8 69.09% 6 69.51% 6 70.16% 5
Washington State University 60.59% 9 57.79% 10 59.25% 10 60.83% 10 61.61% 10 62.59% 8
Univ of Maryland, College Pk 56.25% 10 77.11% 6 70.50% 7 67.61% 7 61.86% 9 55.77% 10
Colorado State University 54.36% 11 52.97% 11 55.084 11 53.84% 11 51.72% 11 52.21% 11
COMPARISON CROUP AVERAGE 81.18% 79.82% 81.63% 79.31% 77.89% 76.30%
PERCENT OF COMP GROUP AVE:
Utah State University 183.93% 159.46% 140.22% 115.95% 121.74% 123.34%
37529

INDCTRS FINANCIAL COMPARISON INDICATORS 30-Jul-92
Indicator: RESEARCH EXPENDITURES % OF INSTRUCTION EXPENDITURES Comparison Group: COMPREHENSIVE INSTITUTIONS
Univ of Nevada, Las Vegas
Univ of Southern Colorado
Eastern Washington University
Boise State University
Indiana University Northwest
SUNY College at Brockport
Univ of Wisconsin, Oshkosh
WEBER STATE UNIVERSITY
Austin Peay State University
Southern Oregon State College
Calif St Univ, Dominguez Hills
SOUTHERN UTAH UNIVERSITY
COMPARISON GROUP AVERAGE
PERCENT OF COMP GROUP AVE:
Weber State University
Southern Utah University
1989-90
Amount Rank
1988-89
Amount Rank
17.67% 1 22.24% 1
7.33% 2 4.95% 4
6.60% 3 5.81% 2
6.22% 4 5.23% 3
3.40% 5 4.86% 5
2.87% 6 2.30% 6
1.61% 7 1.15% 8
1.26% 8 1.60% 7
0.62% 9 0.79% 9
0.44% 10 0.24% 10
0.00% 11 0.00% 11
0.00% 11 0.00% 11
4.45% 4.38%
28.29% 36.54%
0.00% 0.00%
1987-88 1986-87 1985-86 1984-85
Amount Rank Amount Rank Amount Rank Amount Rank
20.63% 1 19.95% 1 16.00% 1 13.86% 1
7.41% 2 7.01% 2 6.42% 3 6.30% 2
5..,8% 4 6.68% 3 6.96% 2 5.13% 3
4.24% 5 3.41% 5 3.51% 5 3.32% 5
7.04% 3 1.69% 7 1.24% 7 1.07% 7
2.51% 6 2.11% 6 2.05% 6 1.43% 6
0.75% 8 0.62% 8 0.58% 8 0.63% 8
1.92% 7 0.56% 9 0.40% 9 0.46% 9
0.49% 9 0.07% 10 0.04% 10 0.04% 10
0.00% 10 0.00% 11 0.04% 10 0.04% 10
0.00% 10 6.24% 4 4.97% 4 4.12% 4
0.00% 10 0.00% 11 G.00% 12 0.00% 12
4.31% 4.67%
44.53%
0.00%
11.99%
0.00%
4.11% 3.53%
9.73%
0.00%
13.03%
Indicator: RESEARCH EXPENDITURES % OF INSTRUCTION EXPENDITURES Comparison Group: COMMUNITY COLLEGES
0.00%
1989-90 1988-89 1987-88 1986-87 1985-86 1984-85
Amount Rank Amount Rank Amount Rank Amount Rank Amount Rank Amount Rank
Onondaga Community College
SNOW COLLEGE
12.67%
0.22%
1
2
13.30%
0.22%
1
2
1.08%
0.28%
1
2
1.15%
0.31%
3
4
1.66%
0.47%
1
2
1.56%
0 .22%
1
2
Anne Arundel Comm College 0.00% 3 0.00% 3 0.00% 3 1.54% 2 0.00% 3 0.00% 3
UTAH VALLEY COMMUNITY COLLEGE 0.00% 3 0.00% 3 0.00% 3 4.80% 1 0.00% 3 0.00% 3
North Idaho College 0.00% 3 0.00% 3 0.00% 3 0.00% 5 0.00% 3 0.00% 3
COLLEGE OF EASTERN UTAH 0.00% 3 0.00% 3 0.00% 3 0.00% 5 0.00% 3 0.00% 3
SALT LAKE COMMUNITY COLLEGE 0.00% 3 0.00% 3 0.00% 3 0.00% 5 0.00% 3 0.00% 3
Joliet Junior College 0.00% 3 0.00% 3 0.00% 3 0.00% 5 0.00% 3 0.00% 3
Yavapai College 0.00% 3 0.00% 3 0.00% 3 0.00% 5 0.00% 3 0.00% 3
DIXIE COLLEGE 0.00% 3 0.00% 3 0.00% 3 0.00% 5 0.00% 3 0.00% 3
Chemeketa Community College 0.00% 3 0.00% 3 0.00% 3 0.00% 5 0.00% 3 0.00% 3
Grand Rapids Junior College 0.00% 3 0.00% 3 0.00% 3 0.00% 5 0.00% 3 0.00% 3
Danville Community College 0.00% 3 0.00% 3 0.00% 3 0.00% 5 0.00% 3 0.00% 3
Western Wyoming Comm College 0.00% 3 0.00% 3 0.00% 3 0.00% 5 0.00% 3 0.00% 3
Spokane Community College -- 15 0.00% 3 0.00% 3 0.00% 5 0.00% 3 0.00% 3
COMPARISON GROUP AVERAGE 1.44% 1.37% 0.11% 0.22% 0.47% 0.13%
PERCENT OF COMP GROUP AVE:
Snow College 15.33% 16.10% 256.57% 140.91% 100.00% 169.23%
Utah Valley Community Colleg 0.00% 0.00% 0.00% 2181.82% 0.00% 0.00%
College of EastLrn Utah 0.00% 0.00% 0.00% 0.00% 0.00% 0.00%
Salt Lake Community College 0.00% 0.00% 0.00% 0.00% 0.00% 0.00%
Dixie College 0.00% 0.00% 0.00% 0.00% 0.00% 0.00%
376
30

INDCTRS FINANCIAL COMPARISON INDICATORS 30-Jul-92
Indicator: ACADEMIC SUPPORT EXPENDITURES PER FTE Comparison Group: UNIVERSITY OF UTAH
1989-90
Amount Rank
1988-89
Amount Rank
1987-88
Amount Rank
1986-87
Amount Rank
1985-86
Amount Rank
1984-85
Amount Rank
Univ California, Los Angeles $4,706 1 $4,231 1 $4,121 1 $4,138 1 $4,110 1 $3,216 1
University of Washington $2,668 2 $2,297 2 $1,987 3 $1,877 2 $1,504 4 $1,531 3
Univ of Virginia, Main Campus $2,458 3 $2,181 3 $2,286 2 $1,821 3 $1,829 2 $1,883 2
University of Arizona $1,825 4 $1,669 4 $1,583 4 $1,545 4 $1,525 3 $1,358 4
UNIVERSITY OF UTAH $1,608 5 $1,575 5 $1,346 6 $1,212 6 $1,195 6 $1,041 7
University of Iowa $1,512 6 $1,400 7 $1,286 7 $1,159 8 $1,068 8 $1,043 6
Univ Cincinnati, Main Campus $1,491 7 $1,286 9 $1,201 9 $1,209 7 $1,069 7 $962 8
Univ North Carolina (Ch Hill) $1,462 8 $1,477 6 $1,427 5 $1,301 5 $1,211 5 $1,118 5
University of Florida $1,455 9 $1,209 10 $1,016 10 $967 10 $391 11 $354 11
Univ of Colorado, Boulder $1,419 10 $1,311 8 $1,208 8 $1,125 9 $991 9 $895 9
Purdue University, Main Campus $840 11 $793 11 $822 11 $757 11 $754 10 $463 10
COMPARISON GROUP AVERAGE $1,984 $1,785 $1,694 $1,590 $1,445 $1,282
PERCENT OF COMP GROUP AVE:
University of Utah 81.05% 88.24% 79.46% 76.23% 82.70% 81.20%
Indicator: ACADEMIC SUPPORT EXPENDITURES PER FTE
1989-90 1988-89
Amount Rank Amount Rank
1987-88
Amount Rank
Comparison Group:
1986-87
Amount Rank
UTAH STATE UNIVERSITY
1985-86 1984-85
Amount Rank Amount Rank
Univ of California, Davis $3,851 1 $3,561 1 $3,177 1 $2,977 1 $2,699 1 $2,503 1
Washington State University $2.149 2 $1,880 2 $1,614 2 $1,499 2 $1,512 2 $1,410 2
Oregon State University $1,377 3 $1,192 4 $1,169 3 $1,077 3 $967 4 $917 5
Virginia Tech University $1,347 4 $1,319 3 $1,129 4 $1,074 4 $966 5 $929 3
Univ of Maryland, College Pk $1,190 5 $1,054 6 $810 7 $758 7 $655 8 $636 7
North Carolina State Univ $1,062 6 $1,128 5 $1,072 5 $951 5 $877 6 $929 3
Iowa State University $1,034 7 $1,018 8 $693 8 $597 9 $545 10 $530 10
UTAH STATE UNIVERSITY $1,024 8 $1,043 7 $1,011 6 $948 6 $999 3 $847 6
Colorado State University $774 9 $698 9 $649 9 $650 8 $684 7 $605 8
New Mexico State University $671 10 $606 10 $568 11 $566 10 $584 9 $575 9
Texas A & M University $498 11 $533 11 $606 10 $465 11 $292 11 $238 11
COMPARISON GROUP AVERAGE $1,215 $1,299 $1,149 $1,061 $978 $927
PERCENT OF COMP GROUP AVE:
Utah State University 73.41% 80.29% 87.99% 89.35% 102.15% 91.37%
37731

INDCTRS FINANCIAL COMPARISON INDICATORS 30-Jul-92
Indicator: ACADEMIC SUPPORT EXPENDITURES PER FTE Comparison Group: COMPREHENSIVE INSTITUTIONS
1989-90
Amount Rank
1988-89
Amount Rank
1987-88
Amount Rank
1986-87
Amount Rank
1985-86
Amount Rank
1984-85
Amount Rank
Univ of Nevada, Las Vegas $1,064 1 $1,106 1 $1,048 1 $974 2 $815 2 $734 2
Calif St Univ, Dominguez Hills $1,027 2 $872 2 $870 2 $856 3 $755 3 $721 3
Eastern Washington University $867 3 $814 3 $740 3 $630 7 $568 7 $620 4
Southern Oregon State College $776 4 $727 4 $671 4 $695 4 $631 5 $590 6
SOUTHERN UTAH UNIVERSITY $719 5 $605 8 $656 5 $1,085 1 $1,099 1 $1,008 1
Boise State University $676 6 $664 5 $606 7 $690 5 $554 8 $512 8
Univ of Wisconsin, Oshkosh $663 7 $632 6 $323 12 $318 12 $376 12 $285 12
Univ of Southern Colorado $661 8 $436 11 $504 10 $604 8 $507 9 $352 10
Indiana University Northwest $585 9 $606 7 $595 8 $682 6 $647 4 $600 5
WEBER STATE UNIVERSITY $489 10 $467 10 $521 9 $603 9 $585 6 $554 7
Austin Peay State University $444 11 $479 9 $634 6 $441 11 $381 11 $375 9
SUNY College at Brockport $421 12 $423 12 $487 11 $477 10 $492 10 $484 11
COMPARISON GROUP AVERAGE $718 $676 $648 $637 $573 $527
PERCENT OF COMP GROUP AVE:
Southern Utah University 100.14% 89.50% 101.23% 170.33% 191.80% 191.27:
Weber State University 68.11% 69.08% 80.40% 94.66% 102.09% 105.12%
Indicator: ACADEMIC SUPPORT EXPENDITURES PER FTE
1989-90 1988-89
Amount Rank Amount Rank
1987-88
Amount Rank
Comparison Group:
1986-87
Amount Rank
COMMUNITY COLLEGES
1985-86 1984-85
Amount Rank Amount Rank
Western Wyoming COM College $1,236 1 $1,132 1 $1,583 1 $1,543 1 $1,685 1 $1,627 1
Yavapai College $613 2 $537 3 $467 3 $480 4 $421 4 $206 11
UTAH VALLEY COMMUNITY COLLEGE $580 3 $481 5 $394 7 $365 8 $344 8 $224 11
North Idaho College $577 4 $347 10 $266 11 $243 12 $245 13 $210 12
SNOW COLLEGE $538 5 $494 4 $400 6 $362 9 $420 5 $408 4
Chemeketa Community College $498 6 $687 2 $1,111 2 $717 3 $416 6 $395 5
Danville Community College $485 7 $479 6 $456 4 $718 2 $670 2 $587 2
Anne Arundel Comm College $463 8 $426 7 $433 5 $416 5 $398 7 $340 6
DIXIE COLLEGE $463 9 $328 12 $258 12 $296 10 $328 10 $305 8
COLLEGE OF EASTERN UTAH $409 10 $406 8 $391 8 $397 6 $489 3 $513 3
Grand Rapids Junior College $256 11 $298 13 $95 14 $255 11 $250 12 $256 10
SALT LAKE COMMUNITY COLLEGE $211 12 $..,0 11 $288 10 $235 13 $324 11 $336 7
Onondaga Community College $167 13 $161 14 $154 13 $161 15 $153 14 $143 14
Joliet Junior College $134 14 $91 15 $87 15 $162 14 $74 15 $71 15
Spokane Community College 15 $350 9 $364 9 $386 7 $334 9 $266 9
COMPARISON GROUP AVERAGE $492 $451 $502 $508 $465 410
PERCENT OF COMP GROUP AVE:
Utah Valley Community Colleg 117.89% 106.65% 78.49% 71.85% 73.98% 54.63%
Snow College 109.35% 109.53% 79.684 71.26% 90.32% 99.51%
Dixie College 94.11% 72.73% 51.39% 58.27% 70.54% 74.39%
College of Eastern Utah 83.13% 90.02% 77.89% 78.15% 105.16% 130.00%
Salt Lake Community College 42.89% 75.39% 57.37% 46.26% 69.68% 81.95%
3 2
1
1

INDCTRS FINANCIAL COMPARISOn INDICATORS 30-Jul-92
Indicator: STUDENT SERVICES EXPENDITURES PER FTE Comparison Group: UNIVERSITY OF UTAH
1989-90
Amount Rank
1988-89
Amount Rank
1987-88
Amount Rank
1986-87
Amount Rank
1985-86
Amount Rank
1984-85
Amount Rank
Univ California, Los Angeles $1,121 1 $1,033 1 $958 1 $922 1 $926 1 $853 1
Univ of Colorado, Boulder $911 2 $752 2 $816 2 $765 2 $728 2 $673 2
University of Florida $683 3 $596 4 $563 5 $373 8 $239 11 $222 11
Univ of Virginia, Main Campus $682 4 $676 3 $634 3 $559 3 $577 3 $500 3
University of Iowa $679 5 $591 5 $573 4 $501 4 $510 4 $476 4
UNIVERSITY OF UTAH $532 6 $467 7 $418 7 $391 7 $440 6 $348 6
Univ Cincinnati, Main Campus $519 7 $441 8 $416 8 $440 5 $390 7 $337 7
University of Arizona $487 8 $484 6 $434 6 $412 6 $468 5 $405 5
University of Washington $400 9 $347 9 $364 9 $293 9 $275 9 $256 8
Univ North Carolina (Ch Hill) $350 10 $319 10 $309 10 $279 10 $271 10 $255 9
Purdue University, Main Campus $280 11 $261 11 $259 11 $261 11 $298 8 $253 10
COMPARISON GROUP AVERAGE $611 $550 $533 $481 $468 $423
PERCENT OF COMP GROUP AVE:
University of Utah 87.07% 84.91% 78.42% 81.29% 94.02% 82.27%
Indicator: STUDENT SERVICES EXPENDITURES PER FTE
1989-90 1988-89
Amount Rank Amount Rank
1987-88
Amount Rank
Comparison Group:
1986-87
Amount Rank
UTAH STATE UNIVERSITY
1985-86 1984-85
Amount Rank Amount Rank
Univ of California, Davis $1,405 1 $1,355 1 $1,233 1 $1,281 1 $1,248 1 $1,131 1
Univ of Maryland, College Pk $623 2 $553 3 $489 4 $436 2 $387 4 $442 3
Iowa State University $612 3 $715 2 $508 2 $411 4 $473 2 $449 2
New Mexico State University $586 4 $525 4 $497 3 $419 3 $452 3 $421 4
Colorado State University $483 5 $448 5 $412 6 $346 7 $342 6 $350 5
Washington State University $470 6 $416 6 $371 7 $358 6 $309 8 $317 6
UTAH STATE UNIVERSITY $423 7 $383 7 $368 8 $335 8 $342 6 $305 7
Oregon State University $399 8 $353 8 $362 9 $312 9 $294 9 $259 9
Virginia Tech University $378 9 $342 9 $419 5 $387 5 $351 5 $221 11
North Carolina State Univ $340 10 $319 10 $329 10 $296 10 $263 10 $250 10
Texas A 8 M University $206 11 $205 11 $197 11 $200 11 $207 11 $301 8
COMPARISON GROUP AVERAGE $550 $523 $482 $444 $433 $414
PERCENT OF COMP GROUP AVE:
Utah State University 76.91% 73.23% 76.35% 75.45% 78.98% 73.67%
39

INDCTRS FINANCIAL COMPARISON INDICATORS 30-Jul-92
Indicator: STUDENT SERVICES EXPENDITURES PER FTE Comparison Group: COMPREHENSIVE INSTITUTIONS
1989-90
Amount Rank
1988-89
Amount Rank
1987-88
Amount Rank
1986-87
Amount Rank
1985-86
Amount Rank
1984-85
Amount Rank
Univ of Nevada, Las Vegas $1,266 1 $1,079 1 $1,076 2 $1,100 2 $1,033 1 $1,231 1
Austin Peay State University $861 2 $912 2 $1,203 1 $782 3 $667 3 $562 3
Calif St Univ, Dominguez Hills $760 3 $743 3 $923 3 $1,165 1 $818 2 $835 2
Univ of Wisconsin, Oshkosh $729 4 $598 5 $352 10 $325 11 $324 10 $311 9
SOUTHERN UTAH UNIVERSITY $625 5 $714 4 $580 4 $360 9 $371 8 $341 6
Eastern Washington Universiy $595 6 $468 7 $470 6 $421 7 $366 9 $289 11
SUNY College at Brockport $526 7 $512 6 $576 5 $450 5 $438 4 1415 5
Univ of Southern Colorado $518 8 $467 8 $459 7 $584 4 $375 7 $443 4
WEBER STATE UNIVERSITY $428 9 $414 9 $423 8 $424 6 $389 6 $334 7
Indiana University Northwest $415 10 $380 10 $413 9 $376 8 $391 5 $332 8
Southern Oregon State College $348 11 $315 12 $310 12 $341 10 $311 11 $291 10
Boise State University $341 12 $365 11 $324 11 $302 12 $293 12 $245 12
COMPARISON GROUP AVERAGE $636 $584 $611 $585 $502 $495
PERCENT OF COMP GROUP AVE:
Southern Utah University 98.27% 122.26% 94.93% 61.54% 73.90% 68.89%Weber State C iversity 67.30% 70.89% 69.23% 72.48% 77.49% 67.47%
Indicator: STUDENT SERVICES EXPENDITJRES PER FTE
1989-90 1988-89
Amount Rank Amount Rank
1987-88
Amount Rank
Comparison Group:
1986-87
Amount Rank
COMMUNITY COLLEGES
1985-86 1984-85
Amount Rank Amount Rank
COLLEGE OF EASTERN UTAH $963 1 $756 3 $687 5 $735 2 $937 1 $630 2
SALT LAKE COMMUNITY COLLEGE $868 2 $614 5 $570 6 $449 7 $405 7 $358 8SNOW COLLEGE $814 3 $763 2 $806 2 $617 5 $535 4 $508 4
North Idaho College $756 4 $836 1 $791 3 $707 3 $702 3 $615 3
Western Wyoming Comm College $722 5 $676 4 $708 4 $852 1 $853 2 $1,431 1
Onondaga Community College $559 6 $583 6 $482 9 $427 8 $373 8 $452 6
DIXIE COLLEGE $554 7 $560 7 $515 7 $419 9 $406 6 $456 5
Grand Rapids Junior College $525 8 $530 8 $1,042 1 $672 4 $483 5 $424 7
Joliet Junior College $506 9 $293 14 $293 15 $348 11 $188 15 $155 15
UTAH VALLEY COMMUNITY COLLEGE $436 10 $391 12 $388 12 $237 15 $219 14 $252 14
Chemeketa Community College $428 11 $381 13 $484 8 $481 6 $362 9 $330 10
Anne Arundel Comm College $401 12 $412 10 $400 10 $318 13 $270 13 $259 13
Danville Community College $318 13 $285 15 $295 14 $302 14 $295 12 $260 12
Yavapai College $317 14 $401 11 $321 13 $334 12 $319 11 $350 9Spokane Community College 15 $426 9 $398 11 $366 10 $351 10 $313 11
COMPARISON GROUP AVERAGE $504 $482 $521 $481 $420 $459PERCENT OF COMP GROUP AVE:
College of Eastern Utah 191.07% 156.85% 131.86% 152.814 223.10% 137.25%Salt Lake Community College 172.22% 127.39% 109.40% 93.35% 96.43% 78.00%Snow College 161.51% 158.30% 154.70% 128.27% 127.38% 110.68%Dixie College 109.92% 116.18% 98.85% 87.11% 96.67% 99.35%Utah Valley Community Colleg 86.514 81.12% 74.474 49.27% 52.144 54.90%
1)
34

INDCTRS FINANCIAL COMPARISON INDICATORS 30-Jul-92
Indicator: SCHOLARSHIPS AND FELLOWSHIPS PER FTE Comparison Group: UNIVERSITY OF UTAH
1989-90
Amount Rank
1988-89
Amount Rank
1987-88
Amount Rank
1986-87
Amount Rank
1985-86
Amount Rank
1984-85
Amount Rank
University of Washington $1,598 1 $1,576 1 $1,174 2 $1,179 1 $1,178 1 $977 2
Univ of Virginia, Main Campus $1,578 2 $1,393 3 $1,276 1 $1,113 3 $1,155 2 $959 3
Univ California, Los Angeles $1,535 3 $1,411 2 $1,153 3 $1,153 2 $1,138 3 $1,003 1
Univ Cincinnati, Main Campus $1,291 4 $1,146 4 $1,017 5 $802 5 $778 5 $718 4
University of Iowa $1,187 5 $1,086 6 $1,015 6 $900 4 $835 4 $707 5
University of Arizona $1,078 6 $954 7 $780 7 $718 7 $662 7 $602 7
Univ North Carolina (Ch Hill) $931 7 $1,137 5 $1,079 4 $790 6 $770 6 $643 6
UNIVERSITY OF UTAH $788 8 $778 8 $637 8 $659 8 $590 8 $514 8
Univ of Colorado, Boulder $658 9 $706 9 $635 9 $558 10 $486 10 $465 9
Purdue University, Main Campus $552 10 $517 10 $520 10 $442 11 $472 11 $431 11
University of Florida $521 11 $462 11 $395 11 $593 9 $544 9 $463 10
COMPARISON GROUP AVERAGE $1,093 $1,039 $904 $825 $802 $697
PERCENT OF COMP GROUP AVE:
University of Utah 72.10% 74.88% 70.46% 79.88% 73.57% 73.74%
Indicator: SCHOLARSHIPS AND FELLOWSHIPS PER FTE
1989-90
Amount Rank
1988-89
Amount Rank
1987-88
Amount Rank
Comparison Group:
1986-87
Amount Rank
UTAH STATE UNIVERSITY
1985-86 1984-85
Amount Rank Amount Rank
Washington State University $1,343 1 $1,295 1 $651 6 $623 7 $579 7 $481 9
UTAH STATE UNIVERSITY t',191 2 $972 3 $894 1 $815 1 $799 2 $700 1
Univ of California, Davis $1,144 3 $995 2 $841 2 $797 2 $772 3 $674 3
Texas A 8 M University $995 4 $931 4 $588 9 $721 5 $862 1 $322 11
Iowa State University $977 5 $916 5 $822 4 $739 4 $653 5 $529 7
Univ of Maryland, College Pk $951 6 $806 7 $544 10 $464 11 $455 11 :432 10
New Mexico State University $928 7 $821 6 $701 5 $681 6 $634 6 !,541 4
Oregon State University $852 8 $799 8 $833 3 $757 3 $746 4 $691 2
Colorado State University $803 9 $753 9 $623 8 $610 8 $610 9 $541 4
Virginia Tech University $695 10 $614 11 $518 11 $479 10 $479 10 $537 6
North Carolina State Univ $675 11 $661 10 $628 7 $579 9 $573 8 $514 8
COMPARISON GROUP AVERAGE $936 $859 $675 $645 $636 $526
PERCENT OF COMP GROUP AVE:
Utah State University 127.24% 113.15% 132.44% 126.36% 125.63% 133.08%
353

1NDCTRS FINANCIAL COMPARISON INDICATORS 30-Jul-92
Indicator: SCHOLARSHIPS AND FELLOWSHIPS PER FTE
1989-90 1988-89 1987-88
Comparison Group: COMPREHENSIVE INSTITUTIONS
1986-87 1985-86 1984-85
Univ of Southern Colorado
Eastern Washington University
SOUTHERN UTAH UNIVERSITY
Southern Oregon State College
SUNY College at Brockport
WEBER STATE UNIVERSITY
Indiana University Northwest
Boise State University
Austin Peay State University
Univ of Wisconsin, Oshkosh
Univ of Nevada, Las Vegas
Calif St Univ, Dominguez Hills
COMPARISON GROUP AVERAGE
PERCENT OF COMP GROUP AVE:
Southern Utah University
Weber State University
Amount
$1,218
$1,201
$1,179
$952
$882
$836
$761
$716
$675
$566
$407
$362
$774
152.33%
108.01%
Rank
1
2
3
4
5
6
7
8
9
10
11
12
Amount
$1,123
$1,110
$1,089
$961
$905
$752
$740
$768
$614
$558
$416
$354
$755
144.24%
99.60%
Rank
1
2
3
4
5
7
8
6
9
10
11
12
Amount
$980
$894
$909
$901
$815
$587
$607
$179
$654
$424
$343
$286
$608
149.51%
96.55%
Rank
1
4
2
3
5
8
7
12
6
9
10
11
Amount
$984
$602
$895
$995
$1,454
$594
$572
$194
$440
$417
$354
$299
$631
141.84%
94.14%
Rank
3
5
4
2
1
6
7
12
8
9
10
11
Amount
$904
$541
$880
$1,000
$1,206
$585
$626
$597
$451
$443
$418
$248
$643
136.86%
90.98%
Rank
3
8
4
2
1
7
5
6
9
10
11
12
Amount
$705
$427
$820
$880
$1,145
$508
$478
$500
$407
$376
$222
$222
$536
152.99%
94.78%
Indicator: SCHOLARSHIPS AND FELLOWSHIPS PER FTE Comparison Group: COMMUNITY COLLEGES
Rank
II4
8
3 II2
1
5
6 I7
9
10
11 I11
I
I
I1989-90 1988-89 1987-88 1986-87 1985-86 1984-85 I
Amount Rank Amount Rank Amount Rank Amount Rank Amount Rank Amount
North Idaho College $1,088 1 $1,134 1 $1,043 1 $1,087 1 $1,093 1 $839
DIXIE COLLEGE $1,044 2 $970 4 $730 4 $590 4 $548 5 $482
COLLEGE OF EASTERN UTAH $1,007 3 $1,053 2 $894 2 $864 2 $851 2 $957
SALT LAKE COMMUNITY COLLEGE $815 4 $848 5 $586 7 $455 7 $457 8 $387
UTAH VALLEY COMMUNITY COLLEGE $763 5 $665 8 $451 8 $455 7 $422 11 $338
Onondaga Community College $734 6 $698 6 $652 5 $603 3 $366 12 $297
SNOW COLLEGE $731 7 $689 7 $622 6 $502 6 $575 4 $442
Western Wyoming Comm College $606 8 $552 9 $351 11 $212 13 $151 15 $444
Chemeketa Community College $555 9 $500 10 $441 9 $406 10 $452 9 $391
Grand Rapids Junior College $507 10 $494 11 $404 10 $412 9 $432 10 $420
Danville Community College $394 11 $406 12 $335 12 $338 11 $487 7 $323
Yavapai CoIlege $312 12 $294 13 $266 13 $249 12 $311 13 $259
Joliet Junior College $237 13 $241 14 $172 14 $202 14 $722 3 $540
Anne Arundel Comm College $139 14 $122 15 $105 15 $74 15 $256 14 $225
Spokane Community College 15 $1,044 3 $801 3 $537 5 $502 6 $376
COMPARISON GROUP AVERAGE $508 $549 $457 $412 $477 $411
PERCENT OF COMP GROUP AVE:
Dixie College 205.51% 176.68% 159.74% 143.20% 114.88% 117.27%
College of Eastern Utah 198.23% 191.80% 195.62% 209.71% 178.41% 232.85%
Salt Lake Community College 160.43% 154.46% 128.23% 110.44% 95.81% 94.16%
Utah Valley Cnmmunity Colleg 150.20% 121.13% 98.69% 110.44% 88.47% 82.24%
Snow College 143.90% 125.50% 136.11% 121.84% 120.55% 107.54%
:3 2
3 6
Rank
2
114
1
9
11 I13
6
5
8 I7
12
14
3 I15
10
I

INDCTRS FINANCIAL COMPARISON INDICATORS 30-Jul-92
Indicator: INSTITUTIONAL SUPPORT EXPENDITURES PER FTE Comparison Group: UNIVERSITY OF UTAH
1989-90
Amount Rank
1988-89
Amount Rank
1987-88
Amount Rank
1986-87
Amount Rank
1985-86
Amount Rank
1984-85
Amount Rank
Univ California, Los Angeles $2,038 1 $2,075 2 $1,627 2 $1,503 2 $1,928 1 $1,763 1
University of Florida $1,841 2 $3,182 I $2,151 1 $1,818 1 $1,857 2 $1,703 2
University of Washington $1,700 3 $1,728 3 $1,457 3 $1,401 3 $1,357 3 $1,305 3
Univ of Virginia, Main Campus $1,617 4 $1,222 6 $1,178 5 $1,012 7 $905 7 $855 6
Univ North Carolina (Ch Hill) $1,338 5 $1,208 7 $1,159 7 $1,093 4 $1,023 4 $901 5
University of Arizona $1,288 6 $1,225 5 $1,173 6 $1,045 6 $915 6 $696 8
UNIVERSITY OF UTAH $1,155 7 $1,234 4 $1,068 8 $1,055 5 $997 5 $905 4
Univ of Colorado, Boulder $935 8 $884 9 $880 9 $792 9 $738 8 $755 7
University of Iowa $917 9 $925 8 $619 11 $473 11 $436 11 $415 11
Purdue University, Main Campus $822 10 $743 10 $736 10 $717 10 $628 10 $623 10
Univ Cincinnati, Main Campus $724 11 $702 11 $1,201 4 $944 8 $669 9 $675 9
COMPARISON GROUP AVERAGE $1,322 $1,389 $1,218 $1,080 $1,046 $969
PERCENT OF COMP GROUP AVE:
University of Utah 87.37% 88.84% 87.68% 97.69% 95.32% 93.40%
Indicator: INSTITUTIONAL SUPPORT EXPENDITURES PER FTE
1989-90 1988-89
Amount Rank Amount Rank
1987-88
Amount Rank
Comparison Group:
1986-87
Amount Rank
UTAH STATE UNIVERSITY
1985-86 1984-85
Amount Rank Amount Rank
Texas A 8 M University $2,376 1 $1,909 1 $2,086 1 $1,812 2 $1,664 1 $1,390 1
Univ of California, Davis $1,469 2 $1,377 2 $1,214 2 $2,456 1 $1,398 2 $1,197 2
Washington State University $1,455 3 $1,230 3 $1,177 3 $1,122 3 $1,014 3 $935 3
Oregon State University $1,279 4 $1,052 8 $1,006 5 $908 6 $796 7 $667 9
Colorado State University $1,204 5 $1,099 4 $1,141 4 $1,070 4 $780 8 $780 5
Virginia Tech University $1,148 6 $872 10 $849 9 $893 7 $899 4 $868 4
North Carolina State Univ $1,066 7 $1,075 6 $993 6 $892 8 $807 6 $723 6
Univ of Maryland, College Pk $985 8 $1,094 5 $908 8 $736 9 $688 9 $692 8
UTAH STATE UNIVERSITY $982 9 $1,052 7 $705 10 $948 5 $893 5 $695 7
Iowa State University $773 10 $904 9 $943 7 $466 11 $433 11 $375 11
New Mexico State University $714 11 $606 11 $554 11 $471 10 $491 10 $450 10
COMPARISON GROUP AVERAGE $1,247 $1,122 $1,087 $1,083 $897 $808
PERCENT OF COMP GROUP AVE:
Utah State University 78.75% 93.76% 64.86% 87.53% 99.55% 86.01%
35337

1NDCTRS FINANCIAL COMPARISON INDICATORS 30-Jul-92
Indicator: INSTITUTIONAL SUPPORT EXPENDITURES PER FTE Comparison Group: COMPREHENSIVE INSTITUTIONS
1989-90
Amount Rank
1988-89
Amount Rank
1987-88
Amount Rank
1986-87
Amount Rank
1985-86
Amount Rank
1984-85
Amount Rank
Calif St Univ, Dominguez Hills $1,565 1 $1,582 1 $1,651 1 $1,472 1 $2,273 1 $1,695 1
SUNY College at Brockport $1,253 2 $1,260 2 $1,387 2 $973 3 $1,171 3 $1,058 2
Eastern Washington University $1,113 3 $858 4 $735 6 $676 6 $721 6 $610 6
Univ of Nevada, Las Vegas $1,021 4 $998 3 $989 1 $833 4 $868 4 $729 5
SOUTHERN UTAH UNIVERSITY $792 5 $816 5 $764 5 $749 5 $846 5 $777 4
Univ of Southern Colorado $770 6 $714 7 $725 7 $1,374 2 $1,300 2 $1,043 3
Southern Oregon State College $722 7 $643 8 $639 8 $646 8 $597 8 $592 7
Austin Peay State University $702 8 $773 6 $940 4 $671 7 $566 9 $445 11
WEBER STATE UNIVERSITY $616 9 $610 10 $553 10 $575 9 $645 7 $572 8
Boise State University $595 10 $613 9 $563 9 $542 10 $540 10 $482 9
Univ of Wisconsin, Oshkosh $561 11 $471 12 $402 11 $352 12 $371 11 $366 12
Indiana University Northwest $501 12 $478 11 $350 12 $360 11 $521 12 $456 10
COMPARISON GROUP AVERAGE $880 $839 $838 $790 $893 $748
PERCENT OF COMP GROUP AVE:
Southern Utah University 90.00% 97.26% 91.17% 94.81% 94.74% 103.884
Weber State University 70.00% 72.71% 65.99% 72.784 72.23% 76.47%
Indicator: INSTITUTIONAL SUPPORT EXPENDITURES PER FTE
1989-90 1988-89
Amount Rank Amourt Rank
1987-88
Amount Rank
Comparison Group:
1986-87
Amount Rank
COMMUNITY COLLE
1985-86
Amount Rank
1984-85
Amount Rank
Onondaga Community College $1,423 1 $1,503 1 $1,407 1 $1,286 2 $1,405 2 $1,067 2
Yavapai College $1,092 2 $988 3 $999 5 $1,059 5 $923 6 $786 6
SNOW COLLEGE $1,034 3 $1,034 2 $1,072 4 $905 7 $1,032 5 $1,019 3
Chemeketa Community College $1,019 4 $966 4 $1,168 2 $1,166 3 $1,087 4 $977 4
COLLEGE OF EASTERN UTAH $978 5 $964 5 $1,079 3 $1,062 4 $1,199 3 $1,371 1
UTAH VALLEY COMMUNITY COLLEGE $813 6 $881 6 $750 9 $923 6 $834 7 $708 7
North Idaho College $713 7 $701 11 $601 13 $622 11 $649 10 $576 9
Danville Community College $706 8 $800 7 $777 7 $753 8 $756 9 $610 8
DIXIE COLLEGE $679 9 $712 9 $768 8 $720 9 $793 8 $520 12
Western Wyoming Comm College $672 10 $599 12 $849 6 $1,514 1 $2,303 1 $904 5
Joliet Junior College $640 11 $707 10 $617 11 $509 14 $525 13 $537 11
SALT LAKE COMMUNITY COLLEGE $632 12 $777 8 $678 10 $634 10 $600 11 $562 10
Anne Arundel Comm College $594 13 $562 13 $572 14 $560 12 $589 12 $508 13
Grand Rapids Junior College $309 14 $268 15 $603 12 $161 15 $203 15 $188 15
Spokane Community College 15 $560 14 $529 15 $541 13 $493 14 $443 14
COMPARISON GROUP AVERAGE $796 $765 $812 $817 $893 $660PERCENT OF COMP GROUP AVE:
Snow College 129.90% 135.16% 132.02% 110.77% 115.57% 154.39%College of Eastern Utah 122.86% 126.01% 132.88% 129.99% 134.27% 207.73%Utah Valley Community Colleg 102.14% 115.16% 92.36% 112.97% 93.39% 107.27%
Dixie College 85.30% 93.07% 94.58% 88.13% 88.80% 78.79%Salt Lake Community College 79.40% 101.57% 83.50% 77.60% 67.19% 85.15%
38
p

INDCTRS FINANCIAL COMPARISON INDICATORS 30-Jul-92
Indicator: PHYSICAL PLANT 0 & M EXPENDITURES PER FTE Comparison Group: UNIVERSITY OF UTAH
1989-90
Amount Rank
1988-89
Amount Rank
1987-88
Amount Rank
1986-87
Amount Rank
1985-86
Amount Rank
1984-85
Amount Rank
Univ North Carolina (Ch Hill) $1,973 1 $1,770 1 $2,074 1 $1,868 1 $1,654 1 $1,315 1
Univ California, Los Angeles $1,771 2 $1,766 2 $1,411 3 $1,318 3 $1,293 2 $1,232 2
University of Washington $1,744 3 $1,542 3 $1,416 2 $1,414 2 $1,238 3 $1,085 3
University of Florida $1,267 4 $1,216 4 $1,024 8 $922 10 $1,042 6 $1,041 4
University of Iowa $1,241 5 $1,078 7 $1,208 4 $1,033 7 $996 8 $893 8
Purdue University, Main Campus $1,227 6 $1,193 5 $1,184 5 $1,172 4 $1,060 5 $999 6
Univ Cincinnati, Main Campus $1,098 7 $975 10 $965 10 $1,029 8 $937 9 $862 10
Univ of Virginia, Main Campus $1,081 8 $1,167 6 $1,158 6 $1,085 6 $1,008 7 $918 7
University of Arizona $1,059 9 $997 9 $985 9 $954 9 $869 10 $890 9
UNIVERSITY OF UTAH $1,030 10 $1,058 8 $1,089 7 $1,103 5 $1,142 4 $1,012 5
Univ of Colorado, Boulder $592 11 $588 11 $569 11 $562 11 $537 11 545 11
COMPARISON GROUP AVERAGE $1,305 $1,229 $1,199 $1,136 $1,063 $998
PERCENT OF COMP GROUP AVE:
University of Utah 78.93% 86.09% 90.83% 97.10% 107.43% 101.40%
Indicator: PHYSICAL PLANT 0 & M EXPENDITURES PER FTE
1989-90 1988-89
Amount Rank Amount Rank
1987-88
Amount Rank
Comparison Group:
1986-87
Amount Rank
UTAH STATE UNIVERSITY
1985-86 1984-85
Amount Rank Amount Rank
Univ of California, Davis $1,973 1 $1,894 1 $1,723 1 $1,633 1 $1,595 1 $1,482 1
Univ of Maryland, College Pk $1,499 2 $1,080 5 $1,061 4 $780 10 $949 6 $890 7
North Carolina State Univ $1,254 3 $1,169 2 $1,156 2 $1,056 3 $1,049 4 $976 4
Washington State University $1,231 4 $1,168 3 $1,108 3 $1,144 2 $1,030 5 $1,045 3
Iowa State University $1,099 5 $997 6 $880 9 $889 7
8
$892 6
Texas A & M University $1,052 6 $1,084 4 $1,017 5 $974 4 $1$,16946 2 $1,241 2
Virginia Tech University $925 7 $886 9 $820 10 $843 8 $694 11 $694 11
UTAH STATE UNIVERSITY $885 8 $976 7 $979 6 $924 5 $1,059 3 $975 5
Colorado State University $877 9 $893 8 $906 8 $894 6 $843 8 $780 9
Oregon State University $876 10 $832 10 $916 7 $833 9 $754 9 $795 8
New Mexico State University $838 11 $818 11 $747 11 $690 11 $742 10 $726 10
COMPARISON GROUP AVERAGE $1,162 $1,082 $1,033 $974 $972 $952
PERCENT OF COMP GROUP AVE:
Utah State University 76.16% 90.20% 94.77% 94.87% 108.95% 102.42%
35539

INDCTRS FINANCIAL COMPARISON INDICATORS 30-Jul-92
Indicator: PHYSICAL PLANT 0 & M EXPENDITURES PER FTE Comparison Group: COMPREHENSIVE INSTITUTIONS
1989-90
Amount Rank
1988-89
Amount Rank
1987-88
Amount Rank
1986-87
Amount Rank
1985-86
Amount Rank
SUNY College at Brockport $1,030 1 $994 2 $1,103 1 $1,008 2 $992 1
Eastern Washington University $973 2 $1,016 1 $1,032 2 $1,070 1 $887 3
Calif St Univ, Dominguez Hills $920 3 $921 4 $839 4 $951 4 $471 12
Univ of Nevada, Las Vegas $873 4 $924 3 $922 3 $1,000 3 $950 2
SOUTHERN UTAH UNIVERSITY $780 5 $756 6 $754 8 $781 5 $864 4
Indiana University Northwest $733 6 $734 7 $810 7 $767 6 $735 6
Univ of Southern Colorado $691 7 $769 5 $839 4 $690 8 $627 8
Austin Peay State University $610 8 $650 8 $820 6 $596 9 $577 9
Southern Oregon State College $588 9 $518 11 $537 11 $583 10 $479 11
WEBER STATE UNIVERSITY $582 10 $560 10 $692 9 $694 7 $739 5
Boise State University $534 11 $604 9 $564 10 $504 11 $638 7
Univ of Wisconsin, Oshkosh $517 12 $480 12 $527 12 $488 12 $521 10
COMPARISON GROUP AVERAGE $747 $761 $799 $766 $688
PERCENT OF COMP GROUP AVE:
Southern Utah University 104.42% 99.34% 94.37% 101.96% 125.58%
Weber State University 77.91% 73.59% 86.61% 90.60% 107.41%
Indicator: PHYSICAL PLANT 0 & M EXPENDITURES PER FTE
1989-90 1988-89
Amount Rank Amount Rank
1987-88
Amount Rank
Comparison Group:
1986-87
Amount Rank
Western Wyoming Comm College $1,805 1 $1,417 1 $1,520 1 $1,294 1
SNOW COLLEGE $921 2 $881 2 $1,051 2 $908 2
DIXIE COLLEGE $749 3 $600 6 $566 6 $580 5
North Idaho College $718 4 $710 4 $692 4 $763 4
Onondaga Community College $713 5 $752 3 $649 5 $578 6
COLLEGE OF EASTERN UTAH $661 6 $704 5 $814 3 $793 3
SALT LAKE COMMUNITY COLLEGE $566 7 $577 7 $493 9 $535 8
Yavapai College $552 8 $511 10 $519 7 $521 9
Joliet Junior College $547 9 $516 8 $491 10 $536 7
UTAH VALLEY COMMUNITY COLLEGE $547 10 $477 12 $456 13 $490
Grand Rapids Junior College $469 11 $482 11 $468 11 $246 15
Anne Arundel Comm College $432 12 $407 14 $421 14 $434 12
Chemeketa Community College $417 13 $425 13 $509 8 $430 13
Danville Community College $298 14 $310 15 $379 15 $429 14
Spokane Community College 15 $514 9 $456 12 $481 11
COMPARISON GROUP AVERAGE $661 $604 $610 $571
PERCENT OF COMP GROUP AVE:
Snow College 139.33% 145.86% 172.30% 159.02%
Dixie College 113.31% 99.34% 92.79% 101.58%
College of Eastern Utah 100.00% 116.56% 133.44% 138.88%
Salt Lake Community College 85.63% 95.53% 80.82% 93.70%
Utah Valley Community Colleg 82.75% 78.97% 74.75% 85.81%
:3
40
1984-85
Amount Rank
$1,008 1
$889 3
$747 5
$990
$748
$684 7
$524 9
$514 11
$525 8
$707 6
$459 12
$522 10
$686
109.04%
103.06%
ICOMMUNITY COLLEGES
1985-86 1984-85
IAmount Rank Amount Rank
$1,150 1
$837 7 1I$1,023 2 $1,0
$620 6 $623 5
$802 4 $718 4
$602 7
rg63
111$882 3
$481 9 $417 12
$491 8 $440 10
$674 5
$448 13 1532970 1310 I$469 11 $440 10
$481 9 $465 8
$336 15 15
$386 14 131380 14
$458 12 $444 9
i$585 $509
174.87%
105.98%
150.77%
82.22%
76.58%
203.73%
122.40%
153.44%
81.93%
76.62%

INDCTRS FINANCIAL COMPARISON INDICATORS 30-Jul-92
Indicator: TOTAL EXPENDITURES AND TRANSFERS PER FTE Comparison Group: UNIVERSITY OF UTAH
1989-90
Amount Rank
1988-89
Amount Rank
1987-88
Amount Rank
1986-87
Amount Rank
1985-86
Amount Rank
1984-85
Amount Rank
Univ California, Los Angeles $31,564 1 $29,380 1 $27,203 1 $25,471 1 $24,683 1 $22,001 I
Univ North Carolina (Ch Hill) $26,920 2 $24,993 3 $23,836 2 $21,860 2 $20,525 2 $19,845 2
University of Washington $26,577 3 $25,094 2 $21,754 3 $20,710 3 $17,915 3 $16,677 3
University of Florida $22,891 4 $21,124 4 $18,711 4 $16,291 4 $14,879 4 $13,728 4
Univ of Virginia, Main Campus $21,005 5 $18,961 5 $17,424 5 $15,803 5 $14,131 6 $12,935 6
UNIVERSITY OF UTAH $18,948 5 $17,789 6 $15,831 6 $15,035 6 $14,417 5 $13,028 5
University of Iowa $17,224 7 $15,951 7 $13,905 8 $12,112 10 $11,599 9 $10,732 9
University of Arizona $16,978 8 $15,745 8 $15,402 7 $14,681 7 $13,785 7 $12,444 7
Univ Cincinnati, Main Campus $15,565 9 $13,939 9 $13,240 10 $13,173 6 $11,233 10 $10,302 10
Purdue University, Main Campus $13,955 10 $13,293 10 $13,271 9 $12,747 9 $11,932 8 $10,742 8
Univ of Colorado, Boulder $13,327 11 $12,821 11 $11,766 11 $10,828 11 $9,158 11 $8,674 11
COMPARISON GROUP AVERAGE $20,601 $19,130 $17,651 $16,368 $14,984 $13,808
PERCENT OF COMP GROUP AVE:
University of Utah 91.98% 92.99% 89.69% 91.86% 96.22% 34.35%
Indicator: TOTAL EXPENDITURES AND TRANSFERS PER FTE
1989-90 1988-89
Amount Rank Ampunt RaCK
1987-88
Amount Rank
Comparison Group:
1986-87
Amount Rank
UTAH STATE UNIVERSITY
1985-86 1984-85
Amount Rank Amount Rank
Univ of California, Davis $29,502 1 $27,702 1 $25,052 1 $25,152 1 $22,226 1 $20,229 1
North Carolina State Univ $18,423 2 $17,947 2 $17,324 2 $15,590 2 $14,862 2 $13,600 2
UTAH STATE UNIVERSITY $17,339 3 $16,198 3 $14,833 4 $13,760 5 $13,647 4 $11,923 4
Texas A & M University $17,254 4 $15,293 7 $13,295 7 $14,418 4 $14,217 3 $11,842 5
Virginia Tech University $17,149 5 $15,420 5 $14,354 5 $13,427 6 $12,534 6 $11,748 6
Oregon State University $16,739 6 $15,430 4 $15,937 3 $14,495 3 $13,428 5 $12,636 3
Washington State University $16,584 7 $15,410 6 $13,549 6 $13,212 7 $12,321 7 $11,639 7
Iowa State University $15,419 8 $14,022 9 $12,662 10 $10,611 11 $9,778 10 $9,495 10
Univ of Maryland, College Pk $15,400 9 $14,859 8 $12,781 9 $11,186 10 $9,399 11 $8,939 11
New Mexico State University $14,973 10 $13,390 10 $12,825 8 $12,570 8 $12,190 8 $11,061 8
Colorado State University 514,149 11 $13,120 11 $11,927 11 $11,467 9 $10,960 9 $10,104 9
COMPARISON GROUP AVERAGE $17,559 $16,259 $14,971 $14,213 $13,192 $12,129
PERCENT OF COMP GROUP AVE:
Utah State University 98.75% 99.62% 99.08% 96.81% 103.45% 98.30%
3 S
4 1

INDCTRS FINANCIAL COMPARISON INDICATORS 30-Jul-92
Indicator: TOTAL EXPENDITURES AND TRANSFERS PER FTE Comparison Group: COMPREHENSIVE INSTITUTIONS
1989-90
Amount Rank
1988-89
Amount Rank
1987-88
Amount Rank
1986-87
Amount Rank
1985-86
Amount Rank
1984-85
Amount Rank
Calif St Univ, Dominguez Hills $10,297 1 $9,834 1 $9555 1 $9,862 1 $8,723 2 $8,129 2
SUNY College at Brockport $9,049 2 $8,853 2 $9,279 2 $9,497 2 $9,169 1 $9,061 1
Univ of Nevada, Las Vegas $8,961 3 $8,291 3 $7,974 4 $7,735 3 $7,295 3 $6,883 3
Eastern Washington University $8,796 4 $8,141 4 $7,652 5 $6,980 5 $6,235 6 $5,813 5
SOUTHERN UTAH UNIVERSITY $7,677 5 $6,992 8 $6,517 8 $6,460 6 $6,951 4 $6,260 4
Univ of Southern Colorado $7,102 6 $7,138 5 $6,819 6 $7,315 4 $6,394 5 $5,494 7
Southern Oregon State College $6,928 7 $6,559 10 $6,196 9 $6,420 7 $5,737 9 $5,348 8
Boise State University $6,739 8 $7,110 6 $5,738 10 $5,646 11 $5,819 8 $4,960 10
Austin Peay State University $6,737 9 $7,011 7 $8,833 3 $6,296 8 $5,367 11 $4,714 12
Univ of Wisconsin, Oshkosh $6,618 10 $6,072 11 $5,649 12 $5,125 12 $5,147 12 $4,746 11
Indiana University Northwest $6,606 11 $6,747 9 $6,525 7 $5,995 10 $5,721 10 $5,029 9
WEBER STATE UNIVERSITY $6,247 12 $6,047 12 $5,688 11 $6,197 9 $6,028 7 $5,584 6
COMPARISON GROUP AVERAGE $7,783 $7,576 $7,422 $7,087 $6,561 $6,018
PERCENT OF COMP GROUP AVE:
Southern Utah University 98.64% 92.29% 87.81% 91.15% 105.94% 104.02%
Weber State University 80.26% 79.82% 76.64% 87.44% 91.88% 92.79%
Indicator: TOTAL EXPENDITURES AND TRANSFERS PER FTE
1989-90 1988-89
Amount Rank Amount Rank
1987-88
Amount Rank
Comparison Group:
1986-87
Amount Rank
COMMUNITY COLLEGES
1985-86 1984-85
Amount Rank Amount Rank
Western Wyoming Comm College $9,072 1 $8,260 1 $9,132 1 $10,099 1 $10,918 1 $8,284 1
North Idaho College $7,123 2 $6,920 3 $6,552 4 $6,547 2 $6,853 3 $5,956 4
Onondaga Community College $6,880 3 $6,962 2 $5,962 6 $5,260 6 $5,044 7 $4,516 8
SNOW COLLEGE $6,842 4 $6,860 4 $7,234 2 $6,055 5 $6,751 4 $6,098 3
COLLEGE OF EASTERN UTAH $6,657 5 $5,976 6 $6,239 5 $6,260 4 $7,049 2 $6,959 2
Chemeketa Community College $6,426 6 $6,025 5 $6,746 3 $6,507 3 $5,756 5 $5,316 5
DIXIE COLLEGE $6,250 7 $5,856 8 $5,231 8 $4,661 11 $4,745 8 $4,427 9
Grand Rapids Junior College $5,713 8 $5,582 9 $5,923 7 $4,856 8 $4,745 8 $4,755 6
SALT LAKE COMMUNITY COLLEGE $5,632 9 $5,924 7 $5,073 9 $4,800 10 $4,670 10 $4,328 10
UTAH VALLEY COMMUNITY COLLEGE $5,176 10 $4,863 12 $4,296 14 $4,528 13 $4,154 14 $3,770 13
Yavapai College $5,033 11 $4,788 13 $4,785 12 $4,822 9 $4,372 11 $4,214 11
Joliet Junior College $4,908 12 $4,663 14 $4,408 13 $4,253 14 $4,006 15 $3,741 15
Danville Community College $4,775 13 $4,892 11 $4,868 11 $5,218 7 $5,046 6 $4,549 7
Anne Arundel Comm College $4,510 14 $4,213 15 $4,272 15 $4,244 15 $4,243 13 $3,887 12
Spokane Community College 15 $5,525 10 $4,970 10 $4,628 12 $4,313 12 $3,770 13
COMPARISON GROUP AVERAGE $6,049 $5,783 $5,762 $5,643 $5,530 $4,899
PERCENT OF COMP GROUP AVE:
Snow College 113.11% 118.62% 125.55% 107.30% 122.08% 124.47%
College of Eastern Utah 110.05% 103.34% 108.28% 110.93% 127.47% 142.05%
Dixie College 103.32% 101.26% 90.78% 82.60% 85.80% 90.37%
Salt Lake Community College 93.11% 102.44% 88.04% 85.06% 84.45% 88.34%
Utah Valley Community Colleg 85.57% 84.09% 74.56% 80.24% 75.12% 76.95%
4 2

TAB LCOMPARISONS
Explanation and Analysis 1
FIGURE 1 & 2 Financial Indicators Profile 1989-90, UofU and USU 2
FIGURE 3 & 4 Financial Indicators Profile 1989-90, WSU and SUU 3
FIGURE 5 & 6 Financial Indicators Profile 1989-90, Snow and Dixie 4
FIGURE 7 & 8 Financial Indicators Profile 1989-90, CEU and UVCC 5
FIGURE 9 Financial Indicators Profile 1989-90, SLCC 6
Fall FTE Enrollment, 1984-85 to 1989-90 7
Tax Funds Appropriations per FTE 9
Tax Appropriations % of Education & General Revenues 11
Tuition and Fees per FTE 13
Tuition and Fees % of Instruction Direct Expenditures 15
Endowment Revenue per FTE 17
Government Grants & Contracts per FTE 19
Private Gifts, Grants & Contracts per FTE 21
Total Revenues per FTE 23
Instruction Expenditures per FTE 25
Research Expenditures per FTE 27
Research Expenditures % of Instruction Expenditures 29
Academic Support Expenditures per FTE 31
Student Services Expenditures per FTE 33
Scholarships & Fellowships per FTE 35
3

TAB LCOMPARISONS
--Continued--
Institutional Support Expenditures per FTE 37
Physical Plant 0 & M Expenditures per FTE 39
Total Expenditures and Transfers per FTE 41
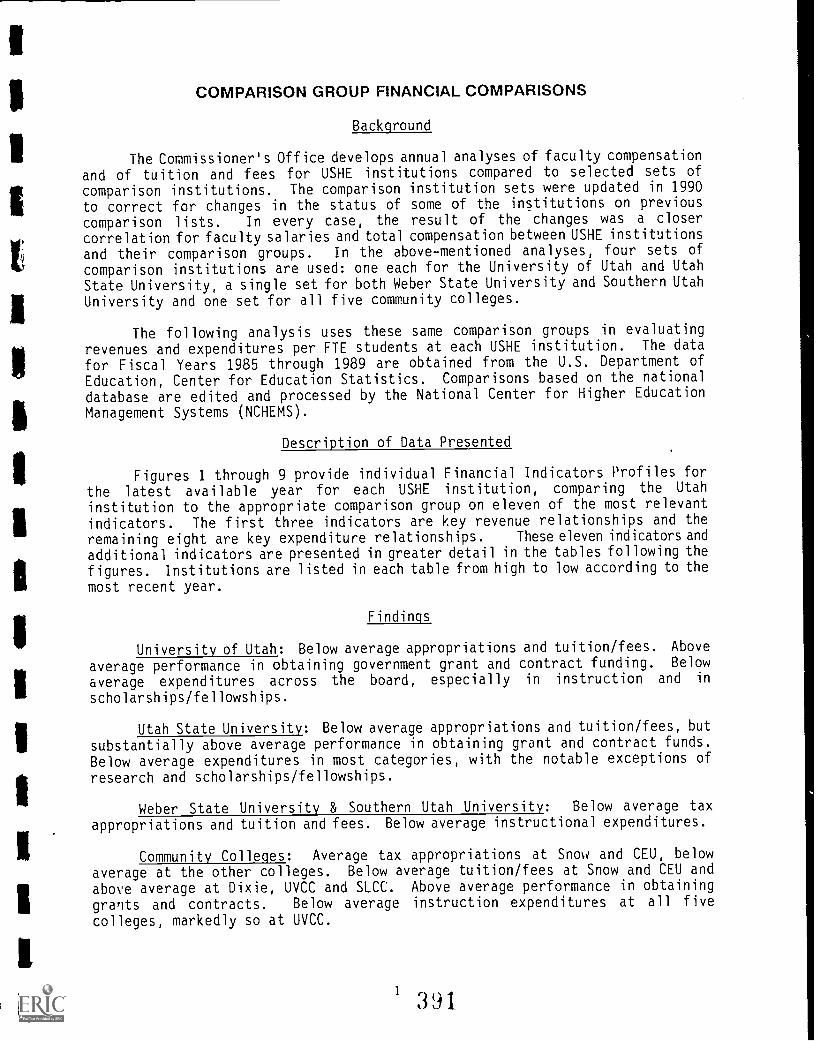
COMPARISON GROUP FINANCIAL COMPARISONS
Background
The Commissioner's Office develops annual analyses of faculty compensationand of tuition and fees for USHE institutions compared to selected sets of
comparison institutions. The comparison institution sets were updated in 1990
to correct for changes in the status of some of the institutions on previous
comparison lists. In every case, the result of the changes was a closer
correlation for faculty salaries and total compensation between USHE institutions
and their comparison groups. In the above-mentioned analyses, four sets ofcomparison institutions are used: one each for the University of Utah and Utah
State University, a single set for both Weber State University and Southern Utah
University and one set for all five community colleges.
The following analysis uses these same comparison groups in evaluating
revenues and expenditures per FTE students at each USHE institution. The data
for Fiscal Years 1985 through 1989 are obtained from the U.S. Department of
Education, Center for Education Statistics. Comparisons based on the national
database are edited and processed by the National Center for Higher Education
Management Systems (NCHEMS).
Description of Data Presented
Figures 1 through 9 provide individual Financial Indicators Profiles for
the latest available year for each USHE institution, comparing the Utah
institution to the appropriate comparison group on eleven of the most relevant
indicators. The first three indicators are key revenue relationships and theremaining eight are key expenditure relationships. These eleven indicators and
additional indicators are presented in greater detail in the tables following the
figures. Institutions are listed in each table from high to low according to the
most recent year.
Findings
University of Utah: Below average appropriations and tuition/fees. Above
average performance in obtaining government grant and contract funding. Below
average expenditures across the board, especially in instruction and in
scholarships/fellowships.
Utah State University: Below average appropriations and tuition/fees, butsubstantially above average performance in obtaining grant and contract funds.Below average expenditures in most categories, with the notable exceptions of
research and scholarships/fellowships.
Weber State University & Southern Utah University: Below average tax
appropriations and tuition and fees. Below average instructional expenditures.
Community Colleges: Average tax appropriations at Snow and CEU, below
average at the other colleges. Below average tuition/fees at Snow and CEU and
above average at Dixie, UVCC and SLCC. Above average performance in obtaining
graqts and contracts. Below average instruction expenditures at all five
colleges, markedly so at UVCC.
1 ,391

Figures 1 & 2
FINANCIAL INDICATORS PROFILEUniversity of Utah 1989-90
$ P er FTE
21.000
18.000
16,000
12.000
9,000
6,000
3,000 -0
L -of -U- C omp Group
o.
0
00
00
U of UComp GroupU ol U %
6,638 122W8,26 0 1 3,331
80 66
5,63 7
4,83 8
117
5,725
7,72774
3,740
4,511
ea
1,608
1,984
81
532
6 11
87
788
1,093
72
1,155
1,3 22
87
1,030
1,303
79
18,948
20,6 01
9 2
21,000
18,000
16.000
12.000
9,000
6,000
3,000
0
FINANCIAL INDICATORS PROFILEUtah State University 1989-90
$ Per FTE
USW 0-Comp Group -
4
U.
USU 6,295 1973, 7,33 7 4.4 00 6,570 1,024 423 1,19 1 982 8126 17,3 39
COMO Group 8,369 2.677 3,600 5,453 4,427 1,395 550 936 1,24 7 1,162 17,559
USU `Yo 75 74 204 81 148 73 77 127 79 76 99
2 3a 2
a
1
1

Figures 3 & 4
FINANCIAL INDICATORS PROFILEWeber State University 1989-90
$ Per FTE8,000
6,000
4,000
2,000
i
WSU Comp Group I
i or -ii ww-Hici iiri or0. . E 'g t -0 .12. -0 '0 1:12880 g go E. i g.a a 0. a 1
X X XZ 4 .5 6 6 6 6 LU 10 ILa ° A a.
-0 0 .5 8 t Et g a 0. 0wSa = o .- m =
LE -30 IL
I g :E. = z 732 : 1,,?, .E ,- -;
0 a g ._ a.
WSU
Comp GroupWSU %
3,524
4,52878
1,543
1,816
05
1,033
1,087
92
3,014
3,48087
38
155
25
489
718
60
428
63667
836
774
108
616
880
70
582
74778
6,247
7,78380
FINANCIAL INDICATORS PROFILESouthern Utah University 1989-90
$ Per FTE8,000
6,000
4,000
2,000
iii SUU Comp Group
iliJ 1111 EU eV IV lin WIo .a . .2 -0 -0 -0 a -0 -,,,,2 8 c. 88& U. 0 a. 0. 0. 0. c.. 0. a.a 5 45 6 Li 6 6 E ul 6 6. g r.. c .c 0. a 4 ci... 2 0.2 = 2 52 e a a a 4 Ss 0 U-I
f... : 'V ....Z --f v. "e 13ig IS cc E .,3 A -4 . *6-
m _ca0 0SUUComp GroupSUU %
3,7434,528
83
1,395
1,816
76
1,540
1,087
142
2,5083,480
72
0
155
0
719
718
100
625636
98
1,179
774
152
792
800
90
780747
104
7,67
7,783
99
3933
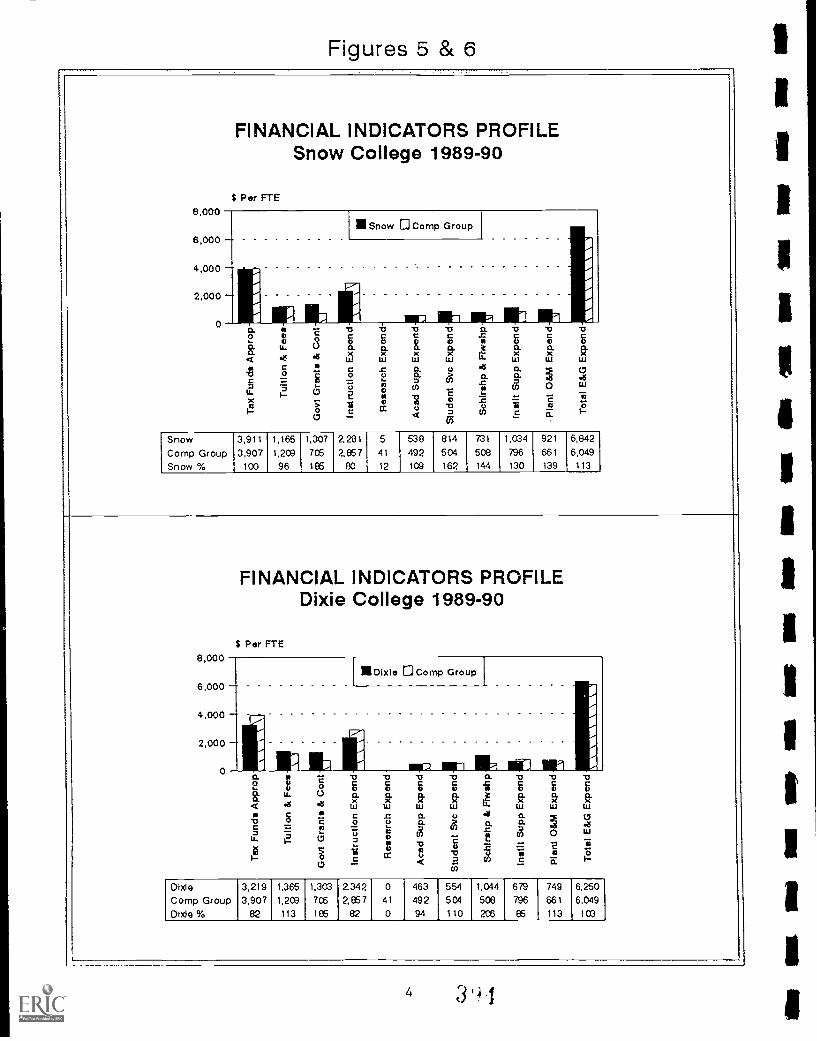
O 0
a o
a.g
CD
0-e
6.1
R3
-80)
=81
81
g
N2
81 2
00
g
g 7d
'
gC
D
cr,
cr,
8 F,
Tax
Fun
ds A
ppro
p
Tui
tion
& F
ees
Gov
t Gra
nts
& C
ont
Iner
uctIo
n E
xpen
d
Res
earc
h E
xpen
d
Ace
d S
upp
Exp
end
Stu
dent
Svc
Exp
end
Sch
lrshp
& F
rwsh
p
Inst
il S
upp
Exp
end
Pla
nt O
&M
Exp
end
Tot
al E
&G
Exp
end
- n
0.-
o 0 070
0
S03
(n -o0
33 0 rn
C.3
74 C
O -
CO
61 0 3
(51 g0
f-)
N8
81 8
,73 -0 ud N
) O
D
r.;;)
g.-
0g
8
co -
F3 2
2(0
0)
Is)
AC
I)0)
-0-8
-0b
00
oo
oo
o
Tax
Fun
ds A
ppro
p
Tui
tion
& F
ees
Gov
t Gra
nts
& C
ont
Inst
ruct
ion
Exp
end
Res
earc
h E
xpen
d
Ace
d S
upp
Exp
end
Stu
dent
Svc
Exp
end
Sch
irshp
& F
lwsh
p
Inst
it S
upp
Exp
end
Pla
nt O
&M
Exp
end
Tot
al E
&G
Exp
end
- rt
cn 0
o 0 z
o 0 0
tfa 0 "
0C
D 7
1C
OC
O 0 73 0 -n r- rn
illos
mai
sam
irwis
aim
asim
aim
allis
msa
mom
mur
s--

Ails
Ow
la a
s m
g am
oat
as
as N
Oim
ass
an n
o in
.s.d
C.d
r1
0 0
C) fr.,
0Il
lC
3 C
e0 c -o
o
Tax
Fun
ds A
ppro
p
Tui
tion
& F
ees
Gov
t Gra
nts
& C
ont
Inst
ruct
ion
Exp
end
Res
earc
h E
xpen
d
Aca
d S
upp
Exp
end
Stu
dent
Svc
Exp
end
Sch
irshp
& F
lwsh
p
Inst
it S
upp
Exp
end
Pla
nt O
&M
Exp
end
Tot
al E
&G
Exp
end
til4l
.C
OC
O
o o0
0o
irt 13-n
0 .-
-'0
Z=
D 0 Z
mo
,...
..,r.
.....
.ii
A,r
n z
.. 0 C
.)0
0 --I
C 0
E.;
33=
(I)
a 'V
CD
X)
C,i2
,0
*.se 1
11(D
=eN
1...
....
...1
.1
p0
C)
e 0 E
; c -oo
Tax
Fun
ds A
ppro
p
Tui
tion
& F
ees
Gov
t Gra
nts
& C
ont
Inst
ruct
ion
Exp
end
Res
earc
h E
xpen
d
Acs
d S
upp
Exp
end
Stu
dent
Svc
Exp
end
Sch
lruhp
& F
lyis
hp
Inst
il S
upp
Exp
end
Pla
nt O
&M
Exp
end
Tot
al E
&G
Exp
end
ti>-A
a)co
gg
-8-8
oo
oo
C40
0ID
-o=
-n
<Z
ta)
>
,,,e.
(1)
0--
......
...
0 p_
,..%
.%
.i 3z
3 0
c --
747
>%
.< "
1
%. i
m0 -
(.0
0 "1
3lia
-n
" %L
.,..
,-a
Li 71(
r-co
rn
, 0
C..)
C./
(4:',
-8
.§-4
"IM
MI1
1111
1C
..)ri
)
2 8
'
alm
a].
" '
,.
,
,.
.
m
co Iv
-,-
ro
N 8
---
.4o
cr, 8
- --
4co
cd3
8
N N
Ei3
83 -4
0-4
0II
LII
MIL
'
x 0 c 0 o 3 0 3 c -1,
1111
1x , < 0 0 M
I
o 0 -, 0 o -o
'
.
. " . .
a.
.
o -2
: o. -
.E
Sirt
)i'3
'-
....
0,0
r0 0
cS c
g'
_ct
g 8
'Z'
cil
LI w M
IIM
ILII
IIIM
VI
.
:
::
.
mai
min
ua
- -,
a)
8z-
DJ
8 8
8.
8F
iz
a) a
)-
-2g)
,°
c 8 >
"'":
(3Z
;to
CP

0 N N go
2
§(i'`
,+;
83 g P
(c,2
)
-88
00
0
Tax
Fun
ds A
ppro
p
Tui
tion
& F
ees
Gov
t Gra
nte
& C
ont
Inst
ruct
ion
Exp
end
Res
earc
h E
xpen
d
Ace
d S
upp
Exp
end
Stu
dent
Svc
Exp
end
Sch
irshp
& F
lwsh
p
Inst
lt S
upp
Exp
end
Pla
nt O
&M
Exp
end
Tot
al E
&G
Exp
end
-8 0
Si U
N in
s um
am
ass
Es
les
Me
am a
m a
n N
u W
OM
O

IIIINDCTRS FINANCIAL COMPARISON INDICATORS 30-Jul-
IIIIndicator: FALL FIE ENROLLMENT, 1984-85 TO 1988-89
1989-90 1988-89
Amount Rank Amount Rank
1987-88
Amount Rank
Comparison Group:
1986-87
Amount Rank
UNIVERSITY OF UTAH
1985-86 1984-85
Amount Rank Amount Rank
Purdue University, Main Campus 33,394 1 32,623 1 30,786 2 30,001 3 29,750 3 29,184 4
Univ California, Los Angeles 32,609 2 32,266 2 33,802 1 32,727 1 32,645 1 32,645 1
University of Florida 30,340 3 29,845 3 29,823 3 31,213 2 31,666 2 31,611 2
University of Arizona 30,015 4 28,392 5 27,147 5 25,793 5 25,418 6 24,869 6
University of Washington 28,885 5 29,123 4 29,010 4 29,177 4 29,384 4 29,445 3
University of Iowa 25,111 6 25,165 6 25,071 6 25,611 6 25,637 5 25,776 5
Univ Cincinnati, Main Campus 23,652 7 24,619 7 24,123 7 22,366 7 22,518 7 22,826 7
Univ of Colorado, Boulder 22,964 8 22,463 8 22,006 8 20,987 8 20,997 8 20,650 8
Univ North Carolina (Ch Hill) 20,812 9 20 925 9 20,207 9 20,228 9 19,733 9 19,365 9
UNIVERSITY OF UTAH 18,390 10 18,067 10 18,504 10 18,417 10 18,359 10 18,481 10
Univ of Virginia, Main Campus 17,972 11 17,816 11 17,817 11 17,972 11 16,462 11 16,168 11
COMPARISON GROUP AVERAGE 26,575 26,314 25,979 25,608 25,421 25,254
PERCENT OF COMP GROUP AVE:
University of Utah 69.20% 68.66% 71.23% 71.92% 72.22% 73.18%
Indicator: FALL FTE ENROLLMENT, 1984-85 TO 1988-89
1989-90 1988-89
Amount Rank Amount Rank
1987-88
Amount Rank
Comparison Group:
1986-87
Amount Rank
UTAH STATE UNIVERSITY
1985-86 1984-85
Amount Rank Amourt Rank
Tex;.s A & M University 37,569 1 36,317 I 36,196 1 33,763 1 32,820 1 33,835 1
Univ of Maryland, College Pk 29,660 2 30,374 2 31,576 2 31,989 2 32,118 2 31,700 2
Iowa State University 23,531 3 23,667 3 23,817 3 24,502 3 24,569 3 24,463 3
Virginia Tech University 22,612 4 22,037 4 22,587 4 22,264 4 21,888 4 21,288 4
North Carolina State Univ 20,563 5 19,956 5 19,182 6 19,633 5 19,340 5 19,083 5
Univ of California, Davis 19,979 6 19,242 6 19,319 5 18,421 6 18,205 6 18,205 6
Colorado State University 18,735 7 17,675 7 17,695 7 17,350 7 16,698 7 16,722 7
Washington State Unive.'sity 16,095 8 15,403 8 15,489 8 15,286 8 15,357 8 15,721 8
Oregon State University 14,943 9 14,789 9 13,800 9 14,295 9 14,376 9 14,784 9
New Mexico State University 11,742 10 11,919 10 11,878 10 11,538 10 11,282 10 11,271 10
UTAH STATE UNIVERSITY 10,399 11 9,979 11 9,719 11 9,649 11 9,147 11 9,262 11
COMPARISON GROUP AVERMIE 21,543 21,138 21,154 20,904 20,665 20,707
PERCENT OF COMP GROUP AVE:
Utah State University 48.27% 47.21% 45.94% 46.16% 44.26% 44.73%
3977

INDCTRS FINANCIAL COMPARISON INDICATORS 30-Jul-92
Indicator: FALL FTE ENROLLMENT, 1984-85 TO 1988-89 Comparison Group: COMPREHENSIVE INSTITUTIONS
1989-90
Amount Rank
1988-89
Amount Rank
1987-88
Amount Rank
1986-87
Amount Rank
1985-86
Amount Rank
1984-85
Amount Rank
Univ of Nevada, Las Vegas 10,394 1 9,303 1 8,565 3 7,950 3 7,521 4 7,006 4
WEBER STATE UNIVERSITY 9,424 2 8,957 3 8,706 2 8,299 2 8,029 2 7,685 3
Univ of Wisconsin, Oshkosh 9,274 3 9,274 2 9,339 1 9,375 1 9,242 1 9,058 1
Boise State University 8,998 4 7,717 4 8,096 4 7,717 4 7,667 3 8,109 2
Eutern Washington University 7,062 5 6,967 5 6,889 5 6,967 5 7,422 5 7,422 5
SUNY College at Brockport 6,995 6 6,701 6 6,072 6 5,826 6 5,715 6 5,795 6
Calif St Univ, Dominguez Hills 5,437 7 4,949 7 4,975 7 4,764 7 5,555 7 5,555 7
Austin Peay State University 4,629 8 3,993 9 2,857 10 3,886 8 3,947 8 4,161 9
Southern Oregon State College 4,077 9 4,120 8 3,960 8 3,595 9 3,678 9 3,631 10
Univ of Southern Colorado 3,686 10 3,503 10 3,450 9 3,257 10 3,653 10 4,197 8
Indiana University Northwest 3,061 11 3,009 11 2,841 11 2,769 11 2,745 11 2,813 11
SOUTHERN UTAH UNIVERSITY 2,936 12 2,689 12 2,644 12 2,522 12 2,280 12 2,265 12
COMPARISON GROUP AVERAGE 6,361 5,954 5,704 5,611 5,715 5,775
PERCENT OF COMP GROUP AVE:
Weber State University 148.15% 150.44% 152.63% 147.91% 140.49% 133.07%
Southern Utah University 46.16% 45.16% 46.35% 44.95% 3).90% 39.22%
Indicator: FALL FTE ENROLLMENT, 1984-85 TO 1988-89
1989-90 1988-89
Amount Rank Amount Rank
1987-88
Amount Rank
Comparison Group:
1986-87
Amount Rank
COMMUNITY COLLEGES
1985-86 1984-85
Amount Rank Amount Rank
Grand Rapids Junior College 6,659 1 6,277 1 6,190 1 6,005 1 5,693 1 5,472 1
SALT LAKE COMMUNITY COLLEGE 6,546 2 5,502 3 5,551 2 5,437 2 5,162 2 5,068 2
Anne Arundel Comm College 6,077 3 5,842 2 5,225 3 4,943 3 4,544 6 4,415 7
UTAH VALLEY COMMUNITY COLLEGE 5,590 4 4,966 6 5,043 4 4,544 6 4,697 5 4,584 6
Joliet Junior College 5,182 5 5,069 5 4,991 5 4,793 4 5,161 3 5,042 3
Chemeketa Community College 5,137 6 5,181 4 4,325 8 4,276 8 4,420 8 4,395 8
Onandaga Community College 4,987 7 4,634 8 4,626 6 4,534 7 4,527 7 4,685 5
Spokane Community College 4,860 8 4,705 7 4,617 7 4,595 5 4,785 4 4,938 4
Yavapai College 2,646 9 2,638 9 2,404 9 2,159 9 2,172 9 2,181 9
North Idaho College 1,977 10 1,951 10 1,937 10 1,778 11 1,710 10 1,766 10
DIXIE COLLEGE 1,928 11 1,799 11 1,804 11 1,811 10 1,705 11 1,556 11
Danville Community College 1,700 12 1,521 12 1,307 12 1,146 14 1,138 12 1,235 12
SNOW COLLEGE 1,540 13 1,355 14 1,241 14 1,295 12 1,143 13 1,168 13
COLLEGE OF EASTERN UTAH 1,525 14 1,441 13 1.303 13 1,241 13 1,114 14 892 14
Western Wyoming Comm College 1,060 15 891 15 890 15 779 15 873 15 839 15
COMPARISON GROUP AVERAGE 4,029 3,871 3,651 3,501 3,502 3,497
PERCENT OF COMP GROUP AVE:
Salt Lake Comm College 162.47% 142.13% 152.04% 155.30% 147.40% 144.92%
Utah Valley Com College 138.74% 128.29% 138.13% 129.79% 134.12% 131.08%
Dixie College 47.85% 46.47% 49.41% 51.73% 48.69% 44.50%
Snow College 38.22% 35.00% 33.99% 36.99% 32.64% 33.40%
College of Eastern Utah 37.85% 37.23% 3.59% 35.45% 31.81% 25.51%
,
4 s
8

INDCTRS FINANCIAL COMPARISON INDICATORS 30-Jul-92
Indicator: TAX FUNDS APPROPRIATIONS PER FTE Comparison Group: UNIVERSITY OF UTAH
1989-90
Amount Rank
1988-89
Amount Rank
1987-88
Amount Rank
1986-87
Amount Rank
1985-86
Amount Rank
1984-85
Amount Rank
Univ California, Los Angeles $13,372 1 $13,290 1 $12,473 1 $12,128 1 $11,455 1 $10,493 1
University of Florida $12,865 2 $12,120 2 $10,842 3 $9,700 3 $8,544 3 $8,157 3
Univ North Carolina (Ch Hill) $12,1. 3 $11,512 3 $11,421 2 $10,618 2 $10,140 2 $9,453 2
University of Washington $8,346 4 $8,048 4 $6,760 5 $6,198 5 $5,941 8 $5,626 8
University of Arizona $7,685 5 $8,001 5 $7,774 4 $7,527 4 $7,350 5 $6,639 5
Univ of Virginia, Main Campus $7,129 6 $6,875 6 $6,360 6 $5,922 6 $7,706 4 $7,082 4
University of Iowa $6,755 7 $6,324 8 $5,736 8 $5,493 8 $6,437 6 $6,524 6
UNIVERSITY OF UTAH $6,638 8 $6,458 7 $6,094 7 $5,819 7 $6,064 7 $5,701 7
Purdue University, Main Campus $5,840 9 $5,628 9 $5,467 9 $5,255 10 $4,865 10 $4,498 10
Univ Cincinnati, Main Campus $5,835 10 $5,334 10 $5,010 10 $5,273 9 $5,686 9 $5,441 9
Univ of Colorado, Boulder $2,640 11 $2,399 11 $2,458 11 $2,315 11 $2,213 11 $2,161 11
COMPARISON GROUP AVERAGE $8,260 $7,953 $7,430 $7,043 $7,034 $6,608
rERCENT OF COMP GROUP AVE:
University of Utah 80.36% 81.20% 82.02% 82.62% 86.21% 86.27%
Indicator: TAX t,,AS APPROPRIATIONS PER FTE
1989-90
Mount Rank
1988-89
Amount Rank
1987-88
Amount Rank
Comparison Group:
1986-87
Amount Rank
UTAH STATE UNIVERSITY
1985-86 1984-85
Amount Rank Amount Rank
Univ of California, Davis $15,165 1 $14,912 1 $14,274 1 $14,267 1 $13,621 1 $12,334 1
North Carolina State Univ $11,078 2 $10,767 2 $10,638 2 $9,592 2 $9,113 2 $8,293 2
Washington State University $8,497 3 $8,191 3 $7,639 4 $7,174 3 $6,848 4 $6,565 4
Texas A & M University $8,489 4 $7,532 6 $7,777 3 $6,889 4 $8,109 3 $7,933 3
Virginia Tech University $8,061 5 $7,794 5 $7,159 5 $6,828 5 $6,283 6 $5,943 5
Univ of Maryland, College Pk $7,581 6 $7,812 4 $6,424 7 $5,739 8 $5,213 10 $4,735 9
Iowa State University $7,478 7 $6,855 7 $6,196 9 $5,607 9 $5,278 9 $5,216 7
Oregon State University $6,949 8 $6,360 9 $6,528 6 $5,925 7 $5,288 8 $4,633 10
UTAH STATE UNIVERSITY $6,295 9 $6,371 8 $6,372 8 $6,132 6 $6,423 5 $5,924 6
New Mexico State University $5,921 10 $5,354 10 $5,046 10 $5,088 10 $5,303 7 $5,045 8
Colorado State University $4,471 11 $4,216 11 $3,917 11 $3,668 11 $3,590 11 $3,457 11
COMPARISON GROUP AVERAGE $8,369 $7,979 $7,560 $7,078 $6,865 $6,421
PERCENT OF CCmr.' GROUP AVE:
Utah State University 75.22% 79.85% 84.29% 86.63% 93.56% 92.26%

INDCTRS FINANCIAL COMPARISON INDICATORS 30-Jul-92
Indicator: TAX FUNDS APPROPRIATIONS PER FTE Comparison Group: COMPREHENSIVE INSTITUTIONS
1989-90
Amount Rank
1988-89
Amount Rank
1987-88
Amount Rank
1986-87
Amount Rank
1985-86
Amount Rank
1984-85
Amount Rank
Calif St Univ, Dominguez Hills $7,817 1 $9,439 1 $7,153 1 $8,256 1 $6,706 1 $6,050 2
SUNY College at Brockport $5,869 2 $5,997 2 $6,543 2 $6,530 2 $6,526 2 $6,271 1
Eastern Washington University $4,874 3 $4,824 3 $4,620 4 $4,370 3 $3,874 4 $3,990 3
Univ of Nevada, Las Vegas $4,562 4 $4,004 6 $4,050 5 $3,925 5 $3,802 5 $3,495 6
Boise State University $4,124 5 $4,300 4 $3,952 6 $3,714 6 $3.505 8 $3,099 8
Indiana University Northwest $3,930 6 $3,746 7 $3,567 8 $3,605 7 $3,546 7 $3,221 7
Austin Peay State University $3,757 7 $4,229 5 $5,744 3 $4,093 4 $3,491 9 $2,963 9
SOUTHERN UTAH UNIVERSITY $3,743 8 $3,638 8 $3,558 9 $3,554 8 $3,964 3 $3,756 4
Southern Oregon State College $3,565 9 $3,165 12 $3,102 12 $3,123 11 $2,935 11 $2,554 11
Univ of Wisconsin, Oshkosh $3,529 10 $3,319 11 $3,283 11 $3,019 12 $3,116 10 $2,912 10
WEBER STATE UNIVERSITY $3,524 11 $3,579 9 $3,605 7 $3,496 9 $3,661 6 $3,608 5
Univ of Southern Colorado $3,257 12 $3,370 10 $3,434 10 $3,236 10 $2,863 12 $2,344 12
COMPARISON GROUP AVERAGE $4,528 $4,639 $4,545 $4,387 $4,036 $3,690
PERCENT OF COMP GROUP AVE:
Southern Utah University 82.66% 78.42% 78.28% 81.01% 98.22% 101.79%
Weber State University 77.83% 77.15% 79.32% 79.69% 90.71% 97.78%
Indicator: TAX FUNDS APPROPRIATIONS PER FTE
1989-90
Amount Rank
1988-89
Amount Rank
1987-88
Amount Rank
Comparison Group:
1986-87
Amount Rank
COMMUNITY COLLEGES
1985-86 1984-85
Amount Rank Amount Rank
Western Wyoming COM College $6,595 1 $6,587 1 $6,902 1 $8,122 1 $7,495 1 $7,080 1
North Idaho College $4,589 2 $4,219 2 $4,102 4 $4,143 3 $4,066 3 $3,717 5
Chemeketa Community College $4.318 3 $4,007 4 $4,663 2 $4,455 2 $3,904 5 $3,796 4
Yavapai College $4,189 4 $3,783 5 $3,503 6 $3,495 7 $3,235 7 $3,147 7
SNOW COLLEGE $3,911 5 $4,034 3 $4,287 3 $3,919 4 $4,417 2 $4,229 3
COLLEGE OF EASTERN UTAH $3,805 6 $3,621 6 $3,658 5 $3,643 6 $3,944 4 $4,321 2
Danville Community College $3,286 7 $3,195 10 $3,496 7 $3,754 5 $3,581 6 $3,206 6
Onandaga Community College $3,271 8 $3,454 7 $3,212 8 $3,072 8 $3,011 9 $2,728 11
DIXIE COLLEGE $3,219 9 $3,271 9 $3,127 9 $2,973 10 $2,971 10 $2,984 8
Grand Rapids Junior College $3,065 10 $2,705 13 $2,715 13 $2,373 15 $2,265 14 $2,136 15
Anne Arundel Comm College $2,950 11 $2,838 12 $2,940 11 $2,972 11 $3,093 8 $2,772 9
Joliet Junior College $2,901 12 $2,686 14 $2,522 14 $2,811 12 $2,159 15 $2,461 13
SALT LAKE COMMUNITY COLLEGE $2,785 13 $2,976 11 $2,816 12 $2,706 13 $2,731 12 $2,665 12
UTAH VALLEY COMMUNITY COLLEGE $2,370 14 $2,448 15 $2,291 15 $2,471 14 $2,370 13 $2,217 14
Spokane Community College 15 $3,327 8 $3,107 10 $3,071 9 $2,916 11 $2,761 10
COMPARISON GROUP AVERAGE $3,907 $3,680 $3,716 $3,827 $3,572 $3,380
PERCENT OF COMP GROUP AVF:
Snow College 100.10% 109.62% 115.37% 102.40% 123.66% 125.12%
College of Eastern Utah 97.39% 98.40% 98.44% 95.19% 110.41% 127.84%
Dixie College 82.39% 88.89% 84.15% 77.68% 83.17% 88.28%
Salt Lake Community Cullege 71.28% 80.87% 75.78% 70.71% 76.46% 78.85%
Utah Valley Community Colleg 60.66% 66.52% 61.65% 64.57% 66.35% 65.59%
10
1

IIIINDCTRS FINANCIAL COMPARISON INDICATORS 30-Jul-92
Indicator: TAX APPROPRIATIONS % OF EDUCATION & GENERAL REVENUES Comparison Group: UNIVERSITY OF UTAH
University of Florida
University of Arizona
Univ North Carolina (Ch Hill)
Univ California, Los Angeles
Purdue University, Main Campus
University of Iowa
Univ Cincinnati, Main Campus
Univ of Virginia, Main Campus
UNIVERSITY OF UTAH
University of Washington
Univ of Colorado, Boulder
COMPARISON GROUP AVERAGE
PERCENT OF COMP GROUP AVE:
University of Utah
1989-90
Amount Rank
1988-89
Amount Rank
1987-88
Amount Rank
1986-87
Amount Rank
1985-86
Amount Rank
1984-85
Amount Rank
57.45% 1 56.61% 1 57.65% 1 58.34% 1 57.51% 1 59.35% 1
44.91% 2 47.51% 2 48.95% 2 49.81% 2 51.35% 2 51.97% 3
44.44% 3 45.08% 3 46.71% 3 47.77% 3 46.27% 4 46.73% 4
42.49% 4 44.26% 4 46.41% 4 46.92% 4 44.27% 5 45.18% 6
41.40% 5 41.73% 5 40.82% 6 41.18% 6 40.00% 9 40.61% 9
38.74% 6 39.45% 6 41.10% 5 43.82% 5 49.42% 3 52.57% 2
37.49% 7 38.27% 7 38.80% 7 40.07% 7 42.25% 7 41.84% 7
35.16% 8 36.93% 8 37.85% 8 39.40% 8 45.40% 6 46.13% 5
34.33% 9 35.19% 9 36.91% 9 37.62% 9 40.28% 8 41.18% 8
31.65% 10 32.90% 10 31.24% 10 30.25% 10 31.55% 10 33.41% 10
20.31% 11 19.48% 11 21.29% 11 21.85% 11 22.91% 11 23.95% 11
40.29% 41.28% 42.15% 42.84% 43.67% 44.75%
85.21% 85.25% 87.57% 87.81% 92.24% 92.02%
Indicator: TAX APPROPRIATIONS % OF EDUCATION & GENERAL REVENUES
1989-90
Amount Rank
1988-89
Amount Rank
North Carolina State Univ 59.53% 1 59.30% 1
Univ of California, Davis 53.26% 2 55.46% 2
Texas A & M University 52.65% 3 50.75% 5
Washington State University 50.92% 4 51.75% 3
Univ of Maryland, College Pk 50.57% 5 51.66% 4
Iowa State University 48.79% 6 47.88% 7
Virginia Tech University 47.25% 7 49.60% 6
Oregon State University 41.25% 8 41.01% 8
New Mexico State University 39.17% 9 40.17% 9
UTAH STAIE UNIVERSITY 35.64% 10 39.23% 10
Colorado State University 31.54% 11 30.65% 11
COMPARISON GROUP AVERAGE 48.26% 48.81%
PERCENT OF COMP GROUP AVE:
Utah State University 73.85% 80.37%
1987-88
Amount Rank
Comparison Group:
1986-87
Amount Rank
UTAH STATE UNIVERSITY
1985-86 1984-85
Amount Rank Amount Rank
60.55% 1 60.76% 1 60.33% 1 60.05% 1
57.42% 2 59.76% 2 57.45% 2 58.36% 2
55.80% 3 45.74% 7 49.79% 6 53.81% 4
55.22% 4 54.52% 3 54.55% 3 55.97% 3
49.83% 5 49.16% 5 48.67% 7 49.06% 7
49.65% 7 46.17% 6 51.34% 4 53.00% 5
49.71% 6 50.64% 4 49.80% 5 51.07% 6
40.87% 9 40.96% 9 38.64% 10 36.49% 10
39.45% 10 39.82% 10 41.82% 9 43.42% 9
42.76% 8 44.65% 8 46.14% 8 47.89% 8
31.78% 11 31.43% 11 32.50% 11 33.08% 11
50.05% 49.12% 49.51% 50.39%
85.44% 90.90% 93.19% 95.04%
14

INDCTRS FINANCIAL COMPARISON INDICATORS 30-Jul-92
Indicator: TAX APPROPRIATIONS % OF EDUCATION & GENERAL REVENUES Comparison Group: COMPREHENSIVE INSTITUTIONS
1989-90
Amount Rank
1988-89
Amount Rank
1987-88
Amount Rank
1986-87
Amount Rank
1985-86
Amount Rank
1984-85
Amount Rank
Calif St Univ, Dominguez Hills 75.78% 1 79.37% 1 79.50% 1 77.63% 1 74.68% 1 72.78% 1
SUNY College at Brockport 65.39% 2 66.87% 2 68.84% 2 68.50% 2 71.31% 2 69.76% 2
Indiana University Northwest 57.03% 3 55.15% 6 56.52% 8 59.40% 6 59.74% 7 63.51% 4
Austin Peay State University 56.63% 4 58.90% 3 62.47% 4 63.78% 3 63.94% 3 61.52% 6
Boise State University 56.50% 5 56.97% 5 62.70% 3 61.69% 4 57.67% 8 59.14% 7
Eastern Washington University 54.55% 6 57.09% 4 58.25% 7 60.23% 5 60.40% 6 64.68% 3
Univ of Wisconsin, Oshkosh 54.06% 7 54.63% 8 58.63% 5 58.84% 7 60.86% 4 57.59% 9
WEBER 'TATE UNIVERSITY 53.18% 8 55.10% 7 58.58% 6 57.76% 8 60.78% 5 62.45% 5
Southern Oregon State College 50.86% 9 48.79% 10 49.73% 10 49.50% 10 49.89% 11 48.06% 11
Univ of Nevada, Las Vegas 49.86% 10 46.85% 11 49.13% 11 48.82% 11 51.07% 10 49.62% 10
SOUTHERN UTAH UNIVERSITY 47.75% 11 50.07% 9 52.96% 9 53.95% 9 57.11% 9 58.17% 8
Univ of Southern Colorado 42.65% 12 44.69% 12 47.10% 12 43.93% 12 44.22% 12 42.73% 12
COMPARISON GROUP AVERAGE 57.04% 58.37% 60.10% 60.28% 60.29% 60.00%
PERCENT OF COMP GROUP AVE:
Weber State University 93.23% 94.40% 97.47% 95.82% 100.81% 104.08%
Southern Utah University 83.71% 85.78% 88.12% 89.50% 94.73% 96.95%
Indicator: TAX APPROPRIATIONS % OF EDUCATION & GENERAL REVENUES
1989-90 1988-89
Amount Rank Amount Rank
1987-88
Amount Rank
Comparison Group:
1986-87
Amount Rank
COMMUNITY COLLEGES
1985-86 1984-85
Amount Rank Amount Rank
Western Wyoming Comm College 75.94% 1 76.25% 1 79.80% 1 75.76% 1 68.95% 4 78.00% 1
Danville Community College 68.79% 2 65.97% 4 70.58% 3 72.49% 2 70.33% 2 69.15% 6
Yavapal College 68.19% 3 69.58% 2 70.75% 2 68.72% 4 69.39% 3 70.58% 3
Anne Arundel Comm College 65.86% 4 67.30% 3 69.23% 4 70.96% 3 71.46% 1 69.91% 4
Chemeketa Community College 63.77% 5 63.68% 5 68.64% 5 67.61% 5 67.28% 5 69.55% 5
North Idaho College 62.44% 6 60.384 7 62.89% 6 62.75% 7 58.83% 10 60.55% 10
Joliet Junior College 61.36% 7 57.44% 8 57.42% 10 65.91% 6 57.73% 12 61.46% 9
COLLEGE OF EASTERN UTAH 55.50% 8 57.16% 9 57.66% 9 55.49% 13 54.99% 14 56.15% 14
SNOW COLLEGE 54.68% 9 55.65% 10 58.12% 8 60.29% 10 64.47% 7 65.11% 7
Grand Rapids Junior College* 53.84% 10 47.91% 15 26.55% 15 47.68% 15 47.99% 15 44.94% 15
DIXIE COLLEGE 52.19% 11 55.14% 11 56.46% 11 61.71% 9 62.39% 8 63.65% 8
Onondaga Community College 50.16% 12 53.07% 12 53.71% 12 56.20% 12 59.68% 9 57.82*; 12
SALT LAKE COMMUNITY COLLEGE 48.30% 13 50.21% 13 53.14% 13 56.62% 11 58.07% 11 59.47% 11
UTAH VALLEY COMMUNITY COLLEGE 46.81% 14 49.16% 14 51.88% 14 54.96% 14 56.60% 13 56.33% 13
Spokane Community College 15 60.49% 6 59.67% 7 62.32% 8 65.05% 6 72.30% 2
*College has 7 times ave "Other Funds," in 87-88
COMPARISON GROUP AVERAGE 63.75% 62.64% 60.01% 65.98% 64.18% 66.24%
PERCENT OF COMP GROUP AVE:
College of Eastern Utah 87.05% 91.25% 96.08% 84.10% 85.68% 84.77%
Snow College 85.77% 88.84% 96.85% 91.38% 100.45% 98.29%
Dixie College 81.86% 88.03% 94.08% 93.53% 97.21% 96.09%
Salt Lake Community College 75.76% 80.16% 88.55% 85.81% 90.48% 89.78%
Utah Valley Community Colleg 73.42% 78.48% 86.45% 83.30% 88.19% 85.04%

1NDCTRS FINANCIAL COMPARISON INDICATORS 30-Jul-92
Indicator: TUITION AND FEES PER FTE Comparison Group: UNIVERSITY OF UTAH
1989-90
Amount Rank
1988-89
Amount Rank
1987-88
Amount Rank
1986-87
Amount Rank
1985-86
Amount Rank
1984-85
Amount Rank
Univ of Colorado, Boulder $4,737 1 $4,519 1 $4,239 1 $3,900 1 $3,436 1 $3,119 1
Univ of Virginia, Main Campus $4,374 2 $4,024 2 $3,695 2 $3,464 2 $3,378 2 $2,980 2
Univ Cincinnati, Main Campus $3,687 3 $3,310 4 $2,984 5 $2,953 4 $2,740 5 $2,657 3
University of Washington $3,670 4 $3,549 3 $3,538 3 43,384 3 $2,740 5 $2,242 6
Univ California, Los Angeles $3,345 5 $3,115 5 $2,794 6 $2,632 6 $2,787 3 $2,654 4
Purdue University, Main Campus $3,319 6 $3,095 6 $3,111 4 $2,941 5 $2,744 4 $2,442 5
University of Arizona $3,068 7 $2,787 8 $2,568 7 $2,393 7 $2,056 7 $1,795 8
University of Iowa $3,055 8 $2,858 7 $2,476 8 $2,100 8 $1,959 8 $1,812 7
Univ North Carolina (Ch Hill) $2,245 9 $1,938 10 $1,846 10 $1,792 10 $1,556 10 $1,441 10
UNIVERSITY OF UTAH $2,209 10 $2,046 9 $1,905 9 $1,865 9 $1,683 9 $1,465 9
University of Florida $1,805 11 $1,584 II $1,513 11 $1,314 II $1,150 II $1,029 11
COMPARISON GROUP AVERAGE $3,331 $3,078 $2,876 $2,687 $2,455 $2,217
PERCENT OF COMP GROUP AVE:
University of Utah 66.32% 66.47% 66.24% 69.41% 68.55% 66.08%
Indicator: TUITION AND FEES PER FTE
1989-90
Amount Rank
1988-89
Amount Rank
1987-88
Amount Rank
Comparison Group:
1986-87
Amount Rank
UTAH STATE UNIVERSITY
1985-86 1984-85
Amount Rank Amount Rank
Colorado State University $3,844 1 $3,528 I $3,154 I $2,880 1 $2,673 I $2,569 1
Virginia Tech University $3,517 2 $3,226 2 $3,146 2 $2,865 2 $2,620 2 $2,395 2
Univ of Maryland, College Pk $3,262 3 $3,035 3 $2,772 3 $2,520 3 $2,302 3 $2,189 3
Iowa State University $2,941 4 $2,660 4 $2,381 4 $2,171 4 $1,559 8 $1,613 6
Washington State University $2,646 5 $2,637 5 $1,740 8 $1,656 8 $1,599 7 $1,353 8
Univ of California, Davis $2,541 6 $2,428 6 $2,173 5 $1,962 5 $2,071 4 $1,975 4
Texas A & M University $2,528 7 $2,301 7 $2,099 6 $1,785 7 $1,999 5 $1,236 9
Oregon State University $2,270 8 $2,048 8 $2,003 7 $1,922 6 $1,940 6 $1,834 5
UTAH STATE UNIVERSITY $1,973 9 $1,814 9 $1,652 9 $1,613 9 $1,511 9 $1,411 7
North Carolina State Univ $1,752 10 $1,586 10 $1,536 10 $1,412 10 $1,341 10 $1,231 10
New Mexico State University $1,473 11 $1,400 11 $1,406 11 $1,259 11 $1,131 II $1,027 11
COMPARISON GROUP AVERAGE $2,677 $2,485 $2,241 $2,043 $1,924 $1,742
PERCENT OF COMP GROUP AVE:
Utah State University 73.70% 73.00% 73.72% 78.95% 78.53% 81.00%
13 4113

INDCTRS FINANCIAL COMPARISON INDICATORS 30-Jul-92
Indicator: TUITION AND FEES PER FTE Comparison Group: COMPREHENSIVE INSTITUTIONS
1989-90 1988-89 1987-88 1986-87 1985-86 1984-85
Eastern Washington University
Univ of Southern Colorado
Calif St Univ, Dominguez Hills
Indiana University Northwest
Southern Oregon State College
Univ of Wisconsin, Oshkosh
Austin Peay State University
SUNY College at Brockport
Univ of Nevada, Las Vegas
WEBER STATE UNIVERSITY
Boise State University
SOUTHERN UTAH UNIVERSITY
COMPARISON GROUP AVERAGE
PERCENT OF COMP GROUP AVE:
Weber State University
Southern Utah University
Amount Rank Amount Rank Amount Rank Amount Rank Amount Rank Amount
$2,292 1 $2,040 1 $1,956 2 $1,607 4 $1,477 4 $1,255
$2,107 2 $1,888 3 $1,833 3 $1,905 1 $1,739 1 $1,643
t..,954 3 $1,809 5 $1,368 8 $1,353 8 $1,430 5 $1,323
$1,931 4 $1,896 2 $1,822 4 $1,499 5 $1,355 7 $1,158
$1,866 5 $1,833 4 $1,701 5 $1,687 2 $1,559 3 $1,484
$1,719 6 $1,621 7 $1,498 7 $1,385 7 $1,244 8 $1,147
$1,674 7 $1,664 6 $2,095 1 $1,413 6 $1,146 11 $1,036
$1,588 8 $1,589 8 $1,585 6 $1,608 3 $1,570 2 $1,561
$1,562 9 $1,491 9 $1,339 9 $1,314 9 $1,423 6 $1,266
$1,543 10 $1,452 11 $1,334 10 $1,286 10 $1,161 10 $1,137
$1,462 11 $1,463 10 $1,275 11 $1,228 11 $1,198 9 $1,051
$1,385 12 $1,249 12 $1,129 12 $1,097 12 $972 12 $935
$1,816 $1,729 $1,647 $1,500 $1,414 $1,292
84.97% 83.98% 81.00% 85.73% 82.11% 88.00%
76.27% 72.24% 68.55% 73.13% 68.74% 72.37%
Indicator: TUITION AND FEES PER FTE Comparison Group: COMMUNITY COLLEGES
1989-90
Amount Rank
1988-89
Amount Rank
1987-88
Amount Rank
1986-87
Amount Rank
1985-86
Amount Rank
Onandaga Community College $1,812 1 $1,762 2 $1,625 2 $1,485 2 $1,411 2
Grand Rapids Junior College $1,735 2 $1,892 1 $1,827 1 $1,531 1 $1,531 1
SALT LAKE COMMUNITY COLLEGE $1,517 3 $1,457 3 $1,311 3 $1,136 4 $1,057 4
UTAH VALLEY COMMUNITY COLLEGE $1,374 4 $1,267 5 $1,056 5 $1,060 5 $852 7
DIXIE COLLEGE $1,365 5 $1,205 6 $1,053 6 $822 8 $754 10
Anne Arundel Comm College $1,247 6 $1,102 7 $1,043 7 $980 6 $904 6
SNOW COLLEGE $1,165 7 $1,003 9 $945 8 $785 13 $791 9
Yavapai College $1,143 8 $907 12 $849 11 $794 11 $696 13
North Idaho College $1,132 9 $1,403 4 $1,220 4 $1,184 3 $1,120 3
Joliet Junior College $1,061 10 $1,017 8 $913 9 $818 9 $723 11
Chemeketa Community College $943 11 $814 13 $844 12 $815 10 $709 12
Western Wyoming Comm College $932 12 $943 11 $666 15 $693 14 $564 14
Danville Community College $875 13 $992 10 $906 10 $902 7 $916 5
COLLEGE OF EASTERN UTAH $804 14 $726 14 $742 13 $786 12 $799 8
Spokane Community College 15 $632 15 $727 14 $673 15 $554 15
COMPARISON GROUP AVERAGE $1,209 $1,146 $1,062 $987 $913
PERCENT OF COMP GROUP AVE:
Salt Lake Community College 125.48% 127.14% 123.45% 115.10% 115.77%
Utah Valley Community Colleg 113.65% 110.56% 99.44% 107.40% 93.32%
Dixie College 112.90% 105.15% 99.15% 83.28% 82.58%
Snow College 96.36% 87.52% 88.98% 79.53% 86.64%
College of Eastern Utah 66.50% 63.35% 69.87% 79.64% 87.51%
4 .4
14
Rank I
6
1
4 1117
3
8 ,
11
2
5
9
10
12
1984-85
Amount Rank
$1,401 2
$1,580 1
$909 5
$762 8
$673 11
$943 4
$681 10
$671 12
$955 3
$748 9
$657 13
$521 14
$817 7
$881 6
$449 15
$874
104.00%
87.19%
77.00%
77.92%
100.80%
1

INDCTRS FINANCIAL COMPARISON INDICATORS 30-Jul-92
Indicator: TUITION AND FEES % OF INSTRUCTION DIRECT EXPENDITURES Comparison Group: UNIVERSITY OF UTAH
1989-90
Amount Rank
1988-89
Amount Rank
1987-88
Amount Rank
1986-87
Amount Rank
1985-86
Amount Rank
1984-85
Amount Rank
Univ of Colorado, Boulder 105.06% 1 103.60% I 106.32% 1 104.03% 1 97.98% 1 96.89% 1
Univ Cincinnati, Main Campus 58.97% 2 58.04% 4 57.50% 3 53.39% 4 53.62% 4 59.53% 2
Purdue University, Main Campus 57.92% 3 58.52% 2 58.19% 2 55.74% 3 56.67% 3 55.60% 4
Univ of Virginia, Main Campus 57.42% 4 58.24% 3 56.65% 4 58.81% 2 59.97% 2 58.63% 3
University of Arizona 54.42% 5 51.14% 5 48.27% 5 46.58% 5 41.10% 6 37.85% 7
University of Iowa 45.54% 6 47.29% 6 43.21% 6 40.86% 7 39.83% 7 38.38% 5
UNIVERSITY OF UTAH 38.59% 7 37.02% 8 36.18% 8 36.36% 8 32.75% 8 31.25% 9
University of Washington 38.19% 8 38.22% 7 43.20% 7 44.33% 6 43.75% 5 37.94% 6
Univ California, Los Angeles 26.00% 9 26.54% 10 26.37% 9 26.05% 9 29.10% 9 31.84% 8
University of Florida 24.93% 10 28.17% 9 23.92% 10 23.74% 10 20.35% 10 19.02% 10
Univ North Carolina (Ch Hill) 20.22% 11 19.30% 11 19.24% 11 19.33% 11 17.76% 11 17.44% 11
COMPARISON GROUP AVERAGE 43.10% 43.69% 43.05% 42.47% 41.42% 40.65%
PERCENT OF COMP GROUP AVE:
University of Utah 89.55% 84.73% 84.03% 85.61% 79.07% 76.88%
Indicator: TUITION AND FEES % OF INSTRUCTION DIRECT EXPENDITURES
1989-90 1988-89 1987-88
Amount Rank Amount Rank Amount Rank
Comparison Group:
1986-87
Amount Rank
UTAH STATE UNIVERSITY
1985-86 1984-85
Amount Rank Amount Rank
Colorado State University 78.64% 1 76.40% I 75.76% I 71.55% 1 66.18% 2 68.40% I
Univ of Maryland, College Pk 63.60% 2 67.72% 2 69.30% 2 67.45% 2 67.69% 1 66.09% 2
Iowa State University 62.11% 3 64.47% 3 63.73% 3 61.17% 4 45.81% 6 47.40% 5
Virginia Tech University 61.08% 4 60.62% 4 62.84% 4 61.30% 3 60.78% 3 59.92% 3
Oregon State university 54.41% 5 50.54% 6 48.49% 6 48.76% 5 53.70% 4 55.39% 4
Washirgton State University 52.75% 6 52.80% 5 38.70% 9 38.54% 9 39.36% 7 35.37% 8
Texas A & M University 52.42% 7 43.49% 8 49.76% 5 43.34% 6 47.83% 5 31.22% 9
UTAH STATE UNIVERSITY 44.84% 8 42.08% 9 39.06% 8 39.40% 8 36.38% 9 38.50% 6
New Mexico State University 43.61% 9 43.71% 7 47.20% 7 43.19% 7 38.42% 8 38.38% 7
North Carolina State Univ 28.14% 10 26.50% 10 26.06% 10 26.55% 10 26.76% 10 26.99% 10
Univ of California, Davis 24.43% 11 25.41% 11 24.53% 11 22.64% 11 25.61% 11 26.93% 11
COMPARISON GROUP AVERAGE 49.09% 48.13% 47.20% 45.16% 44.69% 43.41%
PERCENT OF COMP GROUP AVE:
Utah State University 91.34% 87.43% 82.76% 87.25% 81.41% 88.69%

INDCTRS FINANCIAL COMPARISON INDICATORS 30-Jul-92
Indicator: TUITION AND FEES % OF INSTRUCTION DIRECT EXPENDITURES Comparison Group: COMPREHENSIVE INSTITUTIONS
1989-90
Amount Rank
1988-89
Amount Rank
1987-88
Amount Rank
1986-87
Amount Rank
1985-86
Amount Rank
1984-85
Amount Rank
Univ of Southern Colorado 85.82% 1 71.35% 1 73.38% 1 79.54% 1 83.37% 1 84.21% 1
Indiana University Northwest 66.96% 2 61.88% 3 62.91% 2 51.78% 4 49.40% 5 47.75% 4
Eastern Washington University 61.20% 3 58.72% 4 57.87% 4 50.61% 5 52.45% 4 46.31% 5
Southern Oregon State College 58.68% 4 63.45% 2 60.11% 3 59.19% 2 62.06% 2 64.69% 2
Univ of Wisconsin, Oshkosh 55.34% 5 55.04% 6 48.76% 7 47.94% 6 45.27% 6 45.03% 6
SOUTHERN UTAH UNIVERSITY 55.22% 6 56.80% 5 53.00% 5 53.02% 3 41.97% 9 43.21% 9
Austin Peay State University 54.35% 7 48.97% 8 49.18% 6 46.13% 8 43.07% 8 44.18% 8
WEBER STATE UNIVERSITY 51.19% 8 48.30% 9 45.64% 9 42.72% 10 38.86% 11 40.32% 11
Boise State University 43.93% 9 41.60% 11 40.61% 11 40.28% 11 41.64% 10 42.59% 10
Univ of Nevada, Las Vegas 43.88% 10 49.93% 7 46.59% 8 47.40% 7 54.07% 3 51.01% 3
SUNY College at Brockport 41.03% 11 45.12% 10 41.86% 10 42.89% 9 44.10% 7 44.64% 7
Calif St Univ, Dominguez Hills 34.50% 12 33.74% 12 27.94% 12 29.12% 12 37.61% 12 36.83% 12
COMPARISON GROUP AVERAGE 52.16% 51.15% 48.97% 47.65% 49.72% 49.11%
PERCENT OF COMP GROUP AVE:
Southern Utah University 105.88% 111.04% 108.22% 111.27% 84.41% 87.99%
Weber State University 98.15% 94.42% 93.19% 89.65% 78.16% 82.10%
Indicator: TUITIION AND FEES % OF INSTRUCTION DIRECT EXPENDITURES
1989-90 1988-89 1987-88
Amount Rank Amount Rank Amount Rank
Comparison Group:
1986-87
Amount Rank
COMMUNITY COLLEGES
1985-86 1984-85
Amount Rank Amount Rank
UTAH VALLEY COMMUNITY COLLEGE 68.84% 1 65.41% 1 56.84% 3 55.32% 3 45.15% 3 42.55% 4
SALT LAKE COMMUNITY COLLEGE 63.66% 2 56.04% 4 54.67% 4 45.79% 4 43.97% 4 40.10% 6
Onandaga Community College 62.38% 3 61.20% 2 62.81% 1 68.18% 1 66.90% 1 70.72% 1
DIXIE COLLEGE 58.28% 4 55.66% 5 54.39% 5 45.09% 5 40.73% 5 36.34% 7
Yavapai College 53.69% 5 44.44% 8 38.66% 8 36.71% 8 37.62% 8 31.71% 11
Grand Rapids Junior College 53.01% 6 58.83% 3 61.81% 2 58.55% 2 62.24% 2 57.64% 2
SNOW COLLEGE 51.07% 7 43.23% 9 38.23% 9 34.28% 10 28.72% 11 30.04% 12
Anne Arundel Comm College 50.55% 8 48.33% 6 44.55% 6 40.75% 6 40.18% 7 45.12% 3
Joliet Junior College 40.82% 9 40.91% 10 36.02% 10 35.70% 9 40.62% 6 40.63% 5
North Idaho College 38.71% 10 45.67% 7 41.08% 7 39.89% 7 35.10% 10 33.45% 9
Danville Community College 35.48% 11 38.04% 11 34.53% 11 33.71% 11 37.40% 9 33.51% 8
COLLEGE OF EASTERN UTAH 31.78% 12 36.43% 12 32.32% 12 33.66% 12 29.80% 12 32.78% 10
Chemeketa Community College 29.86% 13 27.84% 13 28.79% 14 25.34% 14 23.52% 14 23.17% 14
Western Wyoming Comm College 24.58% 14 25.65% 14 16.96% 15 14.84% 15 11.18% 15 17.31% 15
Spokane Community College 15 24.02% 15 30.02% 13 29.06% 13 25.49% 13 23.26% 13
COMPARISON GROUP AVERAGE 43.10% 43.69% 38.63% 35.89% 35.03% 36.66%
PERCENT OF COMP GROUP AVE:
Utah Valley Community Colleg 159.74% 149.71% 147.13% 154.13% 128.89% 116.07%
Salt Lake Conmunity College 147.72% 128.27% 141.51% 127.58% 125.52% 109.38%
Dixie College 135.23% 127.40% 140.79% 125.63% 116.27% 99.13%
Snow College 118.50% 98.95% 98.96% 95.51% 81.99% 81.94%
College of Eastern Utah 73.74% 83.38% 83.66% 93.78% 85.07% 89.42%
'V 6
16

INDCTRS
Indicator: ENDOWMENT REVENUE PER FTE
FINANCIAL COMPARISON INDICATORS 30-Jul-92
Comparison Group: UNIVERSITY OF UTAH
1989-90
Amount Rank
1988-89
Amount Rank
1987-88
Amount Rank
1986-87
Amount Rank
1985-86
Amount Rank
1984-85
Amount Rank
Univ of Virginia, Main Campus $1,060 1 $1,010 1 $759 1 $675 1 $685 1 $651 1
Univ Cincinnati, Main Campus $478 2 $467 2 $481 2 $520 2 $491 2 $449 2
UNIVERSITY OF UTAH $473 3 $345 3 $274 3 $264 3 $264 4 $225 4
Univ North Carolina (Ch Hill) $354 4 $248 4 $223 4 $203 4 $200 5 $182 5
University of Arizona $228 5 $168 6 $190 5 $124 7 $171 6 $31 8
University of Washington $202 6 $175 5 $173 6 $171 5 $150 7 $130 6
Purdue University, Main Campus $168 7 $139 7 $131 7 $146 6 $139 8 $105 7
University of Iowa $21 8 $94 8 $94 8 $56 8 $60 9 $25 9
Univ of Colorado, Boulder $16 9 $15 9 $11 9 $11 9 $11 10 $9 10
University of Florida $1 10 $1 10 $1 10 $1 10 $0 11 $0 11
Univ California, Los Angeles $O 11 $0 11 $0 11 $0 11 $371 3 $309 3
COMPARISON GROUP AVERAGE $253 $232 $206 $191 $228 $189
PERCENT OF COMP GROUP AVE:
University of Utah 186.96% 148.71% 133.01% 138.22% 115.79% 119.05%
Indicator: ENDOWMENT REVENUE PER FTE
1989-90
Amount Rank
1988-89
Amount Rank
1987-88
Amount Rank
Comparison Group:
1986-87
Amount Rank
UTAH STATE UNIVERSITY
1985-86 1984-85
Amount Rank Amount Rank
Oregon State University $278 1 $196 1 $168 2 $145 2 $76 8 $96 4
Univ of Maryland, College Pk $260 2 $35 7 $33 9 $25 9 $21 10 $26 10
Texas A & M University $179 3 $152 3 $132 3 $131 3 $118 4 $74 5
New Mexico State University $142 1 $158 2 $117 4 $114 4 $121 3 $114 3
Virginia Tech University $72 5 $18 8 $44 6 $35 7 $30 8 $33 7
UTAH STATE UNIVERSITY $56 6 $44 5 $36 8 $32 8 $28 9 $33 7
North Carolina State Wily $52 7 $44 5 $44 6 $41 6 $38 6 $49 6
Washington State University $26 8 $79 4 $67 5 $60 5 $34 7 $30 9
Iowa State University $3 9 $11 9 $10 10 $10 10 $3 11 $4 11
Colorado State University $0 10 $0 10 $360 1 $367 1 $224 2 $244 2
Univ of California, Davis $0 10 $0 10 $0 11 $0 11 $346 1 $288 1
COMPARISON GROUP AVERAGE $101 $69 $98 $93 $101 $96
PLRCENT OF COMP GROUP AVE:
Utah State University 55.45% 63.77% 36.73% 34.41% 27.72% 34.38%
.17
1 7

INDCTRS FINANCIAL COMPARISON INDICATORS 30-Jul-92111
Indicator: ENDOWMENT REVENUE PER FTE Comparison Group: COMPREHENSIVE INSTITUTIONS
1989-90 1988-89 1987-88 1986-87 1985-86
Amount Rank Amount Rank Amount Rank Amount Rank Amount Rank IUniv of Nevada, Las Vegas $60 1 $67 1 $65 1 $51 I $52 1
SOUTHERN UTAH UNIVERSITY $34 2 $32 2 $31 3 $34 2 $34 2
WEBER STATE UNIVERSITY $34 3 $27 3 $19 4 $22 3 $20 3
Austin Peay State University $15 4 $17 4 $34 2 $14 4 $2 5
Univ of Wisconsin, Oshkosh $8 5 $7 5 $3 5** 5 $3 4
Eastern Washington University $0 6 $0 6 $0 8 $0 9 $0 9
Boise StaLe University $0 6 $0 6 $0 8 $0 9 $0 9
Southern Cregon State College $0 6 $0 6 **?
** 8 ** 8
Calif St Univ, Dominguez Hills $0 6 $0 6 $0 8 ** 6 **6
Indiana University Northwest $0 6 $0 6 ** 6 **7
**7
SUNY College at Brockport $0 6 $0 6 $0 8 $0 9 $0 9
Univ of Southern Colorado $0 6 $0 6 $0 8 $0 9 $0 9
**Less than $0.50
COMPARISON GROUP AVERAGE $8 $9 $10 $7 $6
PERCENT OF COMP GROUP AVE:
Southern Utah University 425.00% 355.56% 310.00% 485.71% 566.67%
Weber State University 425.00% 300.00% 190.00% 314.29% 333.33%
Indicator: ENDOWMENT REVENUE PER FTE
1989-90
Amount Rank
1988-89
Amount Rank
1987-88
Amount Rank
Comparison Group:
1936-87
Amount Rank
DIXIE COLLEGE $26 1 $23 2 $10 2 $8 2
SNOW COLLEGE $13 2 $39 1 $11 1 $14 1
SALT LAKE COMMUNITY COLLEGE $6 3 $6 3 $2 4 $2 3
COLLEGE OF EASTERN UTAH $4 4 $4 4 $3 3 $2 3
Spokane Community College $0 5 $0 5 $0 6 ** 6
North Idaho College $0 5 $O 5 $0 6 $0 7
Onondaga Community College $O 5 $0 5 SO 6 $O 7
Joliet Junior College $0 5 $O 5 SO 6 $0 7
Grand Rapids Junior College $0 5 $0 5 $0 6 $0 7
Chemeketa Community College SO 5 $0 5 $0 6 $0 7
UTAH VALLEY COMMUNITY COLLEGE $0 5 $0 5 $0 6 $0 7
Danville Community College $0 5 $0 5 $1 5 $2 3
Anne Arundel Comm College $0 5 $0 5 $0 6 $O 7
Western Wyoming Comm College $0 5 $0 5 $0 6 $0 7
Yavapai College $0 5 $0 5 $0 6 $0 7
COMPARISON GROUP AVERAGE ** ** ** **
1111984-85
Amount Rank
$68 2
$132 1
$23 3 i$2 4
$2 4
$0 9
$0 9 111
** 8
$1 6**
7
$0 9 I$0 9
i$7
1885.71%
328.57% 111
ICOMMUNITY COLLEGES
1985-86 1984-85111
Amount Rank Amount Rank
$8 3 $1 5 I$15 2 $14 1
$2 5 S2 4
$18 1 $10 2
$0 8 $0 6 1$0 8 $0 6
$O 8 $O 6
$0 8 $0 6
$0 8 $0 6
$0 8 $0 6 I$2 5 $10 2
$2 5 $0 6 II
II$3 4 $0 6
$0 8 $0 6
$0 8 $0 6
** ** 1PERCENT OF COMP GROUP AVE:
Snow College
Dixie College
1Salt Lake Community College
College of Eastern Utah
Utah Valley Community College
I

INDCTRS FINANCIAL COMPARISON INDICATORS 30-Jul-92
Indicator: GOVERNMENT GRANTS AND CONTRACTS PER FTE Comparison Group: UNIVERSITY OF UTAH
1989-90
Amount Rank
1988-89
Amount Rank
1987-88
Amount Rank
1986-87
Amount Rank
1985-86
Amount Rank
1984-85
Amount Rank
University of Washington $9,534 1 $8,792 1 $7,635 1 $7,036 1 $6,610 1 $5,959 1
Univ California, Los Angeles $6,799 2 $6,707 2 $5,511 2 $5,684 2 $5,278 2 $4,609 3
Univ North Carolina (Ch Hill) $6,389 3 $6,033 3 $5,410 3 $4,877 3 $4,603 3 $4,805 2
UNIVERSITY OF UTAH $5,637 4 $4,516 4 $4,437 4 $3,818 4 $3,650 4 $3,444 4
University of Arizona $4,325 5 $3,961 6 $3,753 5 $3,514 5 $3,244 5 $2,910 5
Univ of Virginia, Main Campus $4,296 6 $3,854 8 $3,558 7 $3,114 6 $3,238 6 $2,822 6
University of Iowa $4,208 7 $3,936 7 $3,494 8 $2,990 8 $2,880 7 $2,604 7
Univ of Colorado, boulder $3,818 8 $3,678 9 $3,063 9 $2,793 9 $2,713 9 $2,588 8
University of Florida $3,534 9 $4,000 5 $3,665 6 $3,096 7 $2,850 8 $2,441 9
Univ Cincinnati, Main Campus $3,020 10 $2,501 10 $2,121 11 $2,075 11 $1,894 11 $1,732 11
Purdue University, Main Campus $2,460 11 $2,369 11 $2,376 10 $2,219 10 $2,184 10 $1,953 10
COMPARISON GROUP AVERAGE $4,838 $4,583 $4,059 $3,740 $3,549 $3,242
PERCENT OF COMP GROUP AVE:
University of Utah 116.52% 98.54% 109.31% 102.09% 102.85% 106.23%
Indicator: GOVERNMENT GRANTS AND CONTRACTS PER FTE
1989-90 1988-89
Amount Rank Amount Rank
1987-88
Amount Rank
Comparison Group:
1986-87
Amount Rank
UTAH STATE UNIVERSITY
1985-86 1984-85
Amount Rank Amount Rank
UTAH STATE UNIVERSITY $7,337 1 $5,865 1 $5,065 1 $4,193 2 $4,105 2 $3,491 3
Univ of California, Davis $5,600 2 $5,027 2 $4,362 3 $4,170 3 $3,826 3 $3,252 4
New Mexico State University $5,344 3 $4,493 3 $4,276 4 $3,929 4 $3,419 4 $3,527 2
Oregon State University $4,807 4 $4,301 4 $4,587 2 $4,430 1 $4,350 1 $4,255 1
Colorado State University 5 $3,773 5 $3,430 5 $3,158 5 $2,647 5 $2,347 5
Virginia Tech University
.$3,680
$3,451 6 $3,098 6 $2,522 7 $2,292 8 $2,314 7 $1,957 8
Washington State University $3,177 7 $2,707 8 $2,378 8 $2,302 7 $2,242 8 $2,114 7
Univ of Maryland, College Pk $3,110 8 $3,042 7 $2,844 6 $2,767 6 $2,510 6 $2,199 6
Iowa State University $2,731 9 $2,371 9 $1,693 10 $1,780 10 $1,455 10 $1,692 10
North Carolina State Univ $2,448 10 $2,204 10 $1,955 9 $1,900 9 $1,792 9 $1,775 9
Texas A & M University $1,650 11 $1,363 11 $1,132 11 $1,170 11 $793 11 $626 11
COMPARISON GROUP AVERAGE $3,600 $3,238 $2,918 $2,790 $2,535 $2,374
PERCENT OF COMP GROUP AVE:
Utah State University 203.81% 181.13% 173.58% 150.29% 161.93% 147.05%
19

INDCTRS FINANCIAL COMPARISON INDICATORS 30-Jul-92
Indicator: GOVERNMENT GRANTS AND CONTRACTS PER FTE Comparison Group: COMPREHENSIVE INSTITUTIONS
1989-90
Amount Rank
1988-89
Amount Rank
1987-88
Amount Rank
1986-87
Amount Rank
1985-86
Amount Rank
1984-85
Amount Rank
Univ of Southern Colorado $2,098 1 $2,091 1 $1,904 1 $2,034 1 $1,771 1 $1,452 1
SOUTHERN UTAH UNIVERSITY $1,540 2 $1,278 4 $1,103 4 $1,082 4 $1,116 2 $1,041 2
Eastern Washington University $1,435 3 $1,293 3 $1,130 3 $1,015 6 $860 6 $731 6
Boise State University $1,179 4 $1,298 2 $629 9 $556 12 $960 4 $677 8
SUNY College at Brockport $1,142 5 $1,070 6 $1,024 5 $1,133 2 $879 5 $875 4
Univ of Nevada, Las Vegas $1,099 6 $1,275 5 $1,173 2 $1,038 5 $859 7 $769 5
Southern Oregon State College $1,045 7 $1,032 8 $980 6 $1,101 3 $1,091 3 $982 3
WEBER STATE UNIVERSITY $1,003 8 $1,047 7 $897 7 .;808 7 $781 8 $705 7
Austin Peay State University $851 9 $909 9 $884 8 $631 10 $630 11 $638 9
Indiana University Northwest $791 10 $744 11 $584 11 $632 9 $719 9 $546 12
Univ of Wisconsin, Oshkosh $735 11 $761 10 $609 10 $583 11 $621 12 $578 10
Calif St Univ, Dominguez Hills $493 12 $540 12 $461 12 $699 8 $633 10 $569 11
COMPARISON GROUP AVERAGE $1,087 $1,101 $938 $942 $902 $782
PERCENT OF COMP GROUP AVE:
Southern Utah University 141.67% 116.08% 117.59% 114.86% 123.73% 133.12%
Weber State University 92.27% 95.10% 95.63% 85.77% 86.59% 90.15%
Indicator: GOVERNMENT GRANTS AND CONTRACTS PER FTE
1989-90 1988-89
Amount Rank Amount Rank
1987-88
Amount Rank
Comparison Group:
1986-87
Amount Rank
COMMUNITY COLLEGES
1985-86 1984-85
Amount Rank Amount Rank
COLLEGE OF EASTERN UTAH $1,763 1 $1,546 1 $1,450 1 $1,631 1 $1,705 1 $1,680 1
SNOW COLLEGE $1,307 2 $1,170 5 $1,232 2 $1,031 2 $1,103 3 $1,116 2
DIXIE COLLEGE $1,303 3 $1,118 6 $1,002 5 $767 9 $758 9 $735 5
Chemeketa Community College $1,195 4 $1,258 4 $1,060 4 $1,050 3 $914 4 $729 6
SALT LAKE COMMUNITY COLLEGE $1,164 5 $1,288 3 $973 6 $778 8 $765 8 $711 7
UTAH VALLEY COMMUNITY COLLEGE $976 6 $877 9 $738 10 $575 12 $650 10 $528 9
Onandaga Community College $965 7 $1,029 7 $907 7 $633 11 $385 14 $318 13
North Idaho College $873 8 $955 8 838 8 $903 6 $1,321 2 $1,069 3
Western Wyoming Comm College $789 9 $876 10 $804 9 $847 7 $800 6 $525 10
Grand Rapids Junior College $694 10 $822 11 $591 11 $1,001 5 $808 5 $907 4
Yavapai College $640 11 $632 12 $465 13 $687 10 $578 11 $481 11
Danville Community College $518 12 $605 13 $496 12 $461 13 $459 12 $454 12
Joliet Junior College $475 13 $421 14 $420 14 $111 15 $432 13 $375 14
Anne Arundel Comm College $194 14 $243 15 $208 15 $199 14 $212 15 $160 15
Spokane Community College 15 $1,382 2 $1,138 3 $1,008 4 $780 7 $550 8
COMPARISON GROUP AVERAGE $705 $822 $693 $690 $669 $557
PERCENT OF COMP GROUP AVE:
College of Eastern Utah 250.07% 188.08% 209.24% 236.38% 254.86% 301.62%
Snow Colir!e 185.39% 142.34% 177.78% 149.42% 164.87% 200.36%
Dixie College 184.82% 136.01% 144.59% 111.16% 113.30% 131.96%
Salt Lake Community College 165.11% 156.69% 140.40% 112.75% 114.35% 127.65%
Utah Valley Community Colleg 138.44% 106.69% 106.49% 83.33% 97.16% 94.79%
20
1

INDCTRS FINANCIAL COMPARISON INDICATORS 30-Jul-92
Indicator: PRIVATE GIFTS, GRANTS, & CONTRACTS PER FTE Comparison Group: UNIVERSITY OF UTAH
1989-90
Amount Rank
1988-89
Amount Rank
1987-88
Amount Rank
1986-87
Amount Rank
1985-86
Amount Rank
1984-85
Amount Rank
University of Florida $3,364 1 $2,821 1 $1,968 3 $1,464 1 $1,708 2 $1,495 2
Univ California, Los Angeles $3,036 2 $2,469 2 $2,121 1 $1,887 1 $1,789 1 $1,509 1
Univ of Virginia, Main Campus $2,697 3 $2,038 4 $1,697 4 $1,253 2 $1,200 5 $1,067 5
Univ North Carolina (Ch Hill) $2,361 4 $2,158 3 $2,020 2 $1,644 3 $1,498 3 $1,470 3
University of Washington $1,760 5 $1,704 5 $1,585 5 $1,702 2 $1,408 4 $1,209 4
Univ-rsitv of Iowa $1,202 6 $1,061 8 $944 8 $746 10 $715 10 $582 9
Unive-sity of Arizona $1,200 7 $1,404 7 $1,182 6 $1,172 6 $1,142 6 $950 6
Univ Cincinnati, Main Campus $1,018 8 $954 10 $891 9 $913 8 $800 9 $447 10
Purdue University, Main Campus $991 9 $992 9 $1,046 7 $898 9 $936 7 $906 7
Univ of Colorado, Boulder $845 10 $749 11 $773 10 $583 11 $553 11 $428 11
UNIVERSITY OF UTAH $447 11 $1,466 6 $758 11 $1,029 7 $905 8 $771 8
COMPARISON GROUP AVERAGE $1,847 $1,635 $1,423 $1,226 $1,175 $1,006
PERCENT OF COMP GROUP AVE:
University of Utah 24.20% 89.66% 53.27% 83.93% 77.n2% 76.64%
Indicator: PRIVATE GIFTS, GRANTS, & CONTRACTS PER FTE
1989-90 1988-89
Amount Rank Amount Rank
1987-88
Amount Rank
Comparison Group:
1986-87
Amount Rank
UTAH STATE UNIVERSITY
1985-F.6 1984-85
Amount Rank Amount Rank
North Carolina State Univ $1,732 1 $1,747 1 $1,585 1 $1,256 1 $1,150 1 $891 2
Univ of California, Davis $1,652 2 $1,354 3 $1,191 4 $939 4 $1,054 3 $876 3
Texas A & M University $1,617 3 $1,463 2 $1,497 2 $1,187 2 $1,237 2 $1,121 1
Oregon State University $1,236 4 $1,264 4 $1,366 3 $826 6 $800 6 $759 4
Virginia Tech University $1,212 5 $891 6 $806 6 $747 7 $636 9 $558 8
Washington State University $1,152 6 $1,112 5 $999 5 $903 5 $830 5 $601 7
Iowa State University $898 7 $792 8 $661 8 $695 8 $784 7 $725 5
UTA STATE UNIVERSITY $809 8 $792 7 $599 9 $557 9 $649 8 $539 9
New Mexico State University $697 9 $640 9 $779 7 $1,115 3 $973 4 $663 6
Univ of Maryland, College Pk $568 10 $470 10 $411 10 $287 10 $289 11 $252 11
Colorado State University $383 11 $403 11 $0 11 $0 11 $503 10 $414 10
COMPARISON GROUP AVERAGE $1,115 $1,014 $930 $796 $826 $686
PERCENT OF COMP GROUP AV :
Utah State University 72.56% 78.11% 64.41% 69.97% 78.57% 78.57%
21 4

INDCTRS FINANCIAL COMPARISON INDICATORS 30-Jul-92
Indicator: PRIVATE GIFTS, GRANTS, & CONTRACTS PER FTE Comparison Group: COMPREHENSIVE INSTITUTIONS
1989-90
Amount Rank
1988-89
Amount Rank
1987-88
Amount Rank
1986-87
Amount Rank
1985-86
Amount Rank
1984-85
Amount Rank
Univ of Nevada, Las Vegas $513 1 $532 1 $463 1 $498 1 $317 1 $426 1
SUNY College at Brockport $297 2 $282 2 $290 2 $217 2 $178 2 $124 3
Eastern Washington University $284 3 $240 4 $168 4 $180 5 $99 7 $89 7
Southern Oregon State College $279 4 $231 5 $223 3 $193 4 $153 3 $125 2
WEBER STATE UNIVERSITY $265 5 $184 6 $166 5 $205 3 $127 6 $104 6
Boise State University $187 6 $270 3 $147 6 $149 6 $133 4 $108 5
SOUTHERN UTAH UNIVERSITY $143 7 $105 8 $140 7 $133 7 $132 5 $123 4
Austin Peay State University $125 8 $102 9 $108 8 $61 9 $49 8 $46 8
Indiana University Northwest $115 9 $163 7 $51 10 $52 10 $26 10 $36 9
Univ of Wisconsin, Oshkosh $81 10 $46 10 $52 9 $25 11 $21 11 $14 11
Calif St Univ, Dominguez Hills $32 11 $45 11 $0 11 $114 8 $30 9 $31 10
Univ of Southern Colorado $0 12 $0 12 $0 11 $0 12 $0 12 $0 12
COMPARISON GROUP AVERAGE $191 $191 $150 $149 $100 $100
PERCENT OF COMP GROUP AVE:
Weber State University 138.74% 96.34% 110.67% 137.58% 127.00% 104.00%
Southern Utah University 74.87% 54.97% 93.33% 89.26% 132.00% 123.00%
Indicator: PRIVATE GIFTS, GRANTS, & CONTRACTS PER FTE
1989-90 1988-89
Amount Rank Amount Rank
1987-88
Amount Rank
Comparison Group:
1986-87
Amount Rank
COMMUNITY COLLEGES
1985-86 1984-85
Amount Rank Amount Rank
SNOW COLLEGE $136 1 $57 4 $127 2 $73 3 $32 7 $44 7
DIXIE COLLEGE $126 2 $142 1 $132 1 $77 2 $160 2 $129 2
North Idaho College $95 3 $56 5 $44 5 $51 4 $53 6 $50 6
SALT LAKE COMMUNITY COLLEGE $80 4 $14 8 $24 7 $22 9 $21 8 $12 8
Danville Community College $65 5 $29 6 $25 6 $23 8 $74 4 $107 3
COLLEGE OF EASTERN UTAH $49 6 $79 2 $96 3 $78 1 $84 3 $95 4
Western Wyoming Comm College $21 7 $16 7 $15 9 $26 7 $18 9 $0 11
Anne Arundel Comm College $16 8 $0 14 $0 13 $0 12 $62 5 $67 5
Yavapai College $12 9 $5 11 $20 8 $6 11 $0 12 $0 11
UTAH VALLEY COMMUNITY COLLEGE $7 10 $6 10 $11 11 $13 10 $2 11 $5 10
Onondaga Community College $3 11 $5 11 $4 12 $0 12 $0 12 $0 11
Grand Rapids Junior College $2 12 $8 9 $0 13 $0 12 $0 12 $0 11
Joliet Junior College $0 13 $4 13 $12 10 $32 6 $273 1 $232 1
Chemeketa Community College $0 13 $0 14 $0 13 $0 12 $0 12 $0 11
Spokane Community College 15 $73 3 $68 4 $39 5 $7 10 $8 9
COMPARISON GROUP AVERAGE $24 $20 $19 $18 $49 $46
PERCENT OF COMP GROUP AVE:
Snow College 566.67% 285.00% 668.42% 405.56% 65.31% 95.65%
Dixie College 525.00% 710.00% 694.74% 427.78% 326.53% 280.43%
Salt Lake Community College 333.33% 70.00% 126.32% 122.22% 42.86% 26.09%
College of Eastern Utah 204.17% 395.00% 505.26% 433.33% 171.43% 206.52%
Utah Valley Community Colleg 29.17% 30.00% 57.89% 72.22% 4.08% 10.87%
412
22

INDCTRS FINANCIAL COMPARISON INDICATORS 30-Jul-92
Indicator: TOTAL REVENUES PER FTE Comparison Group: UNIVERSITY OF UTAH
1989-90
Amount Rank
1988-89
Amount Rank
1987-88
Amount Rank
1986-87
Amount Rank
1985-86
Amount Rank
1984-85
Amount Rank
Univ California, Los Angeles $31,469 1 $30,026 1 $26,874 1 $25,847 1 $25,877 1 $23,224 1
Univ North Carolina (Ch Hill) $27,298 2 $25,534 2 $24,450 2 $22,227 2 $21,915 2 $20,227 2
University of Washington $26,368 3 $24,465 3 $21,642 3 $20,489 3 $18,830 3 $16,837 3
University of Florida $22,394 4 $21,408 4 $18,806 4 $16,628 4 $14,356 6 $13,745 6
Univ of Virginia, Main Campus $20,275 5 $18,619 5 $16,803 5 $15,031 7 $16,975 4 $15,351 4
UNIVERSITY OF UTAH $19,337 6 $18,351 6 $16,512 6 $15,456 5 $15,056 5 $13,845 5
University of Iowa $17,434 7 $16,030 8 $13,956 8 $12,535 10 $13,025 9 $12,410 9
University of Arizona $17,111 8 $16,842 7 $15,882 7 $15,111 6 $14,313 7 $12,774 8
Univ Cincinnati, Main Campus $15,565 9 $13,939 9 $12,913 10 $13,160 8 $13,457 8 $13,004 7
Purdue University, Main Campus $14,106 10 $13,486 10 $13,392 9 $12,761 9 $12,161 10 $11,076 10
Univ of Colorado, Boulder $13,000 11 $12.313 11 $11,548 11 $10,596 11 $9,661 11 $9,024 11
COMPARISON GROUP AVERAGE $20,502 $19,266 $17,627 $16,439 $16,107 $14,767
PERCENT OF COMP GROUP AVE:
University of Utah 94.32% 95.25% 93.67% 94.08% 93.47% 93.76%
Indicator: TOTAL REVENUES PER FTE
1989-90
Amount Rank
1988-89
Amount Rank
1987-88
Amount Rank
Comparison Group:
1986-87
Amount Rank
UTAH STATE UNIVERSITY
1985-86 1984-85
Amount Rank Amount Rank
Univ of California, Davis $28,474 1 $26,885 1 $24,857 1 !,23,873 1 $23,708 1 $21,135 1
North Carolina State Univ $18,609 2 $18,156 2 $17,568 2 $15,787 2 $15,106 3 $13,811 3
UTAH STATE UNIVERSITY $17,660 3 $16,239 3 $14,901 4 $13,732 5 $13,950 4 $12,370 5
Virginia Tech University $17,062 4 $15,715 5 $14,401 5 $13,483 6 $12,617 7 $11,637 7
Oregon State University $16,847 5 $15,509 6 $15,971 3 $14,467 4 $13,684 5 $12,696 4
Washington State University $16,685 6 $15,827 4 $13,833 7 $13,158 7 $12,553 8 $11,729 6
Texas A & M University $16,124 7 $14,843 8 $13,938 6 $15,062 3 $16,285 2 $14,742 2
Iowa State University $15,326 8 $14,315 9 $12,479 10 $12,143 9 $10,281 11 $9,955 10
New Mexico State University $15,115 9 $13,328 11 $12,791 9 $12,777 8 $12,682 6 $11,618 8
Univ of Maryland, College Pk $14,992 10 $15,120 7 $12,893 8 $11,674 10 $10,711 10 $9,652 11
Colorado State University $14,176 11 $13,758 10 $12,326 11 $11,671 11 $11,045 9 $10,450 9
COMPARISON GROUP AVERAGE $17,341 $16,346 $15,106 $14,409 $13,867 $12,742
PERCENT OF COMP GROUP AVE:
Utah State University 101.84% 99.35% 98.64% 95.30% 100.60% 97.08%
4132 3

INDCTRS FINANCIAL COMPARISON INDICATORS
Indicator: TOTAL REVENUES PER FTE Comparison Group:
30-Jul-92
COMPREHENSIVE INSTITUTIONS
1989-90
Amount Rank
1988-89
Amount Rank
1987-88
Amount Rank
1986-87
Amount Rank
1985-86
Amount Rank
Calif St Univ, Dominguez Hills $10,315 1 $11,892 1 $8,997 3 $10,635 1 $8,980 2
Univ of Nevada, Las Vegas $9,149 2 $8,547 3 $8,244 4 $8,039 3 $7,444 3
SUNY College at Brockport $8,975 3 $8,967 2 $9,505 1 $9,533 2 $9,152 1
Eastern Washington University $8,935 4 $8,449 4 $7,931 5 $7,256 5 $6,414 6
SOUTHERN UTAH UNIVERSITY $7,840 5 $7,266 7 $6,718 7 $6,588 6 $6,941 4
Univ of Southern Colorado $7,637 6 $7,542 6 $7,291 6 $7,366 4 $6,475 5
Boise State University $7,300 7 $7,548 5 $6,303 9 $6,020 11 $6,078 7
Southern Oregon State College $7,010 8 $6,487 11 $6,238 10 $6,309 8 $5,883 10
Indiana University Northwest $6,892 9 $6,793 9 $6,311 8 $6,069 9 $5,936 9
Austin Peay State University $6,634 10 $7,179 8 $9,195 2 $6,417 7 $5,460 11
WEBER STATE UNIVERSITY $6,627 11 $6,496 10 $6,154 11 $6,053 10 $6,023 8
Univ of Wisconsin, Oshkosh $6,528 12 $6,076 12 $5,600 12 $5,131 12 $5,120 12
COMPARISON GROUP AVERAGE $7,938 $7,948 $7,562 $7,278 $6,694
PERCENT OF COMP GROUP AVE:
Southern Utah University 98.77% 91.42% 88.84% 90.52% 103.69%
Weber State University 83.48% 81.73% 81.38% 83.17% 89.98%
Indicator: TOTAL REVENUES PER FTE
1989-90
Amount Rank
1988-89
Amount Rank
1987-88
Amount Rank
Comparison Group:
1986-87
Amount Rank
Western Wyoming Comm College $8,685 1 $8,638 1 $8,649 2 $10,721 1
North Idaho College $7,350 2 $6,987 3 $6,522 5 $6,602 2
SNOW COLLEGE $7,152 3 $7,250 2 $7,376 3 $6,500 5
COLLEGE OF EASTERN UTAH $6,856 4 $6,336 5 $6,344 6 $6,565 4
Chemeketa Community College $6,771 5 $6,292 6 $6,793 4 $6,589 3
Onondaga Community College $6,521 6 $6,509 4 $5,980 7 $5,466 6
DIXIE COLLEGE $6,168 7 $5,933 7 $5,538 8 $4,818 11
Yavapai College $6,142 8 $5,437 11 $4,951 12 $5,086 8
SALT LAKE COMMUNITY COLLEGE $5,767 9 $5,928 8 $5,299 9 $4,779 12
Grand Rapids Junior College $5,693 10 $5,647 9 $10,226 1 $4,977 9
UTAH VALLEY COMMUNITY COLLEGE $5,063 11 $4,979 12 $4,416 13 $4,496 13
Danville Community College $4,776 12 $4,843 13 $4,953 11 $5,179 7
Joliet Junior College $4,728 13 $4,676 14 $4,392 14 $4,265 14
Anne Arundel Comm College $4,479 14 $4,217 15 $4,247 15 $4,188 15
Spokane Community College 15 $5,500 10 $5,207 10 $4,928 10
COMPARISON GROUP AVERAGE $6,127 $5,875 $6,192 $5,800
PERCENT OF COMP GROUP AVE:
Snow College 116.73% 123.40% 119.12% 112.07%
College of Eastern Utah 111.90% 107.85% 102.45% 113.19%
Dixie College 100.67% 100.99% 89.44% 83.07%
Salt Lake Community College 94.12% 100.90% 85.58% 82.40%
Utah Valley Community Colleg 82.63% 84.75% 71.32% 77.52%
414
24
1984-85
Amount Rank
$8,313 2
$7,044 3
$8 990 1
$6,169 5
$6,457 4
$5,485 7
$5,240 9
$5,314 8
$5,072 10
$4,816 12
$5,777 5
$5,056 11
$6,150
104.99%
93.93%
COMMUNITY COLLEGES
1985-86 1984-85111
Amount Rank Amount Rank
$10,870 1 $9,077 1
$6,911 3 $6,139 4
$6,851 4 $6,495 3
$7,172 2 $7,695 2
$5,803 5 $5,458 5
$5,045 7 $4,718 7
$4,762 8 $4,688 8
$4,662 11 $4,459 11
$4,703 10 $4,481 10
$4,720 9 $4,753 6
$4,187 14 $3,936 14
$5,092 6 $4,636 9
$3,740 15 $4,004 12
$4,328 13 $3,965 13
$4,483 12 $3,819 15
$5,566 $5,103
123.09% 127.28%
128.85% 150.79%
85.56% 91.87%
84.50% 87.81%
75.22% 77.13%

INDCTRS FINANCIAL COMPARISON INDICATORS 30-Jul-92
Indicator: INSTRUCTION EXPENDITURES PER FTE Comparison Group: UNIVERSITY OF UTAH
1989-90
Amount Rank
1988-89
Amount Rank
1987-88
Amount Rank
1986-87
Amount Rank
1985-86
Amount Rank
1984-85
Amount Rank
Univ California, Los Angeles $12,867 1 $11,739 1 $10,595 1 $10,104 1 $9,576 1 $8,336 1
Univ North Carolina (Ch Hill) $11,103 2 $10,044 2 $9,597 2 $9,271 2 $8,761 2 $8,261 2
University of Washington $9,610 3 $9,286 3 $8,189 3 $7,633 3 $6,263 3 $5,909 3
Univ of Virginia, Main Campus $7,618 4 $6,909 4 $6,523 4 $5,890 4 $5,633 5 $5,083 5
University of Florida $7,239 5 $5,624 7 $6,326 5 $5,534 5 $5,652 4 $5,411 4
University of Iowa $6,708 6 $6,043 5 $5,730 6 $5,140 8 $4,919 9 $4,721 7
Univ Cincinnati, Main Campus $6,252 7 $5,703 6 $5,190 10 $5,531 6 $5,110 7 $4,463 9
Purdue University, Main Campus $5,730 8 $5,289 10 $5,346 7 $5,276 7 $4,842 10 $4,392 10
UNIVERSITY OF UTAH $5,725 9 $5,527 8 $5,265 9 $5,129 10 $5,139 6 $4,688 8
University of Arizona $5,638 10 $5,450 9 $5,320 8 $5,137 9 $5,002 8 $4,742 6
Univ of Colorado, Boulder $4,509 11 $4,362 11 $3,987 11 $3,749 11 $3,507 11 $3,219 11
COMPARISON GROUP AVERAGE $7,727 $7,045 $6,680 $6,327 $5,927 $5,454
PERCENT OF COMP GROUP AVE:
University of Utah 74.09% 78.45% 78.82% 81.07% 86.70% 85.96%
Indicator: INSTRUCTION EXPENDITURES PER FTE
1989-90
Amount Rank
1988-89
Amount Rank
1987-88
Amount Rank
Comparison Group:
1986-87
Amount Rank
UTAH STATE UNIVERSITY
1985-86 1984-85
Amount Rank Amount Rank
Univ of California, Davis $10,401 1 $9,554 1 $8,858 1 $8,665 1 $8,088 1 $7,333 1
North Carolina State Univ $6,226 2 $5,986 2 $5,893 2 $5,319 2 $5,012 2 $4,561 2
Virginia Tech University $5.758 3 $5,322 3 $5,006 3 $4,674 3 $4,311 3 $3,997 3
Univ of Maryland, College Pk $5,129 4 $4,482 7 $4,000 9 $3,736 9 $3,401 10 $3,312 9
Washington State University $5,016 5 $4,994 5 $4,496 4 $4,297 4 $4,063 6 $3,825 5
Colorado State University $4,888 6 $4,618 6 $4,163 7 $4,025 7 $4,039 7 $3,756 6
Texas A & M University $4,823 7 $5,291 4 $4,218 6 $4,119 5 $4,179 4 $3,959 4
Iowa State University $4,735 8 $4,126 9 $3,736 10 $3,549 10 $3,403 9 $3,403 8
H1AH STATE UNIVERSITY $4,400 9 $4,311 8 $4,229 5 $4,094 6 $4,154 5 $3,665 7
Oregon State University $4,172 10 $4,052 10 $4,131 8 $3,942 8 $3,613 8 $3,311 10
New Mexico State University $3,378 11 $3,203 11 $2,979 11 $2,915 11 $2,944 11 $2,676 11
COMPARISON GROUP AVERAGE $5,453 $5,163 $4,748 $4,524 $4,305 $4,013
PERCENT OF COMP GROUP AVE:
Utah State University 80.69% 83.50% 89.07% 90.5C, 96.49% 91.33%
41525

INDCTRS FINANCIAL COMPARISON INDICATORS
Indicator: INSTRUCTION EXPENDITURES PER FTE Comparison Group:
30-Jul-92
COMPREHENSIVE INSTITUTIONS
1989-90
Amount Rank
1988-89
Amount Rank
1987-88
Amount Rank
1986-87
Amount Rank
1985-86
Amount Rank
1984-85
Amount Rank
Calif St Univ, Dominguez Hills $5,663 1 $5,362 1 $4,896 1 $4,646 1 $3,802 1 $3,592 1
SUNY College at Brockport $3,797 2 $3,522 2 $3,786 3 $3,749 2 $3,560 2 $3,497 2
Eastern Washington University $3,745 3 $3,474 4 $3,380 4 $3,175 3 $2,816 5 $2,710 4
Univ of Nevada, Las Vegas $3,560 4 $2,986 8 $2,874 9 $2,772 10 $2,632 9 $2,482 6
Boise State University $3,328 5 $3,517 3 $3,140 5 $3,049 5 $2,877 4 $2.468 7
Southern Oregon State College $3,180 6 $2,889 10 $2,830 10 $2,850 9 $2,512 10 $2,294 9
Univ of Wisconsin, Oshkosh $3,106 7 $2,945 9 $3,072 6 $2,889 8 $2,748 6 $2,547 5
Austin Peay State University $3,080 8 $3,398 5 $4,260 2 $3,063 4 $2,661 8 $2,345 8
WEBER STATE UNIVERSITY $3,014 9 $3,006 7 $2,923 7 $3,010 6 $2,988 3 $2,820 3
Indiana University Northwest $2,884 10 $3,064 6 $2,896 8 $2,895 7 $2,743 7 $2,164 10
SOUTHERN UTAH UNIVERSITY $2,508 11 $2,199 12 $2,130 12 $2,069 12 $2,316 11 $2,164 10
Univ of Southern Colorado $2,455 12 $2,646 11 $2,498 11 $2,395 11 $2,086 12 $1,951 12
COMPARISON GROUP AVERAGE $3,480 $3,380 $3,363 $3,148 $2,844 $2,631
PERCENT OF COMP GROUP AVE:
Weber State University 86.61% 88.93% 86.92% 95.62% 105.06% 107.18%
Southern Utah University 72.07% 65.06% 63.34% 65.72% 81.43% 82.25%
Indicator: INSTRUCTION EXPENDITURES PER FTE
1989-90
Amount Rank
1988-89
Amount Rank
1987-88
Amount Rank
Comparison Group:
1986-87
Amount Rank
COMMUNITY COLLEGES
1985-86 1984-85
Amount Rank Amount Rank
Western Wyoming Comm College $3,791 1 $3,676 1 $3,927 1 $4,670 1 $4,776 1 $3,010 1
Grand Rapids Junior College $3,273 2 $3,216 2 $2,956 3 $2,615 5 $2,460 6 $2,741 4
Chemeketa Community College $3,158 3 $2,924 4 $2,932 4 $3,216 2 $3,015 3 $2,836 3
North Idaho College $2,924 4 $3,072 3 $2,970 2 $2,968 3 $3,191 2 $2,855 2
Onondaga Community College $2,905 5 $2,879 5 $2,587 6 $2,178 12 $2,109 11 $1,981 11
Joliet Junior College $2,599 6 $2,486 9 $2,535 7 $2,291 10 $1,780 15 $1,841 14
COLLEGE OF EASTERN UTAH $2,530 7 $1,993 14 $2,296 12 $2,335 8 $2,681 5 $2,688 5
Anne Arundel Comm College $2,467 8 $2,280 11 $2,341 11 $2,405 7 $2,250 9 $2,090 10
Danville Community College $2,466 9 $2,608 7 $2,624 5 $2,676 4 $2,449 7 $2,438 6
SALT LAKE COMMUNITY COLLEGE $2,383 10 $2,600 8 $2,398 10 $2,481 6 $2,404 8 $2,267
DIXIE COLLEGE $2,342 11 $2,165 12 $1,936 14 $1,823 15 $1,851 13 $1,852 13
SNOW COLLEGE $2,281 12 $2,320 10 $2,472 8 $2,290 11 $2,754 4 $2,267 7
Yavapai College $2,129 13 $2,041 13 $2,196 13 $2,163 13 $1,850 14 $2,116 9
UTAH VALLEY COMMUNITY COLLEGE $1,996 14 $1,937 15 $1,858 15 $1,916 14 $1,887 12 $1,791 15
Spokane Community College 15 $2,631 6 $2,422 9 $2,316 9 $2,173 10 $1,930 12
COMPARISON GROUP AVERAGE $2,857 $2,781 $2,749 $2,750 $2,606 $2,384
PERCENT OF COMP GROUP AVE:
College of Eastern Utah 88.55% 71.66% 83.52% 84.91% 102.88% 112.75%
Salt Lake Community College 83.41% 93.49% 87.23% 90.22% 92.25% 95.09%
Dixie College 81.97% 77.85% 70.43% 66.29% 71.03% 77.68%
Snow College 79.84% 83.42% 89.92% 83.27% 105.68% 95.09%
Utah Valley Community Colleg 69.86% 69.65% 67.59% 69.67% 72.41% .75.13%
4 ! 626

INDCTRS FINANCIAL COMPARISON INDICATORS 30-Jul-92
Indicator: RESEARCH EXPENDITURES PER FTE Comparison Group: UNIVERSITY OF UTAH
1989-90
Amount Rank
1988-89
Amount Rank
1987-88
Amount Rank
1986-87
Amount Rank
1985-86
Amount Rank
1984-85
Amount Rank
University of Washington $6,964 1 $6,594 1 $5,666 1 $5,588 1 $5,776 1 $5,289 1
University of Florida $6,936 2 $6,470 2 $5,615 2 $4,760 3 $4,377 3 $3,835 3
Univ California, Los Angeles $6,542 3 $5,992 3 $5,231 3 $4,905 2 $4,626 2 $4,426 2
University of Arizona $4,692 4 $4,358 4 $4,142 4 $3,921 4 $3,529 4 $3,129 5
Univ North Carolina (Ch Hill) $4,541 5 $4,255 5 $3,868 5 $3,437 5 $3,218 5 $3,727 4
Univ of Virginia, Main Campus $4,088 6 $3,582 7 $3,202 6 $2,751 7 $2,716 6 $2,363 8
UNIVERSITY OF UTAH $3,740 7 $3,589 6 $3,135 7 $2,923 6 $2,620 7 $2,403 7
University of Iowa $3,255 8 $3,012 8 $2,583 9 $2,135 10 $1,965 10 $1,783 10
Univ of Colorado, Boulder $3,107 9 $2,803 9 $2,547 10 $2,310 9 $2,038 9 $1,897 9
Purdue University, Main Campus $2,729 10 $2,700 10 $2,796 8 $2,578 8 $2,614 8 $2,410 6
Univ Cincinnati, Main Campus $2,253 11 $1,986 11 $1,729 11 $1,620 11 $1,337 11 $1,263 11
COMPARISON GROUP AVERAGE $4,511 $4,175 $3,738 $3,401 $3,220 $3,012
PERCENT OF COMP GROUP AVE:
University of Utah 82.91% 85.96% 83.87% 85.95% 81.37% 79.78%
Indicator: RESEARCH EXPENDITURES PER FTE
1989-90
Amount Rank
1988-89
Amount Rank
1987-88
Amount Rank
Comparison Group:
1986-87
Amount Rank
UTAH STATE UNIVERSITY
1985-86 1984-85
Amount Rank Amount Rank
Univ of California, Davis $7,136 1 $6,804 1 $6,157 1 $5,987 1 $5,622 1 $5,145 1
UTAH STATE UNIVERSITY $6,570 2 $5,487 2 $4,841 4 $3,755 5 $3,939 5 $3,449 5
New Mexico State University $6,219 3 $5,293 3 $5,260 2 $5,091 2 $4,941 2 $4,227 2
Oregon State University $5,264 4 $4,991 5 $5,127 3 $4,643 3 $4,294 3 $4,132 3
North Carolina State Univ $5,155 5 $5,027 4 $4,737 5 $4,216 4 $3,948 4 $3,642 4
Virginia Tech University $4,238 6 $3,627 6 $3,194 7 $2,880 7 $2,779 7 $2,429 7
Texas A & M University $4,090 7 $3,273 9 $3,501 6 $3,365 6 $2,912 6 $2,584 6
Iowa State University $3,582 8 $3,407 8 $3,010 8 $2,395 10 $2,335 8 $2,260 9
Washington State University $3,039 9 $2,886 10 $2,664 10 $2,614 8 $2,503 9 $2,394 8
Univ of Maryland, College Pk $2,885 10 $3,456 7 $2,820 9 $2,526 9 $2,104 10 $1,847 11
Colorado State University $2,657 11 $2,446 11 $2,293 11 $2,167 11 $2,089 11 $1,961 10
COMPARISON GROUP AVERAGE $4,427 $4,121 $3,876 $3,588 $3,353 $3,062
PERCENT OF COMP GROUP AVE:
Utah State University 148.41% 133.15% 124.90% 104.93% 117.48% 112.64%
4172 7

INDCTRS FINANCIAL COMPARISON INDICATORS 30-Jul-92 111
Indicator: RESEARCH EXPENDITURES PER FTE Comparison Group: COMPREHENSIVE INSTITUTIONS
1989-90 1988-89 1987-88 1986-87 1985-86 1984-85
I1
3
5
I4
6
7
8
9 i10
10
2
i12
111
Amount Rank Amount Rank Amount Rank Amount Rank Amount Rank Amount Rank
Univ of Nevada, Las Vegas $629 1 $664 1 $593 1 $553 1
Eastern Washington University $247 2 $202 2 $192 3 $212 3
Boise State University $207 3 $184 3 $133 5 $104 5
Univ of Southern Colorado $180 4 $131 5 $185 4 $168 4
SUNY College at Brockport $109 5 $81 6 $95 6 $79 6
Indiana University Northwest $98 6 $149 4 $204 2 $49 7
Univ of Wisconsin, Oshkosh $50 7 $34 8 $23 8 $18 8
WEBER STATE UNIVERSITY $38 8 $48 7 $56 7 $17 9
Austin Peay State University $19 9 $27 9 $21 9 $2 10
Southern Oregon State College $14 10 $7 10 .. 10 ..11
Calif St Univ, Dominguez Hills $0 11 $0 11 $0 11 $290 2
SOUTHERN UTAH UNIVERSITY $0 11 $0 11 $0 11 $0 12
**Less than $0.50
COMPARISON GROUP AVERAGE $155 $148 $145 $147
PERCENT OF COMP GROUP AVE:
Weber State University 24.52% 32.43% 38.62% 11.56%
Southern Utah University 0.00% 0.00% 0.00% 0.00%
Indicator: RESEARCH EXPENDITURES PER FTE Comparison Group:
1989-90 1988-89 1987-88 1986-87
$421 1 $344
$196 2 $139
$101 5 $82
$134 4 $123
$73 6 $50
$34 7 $26
$16 8 $16
$12 9 $13
$1 10 $1
$1 10 $1
$189 3 $148
$0 12 $0
$117 $93
10.26% 13.984
0.00% 0.00% 111
ICOMMUNITY COLLEGES
111
1985-86 1984-85
Amount Rank Amount Rank Amount Rank Amount Rank Amount Rank
Onandaga Community College $368 1 $383 1 $28 1 $25 3 $35 1
SNOW COLLEGE $5 2 $5 2 $7 2 $7 4 $13 2
Anne Arundel Comm College $0 3 $0 3 $0 3 $37 2 $0 3
UTAH VALLEY COMMUNITY COLLEGE $0 3 $0 3 $0 3 $92 1 $0 3
North Idaho College $0 3 $0 3 $0 3 $0 5 $0 3
COLLEGE OF EASTERN UTAH $O 3 $0 3 $0 3 $0 5 $0 3
SALT LAKE COMMUNITY COLLEGE SO 3 $0 3 $0 3 $0 5 $0 3
Joliet Junior College $0 3 SO 3 $0 3 $0 5 $0 3
Yavapai College SO 3 SO 3 $0 3 $0 5 $0 3
DIXIE COLLEGE $0 3 $0 3 $0 3 $0 5 $0 3
Chemeketa Community College SO 3 $0 3 $0 3 $0 5 $0 3
Grand Rapids Junior College $O 3 $0 3 $0 3 $0 5 $0 3
Danville Community College $0 3 $0 3 $0 3 SO 5 $0 3
Western Wyoming Comm College $0 3 $0 3 $0 3 $0 5 $0 3
Spokane Community College 15 SO 3 $0 3 $O 5 $0 3
COMPARISON GROUP AVERAGE $41 $38 $3 $6 $3
PERCENT OF COMP GROUP AVE:
Snow College 12.20% 13.16% 233.33% 116.67% 433.33%
Utah Valley Community Colleg 0.00% 0.00% 0.00% 1533.33% 0.00%
College of Eastern Utah 0.00% 0.00% 0.00% 0.00% 0.00%
Salt Lake Community College 0.00% 0.00% 0.00% 0.00% 0.00%
Dixie College 0.00% 0.00% 0.00% 0.00% 0.00%
4 1 3
28
Amount Rank
$31 1 I$5 2
$0 3
$0 3
$0 3 I$0 3
$0 3
$0 3
$0 3 I$0 3
$0 3
$0 3
$0 3 I$0 3
$0 3
$3 I166.67%
I0.00%
0.00%
0.00%
0.00%

INDCTRS FINANCIAL COMPARISON INDICATORS 30-Jul-92
Indicator: RESEARCH EXPENDITURES % OF INSTRUCTION EXPENDITURES Comparison Group: UNIVERSITY OF UTAH
1989-90
Amount Rank
1988-89
Amount Rank
1987-88
Amount Rank
1986-87
Amount Rank
1985-86
Amount Rank
1984-85
Amount Rank
University of Florida 95.81% 1 115.04% 1 88.76% 1 86.01% 1 77.44% 2 70.87% 2
University of Arizona 83.22% 2 79.96% 2 77.86% 2 76.33% 2 70.55% 3 65.98% 3
University of Washington 72.47% 3 71.01% 3 69.19% 3 73.21% 3 92.22% 1 89.51% 1
Univ of Colorado, Boulder 68.91% 4 64.26% 5 63.88% 4 .61.62% 4 58.11% 4 58.93% 4
UNIVERSITY OF UTAH 65.33% 5 64.94% 4 59.54% 5 56.99% 5 50.98% 6 51.26% 7
Univ of Virginia, Main Campus 53.66% 6 51.85% 6 49.09% 8 46.71% 8 48.22% 8 46.49% 8
Univ California, Los Angeles 50.84% 7 51.04% 8 49.37% 7 48.55% 7 48.31% 7 53.10% 6
University of Iowa 48.52% 8 49.84% 9 45.08% 9 41.54% 9 39.95% 9 37.77% 10
Purdue University, Main Campus 47.63% 9 51.05% 7 52.30% 6 48.86% 6 53.99% 5 54.87% 5
Univ North Carolina (Ch Hill) 40.90% 10 42.36% 10 40.30% 10 37.07% 10 36.73% 10 45.12% 9
Univ Cincinnati, Main Campus 36.04% 11 34.82% 11 33.31% 11 29.29% 11 26.16% 11 28.30% 11
COMPARISON GROUP AVERAGE 58.38% 59.26% 55.96% 53.75% 54.33% 55.23%
PERCENT OF COMP GROUP AVE:
University of Utah 111.91% 109.58% 106.40% 106.03% 93.83% 92.81%
Indicator: RESEARCH EXPENDITURES % OF INSTRUCTION EXPENDITURES
1989-90 1988-89
Amount Rank Amount Rank
1987-88
Amount Rank
Comparison Group:
1986-87
Amount Rank
UTAH STATE UNIVERSITY
1985-86 1984-85
Amount Rank Amount Rank
New Mexico State University 184.10% 1 165.25% 1 176.57% 1 174.65% 1 167.83% 1 157.96% 1
UTAH STATE UNIVERSITY 149.32% 2 127.28% 2 114.47% 3 91.96% 3 94.82% 3 94.11% 3
Oregon State University 126.17% 3 123.17% 3 124.11% 2 117.78% 2 118.85% 2 124.80% 2
Texas A & M University 84.80% 4 61.86% 9 83.00% 4 81.69% 5 69.684 5 65.27% 7
North Carolina State Univ 82.80% 5 83.98% 4 80.38% 6 79.26% 4 78.77% 4 79.85% 4
Iowa State University 75.65% 6 82.57% 5 80.57% 5 67.48% 8 68.62% 7 66.41% 6
Virginia Tech University 73.60% 7 68.15% 8 63.80% 9 61.62% 9 64.46% 8 60.77% 9
Univ of California, Davis 68.61% 8 71.22% 7 69.51% 8 69.09% 6 69.51% 6 70.16% 5
Washington State Uhiversity 60.59% 9 57.79% 10 59.25% 10 60.83% 10 61.61% 10 62.59% 8
Univ of Maryland, College Pk 56.25% 10 77.11% 6 70.50% 7 67.61% 7 61.86% 9 55.77% 10
Colorado State University 54.36% 11 52.97% 11 55.084 11 53.84% 11 51.72% 11 52.21% 11
COMPARISON GROUP AVERAGE 81.18% 79.82% 81.63% 79.31% 77.89% 76.30%
PERCENT OF COMP GROUP AVE:
Utah State University 183.93% 159.46% 140.22% 115.95% 121.74% 123.34%
24 I 9

INDCTRS FINANCIAL COMPARISON INDICATORS 30-Jul-92
Indicator: RESEARCH EXPENDITURES % OF INSTRUCTION EXPENDITURES Comparison Group: COMPREHENSIVE INSTITUTIONS
Univ of Nevada, Las Vegas
Univ of Southern Colorado
Eastern Washington University
Boise State University
Indiana University Northwest
SUNY College at Brockport
Univ of Wisconsin, Oshkosh
WEBER STATE UNIVERSITY
Austin Peay State University
Southern Oregon State College
Calif St Univ, Dominguez Hills
SOUTHERN UTAH UNIVERSITY
COMPARISON GROUP AVERAGE
PERCENT OF COMP GROUP AVE:
Weber State University
Southern Utah University
1989-90 1988-89 1987-88 1986-87 1985-86 1984-85
Amount Rank Amount Rank Amount Rank Amount Rank Amount Rank Amount
17.67% 1 22.24% 1 20.63% 1 19.95% 1 16.00% 1 13.86%
7.33% 2 4.95% 4 7.41% 2 7.01% 2 6.42% 3 6.30%
6.60% 3 5.81% 2 5.68% 4 6.68% 3 6.96% 2 5.13%
6.22% 4 5.23% 3 4.24% 5 3.41% 5 3.51% 5 3.32%
3.40% 5 4.86% 5 7.04% 3 1.69% 7 1.24% 7 1.07%
2.87% 6 2.30% 6 2.51% 6 2.11% 6 2.05% 6 1.43%
1.61% 7 1.15% 8 0.75% 8 0.62% 8 0.58% 8 0.63%
1.26% 8 1.60% 7 1.92% 7 0.56% 9 0.40% 9 0.46%
0.62% 9 0.79% 9 0.49% 9 0.07% 10 0.04% 10 0.04%
0.44% 10 0.24% 10 0.00% 10 0.00% 11 0.04% 10 0.04%
0.00% 11 0.00% 11 0.00% 10 6.24% 4 4.97% 4 4.12%
0.00% 11 0.00% 11 0.00% 10 0.00% 11 0.00% 12 0.00%
4.45% 4.38% 4.31% 4.67% 4.11% 3.53%
28.29% 36.54% 44.53% 11.99% 9.73% 13.03%
0.00% 0.00% 0.00% 0.00% 0.00% 0.00%
Indicator: RESEARCH EXPENDITURES % OF INSTRUCTION EXPENDITURES
1989-90 1988-89
Amount Rank Amount Rank
1987-88
Amount Rank
Comparison Group:
1986-87
Amount Rank
Onondaga Community College 12.67% 1 13.30% 1 1.084 1 1.15% 3
SNOW COLLEGE 0.22% 2 0.22% 2 0.284 2 0.31% 4
Anne Arundel Comm College 0.00% 3 0.00% 3 0.00% 3 1.54% 2
UTAH VALLEY COMMUNITY COLLEGE 0.00% 3 0.00% 3 0.00% 3 4.80% 1
North Idaho College 0.00% 3 0.00% 3 0.00% 3 0.00% 5
COLLEGE OF EASTERN UTAH 0.00% 3 0.00% 3 0.00% 3 0.00% 5
SALT LAKE COMMUNITY COLLEGE 0.00% 3 0.00% 3 0.00% 3 0.00% 5
Joliet Junior College 0.00% 3 0.00% 3 0.00% 3 0.00% 5
Yavapai College 0.00% 3 0.00% 3 0.00% 3 0.00% 5
DIXIE COLLEGE 0.00% 3 0.00% 3 0.00% 3 0.00% 5
Chemeketa Community College 0.00% 3 0.00% 3 0.00% 3 0.00% 5
Grand Rapids Junior College 0.00% 3 0.00% 3 0.00% 3 0.00% 5
Danville Community College 0.00% 3 0.00% 3 0.00% 3 0.00% 5
Western Wyoming Comm College 0.00% 3 0.00% 3 0.00% 3 0.00% 5
Spokane Community College -- 15 0.00% 3 0.00% 3 0.00% 5
COMPARISON GROUP AVERAGE 1.44% 1.37% 0.11% 0.22%
PERCENT OF COMP GROUP AVE:
Snow College 15.33% 16.10% 256.57% 140.91%
Utah Valley Community Colleg 0.00% 0.00% 0.00% 2181.82%
College of Eastern Utah 0.00% 0.00% 0.00% 0.00%
Salt Lake Community College 0.00% 0.00% 0.00% 0.00%
Dixie College 0.00% 0.00% 0.00% 0.00%
4
30
Rank
1
2
3
5
7
6
8
9
10
10
4
12
COMMUNITY COLLEGES
1985-86 1984-85
Amount Rank Amount Rank
1.66% 1 1.56% 1
0.47% 2 0.22% 2
0.00% 3 0.00% 3
0.00% 3 0.00% 3
0.00% 3 0.00% 3
0.00% 3 0.00% 3
0.00% 3 0.00% 3
0.00% 3 0.00% 3
0.00% 3 0.00% 3
0.00% 3 0.00% 3
0.00% 3 0.00% 3
0.00% 3 0.00% 3
0.00% 3 0.00% 3
0.00% 3 0.00% 3
0.00% 3 0.00% 3
0.47% 0.13%
100.00% 169.23%
0.00% 0.00%
0.00% 0.00%
0.00% 0.00%
0.00% 0.00%
1
1
1
1

INDCTRS
Indicator: ACADEMIC SUPPORT EXPENDITURES PER FTE
FINANCIAL COMPARISON INDICATORS 30-Jul-92
Comparison Group: UNIVERSITY OF UTAH
1989-90
Amount Rank
1988-89
Amount Rank
1987-88
Amount Rank
1986-87
Amount Rank
1985-86
Amount Rank
1984-85
Ampunt Rank
Univ California, Los Angeles $4,706 1 $4,231 1 $4,121 1 $4,138 1 $4,110 1 $3,216 1
University of Washington $2,668 2 $2,297 2 $1,987 3 $1,877 2 $1,504 4 $1,531 3
Univ of Virginia, Main Campus $2,458 3 $2,181 3 $2,286 2 $1,821 3 $1,829 2 $1,883 2
University of Arizona $1,825 4 $1,669 4 $1,583 4 $1,545 4 $1,525 3 $1,358 4
UNIVERSITY OF UTAH $1,608 5 $1,575 5 $1,346 6 $1,212 6 $1,195 6 $1,041 7
University of Iowa $1,512 6 $1,400 7 $1,286 7 $1,159 8 $1,068 8 $1,043 6
Univ Cincinnati, Main Campus $1,491 7 $1,286 9 $1,201 9 $1,209 7 $1,069 7 $962 8
Univ North Carolina (Ch Hill) $1,462 8 $1,477 6 $1,427 5 $1,301 5 $1,211 5 $1,118 5
University of Florida $1,455 9 $1,209 10 $1,016 10 $967 10 $391 11 $354 11
Univ of Colorado, Boulder $1,419 10 $1,311 8 $1,208 8 $1,125 9 $991 9 $895 9
Purdue University, Main Campus $840 11 $793 11 $822 11 $757 11 $754 10 $463 10
COMPARISON GROUP AVERAGE $1,984 $1,785 $1,694 $1,590 $1,445 $1,282
PERCENT OF COMP GROUP AVE:
University of Utah 81.05% 88.24% 79.46% 76.23% 82.70% 81.20%
Indicator: ACADEMIC SUPPORT EXPENDITURES PER FTE
1989-90 1988-89
Amount Rank Amount Rank
1987-88
Amount Rank
Comparison Group:
1986-87
Amount Rank
UTAH STATE UNIVERSITY
1985-86 1984-85
Amount Rank Amount Rank
Univ of California, Davis $3,851 1 $3,561 1 $3,177 1 $2,977 1 $2,699 1 $2,503 1
Washington State University $2,149 2 $1,880 2 $1,614 2 $1,499 2 $1,512 2 $1,410 2
Oregon State University $1,377 3 $1,192 4 $1,169 3 $1,077 3 $967 4 $917 5
Virginia Tech University $1,347 4 $1,319 3 $1,129 4 $1,074 4 $966 5 $929 3
Univ of Maryland, College Pk $1,190 5 $1,054 6 $810 7 $758 7 $655 8 $636 7
North Carolina State Univ $1,062 6 $1,128 5 $1,072 5 $951 5 $877 6 $929 3
Iowa State University $1,034 7 $1,018 8 $693 8 $597 9 $545 10 $530 10
UTAH STATE UNIVERSITY $1,024 8 $1,043 7 $1,011 6 $948 6 $999 3 $847 6
Colorado State University $774 9 $698 9 $649 9 $650 8 $684 7 $605 8
New Mexico State University $671 10 $606 10 $568 11 $566 10 $584 9 $575 9
Texas A & M University $498 11 $533 11 $606 10 $465 11 $292 11 $238 11
COMPARISON GROUP AVERAGE $1,395 $1,299 $1,149 $1,061 $978 $927
PERCENT OF COMP GROUP AVE:
Utah State University 73.41% 80.29% 87.99% 89.35% 102.15% 91.37%
42131

INDCTRS FINANCIAL COMPARISON INDICATORS 30-Jul-92
Indicator: ACADEMIC SUPPORT EXPENDITURES PER FTE Comparison Group: COMPREHENSIVE INSTITUTIONS
1989-90
Amount Rank
1988-89
Amount Rank
1987-88
Amount Rank
1986-87
Amount Rank
1985-86
Amount Rank
1984-85
Amount Rank
Univ of Nevada, Las Vegas $1,064 1 $1,106 1 $1,048 1 $974 2 $815 2 $734 2
Calif St Univ, Dominguez Hills $1,027 2 $872 2 $870 2 $856 3 $755 3 $721 3
Eastern Washington University $867 3 $814 3 $740 3 $630 7 $568 7 $620 4
Southern Oregon State College $776 4 $727 4 $671 4 $695 4 $631 5 $590 6
SOUTHERN UTAH UNIVERSITY $719 5 $605 8 $656 5 $1,085 1 $1,099 1 $1,008 1
Boise State University $676 6 $664 5 $606 7 $690 5 $554 8 $512 8
Univ of Wisconsin, Oshkosh $663 7 $632 6 $323 12 $318 12 $376 12 $285 12
Univ of Southern Colorado $661 8 $436 11 $504 10 $604 8 $507 9 $352 10
Indiana University Northwest $585 9 $606 7 $595 8 $682 6 $647 4 $600 5
WEBER STATE UNIVERSITY $489 10 $467 10 $521 9 $603 9 $585 6 $554 7
Austin Peay State University $444 11 $479 9 $634 6 $441 11 $381 11 $375 9
SUNY College at Brockport $421 12 $423 12 $487 11 $477 10 $492 10 $484 11
COMPARISON GROUP AVERAGE $718 $676 $648 $637 $573 $527
PERCENT OF COMP GROUP AVE:
Southern Utah University 100.14% 89.50% 101.23% 170.33% 191.80% 191.27%
Weber State University 68.11% 69.08% 80.40% 94.66% 102.09% 105.12%
Indicator: ACADEMIC SUPPORT EXPENDITURES PER FTE
1989-90 1988-89
Amount Rank Amount Rank
1987-88
Amount Rank
Comparison Group:
1986-87
Amount Rank
COMMUNITY COLLEGES
1985-86 1984-85
Amount Rank Amount Rank
Western Wyoming Comm College $1,236 1 $1,132 1 $1,583 1 $1,543 1 $1,685 1 $1,627 1
Yavapai College $613 2 $537 3 $467 3 $480 4 $421 4 $206 13
UTAH VALLEY COMMUNITY COLLEGE $580 3 $481 5 $394 7 $365 8 $344 8 $224 11
North Idaho College $577 4 $347 10 $266 11 $243 12 $245 13 $210 12
SNOW COLLEGE $538 5 $494 4 $400 6 $362 9 $420 5 $408 4
Chemeketa Community College $498 6 $687 2 $1,111 2 $717 3 $416 6 $395 5
Danville Community College $485 7 $479 6 $456 4 $718 2 $670 2 $587 1
Anne Arundel Comm College $463 8 $426 7 $433 5 $416 5 $398 7 $340 6
DIXIE COLLEGE $463 9 $328 12 $258 12 $296 10 $328 10 $305 8
COLLEGE OF EASTERN UTAH $409 10 $406 8 $391 8 $397 6 $489 3 $533 3
Grand Rapids Junior College $256 11 $298 13 $95 14 $255 11 $250 12 $256 10
SALT LAKE COMMUNITY COLLEGE $211 12 $340 11 $288 10 $235 13 $324 11 $336 7
Onondaga Community College $167 13 $161 14 $154 13 $161 15 $153 14 $143 14
Joliet Junior College $134 14 $91 15 $87 15 $162 14 $74 15 $71 15
Spokane Community College 15 $350 9 $364 9 $386 1 $334 9 $266 9
COMPARISON GROUP AVERAGE $492 $451 $502 $508 $465 $410
PERCENT OF COMP GROUP AVE:
Utah Valley Community Colleg 117.89% 106.65% 78.49% 71.85% 73.984 54.63%
Snow College 109.35% 109.53% 79.684 71.26% 90.32% 99.51%
Dixie College 94.11% 72.73% 51.39% 58.27% 70.54% 74.39%
College of Eastern Utah 83.13% 90.02% 77.89% 78.15% 105.16% 130.00%
Salt Lake Community College 42.89% 75.39% 57.37% 46.26% 69.684 81.95%
%2
32

INDCTRS FINANCIAL COMPARISON INDICATORS 30-Jul-92
Indicator: STUDENT SERVICES EXPENDITURES PER FTE Comparison Group: UNIVERSITY OF UTAH
1989-90
Amount Rank
1988-89
Amount Rank
1987-88
Amount Rank
1986-87
Amount Rank
1985-86
Amount Rank
1984-85
Amount Rank
Univ California, Los Angeles $1,121 1 $1,033 1 $958 1 $922 1 $926 1 $853 1
Univ of Colorado, Boulder $911 2 $752 2 $816 2 $765 2 $728 2 $673 2
University of Florida $683 3 $596 4 $563 5 $373 8 $239 11 $222 11
Univ of Virginia, Main Campus $682 4 $676 3 $634 3 $559 3 $577 3 $500 3
University of Iowa $679 5 $591 5 $573 4 $501 4 $510 4 $476 4
UNIVERSITY OF UTAH $532 6 $467 7 $418 7 $391 7 $440 6 $348 6
Univ Cincinnati, Main Campus
University of Arizona
$519
$487
7
8
$441
$484
8
6
$416
$434
8
6
$440
$412
5
6
$390
$468
7
5 143g 57
University of Washington $400 9 $347 9 $364 9 $293 9 $275 9 $256 8
Univ North Carolina (Ch Hill) $350 10 $319 10 $309 10 $279 10 $271 10 $255 9
Purdue University, Main Campus $280 11 $261 11 $259 11 $261 11 $298 8 $253 10
COMPARISON GROUP AVEkAGE $611 $550 $533 $481 $468 $423
PERCENT OF COMP GROUP AVE:
University of Utah 87.07% 84.91% 78.42% 81.29% 94.02% 82.27%
Indicator: STUDENT SERVICES EXPENDITURES PER FTE
1989-90 1988-89
Amount Rank Amount Rank
1987-88
Amount Rank
Comparison Group:
1986-87
Amount Rank
UTAH STATE UNIVERSITY
1985-86 1984-85
Amount Rank Amount Rank
Univ of California, Davis $1,405 1 $1,355 1 $1,233 1 $1,281 1 $1,248 1 $1,131 1
Univ of Maryland, College Pk $623 2 $553 3 $489 4 $436 2 $387 4 $442 3
Iowa State University $612 3 $715 2 $508 2' $411 4 $473 2 $449 2
New Mexico State University $586 4 $525 4 $497 3 $419 3 $452 3 $421 4
Colorado State University $483 5 $448 5 $412 6 $346 7 $342 6 $350 5
Washington State University $470 6 $416 6 $371 7 $358 6 $309 8 $317 6
UTAH STATE UNIVERSITY $423 7 $383 7 $368 8 $335 8 $342 6 $305 7
Oregon State University $399 8 $353 8 $362 9 $312 9 $294 9 $259 9
Virginia Tech University $378 9 $342 9 $419 5 $387 5 $351 5 $221 11
North Carolina State Univ $340 10 $319 10 $329 10 $296 10 $263 10 $250 10
Texas A E. M University $206 11 $205 11 $197 11 $200 11 $207 11 $301 8
COMPARISON GROUP AVERAGE $550 $523 $482 $444 $433 $414
PERCENT OF COMP GROUP AVE:
Utah State University 76.91% 73 71% 76.35% 75.45% 78.98% 73.67%

INDCTRS FINANCIAL COMPARISON INDICATrRS 30-Jul-92
Indicator: STUDENT SERVICES EXPENDITURES PER FTE Comparison Group: COMPREHENSIVE INSTITUTIONS
1989-90
Amount Rank
1988-89
Amount Rank
1987-88
Amount Rank
1986-87
Amount Rank
1985-86
Amount Rank
1984-85
Amount Rank
Univ of Nevada, Las Vegas $1,266 1 $1,079 1 $1,076 2 $1,100 2 $1,033 1 $1,231 1
Austin Peay State University $861 2 $912 2 $1,203 1 $782 3 $667 3 $562 3
Calif St Univ, Dominguez Hills $760 3 $743 3 $923 3 $1,165 1 $818 2 $835 2
Univ of Wisconsin, Oshkosh $729 4 $598 5 $352 10 $325 11 $324 10 $311 9
SOUTHERN UTAH UNIVERSITY $625 5 $714 4 $580 4 $360 9 $371 8 $341 6
Eastern Washington University $595 6 $468 7 $470 6 $421 7 $366 9 $289 11
SUNY College at Brockport $526 7 $512 6 $576 5 $450 5 $438 4 $415 5
Univ of Southern Colorado $518 8 $467 8 $459 7 $584 4 $375 7 $443 4
WEBER STATE UNIVERSITY $428 9 $414 9 $423 8 $424 6 $389 6 $334 7
Indiana University Northwest $415 10 $380 10 $413 9 $376 8 $391 5 $332 8Southern Oregon State College $348 11 $315 12 $310 12 $341 10 $311 11 $291 10
Boise State University $341 12 $365 11 $324 11 $302 12 $293 12 $245 12
COMPARISON GROUP AVERAGE $636 $584 $611 $585 $502 $495PERCENT OF COMP GROUP AVE:
Southern Utah University 98.27% 122.26% 94.93% 61.54% 73.90% 68.89%Weber State University 67.30% 70.89% 69.23% 72.48% 77.49% 67.47%
Indicator: STUDENT SERVICES EXPENDITURES PER FIE
1989-90 1988-89
Amount Rank Amount Rank
1987-88
Amount Rank
Comparison Group:
1986-87
Amount Rank
COMMUNITY COLLEGES
1985-86 1984-85
Amount Rank Amount Rank
COLLEGE OF EASTERN UTAH $963 1 $756 3 $687 5 $735 2 $937 1 $630 2
SALT LAKE COMMUNITY COLLEGE $868 2 $614 5 $570 6 $449 7 $405 7 $358 8SNOW COLLEGE $814 3 $763 2 $806 2 $617 5 $535 4 $508 4
North Idaho College $756 4 $836 1 $791 3 $707 3 $702 3 $615 3
Western Wyoming Comm College $722 5 $676 4 $708 4 $852 1 $853 2 $1,431 1
Onondaga Community College $559 6 $583 6 $482 9 $427 8 $373 8 $452 6
DIXIE COLLEGE $554 7 $560 7 $515 7 $419 9 $406 6 $456 5
Grand Rapids Junior College $525 8 $530 8 $1,042 I $672 4 $483 5 $424 7
Joliet Junior College $506 9 $293 14 $293 15 $348 11 $188 15 $155 15
UTAH VALLEY COMMUNITY COLLEGE $436 10 $391 12 $388 12 $237 15 $219 14 $252 14
Chemeketa Community College $428 11 $381 13 $484 8 $481 6 $362 9 $330 10
Anne Arundel Comm College $401 12 $412 10 $400 10 $318 13 $270 13 $259 13
Danville Community College $318 13 $285 15 $295 14 $302 14 $295 12 $260 12
Yavapai College $317 14 $401 11 $321 13 $334 12 $319 11 $350 9Spokane Community College 15 $426 9 $398 11 $366 10 $351 10 $313 11
COMPARISON GROUP AVERAGE $504 $482 $521 $481 $420 $459PERCENT OF COMP GROUP AVE:
College of Eastern Utah 191.07% 156.85% 131.86% 152.81% 223.10% 137.25%Salt Lake Community College 172.22% 127.39% 109.40% 93.35% 96.43% 78.00%Snow College 161.51% 158.30% 154.70% 128.27% 127.38% 110.68%Dixie College 109.92% 116.184 98.85% 87.11% 96.67% 99.35%Utah Valley Community Colleg 86.51% 81.12% 74.47% 49.27% 52.14% 54.90%
34
II

INOCTRS FINANCIAL COMPARISON INDICATORS 30-Jul-92
Indicator: SCHOLARSHIPS AND FELLOWSHIPS PER FTE Comparison Group: UNIVERSITY OF UTAH
1989-90
Amount Rank
1988-89
Amount Rank
1987-88
Amount Rank
1986-87
Amount Rank
1985-86
Amounl Rank
1984-85
Amount Rank
University of Washington $1,598 1 $1,576 1 $1,174 2 $1,179 1 $1,178 1 $977 2
Univ of Virginia, Main Campus $1,578 2 $1,393 3 $1,276 1 $1,113 3 $1,155 2 $959 3
Univ California, Los Angeles $1,535 3 $1,411 2 $1,153 3 $1,153 2 $1,138 3 $1,003 1
Univ Cincinnati, Main Campus $1,291 4 $1,146 4 $1,017 5 $802 5 $778 5 $718 4
University of Iowa $1,187 5 $1,086 6 $1,015 6 $900 4 $835 4 $707 5
University of Arizona $1,078 6 $954 7 $780 7 $718 7 $662 7 $602 7
Univ North Carolina (Ch Hill) $931 7 $1,137 5 $1,079 4 $790 6 $770 6 $643 6
UNIVERSITY OF UTAH $788 8 $778 8 $637 8 $659 8 $590 8 $514 8
Univ of Colorado, Boulder $658 9 $706 9 $635 9 $558 10 $486 10 $465 9
Purdue University, Main Campus $552 10 $517 10 $520 10 $442 11 $472 11 $431 11
University of Florida $521 11 $462 11 $395 11 $593 9 $544 9 $463 10
COMPARISON GROUP AVERAGE $1,093 $1,039 $904 $825 $802 $697
PERCENT OF COMP GROUP AVE:
University of Utah 72.10% 74.884 70.46% 79.88% 73.57% 73.74%
Indicator: SCHOLARSHIPS AND FELLOWSHIPS PER FTE
1989-90
Amount Rank
1988-89
Amount Rank
1987-88
Amount Rank
Comparison Group:
1986-87
Amount Rank
UTAH STATE UNIVERSITY
1985-86 1984-85
Amount Rank Amount Rank
Washington State University $1,343 1 $1,295 1 $651 6 $623 7 $579 7 $481 9
UTAH STATE UNIVERSITY $1,191 2 $972 3 $894 1 $815 1 $799 2 $700 1
Univ of California, Davis $1,144 3 $995 2 $841 2 $797 2 $772 3 $674 3
Texas A & M University $995 4 $931 4 $588 9 $721 5 $862 1 $322 11
Iowa State University $977 5 $916 5 $822 4 $739 4 $653 5 $529 7
Univ of Maryland, College Pk $951 6 $806 7 $544 10 $464 11 $455 11 $432 10
New Mexico State University $928 7 $821 6 $701 5 $681 6 $634 6 $541 4
Oregon State University $852 8 $799 8 $833 3 $757 3 $746 4 $691 2
Colorado State University $803 9 $753 9 $623 8 $610 8 $610 9 $541 4
Virginia Tech University $695 10 $614 11 $518 11 $479 10 $479 10 $537 6
North Carolina State Univ $675 11 $661 10 $628 7 $579 9 $573 8 $514 8
COMPARISON GROUP AVERAGE $936 $859 $675 $645 $636 $526
PERCENT OF COMP GROUP AVE:
Utah State University 127.24% 113.15% 132.44% 126.36% 125.63% 133.08%
35

INDCTRS FINANCIAL COMPARISON INDICATORS 30-Jul-92
Indicator: SCHOLARSHIPS AND FELLOWSHIPS PER FTE Comparison Group: COMPREHENSIVE INSTITUTIONS
1989-90
Amount Rank
1988-89
Amount Rank
1987-88
Amount Rank
1986-87
Amount Rank
1985-86
Amount Rank
1984-85
Amount Rank
Univ of Southern Colorado $1,218 1 $1,123 1 $980 1 $984 3 $904 3 $705 4
Eastern Washington University $1,201 2 $1,110 2 $894 4 $602 5 $541 8 $427 8
SOUTHERN UTAH UNIVERSITY $1,179 3 $1,089 3 $909 2 $895 4 $880 4 $820 3
Southern Oregon State College $952 4 $961 4 $901 3 $995 2 $1,000 2 $880 2
SUNY College at Brockport $882 5 $905 5 $815 5 $1,454 1 $1,206 1 $1,145 1
WEBER STATE UNIVERSITY $836 6 $752 7 $587 8 $594 6 $585 7 $508 5
Indiana University Northwest $761 7 $740 8 $607 7 $572 7 $626 5 $478 7
Boise State University $716 8 $768 6 $179 12 $194 12 $597 6 $500 6
Austin Peay State University $675 9 $614 9 $654 6 $440 8 $451 9 $407 9
Univ of Wisconsin, Oshkosh $566 10 $558 10 $424 9 $417 9 $443 10 $376 10
Univ of Nevada, Las Vegas $407 11 $416 11 $343 10 $354 10 $418 11 $222 11
Calif St Univ, Dominguez Hills $362 12 $354 12 $286 11 $299 11 $248 12 $222 11
COMPARISON GROUP AVERAGE $774 $755 $608 $631 $643 $536
PERCENT OF COMP GROUP AVE:
Southern Utah University 152.33% 144.24% 149.51% 141.84% 136.86% 152.99%
Weber State University 108.01% 99.60% 96.55% 94.14% 90.98% 94.78%
Indicator: SCHOLARSHIPS AND FELLOWSHIPS PER FTE
1989-90
Amount Rank
1988-89
Amount Rank
1987-88
Amount Rank
Comparison Group:
1986-87
Amount Rank
COMMUNITY COLLEGES
1985-86 1984-85
Amount Rank Amount Rank
North Idaho College $1,088 1 $1,134 1 $1,043 1 $1,087 1 $1,093 1 $839 2
DIXIE COLLEGE $1,044 2 $970 4 $730 4 $590 4 $548 5 $482 4
COLLEGE OF EASTERN UTAH $1,007 3 $1,053 2 $894 2 $864 2 $851 2 $957 1
SALT LAKE COMMUNITY COLLEGE $815 4 $848 5 $586 7 $455 7 $457 8 $387 9
UTAH VALLEY COMMUNITY COLLEGE $763 5 $665 8 $451 8 $455 7 $422 11 $338 11
Onondaga Community College $734 6 $698 6 $652 5 $603 3 $366 12 $297 13
SNOW COLLEGE $731 7 $689 7 $622 6 $502 6 $575 4 $442 6
Western Wyoming Comm College $606 8 $552 9 $351 11 $212 13 $151 15 $444 5
Chemeketa Community College $555 9 $500 10 $441 9 $406 10 $452 9 $391 8
Grand Rapids Junior College $507 10 $494 11 $404 10 $412 9 $432 10 $420 7
Danville Community College $394 11 $406 12 $335 12 $338 11 $487 7 $323 12
Yavapai College $312 12 $294 13 $266 13 $249 12 $311 13 $259 14
Joliet Junior College $237 13 $241 14 $172 14 $202 14 $722 3 $540 3
Anne Arundel Comm College $139 14 $122 15 $105 15 $74 15 $256 14 $225 15
Spokane Community College 15 $1,044 3 $801 3 $537 5 $502 6 $376 10
COMPARISON GROUP AVERAGE $508 $549 $457 $412 $477 $411
PERCENT OF COMP GROUP AVE:
Dixie College 205.51% 176.68% 159.74% 143.20% 114.88% 117.27%
College of Eastern Utah 198.23% 191.80% 195.62% 209.71% 178.41% 232.85%
Salt Lake Community College 160.43% 154.46% 128.23% 110.44% 95.81% 94.16%
Utah Valley Community Colleg 150.20% 121.13% 98.69% 110.44% 88.47% 82.24%
Snow College 143.90% 125.50% 136.11% 121.84% 120.55% 107.54%
4
36

INDCTRS FINANCIAL COMPARISON INDICATORS 30-Jul-92
Indicator: INSTITUTIONAL SUPPORT EXPENDITURES PER FTE
1989-90
Amount Rank
1988-89
Amount Rank
Univ California, Los Angeles $2,038 1 $2,075 2
University of Florida $1,841 2 $3,182 .
University of Washington $1,700 3 $1,728 3
Univ of Virginia, Main Campus $1,617 4 $1,222 6
Univ North Carolina (Ch Hill) $1,338 5 $1,208 7
University of Arizona $1,288 6 $1,225 5
UNIVERSITY OF UTAH $1,155 7 $1,234 4
Univ of Colorado, Boulder $935 8 $884 9
University of Iowa $917 9 $925 8
Purdue University, Main Campus $822 10 $743 10
Univ Cincinnati, Main Campus $724 11 $702 11
COMPARISON GROUP AVERAGE $1,322 $1,389
PERCENT OF COMP GROUP AVE:
University of Utah 87.37% 88.84%
1987-88
Amount Rank
Comparison Group:
1986-87
Amount Rank
UNIVERSITY OF UTAH
1985-86 1984-85
Amount Rank Amount Rank
$1,627 2 $1,503 2 $1,928 1 $1,763 1
$2,151 1 $1,818 1 $1,857 2 $1,703 2
$1,457 3 $1,401 3 $1,357 3 $1,305 3
$1,178 5 $1,012 7 $905 7 $855 6
$1,159 7 $1,093 4 $1,023 4 $901 5
$1,173 6 $1,045 6 $915 6 $696 8
$1,068 8 $1,055 5 $997 5 $905 4
$880 9 $792 9 $738 8 $755 7
$619 11 $473 11 $436 11 $415 11
$736 10 $717 10 $628 10 $623 10
$1,201 4 $944 8 $669 9 $675 9
$1,218 $1,080 $1,046 $969
87.68% 97.69% 95.32% 93.40%
Indicator: INSTITUTIONAL SUPPORT EXPENDITURES PER FTE Comparison Group: UTAH STATE UNIVERSITY
Texas A & M University
Univ of California, Davis
Washington State University
Oregon State University
Colorado State University
Virginia Tech University
North Carolina State Univ
Univ of Maryland, College Pk
UTAH STATE UNIVERSITY
Iowa State University
New Mexico State University
ICOMPARISON GROUP AVERAGE
PERCENT OF COMP GROUP AVE:
Utah State University
1989-90
Amount Rank
1988-89
Amount Rank
1987-88
Amount Rank
1986-87
Amount Rank
1985-86
Amount Rank
1984-85
Amount Rank
$2,376 1 $1,909 1 $2,086 1 $1,812 2 $1,664 1 $1,390 1
$1,469 2 $1,377 2 $1,214 2 $2,456 1 $1,398 2 $1,197 2
$1,455 3 $1,230 3 $1,177 3 $1,122 3 $1,014 3 $935 3
$1,279 4 $1,052 8 $1,006 5 $908 6 $796 7 $667 9
$1,204 5 $1,099 4 $1,141 4 $1,070 4 $780 8 $780 5
$1,148 6 $872 10 $849 9 $893 7 $899 4 $868 4
$1,066 7 $1,075 6 $993 6 $892 8 $807 6 $723 6
$985 8 $1,094 5 $908 8 $736 9 $688 9 $692 8
$982 9 $1,052 7 $705 10 $948 5 $893 5 $695 7
$773 10 $904 9 $943 7 $466 11 $433 11 $375 11
$714 11 $606 11 $554 11 $471 10 $491 10 $450 10
$1,247 $1,122 $1,087 $1,083 $897 $808
78.75% 93.76% 64.86% 87.53% 99.55% 86.01%
37
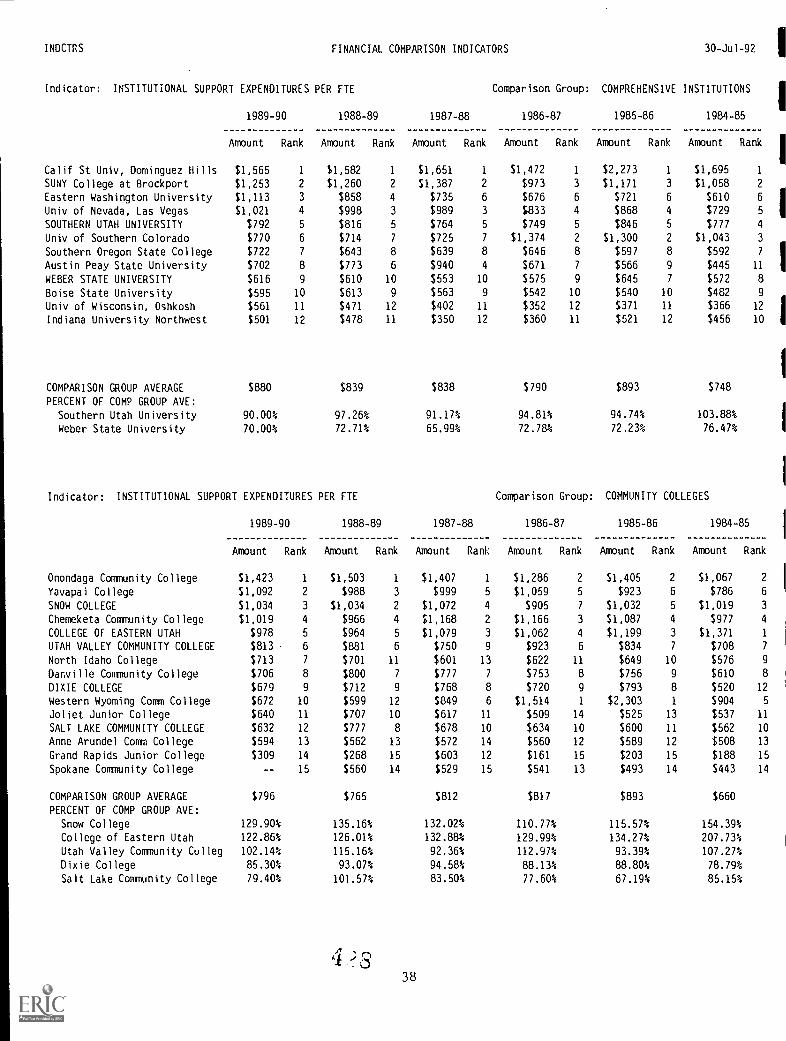
INDCTRS FINANCIAL COMPARISON INDICATORS 30-Jul-92
Indicator: INSTITUTIONAL SUPPORT EXPENDITURES PER FTE Comparison Group: COMPREHENSIVE INSTITUTIONS
1989-90
Amount Rank
1988-89
Amount Rank
1987-88
Amount Rank
1986-87
Amount Rank
1985-86
Amount Rank
1984-85
Amount Rank
Calif St Univ, Dominguez Hills $1,565 1 $1,582 1 $1,651 1 $1,472 1 $2,273 1 $1,695 1
SUNY College at Brockport $1,253 2 $1,260 2 $1,387 2 $973 3 $1,171 3 $1,058 2
Eastern Washington University $1,113 3 $858 4 $735 6 $676 6 $721 6 $610 6
Univ of Nevada, Las Vegas $1,021 4 $998 3 $989 3 $833 4 $868 4 $729 5
SOUTHERN UTAH UNIVERSITY $792 5 $816 5 $764 5 $749 5 $846 5 $777 4
Univ of Southern Colorado $770 6 $714 7 $725 7 $1,374 2 $1,300 2 $1,043 3
Southern Oregon State College $722 7 $643 8 $639 8 $646 8 $597 8 $592 7
Austin Peay State University $702 8 $773 6 $940 4 $671 7 $566 9 $445 11
WEBER STATE UNIVERSITY $616 9 $610 10 $553 10 $575 9 $645 7 $572 8
Boise State University $595 10 $613 9 $563 9 $542 10 $540 10 $482 9
Univ of Wisconsin, Oshkosh $561 11 $471 12 $402 11 $352 12 $371 11 $366 12
Indiana University Northwest $501 12 $478 11 $350 12 $360 11 $521 12 $456 10
COMPARISON GROUP AVERAGE $880 $839 $838 $790 $893 $748
PERCENT OF COMP GROUP AVE:
Southern Utah University 90.00% 97.26% 91.17% 94.81% 94.74% 103.88%
Weber State University 70.00% 72.71% 65.99% 72.78% 72.23% 76.47%
Indicator: INSTITUTIONAL SUPPORT EXPENDITURES PER FTE
1989-90 1988-89
Amount Rank Amount Rank
1987-88
Amount Rank
Comparison Group:
1986-87
Amount Rank
COMMUNITY COLLEGES
1985-86 1984-85
Amount Rank Amount Rank
Onondaga Community College $1,423 1 $1,503 1 $1,407 1 $1,286 2 $1,405 2 $1,067 2
Yavapai College $1,092 2 $988 3 $999 5 $1,059 5 $923 6 $786 6
SNOW COLLEGE $1,034 3 $1,034 2 $1,072 4 $905 7 $1,032 5 $1,019 3
Chemeketa Community College $1,019 4 $966 4 $1,168 2 $1,166 3 $1,087 4 $977 4
COLLEGE OF EASTERN UTAH $978 5 $964 5 $1,079 3 $1,062 4 $1,199 3 $1,371 1
UTAH VALLEY COMMUNITY COLLEGE $813 6 $881 6 $750 9 $923 6 $834 7 $708 7
North Idaho College $713 7 $701 11 $601 13 $622 11 $649 10 $576 9
Danville Community College $706 8 $800 7 $777 7 $753 8 $756 9 $610 8
DIXIE COLLEGE $679 9 $712 9 $768 8 $720 9 $793 8 $520 12
Western Wyoming Comm College $672 10 $599 12 $849 6 $1,514 1 $2,303 1 $904 5
Joliet Junior College $640 11 $707 10 $617 11 $509 14 $525 13 $537 11
SALT LAKE COMMUNITY COLLEGE
Arundel Comm College
$632
$594
12
13
$777
$562
8
13
$678
$572
10
14
$634
$560
10
12
$600
$589
11
12 1855602 13 Anne
Grand Rapids Junior College $309 14 $268 15 $603 12 $161 15 $203 15 $188 15
Spokane Community College 15 $560 14 $529 15 $541 13 $493 14 $443 14
COMPARISON GROUP AVERAGE $796 $765 $812 $817 $893 $660
PERCENT OF COMP GROUP AVE:
Snow College 129.90% 135.16% 132.02% 110.77% 115.57% 154.39%
College of Eastern Utah 122.86% 126.01% 132.88% 129.99% 134.27% 207.73%
Utah Valley Community Culleg 102.14% 115.16% 92.36% 112.97% 93.39% 107.27%
Dixie College 85.30% 93.07% 94.58% 88.13% 88.80% 78.79%
Salt Lake Community College 79.40% 101.57% 83.50% 77.60% 67.19% 85.15%
38

INDCTRS FINANCIAL COMPARISON INDICATORS 30-Jul-92
IIndicator: PHYSICAL PLANT 0 & M EXPENDITURES PER FTE Comparison Group: UNIVERSITY OF UTAH
1989-90 1988-89 1987-88 1986-87 1985-86 1984-85
Amount
Univ North Carolina (Ch Hill) $1,973
Univ California, Los Angeles $1,771
II
University of Washington $1,744
University of Florida $1,267
University of Iowa $1,241
Purdue University, Main Campus $1,227
IUniv Cincinnati, Main Campus $1,098
Univ of Virginia, Main Campus $1,081
University of Arizona $1,059
UNIVERSITY OF UTAH $1,030
IUniv of Colorado, Boulder $592
COMPARISON GROUP AVERAGE $1,305
PERCENT OF COMP GROUP AVE:
IUniversity of Utah 78.93%
Rank Amount Rank Amount Rank Amount Rank Amount Rank Amount Rank
1 $1,770 1 $2,074 1 $1,868 1 $1,654 1 $1,315 1
2 $1,766 2 $1,411 3 $1,318 3 $1,293 2 $1,232 2
3 $1,542 3 $1,416 2 $1,414 2 $1,238 3 $1,085 3
4 $1,216 4 $1,024 8 $922 10 $1,042 6 $1,041 4
5 $1,078 7 $1,208 4 $1,033 7 $996 8 $893 8
6 $1,193 5 $1,184 5 $1,172 4 $1,060 5 $999 6
7 $975 10 $965 10 $1,029 8 $937 9 $862 10
8 $1,167 6 $1,158 6 $1,085 6 $1,008 7 $918 7
9 $997 9 $985 9 $954 9 $869 10 $890 9
10 $1,058 8 $1,089 7 $1,103 5 $1,142 4 $1,012 5
11 $588 11 $569 11 $562 11 $537 11 $545 11
$1,229 $1,199 $1,136 $1,063 $998
86.09% 90.83% 97.10% 107.43% 101.40%
Indicator: PHYSICAL PLANT 0 & M EXPENDITURES PER FTE Comparison Group: UTAH STATE UNIVERSITY
1989-90
Amount Rank
1988-89
Amount Rank
1987-88
Amount Rank
Univ of California, Davis $1,973 1 $1,894 1 $1,723 1
Univ of Maryland, College Pk $1,499 2 $1,080 5 $1,061 4
North Carolina State Univ $1,254 3 $1,169 2 $1,156 2
Washington State University $1,231 4 $1,168 3 $1,108 3
Iowa State University $1,099 5 $997 6 $880 9
Texas A & M University $1,052 6 $1,084 4 $1,017 5
Virginia Tech University $925 7 $886 9 $820 10
UTAH STATE UNIVERSITY $885 8 $976 7 $979 6
Colorado State University $877 9 $893 8 $906 8
Oregon State University $876 10 $832 10 $916 7
New Mexico State University $838 11 $818 11 $747 11
ICOMPARISON GROUP AVERAGE $1,162 $1,082 $1,033
PERCENT OF COMP GROUP AVE:
Utah State University 76.16% 90.20% 94.77%
4::?939
1986-87
Amount Rank
1985-86
Amount Rank
1984-85
Amount Rank
$1,633 1 $1,595 1 $1,482 1
$780 10 $949 6 $890 7
$1,056 3 $1,049 4 $976 4
$1,144 2 $1,030 5 $1,045 3
$889 7 $864 7 $892 6
$974 4 $1,196 2 $1,241 2
$843 8 $694 11 $694 11
$924 5 $1,059 3 $975 5
$894 6 $843 8 $780 9
$833 9 $754 9 $795 8
$690 11 $742 10 $726 10
$974 $972 $952
94.87% 108.95% 102.42%

INDCTRS FINANCIAL COMPARISON INDICATORS 30-Jul-92
Indicator: PHYSICAL PLANT 0 & M EXPENDITURES PER FTE Comparison Group: COMPREHENSIVE INSTITUTIONS
1989-90
Amount Rank
1988-89
Amount Rank
1987-88
Amount Rank
1986-87
Amount Rank
1985-86
Amount Rank
1984-85
Amount Rank
SUNY College at Brockport $1,030 1 $994 2 $1,103 1 $1,008 2 $992 1 $1,008 1
Eastern Washington University $973 2 $1,016 1 $1,032 2 $1,070 1 $887 3 $889 3
Calif St Univ, Dominguez Hills $920 3 $921 4 $839 4 $951 4 $471 12 $747 5
Univ of Nevada, Las Vegas $873 4 $924 3 $922 3 $1,000 3 $950 2 $990 2
SOUTHERN UTAH UNIVERSITY $780 5 $756 6 $754 8 $781 5 $864 4 $748 4
Indiana University Northwest $733 6 $734 7 $810 7 $767 6 $735 6 $684 7
Univ of Southern Colorado $691 7 $769 5 $839 4 $690 8 $627 8 $524 9
Austin Peay State University $610 8 $650 8 $820 6 $596 9 $577 9 $514 11
Southern Oregon State College $588 9 $518 11 $537 11 $583 10 $479 11 $525 8
WEBER STATE UNIVERSITY $582 10 $560 10 $692 9 $694 7 $739 5 $707 6
Boise State University $534 11 $604 9 $564 10 $504 11 $638 7 $459 12
Univ of Wisconsin, Oshkosh $517 12 $480 12 $527 12 $488 12 $521 10 $522 10
COMPARISON GROUP AVERAGE $747 $761 $799 $766 $688 $686
PERCENT OF COMP GROUP AVE:
Southern Utah University 104.42% 99.34% 94.37% 101.96% 125.58% 109.04%
Weber State University 77.91% 73.59% 86.61% 90.60% 107.41% 103.06%
Indicator: PHYSICAL PLANT 0 & M EXPENDITURES PER FTE
1989-90 1988-89
Amount Rank Amount Rank
1987-88
Amount Rank
Comparison Group:
1986-87
Amount Rank
COMMUNITY COLLEGES
1985-86 1984-85
Amount Rank Amount Rank
Western Wyoming Comm College $1,805 1 $1,417 1 $1,520 1 $1,294 1 $1,150 1 $867 2
SNOW COLLEGE $921 2 $881 2 $1,051 2 $908 2 $1,023 2 $1,037 1
DIXIE COLLEGE $749 3 $600 6 $566 6 $580 5 $620 6 $623 5
North Idaho College $718 4 $710 4 $692 4 $763 4 $802 4 $718 4
Onondaga Community College $713 5 $752 3 $649 5 $578 6 $602 7 $544 6
COLLEGE OF EASTERN UTAH $661 6 $704 5 $814 3 $793 3 $882 3 $781 3
SALT LAKE COMMUNITY COLLEGE $566 7 $577 7 $493 9 $535 8 $481 9 $417 12
Yavapai College $552 8 $511 10 $519 7 $521 9 $491 8 $440 10
Joliet Junior College $547 9 $516 8 $491 10 $536 7 $674 5 $527 7
UTAN VALLEY COMMUNITY COLLEGE $547 10 $477 12 $456 13 $490 10 $448 13 $390 13
Grand Rapids Junior College $469 11 $482 11 $468 11 $246 15 $469 11 $440 10
Anne Arundel Comm College $432 12 $407 14 $421 14 $434 12 $481 9 $465 8
Chemeketa Community College $417 13 $425 13 $509 8 $430 13 $336 15 $318 15
Danville Community College $298 14 $310 15 $379 15 $429 14 $386 14 $330 14
Spokane Community College 15 $514 9 $456 12 $481 11 $458 12 $444 9
COMPARISON GROUP AVERAGE $661 $604 $610 $571 $585 $509
PERCENT OF COMP GROUP AVE:
Snow College 139.33% 145.86% 172.30% 159.02% 174.87% 203.73%
Dixie College 113.31% 99.34% 92.79% 101.58% 105.98% 122.40%
College of Eastern Utah 100.00% 116.56% 133.44% 138.88% 150.77% 153.44%
Salt Lake Community College 85.63% 95.53% 80.82% 93.70% 82.22% 81.93%
Utah Valley Community Colleg 82.75% 78.97% 74.75% 85.81% 76.58% 76.62%
40

INDCTRS FINANCIAL COMPARISON INDICATORS 30-Jul-92
Indicator: TOTAL EXPENDITURES AND TRANSFERS PER FTE Comparison Group: UNIVERSITY OF UTAH
1989-90
Amount Rank
1988-89
Amount Rank
1987-88
Amount Rank
1986-87
Amount Rank
1985-86
Amount Rank
1984-85
Amount Rank
Univ California, Los Angeles $31,564 1 $29,380 1 $27,203 1 $25,471 1 $24,683 1 $22,001 1
Univ North Carolina (Ch Hill) $26,920 2 $24,993 3 $23,836 2 $21,860 2 $20,525 2 $19,845 2
University of Washington $26,577 3 $25,094 2 $21,754 3 $20,710 3 $17,915 3 $16,677 3
University of Florida $22,891 4 $21,124 4 $18,711 .4 $16,291 4 $14,879 4 $13,728 4
Univ of Virginia, Main Campus $21,005 5 $18,961 5 $17,424 5 $15,803 5 $14,131 6 $12,935 6
UNIVERSITY OF UTAH $18,948 6 $17,789 6 $15,831 6 $15,035 6 $14,417 5 $13,028 5
University of Iowa $17,224 7 $15,951 7 $13,905 8 $12,112 10 $11,599 9 $10,732 9
University of Arizona $16,978 8 $15,745 8 $15,402 7 $14,681 7 $13,785 7 $12,444 7
Univ Cincinnati, Main Campus $15,565 9 $13,939 9 $13,240 10 $13,173 8 $11,233 10 $10,302 10
Purdue University, Main Campus $13,955 10 $13,293 10 $13,271 9 $12,747 9 $11,932 8 $10,742 8
Univ of Colorado, Boulder $13,327 11 $12,821 11 $11,766 11 $10,828 11 $9,158 11 $8,674 11
COMPARISON GROUP AVERAGE $20,601 $19,130 $17,651 $16,368 $14,984 $13,808
PERCENT OF COMP GROUP AVE:
University of Utah 91.98% 92.99% 89.69% 91.86% 96.22% 94.35%
Indicator: TOTAL EXPENDITURES AND TRANSFERS PER FTE
1989-90 1988-89
Amount Rank Amount Rank
1987-88
Amount Rank
Comparison Group:
1986-87
Amount Rank
UTAH STATE UNIVERSITY
1985-86 1984-85
Amount Rank Amount Rank
Univ of California, Davis $29,502 1 $27,702 1 $25,052 1 $25,152 1 $22,226 1 $20,229 1
North Carolina State Univ $18,423 2 $17,947 2 $17,324 2 $15,590 2 $14,862 2 $13,600 2
UTAH STATE UNIVERSITY $17,339 3 $16,198 3 $14,833 4 $13,760 5 $13,647 4 $11,923 4
Texas A & M University $17,254 4 $15,293 7 $13,295 7 $14,418 4 $14,217 3 $11,842 5
Virginia Tech University $17,149 5 $15,420 5 $14,354 5 $13,427 6 $12,534 6 $11,748 6
Oregon State University $16,739 6 $15,430 4 $15,937 3 $14,495 3 $13,428 5 $12,636 3
Washington State University $16,584 7 $15,410 6 $13,549 6 $13,212 7 $12,321 7 $11,639 7
Iowa State University $15,419 8 $14,022 9 $12,662 10 $10,611 11 $9,778 10 $9,495 10
Univ of Maryland, College Pk $15,400 9 $14,859 8 $12,781 9 $11,186 10 $9,399 11 $8,939 11
New Mexico State University $14,973 10 $13,390 10 $12,825 8 $12,570 8 $12,190 8 $11,061 8
Colorado State University $14,149 11 $13,120 11 $11,927 11 $11,467 9 $10,960 9 $10,104 9
COMPARISON GROUP AVERAGE $17,559 $16,259 $14,971 $14,213 $13,192 $12,129
PERCENT OF COMP GROUP AVE:
Utah State University 98.75% 99.62% 99.08% 96.81% 103.45% 98.30%

INDCTRS FINANCIAL COMPARISON INDICATORS 30-Jul-92
Indicator: TOTAL EXPENDITURES AND TRANSFERS PER FTE
1989-90 1988-89 1987-88
Comparison Group: COMPREHENSIVE INSTITUTIONS
1986-87 1985-86 1984-85
Amount Rank Amount Rank Amount Rank Amount Rank Amount Rank Amount
Calif St Univ, Dominguez Hills $10,297 1 $9,834 1 $9,555 1 $9,862 1 $8,723 2 $8,129
SUNY College at Brockport $9,049 2 $8,853 2 $9,279 2 $9,497 2 $9,169 1 $9,061
Univ of Nevada, Las Vegas $8,961 3 $8,291 3 $7,974 4 $7,735 3 $7,295 3 $6,883
Eastern Washington University $8,796 4 $8,141 4 $7,652 5 $6,980 5 $6,235 6 $5,813
SOUTHERN UTAH UNIVERSITY $7,677 5 $6,992 8 $6,517 8 $6,460 6 $6,951 4 $6,260
Univ of Southern Colorado $7,102 6 $7,138 5 $6,819 6 $7,315 4 $6,394 5 $5,494
Southern Oregon State College $6,928 7 $6,559 10 $6,196 9 $6,420 7 $5,737 9 $5,348
Boise State University $6,739 8 $7,110 6 $5,738 10 $5,646 11 $5,819 8 $4,960
Austin Peay State University $6,737 9 $7,011 7 $8,833 3 $6,296 8 $5,367 11 $4,714
Univ of Wisconsin, Oshkosh $6,618 10 $6,072 11 $5,649 12 $5,125 12 $5,147 12 $4,746
Indiana University Northwest $6,606 11 $6,747 9 $6,525 7 $5,995 10 $5,721 10 $5,029
WEBER STATE UNIVERSITY $6,247 12 $6,047 12 $5,688 11 $6,197 9 $6,028 7 $5,584
COMPARISON GROUP AVERAGE $7,783 $7,576 $7,422 $7,087 $6,561 $6,018
PERCENT OF COMP GROUP AVE:
Southern Utah University 98.64% 92.29% 87.81% 91.15% 105.94% 104.02%
Weber State University 80.26% 79.82% 76.64% 87.44% 91.88% 92.79%
Ir.licator: TOTAL EXPENDITURES AND TRANSFERS PER FTE
1989-90 1988-89
Amount Rank Amount Rank
1987-88
Amount Rank
Comparison Group:
1986-87
Amount Rank
Western Wyoming Comm College $9,072 1 $8,260 1 $9,132 1 $10,099 1
North Idaho College $7,123 2 $6,920 3 $6,552 4 $6,547 2
Onondaga Community College $6,880 3 $6,962 2 $5,962 6 $5,260 6
SNOW COLLEGE $6,842 4 $6,860 4 $7,234 2 $6,055 5
COLLEGE OF EASTERN UTAH $6,657 5 $5,976 6 $6,239 5 $6,260 4
Chemeketa Community College $6,426 6 $6,025 5 $6,746 3 $6,507 3
DIXIE COLLEGE $6,250 7 $5,856 8 $5,231 8 $4,661 11
Grand Rapids Junior College $5,713 B $5,582 9 $5,923 7 $4,856 8
SALT LAKE COMMUNITY COLLEGE $5,632 9 $5,924 7 55,073 9 $4,800 10
UTAH VALLEY COMMUNITY COLLEGE $5,176 10 $4,863 12 $4,296 14 $4,528 13
Yavapai College $5,033 11 $4,788 13 $4,785 12 $4,822 9
Joliet Junior College $4,908 12 $4,663 14 $4,408 13 $4,253 14
Danville Community College 54,775 13 $4,892 11 $4,868 11 $5,218 7
Anne Arundel Comm College $4,510 14 $4,213 15 $4,272 15 $4,244 15
Spokane Community College -- 15 $5,525 10 $4,970 10 $4,628 12
COMPARISON GROUP AVERAGE $6,049 $5,783 $5,762 $5,643
PERCENT OF COMP GROUP AVE:
Snow College 113.11% 118.62% 125.55% 107.30%
College of Eastern Utah 110.05% 103.34% 108.284 110.93%
Dixie College 103.32% 101.26% 90.78% 82.60%
Salt Lake Community College 93.11% 102.44% 88.04% 85.06%
Utah Valley Community Colleg 85.57% 84.09% 74.56% 80.24%
42
Rank
2
1
3
5
4
7
8
10
12
11
9
6
ICOMMUNITY COLLEGES
1985-86 1984-85 IAmount Rank Amount Rank
$10,918 1 $8,284 1 I$6,853 3 $5,956 4
$5,044 7 $4,516 8
$6,751 4 $6,098 3
$7,049 2 $6,959 2
$5,756 5 $5,316 5
$4,745 8 $4,427 9
$4,745 8 $4,755 6
$4,670 10 $4,328 10
$4,154 14 $3,770 13
$4,372 11 $4,214 11
$4,006 15 $3,741 15
$5,046 6 $4,549 7 I$4,243 13 $3,887 12
$4,313 12 $3,770 13
$5,530 $4,899 I122.08%
127.47%
85.80%
84.45%
75.12%
124.47%
142.05%
90.37%
88.34%
76.95%

M. L
ibra
ries
4'.3

I
TAB MLIBRARIES
I
The statistics included in Tab WI for Libraries are compiled from the IPEDS Libraryand Finance surveys.
TABLE 1 Library Staff 1
TABLE 2 Library Operating Expenditures 1
TABLE 3 Library Collections 2
TABLE 4 Library Loan Transactions 3
TABLE 5 Library Service Per Typical Week 3
TABLE 6 Library Expenditures History 4
435

Table 1
UTAH SYSTEM OF HIGHER EDUCATION
Library Staff
InstitutionsLibrarians &
Professional Staff
Fall 1988 Fall 1990 Fall 1992
Other Paid Staff
Fall 1988 Fall 1990 Fall 1992
Student Assistants
Fall 1988 Fall 1990 Fall 1992
Total FTE Staff
Fall 1988 Fall 1990 Fall 1992
University of Utah 64.50 63.00 64.00 137.80 139.00 143.00 87.50 100.00 88.00 289.80 302.00 295.00
Utah State University 23.00 21.00 28.60 25.00 27.00 22.05 22.00 20.00 31.39 70.00 68.00 82.04
Weber State University 9.00 11.00 21.00 18.25 22.00 17.00 30.00 18.00 28.50 57.25 51.00 66.50
Southern Utah University 4.00 6.00 12.25 6.20 5.50 1.50 2.40 2.50 3.15 12.60 14.00 16.90
Snow College 2.66 3.00 3.00 2.99 3.66 4.13 2.65 1.53 3.13 8.30 8.19 10.26
Dixie College 2.00 1.75 2.67 3.75 3.59 4.60 3.10 2.88 2.72 0.85 8.22 9.99
College of Eastern Utah 1.00 1.00 2.00 3.50 3.00 5.40 1.85 1.13 1.00 6.35 5.13 8.40
Utah Valley Comm. College 1.00 1.00 2.20 5.50 6.50 5.50 2.72 2.35 2.56 9.22 9.85 10.29
Salt Lake Comm. College 1.75 1.75 4.90 3.00 4.95 17.45 3.50 5.00 0.75 8.25 11.70 23.10
SYSTEM TOTAL 108.91 109.50 140.62 205.99 215.20 220.63 155.72 153.39 161.20 470.62 478.09 522.45
Source: IPEDS Library Survey 1992
Table 2
UTAH SYSTEM OF HIGHER EDUCATION
Library Operating Expenditures
Institutions Salaries & Wages
FY 87-88 FY 89-90 FY 91-92
Collections
FY 87-88 FY 89-90 FY 91-92
Preservation
FY 87-88 FY 89-90 FY 91-92
University of Utah 94,174,220 94,468,260 $4,979,432 $3,728,300 $3,913,006 $4,166,522 9133,604 1195,551 9149,338
Utah State University 51,095,646 $1,118,786 93,438,353 $1,290,092 $1,458,077 $1,975,655 $72,616 578,051 $81,311
weber State UniversitY $681,150 $791,642 $862,615 9376,193 9521,550 $777,216 $13,573 $791 $1,500
Southern utah University 9248,367 9223,363 9248,079 9105,174 9130,884 $195,968 90 90 $O
Snow College $68,904 $112,096 5156,421 928.563 540,526 $74,264 $467 $799 $917
Dixie College $80,825 $97,179 $148,215 $35,390 956,409 991,681 9486 $0 $2,100
College of Eastern Utah $61,159 $69,570 $114,397 $33,831 $52,977 $45,789 $0 $3,425 $0
Utah Valley Comm. College $111,814 $142,053 $175,972 $85,995 $115,516 $111,572 $0 $1,532 $162
Salt Lake Comm. College $123,823 $244,259 $296,241 $107,602 $162,254 $158,696 $O $0 $0
SYSTEM TOTAL $6,645,908 $7,267,208 98,419,725 $5,791,340 $6,451,199 $7,597,363 $220,746 $280,159 $235,994
Institutions
FY 87-88
Equipment
FY 89-90 FY 91-92
Other Operating
Expenditures .
FY 87-88 FY 89-90 FY 91-92
Total Operating
Expenditures
FY 87-88 FY 89-90 FY 91-92
University of Utah $531,677 1305,845 9383,483 91,075,688 $1,147,878 $1,700,391 $9,643,489 $10,030,540 $11,379,166
Utah State University $38,061 $78,807 $322,202 $187,946 $184,795 $484,229 $2,684,361 $2,918,526 $4,301,816
Weber State University $7,063 $67,272 $194,831 $71,740 $140,156 $107,782 91,149,719 91,521,411 91,943,944
Southern Utah University $36,698 $21,222 $21,630 $36,649 $22,666 $131,077 $426,888 $398,135 $596,754
Snow College 9382 $8,700 545,095 915,768 $17,321 $191,075 $114,084 $179,442 $467,772
Dixie College $5,089 $21,385 $24,480 921,775 919,915 $42,776 $143,565 $194,888 $309,252
College of Eastern Utah $1,210 $2,343 $776 $28,364 $6,738 $1,305 $124,564 9135,053 9162,267
Utah Valley Comm. College $15,162 $10,883 $23,808 $20,940 925,882 $36,294 $233,911 $295,866 $348,408
Salt Lake Comm. College SO $9,924 $275,711 $3,508 $18,468 $180,482 9235,133 $434,905 $911,130
SYSTEM TOTAL $635,342 $526,381 $1,292,016 $1,462,378 $1,583,819 $2,875,411 $14,755,714 916,108,766 920,420,509
Other includes postage, telecommunication, database searches, computer services, etc.
Source: IPEDS Library Survey 1992

Table 3
UTAH SYSTEM OF HIGHER EDUCATION
Library Collections FY 92
Institutions
Book Volumes Book TitlesGovernment Government Serial
Document (Units) Document (Titles) Subscriptions
Added 0 Held at I Added I Held at Added / Held at H Added f Held at I Added I Held at
During Year Year End During Year'Year End During Year Year End During Year Year End During Year Year End
University of Utah 68,611 2,277,387 NA RA 26,479 674,610 NA NA 549 20,500
Utah State University 59,742 1,120,493 41,E32 721,732 17,892 159,461 17,892 159,461 140 6,228
Weber State University 10,289 344,918 9,494 310,000 8,039 237,341 HA RA 2,778
Southern Utah University 12 471 187,086 UA UA 182 1,202
Snow College 1,038 28,781 863 NA 14,461 32,915 RA NA 86 369
Dixie College 4,275 59,822 3,371 46,746 25 709 25 709 7 277
College of Eastern Utah 3,484 42,747 2,991 38,173 1,200 3,500 801 2,103 18 312
Utah Valley Comm. College 4,267 55,259 3,699 44,998 12 413
Salt Lake Comm. College NA NA 2,694 51,714 41 41 41 41 21 373
SYSTEM TOTAL 164177 4116493 64944 1213363 68137 1108577. 18759 162314 1,015 32,452
Institutions
Manuscripts & Archives
Serial Titles Hicroforms (Units) Microforms (Titles) (in linear feet)
CartographicMaterials
Added I Held at I Added # Held at P Added I Held at 0 Added H Held at 0 Added 0 Held at
During Year Year End During Year Year End During Year Year End During Year Year End During Year Year End
university of Utah NA HA 127,853 3,096,495 RA NA 1,907 14,530 8,382 170,375
Utah State University 140 6,050 119,132 1,781,145 66,228 1,094,148 681 6,486 2,996 78,471
Weber State University 2,700 N.A 1,483,822 NA NA 125 1,639 2,906 55,396
Southern Utah University uA HA 20,545 526,458 uA UA 53 322 257 1,745
Snow College 86 369 3,805 40,499 85 330 18 568 2,553
Dixie College 7 276 4,078 25,974 3 43 203 90 488
College of Eastern Utah 18 312 1,725 5,996 63 50 10 730
Utah Valley Comm. College 12 399 3,038 1 1 8.5 16 191
Salt Lake Comm. College 21 359 RA NA 20 78 2 26 641
SYSTEM TOTAL 284 10,465 277,138 6,963,427 66,337 1,094,663 2,777 23,274 15,225 310,590
Institutions
Graphic
Materials
Audio Audio Film & Video Film & Video
Materials (Units) Materials (Titles) Materials (Units) Materials (Titles)
Added I Held at 0 Added 0 Held at I Added I Held at I Added # Held at I Added / Held at
During Ycar Year End During Year Year End During Year Year End During Year Year End During Year Year End
University of Utah 439 553,293 238 27,415 RA NA 2,313 12,259 NA NA
Utah State University 25,500 348,460 758 16,648 758 16,634 381 5,899 354 4,606
weber State University 0 26 6,171 26 6,153 713 3,841 706 3,791
Southern Utah University UA UA 931 4,037 UA UA 173 1,352 UA UA
Snow College 10 NA 16 NA 8 NA 72 NA 68 178
Dixie College 276 3,090 669 2,168 306 1,585 396 511 298 391
College of Eastern Utah 0 20 800 20 750 49 126 49 126
Utah Valley Comm. College 51 33 33 215 893 194 413
Salt Lake Comm. College 3,008 67 3,768 RA HA 582 3,151 NA RA
SYSTEM TOTAL 26,225 907,902 2,725 61,040 1,118 25,155 2,581 15,773 1,669 9,505
Institutions
Machine Readable Machine ReadableMaterials (Units) Materials (Titles)
Other Library
Materials
I Added I Held at I Added 0 Held at I Added 0 Held at
During Year Year End During Year Year End During Year Year End
University of Utah 180 553 KA NA 3,598 17,124
Utah State University 75 250 42 91 11 866
Weber State University 207 500 10 400 NA NA
Southern Utah University 54 2,170 UA UA 25 4,202
Snow College 10 11 8 11 NA RA
Oixte College 1 14 1 13 1 I
College of Eastern utah 4 7 4 7 o eUtah Valley Comm. College 1 1 3 3 0 o
Salt Lase Comm. College 2 302 2 44 0 7,641
SYSTEM TOTAL 354 3,255 70 569 37 12,710
Number Added does not include the number withdrawn.
Source: IPEDS Library Survey 1992
2
4 3 7

Table 4
UTAH SYSTEM OF HIGHER EDUCATION
Library Loan Transactions
Fiscal Year 1991-92
Institutions
Circulation Transactions
General Reserve
Collection Collection
Interlibrary Loans
To Other From Other
Libraries Libraries
University of Utah 463,907 146,385 25,574 11,983
Utah State University 210,897 84,747 8,504 9,151
Weber State University 120,000 27,000 3,277 1,158
Southern Utah University 85,161 13,155 1,212 3,144
Snow College 15,205 5,102 28 310
Dixie College 39,505 4,959 295 715
College of Eastern Utah 38,524 3,613 82 415
Utah Valley Comm. College 21,825 10,492 2 0
Salt Lake Comm. College 52,249 8,175 813 29
SYSTEM TOTAL 1,047,273 303,628 39,787 26,905
Source: IPEDS Library Survey 1992
Table 5
UTAH SYSTEM OF HIGHER EDUCATION
Library Service Per Typical week
Fall 1992
Institutions
Public
Service
Hours
Gate
Count
Reference
Transactions*
University of Utah 100 1,220,926 NA
Utah State University 104 25,538 857
Weber State University 80 18,479 514
Southern Utan University 82 315,045 2,905
Snow College 85 2,907 NA
Dixie College 79 4,727 117
College of Eastern Utah 73 2,358 718
Utah valley Comm. College 79 3.400 937
Salt Lake Comm. College 75 5,846 282
SYSTEM TOTAL 756 1,599,226 6,330
* Includes online database searches.
Source: 1PEDS Library Survey 1992
34 18

Table 6
UTAH SYSTEM OF HIGHER EDUCATION
Library Expenditures HistoryFiscal Years 1986-87 through 1990-91
Expenditures
Library For Acquisition of
Institution Year Expenditures Library Materials
University of Utah 1986-87 $7,371,371 $4,203,887
1987-88 $10,014,158 $3,854,685
1988-89 $9,830,813 $4,454,6861989-90 $9,482,227 $4,488,787
1990-91 $10,702,042 $4,326,832
1991-92 $11,844,424 $6,095,708
Utah State University 1986-87 $2,737,488 $1,140,6401987-88 $3,243,497 $1,276,648
1988-89 $3,402,692 $1,516,0471989-90 $2,998,188 $1,542,138
1990-91 $3,386,597 $1,875,309
1991-92 $3,774,905 $2,002,512
weber State University 1986-87 11,536,018 $465,654
1987-88 $1,426,141 $426,353
1988-89 $1,551,651 $545,2461989-90 $1,769,545 $547,197
1990-91 $1,989,092 $716,804
1991-92 $2,349,069 $910,089
Southern Utah University 1986-87 $437,993 $86,427
1987-88 $426,772 $107,190
1988-89 $496,160 $125,6881989-90 $569,872 $177,075
1990-91 $636,388 $187,265
1991-92 $657,833 $216,370
Snow College 1986-87 $204,634 $50,487
1987-88 $117,087 $37,569
1988-89 $235,680 $19,142
1989-90 $251,817 $23,444
1990-91 $424,000 $424,0001991-92 5365,601 $365,601
Dixie College 1986-87 $166,522 $35,560
1987-88 $216,010 $38,242
1988-89 $165,952 $34,350
1989-90 $182,874 $21,954
1990-91 $218,317 $18,9351991-92 $335,439 $335,439
College of Eastern Utah 1986-87 $141,218 $14,553
1987-88 $168,604 $23,955
1988-89 $147,470 $24,699
1989-90 $148,795 $33,793
1990-91 $255,318 $69,4741991-92 $314,345 $90,066
Utah Valley Comm. College 1986-87 $396,630 $83,266
1987-88 $233,204 $43,0051988-89 $495,927 $34,7691989-90 $305,490 $39,038
1990-91 $396,177 $130,747
1991-92 $571,590 $90,966
Salt Lake Comm. College 1986-87 $372,283 $151,405
1987-88 $301,475 $97,426
1988-89 1335,295 $101,805
1989-90 5446,347 $153,156
1990-91 $490,360 $150,980
1991-92 $740,236 $146,006
SYSTEM TOTAL 1986-87 $13,370,157 $6,231,879
1987-88 $16,146,948 $5,905,0731988-89 $16,661,640 $6,856,432
1989-90 $16,155,155 $7,026,5821990-91 $18,498,291 $7,900,346
1991-92 $20,953,442 $10,252,757
Source: IPEDS Finance Survey
4