Embed Size (px)
Citation preview

DOCUMENT RESUME
ED 246 638 EC 170 031
AUTHOR Bullard, Jennie KneppTITLE Factors in Mainstream Decision Making. [Final
Report].SPONS AGENCY Special Education Programs (ED/OSERS), Washington,
DC..PUB DATE 82GRANT G008101059NOTE 105p.; Ph.D. Dissertation, Pennsylvania State
University.PUB TYPE Dissertations/Theses - Doctoral Dissertations (041)
-- Reports - Research/Technical (143)
EDRS PRICE MF01/PC05 Plus Postage.DESCRIPTORS *Academic Achievement; Administrator Role; *Behavior
Problems; Elementary Education; *LearningDisabilities; *Mainstreaming; MathematicsAchievement; Parent Participation; *ParticipativeDecision Making; Reading Achievement; *Staff Role;Teacher Participation; T--mwork
ABSTRACTThe dissertation reports on a study which examined
the mainstreaming practices and decisionmaking processes used inPittsburgh Public Schools' elementary schools and investigatedwhether learning disabled (LD) students assigned to mainstreamacademic classes differed academically and behaviorally fromnon-mainstreamed LD students. The study was conducted in two phases:(1) selection and assessment of a sample of mainstreamed andnon-mainstreamed students (grades 2, 3, and 4), and (2) anexamination of mainstreaming decisionmaking processes through the use
of a structured interview with school personnel. Students wereadministered a battery of academic and behavioral instruments andteachers reported on behavior problems. Ss were further compared withnon-mainstreamed peers. Results of achievement data indicated littledifference in reading scores of mainstreamed and non-mainstreamedsecond graders, although differences increased markedly withincreased grade level. There was a large number of non-mainstreamedSs who possessed behaVioral attributes reported to be needed formainstreaming but who were not mainstreamed. Structured interviews in
phase 2 revealed that mainstreaming decisions were based on academicand behavioral strengths and weaknesses and identified patterns ofparticipation by teachers, administrators, parents, and support staffin educational planning team meetings. Findings indicated highparticipation levels for special education teachers andadministrators but low levels for regular educators and support
personnel. (CL)
************************************************************************ Reproductions supplied by EDRS are the best that can be made
from the original document.***********************************************************************

FACTORS IN MAINSTREAM DECISION MAKING
By
Jennie Knepp Bullard
B.S., The Pennsylvania State University, 1966
M.Ed., The Pennsylvania State University, 1971
Submitted to the Graduate Faculty in the School
of Education in partial fulfillment of
the requirements for the degree of
Doctor of Philosophy
University of Pittsburgh
1982
U.S, DEPARTMENT OF EDUCATIONNATIONAL INSTITUTE OF EDUCATION
EDUCATIONAL RESOURCES INFORMATIONCENTER (ERIC)
I/This document has been reproduced asreceived loom the person or organizationriginating it,
: Minor changes have been made to improvereproduction quality.
Points of view or opinions stated in this document do not necessarily represent official NIEposition ur
S

(
Copyright by
Jennie Knepp Bullard
1982
3
(N

ACKNOWLEDGEMENTS
It all started several summers ago when Naomi Zigmond brought
to my attention a potential research toot: that was to occupy much of
my conscious thinking for the next two years. In doing so, Dr. Zigmond
became responsible for leading me on one of the most enjoyable, enrich-
ing and fascinating adventures of my educational career. For this
I will always be grateful.
I would be terribly remiss in my duty if I did not also mention
some of the other members of my dissertation committee. I pay special
tribute to Dr. Tony Eichelberger, Dr. Gaea Leinhardt, and Dr. George
Maitland, and I express my admiration for their enviable capacity for
patience and their unusual measure of insight and scholarship.
I must also express'a special -,te of thanks and gratitude to
'Dr. Anne K. Golin who turned this dissertation process into a truly
active learning experience. She is a true teacher in every sense of
the word. I thank her for staying with me every inch of the,way.
Finally, a very special note of gratitude to my husband Ray,
who never lost faith in me. His quiet manner and gentle support kept
me going when the going got rough. He gave me the courage I needed
to finish the race..
4

CHAPTER
TABLE OF CONTENTS
Page
I. INTRODUCTION 1
A. General Statement 1
II. REVIEW OF LITERATURE 3
A. Definition and Implications of LeastRestrictive Environment 3
B. Academic Achievement in Instructional
Integration5
C. Importance of Social Characteristics in
Mainstreaming7
D. Importance of Involvement of School Personnel
in Mainstreaming8
E. Research Concerning Multidisciplinary Teams 9
F. Summary12
III. THE PROBLEM 14
A. Rationale 14
B. Statement of the Problem 14
C. Delimitation of the Study 15
D. Definition of Terms 16
IV. METHODOLOGY 17
A. Phase I - Student Characteristics 17
Subject Selection 1/
Instrumentation 18
Procedures 20
ii

CHAPTERPage
B. Phase II - Decision Making 21
Subject Selection 21
Instrumentation 21
Procedures . . 21
V. RESULTS 23
A. Phase I Analysis 23
Summary of Phase I 30
B. Phase II Analysis 31
Summary of Phase II 43
VI. DISCUSSION, IMPLICATIONS AND SUMMARY 45
A. Discussion of the Results 45
B. Implications for Future Research 51
C. Summary53
REFERENCES55
APPENDICES61
APPENDIX A- Interview Instrument62
APPENDIX B - Scores of Mainstreamed and Non-Mainstreamed
Students in Target Schools 70
0"
APPENDIX C - Frequency Distributions of Math and Readin?
Levels of Mainstreamed and Non-Mainstreamed
Students by Grade04

LIST OF TABLES
TablePage
1 Distribution of Mainstreamed and Non-MainstreamedStudents by Grade 20
2 Means and Standard Deviations of Reading Levels
of Students Mainst-eamed for Reading and Non-
Mainstreamed Peers by Grade 24
3 Means and Standard Deviations of Math Grade
Equivalents of Students Mainstreamed for Math
and Non-Mainstreamed Peers by Grade 25
Means and Standard Deviations of Behavior Checklist
Scores for Mainstreamed and Non-Mainstreamed Students
by Sex26
5 A Summary of Achievement and Behavior Status of
Mainstreamed and Non-Mainstreamed LearningDisabled Students 27
6 Summary of Comparison of Mainstreamed E:nd Non-Main-
streamed Grade-Appropriate Students in the Areas
of Math, Reading, and Behavior within Individual
Classrooms28
7 Initiator of the Mainstreaming Process as Perceived
by Principals and Teachers 32
8 Principal and Teacher Perceptions of When the
Mainstreaming Process was Initiated 33
9 Principal and Teacher Perceptions of the Length
of the Mainstreaming Process33
10 Principal and Teacher Perceptions of Additional
Personnel Involved in the Mainstreaming Process 34
11 Principal and Teacher Perceptions of the Longevity
.of Mainstreaming Placements34
12 Principal and Teacher Perceptions of Appropriate
Mainstreaming Process35
13 Reasons for Mainstreaming Students as Reported by
Principals and Teachers36
14: Reasons for Not Mainstreaming Students as Reported
by Principals and Teachers 36
iv7

Table Page
15 Principal and Teacher Perceptions of CriteriaNecessary for Referral Initiation 37
16 Principal and Teacher Perceptions of Who UsuallyInitiates the Mainstream Referral 38
17 Principal and Teacher Perceptions of AdditionalPersonnel Involved in the Initiation of a Referral . 38
18 Principal and Teacher Perceptions of His/Her Role
in the Mainstreaming Process 39
19 Principal and Teacher Perceptions of Who isResponsible for the Final Decision in theMainstreaming Process 40
20 Principal and Teacher Perceptions of the Role of
the Mainstream Teacher in the Mainstreaming Process . . 40
21 Principal and Teacher Perceptions of the Parent's
Role in the Mainstreaming Process 41
22 Principal and Teacher Perceptions of Additional
Personnel Involved in the Mainstreaming Process 41
23 Principal and Teacher Perceptions of the Role of
Additional Personnel 42
24 Assessment Processes Used in Their Schools as Reported
by Principals and Teachers 42

I. INTRODUCTION
A. General Statement
With the passage of Public Law 94-142, the Education for All
Handicapped Children Act (1975), educators have been faced with the
responsibility of mainstreaming handicapped children. This respon-
sibility is not without its problems. One major problem is that main-
streaming means different things to diffet.ent.people. For example,
TAbull (1977) views mainstreaming as a legislative and judicial
preference used mainly to balance the interests of children and schools.
Chaffin (1974) defines mainstreaming as an alternative program "charac-
terized by the retention of the mildly retarded in the regular classroom
with supplemental support being provided to the regular classroom teach-
er" (p. 6). The parent advocacy publication, Closer Look, points out
that "mainstreaming covers a variety of alternatives,and placements
should be made on the basis of individual needs" (p. 5).
Not only is there a great deal of difference in the way experts
view mainstreaming,,but there are also problems in the actual process
of making mainstreaming decisions. Cruickshank (1977) suggests that
many school principals fail to understand the nature of the difficulties
facing handicapped children who are placed in the mainstream. There-
fore, these administrators may be unable to make appropriate main-
streaming decisions. According to Cruickshank (1977), this has become
an increasingly important problem because the principal, as the admin-

2
strative head of the school, often acts as the representative of the
Local Education Agency (LEA) and is therefore responsible for the
delivery of program modifications. Kaufman, Agard, and Semmel (1979)
speculate thaemanY mainstreaming decisions are made for administrative
convenience and are not related to the needs or characteristics of the
child. The need to examine each student from several points of view led
to the-development of the widespread use of multidisciplinary planning
teams.
While the increased use of these planning teams to determine
educational changes has been the subject of several recent research
projects (Gilliam, 1979; Yoshida, Fenton, Maxwell, & Kaufman, 1978),
there appears to be little research to support why some students are
placed in one program as opposed to another. The purpose of this in-
vestigation was to study the mainstreaming practices and decision making
processes being'used by elementary school p'rsonnel in the Pittsburgh
Public Schools and to determine whether learning disabled (LD) students
who were assigned to academic classes in the mainstream differed in
certain academic and behavioral characteristics from LD students who
were not mainstreamed.

II. REVIEW OF THE LITERATURE
A. Definitions and Implications of Least Restrictive Environment
The mainstream of education or LRE is\defined by Public Law
94-142 as fullows:
Mainstream - The Least Restrictive Environment - Each public
agency shall insure: (1) that to tie maximum extent appro-
priate, handicapped children including children in public
or private institutions, or other care facilities, are edu-
cated with children who are not handicapped, and that (2)
special classes, separate schooling or other removal of
handicapped children from the regular educational environ-
ment occurs only when the nature or severity of the handi-
cap is such that education in the regular classes cannot
be achieved satisfactorily. (P.L. 94-142, 121a.550)
Public schools are now required by law to implement appropriate
models of education for their handicapped students to assure the educa-
tion of students in least restrictive environments.. But there appears
to be considerable confusion and disagreement regarding what elements
are necessary in a valid mainstreaming effort (MacMillan & Semmel, 1977).
This disagreement over the defining characteristics has resulted in con-
fusion in the development and use of procedures to implement programs.
Although the term "mainstreaming" has dominated much of the recent
literature in the field of special education, an exact definition of
this term remains elusive. In a review of articles-about mainstreaming,
Friend (1980-81) reports that Birch in his definition of mainstreaming
"incorporated 14 descriptors, not to mention a panoply of .'elated nomen-
clature, that have resulted from mainstreaming practices" (p. 8). Beery
(1972) while not directly defining mainstreaming, suggested that main-
3

streaming practices be critically examined for three elements: that a /
continuum of programs for children with special needs be provided; that
"pull out" programs be reduced; and that consultants to the regular
classroom be utilized as much as possible.
One common facet in all interpretations of mainstreaming is the
provision that special students should be educated, at least in part,
in the regular classroom with non-handicapped students. Lilly (1970)
in his "zero-reject model" stated that no mentally retarded child,except
the most severely retarded, should be excluded from the regular educa-
tional program or placed in a special class. Add'tionally, Adamson and
Van Etten (1972) postulated that no single educational program can be
appropriate for all children and that some students may really need a
varied range of special services. There appears to be no definition
that is "universally" acceptable thus far, but'some experts in the
special education field point out the need to examine mainstreaming
practices in terms of three components, i.e. Iliporal, instructional,
and social integration (Kaufman. Gottlieb, Agard, & Kukic, 1975).
In the past the emphasis on the administrative aspects of
integrating exceptional children into the regular grades has tended
to establish a perspective that mainstreaming is based primarily on
the amount of time a child spends in the regular classroom. Even though
many experts agree that mainstreaming is:more than jest time spent with
;Ion-handicapped students, Chiba and Semmel (1975), Carrol (1970) and
Ballard and Zettel (1977) state that the most frequently used measure
of me.nstreaming is still the amount of time spent with non-handicapped
students in the regular classroom. According to Semmel, Gottlieb, and
Robinson (1979) temporal integration is certainly a necessary element,
12


5
but is not sufficient in and of itself, and mainstreaming should also
include an appropriate match between pupil and environment.
Part of that appropriate environment is instructional in nature.
The following review examines the role of academic achievement in in-
structional integration, the importance of social characteristics in
mainstreaming, the role of school personnel in the mainstreaming pro-
cess and research in the use of multidisciplinary teams.
B. Academic Achievement in Instructional Integration
Although there is a strong moral ,and legal argument for the in-
tegration of the handicapped, there is also a strong need to fit the
child to the type of recommended placement. The success,of most pro-
gramming for the handicapped, as well as the non-handicapped, is judged
by the progress or lack of progress in academic achievement. A number
of studies have indicated that intensive academic preparation is a nec-
essary prerequisite for successful mainstreaming. In an investigation of
teaching methods by Haring and Krug (1975), 48 EMR children were randomly
assigned to four special classes, 24 to two experimental classes and 24
to two control classes. Children in the experimental class were given
intensive instruction in the areas of math and reading. At the end of
the school year, the children in the experimental group gained an average,
of eleven *months more in math and reading achievement than did the chil-
dren in the control classes. Thirteen of the 24 children were referred
for placement in mainstream classes. A follow-up study of these 13 chil-
dren indicated that 10 children had been successfully integrated into
regular classrooms. Haring and Krug (1975) concluded that intensive
academic preparation was a necessary element for a successful transition
into mainstream classes.
13

6
After reviewing the records of 52 deaf children who had been
transferred from schools for the deaf to public schools, Connor and
Connor (1960) reported that only one-half of these children had achieved
a successful integration. The author concluded that success in the main-
stream was related to strong parental support, an ability to communicate
prior to placement, and high achievement in the area of reading.
In a study of criteria used in determining a learning disabled
child's readiness for mainstreaming, Wilkes,.Bireley, and Schultz (1975)
asked 120 professional educators to rate the importance of a set of 41
criteria developed for use in this study. This group of professionals
consisted of 16 learning disabilities supervisors, 30 school psycholo-
gists, 51 learning disabilities teachers, and 33 regular class teachers
with mainstreaming experience. The list of criteria contained statements
concerning the child's academic work, )ehavioral characteristics and
placement criteria. All four groups of professionals agreed that ade-
illate preparation and ability to handle academic situations were impro-
tant pre-mainstreaming criteria needed for successful integration.
Semmel, Gottlieb, and Robinson (1979)'stated that there are few
regular classroom teachers who change their teaching styles and methods
to accommodate the needs of integrated handicapped students. Therefore,
it would appear-that the achievement level in those subjects into which
handicapped students are mainstreamed should be as close to the achieve-
ment levels of non-handicapped students as possible.
Additionally, there is evidence in the research (Siders,'1979)
that supports the need.for such pre-mainstreaming planning practices as
a part of classroom integration plans. Siders (1979) also indicates,
14

however, that there is no literature that states that such academic
planning is done as a routine matter before making mainstreaming place-
ments.
C. Importance of Social Characteristics in Mainstreaming
Another area of critical concern in the area of mainstreaming
is that of social integration (Kaufman, Gottlieb, Agard, & Kukic, 1975).
Social integration refers to the relationship between a handicapped
child and members of his/her normal peer group. Social integration
can also be defined in terms of physical proximity, interaction, assimi-
lation, and acceptance.
In studies of the social acceptance of mildly retarded students
by their non-handicapped peers, integrated retarded students were found
to be less accepted than were segregated retarded students (Gottlieb,
1974; Goodman, Gottlieb, & Harrison, 1972). In a study by Vacc (1968)
utilizing a play as a sociometric device, it was concluded that emotion-
ally disturbed children integrated into regular classrooms were less
accepted and more rejected than were their normal peers in the same
mainstream classrooms.
In an attempt to find reasons for the poor social acceptability
of handicapped students, non-retarded children were asked why they re-
jected certain retarded students. The major reason given for rejection
was anti-social behavior such as fighting, bullying, and classroom
misbehavior (Baldwin, 1958; Johnson, 1950).
Even when social intervention techniques were implemented in an
effort to improve social and behavioral skills, it appeared that handi-
capped students remained less socially acceptable (Shellhaas, 1969).
15

Wilkes et al. (1975) found in a survey of opinions of learning
disabilities teachers that a child's behavior in the classroom had more
bearing on the decision to mainstream than did the child's academic
performance in the classroom. School psychologists in this same study
indicated that appropriate behavior was an important factor in making
mainstreaming decisions, but was not the most important criteria.
These studies indicate that students who are selected to be
mainstreamed should have better behavior than students who do not get
mainstreamed, but no one has examined this supposition to date.
D. Importance of Involvement of School Personnel in Mainstreaming
School personnel haVe an extremely important role in the inte-
gration of the handicapped and the decisions that led to such integration.
Kaufman et al. (1975) stress that mainstreaming is achieved by coordin-
ated planning and programming by regular and special education adminis-
trative, instructional, and support personnel. If mainstreaming is to
be effective, then educational personnel must be willing to cooperate
in efforts to provide the most appropriate educational programs for all
handicapped children. Kaufman, Agard, and Semmel (1979) found in analyz-
ing the results of Project PRIME that decisions to reintegrate EMR
children into regular classrooms were apparently independent of learner
background, characteristics of teachers or other students, or available
instructional programming. They hypothesized that the decision for in-
tegration was more likely to be based on some administrative variable
that had not yet been.isolated by the investigators. In attitudinal
studies of regular education teachers, there appeared to be a general
air of pessimism toward the concept of mainstreaming and a pervading
feeling that such practices would lower the standards of mainstream
16

instruction (Meyers, McMillan, & Yoshida, 1975; Shotel, Iano, &
McGettigan, 1972). Payne and Murray (1974) indicated that urban ad-
ministrators had a higher level of acceptance toward the handicapped
than did their suburban counterparts. In general, both teachers and
administrators voiced reluctance toward the practice of mainstreaming
handicapped students (Semmel et al., 1979), but no one had studied how
the mainstreaming process actually occurs.
E. Research Concerning Multidisciplinary Teams
A great deal of work and preparation goes into making initial
placement decisions for handicapped children. Public Law 94-142 requires
school personnel to come together as a multidisciplinary team to make
placement decisions. The multidisciplinary or planning team may in-
clude regular and special education teachers,administrative and super-
visory staff and/or support personnel (Bickel, 1980; Braun, 1977;
Fenton, Yoshida, Maxwell, & Kaufman, 1979; Palmer, 1980; Rucker &
Vautour, 1981).
The placement team is generally responsible for determining
.eligibility for special services, establishing educational goals and
objectives, and determining programming decisions (Yoshida, Fenton,
Maxwell, & Kaufman, 1978). Until recently, such decisions had been
made by a single individual or "gatekeeper," usually the school
psychologist (Bickel, 1980; Yoshida et al., 1978). The development
of these educational, planning or multidisciplinary teams has aroused
the interest of researchers in the field of special education and
psychology.,
17

Yoshida et al. (1978) have assessed the roles, relationships,
participation levels and professional satisfaction of members of educa-
tional planning teas. The results of these studies indicate that team
members from different professions differ in the level of self-perceived
participation during planning team meetings. Support personnel (school
psychologists, counselors, and social workers) and administrators appear
to have higher participation scores than do medical personnel, regular,
and special education teachers. However, a weak relationship was also
found between role and satisfaction by all school personnel except regu-
lar and special education teachers and school psychologists. According
to the authors, themost significant findings of .6iese studies are that
participation correlates positively to satisfaction, attendance at a
meeting does not translate into particiyation or satisfaction, and
regular education teachers are low in both participation and satisfac-
tion. The latter finding is particularly, mportant given that the role
of regular educators is critical to the development and implementation
of a mainstream educational programming for the handicapped child.
In a similar investigation, Gilliam (1979) studiehe contri-
butions and status rankings of. planning committee participants. Utiliz-
ing a. questionnaire, 130 committee members were asked to rank order the
1L roles most often represented in planning teams, according to their
,oportance in the planning process. A follow-up study was conducted in
which participants evalUated actual'contributionsin the five areas of
diagnosis, planning, placement, implementation, and due process.' The
results of this study indicated that planning team members may perceive
role stereotypes in terms of expected contributions and generally,
these expectations' werevalid in terms of actual contributions.
18

11
In a pilot study of longstanding planning teams, Vautour (1977)
found that these teams place exceptional children more appropriately
than do individual team members acting alone. Appropriate placements
were determined through follow-up consultations with the receiving
special education teachers. Additionally, the size of the team had
little effect on the appropriateness of placement selections. For
example, teams with four to ten members appeared to have similar success N\N
or failures in selecting appropriate placements as did teams with three
members.
Vautour (1977) also examined the exercise of influence on team
decisiOns. The results of this study indicated that a person's knowl-
edge of appropriate pladements correlates positively with the influence
exerted over fellow team members. In addition, these results refuted
the notion that the role of chairperson or possession of special train-
ing also indicates a higher level of influence.
Crowell (1977) replicated Vautour's study to test out the notion
that teams who had worked as teams over a long ;:;erlod of time may grad-
ually identify knowledgeable team members and subsequently rely on them
for decisions. In this study, however, team members were not familiar
with fellow team members in the experimental groups to which they were
assigned. The findings of Crowell's study were identical to. Vautour's
study, i.e., those team members high in knowledge also had a high level
of influence over other team members.
This research.is focused on factors. affecting the decision-making
of multiciscip.linaryteams in placement decisions but there is no re-
search which examines the decision-making process that takes place when
students igre considered to be ready for reintegration into the mainstream.
19

12
F. Summary
There is a great deal of confusion about mainstreaming. This
confusion includes a lack of clarity about the definition, necessary
elements, and what it takes to deliver appropriate programming (MacMillan
& Semmel, 1977). Although many authors have studied the importance of
social acceptance of the handicapped by the non-handicapped, there is
little evidence that indicates any effort has gone into determining
what acceptable behavior levels will be appropriate for successful
mainstreaming.
The research also indicates that the achievement levels in those.
subjects into which handicapped students are mainstreamed should be as
close to the achievement levels of non - handicapped students as possible
(Semmel et al., 1979; Wilkes, Bireley, & Schultz, 1975). But according
to Siders (1979) there is no literature that states that such academic
planning is done as a routine matter before making mainstreaming
decisions.
Mainstreaming has been discussed as a set of distinct elements,
i.e. temporal, instructional and social integration. In practice,
however, these elements are mutually interdependent (Kaufman et al.,
1979). Additionally, each component of mainstreaming affects, and is
affected by, the school and classroom climates. The tenor of these
climates is greatly influenced by key school personnel. However, those
school personnel responsible for making appropriate mainstream.decisions
have indicated negative and pessimistic views toward handicapped chil-
dren and the practice of mainstreaming (Semmel et al., 1979). A major
reason given was a concern that the standards of the regular classroom
20

will be lowered and education for the non-handicapped will suffer as a
result (Meyers, MacMillen, & Yoshida, 1975). "Furthermore, little in-
formation is available regarding the criteria that schools employ to
decide who gets mainstreamed and for how much time" (Semmel et al.,
1979, p. 79).
Public Law 94-1A2 reruired school personnel to come together as
a team in order to determine eligibility for special services, to es-
tablish educational goals and objectives, and to determine programming
decisions (Yoshida et al., 1970). Recent research concerning these
multidisciplinary teams has examined the perceived roles and satisfac-
tion of team participants, and the effectiveness of both preservice and
inservice educational prograMs. Most of the research thus far has
focused on team behavior at the time of placement. Little research is
available, however, on how teams operate later when making decisions
about mainstreaming.
Although there has been an abundance of recent research involving
the growth and development of multidisciplinary teams, there is no re-
search which addresses one specific problem area, i.e. what are the
student characteristics and the decision-making process which allow
some students the opportunity to be mainstreamed for academic subjects
while others are not. The purpose of this study was to examine both
student characteristics and the decision-making process engaged in by
administrators and teachers responsible for making Mainstreaming
decisions, and to better understand the mainstreaming process.

III. THE PROBLEM
A. Rationale
The enactment of the Education for All Handicapped Children Act
of 1975 has brought forth many far-reaching changes for professionals
in the field of special education. One very significant change has been
the introduction Lf a multidisciplinary team that is responsible for the
planning and implementation of programs for handicapped students. Al-
though the use of "teams" in the human services field has been evident
for many years, it was only with the passage of P.L. 94-142 that these
multidisciplinary teams became federally mandated in education.
According to Rucker and Vautour (1981), a number of research
projects have been initiated in an effort to study the decision-making
of such teams. Yoshida, Fenton, Maxwell, and Kaufman (1976) examined
the relationship between role, participation, and satisfaction during
planning team meetings. In a later study conc,rning the recognition of
team goals, Fenton, Yoshida, Maxwell, and Kaufman (1979) revealed that
less than a three-fourths majority of team members surveyed recognized
the team's duty to make specific decisions. The research thus far has
addressed the role of the team in making initial referral and placement
decisions, but there is little evidence in the literature regarding how
decisions about subsequent mainstreamplacements, are made.
B. Statement of the Problem
Students placed in elementary classrooms for children with
learning disabilitiesusually spend up to fifteen percent of their
14
22

instructional day outside the special education classroom (Leinhardt,
Zigmond, & Cooley, 1981). This time is spent in non-academic "main-
stream" classes with students from mainstream programs. Placement into
these non-academic subjects (art, music, physical education and/or
library) is made on a routine basis, usually without consideration for
either academic or behavioral characteristics.
Placements into mainstream academic subjects (e.g., reading,
math,cspelling, language arts, science, social studies) do not occur as
a matter of routine, but are assumed to be the result of thoughtful de-
cision-making among teachers and.school administrators. It is alsoc,
assumed that each student's academic and behavioral characteristics are
examined critically before academic mainstreaming is recommended- This
assumption,.however, has not been supported in the literature (Semmel et
al., 1979). As school systems become increasingly pressured to comply
with mandates of P.L. 94-142, it also becomes increasingly important t
examine the critical factors operating in the decision to place handi-
capped students into mainstream academic subjects. The major objective
of this study is to examine decision-making factors which affect place-
ment of students into academic subjects in the mainstream. In an effort
to identify critical factors, the following questions will be pursued:
1. How do students who are mainstreamed differ academically
and behaviorally from those who are not?
2. What are the factors that allow some students to be main-
streamed while others are not?.
C. Delimitation of the Study
This investigation includes only students enrolled in self-
contained elementary classrooms for the learning disabled in the
Pittsburgh Public Schools.
_23

r1\
0. Definition of Terms
Mainstreaming - In general, mainstreaming means that to the
maximum extent appropriate, handicapped children, including children
in public or private institutions or other care facilities, are'educated.
with children who are not handicapped, and special classes, separate
schooling or other removal of handicapped children from the regular
education environment occurs only when the nature or severity of the
handicap is such that education in regular classes with the use of
supplementary aids and services cannot be achieved satisfactorily
(P.L. 94-142, Section 121a.550). For the purposes of this study,
mainstreaming means the process of educating handicapped children
into academic subjects with their non-handicapped peers in the regular
classrooms.
Learning Disabilities - Children with special learning disabil-
ities exhibit a disorder in one or more of the basic psychological
processes involved in understanding or in using spoken or written
language. These may be manifested in disorders of listening, think-
ing, talking, reading, writing, spelling, or arithmetic. They include
conditions which have been referred to as perceptual handicaps, brain
injury, minimal brain dysfunction, dyslexia, developmental aphasia,
etc. They do not include learningproblems which are duP primarily
to visual, hearing, or motor handicaps, to mental retardation, emotional
disturbance, or to environmental disadvantage (National Advisory Commit-
tee to the Office of Education's Bureau of Education for the Handicapped).

IV. METHODOLOGY
The purpose of this investigation was to study the mainstreaming
practices and decision making processes used by elementary school
personnel in the Pittsburgh Public Schools and to determine whether
learning disabled (LD) students who were assigned to academic classes
in the mainstream differed in certain academic and behavioral character-
'istics from learning disabled students who were not mainstreamed.
This study was conducted in two phases. The first phase incor-
porated the selection and assessment of a population of mainstreamed
and non-mainstreamed students in selected target schools. Target
schools were those 20 schools in which at least one learning disabled
student was enrolled in an academic subject during the 1980-81 school
year. There were 23 LD classrooms in these 20 schools. The second
phase consisted of an examination of mainstream decision making processes
through the use of a structured interview. This interview was adminis-
tered to school personnel in target schools who were responsible for
making mainstreaming decisions which involved students in the sample.
A. Phase I - Student Characteristics
Subject Selection
The first phase of the study involved all se. .nd, third, and fourth
grade students enrolled in 23 target classrooms for the learning disabled
in which at least one student was mainstreamed for an academic subject
during the 1980-81 school year. These students were divided into two groups,
17 25

i.e. those students who had been mainstreamed (N = 40) and their non-
mainstreamed classroom peers (N = 112).
Instrumentation
The following academic and behavioral instruments were adminis-
tered to all students in the study.
The Reading 360 Initial Screening Test (Clymer, Humphrey, &
McCullough, 1971), the reading placement test for the Ginn reading series,
Is the adopted reading series used in the Pittsburgh Public Schobls. This
instrument is used in both special and mainstream .classes and measures
competency in decoding, encoding, and reading comprehension for students
in kindergarten through fifth grade. This placement test yields a read-
ing level score which correlates with grade levels. The average learner
is expected to master levels and 7 in second grade, complete level 8
and begin level 9 in grade 1. olete level 9 and begin level 10 in \
grade 4, and finish level 10 and begin level 11 in fifth grade. Teacher*,
in classes for the learning disabled utilize those placement tests to
verify a student's reading level placement.
The McMillan Mathematics Placement Test (Series M, 1976) consists
of a series of five tests which are criterion referenced to measure one
child's performance against established mastery criterion rather than
against the performance of other students. These tests are designed to
place children in the appropriate levels (grades one through five) of
the McMillan Mathematics Series (Series M). 'Exercises on the Placement
rest have been constructed to measure a wide range of skills with re-
speet to the learning goal. This mathematics series is used in many
special education and mainstream remedial classes in the Pittsburgh
Schools and produces a grade level score.
26


19
Although the literature states that behavior is a major factor
in the acceptance of the handicapped student by his non-handicapped peers
(Gottlieb, 1974), there is no device for assessing student behavior
in the Pittsburgh Public Schools. The Walker Problem Behavior Identi-
fication Checklist (WPBIC) (Walker, 1976) was used to chart observable
classroom behaviors in this study.
The 50 checklist items initially developed were from teacher
descriptions of classroom behavior problems. A random sampling of thirty
teachers was drawn from a population of elementary teachers in an Oregon
school district. Each teacher was asked to nominate those children in
their classes who exhibited chronic behavior problems. Observable
descriptions of overt behavior were derived from teacher interviews
yielding a pool of 300 items. Fifty of the most frequently mentioned
behavior's were selected for inclusion in the checklist. some sample
questions are as follows: "Has temper tantrums;" "Has no friends;"
"Refers to himself as dumb, stupid, or incapable;" and "Must have
approval for tasks attempted or completed." A panel of behavioral
scientists was then asked to rate each item's weight or influence in
handicapping a child's present adjustment. Interjudge reliability (rn)
was .83 and the, means of the five judges on all items were pooled .and
assigned as score weights for the scale items. The checklist was normed
on a population of 534 elementary school children. The reliability of
the WPBIC has been estimated by the Kuder-Richardson split-half method
and the test -retest method. The split-half reliability coefficient
obtained on the .WPBIC was .98 with a standard deviation of 10.53 and a
standard error of measurement of .28. The purpose of this checklist

20
was to assess the level of inappropriate behaviors eXhIbiW by subjects
being examined in this study.
Procedures
A list of all second, third, and fourth grade learning disabled
students in the 23 target classrooms was developed and mainstreamed and
non-mainstreamed students, were identified in the Spring of 1981. The
data in Table 1 indicates e nInber and percent of mainstreamed and
non-mainstreamed students in each grade.
Table 1
Distribution of Mainstreamed and Non-Mainstreamed Students by Grade
Mainstreamed Non-Mainstreamed
Students Students
Grade
2 9 (22.5) '34 (30.0)
3 14 (35:0) 40 (36.0)
4 17 (42.5) 38 (34.0)
Total 40 (100.0) 112 (100.0)
In June, 1981 each of the 23 teachers in the sample was asked to complete
a Walker Problem Behavior Identification Checklist for each student in
a target classroom.

B. Phase II - Decision Making
Subject Selection
For the second phase of the study, subjects were the 23 teachers
and 20 principals responsible for making mainstreaming decisions for
the learning disabled students in the study.
Instrumentation
The type of interview used in this study is commonly, referred
to as the "Open-end funnel" interview. SpecificalTv the interview be-
gan with very broad questions and comments and narrowed down progressively
to the important point or points desired of interest in this study. This
interview began with a clarific, :ion question regarding the mandates of
P.L. 94-142 and narrowed down to specific questions regarding decisions
which involve special education students being mainstreamed in that
particular school.
The contents of the interview were divided into three general
sections, i.e. an introductory question designed to determine the
interviewee's understanding of mainstreaming; fourteen questions
oriented toward student characteristics; and eleven decision-making
process questions. A copy of the interview is available in Appendix A.
Procedures
Using a table of random numbers,40 non-mainstreamed students
were randomly selected from the 112 non-mainstreamed classroom peers.
The names of these students were inserted into the interview instrument
in pairs consisting of a mainstreamed and non-mainstreamed classroom
peer. When a target school or classroom had more than one pair of '
students, only that section of the interview concerning student
29

22
characteristics was repeated. Twenty principals and 23 learning disa-
bilities teachers in the target schools were interviewed individually
by a graduate student assistant who had been trained in the techniques
of interviewing.

V. RESULTS
A. Phase I Analysis
The purpose of this investigation was to study the mainstreaming
practices and decision-making processes used in the Pittsburgh Public
Schools and to determine whether learning disabled (LD) students who
were assigned to academic classes in the mainstream differed in certain
academic and behavioral characteristics from learning disabled students
who were not mainstreamed.
This study was conducted in two phases. Phase I specifically
addresses research question number one, "How do students who are main-
streamed differ academically and behaviorally from those who are not?"
The first phase of this study examined academic and behavioral
scores of second, third, and fourth grade learning disabled students in
target classrooms. Students were assessed by their special education
teachers utilizing The Ginn Reading 360 Initial. Screening Test, The
McMillan Mathematics Placement Test, and The Walker Problem Behavior
Identification Checklist (WPBIC). Reading scores were reported by the
Ginn series reading levels. Mathematics scores were indicated by grade
equivalency scores which are reported in the McMillan Series M manual.
13ehavior scores Were reported according to guidelines in The Walker
Problem Behavior Identification Checklist manual. Data in Tables A
through W in Appendix B.report reading levels, math grade equivalencies
and behavior checklist scores for the mainstreamed and"non-mainstreamed
students in each of the 23 target classrooms.
23
31

Table 2 shows the means and standard deviations of the reading
levels of the second, third and fourth grade students who were mainstream-
ed in reading related subject areas (n = 19) and those of the 112 students
who had not been mainstreamed in any academic subject. Reading related
subjects included spelling, science, social studies, reading and lang-
uage arts. Since the number of students varies greatly among the six
groups, tests of significance were not carried out. However, an exam-
ination of the means reveal very little difference between the means of
the mainstreamed and non-mainstreamed second grade students. Third and
fourth grade mainstreamed students scored 1.6 and 1.9 grade levels higher
than their non-mainstreamed peers respectively. Appendix C contains a
frequency distribution of the reading level scores for mainstreamed and
non-mainstreamed students.
Table 2
Means and Standard Deviations of Reading Levels.of Students
Mainstreamed for Reading.and:Non-Mainstreamed.Peers by Grade
Grade Mainstreamed Students Non-Mainstreamed Students
Level N X S.D. N X S.D.
2 3 6.7 1.52 34 6.2 .98
3 6 9.0 .63 40 7.4 1.31
4 10 9.2 1.61 38 7.3 1.34
The data in Table 3 reports the means and standard deviations of
the math achievement scores of students mainstreamed in math (n = 28).and
non-mainstreamed students by grade level. Since the number -of students
varies greatly among the six groups, tests of significance were not

25
carried out. However, an examination of the means reveals only slight
differences between mainstreamed and non-mainstreamed students in the
area of math at all three grade levels. A frequency distribution of
the math mainstreamed and non-mainstreamed students may be found in
Appendix C.
Table 3
Means and Standard Deviations of Math Grade Equivalents of
Students Mainstreamed for Math and Non-MainstreamedPeers by Grade
Grade Mainstreamed Students Non-Mainstreamed Students
Level N X S.D. N X S.D.
2 7 2.8 .77 34 2.4 .60
3 9 3.4 .45 40 3.2 .80
4 12 4.1 .70 38 3.4 .92
Data In Table 4 indicate the means and standard deviations of
behavior checklist scores of mainstreamed and non-mainstreamed students
by sex. Since the number of students varies greatly among the four
groups, tests of significance were not carried out. However, an exam-
ination of the means reveals little difference in the levels of problem
behaviors for both mainstreamed and non-mainstreamed males and females.
Comparisons cannot be made between male scores and female scores because
different levels of problem behavior are acceptable for each sex. According
to the data available in The Walker Problem Behavior Identification Check-
list test manual, acceptable behavior checklist scores range between 0 and
12 for females while scores of 0 through 22 are acceptable for males. The
data in. Table 4 indicate that females in general scored closer to the
33

26
unacceptable level of behavior than did their male counterparts. The
range of behavioral scores for the 32 fema'kes was 0 through 62 while the
range of scores for the 120 males was from 0 to 67.
Table 4
Means and Standard Deviations of Behavior Checklist Scores
for Mainstreamed and Non-Mainstreamed Students by Sex
Mainstreamed Students Non-Mainstreamed Students
X S.D. N X S.D.
Males 33 14.2 15.82 87 16.0 10.90
Females -/ 10.6 8.14 25 13.8 13.94
Utilizing data available in The Walker Problem Behavior Iden-
tification Checklist manual, levels of adequate and inadequate behavior
were determined for 40 mainstreamed students and the 112 non-main-
streamed s....udents by sex, and are indicated by (adequate) and - (in-
adequat) scores in Appendix B. Raw scores are also available in the
tetles in Apt.c.,Aix B. Data in Table 5 indicate that 80% of the main-
streamed students had adequate behavior while 69% of the non-mainstreamed
students also had adequate behavior. Sixty-five percent of the main-
streamed students were on level in reading as compared with 52% of the
non-mainstreamed students. Additionally, 76% of the mainstreamed
students were on grade level in math as compared with 52% of their non-
mainstreamed counterparts. 4

Table 5
A Summary of Achievement and Behavior Status of Mainstreamed and
Non-Mainstreamed Learning Disabled Students
MainstreamedNon-Mainstreamed
Adequate Iriadequate
Behavior Behavior Total
N % N N
Adequate Inadequate
Behavior Behavior Total
N % N % N %
Reading
On Level
Not on Level
Total
Math
On Level
Not on Level
Total
20 (50) 6 (15) 26 (65)
12 (30) 2 (5) 14 (35)
32 (80) 8 (20) 40 (100)
27 (68) 3 (8) 30 (76)
5 (12) 5 (12) 10 (24)
32 (80) 8 (20) 40 (100)
39 (35) 19 (17) 58 (52)
38 (34) 16 (14) 54 (48)
77 (69) 35 (31) 112 (100)
43 (39) 15 (13) 58 (52)
34 (30) 20 (18) 54 (48)
77 (69) 35 (31) 112 (100)
N
3536 j)

28
In order to examine more closely students who had been main-
streamed for specific subjects, these students were compared with their
non-mainstreamed grade peers within'each of the 23 target rooms. The
raw data for Table 6 is available in Appendix B. For comparison of
achievement levels, mainstreamed students were divided into three
groups, i.e. those students mainstreamed for reading (n = 12), those
students mainstreamed for math (n = 21), and those students who were
mainstreamed for both reading related subjects and math (n = 7). Of
the 40 mainstreamea students, six students did not have grade-mates
available in their classrooms for comparison. Of these six students,
three had been mainstreamed in reading, one in math, and two in both
math and reading related subjects. Therefore, only 34 of the main-
streamed students were used for the comparisons summarized in Table 6.
In comparing the 20 mainstreamed students who were mainstreamed
for math with their 64 non-mainstreamed classmates, data indicate that
A 20 of the,non-mainstreamed classmates had higher math grade equivalents
than their mainstreamed counterparts while 17 students had the same
grade equivalents, and 37 students had lower math scores than those who
had been mainstreamed for math.
The nine students mainstreamed in reading related subjects were
compared with their 27 non-mainstreamed grade peers. Two of the students
who were not mainstreamed for reading related subjects were higher than
their mainstreamed peers, seven had the same reading level, and 18 had
a lower reading level than students mainstreamed for reading related
subjects. Student, who had been mainstreamed for both math and reading
related subjects ,cored higher than nine and ten of their 12 non-
mainstreamed peers in math and reading,respectively.

29
Mainstreamed students were also compared with non-mainstreamed
grade apprfJpriate Jeers in the area of behavior. The thirty-four main-
streamed students were compared with 101 non-mainstreamed students. Data
indicate that 49 of the non-mainstreamed students had more problem be-
haviors than their mainstreamed classmates, 4 had the same behavioral
checklist score and 48 had fewer behavior problems.
Table 6
Summary of Comparison of Mainstreamed and Non-Mainstreamed Grade-
Appropriate Students in the Areas of Math, Reading, and
Behavior Within Individual Classrooms
Mainstreamed Subject
ScoreCompared
Math
ReadingRelated
Both Math andReading Related
All
Mainstreamed
Math Reading Math Reading Behavior Checklist*.
Number of Main- -streamed Students 20 9 5 5 34
Number of Non-MainstreamedComparison Peers 64 27 12 12 101
Number of Non-
MainstreamedClassmates HigherThan MainstreamedStudents 20 2 3 49
Number of Non-
MainstreamedClassmates theSame as Main-;treamed Students 17 7 0 2 4
Number of Non-
MainstreamedClassmates LowerThan MainstreamedStudents 27 18 9 10 48
*Higher behavior checklist score indicates more problem behaviors

30
Summary of Phase I
In general the results of achievement data indicate little differ-
ences between the reading scores of mainstreamed and non-mainstreamed
second grade students. However, these differences increase markedly as
`the grade level increases. A further comparison of achievement scores
indicate very little difference between grade equivalents in math of both
mainstreamed and non-mainstreamed students regardless of grade level. An
examination of the behavioral checklist scores of the 32 females and 120
males reveals that females in general scored closer to the unacceptable.
level of behavior than did male 'students. However, there was little
difference between the behavioral checklist scores of mainstreamed and
non-mainstreamed students regardless of sex.
Results also indicate thaCover two-thirds of the mainstreamed
students were on grade level in reading. Additionally, over one-half of
the non-mainstreamed subjects were also on level in the area of reading.
Over three-fourths of the mainstreamed students were on grade level in math
as compared with slightly over one-half of the non-mainstreamedistudents.
A further comparison of mainstreamed students with their non-
Imainstreamed age mates within each of the 23 target classrooms reveals.
that 37 of the 64 non-mainstreamed students were the same or higher than
the mainstreamed students in the area of math while only 9 of the 27 non-
mainstreamed students scored the same or higher than their non-mainstreamed
peers in reading. In comparing scores on the behavior checklist, data in-
dicate that there were almost as many non-mainstreamed students who had
fewer problem behaviors than mainstreamed students as there,wer'e non-
mainstreamed students who had a greater number of problem behavior than
mainstreamed students.
39

B. Phase II Analysis
The second phase of this study consisted of an examination of
the mainstream decision making processes through the use of a structured
interview. This interview was administered to those school personnel
who were responsible for making mainstreaming decisions which involved
the students in the sample. The 20 principals and 23 special education
teachers, in schools in which academic mainstrPaming had occurred during
the previous year, were interviewed individually.
The completed interview forms were coded with a school number, and
either a principal number or a teacher number. The responses on the in-
terviews were separated into teacher and principal responses. Data ob-
tained from the interviews were sorted into categories of similar responses
This phase specifically addressed research question number two,
"What factors allow some students to be mainstreamed while others are not?"
The interview began with a question designed to determine the
participants' pe'rception of the definition of mainstreaming. In general,
both principals and teachers defined mainstreaming as "educating handi-
capped students with their non-handicapped peers in the regular class-
,
room.".
The remainder of the interview was divided into two parts. The
first group of nine questions referred to a specific set of mainstreamed
students (n = 40), and a randomly selected set of non-mainstreamed class-
room peers (n = 40). These questions were concerned with the process by
which'specTfic mainstream decisions were made. Data in tables seven throui
fourteeri indicate the percent of cases reporte.:d by principals and teachers
in response to this group of questions. When asked to state who initiated
the mainstreaming process for aparticular mainstreamed student from his/h
'4 0


32
school or classroom, principals indicated that the special education
teacher was the initiator in 85'4 of the cases while teachers indicated
the same response in 75% of the cases (Table 7).
Table 7
Initiator of the Mainstreaming Process as Perceived
by Principals and Teachers
Principals Teachers
Special Education Teacher 85.0 75.0
Parent/Parents 5.0 5.0
Principal 2.5 5.0
Mainstream Teacher 5.0 0.0
Psychologist 0.0 2.5
Mainstreaming had been determinedin the previous year
2.5 12.5
Both principals and teachers responded that mainstreaming was
usually initiated within the first month of the school year (Table 8).
However, in almost one quarter of the cases, principals did not know
when .the actual' mainstreaming process had been initiated.

Table 8
Principal and Teacher Perceptions of When the MainstreamingProcess was Initiated
Cases Reportedby Principals
Cases Reportedby Teachers
Beginning of school year- -within the first month
35.0 62.5
End of the first semester 22.5 20.0
End of year--during last month 0.0 2.5
Had been determined during theprevious year
20.0 15.0
Don't know 22.5 0.0
Both principals and teachers indicated that in the majority of
the forty cases, once the mainstreaming process was initiated, placement
in the regular classroom actually occurred in a period of one or two
days or within two weeks (1-ble 9)
Table 9
Principal and Teacher Perceptions of the Length of
the Mainstreaming Decision Making Process
Cases Reportedby Principals
Cases Reportedby Teachers
Within one or'two days 3.5.0 47.5
Within one Or two weeks 45.0 32.5
A month or longer4 e .
12.5 12.5
Don't know 7.5 7.5
42

When asked who else was involved in each of the mainstreaming
processes, both principals and teachers named the mainstream teacher
as an active participant in one-half of the cases (Table 10).
Table 10
Principal and Teacher Perceptions of Additional Personnel
Involved in the Mainstreaming Process
Cases Reportedby Principals
Cases Reportedby Teachers
None 17.0 17.0
Mainstream Teacher 50.0 50.0
The Multidisciplinary Team 15.0 15.0
Special Education Supervisor 8.0. 8.0
Parents 5:0 5.0
Other auxiliary personnel 5.0 5.0
As noted in Table 11, both teachers .and principals agreed that\mainstream placement in the regular classroom was viewed as, a temporary
arrangement in almost two-thirds of the forty cases.
Table 11 .
Principal and Teacher Perception of the Longevity of
Mainstreaming Placements
`Cases Reported Cases Reported
by Principals by Teachers
/67
Permanent 37.5 37.5
Temporary 62.5 62.5
4

35
As shown in Table 12, when asked to describe the mainstreaming
process that is supposed to be followed, principals indicated satis-
faction with the current mainstreaming process. In marked contrast to
the principals' responses, special education teachers indicated that a
multidisciplinary team approach should be used.
Table 12
Principal and Teacher Perception of Appropriate
Mainstreaming Process
Cases Reported Cases Reported
by Principals by Teachers
A multidisciplinary teamshould be used
Current process should be used
15.0 78.3
85.0 21.7
When asked why the forty students'fn the sample were mainstreamed,
principals reported that theacquisition-of\good academic skills was a
reason for mainstreaming in 100 percentof the casesexamined, Teachers
indicated a need for good academic skills in ninety percent of these
'same cases. APpropriate behavior and adequate social skills were re-
ported by the principal in ninety-five percent of the cases as an
additional reason for mainstreaming. In 98% of the cases,, teachers also
indicated appropriate behavior as justified for mainstreaming. In 37%
of the cases both.princ:ipals and teachers indicated parental desires
as another reason for implementing mainstreaming (Table 13).

36
Table 13
Reasons for Mainstreaming Students As Reported
by Principals and Teachers
Cases Reported Cases Reportedby Principals by Teachers
Good academic skills 40 (100) 36 (90)
Appropriate behavior andsocial skills
38 (95) 39 (98)
Parental desires 15 (37) 15 (37)
Administrative expediency
Table 14
ReaSons for Not.Mainstreaming Students As Reported
by Principals and Teachers
Cases Reportedby Principals
Cases Reportedby Teachers
IJ
Poor academic skills 36 (90) 39 (97)
Inappropriate behavior andsocial skills
6 (15) 4 (10)
Parents did not want their
child mainstreamed
4 (10) 4 (10)
As is indicated in Table 14, in the majority of cases reported
both principals and teachers indicated that poor-academic skills were
the major reasons for not mainstreaming students.
45

37
The second set of questions on the teacher and principal inter-
view examined their general perceptions of the mainstreaming process as
it operated in each of the twenty schools. When the 20 principals and
23 learning disabilities teachers were asked what started them thinking
about mainstreaming a student (Table 15), teachers focused on the student's
performing on or above grade level. Although thirty percent of the prin-
cipals agreed with the teachers' response, thirty-five percent also felt
that initiating mainstreaming procedures was not,their responsibility.
Table 15
Principal and Teacher Perceptions of Criteria Necessary
for Referral Initiation
'Principal(N = 20)
Teacher(N = 23)
When a child is performingat or above grade level
30.0 73.9
When a child's behavioris appropriate
0.0 8.7
When there is a combinationof both appropriate behaviorand good academic skills
25.0 8.7
Need to comply with the law 10.0 8.7
It is not my responsibility, 35.0 0.0
According to the data in Table 16, both principals and special
education teachers agreed that the special education teacher is the
person who usually initiates the mainstreaming referral process.

38
Table 16
Principal and Teacher Perceptions of Who Usually
Initiates the Mainstream Referral
Principal Teacher(N = 20) (N = 23)
The special educationteacher
100.0% 100.0%
Both groups of participants stated that parents would also be
likely to initiate a mainstreaming request. However, in almost one7
third of the responses, it was indicated that no one in addition to
the special education teacher was likely to initiate a referral. The
results also indicated only a minor role for the psychologist in the
initiation phase (Table 17).
Table 17
Principal,and Teacher Perception of Additional Personnel Involved
in the Initiation of a Referral
Principal(N = 20)
Teacher(N =_23)
Special Education Supervisor 5.0 8.8
Parent/Parents 45.0 39.2
Psychologist 15.0 4.3
Mainstream Teacher 0.0 8.7
Educational Aide 0.0 4.3
Principal 0.0 4.3
No one else 35.0 30.4
47

Each group was asked to describe their perceived role in, the
mainstreaming process. As indicated in Table 18, principals saw them-
selves as catalysts, initiators, and arbitr ors; while the majority
of teachers perceived themselves not only as initiators and catalysts,
but also as resource persons to the mainstream classroom.
Table 18
Principal and Teacher Perceptions of His/Her Role
in the Mainstreaming Process
Principal Teacher
(N = 20) (N = 23)
I act as a catalyst to insure 45.0 34.8
proper placement,
I act as the initiator in the 20.0. 43.4
referral process
I act as an arbitrator in the 20.0 0.0
referral process
I assure compliance with the 5.0 4.3
law
I act as a resource,to the 0.0 17.5
mainstream
I do not have an active role 10.0 0.0
in the referral process.
Eighty percent of the principals interviewed considered them-
selves to, be the person responsible for making the final decision
regarding mainstreaming, while 21.7% of the teachers shared this view.
Another 21.7Z felt the special education teacher made the final decision
and 43.5% felt that this was the responsibility of the multidisciplinary
team (Table 19).
48

40 .
Table 19
Principal and Teacher Perceptions of Who is Responsible
for the Final Decision in the Mainstreaming Process
Principal(N = 20)
Teacher(N = 23)
Principal 80.0 21.7
Special Education Teacher 10.0 21.7
Multidisciplinary Team 0.0 43.5
Parents 10.0 4.4'
Special Education Supervisor. 0.0 8.7
The data in Table 20 indicate that both groups perceived that
the mainstream teacher has an active role only after the mainstreaming
decision has been made and this role is supportive in nature.
Table .20
Principal and Teacher Perceptions of the Role of the
Mainstream Teacher in the Mainstreaming Process
Principal Teacher.
(N = 20) (N = 23)eh
Active role duringdecision-making process
Inactive role duringdecision-making process
Active role only after the
fact--supportive in nature
5.0 4.0
10.0 13.0
85.0' 83.0

41
Additionally, both teachers and principals agreed that parents
do not play an active role during the mainstreaming process, but that
they become active only after the process is completed (Table 21').
Table 21
Principal and Teacher Perceptions of the Parent's Role
in the Mainstreaming Process
Principal Teacher(N = 20) (N = 23)
Inactive role duringmainstreaming process
Active role during main-streaming process
Active role only afterthe fact
40.0 61.0
20.0 4.0
40.0 35.0
When asked what other personnel are involved in mainstreaming
a student, 90% of principals and 74% of teachers indicated that no
other personnel were involved (Table 22).
Table 22
Principal aid Teacher Perceptions of Additional PersonnelInvolved in the Mainstreaming Process
Principal(N ='20)
Teacher.(N = 23)
%
No one else 90.0 74.0
Supervisor 10.0 8.7
Mainstream Teacher 0.0 13.0
Psychologist 0.0 4'r
3
50

42
Those principals'and teachers who acknowledged the use of
additional personnel indicated that these personnel were used as resource
persons or as supporters to the student ;'fable 23).
Table
Principal and Teacher Perceptions of the Roleof Additicmial Personnel
Principal(N = 20)
Teacher(N = 23)
No one else is involved 90.0 74.0
Acts as a resource tothe mainstream teacher
10.0 13.0
Acts in a supportive roleto student
0.0 13.0
The majority of both teachers and principals stated there is
no formal process in their school for deciding the appropriate academic
or behavioral levels for students who are being considered for main-
streaming in the regular classroom (Table 24).
Table 24
Assessment Processes Used in Their Schools as Reported
by Principals and Teachers
Principal(N = 20)
Teacher(N = 23)
No formal assessment is presentin our school
85.04
70.0
A formal assessment is presentin the school
10.0 30.0
Don't know 5.0 0.0
51

43
Summary of Phase II
The results of the interviews conducted in Phase II of this
study indicate that principals and special education teachers are seen
as the only consistently active participants in the decision making
process. Although the mainstream teacher was reported to have a major
role in some cases involving specific students, he/she was not perceived
to have a significant role in the mainstreaming process in general.
Additionally, teachers and principals reported that parents could also
be likely participants, but,when asked to describe the role of the
parents in some specific cases, both teachers and principals indicated
that parents had only a minor role in mainstream decision making.
When given the opportunity to describe the mainstreaming process
as it is supposed to be "if there were no constraints," principals re-
ported that the process currently being used in their school was the
best method, while the majority.of teachers reported that mainstreaming
decisions should be determined through a different, process utilizing a
multi-disciplinary approach. In fact, in an examination of.the spec-
ific cases, the multi-disciplinary team was reported to have been
utilized in only fifteen percent of the target cases. Most teachers
indicated that the multi-disciplinary team has the final word in the
decision making process, while principals saw themselves as the final
decision maker":-N
In most cases, teachers and principals reported that the acquis-
ition of good academic skills was the major justification for making a
mainstreaming referral. Good behavior and appropriate social skills
were additional reasons. Both groups also indicated that poor academic
52

-\
skills were the major reasons for not mainstreaming a student, but
neither group indicated that inappropriate behavior was necessarily
a major detriment to being mainstreamed. Finally, both principals
and teachers stated that the7 is no formal assessment process used
in their schools to aid in determining mainstreaming decisions.
44.
VI. DISCUSSION, IMPLICATIONS AND SUMMARY
A. Discussion of the Results
The present study was an investigat;on of mainstreazemg practices
and decision making processes used by elementary school personnel in the
Pittsburgh Public.Schoors: The first phase of this study examined the
academic and behavioral differences between mainstreamed and non-main-
streamed'students in elementary. classrooms for the learning disabled.
The second phase included an examination of mainstream decision making'
processes through the use of a structured interview. This interview was
administered to school personnel who were responsible for making main-
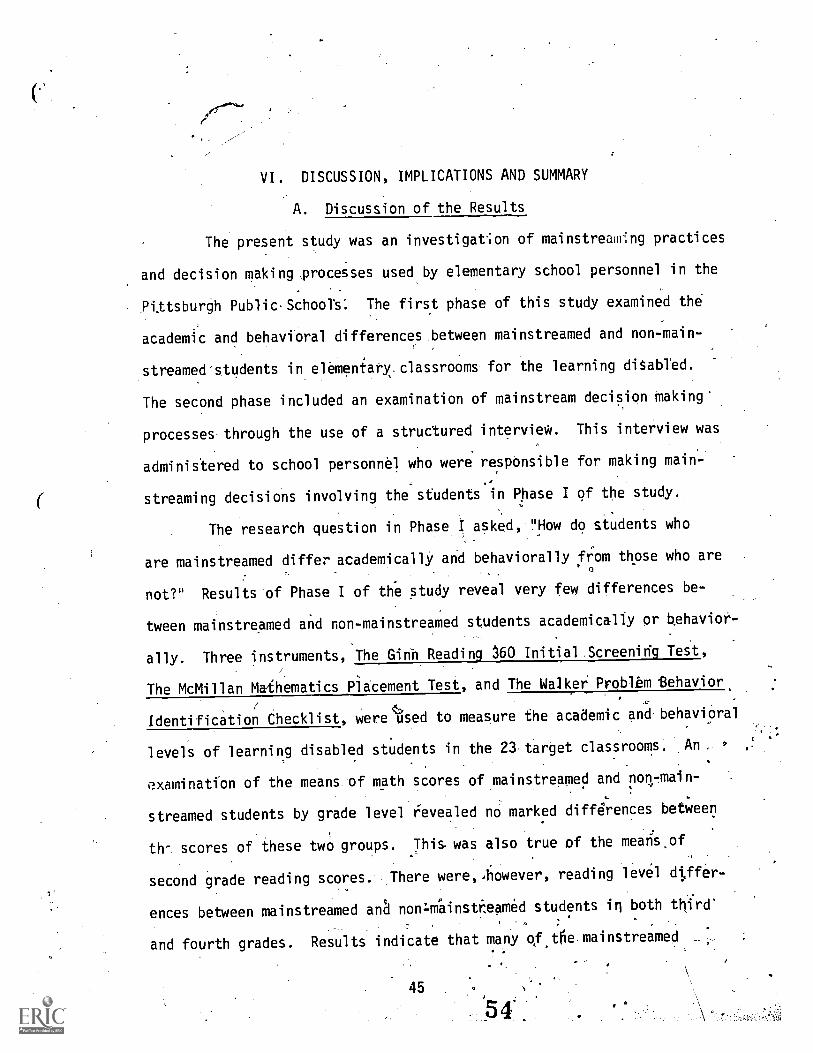
_
streaming decisions involving the students in Phase I of the study.
The research question in Phase I asked, "How do students who
are mainstreamed differ academically and behaviorally fi.om those who are
not?" Results of Phase I of the study reveal very few differences be-
tween mainstreamed and non-mainstreamed students academically or Oehavior-
ally. Three instruments, The Ginn Reading 360 Initial. Screening Test,
The McMillan Mathematics Placement Test, and The Walker Problbm Behavior
Identification Checklist, were%sed to measure the academic and behavioral
levels of learning disabled students in the 23 target classrooms. An..
examination of the means of math scores of mainstreamed and non- main
streamed students by grade level revealed no marked differences between
th- scores of these two groups. This was also true of the mearis.of
second grade reading scores. There were,-however, reading level dtffer-
ences between mainstreamed and non=rdainstizeamed students in both third'
and fourth grades. Results indicate that many of.tlie mainstreamed
45
54


46
students were on level in math and reading but this was also true of
their non-mainstreamed colleagues.
When asked in the interview in Phase II what characteristics a
student should possess to be considered for mainstreaming, teachers and
principals indicated a student should have good academic skills. The
mainstreamed students' achievement test scores generally support this
statement. On the other hand, teachers and principals reported that
students were not mainstreamed because they lacked good academic skills.
However, it was found that a little over one-half of non-mainstreamed
students scored on or above grade level in either math or reading.
Teachers and principals also indicated that the acquisition of
appropriate behavior and social skills was a prerequisite for mainstream-
ing consideration. One-fifth of the mainstreamed students had behavior
that placed them in the inadequate behavior range while over one-third
of the non-mainstreamed students were on level in math or reading and
had appropriate behavior levels. Thus, there were a large number of non-
mainstreamed students who had those behavioral attributes reported to be
needed for mainstreaming but who were not mainstreamed into the regular
classroom.
It should be considered that this discrepancy between what is
stated by teachers and principals as necessary criteria for mainstreaming
and the actual achievement and behavioral levels of mainstreamed and non-
mainstreamed students in the target schools could be due to several factors.
It may be that instruments used to gather academic data did not accurately
reflect the differencesebetween mainstreamed and non-mainstreamed students.
Additionally, the behavior checklist may not have identified those target

47
behaviors that teachers believe are deterents to mainstreaming success.
However, the WPBIC had been developed by regular elementary teachers and
was designed to identify those behaviors that are unacceptable in main-
stream classrooms. When interviewed, teachers and principals had in-
dicated that certain academic and behavioral characteristics should be
present before mainstreaming is considered. It may also be that the
format of the interview instrument did not allow participants an oppor-
tunity to expand on those student characteristics used in making main-
streaming decisions.
It is also possible that teachers and principals may be unaware
of or are unable to verbalize certain subtle tacademic or behavioral
characteristics which may lead them to make or not make mainstreaming
decisions. For example, teachers may respond negatively to an individ-
ual child on the basis of appearance without recognizing the importance
of that factor in the decision making process. On the other hand, teachers
may develop positive feelings about a child based on personality or other
factors and mainstreaming decisions may be inadvertently influenced by
such feelings. In addition, achievement test scores and personal inter-
view data cannot_ accurately reflect the classroom climate. Nor can
these scores reveal the subtle interactions between fell students.
Mainstreamed students were compared within individual classy oms with
their non- mainstreamed peers (Table. 6). However, these scores do\tiot
reveal the interpersonal dynamics of student relationships within target
clasooms, nor do they identify the manner in which these relationships \\
may exert subtle influences over sctiool perSbnnel in making mainstreaming
decisions.. /
56

48
The second phase of this study addressed the research question,
"What are the factors that allow some students to be mainstreamed while
others are not?" The purpose of the interview was to examine the main-
stream decision making processes used by the 20 principals and 23 teachers
in the target schools. When asked why certain decisions were made about
40 mainstreamed. and 40 non-mainstreamed students, teachers and principal
indicated that these decisions were made based on academic and behavioral
strengths and weaknesses. However, as indicated in the previous dis-
cussion, data in this study revealed that achievement scores do not
always support this perception.
The remaining questions in the interview in Phase II examined the
decision making processes in each of the target schools. Public Law 94-
142 requires school personnel to come together as a multidisciplinary or
planning team. These teams may include regular and special education
teachers, administrators and supervisors, and/or support personnel (Bickel,
1980; Braun, 1977; Fenton, Yoshida, Maxwell, & Kaufman, 1979; Palmer,
1980; Rucker & Vautour, 1981). Yos ida et al. (1978) in assessing the
roles, relationships, and participatit7levels of educational planning
team members indicated a higher participation level for administrators
and support personnel than for regular and\special education teachers.
In the interviews in this study special educatipp teachers and principals
were also asked to define roles and participation levels of personnel in
their schools.
As contrasted with previous research, the findings of 'this study
indicate a high participation level for special education teachers and a
low participation level for support personnel (psychologists, social
workers). However, data obtained from the interviews in this study,
57

indicate an agreement with previous research which indicates a high
participation level for administrators and a low participation level
for regular educators. In specific cases, teachers and principals
indicated that regular education teachers were active participants in
fifty percent of the cases, but when asked to define the level of par-
ticipation of regular education teachers in general, principals and
teachers indicated that mainstream teachers have an active role only
after the process is completed and mainstreaming decisions have been
made. The latter finding is particularly important given that the role
of regular educators is critical to the development and implementation
of mainstream educational programming for the handicapped students
(Yoshida et al., 1978). The failure of the regular educator to par-
ticipate in mainstream decision making may make it more difficult for
special education teachers to become familiar with the curriculum and
teaching techniques used in the mainstream classroom. In some cases
the special education teacher may be reluctant to send learning dis-
abled students to a mainstream classroom because of a fear that the
mainstream teacher may not be adequately prepared to meet the special
needs of these students. Therefore, the lack of participation of the
regular educator may affect the outcome of the decision making process
as well as make the implementation of those decisions more difficult.
An additional mandate of Public Law 94-142 is that of parental
involvement.. When asked what role parents play in determining main-
streaming decisions, principals and teachers indicated that parents
seem to have a low participation level as initiators, participants,
and decision makers in general. However, when asked to describe what
58

50.
additional personnel may become involved in the initiation of a referral,
almost half of the principals and teachers saw parents as possible
initiators.
Bickel (1980) and Yoshida et al. (1978) reported that until
recently educational programming for special children has been made by
a single individual or "gatekeeper." This "gatekeeper" was usually the
school psychologist. When asked to identify personnel who might act as
initiators or participants in the educational planning for the specific
subjects in this study, principals and teachers indicated that a minimal
role was played by the school psychologist.
These results are in contrast with previous research which
dicated a high participation level for support personnel (Yoshida et al.,
1978). The findings of this study suggest that there may have been a
shift in levels of responsibility the process of educational planning
for exceptional children. Principals and teachers also saw themselves
as the most consistently active persons throughout the decision making
process, however, teachers indicated that these planning decisions
should be made through a multidisciplinary team effort.. Principals,
in general, reported that they were content with the way the process
was currently being handled in each of their schools.
Public 94-142 mandated t:le use of multidisciplinary teams in
the initiation and planninrj for all exceptional children. Although
these teams appear to be active when a child is placed into a ::-facAll
program, it also a-ppears that mainstreaming decisions are m.,R in general
without the benefit of team decision making. It appears that. if a child
needs the benefit of a multidisciplinary team to be placed into a special

bl
education classroom, it also makes good sense that a team decision should
be employed to take thc, child out of special education classrooms. Thus,
responses of the participants in this study seem to indicate some con-\
fusion about the. participation levels of school personnel when statements
concerning specific decisions are compared with responses about the decis-
ion making process in general. It may be that this apparent confusion re-
garding the role of supportive school personnel is due to a misunderstand-
ing of the mandates of the law. Public Law 94-142 does indicate that a
local agency representative, the child's teacher, one or both of the
parents, and other persons at the discretion of the parents Or
agency personnel must be involved "when there is a change in the child's
educational program or related services." PerhapS school personnel do
not view a recommendation for mainstreaming as a significant change in
/
educational programming. Additionally, the use of multidisciplinary teams
'al the field of education is a relatively new concept. It may be that
school personnel are unfamiliar with teaming tecimiques and therefore may
inadvertently discourage team interactions.
B. Implications for Future Research
The findings of this study sugg6st that additional research should
be. conducted concerning the mainstream decision making processes currently
in pse throughout the country.. There appears to be confusion regarding
what is said to happen, what the stated basis is for making mainstreaming
decisions, and what really occurs in the schools. From the findings of
this study and the results of previous research it is suggested that the
following areas .should be examined:
1. A further examination of the characteristics of mainstreamed
and non-mainstreamed students should be made in order to identify.attri-
butes important to the mainstream decision making process. Such research.
6o

52
should include follow-up studies to determine the outcome of the decision
making process and should involve students from other disabilities in
addition to learning disabled students.
2. Additional study of roles and participation levels is also
indicated. Such a study should be extended to include other school per-
sonnel and parents.
3. It may also be that the role of the multidisciplinary team
in the schools should be studied. Specifically, it should be examined
whether teams should be used to make programming decisions and_if so,
how these teams can be used in a more effective fashion.
4. If the present study were to be replicated the use of
alternate achievement and behavioral test measures would be recommended.
Additionally, the interview instrument could be modified to include
additional school personnel. The format could also be changed to an
open-ended design. This change may afford school personnel an opportunity
to express ideas and feelings in a freer fashion.
5. In view of the variability within and between schools, future
research must look more closely at factors within individual schools and
classrooms. Factors that might affect mainstreaming within a school are
the number of regular classrooms available for placement of learning
disabled students, the support services available to the mainstream
reacher, the number of identified special education students in that
school and the amount of previous inservice training in mainstreaming
provided to school personnel.
61

53
C. Summary
The purpose of this investigation was to study the Mainstreaming
practices and decision making processes used by elementary school per-
sonnel in an urban school system and to determine whether learning dis-
abled students who were assigned to academic classes in the mainstream
differed in certain academic and behavioral characteristics from learning
disabled students who were not mainstreamed. Participating in the study
were 23 learning disabilities teachers, 20 elementary school principals,
40 mainstreamed learning disabled students, and 112 non-mainstreamed
learning disabled students.
This study was conducted in two phases. The first phase incor-
porated the selection and assessment of a sample of mainstreamed and non-
mainstreamed learning disabled students in selected target schools. The
second phase consisted of an examination of mainstreaming decision making
processes through the use of a structured interview. This interview was
administered to school personnel in taxget schools who were responsible
for making mainstreaming decisions which involved students in the sample.
Three instruments were used to assess academic and behavioral
characteristics of students in the sample: The Ginn,Reading 360 Initial
Screening Test; The McMillan Mathematics Placement Test; and The Walker
Problem Behavior Identification Checklist. Math and reading scores of
mainstreamed students were compared with those-6f the total student group
and with those'of non-mainstreamed peers in each of the target classrooms.
Results of these analyses revealed very little difference between main-
streamed and non-mainstreamed learning disabled student\
in the subject
areas of math and reading. Results of these behavior ch\ecklist data re-,
vealed no marked behavioral differences between mainstreamed and non-
mainstreamed males or females.
62

54
Responses of principals and teachers in the second phase of the
study indicated that decisions to mainstream are basedon academic and
behavioral characteristics, but the data in Phase I did not seem to
clearly support these perceptions.
The results of the principal and teacher interviews also indicate
some confusion about roles and levels of participation for support per-
sonnel, parents, and regular educators in the decision making process.
Implications for future research are discussed.
63

REFERENCES
64

56
References
Adamson, G., & Van Etten, G. Zero reject model revisited: A workable
alternative. Exceptional Children, 1972, 38, 735-738.
Baldwin, W. K. The social position of the educable mentally retarded
child in the regular grades in the public schools. Exceptional
Children, 1958, 25, 106-108.
Ballard, J., & Zettel, J. Public Law 94-142 and Section 504 and what
they say about rights and protection. Exceptional Children, 1977,
44, 177-184.
Beery, K. Models for mainstreaming. San Rafael, Calif.: Dimensions
Publishing Company, 1972.
Bickel, W. D. The placement process in special education with special
reference to issues of minority overrepresentation, in press.
National Academic of Sciences, Washington, D.C., 1981.
Braun, C. S. How to select the least restrictive, but most appropriate,
educational program for handicapped children, April, 1977. Paper
presented at the Annual International Convention, The Council for
Exceptional. Children (55th, Atlanta, Georgia, April 11-15, 1977).
Carrol, A. The effects of segregated and partially integrated school
programs on self-concept and academic achievement of educable men-
tally retardates. Exceptional Children, 1970, 34, 93-99.
Chaffin, J. D. Will the real mainstreaming program please stand up?
Focus on Exceptional Children, 1974, 6.
Chiba, C., & Semmel, M. Due process and leaSt restrictive alternative:
New emphasis on parental participation. View oints, 1975, 53(2),
17-29.
65

Closer Look, Editorial statement on "the least restrictive alternative
setting." Parents' Campaign for Handicapped Children and Youth,
Washington, D.C., December, 1978, p. 5.
Connor, C., & Connor, J. Deaf children in the regular classroom.
Exceptional Children, 1960, 26, 483-486.
Crowell, A. R., Jr. Influence and regular education involvement on
child study teams. In J. A. C. Vautour and C. N. Rucker (Eds.),
Child study team training program book of readings. Austin, Texas:
Special Education Associates, 1977.
Cruickshank, W. M. Least restrictive placement: Administrative wishful
thinking. Journal of Learning Disabilities,' April, 1977, 10(4),
193-194.
Fenton, K. S., Yoshida, R. K., Maxwell, J. P., & Kaufman, M. J. Recog-
nition of team goals: An essential step toward rational decision
making. Exceptional Children, May, 1979, 638-644.
Friend, M. Assessing the impact of mainstreaming. Bloomington, Ind.:
Indiana University, C.A.S.E. Information Dissemination Packet,
1980-1981, p. 8.
Gilliam, J. E. Contributions and status -ankings of educational planning
committee participants. Exceptional Children, March, 1979, 466-468.
Goodman, H., Gottlieb, J.,1 &-Harrison, R. H. Social acceptance of EMRs
integrated into a nongraded elementary school. American Journal of
Mental Deficiency, 1972, 76, 412-417.
Gottlieb, J. Attitudes of Norwegian and American children toward mildly
retarded children in special ,classes. Journal of Special Education,
1974, 8, 313-319.
66

58
Haring, N. G., & Krug, D. Placement in regular programs: Procedures
and results. Exceptional Children, 1975,'41, 413-417.
Johnson, G. 0. Social position of mentally handicapped children in
regular grades.. American Journal of Mental Deficiency, 1950, 55,
60-89.
Kaufman, M., Agard, J., & Semmel, M. (EdS.) Mainstreaming: Learners
and their environments. In M. I. Semmel, Alternative for teaching
exceptional children. Denver, Co.: Love Publishing Company, 1979.
Kaufman, M., Gottlieb, J., Agard, J., & Kukic, M. Mainstreaming toward
an explication of the construct. In E. Meyer, G. Vergason, & R.
Whelan (Eds.), Alternative for teaching exceptional children.
Denver, Co.: Love Publishing Company, 1975.
Kerlinger, F. N. Foundations of behavioral research. New York: Holt,
Rinehart and Winston, 1973.
Leinhardt, G., Zigmond, N., & Cooley, W. Reading instruction and its
effects. .AERJ, 1981, 18(3).
Lilly, M. S. Special education: A teapot in a tempest. Exceptional
Children, 1970, 37, 43-48.
MacMillan, D.,. & Semmel, M. I. .Evaluation of mainstreaming programs.
Focus on Exceptional Children, 1977, 9, 1714.
Meyers, C., MacMillan, D., & Yoshida, R. Correlates of success in trans-
ition of MRs to regular class. (Final Report, Grant OEG 0-73-5263).
Pomona, Calif.: PsychiatriC Institute, Pacific State Hospital Re-
search Group, 1975.
Palmer, D. J. Factors to be considered in placing handicapped children
in regular classes. Journal of School Psychology, 1980, 18(2),
163-170.

59,
Payne, R., & Murray, C. Principal's attitude toward integration of the
handicapped. Exceptional Children, 1974, 41, 123-125. .
Rucker, C. N., & Vautour, J. A. C. Efficacy of child study teams.
Teacher Education and Special Education, Winter, 1981, 4(1), 5-12.
Semmel, M. I., Gottlieb, J., & Robinson, M. M. Mainstreaming: Perspec-
tives on educating handicapped children in the public schools. In
D. C. Berlinger (Ed.), Review of research in education, 7.
Washington, D.C.: American Educational Research Association, 1979.
Shellhaas, M. D. Sociometric status of institutionalized retarded
community children. American Journal of Mental Deficiency, 1969(a),
73, 804-808.
Shotel, J. 11:, Iano, R. P., & McGettigan, J. R. Teacher attitudes assoc-
iated with integration of handicapped children. Exceptional Children,
1972, 38, 677-683.
Siders, J. A. A comparison of discrepancy values: Classroom placement
consideration for exceptional education. Unpublished doctoral disser-
tation, University of Florida, 1979.
Turnbull, H. R. Legal implications. In A. J. Pappanikou (Ed.),
Mainstreaming emotionally disturbed children. Syracuse, N.Y.:
Syracuse University Press, 1977.
Vacc, N. A. A study of emotionally disturbed children in regular
and special classes. Exceptional Children, 1968, 39, 15-22.


00
Vautour, J. A. C. The efficacy of child study teams. In J. A. C.
Vautour and C. N. Rucker (Eds.), Child study team training program
book of readings. Austin, Texas: Special Education Associates, 1977.
Walker, H. Walker problem behavior identification checklist. Los
Angeles, Calif.: Western Psychological Services,'1976.
Wilkes, H. H., Bireley, M. K., & Schultz, J. J. Criteria for 'mainstream-
ing the learning disabled child into the regular classroom. Excep-
tional Children, 1975, 41, 391-396.
Yoshida, R. K.,.Fenton, K. S., Maxwell, J. P., & Kaufman, M. J. Ripple
effect: Communication of planning team decisions to program implq-
menters. Journal of School Psychology, 1976; 16(2), 177-183.
Yoshida, R. K., Fenton, K. S., Maxwell, J. P., & Kaufman, M. J. Group
decision making in the planning team process: Myth or reality?
Journal of School Psychology, 1978, 16(3), 237-243.

' APPENDICES
70

APPENDIX A
INTERVIEW INSTRUMENT
71

1.0 In the long history of special education, mainstreaming has only
recently become an important issue. But mainstreaming nunsdifferent things to different people. I am trying to determine
how mainstreaming is interpreted by personnel in the Pittsburgh
Public Schools.
i.1 How do you define mainstreaming?
2.0 Another interest is to understand how mainstreaming is accomplished
in our schools. I would like you to describe the mainstreaming
process by telling me about one of your students who has been
mainstreamed.
2.1.a. has been
mainstreamed for . Please
describe how this was accomplished.
2.1.1 Who initiated this process?
72

54
2.1.2 When was this process initiated?
2.1.3 How long did this process take?
2.1.4 Who else was involved?
2..5 Is. this viewed as a temporary or a permanent
arrangement?
73

65
2.2 Now I would like you to think of a hypothetical student who
is to be mainstreamed since we know sometimes the process
is different in theory than it is in practice. I would
like you to describe the Process that is supposed to be
followed if all resources were available and there were
no constraints.
2.3 has not been.main-.
streamed for academic subjects.' Was she/he referred for
mainstream? If not, could you tell me why..
Wasqlot thought to be ready for mainstreaming?
3.0 You have mentioned that students were mainstreamed ar not mainstreamed
because:
Mainstreamed Not Mainstreamed
good academic skills poor academic skills
appropriate behavioral inappropriate behavioral
and social skills and social skills
parental desires parent did not want
administrative administrative ruling
expediency
other other
Is that right?
74

3.1 What starts you thinking about mainstreaming a student?
3.2 What characteristics must a student possess for you to
consider a mainstream referral? Let's divide these
characteristics into two sections: academic and
behavioral.
3.2.1 What academic characteristics?
3.2.2 What behavioral characteristics?
4.0 The mainstreaming process involves many people performing many
different roles. Some of the people who have already been
mentioned are:
Special education teacher
Principal
75
66

Psychologist
Parent(s)
Other
Is that correct?
4.1 who usually initiates the mainstream referral process?
4.1.1 Is there anyone else 14' might initiate this
process,?
4.2 What is your role in this mainstreaming process?
76
vi

68
4.3 Who is responsible for making the final decision as to
whether a student is mainstreamed?
4.4 What is the role of the mainstream teacher in themainstreaming process?
4.5 What part do parents play?
4.6 What other personnel are involved in mainstreaming a
student? (e.g. principal, school psychologist)

69
4.6.1 What is his/her role?
5.0 To be used if answers have not revealed this information.
5.1 Do you haye a formal process for deciding what are
appropriate academic and/or behavioral levels; forexample, checklists or formal or informal testing?
5.1.1 Describe.

C.Co
APPENDIX 5
SCORES OF MAINSTREAMED AND.NON-MAINSTREAMED STUDENTS
IN TARGET SCHOOLS

.1)
Table A
Scores of Mainstreamed and Non-Mainstreamed Students in
School 01
Mainstream Reading Math Behavior
Student Grade Subjecti Level2 Grade3 Score4
000 2 Spelling 5 3.3 + (7)
002 2 5 2.0 + (4)
004 2 4 2.9 + (5)
001 2 7 2.9 + (11)
003 3 Social 9 3.9 + (5)
Studies
005 3 Spelling 8 3.3 + (11)
1. Subjects in which students were mainstreamed.
2. Reading scores based on the Ginn 360 Initial Screening Test manual.
3. Math grade equivalency based on the McMillan Placement Test manual.
4. A plus (+) indicates adequate behavior, a minus (-) indicates in-
adequate behavior according to criteria in the Walker Problem
Behavior Identification Checklist manual. Scores in parentheses
indicate raw scores; adequate behavior for females falls betwebn0 and 12; for males between 0 and 22.
80

72
Table B
Scores of Mainstreamed and Non-Mainstreamed Students i
School 02
Mainstream Reading Math Behavior
Student Grade Subjecti Leve12. Grade3 Score4 .
012 2 Math 6 1.6 + (4)
007 2 6 1.6 + (3)
008 2 6 1.9 t (15)
009 2 6 3.0 (16)
010 2 6 1.9 + (1)
011 2 6 1.3 +- (13)
013 2 6 1.9 (31)
014 2 6.1.9 + (1)
006 4 6 1.6 +' (11)
1. Subjects in which students, were ma streamed.
2. Reading scores based on thc. Ginn Q Initial Screening Test manual.
3. Math grade equivalency based on the McMillan Placement Test manual.
4. A plus (+) indicates adequate behavior, a minus (-) indicates i1-
adequate behavior according to criteria in the Walker ProblemBehavior Identification Checklist manual: Scores in parentheses.indicate raw scores; adequate behavior for females falls between
0 and 12; for males between 0 and 22.
.00
81

73
Table C
Scores of Mainstreamed and Non-Mainstreamed Students in
School 02
Student GradeMainstreamSubject).
ReadingLevel2
!A6J-1
GrAe3BehaviorScore4
018 3 Math 7 3.3 + (4)
015 3 6 3.3 + (8)
016 3 - 6 2.6 + (11)
017 4 9 3.6 + ( ),
019 4 9 3.6 + (11;
1. Subjects in which students were mainstreamed.
2. Reading scores based on the Ginn 360 Initial Scree11_jng Test
3. Math grade equivalency based on the McMillan Placement Test manual.
4. A plus (+) indicates adequate behavior, a minus (-) indicates in-
adequate behavior according to criteria in the Walker Problem
Behavior Identification Checklist manual. Scores in parenthesesindicate raw scores; adequate behavior for females falls between0 and 12; for males between 0 and 22.
82


Table D
Scores of Mainstreamed and Non-Mainstreamed Students in
School 04
74
Mainstream Reading Math Behavior
Student Grade Subject]. Level2 Grade3 Score4
026 2 lath 6 3.0 + (9)
027 2 7 2.6 + (10)
028 6 2.6 - (23)
025 3 Math 7 4.0 (6)
022 4.3 (11)
020 4 8 4.0 - (12)
021 4 - 9 1.9 (10)
023 4 7 t 4.3 + (2)
- 024 4 9 4.0 + (9)
1. Subjects in which students were mainstreamed.
2. Reading,scores based on the Ginn 360 Initial Screening Test manual.
3. Math grade equivalency based on the McMillan Placement Test manual.
4.' A plus (*) indicates adequate behavior, a minus (-) indicates in-
,adequate behavior according to, criteria in the Walker Problem
Behavior Identification Checklist manual. Scores in parenthesesindicate raw scores; adequate behavior for females falls between0 and 12; for males between 0 and 22.
83

75
Table E
Scores of Mainstreamed and Non-MainWeamed Students in
School 05
Mainstream Reading Math Behavior
Student Grade Subject]. Level? \ Grade3 Score4
029 4 Math 8 \ 3.3 + (4)
030 4 5 1.3 + (14)
1. Subjects in which students were mainAreamed.
2. Reading scores based on the Ginn 360 Initial Screening Test manual.
3. Math grade equivalency based on the McMillan Platement Test manual.
4. A plus (+) indicates adequate behavior, a minus (-) indicates in-
adequate behavior according to criteria in the W4lker Problem
Behavior Identification Checklist manual. Scores in parenthesesindicate raw scores; adequate behavior for females falls between0 and 12; for males between 0 and 22.

76
Table F
Scores of Mainstreamed and Non-Mainstreamed Students in
School 06
Student GradeMainstreamSubject1
ReadingLevel2
MathGrade3
BehaviorScore4
03]. 3 7 2.6 + (17)
034 3 8 3.3 + (18)
035 3 8 3.0 - (25)
033 4 Math 7 3.3 - (57)
032 4 8 3.3 - (35)
037 4 9 4.3 + (14)
038 4 Math 9 4.3 - (29)
039 4 8 3.6 - (36)
036 4 5 2.0 (17)
1. Subjec:ts in which students were mainstreamed.
2. Reading scores based on the Ginn 360 Initial Screening Tes_t.manual.
Math grade equivalency based on the McMillan Placement Test manual.
4. A plus (+) indicates adequate behavior, a minus (-) indicates in-
adequate behavior according to criteria in the Walker Problem
Behavior Identification Checklist manual. Scores in parentheses
indicate raw scores; adequate behavior for females falls between
0 and 12; for males between 0 and 22.

I/
Table G
Scores of Mainstreamed and Non-V Instreamed Students in
School 07
Student GradeMainstreamSubjecti
ReadingLevel2
MathGrade3
BehaviorScore4
040 2 8 1.6 - (23)
041 2 6 1.9 - (36)
043 2 6 3.0 - (52)
044 2 6 3.3 (14)
045,c 4 2.0 (62)
042 3 Math 8 4.3 '76)
1. Subjects in which students were maisl.reamed.
2. Reeling scorer based on the Ginn 360 manual.
3. Math grade equivalency based on the McMillan Placement Test manual.
4. A plus (-0 indicates adequate behavior, a minus (-) indicates in-
adequate behavior according to criteria in the Walker Problem
Behavior Identification Checklist manual. Scores in parentheses
fl dicate ravo scores; adequate behavior for females falls between
0 and 12; for males betwee 0 and 22.
86

78
Table H
Scores of Mainstreamed and Non-Mainstreamed Students in
School 08
Student GradeMainstreamSubject]
ReadingLevel2
MathGrade3
BehaviorScore4
047 2 Math/Reading 8 2.9 + (11)
046 2 6 1.6 + (12)
051 2 6 3.3. + (8)
048 3 Reading 9 3.6 + (1)
049 3 6 3.9 - (22)
050 3 6 2.0 + (9)
052 3 8 2.9 + (13
053 3 9 2.9 - (19)
004 3 7 2.0 - (25)
1. Subjects in which students were mains..reamed..
2. Reading scores based on the Ginn 360 Initial Screeninp Test manual..
3. Math grade equivalency based on the McMillan Placement Test manual.
4. A plus (+) indicates adequate behavior, a minus (-) i;!..cates in-
"adequate behavior according to criteria in the Walker Problem
Behavior Identification Checklist manual. Scores in parentheses
indicate raw stores; adequate behavior for females falls between0 and 12;. for males between 0 and 22.
87

79
Table
Scores of Mainstreamed and Non-Mainstreamed Students in
School 09
Student GradeMainstreamSubject1
ReadingLevel2
MathGrade3
BehaviorScore4
058 3 Math 7 3.3 + (15)
059 3 Math / 3.3 + (4)
060 3 English 9 3.9 + (2)
055 3 6 2.6 + (7)
056 3 7 3.3 + (19)
057 3 7 4.0. + (10)
061 4 1 3.6 - (34)
1. Subjects in wi,;ch students were mainstreamed.
2. Reading scnrLs ''Ised on the Ginn 360 Initial_ScrumingTelt manual.
3. Math grade eci ivalency based on the McMillan PL:.,ement Teatimanual.
4. A pliv (+) indicates adequate behavior, a minus (-) indicates in-.
adequate behavior according to criteria in the Walker Problem
Behavior Identification Checklist manual. Scores in parentheses
0 indicate raw scores; adequate behavior for females falls between
0 and 12; for males between 0 and 22.

OU
Table J
Scores of Mainstreamed and Non-Mainstreamed Students in
School 10
Student GradeMainstreamSubject].
ReadingLevel
2
MathGrade3
'BehaviorScore4
063 4 Readin iMath/ 11 4.3 + (15)
Science, SocialStudies
064 4 10 4.0 _ (22)
062 4 6 2.9 + (19)
1. Subjects in which students were maint,treamed.
2. Reading scores based on the Ginn 360 IniCbal ScreeningjesImanual.
3. Math grade equivalency based on the McMillan Placement Tes_manual.
4. A plus (+) indicates adequate behavior, a minus (-) indicates in
adequate behavior according to criteria in the Walker Problem
Ben,:vior Identification Checklist manual. Scores in parenthesesifiTicate raw scores; adequate behavior for females falls between0 and 12; for males between 0 and 22.

81
Table K
Scores of Mainstreamed and Non-Mainstreamed Students in
School 11
Student GradeMainstreamSubject].
ReadingLevel2
MathGrade3
BehaviorScore4
067 2 Math 7 2.3 + (12)
065 2 7 3.0 + (4)
066 2 6 2.9 + (7)
068 2 6 , 1.9 - (18)
1. Subjects in which students were mainstreamed.
2. Reading scores based on the Ginn 360 Initial Screening Test manual.
3. Math co^ equivalency based on the McMillan. Placement Test manual.
4n A plus '') indicates adequate behavior, a minus (-) indicates in-
adequate behavior according to criteria in the Walker Problem
Behavior Identification Checklist manual. Scores in parentheses
ifi-dicate raw scores; adequate behavior for females falls between
0 and 12; for males between 0 and 22.
90

82
Table 1.
Scores of Mainstreamed and Non-Mainstreamed Students in
School 11
Student GradeMainstreamSubject1
ReadingLevel2
MathGrade3
BehaviorScore4
074 2 Math 7 3.9 + (17)
075 2 6 1.9 - (28)
072 2 8 3.0 + '12)
07G 3 Math 8 2.9 - (22)
070 3 -- 10 2.9 + (5)
073 3 8 3.0 + (11)
09 4 Reading, Math,Language,Social Studies,Spelling, Hand-writing
12 6.0 + (5)
071 4 7 3.0 + (9)
077 4 2.6 + (11)
1. Subjects in which students were mainstreamed.
2. Reading scores based on the Ginn 360 Initial Screening Test manual.
3. Math grade equivalency based o.' the McMillan Placement Test manual.
4. A plus (+) indicates adequate behavior, a minus (-) indicates in-
adequate behavior according to criteria in the Walker Problem
Behavior Identification Checklist manual. Scores in parentheses
indicate raw scores; adequate behavior f females falls between
U and 12; for males between 0 and 22.

83
Table M
Scores of Mainstreamed and Non-Mainstreamed Students in
School 11
Student GradeMainstreamSubjecti
ReadingLevel2
MathGrade3
BehaviorScore4
078 4 Math 6 4.0 + (5)
080 4 10 3.6 -(35)
079 4 8 3.6 + (0)
032 (, 4 12 3.0 -(37)
I. Subjects in which students were mainstreamed.
2. Reading scores based on the Ginn 360 Initial Screening Test manual.
3. Math grade equivalency based on the McMillan Placement Test manual.
4. A plus (+) indicates adequate behavior, a minus (-) indicates in-
adequate behavior according to criteria in the Walker Problem
Behavior Identification Checklist manual. Scores in parentheses
indicate raw scores; adequate behavior for females falls between
0 and 12; nor males between 0 and 22.

84
Table N
Scores of Mainstreamed and Non-Mainstreamed Students in
School 12
Student GradeMainstreamSubject'
'ReadipcLevel2
MathGrade3
BehaviorScore4
088o
3 M-A.h 7 3.0 + (15)
083 3 8 1.9 + (0)
034 3 9 4.3 + (3)
085 4 5 1.6 + (11)
086 4 7 3.6 (19)
087 4 7 3.0 + (21)
089 4 7 4.3 - (28)
1. Subjects in which students were mainstreamed.
2. Reading scores based on the Ginn 360 Initial Screening.Test manual.
3. Math grade equivalency based on the McMillan Placement Test manual.
4. A plus (+) indicates adequate behavior, a minus (-) indicates in-
adequate behavior according td criteria in the Walker Problem
Behavior Identification Checklist manual. Scores in parentheses
indicate raw scores; adequate behavior for females falls between
0 and 12; for males between 0 anc 22.

Table 0
Scores of Mainstreamed and Non Mainstreamed Students in
School 13
Student GradeMainstreamSubjecti
ReadingLeve12
MathGrade3
BehaviorScore4
091 3 7 3.3 + (8)
093 3 5,
3.0 + (8)
095 3 6 1.6 (10)
097 3 8 2.6 - (23)
094 4 Math 9 3.9 - (13)
099 4 Math 7 3.6 + (13)
100 4 Math 7 3.9 '+ (6)
090 4 ," 8 3.9 + (12)
092 4 6 3.6 + (6)
096 4;
7 4.0 + (15)
098 4 . 9 4.3 + (11)
1. Subjects in which students were mainstreamed.
2. Reading scores based on the Ginn 360 Initial Screening Test manual.
3. Math grade e,4: valency based on the McMillan Placement Test manual.
4. A plus (+) indicates adequate behavior, a minus (-) indicates in-
adc:Al.i6.cr behavior according to criteria in the. Walker Problem
Behavior Identification Check7ist manual. Scores in parentheses
indicate raw scores; adequate behavior for females falls bettqeen
0 and 12; for males between 0 and 22.

.111 01..... 1 1 I
Table P
Scores of Mainstreamed and Non-Ma.nsfreamed Sudents in
School 14
86
Student GradeMainstreamSubject].
ReadingLevel
2
, MathGrade
3
BehaviorScore4
102 3 Reading/Math 9 3.3 (6)
103 3 6 3.6 + (8)
104' 3 -- 6 2.6 + (11)
105 4 Math/Science 8 3.9 (6)
106 4 Science 7 2.0 - (16)
1. Subjects in which students were mainstreamed.
2. Reading scores based on the Ginn 360 Initial Screening Test manual.
3. Math grade equivalencj based on the McMillan P'?cenlqnt Test manual,.
4. ! A plus (+) indicates adequate behavior, a minus (-) indicates in-
, adequate behavior according to criteria in the Walker Proble9_
i Behavior Identification Checklist manual. Scores in riarentH6ses
Indicate raw scores; adequate behavior for females falls between0 and 12; for males between 0 and 22.

27
Table Q
Scures of Mainstreamed and Non-Mainstreamed Students in
School 15
Student GradeMainstreamSubject1
ReadingLevel
MathGrade3
BehaviorScore4
103 2 Math / 3.6 + (11)
111 2 polling 7 2.0 + (8)
114 2 Math 7 2.6 + (8)
109 2 6 2.6 + (0)
112 2 7 2.6 + (6)
113 2 5 2.6 + (3)
115 2 7 2.9, + (8)
1. Subjects in which students were mainstreamed.
2. Reading scores based on the Ginn 360 Initial Screening Test manual.
3. Math orade equivalency based on the McMill,,n Placement Test manual.
4. A plus (+) indicates adequate behavior, a minus (-) indicates in-
adequate behavior according to criteria in the Walker Problem-
Behavior Identification Checklist manual. Scores in parentheses__-indicate raw scores; adequate behavior for females falls between
0 and 12; for males between 0 and 22.
96


88
Table R
Scores of Mainstreamed and Non-Mainstreamed Students in
School 16
Student GradeMainstreamSubject].
ReadingLevel,
MathGrade3
BehaviorScore4
117 3 -- 10 4.3 +. (2)
118 3 10 3.3 + (6)
120 4 Spelling 10 4.3 (25)
116 4 10 4.3 (6)
119 4 7 3.,6 + (3)
1. Subjects in which students were mainstreamed.
2. Reading scores based on the Ginn 360 Initial Screening Test manual.
3. Math grade equivalency based on the McMillan Placement Test_m 1.
4. A plus (+) indicates adequate behavior, a minus (-) indicates in-
adequate behavior according to criteria in the Walker Problem
Behavior Identification Checklist manual. Scores in parentheses
indicate raw scores; adequate behavior for females falls between0 and 12; for males between 0 and 22.
(.

89
Table S
Scores of Mainstreamed and Non-Mainstreamed Students in
School 17
Student GradeMainStreamSubject].
ReadingLevel2
MathGrade3
BehaviorScore4
127 3 7 3.6 + (4)
129 3 10 4.3 + (5)
125 4 Reading 9 3.0 - (67)
128 4 Reading 7 2.3 + (10)
121 4 7 4.3 + (3)
123 4 8 3.6 + (19)
124 4 7 3.6 - (41)
126 4 / 6 '4.3 + (6)
1. Subjects in which students were mainstreamed.
2. Reading scores based on the Ginn 360 Initial Screening Test manual..
3. Math grade equivalency based on the McMillan Placement Test,manual.
4. A plus (+) indicates adequate behavior, a minus (-) indicates in-
adequate behavior according to criteria in the Walker Problem
Behavior Identification Checklist manual. Scores in parentheses
indicate raw scores; adequate behavior for females falls between
0 and 12; for males between 0 and 22.
98

90
Table T
Scores of Mainstreamed and Non-Mainstreamed Students in
School 18
Mainstream Reading Math Behavior
Student Grade Subject]. Level2 Grade3 Score4
130 4 Reading/Math 10 4.3 + (7)
131 3 9 3.3 (16)
132 3 8 3.6 - (23)
1. Subjects in which students were mainstreamed.
2. Reading scores based on the Ginn 360 Initial Screening Test manual.
3. Math grade equivalency based on the McMillan Placement Tes_tmanual.
4. A plus (+) indicates adequate behavior, a minus (-) indicates in-
adequate behavior according to criteria in the Walker Problem
Behavior Identification Checklist manual. Scores in parentheses
indicate raw scores; adequate behavior for females falls between
0 and 12; for males between 0 and 22.
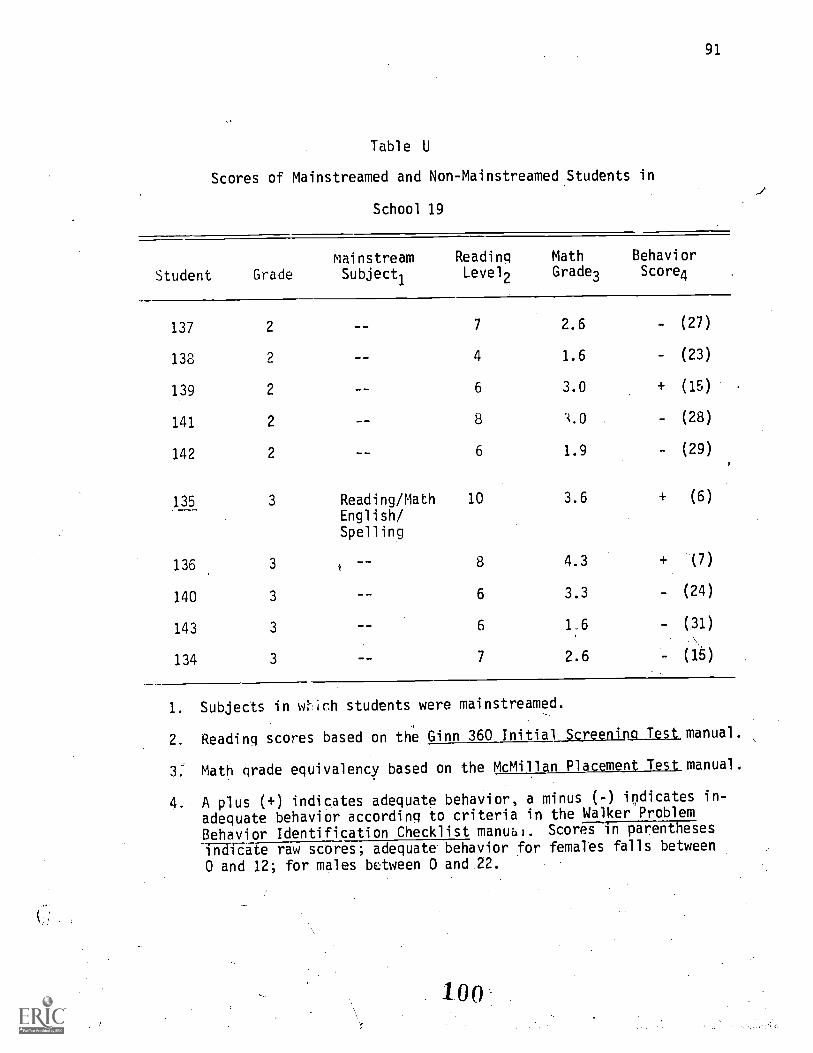
91
Table U
Scores of Mainstreamed and Non-Mainstreamed Students in
School 19
Student GrademainstreamSubject].
ReadingLevel2
MathGrade3
BehaviorScore4
137 2 7 2.6 - (27)
138 2 4 1.6 - (23)
139 2 6 3.0 + (15)
141 2 8 ".C) - (28)
142 2 6 1.9 - (29)
135 3 Reading/Math 10 3.6 + (6)
English/Spelling
136 3 i8 4.3 + (7)
140 3 6 3.3 - (24)
143 3 6 1.6 - (31)
134 3 7 2.6 (15)
1. Subjects in students were mainstreamed.
2. Reading scores based on the Ginn 360 Initial 3creening_Test manual.
3: Math grade equivalency based on the McMillan Placement Test manual.
4. A plus (+) indicates adequate behavior, a minus (-) indicates in-
adequate behavior according to criteria in the Walker Problem
Behavior Identification Checklist manual. Scores in parentheses
indicate raw scores; adequate- behavior for females falls between
0 and 12; for males between 0 and -22.
100

92
Table V
Scores of Mainstreamed and Non-Mainstreamed Students in
School 19
Mainstream Reading Math Behavior
Student Grade Subject). Level2 Graded Scorell
144 4 Science 9 3.6 + (11)
146 4 'Science 4.6 + (7)
145 4 8 3.0 - (14)
1. Subjects in which students were mainstreamed.
2. Reading scores based on the Ginn 360 Initial auegnino Test manual.
3. Math grade equivalency based on the McMillan Plaument Tej manual.
4. A plus (+) indicates adequate behavior, a minus (-) indicates in-
adequate behavior according to criteria in the Walker Problem
Behavior Identification Checklist manual. Scores in parentheses
indicate raw scores; adequate behavior for females falls between
0 and 12; for males between 0 and 22.
101

93
Table W
Scores of Mainstreamed and Non-Mainstreamed Students in
School 20
Student GradeMainstreamSubjecti
ReadingLevel2
MathGrade3
BehaviorScore4
147 2 8 3.3 + (6)
149 3 8 4.6 + (15)
150 3 7 4.0 + (5)
151 3 7 3.6 (38)
153 3 S 3.3 + (7) ,
155 3 7 2.6 (/0)
156 3 6 1.6 + (17)
152 4 Math 9 4.3 + (6)
148 4 8 4.3 + (8)
154 4 8 4.0 + (11)
157 4 6 1.6 +
1. Subjects in which students were mainstreamed.
2. Reading scores based on the Ginn 360 Initial Screening Test manual.
3. Math grade equivalency based on the.McMillan Placement Test. manual.
4. A plus (+) indicates adequate behavior, a minus (-) indicates in-
adequate behavior according to criteria in the Walker. Problem
Behavior Identification Checklist manual. Scores n rent eses
indicate raw scores; adequatebehavior for females falls between
0 and 12; for mates between 0 and 22.
102

APPENDIX C
FREQUENCY DISTRIBUTIONS OF MATH AND READINL EV S OF MAINSTREAMED
AND NON-MAINSTREAMED STUDENTS BY GRADE
103

95
Table A
Frequcncy Distribution of Reading Levels of Mainstreamedand NonMainstreamed Students by Grade
ReadingLevel
Number ofMainstreamed Students
Number ofNon-Mainstreamed Students
Grade Level
2 3 4
Grade Level
2 3 4
4
5 2
6 2 1
7 6 6 5
8 2 4 2
9 4 5
10 1 2
11 1
12 1
2
3 1 3
19 11 5
6 10 11
4 11 10
3 6
4 3
104

96
Table B
Frequency Distrib tion of Math Levels of Mainst1m:amed
and N1n-M instreamed Students by Grade
MathGradeLevels
Number ofMainstreamed Students
Number ofNon-Mainstreamed Students
Grade Level
2 3 '4
Grade Level
2 3 4
1.3
1.6
1.9
2.0
2.3
2.6
2.9
3.0
3.3
3.6
3.9
4.0
4.3
4.6
6.0
1
1
1 1
1
1 2 1
1 1 1
1 5 2
1 1 2
1 3 3
1 1
1 4
1
1
105
1 1
,4 3 3
8 1 1
2 2 1
6 7 1
4 3 1
6 3 4
3 8 1
4 10
1 1
2 5
5 8
1.


![Bullard Assumptions Talk[1]](https://img.dokumen.tips/doc/110x75/577d22b61a28ab4e1e980efd/bullard-assumptions-talk1.jpg)