Embed Size (px)
Citation preview

ED 127 666
AUTHORTITLE
INSTITUTION
REPORT NOPUB DATENOTEAVAILABLE FROM
EDRS PRICEDESCRIPTORS
ABSTRACT
DOCUMENT RESUME
95 EA 008 578
Foster, Betty J.; Carpenter, Judi M.Statistics of Public Elementary and Secondary DaySchools, Fall 1975. Pupils, Staff, Revenues,Expenditures and Salaries.National Center for Education Statistics (DHEW),Washington, D.C.NCES-76-1457657p.; For a related document, see ED 112 472Superintendent of Documents, U.S. Government PrintingOffice, Washington, D.C. 20402 ($1.15)
1F-$0.83 Plus Postage. HC Not Available from EDRS.Educational Finance; Educational Trends; *ElementarySecondary Education; Expenditure Per Student; HighSchool Graduates; *National Surveys; Questionnaires;School Personnel; *School Statistics; *SchoolSurveys; Student Enrollment; *Tables (Data) ; TeacherSalaries
This report presents basic state summary data onpublic elementary and secondary day schools in the United States andsome outlying areas under U.S. jurisdiction as of fall 1975. Selectednational trend data dating back to 1971 are also included. Data foreach state list numbers of local school districts, staff, and pupilsin fall 1975 and for the 1975-76 school year, as well as estimatedrevenue and nonrevenue receipts, expenditures for school maintenanceand operation, and average salaries paid to professional/educationalstaffs. Data for 1975-76 on numbers of public elementary andsecondary day schools and numbers of high school graduates are alsoincluded, and most data are listed separately for the 20 mostpopulous cities, as well as by state. Survey procedures and coverageare described briefly, and a replica of the survey questionnaire isincluded in the appendix. (Author/JG)
***********************************************************************Documents acquired by ERIC include many informal unpublished
* materials not available from other sources. ERIC makes every effort ** to obtain the best copy available. Nevertheless, items of marginal* reproducibility are often encountered and this affects the quality* of the microfiche and hardcopy reproductions ERIC makes available* via the ERIC Document Reproduction Service (EDRS). EDRS is not* responsible for the quality of the original document. Reproductions ** supplied by ENS are the best that can be made from the original.***********************************************************************

EIelementary and secondary education
Statistics of PublicElementary and SecondaryDay SchoolsFALL 1975
U S OE PARTMENT OF HEAL1H,EDUCATION &WELFARENATIONAL INSTITUTE OF
EOUCATION
THIS DOCUMENT HAS 8EEN REPRO-DUCED EXACTLY AS RECEIVED FROMTHE PERSON OR ORGANIZATION ORIGIN-A TING IT POINTS OF VIEW OR OPINIONSSTATED DO NOT NECESSARILY REPRE-SENT OFFICIAL NATIONAL INSTITUTE OFEDUCATION POSITION OR POLICY

o--,?na school :-..istricts continued a decline,-
fall fro7a 16,f0.,±, reported in fall 1974.
professionalleduational, ocher professional, andemployees (full-time equivalents),
pro;esi.s,n::: Lind nonpr: fc.ssion:12, wen., elementary and secondary
day .-chools in sti.2 1ui ftatcs in Lail 1975.
estim :1.2 million clesroom teachers, in full-time%,!cre tr::pio'yed En publi,.7 schools in fall 1973, an increase of
-,:oxlmatiy 1.7 per..7eni: those in :Tall
cc:,ncutivu year enrollment decreased for
ele::,?ntury and s.LSools. From :Tall 1174 to fall 1975 enro11:71ents
:,,cresed approately 21:i,732, or 5.5 percent.
:-atio.--ause the numer rla53sroom teachers continued
:),r of per t.eacr dreased to the lciwestrecoot.
..!,raThatos.--An students completed theschocls durinU the l974-75 school year, represent-
pere-1, c,f 9th-grade enroilmellt years earlier.
:75.3 billion in total revenuesci-101 purposes for 1975-76, $67.1
receip:.s billion was in nonrevenue receipts.
1.::e estimate:: S67.1 bIEI. on dollars in total expenditures
l'.1;r7t) fr billion was for current
.1, d1.7 !,41110n f.or
expend:tr-s fr otor prc;4rnms, for capital outlay,
.H Intorost on school
,rrent ox7,c.nd7ture pupil.--In 197-76, the estimated current
:xoe:1,fitur pupil in a%',..fri!.o daily at_ndnce amounted to S1,388. BseddaLly per-pupil expenditure was $1,302.
alary.--Fhe estimated ayr.:;;e salary for classroom teachers was $12,448.esti7::oted av:..ra,;o annual salary of all ether professional/educational
Kin11:1:n only curriculum specialists. counselors, librarians/mediaaud specialist!,) in elementary and secondary
sThools in was $13,967.

NCES 76-145
Statistics ofPublic Elementary
and Secondary Day SchoolsFALL 1975
Pupils, Staff, Revenues, Expenditures, and Salaries
by
Betty J. Foster and Judi M. CarpenterElementary and Secondary
Surveys Branch
U.S. DEPARTMENT OF HEALTH, EDUCATION, AND WELFAREDavid Mathews, Secretary
Education DivisionVirginia Y. Trotter, Assistant Secretary for Education
National Center tor Education StatisticsMarie D. Eldridge, Administrator
4

NATIONAL CENTER FOR EDUCATION STATISTICS
"The purpose of the Center shall be to collect and disseminate statisticsand other data related to education in the United States end in other nations.The Center shall . . . collect, collate, and, from time to time, report fulland complete statistics on the conditions of education in the United States;conduct and publish reports on specialized analyses of the meaning and signi-ficance of such statistics; . . . and review and report on education activitiesin foreign countries."--Section 406(b) of the General Education Provisions Act,as amended (20 U.S.C. 1221e-1).
U.S. GOVERNMENT PRINTING OFFICEWASHINGTON: 1976
Fcr sale v the Superintendent of Documents, U.S. Government Printing OfficeWashington, D.C. 20402 - Price $1.18
0

FOREWORD
The data in this report were providad through the assistance of research andstatistics personnel in each State Department of education, the District ofColumbia, and the outlying areas of the United States. The National Centerfor Education Statistics expresses appreciation to the officials listed belowand their staffs for their cooperation in continuing to make this publicationseries possible.
Alabama W H. Kinbrough, Director, Division of Administrationand Finance
Alaska Lorraine Robinson, Administrative Assistant,Statistical Services
Arizona Robert A. Duvall, Statistician, Charlotte S. Deuvall,Director, School Financc
Arkansas Truett M. Goatcher, Supervisor, Research andStatistics
California Melvin W. Gipe, Consultant, Evaluation and Research,Bureau of School Apportionments and Reports
Colorado Edith Ruppert, Administrative AssistantConnecticut William T. Magnotta, Accountant IIDelaware Wilmer E. Wise, Director Planning, Research and
Evaluation DivisionDistrict of Columbia Mildred P. Cooper, Assistant Superintendent, Office
of Planning, Research and EvaluationFlorida Edward R. Allen, Jr., Program Administrator, Research
Information and SurveysGeorgia M Eugene Wallace, Jr., Coordinator of StatisticsHawaii George Nakamato, Staff Specialist IIIdaho Barry Bull, Consultant Evaluation and Statistics,
Planning and Evaluation DivisionIllinois David F. Ellsworth, Director of Statistics
Dave WilliamsCameron Barbian, Assistant DirectorClifford H. Berry, Department of Control
Indiana Lynda K. Land, Adndnistrative Assistant, Division ofResearch
Iawa Eldert A. Groenendyk, Consultant, Statistical ReportsKansas Marjorie Miller, Research AnalystKentucky WendeAl McCourt, Assistant Director, Division of
Statistical ServicesLouisiana Ethel B. Bailey, Section Chief, Data Collection
and Reports
6

Maine Dale Elliot, Systems Analyst, Planning and Manage-ment InformationShirley CsengeryBarbara TurnerLucille Johnson, Director,Statistical Services
Maryland Kathleen C. Hiatt, Research AnalystMary H. Binebrink, Specialist in Research
Massachusetts Leslie May, Education Specialist, Bureau of Researchand AssessmentLeo Turo, Director, Bureau of School ManagementServices
Michigan Sylvester White, School Finance SpecialistRobert Hornberger, Director, Department Services
Minnesota S Walter Harvey, Director of Research, State Aidsand Statistics
Mississippi Smith Sparks, Administrative Assistant, Financeand Statistics
Missouri Bertha McClaskey, Director, School DataJames H. Cockerham, Director of Budget, St. LouisPublic SchoolsStephen Paeschner
Montana Stephen Colberg, StatisticianNebraska Harley V. Pfeiffer, Statistical ServicesNevada Lincoln W. Liston, Director, Office of Technical
AssistanceNew Hampshire Shermgn V. Wheeler, Consultant, Educational
InformationNew Jersey M Jack Krupnick, Director,State Education
Statistics BranchS. Herbert Starkey
New Mexico Caroline T. Chavez, Director of Statistics,Ann Klemmer, Accountant II, Public School FinerDivision
New York James R. Barnes, Associate StatisticianNorth Carolina Carlton Willis, Operation's Manager
North Dakota Leslie D. Engstrom, Coordinator of InformationSystems, H. J. Snortland, Assistant Superintendent
Ohio Dan L. Brown, Chief, Statistical ReportsAndrew J. Grant, Clerk Treasurer, Cleveland CitySchool District
Oklahoma Ad 0. Acers, Manager, Systems DesignOregon Jan Clemmer, Coordinator of Statistics
7
iv

Pennsylvania Dominic R. Lattanzio, Supervisor, Division of Statistics,Paul H. Lauver, Educational Statistics Associate,Paul C. Shatto, Jr., Educational Statistics Associate,John P. McQuaid, Subsidies Manager
Rhode Island Robert R. Joyce, Supervisor, Educational StatisticsSouth Carolina Pamela P. McMillan, Statistician, Office of Research,
Phillip T. Kelly, Supervisor, Administrative ServicesSouth Dakota Gale D. Schlueter, Director, StatisticsTennessee Charles K. Pullen, Educational Special!_st
R. W. SprouseTexas Jerry T. Barton, Director of Research, Nolan Estes,
Superintendent of Schools, Dallas, Harold H. Hitt,Superintendent of Schools, San Antonio,Ray A. Kalich
Utah Elvin H. Ossmen, Specialist, Statistical ResearchVermont Mickey McCann, Chief, Statistics and InformationVirginia R T. Lewis, Jr., Supervisor of Special Studies,
R. S. Hager, Supervisor, Administrative ServicesWashington Alan W. Metcalf, Director, Statistical Information
ServicesWest Virginia Robert Vaughn, Coordinator of Data Processing
Gerald Harper, StatisticianWisconsin Don Russell, Director, Information Systems
Richard S. RussellWyoming Mark M. Fox, Assistant Superintendent for Planning,
Evaluation and Information ServicesAmerican Samoa Lealofi Uiagalelei, Assistant Director, Business
ServicesCanal Zone Zander S. Krawitz, Administrative OfficerGuam Jose Q. Cruz, Educational PlannerPuerto Rico Edwardo L. Lopez, Stati3ticianVirgin Islands Raoul L. Weinstein, Coordinator, Research and Educa-
tional Statistics
Recognition must be given to all members of the Elementary and Secondary SurveysBranch for their assistance in preparing this publication, with special recog-nition to Lena M. McDowell and Judy A. Anderson for their secretarial services.
Theodore H. DrewsActing DirectorDivision of Survey Planningand Analysis
Roy C. NehrtChief, Elementary and SecondarySurveys Branch

CONTENTS
Foreword
Introduction
Local School Districts
Page
iii
1
1
Staff Personnel, Professional and Nonprofessional 2Professional/Nonprofessional Classifications 2Classroom Teachers 2
Pupils 3School-Age Population 3Enrollment
3Enrollments in Grades 7 and 8 by Organizational Level 4Pupil-Teacher Ratios 4
High School Graduates5
Elementary and Secondary Day Schools Ly Level
Estimated Revenue and Nonrevenue ReceiptsRevenue ReceiptsNonrevenue Receipts
5
Estimated Expenditures and Salary Data 7Total Expenditures
7Current Expenditures per Pupil in ADA and ADM 7
Average Salaries of Classroom Teachers and Other ProfessionalEducational Staff
Large-City Data 8
Nature and Conduct of the Survey 8
Appendix: Survey Report Form 41
vii
9

TABLES
1-Historical summary of fall survey statistics on school districts,pupils in membership, teachers, and high school graduates in publicelementary and secondary day schools: 50 States and the District of
Columbia, 1971 to 1975
2-Local basic administrative units (school districts), by State or other
area: United-States, fall 1975 and 1974
3-Total official/administrative, professional/educational, professional/other and nonprofessional staff in public elementary and secondaryday schools, by State or other area and in large cities: United
States, fall 1975
3a-Official/administrative staff in public elemenLary and secondary dayschools, by sex and by State or other area and in large cities: United
States, fall 1975
Page
12
13
14
16
3b-Professional/educational and professional/other staff in public ele-mentary and secondary day schools, by sex and by State or other areaand in large cities: United States, fall 1975 18
3c-Nonprofessional staff in public elementary and secondary day schools,by sex and by State or other area and in large cities: United States,
fall 1975
4-Enrollments by organizational level, fall 1975 and 1974, and averagedaily membership (ADM) and average daily attendance (ADA), 1975-76,in public elementary and secondary day schools, by State or other
area and in large cities: United States
20
22
5-Enrollment in public elementary and secondary day schools, by gradelevel and by State or other area and in large cities: United States,
fall 1975 24
6-Pupils enrolled in grades 7 and 8 reported as both elementary andsecondary level in 24 reporting States, by organizational level:Fall 1975
Page
28
7-Total enrollment_ classroom teachers, with fall 1974 data on teachers,pupil-teacher ratios in enrollment, average daily attendance (ADA),and average daily membership (ADM) in public elementary and secondaryday schools, by State or other area and in large cities: UnitedStates 29
8-High school completions, 1974-75, and graduates of regular day schoolprograms, by sex and by State or other area and in large cities:United States, 1974-75 and 1973-74
9-Number of public schools by type, including one-teacher schools, byState or other area and in large cities: United States, 1974-75
10-Estimated revenue and nonrevenue receipts for public elementary andsecondary education from Federal, State, intermediate, and localsources, by State or other area and in large cities: United States,1975-76
11-Estimated expenditures for public elementary and secondary day schools,with major purpose, current e:cpenditures per pupil, and averageannual salary of other professional/educational staff and classroomteachers, by State or other area and in large cities: United States,1975-76
30
32
34
36

INTRODUCTION
This 22nd annual fall report of State summary data on free public elemen-tary and secondary day schools is part of the regular National Center forEducation Statistics (NCES) program to collect and disseminate timely anduseful information about the largest segment of the educational system in theUnited States.
Basic educational data on all free public elementary and secondary dayschools in the United States, the District of Columbia, and some outlying areasunder U.S. jurisdiction for fall 1975 are presented in this report. Nationaltrend data since fall 1971 on selected items of information are included. Basicdata for each State or other area are shown on numbers of local school districts,staff, and pupils in fall 1975 and for the 1975-76 school year, estimatedrevenue and nonrevenue receipts, expenditures for school maintenance and operation,and the average salaries paid to professional/educational staffs. Data on thenumbers of public elementary and secondary day schools and high school graduatesfor school year 1974-75 are also included. Most of the data also are shownseparately for the 20 most populous cities.
The information was gathered in the 22nd consecutive fall survey of publicelementary and secondary day schools, begun by the U.S. Office of Education butnow conducted by NCES in cooperation with education officials of the States,the District of Columbia, and U.S. outlying areas. Descriptions of survey proce-dure, other methodology, and coverage appear in the section "Nature and Conductof the Survey." A replica of the report form, with totals entered for the 50States and thn District of Columbia, and instructions to respondents are shownin the appendix.
LOCAL SCHOOL DISTRICTS
For the past several decades, the number of school districts (local basicadministrative units) has been reduced as a result of reorganization, consoli-dation, and annexation of smaller units, and until this year most nonoperatingschool districts have been eliminated. The number of school districts decreacedfrom 16,568 in fall 1974 to 16,376 in fall 1975, down 1.2 percent. From fall1971 to fall 1975, the number of the local basic administrative units decreasedby 913, or more than 5.3 percent (table 1).
California, Illinois, Nebraska, and Texas reported more than 1,000 schooldistricts each, accounting for 26.9 percent of all the districts in the Nation(table 2). Eight States reported in the range of 500-999 (actually 505 to 757)operating and nonoperating school districts; 25 States, 100-499 (115 to 450);and 13 States and the District of Columbia, fewer than 100 (1 to 92).
Of the reported 16,376 districts in fall 1975, the number performing theirprescribed function of operating schools was 16,013, or 97.8 percent. The other363 districts did not operate schools but provided for their pupils by othermeans, such as transferring them to nearby opeiating districts on a tuition basis.
-1-
12
STAFF PERSONNEL,PROFESSIONAL AND NONPROFESSIONAL
It) addition to the traditional collection of the full-time-equivalent(FTE)li numbers of classroom teachers, in fall 1971 the survey was expanded andcontinued in iall 1974 to include all other instructional and noninstructionalstaff (also FTE), bcth professional and nonprofessional. The classification of
staff as instructional and noninstructional, professional and nonprofessional,was based on Handbook 12/.
Professional/Nonprofessional Classifications
The system of classifying staff in accordance with Handbook I was changed
in fall 1975. Data on FTE staff assignment by sex were collected in fourmajor assignment classifications in accordance with Handbook 1112/. These
classifications include official/administrative, professional/educational,
professional/others, and nonprofessional. More detailed composition of theseassignment classifications are included in the appendix, instructions for
completing part A-1, State Fall Report on Staff and Pupils, Fall 1975,
questionnaire (p. 43).
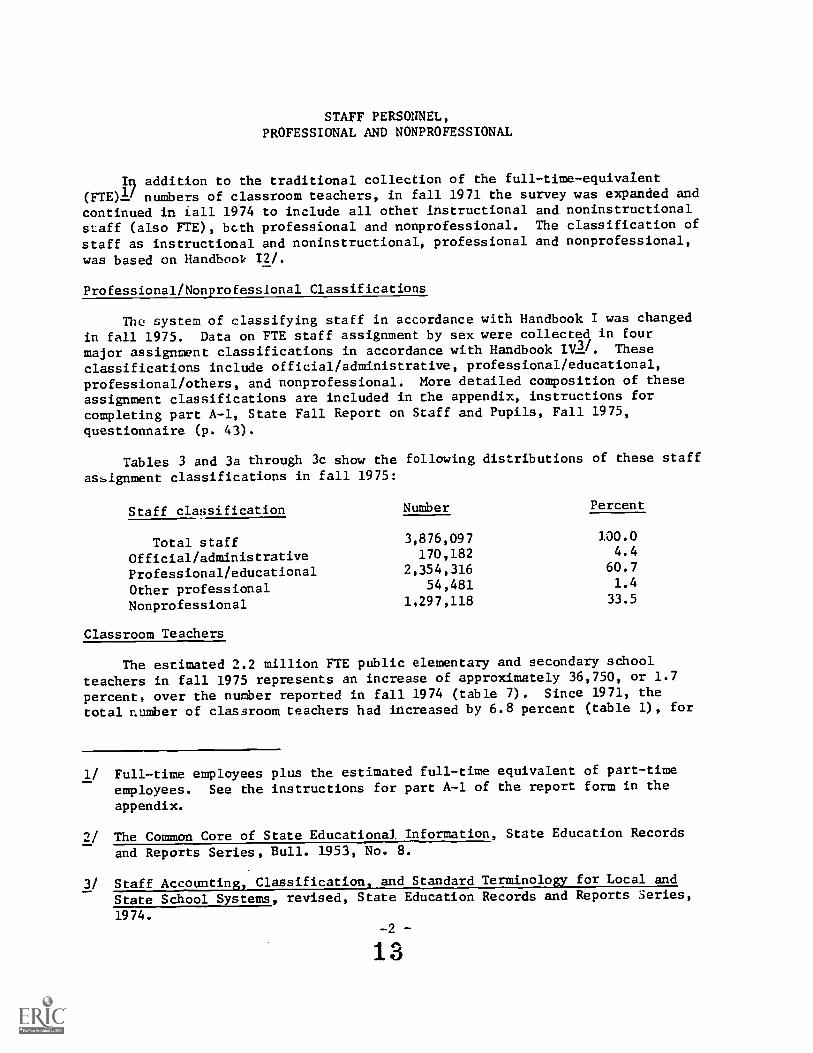
Tables 3 and 3a through 3c show the following distributions of these staff
as,ignment classifications in fall 1975:
Staff classification Number Percent
Total staff 3,876,097 100.0
Official/administrative 170,182 4.4
Professional/educational 2,354,316 60.7
Other professional 54,481 1.4
Nonprofessional 1,297,118 33.5
Classroom Teachers
The estimated 2.2 million FTE public elementary and secondary schoolteachers in fall 1975 represents an increase of approximately 36,750, or 1.7
percent, over the number reported in fall 1974 (table 7). Since 1971, the
total aumber of classroom teachers had increased by 6.8 percent (table 1), for
1/ Full-time employees plus the estimated full-time equivalent of part-time
employees. See the instructions for part A-1 of the report form in the
appendix.
2/ The Common Core of State Educational Information, State Education Records
and Reports Series, Bull. 1953, No. B.
3/ Staff Accounting, Classification, and Standard Terminology for Local and
State School Systems, revised, State Education Records and Reports Series,
1974.-2-

an average annual rate of about 1.6 percent (compounded annually). Histor-ical records in NCES indicate that, for any 5-year period, the one beginningin the first half of the 1960's showed the greatest percentage-rate increasefor the employment of teachers. These increases ranged from 17.1 to 18.7percent. The rates began to slow down in the latter half of the 1960's,beginning in the 1966-70 5-year span with a 14.9-percent increase and goingdown to 6.0 percent during 1969-73. Probable reasons for the reduction in therate of increase are decreases in enrollment and budgetary problems.
PUPILS
School-Age Population 41
From October 1, 1974, to October 1, 1975, the estimated school-agepopulation (ages 5-17 years, inclusive) declined from 50,812,0005/ to 50,2.77,000,a decrease of 535,000 or 1.0 percent. During this period the estimated totalresident population increased from 211,872,000 persons to 213,647,000 persons,or up 0.8 percent. The total school-age population represented a little lessthan one-fourth of the total population.
Enrollment
More than 44.8 million pupils were enrolled in public elementary andsecondary day schools in fall 1975, a decrease of approximately 214,782, or 0.5percent, from the number in fall 1974 (table 4). The decrease from fall 1973to fall 1974 was 376,225, or 0.8 percent (table 1). While enrollments continuedto increase until fall 1971, the amount of annual increase had diminished fromyear to year. Records in NCES indicate that in fall 1972, for the first timesince school year 1943-44, enrollments in public schools decreased. Since thefirst Commissioner's report for 1869-70 and succeeding reports, data show thatenrollments increased through 1933-34; decreased, 1935-36 through 1943-44; andincreased again, 1945-46 through fall 1971. (The annual fall survey began infall 1954.)
In fall 1975, a total of 31 States and the District of Columbia reportedenrollment decreases, ranging from less than 0.05 percent in Washington to 3.6percent in Missouri. Idaho reported the largest increase in enrollment--4.8percent over fall 1974, whereas the other 18 States reported smaller increasesranging from 0.1 percent to 3.3 percent.
While enrollment in the public elementary and secondary levels coMbinedhad increased for several years until fall 1972, the percent relationshipbetween levels has been changing. As a percent of total enrollment, elementaryenrollment has continued to decline Thile secondary enrollment has increased,
41 L:s,timates based on data published by the U.S. Bureau of the Census incurrent Population Reports, Series P-25, No. 614, and unpublished data.
5/ Revised from earlier estimates.
/'-x
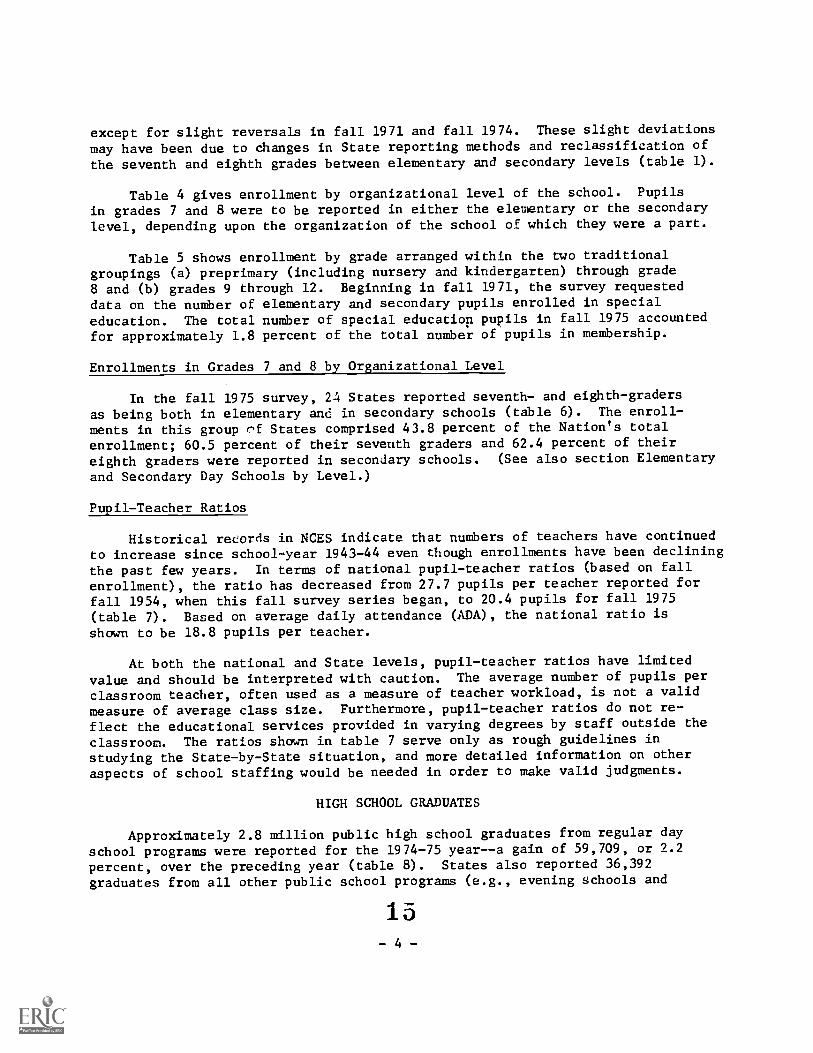
except for slight reversals in fall 1971 and fall 1974. These slight deviations
may have been due to dhanges in State reporting methods and reclassification of
the seventh and eighth grades between elementary and secondary levels (table 1).
Table 4 gives enrollment by organizational level of the school. Pupils
in grades 7 and 8 were to be reported in either the elementary or the secondarylevel, depending upon the organization of the school of which they were a part.
Table 5 shows enrollment by grade arranged within the two traditionalgroupings (a) preprimary (including nursery and kindergarten) through grade8 and (b) grades 9 through 12. Beginning in fall 1971, the survey requesteddata on the number of elementary and secondary pupils enrolled in special
education. The total number of special education pupils in fall 1975 accountedfor approximately 1.8 percent of the total number of pupils in membership.
Enrollments in Grades 7 and Lby_Organizational Level
In the fall 1975 survey, 24 States reported seventh- and eighth-graders
as being both in elementary and in secondary schools (table 6). The enroll-
ments in this group r,f States comprised 43.8 percent of the Nation's total
enrollment; 60.5 percent of their seventh graders and 62.4 percent of theireighth graders were reported in secondary schools. (See also section Elementary
and Secondary Day Schools by Level.)
Pupil-Teacher Ratios
Historical records in NCES indicate that numbers of teachers have continuedto increase since school-year 1943-44 even though enrollments have been declining
the past few years. In terms of national pupil-teacher ratios (based on fallenrollment), the ratio has decreased from 27.7 pupils per teacher reported forfall 1954, when this fall survey series began, to 20.4 pupils for fall 1975
(table 7). Based on average daily attendance (ADA), the national ratio isshown to be 18.8 pupils per teacher.
At both the national and State levels, pupil-teacher ratios have limited
value and should be interpreted with caution. The average number of pupils perclassroom teacher, often used as a measure of teacher workload, is not a valid
measure of average class size. Furthermore, pupil-teacher ratios do not re-
flect the educational services provided in varying degrees by staff outside the
classroom. The ratios shown in table 7 serve only as rough guidelines instudying the State-by-State situation, and more detailed information on otheraspects of school staffing would be needed in order to make valid judgments.
HIGH SCHOOL GRADUATES
Approximately 2.8 million public high school graduates from regular dayschool programs were reported for the 1974-75 year--a gain of 59,709, or 2.2percent, over the preceding year (table 8). States also reported 36,392
graduates from all other public school programs (e.g., evening schools and
- 4 -

adult education programs) and a total of 225,585 persons receiving high schoolequivalency certificates. Data were not available for some States on graduatesfrom other programs and those receiving high school equivalency certificates.
In 1974-75, girls represented 50.8 percent of the total number graduatedfrom regular public high school programs. A slight inbalance of female overmale high school graduates has been noted over a period of years.
Although the retention rate of public high school pupils remains high,the percentage ratio of 1973-74 high school graduates (reported in fall 1974)to students enrolled in the ninth grade 4 years earlier was greater than thesimilar ratio for 1974-75 graduates. The 1973-74 graduates represented 75.7percent of the class that entered the ninth grade in fall 1970. The 1974-75graduates represented 74.7 percent of the ninth-grade class in fall 1971.Five years earlier, the 1969-70 high school graduates also showed a higherratio: 78.1 percent of the fall 1966 ninth-grade class.
ELEMENTARY AND SECONDARY DAY SCHOOLS BY LEVEL
In fall 1970, the survey was expanded to include the number of publicelementary and secondary day schools by level. For purposes of this report,a school consists of a group of pupils with one or more teachers who giveinstruction of a defined type in one or more grades, housed in a school plantof one or more buildings or in more than one school plant, and organized asone unit. More than one schooI may be housed in the same school plant, as inthe case when separately organized elementary and secondary grade levels arehoused in the same school plant; where this occurs, ea .:?! level is consideredas a separate unit, if administered separately. If tYj....": ,-lementary and secondary
grade levels are administered as a single unit, it was Lz-Asidered as one school.
The fall 1975 survey collected data on elementary schools, which normallyincluded any span of grades not above 8, and on a middle range of schools,which generally included grades 5 or 6 through 8. Secondary schools includedany span of grades above elementary or middle schools, but not above grade 12,and junior high schools, generally consisting of grades 7 through 9. SinceStates vary in their classification of elementary and secondary schools, grades7 and 8 were considered as elementary or secondary depending on how they wereorganized in the local school districts. However, for this report, middleschools were grouped in the elementary category; junior high schools, in thesecondary category.
Results of the survey show a total of 88,695 public elementary and secondaryday sdhools, including 61,759 elementary, 23,837 secondary, 1,860 combinedelementary-secondary schools, and 1,239 special education schools for the handi-capped (table 9).
5
16

Of the 61,759 elementary schools reported, 3,224 were middle schoolsand 1,247 were one-teacher schools. The middle school, although a popularemerging classification, comprised only 5.2 percent of elementary schools.
There has been a constant reduction in the number of one-teacherschools, due mainly to school and school district reorganization. In fall1975, these schools constituted just 2.0 percent of all elementary schools.Nebraska reported the largest number of one-teacher schools -- 492, or 39.5percent of all one-teacher schools in the Nation.
Included in the count of secondary schools were 7,690 junior high,11,480 senior high, 4,122 6-year or junior-senior high, and 545 separatelyorganized vocational schools not included with other secondary schools.
Combined elementary and secondary schools (those organized andadministered as a single unit) amounted to 1,860, or 2.1 percent of thetotal number of elementary and secondary schools.
Special education schools for the handicapped include only those schoolswhich serve emotionally disturbed and mentally or phySically handicappedpupils exclusively. These schools amounted to 1,239, or 1.4 percent of the
total number of schools.
ESTIMATED REVENUE AND NONREVENUE RECEIPTS
The fall 1975 survey was expanded to collect estimated revenue andnonrevenue receipts by source of funding for the current school year.The revenue and nonrevenue receipts estimated by the 50 States and theDistrict of Columbia for school year 1975-76 totaled $70.3 billion.
Revenue Receipts
Revenue receipts are additions to assets which do not incur anobligation that must be met at some future date, do not represent exchangesof property for money, and are available for expenditures. State contrib-utions to retirement systems, pension funds, and social security are included.Not included are moneys that support or aid in expenditures for vocationalrehabilitation and salaries of personnel for supplementary services suchas State libraries and State museums, teacher retirement, and teacherplacement.
The States and the District of Columbia estimates of income from Federal,State, intermediate, and local sources totaled $67.1 billion, or 95.5 percentof the total amount of income they anticipated receiving for the operationof public elementary and secondary schools in school year 1975-76. Of this
amount, an estimated $5.3 billion, or 8.0 percent, was to be received from
1 '7
-6-

Federal sources. Estimated revenues from State sources accounted fOrbillion, or 43.7 percent of the total amount. The amount expected fromlocal sourcel was $32.1 billion, or 47.8 percent; intermediate revenuereceipts, $341.3 million, or 0.5 percent of the total amount of revenue.
Nonrevenue Receipts
Nonrevenue receipts consist of amounts received which either incur anobligation that must be met at some future date or change the form of anasset from property to cash and therefore decrease the amount and value ofschool property. For example, money received from loans, sale of bonds,sale of property purchased from capital funds, and proceeds from insuranceadjustments are nonrevenue receipts. Nonrevenue receipts are used chieflyfor capital outlay expenditures. Total estimated nonrevenue receipts werereported to be $3.1 billion, or 4.5 percent of total income.
ESTIMATED EXPENDITURES AND SALARY DATA
Total Expenditures
Estimated total expenditures for all public school purposes in 1975-76amounted to $67.1 billion (table 11). Included in the grand total werecurrent expenditures for elementary and secondary day schools ($57.4 billion)and for other programs ($1.7 billion), capital outlay ($6.0 billion), andpayment of interest on debt ($2.0 billion). Debt retirement was not included,since it would be a duplication of expenditures made and reported in precedingyears.
Current Expenditures per Pupil in ADA and ADM
The ,stimated average current expenditure per pupil in average dailyattendance (ADA) for school year 1975-76 was $1,388 (table 11). Based onaverage daily membership (ADM), the estimated amount was $1,302 per pupil.
Average Salaries of Classroom Teachers and Other Professional Educational Staff
For the United States, the estimated average annual salary of class-room teachers in 1975-76 was $12,448 (table 11). An analysis of averagesalaries among States indicates wide differences, ranging from $9,314 forMississippi and South Dakota to $19,312 for Alaska. California, Hawaii,Michigan, New York, and the District of Columbia reported average salariesin excess of $15,000 but not above $15,950. In 4 States, the average salarywas within a range of $13,000 to $13,999; 8 States, $12,000 to $12,999; 12States, $11,000 to $11,999; 12 States, $10,000 to $10,999; and 6 States,$9,000 to $9,999. Data for the State of Illinois were not available.
18
-7-
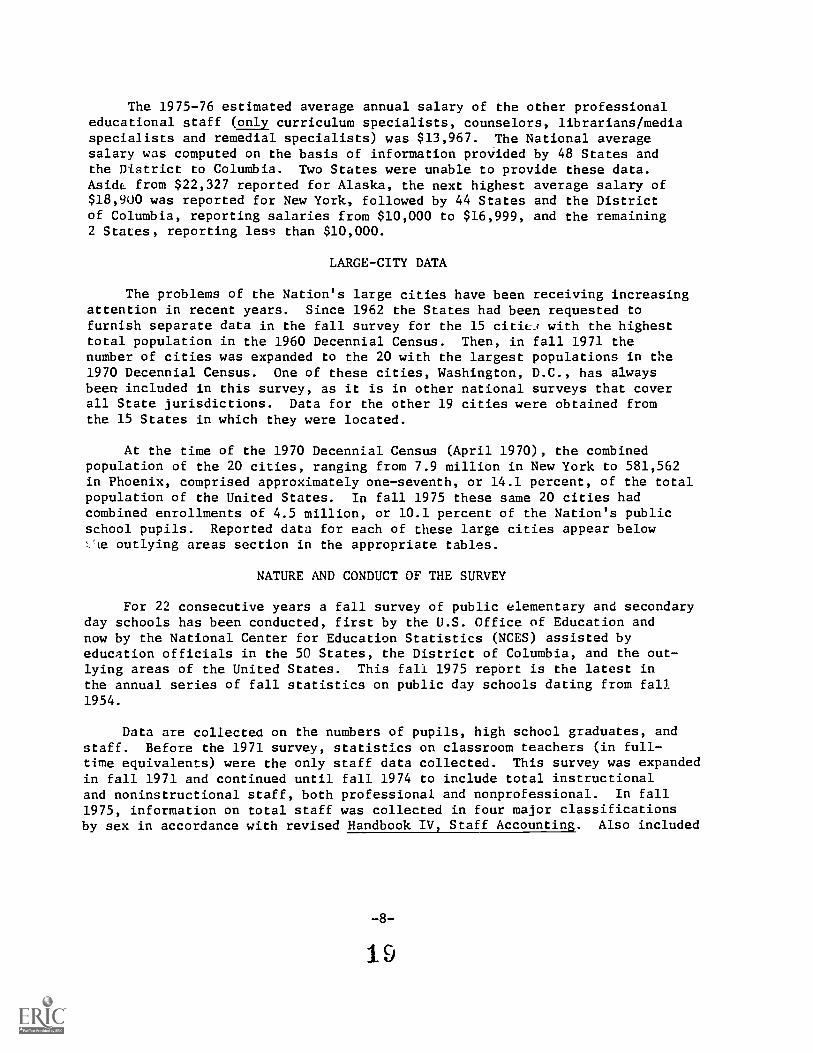
The 1975-76 estimated average annual salary of the other professionaleducational staff (only curriculum specialists, counselors, librarians/mediaspecialists and remedial specialists) was $13,967. The National averagesalary was computed on the basis of information provided by 48 States andthe District to Columbia. Two States were unable to provide these data.Aside from $22,327 reported for Alaska, the next highest average salary of$18,900 was reported for New York, followed by 44 States and the Districtof Columbia, reporting salaries from $10,000 to $16,999, and the remaining2 States, reporting less than $10,000.
LARGE-CITY DATA
The problems of the Nation's large cities have been receiving increasingattention in recent years. Since 1962 the States had been requested tofurnish separate data in the fall survey for the 15 citieLt with the highesttotal population in the 1960 Decennial Census. Then, in fall 1971 thenumber of cities was expanded to the 20 with the largest populations in the1970 Decennial Census. One of these cities, Washington, D.C., has alwaysbeen included in this survey, as it is in other national surveys that coverall State jurisdictions. Data for the other 19 cities were obtained fromthe 15 States in which they were located.
At the time of the 1970 Decennial Census (April 1970), the combinedpopulation of the 20 cities, ranging from 7.9 million in New York to 581,562in Phoenix, comprised approximately one-seventh, or 14.1 percent, of the totalpopulation of the United States. In fall 1975 these same 20 cities hadcombined enrollments of 4.5 million, or 10.1 percent of the Nation's publicschool pupils. Reported data for each of these large cities appear belowYle outlying areas section in the appropriate tables.
NATURE AND CONDUCT OF THE SURVEY
For 22 consecutive years a fall survey of public elementary and secondaryday schools has been conducted, first by the U.S. Office of Education andnow by the National Center for Education Statistics (NCES) assisted byeducation officials in the 50 States, the District of Columbia, and the out-lying areas of the United States. This fall 1975 report is the latest inthe annual series of fall statistics on public day schools dating from fall1954.
Data are collected on the numbers of pupils, high school graduates, andstaff. Before the 1971 survey, statistics on classroom teachers (in full-time equivalents) were the only staff data collected. This survey was expandedin fall 1971 and continued until fall 1974 to include total instructionaland noninstructional staff, both professional and nonprofessional. In fall1975, information on total staff was collected in four major classificationsby sex in accordance with revised Handbook IV, Staff Accounting. Also included
-8-
19
were estimated revenues and nonrevenue receipts by source, expenditures bymajor purpose, average salaries of classroom teachers and other professionaleducational staff, estimated average daily attendance, and average dailymembership. Data were also collected on the numbers of local school districts,operating and nonoperating. Since fall 1970, except in fall 1972, thesurvey has collected data on the numbers of public elementary and secondaryday schools.
To the extent available, data are shown for each State and the Districtof Columbia, and estimates for missing data are included in the nationaltotals. Data are also shown for five outlying areas: American Samoa, CanalZone, Guam, Puerto Rico, and the Virgin Islands. Data for the Trust Territoryof the Pacific Islands and the Department of Defense Overseas schools werenot received in time to be included in this report.
This survey also provides information on the school systems located inthe 20 largest cities that ranked highest in total population according tothe 1970 Census. Data for Washington, D.C., are shown both in the Statelisting as one of the 51 jurisdictions comprising the total for the UnitedStates and with the large cities to facilitate intercity comparisons. Datashown for Phoenix, Ariz., are for all the schools located in the city limitsof Phoenix and not just for those in the Phoenix Elementary and PhoenixUnion High School districts.
Statistics for the outlying areas are shown separately and are notincluded in the national totals. In several tables, National and Statetotals for fall 1974 are provided for comparison. Some of the data differfrom those originally published in the fall 1974 report and the advance fall1975 report6/ because more complete data became available after those reportswere issued.
The data in this report were furnished by the State education agencieson three report forms designed by the National Center for EducationStatistics. One of these forms requested data on pupil membership, staff,and high school graduates; another provided for reporting the number ofschools by type; and the third requested estimated data for the currentyear on revenues, expenditures, average salaries, average daily attendance,average daily membership, and operating and nonoperating local schooldistricts. (See appendix for facsimiles of these forms.)
Each State report was reviewed for internal consistency and for com-parability with information received in previous surveys, State publications,and related NCES studies. Letters and telephone calls were used as necessaryto obtain data from respondents and to resolve outstanding questions.
6/ See "Related NCES Publications," inside back cover.
-9-
20

As in any survey that employs the mail questionnaire, interpretationof instructions and definitions may vary among respondents. Because publicelementary and secondary education is a State and local responsibility,any statistical total for the Nation as a whole reflects a composite of
the different educational practices existing in the United States. The use
of standard forms and definitions in collecting the data tends to minimizethese variations. To the extent that State deviations from prescribeddefinitions and instructions were known, they are indicated in the footnotesto the various tables.
The National Center for Education Statistics encourages each State toobtain the data for its report by conducting a fall survey of local schooldistricts and by using an adaptation of the Federal forms and accompanyinginstructions. Many of the States used adaptations of these forms; however,some State education agencies find this approach impractical for a varietyof reasons; e.g., funds and staff are not available for conducting thesurvey or similar data for a recent period may already be available atthe State level. Some States collected the data from regular annual reports,and a few submitted estimates based primarily on records. Financialestimates for 1975-76 were prepared in the State offices, generally withoutrecourse to survey efforts. However, State appropriation records andbudgets filed by local school districts often served as bases for theseestimates.
Some of the data shown in the basic tables may not agree exactly withsimilar data reported in other NCES publications. Different reportingdates for various surveys may cause slight variations in published data.
2 1.

TABLES
Explanation of SyMbols in Tables
NA Category exists but data not available.
-- Quantity zero, unknown, or not applicable.
NOTES
DOD Overseas Schools are elementary and secondary schools operatedin foreign countries by the Department of Defense for minor dependentsof military and civilian personnel in the Department who are stationedoverseas.
The Trust Territory of the Pacific Islands is administered by theUnited States by agreement with the United Nations Security Council.
Kansas and Wisconsin: Data for vocational schools which are nota part of the regular public school system are not included.
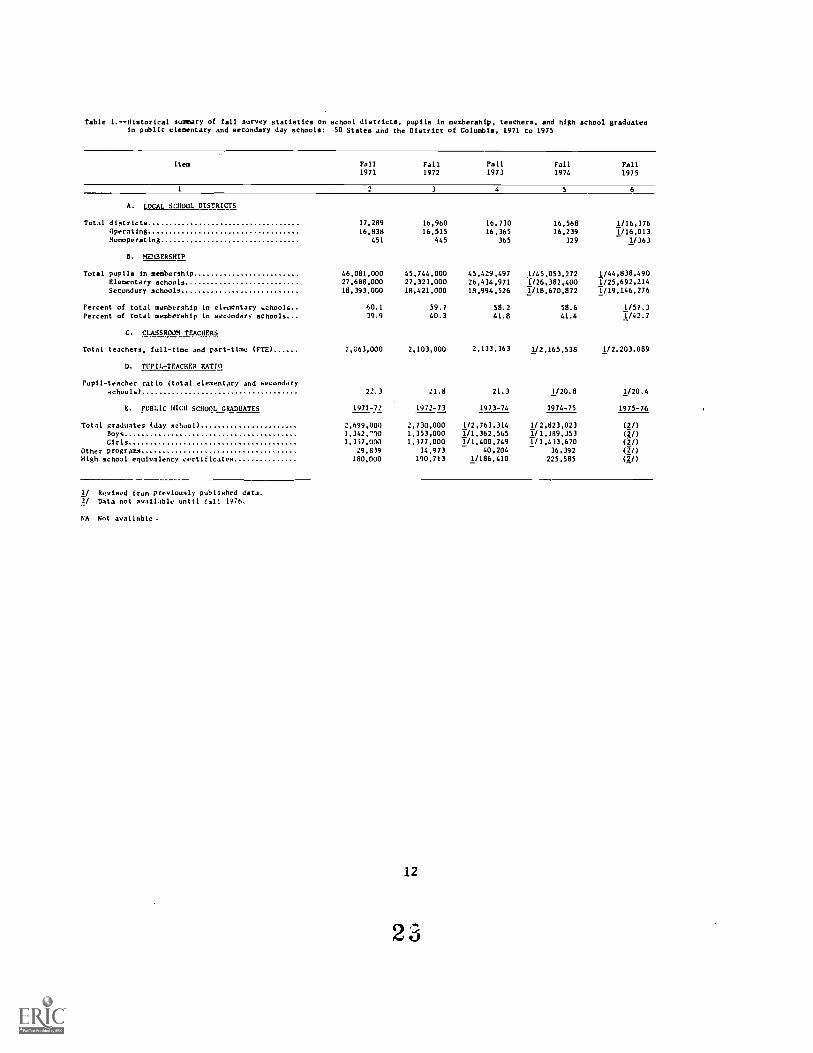
Table 1.--Historical summary of fall survey statistics on school districts, pupils in membership, teachers, and high school graduatesin public elementary and secondary day schools: 50 States and the District of Columbia, 1971 to 1975
Item Fall Fall Fall Fall Fall1971 1972 1973 1974 1975
2 3 4 5 6
A. LOCAL SCHOOL DISTRICTS
Total districts 17,289 16,960 16,730 16,568 1/16,376Operating 16,838 16,515 16,365 16,239 1/16,013Nonoperating 451 445 365 329 1/363
B. 1eMBERSHIP
Total pupils in membership 46,081,000 45,744,000 45,429,497 1/45,053,272 1/44,838,490Elementary schools 27,6138,000 27,323,000 26,434,971 1/26,382,400 1/25,692,214Secondary schools 18,393,000 18,421,000 13,994,526 1/18,670,872 1/19,146,276
Percent of total membership in eleocntary schools 60.1 59.7 58.2 58.6 1/57.3Percent of total membership in secondary schools 39.9 40.3 41.8 41.4 Y/42.7
C. CLASSROOM TEACHERS
Total teachers. full-time and part-time (FTE) 2,063,000 2,103,000 2,133,363 1/2,165,538 1/2,203.089
D. PUPIL-TEACHER RATIO
Pupil-teacher ratio (total elementary and secondaryschools) 22.3 21.8 21.3 1120.8 1/20.4
E. PUBLIC HIGH SCHOOL GRADUATES 1971-72 1972-73 1973-74 1974-75 1975-76
Total graduates (day school) 2,699,000 2,730,000 112,763.314 1/2,823,023 (2))Boys 1,342,"10 1,353,000 1/1,362,565 1/1,389,353 (1/)Girls 1,317,000 1,377,000 1/1,400,749 1/1,433,670 (1/)
Other programs 29,839 34,973 40,204 36,392 (2/)
High school equivalency certificates 180,000 190,713 1/186,410 225,585 (2/)
1/ Revised from previously published data.2/ Data not available until fall 1976.
NA Not available

Table 2.--Local basic adcdnistrative units (school districts), by State or other area: United States, fall 1975 and 1074
State or other areaof the United States
Fall 1975 Fall 1974 Decrease intotal nusber
Non- Non- of districtsTotal Operating operating Total Operating operating [plus (+)
denotesIncrease)
1 2 4 5 6 7 8
UNITED STATES 1/ 16,378 16,013 363 16,568 16,279 329 192
Alabama 126 126 -- 126 126 --Alaska 2/31 2/31 -- 32 32 -- 1
Arizona 245 232 13 283 271 12 38Arkansas 3/385 3/383 2 385 383 2California 1,045 1.045 -- 1,048 1,048 -- 3
Colorado 181 181 181 181Connecticut /1/ 175 166 9 165 165 +10Delaware 26 26 24 24 +2District of Columbia 1 1
Florida 67 67 67 67
Georgia 188 188 188 188Hawaii 1 1 1 1
Idaho 115 115 115 115Illinois 1,034 1,029 5 1,060 1,054 6 26Indiana 305 304 1 305 304 1
Iowa 450 450 450 450 --Kanaaa 308 308 310 310 2Kentucky 182 182 189 189 7Louisiana 66 66 66 66 -- --Maine 283 229 54 300 266 34 17
Maryland 24 24 24 24 -- --Massachusetta 5/ 1/402 1/360 42 402 360 42 --Michigan 587 583 4 594 592 2 7Minneaota 440 439 1 442 439 3 2Mississippi 150 150 150 150 -- --
Misrouri 567 567 572 5/2 5Montana 627 588 39 643 599 44 16Nebraska 1/1.204 1/1,148 1156 1,238 1.188 50 34Nevada 17 17 17 17 --New Hampshire 168 157 11 167 156 11 +1
New Jersey 610 592 18 1/608 1158e 1/19 +2New Mexico 88 88 -- 88 88 --New York 757 738 19 758 739 19 1North Carolina 1/148 1/148 -- 151 151 -- 3North Dakota 351 320 31 360 325 35 9
Ohio 617 617 617 617 --Oklahoma 630 630 634 634 4Oregon 334 332 2 339 337 2 5Pennsylvania 6/ 505 504 505 504 1 --Oracle Island 40 40 40 40 --
Soul:, Carolina 92 92 -- 94 94 -- 2South hakota 231 217 14 231 219 12Tenneme 147 147 146 146 -- +1Texan 1,127 1,121 6 1,135 1,129 6 8Utah 443 40 40 40 --
Vermont 274 246 28 274 246 28 --Virginia :41 134 7 139 139 -- +2Washington 304 704 -- 313 313 -- 9West Virginia 55 55 -- 55 55 --Wisconsin 435 475 436 436 1Wyoming 50 50 60 60 10
OUTLYING AREAS:
American Samoa 1 1 -- 1 1
Canal Zone 1 1 -- 1 1
Guam 1 1 1 1Puerto Pico 1 1 1 1Virgin Islands 1 1 1 1
DOD Overseaa Schools N 0 R E P 0 R TTruat Territory ofthe Pacific Islands N 0 R E P 0 R T
1/ Revised from previously published data.T/ Does not include 31 city and borough school districts and 20 regional educational attendance areas, formerly State
operated school systems.3/ Does not include the Arkansas Department of Correction, which by law is recognized as a school district for aid
purposes.4/ Includes the Connecticut Department of Correction which by law is recognized as an operating school district.3/ Does not Include 19 operating and 7 nonoperating regional vocational education school systems.17 In [hood instances where two or gore districts have organized into Jointures for purposes of operating schools,
the larger unit (jointure) is the administrative unit counted here. Does not include districts operatingvocational technical programs and speclal education programs.
24

Table 3.--Total official/administrative, professional/educational, professional/other and nonprofessional staff In public elementary and secondary
day schools, by State or other area and in large cities: United States, fall 1975
(In full-time equivalents)
State or other areaand city
Total staffTotal
official/administrativestaff
Totalprofessional/educational
staff
Totalprofessional/other
staff
Totalnonprofessional
staff
1 2 3 4 5 6
UNITED STATES 1/.., 3,876,097 170.182 2,354.316 54.481 1.297.118
Alabama 2/ 60.890 1.747 36,675 668 21.800Alaska 8,155 273 4.879 -- 3.003Arizona '/ 46.635 1.951 24.811 998 18.875Arkansas 38,495 1.761 22.376 233 14,125California 2/ 369,700 15.300 214.100 4,500 135.800
Colorado 2/ 55,000 1,985 29.750 1.750 21.515Connecticut 2/ 4/43,320 3.659 39.111 550 NADelaware 11.450 519 2/6.819 2/338 2/3,774District of Columbia 12,774 553 7.322 296 4,603Florida 139.646 5,239 81,454 1.005 51.948
Georgia 92,269 3,714 50.894 262 37.399Hawaii 12.817 615 8,646 -- 3.556Idaho 14.663 1.072 9.437 217 3.937Illinois 198.442 7,900 122.927 4.149 63.466Indiana 2/ 90,333 3,817 55.381 802 30.333
Iowa 61.182 2.989 34.825 353 23.015Kansas 2/ 44.729 2,080 27.482 431 14.736Kentucky 59,985 2.615 34.347 125 22,898Louisiana 6/ 79,199 2,554 43,593 1,649 31,403Maine 17.712 1.094 13.995 285 2.338
Maryland 80,283 4,108 44.913 1.374 29.888Massachusetts 2/ 112.475 5,975 74.000 2.000 30.500Michigan 178,204 9.092 97,297 3.438 68.377Minnesota 79.130 3.089 47.756 662 27.623Mississippi 46,953 2.020 25,540 404 18.989
Missouri 90,019 4.184 53.034 744 32.057Montana 8/10,325 675 9.650 NA NANebraska 30.321 1.248 18,352 957 9.764Nevada 9.905 347 6,153 157 3.248New Haopshire 12.651 541 9.746 365 2/1.999
New Jersey 2/ 135.269 4,404 88.410 4.210 38,245New Mexico 10/18.102 1.026 13.866 12/210 3,000New York 2/ 327,660 16.844 201,459 2,457 106.900North Carolina 94.336 ;,789 56.358 1,980 32,209North Dakota 12,657 692 7.882 143 3,940
Ohio 186,392 6,701 113.283 3,166 63.242Oklahoma 50,754 2.353 31.072 364 16,965Oregon 43.823 2,233 25,733 574 15.283
Pennsylvania 207.677 6,528 122,319 5.508 73,322Rhode Island 14.635 1,032 9.619 436 3.548
South Carolina 4/34.155 2,202 31.248 705 NASouth Dakota 14.063 673 S.464 28 4.900Tennessee 71.343 2,99' 42.396 164 25,786Texas 2/ 238.115 9,625 150.990 1,500 76.000Utah 27 21,573 952 13,272 178 7.171
Vermont 10,878 372 7.067 303 3,136Virginia 2' 100,279 5.000 58.330 1,540 35.409Washington 59.983 4.187 36,480 1,131 18.185
West Virginia 16/36,622 2,121 20.650 361 13.490Wisconsin 81.435 3.296 54.709 693 22,737Wyoming 8,682 439 5.444 118 2.681
See footnotes at end of table.
14
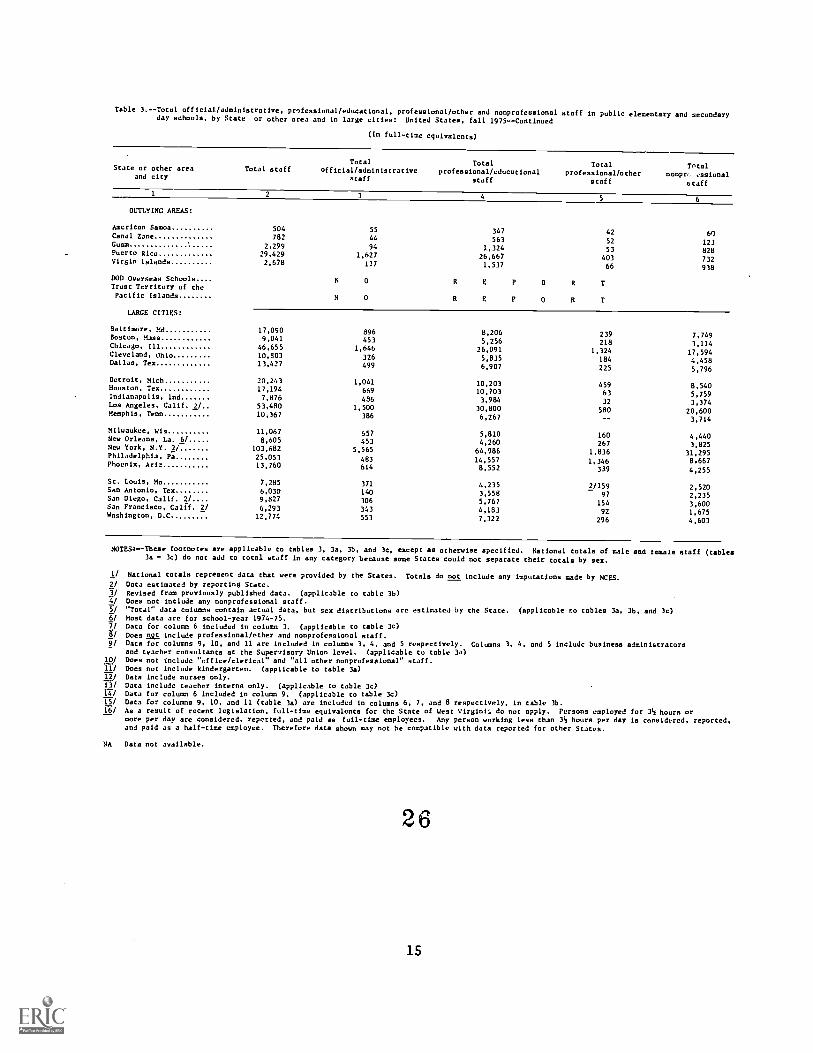
Table 3.--Total official/administrative, prgfessional/educational, professional/other and nonprofessional staff in public elementary and secondaryday schools, by State or other area and in large cities: United States, fall 1975--Continued
(In full-cime equivalents)
Total Total TotalState or other area Total staff official/administrative professional/educational professional/otherand city staff staff staff
1 2
OUTLYING AREAS:
American Samoa 504Canal Zone 782Guam 2,299Puerto Rico 29,429Virgin Wands 2,678
DOD Overseas SchoolsTrust Territory of thePacific Islands
LARGE CITIES:
Baltimore, Md 17,090Boston, Sass 9.041Chicago, Ill 46,655Cleveland, Ohio 10,803Dallas, Tex 13,427
Detroit, Mich 20,243Houston, Tex 17,194Indianapolis, Ind 7,876Los Angeles, Calif. 2/ 53,480Memphis, Tenn 10,367
Milwaukee, Wis 11,067New Orleans. La. 6/ 8,605New York, N.Y. 2/ 103.682Philadelphia, ii 25,053Phoenix, Aria 13.760
St. Louis, Mo 7,285San Antonio, Tex 6.030San Diego, Calif. 2/ 9,827San Francisco, Calif. 2/ 6,293Washington, D.0 12,774
Totalnonpr, vssional
staff
3 4 5 6
55 347 42 6044 563 52 12394 1,324 53 828
1.627 26,667 403 732137 1,537 66 938
N 0 R 0 1, 0 R T
N 0 R E P 0 R T
896 8,206 239 7,749453 5,256 218 3,114
1,646 26,091 1.324 17,594326 5,835 184 4,458499 6,907 225 5,796
1,041 10.203 459 8,540669 10,703 63 5,759486 3,984 32 3,374
1,500 30,800 580 20,600386 6,267 -- 3,714
657 5,810 160 4,440453 4,260 267 3,825
5,565 64,986 1.836 31,295483 14,557 1,346 8.667614 8.552 339 4,255
371 4,235 2/159 2,520140 3,558 97 2,235306 5,767 154 3,600343 4,183 92 1,675553 7,322 296 4,603
NOTES:--These footnotes are applicable to tables 3. 3a. 36, and 3c, except as otherwise specified. National totals of male and temale staff (tables3a - 3c) do not add to total staff in any category because some States could not separate their totals by sex.
1/ National totals represent data that were provided by the States. Totals do not include any imputations made by NCES.2/ Data estimated by reporting State.1./ Revised from previously published data. (applicable to table 31,)4/ Does not include any nonprofessional staff.5/ "Total" data columns contain actual data, but sex distributions arc estimated by the State. (applicable to tables 3a, 36, and 3c)2/ Most data arc for school-year 1974-75.
1/ Data for column 6 included in column 3. (applicable to table 3c)8/ Does ngt include professional/other and nonprofessional staff.4/ Data for columns 9, 10, and 11 are included in columns 3, 4, and 5 respectively. Columns 3, 4, and 5 include business administrators
and teacher consultants at the Supervisory Union level. (applicable to table 3a)12/ Does not include "office/clerical" and "all other nonprofessional" staff.11/ Does not include kindergarten. (applicable to table 3a)12/ Data include nurses only.
Data include teacher interns only. (applicable to table 3c)Data for column 6 included in column 9. (applicable to table 3c)
15/ Data for columns 9, 10, and 11 (table 3m) are included in columns 6, 7, and 8 respectively, in table 36.16/ As a result of recent legislation, full-time equivalents for the State of West Virgini: do not apply. Persons employed for 31/2 hours or
more per day are considered, reported, and paid as full-time employees. Any person working less than 3,1 hours per day is considered, reported,and paid as a half-time employee. Therefore data shown may not be compatible with data reported for other States.
NA Data not available.
2 6
15
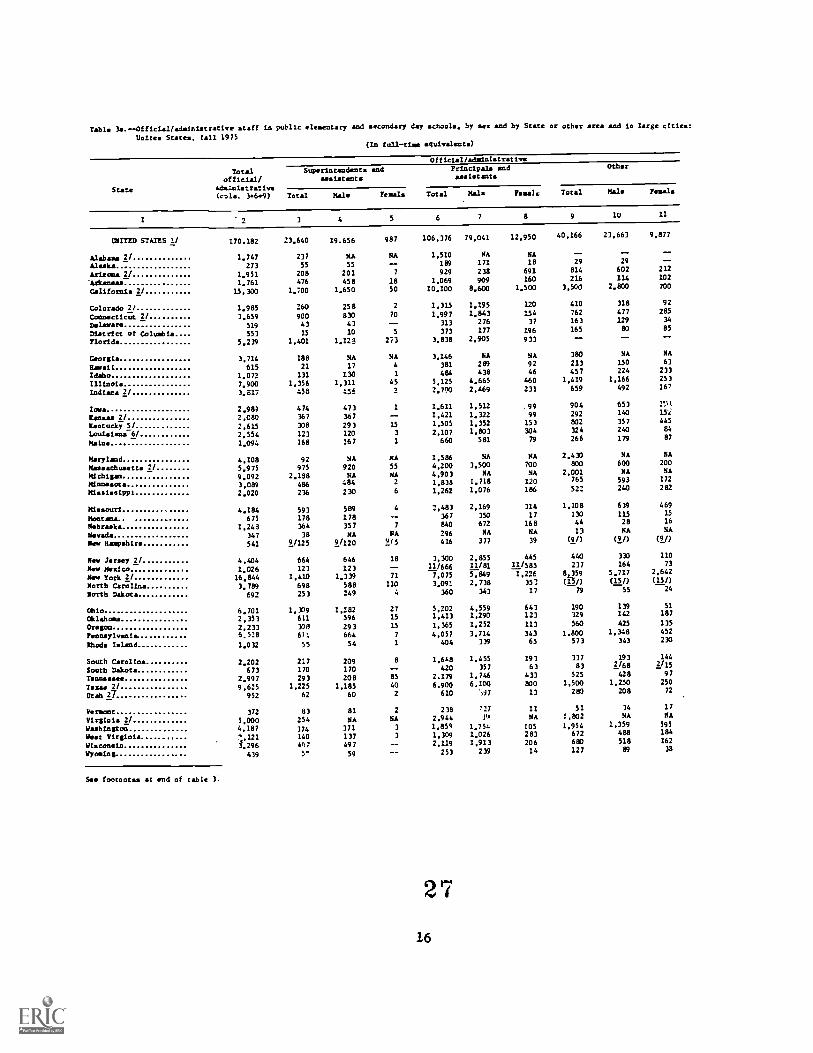
Table la.--Officialfanainiarrativo staff in public elementary and secondary day schools, by sex and by State or other area and in large cities:Un1tes States. fall 1975
(In full-tisa equivalents)
Off icia1/a4sainistrativeTotal Superintendents end Principals and Other
of f icial/ assistants assistantsState adsthistrative
Total Male Female Total Male Female(cols. 1+6+9) Total Male female
1 3 4 5
MIT= STATES 21
Mahan. 2//auksArizona 2/ArkansasCalifornia 2/
Colorado 21Connecticut 2/DalevaraDistrict of coltngdaFlorida
GeorgiaflamaiiIdahoIllinoisIndiana 2/
ZoeteILIslass 2/Kentucky 5/Louisiana 6/Maine
MarylandMassachusetts 2/MichiganMinnasotaMississippi
MissouriMontana..NebraskaNevadaNew Haspsbire
New Jersey 21SW MaltaNay York 2/North CarolinaNorth Dakota
OhioCalahcaesOregonPennsylvania.Rhode Island
South Caroltha .South DakotaTennesseeTexas 2/Utah 27
VersantVirginia 2/WashingtonWest VirginiaWisconsinWyoming
170.182
1.747273
1,9511,761
15,300
1,9853,659
519553
5,239
3,714615
1.0727,9003.817
2.9892,0802,6152,5541,094
4,1085.9759,0923,0992.020
4.284675
1,248347542
4,4041.026
16,8443,799
692
6.7022,3532,2336.5282,032
2,202673
2,9979,625
952
3725,0004,1871,1211,296
439
23.640
23755
208476
1.700
26090043IS
2,401
18821
2311,356
458
474367308123169
92
2,918785
486236
593178364
389/225
664123
1,415698253
1,309611
6397!
55
217170293
1,22562
83254374140497
5^
19.656
NA55
202458
1.650
25 8830
1.1241053
NA
17130
1,311458
47336729 3120267
NA
920NA
484230
589178357NA
9/220
646123
1.339588249
1,28259629 366454
209
1.211057598
60
81NA
371137497
59
987
NA-7
1850
270-5
273
NA41
452
1-15
3
1
NA
55NA
26
4-7
NA
215
18-71
1104
271515
7
1
a-8540
2
2NA
33
--
Sas footnotes at end of table 3.
6
106,376
1,510
1.091629959
10.100
1,3151,997
313373
3,838
,1463381484
5.1252.700
1.611,4211
1:1067460
41;250086
4.9031,8381,262
.7,483367840296414
3,30011/666
7,0753.091
360
5,2021,4131,3654,057
404
1,648420
62:510079
610
238
12,895494
1,3092,119
253
2 7
16
7 8 9 11
79,041
NA
171238909
8,600
1,1951,843
276177
2,905
NA
289438
4.6652,469
1,5121.322
1.g1581
mm88
NA
1,7181,076
2,169350672
NA
377
2,85511/815,8492,738
343
4,5591,2901,2523,714
339
1.455357
16:170046
,97
727
1,75114A
1.0261,913
239
12,950
NA18
691160
1.500
120154
37196933
NA9246
460231
9999
153304
79
NA700NA
120186
31417
168NA
39
44511/5851,226
35717
643123113343
65
19363
43380013
11NA
1052 8320614
40,166
-29
814216
3,500
410762163165-380213457
1,419659
904292802324
80022..042063016
765522
1,1081304413
(9/)
5,...43254°37)
(15/)79
190329560
1.800573
33783
5251.500
280
511,8021,954
672690127
23,663
-29
602114
2.800
318477129
80-NA
150224
1,166492
653140357240179
NA600
NA593
115
NA
(9622:39)8
333164
5.717(15/)
123441/113962445398528335
4281,250
208
34
1,35N9A488518
89
9.877
--212102700
92285
3485-NA
63233253167
21151445
8487
NA
200NA
172282
4691516NA
(9/)
11073
2.642(15/3
24
51187135452230
1442/is
97250
72
17NA
595184162la

Table U.Official/administrative staff in public elementary and secondary day chools, by ses end by State or other area and in large cities:Unites States. fall 1975--Gontinued
(In full -time equivalents)
Official/AdministrativeTotal Superintendents and Principals and
official/ assistants Assistants OtherOther area administrativeand city (cols. 34-6.9) Total male Female Total Male Female Total Male Female
1 2 3 4 5 6 7 8 9 10
OUTLYING AREAS:
American SamoaCanal ZoneGuamPuerto RicoVirgin Islands
55
44
94
1.627137
8
5
8
218
4
6
4
6
NANA
2
1
2
NANA
39
2265
1.22569
36
21
37NANA
3
1
28
NAHA
8
11
21
184
64
7
II
10
NANA
1
6
11NANA
DOD Overseas Schools N 0 It E P 0 It TTrust Territory of thePacific Islands N 0 R E P 0 R T
LARGE CITIES:
Baltimore. 74.1 896 10 NA NA 396 NA NA 490 NA NABoston. Kass 453 7 SA NA 300 NA NA 146 NA NAChicago. In 1.646 38 29 9 1.041 947 94 567 466 101Cleveland. Ohio 326 6 5 1 105 166 139 2/15 2/10 2/52allas. Tex 499 24 20 4 214 185 29 261 181 -80
Detroit. Mich 1.041 190 NA SA 580 KA NA 271 NA NAHouston. Tex 669 12 11 1 388 229 159 269 133 136Indianapolis. Ind 486 9 8 1 178 130 48 299 94 205Los Angeles. Calif. 2/ 1.500 30 25 5 1.160 1.030 130 310 280 30Keephis. Tenn 386 14 13 1 202 163 39 170 101 69
Milwaukee. Wig 657 6 6 -- 318 261 57 333 229 104New Or1earls, La. 6/ 451 14 12 2 199 115 84 40 31New Yank, 8.8. 2/ 5.565 83 56 27 2.646 1.911 735 2.836 1.562 1.2/4Philadelpvia. Pa 483 14 12 2 447 355 92 22 21 1Phoenix. Aria 014 45 43 2 267 68 199 302 223 79
St. Louis, Mo 171 11 11 -- 111 142 39 179 110 69San Antonio, Tex 140 10 10 100 57 43 30 24 6San Diego. Calif. 2/ 306 8 8 241 174 67 57 46 11San Francisco. Calif. 2/ 343 8 7 1 277 177 100 58 40 18
D.0 553 15 10 5 373 177 196 165 80 85
See footnotes at end of table 3.
28
17

Table 36.--Professional/educational and professional/other staff in public elementary and secondary day schools, by sex and by State or other area
and la large titles: Crated States, fall 1975
(In full-time equivalents)
State
Professional/educational Professional/other
Total Classroomprofessional! teachers Others Total
educational professional/(cols. 3+6) Total Male Female Total Male Female other Male Female
2 3 5 6 7 9 10 11
UNITFO STATES 1/ 2.154.316 3/2.2034089 682.640 1.340.842 151.227 50.378 86,949 54.481 15.606 30,692
Alabama '/ 36,675 36.675 8.568 28.107 -- - - -- 668 NA NA
Alaska 4,879 3/4.577 1.803 2.774 302 107 195 -- -- --
Arlfona 2/ 24.811 22.978 8.365 14.613 1.833 737 2.096 998 247 751
Arkansas 22,376 21.256 5.465 15.791 1.120 248 872 233 57 176
California 2/ 214.100 205.000 78,000 127.000 9.100 4.800 4.300 4.500 1.580 2.920
Colorado 2/ 29,750 26.750 10.050 16.700 3,000 1.500 1,500 1.750 875 875
Connecticut 2/ 39.111 35.673 13.638 22.035 3,438 4.320 2.118 550 350 200
Delaware 2/6,819 2/6.335 2/2.484 2/3.851 . "014 1/213 '/271m 2/338 2/68 2/270
District of Columbia. 7.322 6.642 1.413 5.229 i,d0 135 545 296 82 214
Florida 81.454 3/72.836 21.814 51.022 8.618 2.744 5.874 1.005 391 614
Ceotala 50,894 47.382 NA NA 3.512 NA NA 262 NA NA
Hawaii 8.646 7.860 1.791 6.067 786 242 544 -- -- --
Idaho 9.437 9.009 3.399 5.610 428 171 257 217 74 143
Illinois 122.927 3/113.589 39.861 73.728 9,338 3.784 5.554 4,149 1,427 2.722
Indiana 2/ 55.181 52.579 19.479 33.100 2.802 1.129 1.673 802 244 558
Iowa 34,825 33.100 12.350 20.750 1.725 764 961 353 9 344
Kansas 2/ 27.482 25.668 8.754 16,914 1.814 599 1,215 4)1 112 319
Kentucky 5/ 34,147 3/31,962 8.790 23.172 2,385 508 1,877 125 52 73
Loulsiana 6/ 43.593 41,054 9.934 31.120 2,539 737 1,802 1.649 819 830
Maine 13.995 12,304 5,247 7.057 1,691 562 1.129 285 38 247
Maryland 44.913 42,378 NA NA 2,535 NA NA 1.374 NA NA
Massachusetts 2/ 74.000 64.100 24.400 39.700 4.900 3.400 6,500 2,000 1.500 500
Michigan 97.297 89,847 NA NA 7,450 NA NA 3.438 NA NA
Mlnnesota 47,756 44,779 19.660 25.119 2,977 1.634 1.343 662 202 460
Mississippi 25.540 23,881 5.789 18.092 1,659 417 1.242 404 154 250
Miss -1 53,034 49.283 14.384 34,899 3,751 1.015 2.736 744 NA NA
Mont, a 9.640 3/9.052 3.753 5.299 598 292 306 NA NA NA
Nebraska 18.352 3/17.707 5.666 12.041 645 355 290 957 364 593
Nevada 6.151 5.750 2.210 3.540 403 NA NA 157 NA NA
New Hampshlre 9.7.6 8.775 3.143 5.635 971 511 458 365 184 181
New Jersey 2/ 88.410 80.410 28.650 51.760 8.000 3,470 4,530 4,210 45 3,325
New Mexico 13.866 1/12.883 4,550 8.333 983 330 653 12/210 1_,./7 12/203
New York 2/ 201.459 189.130 70.907 118.223 12.329 4.556 7.773 2.457 1,162 1,295
North Carolina 56.358 52.379 11,455 40.924 15/3.979 15/720 15/3.259 1.980 411 1.569
North Dakota 7.882 7.594 3,018 4.576 288 118 170 143 22 121
Ohio 113.283 31105.875 37.123 68.752 7.408 3,030 4.3783. 13:2
711 2.455
Oklahoma 31,072 29.762 8.440 20.822 1.310 420 890 175 189
Oregon 25.733 23.808 10.361 13.447 1.925 790 1.135 574 238 336
Pennsylvania 122.119 1/116.255 47.288 68.967 6.064 2.294 1.770 5.508 1.771 3.737
Rhode Island 9,619 9.196 3.427 5.769 423 59 364 436 212 224
South Carolina 31,248 3/28.695 5.929 22.766 2.551 507 2.046 705 125 580
South Dakota 8.464 8,083 2,796 5,287 381 2/314 2/67 28 2../23 2/5
Tennessee 42.346 19,855 9.892 29.963 2.541 305 2.236 164 15 149
Texas 2/ 150.990 143.390 33,625 109.765 7.600 2.000 5,600 1.500 75 1.425
Utah 2/ 13.272 11.900 5.032 6.868 1.372 493 879 178 71 107
Vermont 7,067 6.421 2.490 3.931 646 271 375 303 77 226
Virginia 2/ 58.330 58.330 13.810 44.520 -- -- -- 1,540 NA NA
Washington 36.-il 1/33.698 14.763 18.935 2.782 1.221 1.561 1.131 324 807
Vest Virginia 70,450 19.590 5.746 13.844 1.060 261 799 361 90 271
Ulsconsin 54.709 51.847 20.584 31.263 2.862 1,181 1.681 693 340 353
Wyoming 5.444 5.207 2.045 3.162 237 112 125 118 43 75
See footnotes et end of table 3.
2 9
18

Table 36.--Professional/educationai and professional/other staff in public elementary and secondary day schools, by sex and by State or other areaand in large cities: United States, fall 1975--Continued
(In full-time equivalents)
Other area andcity
Professional/educational Prafessional/otherTotal Classroom
professional/ teachers Others Totaleducational professional/(cols. 3+6)
ecTotal Male Female Total Male Female other, Male Female
2 3 4 5 6 7 8 9 10 11
OUTLYING AREAS:
American Samoa 347 342 185 157 5 1 4 42 25 17Canal Zone 563 406 132 274 157 51 106 52 17 35Guam 1.324 1,229 339 894 95 23 72 53 19 34Puerto Rico 26,667 25,796 NA NA 871 NA NA 403 NA NAVirgin Islands 1.537 1.408 NA NA 1:9 NA NA 66 NA NA
DOD Overseas Schools N 0 R E P o R TTrust Territory ot thePacific Islands N o R E P o R T
LARGE CITIES:
Baltimore. 94 8.206 7,865 NA NA 341 NA NA 23? NA NAWoston. Mass 5.256 4.240 1.055 2.683 1,016 NA NA 218 NA NAChicago. III 26.091 23.831 8.322 15.509 2.260 916 1,344 1,324 459 865Cleveland. Ohio 5.835 5,401 1,746 3.655 434 150 284 184 76 158Dallas, Tex 6.907 6.534 1,572 4,962 373 42 331 225 67 158
Detroit. Mich 10,203 9.411 NA NA 792 NA NA 459 NA NAHouston. Tex 10.70! 9.923 1.966 7,957 780 89 691 63 50 13Indianapolis. Ind 3,984 3.551 901 2.650 433 317 116 32 29 3Los Angeles. Calif. 2/ 30.800 29,400 10.200 19.200 1,400 900 500 580 300 280Memphis, Tenn 6.267 5,622 1.143 4,479 645 148 497 -- -- --
Milwaukee. Wis 5.810 5.553 1.922 3.631 257 132 125 160 90 70New Orleans, LA. 6/ 4.260 4,013 894 3.119 247 66 181 267 104 163New York. N.Y. 2/ 64.986 61.694 24.334 37,360 3.292
1'241.836 1,836 974 862
Philadelphia. Pa 14.557 14.013 5.056 8,957 544 417 1,346 473 573Phoenix. Ariz 8.552 7,934 2.888 5.046 618 248 370 339 84 255
St. Louis. No 4.235 3,747 888 2.859 488 87 401 2/159 2/37 2/122San Antonio, Tex 3,558 3.269 757 2,512 289 108 181 97 aSan Diego. Calif. 2/ 5.767 5,400 1.700 3.700 367 183 184 154 37 117San Francisco. Calif. 2/ 4.183 4,108 1,529 7,579 75 21 54 92 31 61Washington, D.0 7.322 6.642 1.413 5.229 680 135 545 296 82 214
See footnotes at end of table 3.
19

Table lc.--Nonprofessional staff in public elementary and secondary day schools, by sex and by State or other area and in large cities: United
States. fall 1975(In full-tine equivalents)
State
Nonprofessional
Total Teacher aides, Office/clerical All otber
non- assistants, and interns parsonnel nonprofessional
profeasional(cols. 146+9) Total Male Fecale Total Hale Female Total Male Female
2 3 6 7 8 9 10 11
UNITED STATES 1/ 1,297,118 244,125 6.766 136,517 196.747 7,347 115,561 856,250 238,784 268,764
Alabama 2/ 21,800 -- -- -- 2,760 NA NA 19,040 NA NA
Alaska 7.003 634 71 563 659 47 612 1,710 906 804
Arizona 2/ 18,875 3,104 122 2,982 2,981 58 2,923 12,790 5,764 7,026
Arkansas 14,125 1,866 74 1,792 1,917 26 1,891 10,342 5,228 5,114
California 2/ 135,800 41,200 NA NA 21,200 NA NA 73,400 NA NA
Colorado 2/ 21,515 5,000 -- $,000 5,064 -- 5,064 11,451 7,451 4,000
ConnecticZt 2/ NA NA NA NA NA NA NA NA NA NA
Delaware 2/7,774 2/850 2/70 2/820 2/769 2/6 2/767 2/2,155 2/997 2/1,158
District of Columbia 4,603 7/718 27133 2/585 854 103 751 7,071 1,879 1,152
Florida 51,948 11,267 125 10,942 10,626 362 10,264 30,055 12,909 17,146
Georgia 37,399 5.970 NA NA 5,018 NA NA 26,411 NA NA
Hawaii 3.556 522 35 487 716 19 717 2,298 835 1,463
Idaho 3,937 838 26 812 668 10 658 2,431 2,230 1.201
Illinois 63,466 11,197 560 10,637 12,673 253 12,420 39,596 21,778 17,818
Indiana 2/ 30,333 5,980 186 5,794 5,095 253 4,842 19,258 7,118 12,140
Iowa 23,015 2,947 295 2,652 3.947 79 7,868 16,121 8,061 8,060
Kansas 2/ 14,716 1,184 12 1,172 2,750 28 2,722 10,802 5,617 5,185
Kentucky 5/..... 22,898 1.942 48 1,894 2,776 64 2,712 18,180 6.036 12,144
Louisiana 6/ 31,403 5,218 100 5,118 3,278 95 3,183 22,907 5,040 17,867
Maine 2,338 1,493 107 1,390 845 6 839 NA NA NA
Mar/land 29,888 7/6,079 NA NA (7/) NA NA 23,809 NA NA
Massachusetts 2/- 30,500 4,500 1,000 7,500 6,000 1,000 5,000 20,000 12,000 8,000
Michigan 68,777 13,600 NA NA 5,867 NA MA 48,910 NA NA
Minnesota 27,623 5,873 229 5,644 3,362 22 7,740 18,388 8,900 9,488
Mississippi... ...... 18,989 2,983 71 2,912 1,806 18 1,788 14,200 5,805 8,395
Missouri 32,057 3,102 NA NA 6,238 NA NA 22,717 NA NA
Montana NA NA NA NA NA NA NA NA NA NA
Nebraska 9,764 1,511 NA NA 2,613 NA NA 5,540 NA NA
Nevada 3,248 425 NA NA 965 NA NA 1,858 NA NA
New Hampshire 2/1,999 2/99 2/21 2/78 2/1,700 2/600- 2/1,100 2/200 2/15 2/185
New Jersey 2/ 38,245 4,600 150 4,450 9,440 120 9,320 24,205 17.770 10,435
New Mexico 3,000 2/13/7,000 2/13/300 2/13/2,700 NA NA NA NA qA NA
N4w York 2/ 106,900 19,100 NA NA (14/) NA NA 14/87,800 NA NA
North CarOlina 32,209 7,832 lea 7,643 47704 144 4,560 19,673 6,668 13.005
North Dakota 3,940 526 28 498 722 49 573 2,692 1,556 1,136
Ohio 63,242 8,565 169 8,196 12,045 503 11,542 42,632 19,764 22,868
Oklahoma 16,965 2,174 10 2,164 2,809 50 2,759 11,982 8,777 3,645
Oregon 15,283 7,571 209 7,162 3.301 98 3,203 8,411 4,641 3.770
Pennsylvania 73.322 10,371 424 9,949 13,563 375 17,188 49.386 23.721 25,665
Rhode Island 3,548 876 22 854 554 26 528 2,118 1,291 827
South Carolina NA NA NA NA NA NA NA NA NA NA
South Dakota 4,900 1,250 37 1,213 3,650 1,487 2,163 -- -- --
Tennessee 25,786 4.338 219 4,119 3,126 862 2,264 18,722 9,894 8,428
Texas 2/ 76,000 19,000 900 18,100 12,000 400 11,600 45,000 15,900 29,100
Utah 27 7,171 2,300 52 1,248 1,292 23 1,259 4,579 2,253 2,326
Vermont 3,136 680 78 642 595 28 567 1,851 927 934
Virginia 2/ 35,409 7,709 NA NA 4,425 NA NA 23.275 NA NA
Washington 18,185 7,886 324 3,562 4,176 67 4,069 10,163 6,679 3,484
West Virginia 13,490 2,412 46 2.366 1,881 66 1,815 9,197 5,170 4,027
Wisconsin 22,737 2,046 NA NA 4,749 NA NA 15,942 NA NA
Wyoming 2,681 585 a 677 584 -- 584 1,412 644 768
See footnotes at end of table 3.
3120

Table 3c.--Nonprofeaslonal staff in public elementaryand secondary day schools, by sex and by
State or other area and in large cities: UnitedStates, fall 1975--Continued
(In full-rime equivalerts)
Other area andcity
NonprofessionalTotal Teacher aides. Office/clericalnon- assistants, and interns personnel
professional(cols. 3+6+9) Total male Female Total Male
All othernonprofessional
Female Total Male Female
1 2 3 4 5 6 7 8 9 10 11
OUTLYING AREAS:
/aerie= SamoaCanal ZoneGuamPuerto RicoVirgin Islands
60
123828732
938
--1
276123
230
----
54
NANA
--
1
222NANA
30
914
554
149
3
351
NANA
27
563
NANA
30
31
548
55
559
2931
247NAHA
1--
301
NANA
DOD Ov Schools.... N 0 R E e 8 TTrust Territory of thePacific Islands 0 T
LARGE CITIES:
Baltimore, Md 7,749 7/2.2442,201
NA NA (7/) NA NA 5.505 NA NABoston, Mass 3,114 NA NA 352 NA NA 561 NA NAChicago, Ill 17.594 3,870 193 3,677 1,788 36 1,752 11,936 6,565 5,371Cleveland. Ohio 4.458 1,157 39 1.118 904 46 858 2,397 1.127 1.270Dallas. Tex 5,796 1,053 16 1.007 895 89 806 3,848 1,549 2.299
Detroit, Mich 8,540 3.059 NA NA 903 NA NA 4.578 NA NAHousron, Tex 5,759 1.2,17 31 1,266 1,250 19 1.231 3.212 2.712 500Indianapolis, Ind 3.374 833 54 779 509 42 467 2,032 1.037 995Los Angeles. Calif. 2/ 20,600 8,000 NA NA 2.000 NA NA 10.600 NA NAMemphis. Tenn 3,714 286 27 259 663 -- 663 2.765 1.025 1.740
Milwaukee, Wis 4,440 1,880 NA NA 649 NA liN 1.911 NA HANew Orleans. La. 6/ 3,825 1.040 26 1,014 580 42 ..5.'i 2.205 836 1,369New York, N.Y. 2/ 31,295 6,207 NA NA (14/) NA NA 14/25,088 NA NAPhiladelphia, Pa 8,667 697 53 644 2.555 78 2.477 5,415 3.309 2.106Phoenix, Ariz 4,255 668 26 642 976 19 957 2.611 1.178 1.433
St. Louis. No 2,520 310 49 261 495 3: 461 1.715 929 786San Antonio, Tex 2,235 593 : 69 524 299 292 1,343 513 830San Diego. Calif. 2/ 3,600 1,200 NA NA 500 NA NA 1.900 NA mASan Francisco. Calif. 2/ 1,675 700 NA NA 400 NA NA 575 NA NAWashington, D.0 4,603 2/718 2/133 2/585 854 103 751 3.031 1,879 1,152
See footnotes at end of table 3.
21

Table 4.--Enrollment by organizational levol. fall 1975 and 1974, and average daily membership (ADM) and average daily attendance (ADA). 1975-76,in public elemencary and secondary day schools, by State or ocher area and in large cities: United States
State or ocher area Totaland city
Fall 1975
Elementary Secondary
PercentFall 1974 change 1975-76 school year
Total in totalmembership
Elementary Secondary. [minus (-) Estimated Estimateddenotes ADM ADAdecrease]
1 2 3 4 5 6 7 8 9 10
UNITED STATES
Alabama 3/AlaskaArizona 4/ArkansasCalifornia
ColoradoConnecticutDelaware 3/District of Columbia 3/Florida 3/
Georgia 8/Hawaii 37Idaho 37Illinois 4/Indiana 37
Iowa
KansasKentuckyLouisiana 4/Maine 4/
MarylandMassachusetts 4/Michigan 3/MinnesotaMississippi
MissouriMontana 4/NebraskaNevada 3/New Hampshire
New JerseyNew Mexico 3/New York 3f-North Carolina 4/North Dakota 3/-
OhioOklahomaOregonPennsylvania 3/Rhode Island
South Carolina 10/South Dakota 4/Tenn eeeee
Texas 3/Utah 3/
VermontVirginia 8/Washingcnn 3/West VirginiaWisconainWyoming 3/
1/44,838.490
'19,3461/89,295
5/492,995456,703
1/4,419,571
1/569,128652,449127,476
7/129,9691,551,373
1,090,292
176.430196,616
1/2.269,892
1,226,208
612,1111/448,0641/691,612847,202
250,931
880,9275/1,198,4101/2,073,288
879,944512,407
965,360171,788
1/315,669139,745174,597
5/1,458,000274,612
5/3,401,214
1,17t.9393Z
1/2,292.447594,816477,559
1/2,246,218176,317
1/629,729151,217876,926
1/2,812.888
309,708
104,8741,103,669785,449404.119964,21988,1 84
1125.692,214
384,9471151,09457349,831
242,7941/2,653.818
1/302.216403,49464,51272,019793,708
653,77193,34299.922
1/1.535.515653,891
322,2971/246,3281/429.258
592,479172,350
459,73151813,410
1/1,090.003426,779285,865
514,997114,646
1/167.44072.339103,392
5/924,000
133,6815/1,753.293
817,53759,829
1/1,365,523320,077274,099
1/1,128,946101,491
1/382.693
99,844537,793
1/1,517,060
163.453
63,090
63:58::02:
.:29,919
141,56344,140
1/19.146.276
374,3991138,2015/143,164213,909
1/1,765,753
266,912248,95562,96457,950
757,665
436,52183,08896,694
1/731,313572,317
289,8141/201,736
1/262,354254,72378,581
421,1965/385,0001/983,285453,165226,542
450,36357,142
1/148.22966.90671,205
5/534,000140,931
5/1,647,921367,45971,502
1/927,124
274,739203,460
1/1,117.27274,826
1/247,036
51.3'3339,133
1/1,295,828146,255
41,784
438,063386,624174,200422,65644,044
1145,053,272
764,34186,576
487,040454,406
4,427,443
568,060660,067130,616131,691
1,557,054
1,081,485177,030187,552
2,296,2411,186,800
617,485449,564701,373840,742250,643
894,2095/1,210.100
2,137,612889,535513,476
1,001,705172,158318,792137,051172,117
1/1,466.956282.382
3,435,8471,177,860
133,241
2,330,150
596,380476,583
2,277,447178,662
627,205153,592872,819
2,785,296306,388
105,3761,093,309785,457404,441974,33386,584
1/26,382.400
390,68548,306
346,599243.758
2,674,385
104,705408,60367,21474,789
809,271
673,20594,60991,060
1,572,145620,234
328,566243,296436,144
590,432174,439
474,53721836,500
9/1,448,345437,618289,164
541,709115,142170,80273,162102,760
936,862188,073
1,789,763818,59466,797
1,401,040322,253272,278
1,148,817105,000
380,927102,559535,256
1,516,829160,785
63,788661,661400,548228,656
553,96245,768
1/18,670,872
373.65638,270
111g,:11.18
1.753,058
263,355251.46463,40256,902747,783
408,280
:26,IT724,096566,566
288,919206,268265,229250,31076,204
419,6725/373,600v/689 267451,917224,312
459,99657,016147,99063.88969,357
530,09494,309
1,646,084359,26666,444
929,110274,127204,305
1,128.63073.662
246,27851,033337,563
1,268,467145,603
41,588431,648384,909175,785420,37140,816
3.11.2
.5
.2
-1.2-2.4-1.3
.8
4.8-1.13.3
-1.4.8
.1
-1.5
-3.0-1.1
-3.6
-1.02.01.4
-2.8-1.0
.6
-1.4
-1.6
.2
-1.4-1.3
.4
-1.5.5
1.01.1
.9
11/
7:1-1.01.8
2/44,100,057
751,828
4r9,111.096
433,8674,351,289
551,000651,020125,943128,409
1.554,907
1.064,634177,474
NA2,233,0001,145,216
294n:690,000826,220242,800
874,998NANA
879,944
507,465
NA171,800309,533137,900171,969
1,442,000274.612
3,373,3721,169,740131,068
2,253,957585,000457,434
2 ,227,100
167,501
628,410150,127878,159
2.729,993308,438
1,008;,:gg
778,390387.501918,11081,695
2/41,373,473
718.54Z;
460,042412,174
4,286,981
6/527,446604,440116,928116,938
1,461,613
988,872162,744183,760
2,033,2391,078,959
758,000!!!!!
792,017NA
1,967,600846,266479,554
866,987163,300294,295126,900161,669
1,309,000261,321
?:01.=126,734
2,096,180555,000426,328
2,057,200158,685
587,230144,091829,514
2,534,474290,320
99,6561,009,000728,040157,319861,31278,653
See footnotes at end of table.
3 3
2 2

Table 4.--Enrollment by organizational level, fall 1975 and 1974, and average daily membership (MK) and average daily attendance (ADA), 1975-76.
in public elementary and secondary day schools. by State or other area and in large cities: United States--Continued
Percent
Fall 1975 Fall 1974 change 1975-76 school year
State or other area Total Total in total
and City membership
Elementary Secondary Elementary Secondary [minus (-) Estimated Estimated
denotes ADM ADAdecrease)
1 2 3 4 5 6 7 8 9 10
OUTLYING AREAS:
American Samoa 4/ 10,119 8,022 2,097 10,186 8,013 2,173 NA NA
Canal Zone 3/ 10,887 5.9(4 4,923 11,311 6,260 5,051 -3,7 9,930 9,533
Goan 3/ 28,591 17,009 11,582 28,104 16,805 11.379 1.4 28.204 26,426
Puerto Rico 8/ 697,159 466,737 230.422 N 0 REPORT -- 716,430 646.150
Virgin Islands 3/ 24,512 15,844 8,668 23,343 15,493 7,850 5.0 24,500 22,880
U.S. Ove Schools... N 0 R E P 0 R T
Trust Territory ofthe Pacific Islands.... N o R E P 0 R T
LARGE CITIES:
Ba1timore, Md. 3/ 166,370 90,172 76,198 173.198 95,324 77,874 -3.9 166,080 137.819
Boscon. Mass.4/ 5/85,070 5/61.910 5/23.160 87,185 64,466 22,719 -2.4 NA NA
Chicago. III. 4/ 12/526,716 12/374,883 12/151,833 12/536.657 12/387.211 12/149,446 -1.9 525,600 443,687
Cleveland Ohio 128,127 69,713 58,814 134.997 72.604 62,393 -5.1 122,471 109,830
Dallas. Tex. 8/ 151.187 92.661 58.326 151.215 106.698 44,517 11/ 137,709 131,285
Detroit. Mich. 3/ 248.007 145,439 102,568 263.011 143.770 119.241 NA 234,021
Houston. Tex. fT 208,681 114,930 93.751 211,369 117.143 94,226 -1.3 202,760 190,938
Indianapolis, Ind. 3/ 84,884 46,400 38,484 87.642 48,692 38,950 -3.1 79,630 72,361
Los Angeles, Calif. 3/ 608,998 326.550 282,448 607.206 324.182 283,024 .3 594,300 585,500
Memphis. Tenn. 8/ 116,831 70,489 46,342 115.846 60,535 55.311 .8 118,171 110,582
Milwaukee, Wis 115,676 63,242 52.434 118,856 64.849 54,007 -2.7 107,115 95,211
New Orleans, La. 4/ 94,079 65,646 28,433 95.738 67.817 27,921 -1.7 89,500 77,000
New York, N.Y. 3/ 5/1.085.807 5/569,265 5/516.542 1,094,859 577,224 517,635 -.8 1,067,022 888,082
Philadelphia. P. 3/ 265,674 139.921 125,753 266.044 140,477 125,567 -.1 262.550 223,168
Phoenix, Ariz. 4/ 5/175.111 5/124.259 5/50.852 173.003 121,209 51.794 1.2 173,809 163.382
St. Louis. Mo. 4/ 87.854 61.781 26.073 90.511 62,798 27,713 -2.9 84,909 76,006
San Antonio. Tex. 3/ 67,632 36,666 30,966 68.708 37,552 31,156 -1.6 65,825 61.757
San Diego. Calif. 121,953 65,170 56.783 123,214 66,178 57,036 -1.0 120,879 119,093
San Francisco, Calif. 3/ 70.133 34.913 35,220 72,475 15.892 36,583 -3.2 68,393 67,382
Washington, D.C. 3/ 7/129,969 72,019 57,950 131,691 74,789 56,902 -1.3 128,409 116,933
I/ Revised from previously published data.2/ NCES imputations for nonreporting States comprise approximately 10 percent of national total in column 9 and 3 percent in column 10.
'I/ Data are reported by specific grade group: K to 6 for elementary and 7 to 12 for secondary.
-4-/ Data are reported by specific grade group: K co 8 for elementary and 9 co 12 for secondary.
5/ pit& eetimated by reporting State..6-/ Represents ADA as of October 1975, estimate is not for entire school year 1975-76.
7/ Does not include 462 special education students receiving tuition grants and 169 pre-school students.
8/ Data are reported by specific grade group: K to 7 for elementary and 8 to 12 for secondary.
Distribution estimated by NCES.
10/ Columns 2, 3. 9, and 10 include enrollment for all kindergartens, State supported as well as federally End locally funded.Kindergarten im not part of the official enrollment in South Carolina. Information provided is compatible with previous
years' reporting.11/ Less than 0.05 percent.
12/ Chicago school system has an ungraded 1-8 program. Reported enrollments on this form were derived by using age as the
determining factor for count by grade.
NA Not available.
34
23

Table 5. --Enrollment in public elementary and secondary day schools.
Preprimary through grade 8
Total N-8,including
State or other area Total elementary Pre- First Second Third Fourth Fifth Sixth Seventhand city ungraded primaryl/ grade grade grade grade grade grade gradeand
specialeducation
2 3 4 5 6 7 8 9 10 11
UNITED STATES
AlabamaAlaskaArizona 4/ArkansasCalifornia
ColoradoConnecticutDelawareDistrict of ColumbiaFlorida
GeorgiaHawaiiIdahoIllinoisIndiana
IowaKACS30KentuckyLouisianaMaine
MarylandMIssachusetts 4/MichiganMinnesotaMississippi
MissouriMontanaNebraskaNevadaNew Hampshire
New Jersey 4/New MexicoNew York 4/North CarolinaNorth Dakota
Ohio
OklahomaOtegonPennsylvaniaRhode Island
South CarolinaSouth DakotaTennesseeTexasUtah
VermontVirginiaWashingtonWest VirginiaWisconsinWyoming
OUTLYING AREAS:
American SamoaCanal ZaneGuamPuerto RicoVirgin Islands
DOD Ov eeeeee Schools
Trust Territory ofthe Pacific Islands
2/44.838,490
759,1462/89.295492,995456,703
214,419,511
2/569,128652,449127,476
5/129,9691.551,373
1,090,292176,430196,616
2/2.269,8921,226.208
612,1112 /448_ . 064
2/691,612847,202250,931
880,9271.198,410
2/2.073,288879.944
512,407
965,360171,788
2/315,669139,745174,597
1,458,000274,612
1.01,2141.284,996
131,331
2/2,292,647
594,816477,559
2/2,246,218176,317
2/629,729151,217876,926
2/2,812,838309.708
104,874
1,103,669785,449404,119964,21988,184
30,544.746
520,40564.574349,831317,458
2,992,901
383,879449.78784.38994,105
1,061,282
750,505120,621133,335
1,538,579851,386
408,460293,673475,098592,479172,350
606,512813,410
1.418,905572,827356,234
645,886114,646210,44595,761120,195
998,000183,144
2,281,458817,53783,747
1,535,447
408,378321,449
1,480,733121,297
443,431
99,844626,230
1,991,629212,452
73,452
75,,305530,116283,044625,14958,784
2,946.189
--6,63734,86623,172
328,239
41.63450,0688,74611,57299,868
34,56013,68610,373181,60877,389
46,48717,292
t;',1:,!
17,692
63,21582,430167,77962.9631,509
68,0139,96524,7229,7705,251
109,0003,630
234,69358,4893,128
176,402
43,25720,333164,87112,210
9/29,35510,43054,977186,91525,531
5,14274,83557,67627,62177,2856,557
3.241.787
(471,r51
38,01835,564325,352
41,16945,8728,79310,165114,151
91,59313,00615,621117,95188,864
40,93832,56658,77566,01918,273
52.76585,020149,50158,71145,402
68,41012,46922,18510,26614,902
100,00020.434246,28692,2809,056
155,781
44,72038,059154,34411,197
46,5239,93770,918
215,48823,943
8.03185,75458,86532,22961,9226,492
3,035.225
56,2726,35134,17732,754
303,934
38,63242,6397,8679,137
107,351
83,08412,21314,463111,79384,804
39,08930,17352,52159,79917,096
50,79280,330141,81856,02038,915
62,53711,61120,7039,09212,996
98,00019,652234,87187,5048,465
142,198
41,15734,588
146,00710,527
44,3749,62364,575202,65222,573
7,63981,059
54,35829,26961,1266.046
3,047,590
1:55n35,52032,804
301,382
38,25043.6247,7828,991
108,910
82,79212,11414,174111,81689,162
39,50730.51051,89159,70017,863
51,76885.110141,94856,58538,624
64,07511,63920.6529,38812,725
101,00019,845235,73787,2489,059
142.03340,45934,347
147,84611,212
44,4679,53264,361199,88122,483
7,36877,23954,17728.77162,2205,904
3,128,397
58,2706,75936,17033,814
105.654
38,05145,3918,1779,400
114,147
84.63812,55014,147
115,14394,776
40,67631,09253,30261,22717,969
54,89288,940143,91358,02539.667
66,50411,87321,3759,74613,065
104,00020,182
245,53588,0729,313
146,44740,64234,592152,21211,451
45,93010,06466,088202,44121.718
7,82079,74554,19029,25863.4175,925
3,290.227
61,7096,99438.15236,127322,160
40,91648.1338,8909,838
120,238
819f,,,
121.08994,181
43,18133,63455,89763.75719,364
58,10092,840149,70961,36941,851
70,67012.64422,77510,66413,661
109,00021,721253,27093,50210,021
154,53943.20136,147
159,42812,150
49.24310,82570,447215,57822,157
8,18384,82057,38930,68566,1656,409
3.478,206
64,6877,468
40,01438,801341,254
43,65349,9999,6739,500
129,044
93,43513,43615,444
130,60394,903
46,46633,91859,39668,36219,929
62.39796,350158,08565,88543.628
75.59613,51824,22011,14613,992
114,00023,349261,11599,20010,787
165,04047,29637,893168,85812,522
53,00811,86575,045229,89923,057
8,92090,45362,17032,02470,0966,807
3,621,927
677:nill
44:84349,136
46,09850,88910,04511,061133,083
94,60013,64216,293135,65199,842
49,63236,48861,19970,61120,803
75.01699.830
163,83972,03147,549
78,84014,39625,53911,34915,409
115,00024.707267,275101,63111,915
175.57250,15840,179175,37414,562
54,76912,89275,742
237,48224,103
9,06591,70164,75133,26673,8737,256
10,11910,88728,591
697,15924,512
8,0227,672
21,311466.737
19,697
1,970960
2.87418,409
1.966
N 0
N 0
789931--
63,870
2.397
REPORTREPORT
809824
--62,897
2,136
705749
--65,653
2.153
718750
2,189
65,934
2,268
745
8792,277
65.6152,092
757
8712,15961,9341,993
722
877
2,15962,4252.214
See footnotes at end of table.
3 5
24

by grade level and by State or other area and in large cities: United Statas, fall 1975
Preprimarv through grade 8--Con. Grades 9-12 and postgraduates
Total 9-12including
Elemen- Second-POSt-
Elemen- tary ary
tary specialgraduates. special
Eighthsecondary
educa- Ninth Tenth Eleventh Twelfth Post Secondary educe- State or other areaungraded
grade graded tionand special
grade grade grade grade graduates ungraded tion and city
education
12 13 14 15 16 17 18 19 20 21 22 23
3.638.264
67.5107.613
42.16n39.980356.259
46.57450.0549.832
11.025134.491
96.73413.63717.120137.59697.653
51.02438.35060.56869.23120.788
71,79997.590165.06374.53246,161
80.40714.97626.36311.57515.020
114.00024.756260.890103.25112,003
179.274
50.75741.774176.413
14.521
54.12313.19073.897
237,08724.896
9,17893.69966.54032.49576.4387.388
586,246
----
4.204282459
5.25611,921
--
2,743(6/)
--
--
--336.65229.812
6,5662.109
--
--
55.123
4,920--77
3.773
--55
1.911--
2.338
13.000
57,961
----
.--
7/7,967
10,247363--
26,634--
1.108----
765--
--
530,688
3/27,3131.5155.1533.59658.872
3.6443/11.197
4.584
673
(6/)
--3,357
94538.677(6/)
4,8947.5419.39721.5772.573
10.645--
3/37,2506,6299.155
10,8341,500--
2.767
1,036
21.0004,868
41,7866.360
(6/)
40,200
6.7313.53735,3802,978
3/11.3921.12310,18037.5721.991
998----
6.66112.607
--
14.293.744
238.94124.721143,164139,245
1.426.670
185.249202,66243.08735,864
490,091
339,78755.80963.281731.313374.822
203,651154.391216.514254,72378,581
274.415385.000654.383307,117156.173
319.47457,142105.22443,98254.202
460.00091.468
1.119.756367.45947,584
757.200
186.438156.110765,48555,020
186.29851.373250,696821.25997,256
31,422344,364255.333121,075339.07029.400
3,876.779
68.7887,390
40.80738.563368.831
47,61355,19311.34810,695140.295
96,93414,15117.105196.553101.945
53.16839.36362.77272.80021.593
73.785
102.340177.40977,731
46.331
85.90314.89628,14911.72015,089
125,00025,558300.993107.06612,494
197,708
52.05842.146193.355
15.636
56.48013.45770.885242,73525.182
8.58692.52368,26432.71987,1217,553
3,724,173
63,3086,71537.60836,838362.118
48.08352.40210,2929,464
135,547
88.01013.83616.650189,55095,918
51.67040.43056.49065,25720.556
72,18198.720173,53877.99041.396
83.64614.81427.37211.19214.158
118.00024,856299.797101.30712.103
192.96248,83341.378194,492
14.213
50.37013.21366.352220,43624.422
8,08686,22566.82530.71486.4237,417
3.349.498
56.8285,85933,26932,679331.633
44.47848.5309,5867,054
117,043
73,73912.95915.403171.46188,063
49,14738.33550.02556.84318,792
62.88387.850158.74175,42834.426
76,28213.98125.80110,40913.023
108,00021,935256,20884,60611.912
180.05344.87237.691179.74312,686
41,36012.49259.411190.58323,364
7.41075,88462.63927,90083.4966.703
2.984.260
50.0174,75729.02428.277288.319
39.53144,5938.8485,923
97.206
62.22811.75213.755148.87978.389
43,63034,26944,01549,92916.718
57.56582.930143,40569.21029.004
67.93212.804
23.2478.81611.638
100.00019.119226,53673,90411.075
162.609
39.13633.522
168,27411.451
38.08811,68052.935
167.50521,492
6.80069,39557.60525.61174,8906,023
22.560
16
837--
--
--
----
4.322139
--
--NA--93
--
13,1601.290----
--1
----
28
1,000--NA----
343
----
388
9
191
77
161
--47231
2
72.889
----789
17244,747
3.7841,107
--1,976
(60
------
R.604.1
i0.3i,8
504
----
134
----343
878
--108655
--29
2,000
3.034
------
8/376
--4
----
16
----256
263.585
(3/)
--
1,6672,71631,022
1,744(3/)
3.013752
(6/)
18,8763.111
36818.939(5/)
5,532
13,929112
9,894
829
7,867
(3fl
6.4154.138
5.711
538
1.;7, 5
237
6,000--
36.222576
(6/)
20,491
l'3;93
29.233649
(3/)
3361.113--
2.796
447
20.176--.
3,6597.1091,446
UNITED STATES
AlabamaAlaskaArizonaArkansasCalifornia
ColoradoConnecticutDelawareDistrict of ColumbiaFlorida
GeorgiaHawai4IdahoIllinoisIndiana
Iowa
IFl :::::ky
LoulsianaMaine
Maryland
MinnesotaMississippi
MissouriMontano
ifli=::ka
New Hampshire
New JerseyNew MexicoNew YorkNorth CarolinaNorth Dakota
Ohio
(131:1414:78
PennsylvaniaRhode Island
South CarolinaSouth DakotaTenn eeeeTexasUtah
VermontVirginiaWashingtonWest VirginiaWisconsinWyoming
OUTLYING AREAS:
American SamoaCanal ZoneGuamPuerto RicoVirgin Islands
DOD Overseas SchoolsTrust Territory ofthe Pacific Islands
727
831
2.14356.5081.639
--
--6.880--427
80
--630--
412
N
N
2.0973,2157,280
230.4224.815
0
0
642
9142.00352,0391,560
R
R
477
7682.060
47.7551,218
E P
E P
552
749
1.75238.4321.055
0 R
0 R
402
6821.26631.200
786
T
T
-- 24
102
1994.488
196
3 6'
25

Table 5.-- Enrollment in public elementary and secondary day schools.
Preprimarv through grade 8Total U-8,includingelementary
State or other area Total ungraded Pre- First Second Third Fourth Fifth Sixth Seventhand city and primaryl/ grade grade grade grade grade grade gradespecialeducation
1 2 3 4 5 6 7 8 9 10 11LARGE CITIES
Baltimore, Md 166.370 118.707 12.894 10.213 9.448 9,679 10,701 11,134 11.256 15.225Boston, Mass 4/ 85.070 61,910 9.610 6.315 5.945 6.225 6,565 6,565 6,585 6.765Chicago. III 526,716 374.883 48.323 (1_0/) (10/) (10/) (10/) (10/) (10/) (10/)Cleveland. Ohio 128,127 88.251 12.203 9,970 8.880 8,686 8.754 9.131 9,102 9.593Dallas. Tex 151.187 105,052 10,073 11,585 12.662 11.240 11,508 11.786 11.532 12,475Detroit. Mich 248.007 183.176 23.038 20,115 20,382 19.106 18.943 18.565 18.645 19.193Houston, TeX 208.681 150.541 15.964 17,155 15,950 15,982 35,859 16.874 17.146 17.634Inditnapolis. Ind 84.884 59.554 6,540 6,321 5.762 5.727 5.630 6.255 6.583 6.645Los Angeles. Calif 608.998 416.811 46.662 48.627 44.850 43,738 44.261 45.267 46.467 44.462Memphis. Tenn 116.831 80.323 7.374 9.413 8,615 8.123 8,418 9.036 9.756 9,754Milwaukee. Dis 115.676 78,772 11.280 7.923 7,534 8,947 7,853 7,933 8,070 8.308New Oreleans. La 94,079 65,646 6.065 7.023 6.749 7.059 7.230 7,380 7.352 7.591New York. N.Y. 4/ 1.085.809 725.701 71.945 81.837 78,054 78.139 81.845 83.000 81.181 81.528Philadelphia. Pa 265.674 180,051 23,197 19,170 17,613 18.104 18.293 18.638 19.386 20.253Phoenix. Ariz. 4/ 175,111 124.259 12.384 13.504 12,140 12.617 12.847 13.552 14.213 14.701St. Louis. Mu 87,854 61,781 6.021 8.121 6,032 5.740 6.995 6.849 6.759 6.387San Antonio. Tex 67,632 47.380 4.633 5.279 4,944 4.677 4.849 5.124 5,347 5.396San Diego, Calif 121.953 84.618 9,654 9,473 8,683 8.520 8.529 8,900 9,640 9.753San Francisco. Calif 70,133 45,500 5.169 5.042 4.676 4.647 4.636 4,890 5,057 5.223Washington, D.0 5/19.969 94.105 11.572 10,165 9.137 8.991 9.400 9,838 9.500 11.061
1/ Data include nursery schools and kindergartens operated as part of the regular public school system.2/ Revised from previously published data.3/ Data for column 22 included in column 14.
Data estimated by reporting State.5/ Does not include 462 tuition grant students (special education) and 169 pre-school students in regular budget.T/ Elementary and secondary ungraded and/or special education pupils are distributed in other grades.71 Includes 3.614 primary pupils; 4.108 intermediate pupils; 236 English
- secondary - language pupils; and 9 ungraded pupils.Includes 82 bilingual pupils and 49 English - secondary - language pupils. Data also include 245 ungraded pupils.
-4/ Includes enrollment for all kindergartens. State supported as well as Federally and locally funded. Kindergarten enrollmentis not part of the official enrollment in South Carolina.Information provided is compatible with previous year's reporting.10/ Chicago school systems has an ungraded program f,Ir grades 1 through 8. Data for columns 5 to 12 are included in column 13.
NA Not available.
3 '7
26
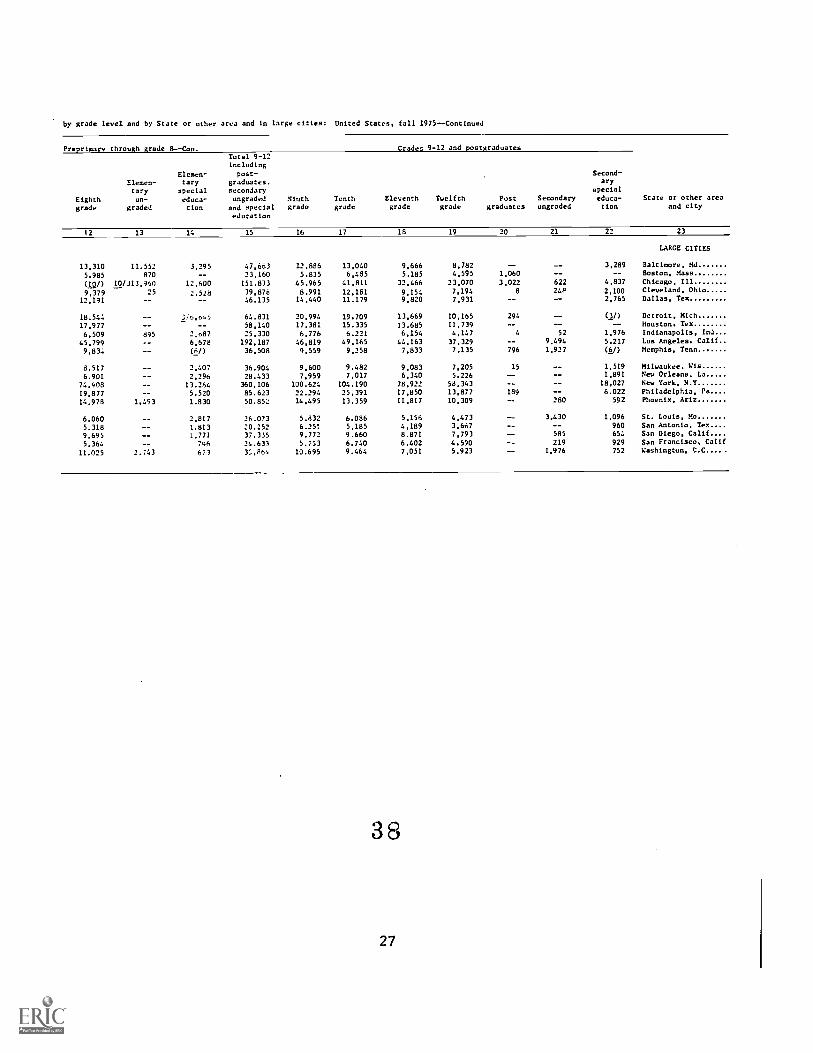
by grade level and by State or other area and in large cities: United States. fall 1975--Continued
Preprimary through gxade 8--Con. Grades 9-12 and postgraduatesTotal 9-12including
Elemen- post- Second-
Elemen- tary graduates. ary
tory special secondary special
Eighth un- educa- ungraded Ninth Tenth Eleventh Twelfth Post Secondary educa- State or other area
grade graded tion and special grade grade grade grade graduates ungraded tion and City
education
12 13 14 15 16 17 18 19 20 21 22 23
LARGE CITIES
13,310 11.552 3,295 47,663 12,886 13,040 9,666 8,282 -- -- 3,289 Baltimore, Md
5.985 870 -- 23,160 5,835 6,485 5,185 4,595 1,060 -- -- Roston, Mass
(100 10/313,960 12,600 151.833 45.965 41,811 32,466 23,070 3,022 622 4,837 Chicago, Ill
9,379 25 2.528 39,876 8.991 12,181 9,154 7,194 8 24? 2,100 Cleveland. Ohio
12,191 -- -- 46.135 14,440 11.179 9,820 7,931 -- -- 2.765 Dallas, Tex
18.544 2/6.645 64.831 20,994 19.709 13,669 10,165 294 -- (30 Detroit. Mich
17,977 -- 58,140 17.381 15.335 13.685 11,739 -- -- -- Houston. Tex
6.509 895 2.687 25,330 6,776 6.221 6,154 4,147 4 52 1,976 Indianapolis, Ina
45,799 6,678 192,187 46,819 49,165 44,163 37.329 -- 9.494 5.217 Los Angeles. Calif
9,833 (6/) 36,508 9,559 9,258 7,833 7,135 796 1,927 (6/) Memphis, Tenn
8.517 2,407 36.904 9.600 9.482 9,083 7,205 15 -- 1,519 Milwaukee. Wis
6.901 2,296 28.433 7,959 7,017 6,340 5.226 -- -- 1,891 New Orleans. La
74.908 13.264 360,106 100.624 104.190 78,922 58.343 -- -- 18,027 New Yor6.. N.Y
19,877 5.520 85.623 22.294 25.391 17,850 13,877 189 -- 6.022 Philadelphia, Pa
14.978 1.493 1.830 50.852 14.495 13.359 11,817 10,309 -- 280 592 Phoenix, Ariz
6.060 2,817 26.073 5.832 6.086 5,156 4,473 3,430 1,096 St. Louis, MD
5.318 1.813 20.252 6.251 5,185 4,189 3,667 -- 960 San Antonio, Tex
9.695 1,771 37.335 9.772 9.660 8.871 7,793 585 654 San Diego, Calif
5.364 796 24.633 5.753 6.740 6.402 4.590 219 929 San Francisco, Calif
11.025 2.743 673 3:"...864 10.695 9.464 7,051 5.923 1,976 752 Washington, E.C.... .
3 8
27
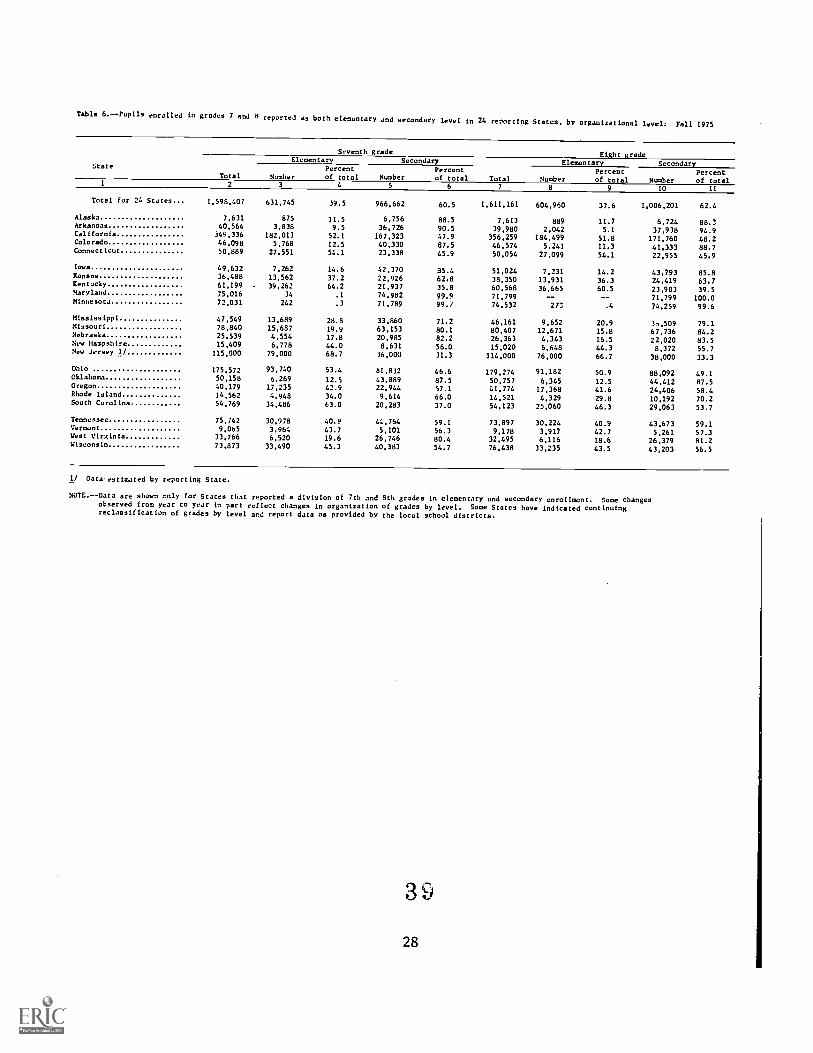
Table 6.--Pupils enrolled in grades 7 and 8 reported as both elementary and secondary levelin 24 reporting States. by organizational level: Fall 1975
State
Seventh_grade Eight grade
Torl
Elementary Secondary Elementary Secondary
NumberPercentof total Number
Percentof total Total Number
Percentof total Number
Percentof total
1 3 4 5 6 7 8 9 10 11
Total fur 24 States 1.598,407 631.145 39.5 966.662 60.5 1.611.161 604.960 37.6 1,006,201 62.4
Alaska 7,631 675 11.5 6,756 88.5 7.613 889 11.7 6,724 88.3Arkansas 40.564 3.838 9.5 36,726 90.5 39.980 2,042 5.1 37,938 94.9California 349,336 182,013 52.1 167,323 47.9 356,259 184.499 51.8 171,760 48.2Colorado 46,098 5.768 12.5 40,330 87.5 46.574 5,241 11.3 41,333 88.7Connecticut 50,889 27,551 54.1 23,338 45.9 50,054 27.099 54.1 22,955 45.9
Iowa 49,632 7.262 14.6 42.370 35.4 51.024 7,231 14.2 43,793 85.8Kansas 36.488 13.562 37.2 22.926 62.8 38,350 13,931 36.3 24,419 63.7Kentucky 61,199 39.262 64.2 21.937 35.8 60.568 36.665 60.5 23,903 39.5Maryland 75.016 34 .1 74.982 99.9 71.799 -- -- 71.799 100.0Minnesota 72,031 242 .3 71.789 99.7 74.532 273 .4 74.259 99.6
Mississippi 47.549 13.689 28.8 33.860 71.2 46,161 9,652 20.9 36.509 79.1Missouri 78,840 15.687 19.9 63.153 80.1 80.407 12.671 15.8 67.736 84.2Nebraska 25,539 4,554 17.8 20.985 82.2 26,363 4,343 16.5 22.020 83.5Sew Hampshire 15.409 6.778 44.0 8.631 56.0 15.020 6.648 44.3 8,372 55.7New Jersey 1/ 115.000 79.000 68.7 36.000 31.3 114.000 76.000 66.7 38.000 33.3
Ohio 175,572 93.740 53.4 81,832 46.6 179.274 91,182 50.9 88.092 49.1Oklahoma 50.158 6.269 12.5 43.889 87.5 50.757 6.345 12.5 44.412 87.5Oregon 40,179 17,235 42.9 22.944 57.1 11,774 17,368 41.6 24,406 58.4Rhode Island 14,562 4.948 34.0 9.614 66.0 14,521 4.329 29.8 10,192 70.2South Carolina 54,769 34,486 63.0 20,283 37.0 54.123 25.060 46.3 29.063 53.7
Tennessee 75.742 30.978 40.9 44.764 59.1 73.897 30,224 40.9 43.673 59.1Vermont 9.065 3,964 43.7 5.101 56.3 9.178 3.917 42.7 5.261 57.3West Virginia 33.266 6,520 19.6 26,746 80.4 32,495 6,116 18.8 26,379 81.2Wisconsin 73.873 33.490 45.3 40.383 54.7 76.438 33,235 43.5 43,203 56.5
1/ Data estimated by reporting State.
NOTE.--Data are shown only for States that reported a division of 7th and 8th grades in elementary and secondary enrollment. Some changesobserved from year to year in part reflect changes in organization of grades by level. Some States have indicated continuingreclassification of grades by level and report data as provided by the local school districts.
3 .9
28

------- ngr:r1 g9n9n
A4eig.9:7idg mg e:.-.1g2e:
v.ege4p. .r.14.9'4`4 224g2 ..... 2:1E:14 ev.:gc.e2r. 7.1gne,.
E.Aulq qqaj. gAiiu 11E..1.1;1
rr;g--g grnri!4.1 ie4;i.n;
E qUAR RHAF, 5..EXCA FeElkU. qiiqU. PIAUI E.E.E.kk
. IzII
`42,14,'M
22erig
484"
.1:74222 r4.9:1.
kaAq FA'01-1.F. qqqlq
qEAEAn-fP11.

Table 8.--High school comPleticns. 1974-75. old graduates of regular day school programs, by sax and by State or other area and in large cities;United States, 1974-75 and 1973,74
Srata or other areaand city
Total publichigh schoolcompletions,
1974-75
(sum of cols,3 thru 5)
Personsgranted
high schoolequivalencycertificate,
1974-75
Graduatesfromother
programs.1974-75
Crsduatts of regular day school programa
Percent
changeIn totalgraduatesof regularday schoolprograms(minus (-)denotes
decrease)
1974-75 1973-74
Total Boys Girls Total Boys Girls
2 4 5 6 7 8 9 10 11
UNITED sTATES
AlabamaAlaskaArlsonaArkansasCalifornia
ColoradoConnecticatDelawareDistrict of ColumbiaFlorida
GeorgiaHawaiiIdaho
IllinoisIndiana
104.4
K4CM4SLentuck4LouisianaMaine
MarylandMassachusettsMichiganMinnesotaMisslosippi
MissouriMontanaNebraskaNevadaNew Hampshire
Neu JerseyNew MexicoNew YorkNorth CarolinaNorth Dakota
OhioOklahomaOregon
PennsylvaniaRhode Islancl. .
South Caroline .
South DakotaTennesseeTexasUtah
VermontVirginiaWashingtooWest VirginiaWisconsinWyoming
3,085.000
58,4085,65713.39129,297
294,651
40.04451,5119.1545.615
99,070
68,70113.07513,439
5/157.12379,886
46.19137,50348.21054,16214,830
62,2001/79,000
115.06n71,22072,851
68,51014,16721.9247,232
12,650
1146,00918.438
1/29506170,0 44
11,627
160,16412,02214014174.62411,049
45,115.1,28356.187
159,48711,392
7,14174.11956.45028,82271.9246.171
225,585
12.2752.4374,7262,4615.392
5.0816.282
612
NA12,589
8,900
--762
1/15,8071.671
1,186
5,1455.8426,471
.4
5,805NA-
4,119
5,608
6,1352,074
1,675NA
1,600
----
J/41,649
NA917
4605/4.2114,27111.1002,007
t/2,8511,5637,024-
464
6368,419
5,4604,191
452
523
16,392
----
NA--
15,848
--
4,457287
248--
--
1,792
46
5/NA
2,113
NA
987NA
451566--
NA
NA
NA
5/1,2;-7
NA
I,s:5
NA
111,952
1.160
-491NA
1/2,823.023
46,6334,22025,66526,836
1/213,411
34,96341,792
8,2355.36786,481
59.80311.28312,611
1/141,3161/74,002
41.00531,45842,16847,691
14,830
55,4085/79.000115_509
66.53527,241
62,315
12.249
1:::::4/11,050
1/.46,10o0
18,418
1/211,26770,094
10,691
158,1795/37,809
30,668
1/161.12411,042
2118,31211,72549,363159,48719.668
6,45565,57050,99024,631
70.9795,648
1/1.384053
22,5182,14012,89?13,405
133.653
17,438
21,105
3.990
2,16842,809
28,6975.6276,337
2/69,81136,824
21.43515,77720,80322,5827.288
5/23,1,n10
66,25371,91812,949
31,0986.145
11,119
3,735
5,318
.i/47,213
2/1094,r767
34,103
5,264
77,88819,06615.354
81,6665.302
18,725
5,90721.59179,5004,874
3,20731.015
22,15012,263
)4.4652,882
1/1,433,670
24,1152.08012,77313,431119,758
17,52521.6874,245
3.19943,672
31.1065,6566,294
2171,50537,178
21.57016.681
21,56525,1097.542
18,8675/19,50069,25633.617
14,294
31,2776,14811,130
',47.9372
1/48,7879,372
1/106,690
35,991
5.426
80,29118,74315.314
81,4585,740
19,5875,818
25.77279,9879,794
3,24814,55525,64012.16836,1142,766
112,163,314
45.5024,248
24.92424,384268,491
34,35339,1718,1655,54074.830
58,02611,42612,776
139,10473.377
43,50831,37441,15146,80814.491
54,11878,000134.33663,98125,664
62,18112,11522,2766.90,9,492
1/1/91=
207,41369.06210,824
153,87436,77030,806
1/159,93411,117
8/18,83711,89449,641156,98418,898
6,3166).846iIII611
L:::,4111
,104/1
J,7"60
111,162.565
22,8612,19017,525
12;498131.532
17,17718.5673,970
2/2 206_ .
37,041
27,6975,7046,327
68,59916,651
21,65916,86520,25522,3451,075
26,07539,00066,422
M93:16
30,886
.7/614,0116
1/,:/46.208
8,4182/102,669
33,679
5,408
76,37318,56015,130
1/79,870
5,426
2/18.692
5,98523,68178,1259,612
3,16950,08525,86212,50634,2422.950
111.400,749
22,6412,05812,39912,086
136,961
17,17620.6044,195
2/333437,789
300295.7226,449
70.505
16.724
21,84916.509
21,05624,4637,416
28,05339,000
61;:(9);D.
11,158
36,(2):TO
11.1533,397
2/2:::::::
8,946
2/104,74435,3815,416
77,501
18,21015,676
uso,0645,691
2120,1455,90925,96078.859
9,286
3,147
33,76126,00612,89535,099
2,810
2.2
2.5-.73.0
10.11.8
1.8
9.2.9
-3.115.6
3.1
-1.3-1.11.6
.9
-1.2-2.72.5
1.9
2.3
2.41.3
4::
6.2
.31.3-.13.9
1:::6.21.9
1.5
-1.2
2.92.8
2.0
-1.4-1.4-.61.6
4.1
2.22.7
-1.7-3.02.4
-1.9
Set footnotes at end of table,
30
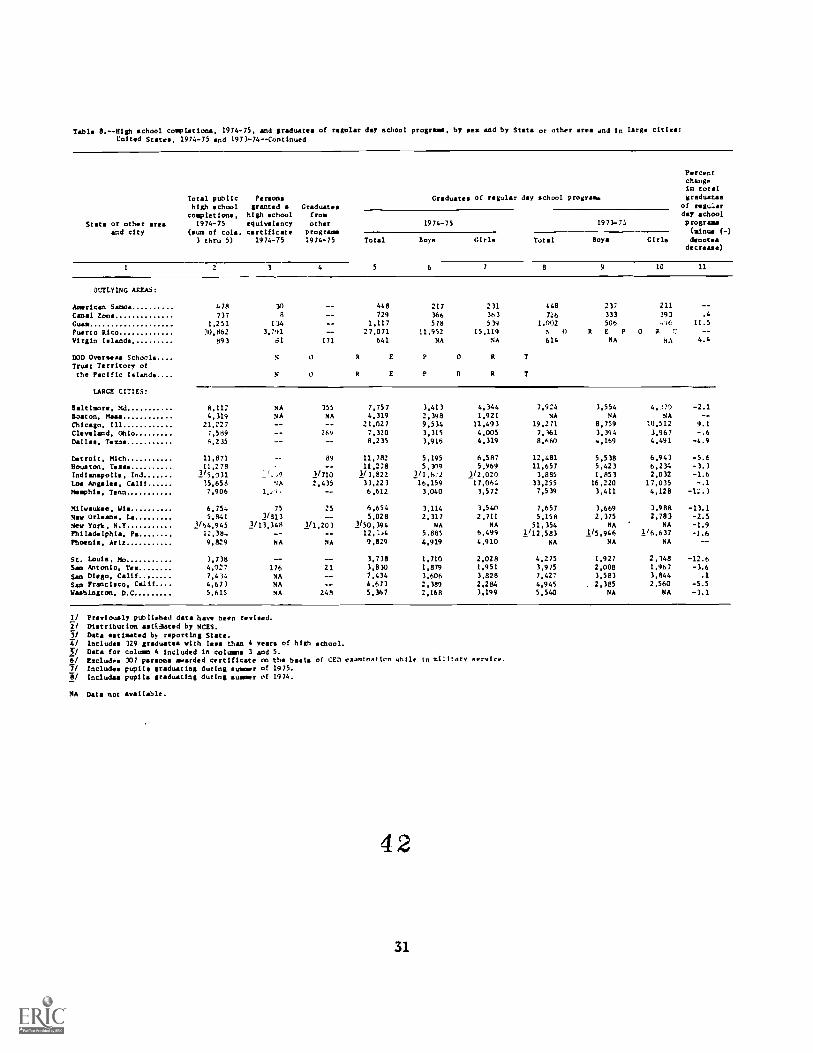
Table 8.--Nigh school complarima, 1974-75, and graduates of regular day school programa, by pex and by Scats or other area And in large cities:
enited States. 1974-75 and 1973-74-4Continued
State or other areaand city
Total public Personshigh school granted Graduatepcompletions. high ochool from
1974-75 equivalency other(pum of coll. certificate programs3 thru 5) 1974-75 1974-75
PercentchangeIn total
Graduates of regular day school program, graduatesof regu.1ar
Total
day school1974-75 1973-74 programa
(Liam (-)Boys Girls Total Boys Girls denotes
decrease)
2 3 4 5 6 7 9 10 II
OCTLYING AREAS:
American Samoa 478 30 448 217 231 448 237 211 --
Canal Zone 737 8 729 366 363 726 333 391 .4
Guam 1,251 134 -- 1.117 578 539 1.002 506 446 11.5
Puerto Rico 70,862 3.791 27.071 11,952 15.119 NO REPO a 7: --
Virgin Iolanda 893 61 171 641 NA NA 614 NA NA 4.4
D3D Overseas Schools 9 0 8 E I, 0 It T
Trust Territory ofthe Pacific Islands N 0 R E P 0 T
LARGE CITIES:
Baltimore, Md 8.112 94 355 7,757 3.413 4.144 7,924 3,554 4.70 -2.1
Boaton, Mass 4,319 NA NA 4.319 2,398 1,921 NA NA NA --
Chicago, Ill 21,027 -- 21.027 9.534 11,493 19.271 8,759 10,512 9.1
Cleveland, Ohio 7,589 264 7,320 3,315 4,005 7,161 3.194 3.967
Dallas, Temsa 8,235 -- 8.235 3,916 4,319 8,660 4,169 4,491 -4.9
Detroit. Mich 11.871 89 11,782 5.195 6,587 12,481 5,538 6,943 -5.6Houston, Texas 11,278 -- 11,278 5,109 5.969 11,657 5,423 6,234 -3.3Indianapolie, Ind 1/5.031 -,9 3/710 3/3.822 3/1,6,2 3/2.020 3.885 1,853 2,032 -1.6
Los Angel... Calif 15.658 .i.... 2.435 33.223 16,159 17,064 33,255 16,220 17.015 -.I
Memphio, Tenn 7,906 1 -- 6,612 3,040 3.572 7,539 3,411 4,128 -12.3
Milwaukee. Wis 6,754 75 25 6,654 3.114 3,540 7,657 3,669 1.988 -13.1New Orleans, La 5,841 21813 5,028 2.317 2,711 5.158 2.375 2,783 -2.5
New York, N.Y 3/ 64,945 3/13.348 3/1,2(73 3/50,394 NA NA 51,354 NA NA -1.9
Philadelphia. P. 12,384 -- -- 12.134 5.885 6,499 2/12,583 1/5,946 1/6,637 -1.6
Phoenix, Aril 9,829 NA NA 9,829 4,919 4,910 NA NA NA --
St. Louis, Mo 3,738 -- -- 3,778 1,710 2,028 4,275 1,927 2.148 -12.6San Antonio. Tex 4,027 176 21 3.830 1,879 1,951 3,975 2,008 1,967 -3.6
San Diego, Callf 7,414 NA 7.434 3,606 3,828 7,427 3,583 3,844 .1
San Francipco, Calif 4,673 NA 4,671 2,389 2,284 4.945 2,385 2,560 -5.5Washington, D.0 5.615 NA 249 5.167 2,168 3,199 5,540 NA NA -3.1
If Previously published data have been revised.2/ Distribution esaaated by NCES.
Data estimated b., reporting State.-4/ Includes 329 graduates with Imo than 4 years of high school.
Data for column 4 included in columns 1 and 5.6/ Excludes 107 pvreons awarded certificate on the bests of CEO examinatIon while in military service.1/ Includes pupils graduating during sumer or 1975.if Includes pupils graduating during summer of 1974.
NA Data not available.
4 2
31
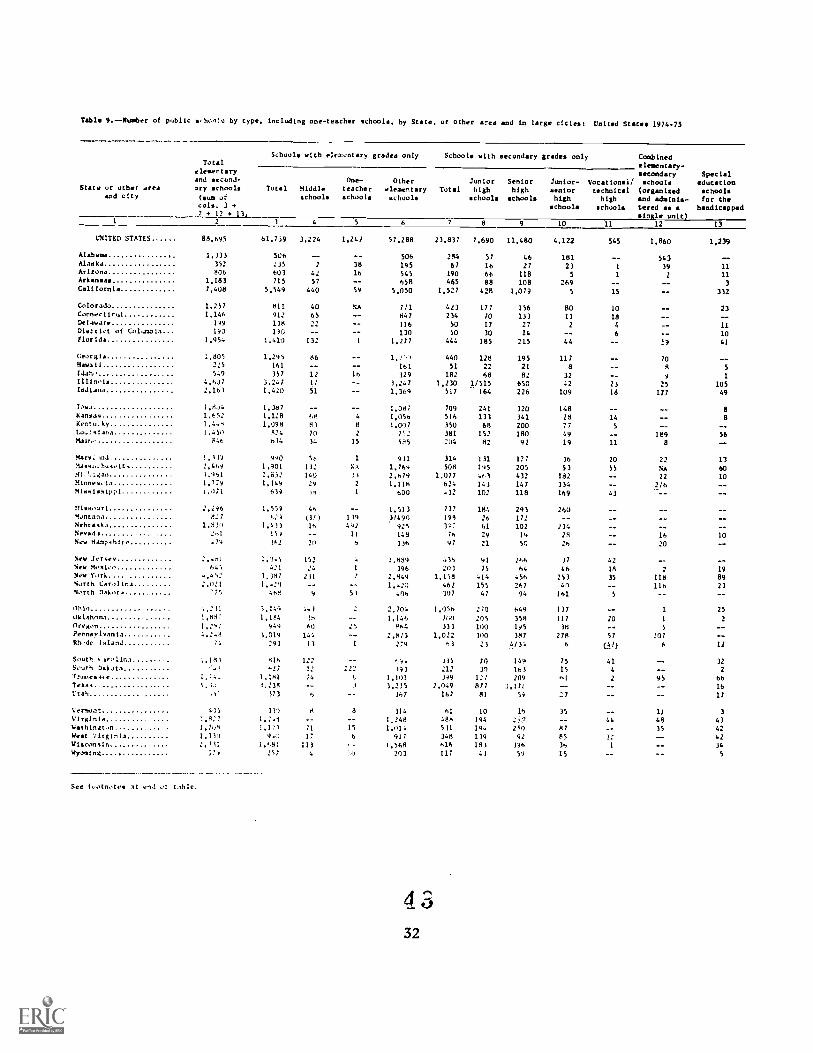
Table 9.--Nusiber ot public srhonio by type, including one-teacher schools, by State, or other area and ln large cities: United States 1974-25
Schools with elemontary gradea only Schools with secondary grades only CombinedTotal elementary-
elementary secondary Specialand second- One- Other Junior Senior Junior- Vocationsii schools education
State or other area ary schools Total Middle teacher elementary Total high high senior technical (organised schoolsaod city num of schools schools schools schools schools high high and adminis- for the
cols. 1 4, schools schools tered as a handicappad7 + 12 11r single unit)
2 1 4 5 6 7 8 9 10 11 12 11
UNITED STATES 88,695 61,759 3.224 1,24/ 57,288 23,837 7.690 11.480 4.122 545 1.860 1.239
Alabama 1,333 506 -- 506 284 57 46 181 543Alaska 352 235 18 195 67 16 27 21 1 39 Ti.Arizona 806 603 42 16 545 190 66 118 5 1 2Arkansas 1,181 715 57 658 465 88 108 269 -- 3California 7,408 5.549 440 59 5.050 1,527 428 1.079 5 15 -- 332
Colorado 1.257 tIll 40 NA 711 423 177 156 80 10 23Connecticut 1.141. 412 65 847 234 70 133 13 18 --Delaware 149 138 22 116 50 17 27 2 4 11District of Columbia 190 130 130 50 30 14 -- 6 10Florida 1,954 1,410 132 1 1,277 444 185 215 44 19 41
Georgia 1,805 1.295 86 1,21 440 128 195 111 10Hawaii 2:5 161 161 51 22 21 8 A 5Idan 549 357 12 lh 329 182 68 82 32 9 1
Illinois 4,607 3,247!./ 3.247 1,230 1./r654 650 42 23 25 105
Indiana 2.161 1.420 51 1.364 517 226 109 18 127 49
Iowa 1,804 1.087 1.087 709 241 320 148 8Kansas 1,652 1,118 68 4 1,056 516 133 341 28 14 8Kento.Ay 1,4.8 1,098 85 8 1,007 350 68 200 77 5 ..-
Lo.'1114.4 1.45n 424 70 2 71 381 152 180 49 189 56Main, S4t, 614 34 15 585 204 82 92 19 11 8 --
Mary md 1,139 940 SS 1 931 314 131 121 36 20 22 13Maliss,husett , 224644 1,901 II: NA 1.769 508 145 205 53 55 NA 60741 1l9.. 1,461 2,852 140 31 2,679 1,077 4e3 432 182 22 10Minnevo,1 1,779 1,149 29 2 1,118 624 143 147 334 1/6Mississippi ,,All 619 14 1 m00 432 102 118 169 43 --
Missouri 2.296 1.559 46 1.513 137 184 293 260Montan, 827 k:4 (3!) 114 3/490 194 26 172 --Nebrask, 1,830 1,433 16 442 925 197 61 102 234Nevada .......... .. 261 159 -- 11 148 Ih 29 19 28 16 10New Hampshire .74 36: 273 6 336 97 21 50 26 20
New Jersey 2,-81 2,245 152 . 1.989 436 91 266 17 42 --New Mexico 64% 421 24 1 396 201 75 64 46 18 2 19New York -.492 1.047 211 7 2.449 1.158 414 456 253 35 118 89North Cor,1 fro 2.021 1.420 1,4:0 462 155 267 40 Ilh 23North Dakota 121 464 9 51 306 307 47 94 161 5 --
0910 4,211 1,144 4.1 2 2.703 LOSS 270 649 137 1 25Oklahoma 3,687 1.104 39 1,146 71.40 205 358 117 20 1 2Oregon 1.2,1 939 60 25 P64 333 100 195 38 5
Pennsylvania :,2.11 1.019 144 2.915 1.022 100 387 278 57 20783,-de island 73 243 13 1 :74 63 21 4/34 3, 0/3 6 12
Sout6 ilrolina 1,143 1113. 122 4114 115 70 149 75 41 32South Dakota e27 12 :21 193 :12 31 161 IS 4'f,ment4ee 1.::2 1.181 74 1.101 399 1:7 209 Al 2 95 66TeXAY 5. 14, 1.:38 -. 3,235 2.049 877 '3,17: -- 16Utah .11 173 6 167 167 81 58 ..27 17
Vernon 4,15 131 8 8 114 4,1 10 16 15 11 3Virginia 3,8:7 1,2.0 1.248 488 194 ..ls17 41. 48 43bashington 1.764 1.1:11 71 15 1.014 531 194 250 87 35 42West lireion 1,310 9.3 17 6 917 348 139 42 85 42Wisconsin 2,,11 1..81 111 1,568 616 181 396 36 34wyoming 319 257 1,0 203 112 43 59 15 5
--_-_-., -+_-.- - .
See footnote, at en3 of t,h/e.
4 5
32

Table 9.--humber of public schools by type. including one-teacher schools, by State or other area and in large cities: United States 1974-75Continued
Schools with elementary grades only Schools with secondary grades only CombinedTotal elementary-
elementary secondary Specialand second- One- nther Junior Senior Junior Vocational/ schools education
State or other area aty ochools Total Middle teacher elementary Total high high senior technical (organized choolsand city (sum of achools schools schools schools school. high high and adminis- for the
cols. 3 + schools schools tered as a handicapped7 .1. 12 4- 13) single unit)
1 2 3 4 5 6 7 8 9 10 11 12 13
OUTLYING AREAS:
American Samoa 31 26 2 24 4 -- 4 -- 1Canal Zone 21 In -- 16 5 1 3
Guam 38 28 -- 28 9 6 2 -- 1 IPuerto Rico 1.958 1,700 2 259 1,439 255 129 94 23 9 3
Virgin Islands 32 25 -- 25 5 2 2 1 2
DOD Ov Schools... 0 R E P 0 R TTrust Territory ofthe Pacific Islands... N 0 R e P 0 R T
LARGE CITIES:
Baltimore, Rd 205 150 2 148 49 18 19 10 2 4 2
Boston, Mass 169 152 17 NA 135 30 5 18 2 5 NA 7
Chicago. 111 644 501 501 116 40 62 14 -- 27Cleveland, Ohlo 180 110 130 47 28 18 1 -- 3Dallas. Tex 184 141 5 136 42 20 22 -- 1
Detroit. Mich 248 220 220 77 49 23 -- 1
Houston. Tex 225 170 170 55 31 19 5 --Indianapolis, Ind 112 9,/ 1 98 11 -- 10 1 -- 2Los Angeles, Call' 626 440 440 165 75 90 -- -- 21
Memrhia. Tenn 171 104 104 63 27 19 17 -- 3 1
Milwaukee. Wis 161 125 -- 125 36 19 12 4 1 -- --New Orleans. La 141 87 7 80 43 22 19 2 -- 1 10New York, 8 Y 490 701 53 648 232 118 88 3 23 -- 57
Philadelphia. P. 278 151 10 141 57 21 25 11 70Phoenix. Ariz 196 153 7 148 27 10 26 -- 1 --
St. Louie. M. 160 114 1 133 1: 1 16 1 8San Antonio, Tex 69 83 17 63 8 -- 1 --San Diego, Cali( 160 125 125 35 18 17 -- NASan Francis,o. CAUL 130 100 39 61 29 16 10 1 1
Washington. 0 i 160 130 130 50 31 14 6 10
1/ Data for cclumn 4 Included ln column 8.3/ Include, 3 middle school% with 6-9 grade P4411 (total number of 9tb grade pupil's enrolled i, 783).3/ Date for column 4 Included in colteen 6.4/ Data for column 11 Included ln column 9.
MA Not available.
4 4
33

Table 10.--Eatimated revenue and nonrevenuc receipts for public elementery and secondaty education (rom Federal. State. intermediate. and localsources, by State or other area and in large cities: United States, 1975-76
State or other areaand city
Totalreceiptscols. 3and 12)(in thou-sands)
Revenue receipts by source (in thousand.) Percent of revenuereceir a by source Non-
revenuereceipt.(in thou-sands)
Total Federal Stateinter-mediate Local
Inter ..
State mediate Local
1 2 3 4 5 4 7 10 11 12
UNITED STATES S70.271,125 S67.136.937 S5,345.912 S29,321.594 5341.348 S32.128.083 6.0 41. .5 47.8 83,136,188
Alabama 870,615 858,774 1/138,308 545.029 175,437 16.) 61. , 20.4 11.841Alaska 242,881 232,881 35,157 151,201 -- 46.523 15.1 20.0 10.000Arizona 827,617 763.757 80.438 365.258 3.259 314,802 1.5 .7.8 .4 41.2 63,860Arkansas 523.196 472,634 73,361 246,733 152.540 15.5 52.2 32.3 50,762California 7.013.788 6.831.788 2/630.037 2,759,494 3,442.257 9.2 40.4 50.4 182,000
Colorado 900.000 880.000 60.000 350.000 NA 470.000 6.8 39.8 NA 53.4 20,000Connecticut 1.055.105 1,027.105 42.096 284,297 NA 700,712 4.1 27.7 NA 68.2 28.000Delaware 234,220 219.220 17.500 148.420 53,300 8.0 67.7 24.3 15.000District of Columbia 269.4:0 269.420 3/47,931 -- 3/221.489 17.8 -- 82.2 --Florida 2.127.104 2.097.669 130.328 1.145.103 822.238 6.2 54.6 39.2 29.635
Georgia 1.217.179 1.155,179 139.506 599.488 -- 416,185 12.1 51.9 36.0 62,000Hawaii 285.881 285.881 20.736 265.145 -- - - 7.3 92.7 -- --Idaho 254,673 225.721 24,599 111.788 6.542 82.794 10.9 49.5 2.9 36.7 28.950Wino!. 4,526,229 4,305,729 266,524 1,988.132 2.738 2,048.335 6.2 46.2 .1 47.6 220,500Indiana 4/1 536 000 1.501,000 85.000 610.000 6.000 800.000 5.7 40.6 .4 53.3 35,000
Iowa 1.068,405 1,042,898 48.162 1 .296 5/598.430 4.6 38.0 57.4 25,517Kansas 782,978 742,978 86,056 31 .598 331,324 11.6 43.8 44.6 40,000Kentucky 830.000 755,000 110.000 410.000 235.000 14.6 54.3 31.1 75,000Louisiana 1,059.000 942.000 165,000 525.000 252.000 17.5 55.7 26.8 117,000Maine 116.045 296.045 24.000 13..045 140.000 8.1 44.6 47.3 20.000
Narvlan4 1.512.559 1.498,541 84.918 592.661 820.962 5.7 39.5 54.8 14.018Nessachusetts 2.050.000 1.977.000 80.000 465.000 1,430,000 4.1 23.5 72.4 75,000Michigan 3.110.000 2.745,000 105.000 1.420.000 1,220,000 3.8 51.7 44.4 365.000Minnesota 1.505.000 1.425,000 79.000 780.000 6.000 560.000 5.5 54.7 .4 39.3 80.000Mississippi 511.585 502.919 106,474 276,523 119.922 21.2 55.0 23.8 8.666
Missouri 1.126.765 1.266.843 103.137 442.849 74.535 646,122 8.2 35.0 5.9 51.0 59,922Montana 251.700 247,800 15.000 142,800 17,800 72,200 6.1 57.6 7.2 29.1 5.900Nebraska 406.840 396,738 29.174 69.961 12,598 285.005 7.4 17.6 3.2 71.8 10.102Nevada 196.300 188,300 10.300 76.000 -- 102.000 5.5 40.4 -- 54.2 8.000New Hampshire 225,000 210,726 12,667 19,859 -- 178,200 6.0 9.4 -- 84.6 14,274
New Jersey 2.802.000 2.702.000 110,000 795,000 1.797.000 4.i 29.4 66.5 100.000New Mexico 390.134 369.595 76.136 234.245 59.214 20.6 63.4 16.0 20.539New York 7.677.000 7.577.000 351.000 3,023.000 4.203.000 4.6 39.9 55.5 100,000North Caroltua 1.491.649 1.454.389 190.193 964.196 300.000 13.1 66.3 20.6 37.260Notth Dakoti 191,400 186.400 13.500 90.900 16.000 66,000 7.2 48.8 8.6 35.4 5,000
Ohio 3,304,500 2.984.500 177,000 1.092.000 -- 1.715.500 5.9 36.6 -- 57.5 320.000Oklahoma 757.000 720.000 80.000 '60.000 35.000 245.000 11.1 50.0 4.9 34.0 37.000Oregon 735.000 715,000 42.000 207.000 123.000 343,000 5.9 29.0 17.2 48.0 20,000Pennsylvania 4.112.516 4.008.516 348.000 1,929.085 -- 1.731.431 8.7 48.1 -- 43.2 124.000Rhode laland 309.497 295.137 23,403 105.950 -- 165.784 7.9 35.9 -- 56.2 14.360
South Carolina 707.000 672,000 99,000 395.000 -- 178.000 14.7 58.8 26.5 35.000South Dakota 196.102 185.102 26,832 26.227 1.435 130.608 14.5 14.2 .e 70.6 11,000Tenn eeeee 991.898 902.798 99.850 478,448 -- 324,500 11.1 53.0 35.9 89,100Texas 4.013.248 3.713.799 384.818 1.862.462 9.273 1,457,246 10.4 50.2 .2 39.2 299.449Etall 403.440 368,700 27.153 213.390 -- 128.157 7.4 57.9 34.8 34,740
Vermont 182.287 166.287 9.990 49.000 107.297 6.0 29.5 64.5 16,000Virginia 1.438.636 1.416,994 155.348 434,168 827.478 11.0 30.6 58.4 21,642Washington 1.275.000 1.200.000 99,500 617.750 482.750 8.3 51.5 liC .2 75.000West Virginia 521.674 465.529 57.291 261.861 146.377 12.3 56.3 31.4 56.145Wisconsin 1.596.304 1,552.298 116.1)4 498,283 1.568 936.313 7.5 32.1 .1 60.3 44.006Wyoming 118055 118.355 8.155 38.949 25,500 45,651 6.9 32.9 21.6 38.6 --
See footnotes at end of table.
4 5
34
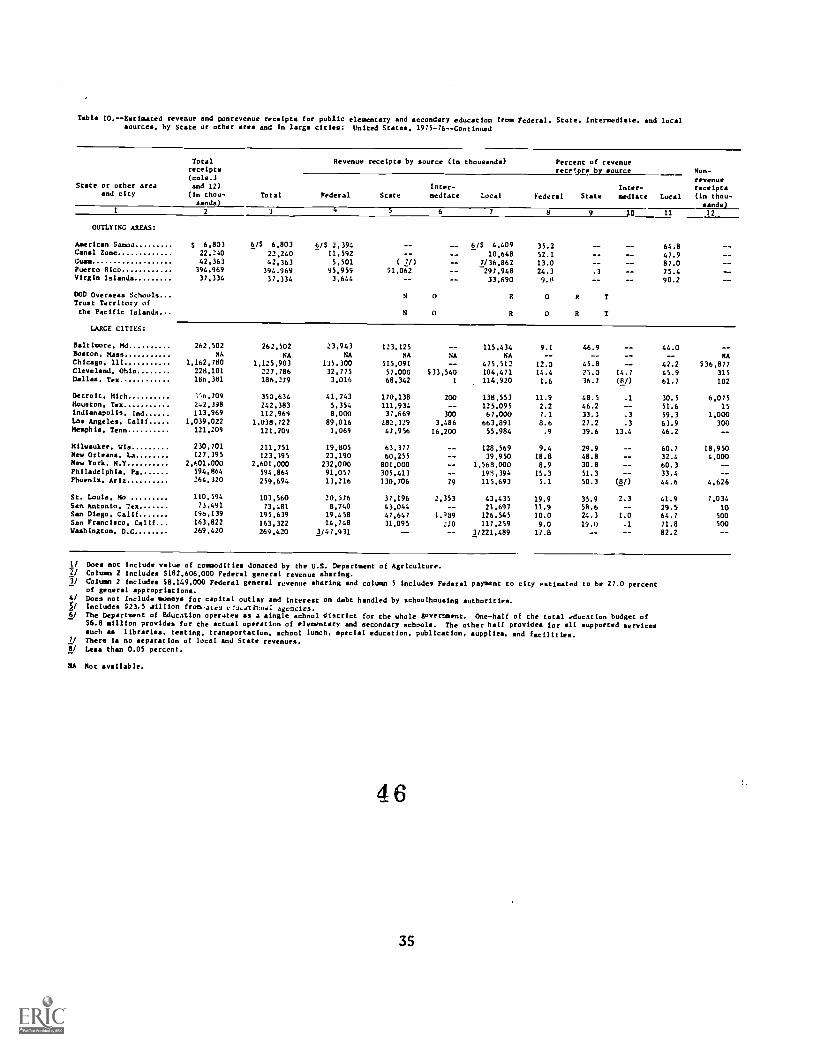
Table 10.--Estimated revenue and ponrevenue receipts for public elementary and secondary education from Federal, State, Intermediate, and localsources, by State or other area and in large cities: United States, 1975-76--Continued
State or other areaand city
Totalreceipts(cols.)and 12)(in thou-
sands)Total
Revenue receipts by source (in thousands) Percent of revenuerecrprs by source
Inter-mediate Local
Non-revenuereceipts(in thou-Federal Stste
Inter-mediate Local Federal State
2 3 4 5 6 7 8 9 10 11-111.1
12
OUTLYING AREAS:
American Samoa s 6.803 6/$ 6.803 6/$ 2,394 -- -- 6/$ 4.409 35.2 -- 64.8Canal Zone 22.240 22,240 11.592 -- -- 10,648 52.1 -- 47.9Guam 42.363 42.363 5.501 ( 7/) 7/36,862 13.0 -- 87.0Puerto Rico 394,969 394.969 95,959 $1.062 -297.948 24.3 .3 75.4Virgin Islands 37,334 37.334 3.644 -- 33.690 9.8 -- 90.2
DOD Ove ..... Schools N 0 R 0 R TTrust Territory ofthe Pacific Islands N 0 R 0 R T
LARGE CITIES:
Baltimore, :id 262,502 262,502 23.943 123.125 -- 115.434 9.1 46.9 44.0 --Boston, mass NA NA NA NA NA NA -- -- -- -- NAChicago, 111 1,162,780 1,125,903 135,300 515.091 -- 475.512 12.0 45.8 -- 42.2 $36.877Cleveland, Ohio 228,101 227,786 32.775 57.000 $33,540 104,471 14.4 25.0 14.7 45.9 315Dallas. Tex 186,381 186.279 3,016 68,342 1 114.920 1.6 36.7 (8/) 61.7 102
Detroit, Mich IM.709 350.634 41,743 170.138 200 138,553 11.9 48.5 .1 30.5 6,075Houston. Tex 242.398 242.383 5.354 111.934 -- 125.095 2.2 46.2 -- 51.6 15Indianapolis, Ind 113.969 112.969 8.000 37,669 300 67.000 7.1 33.3 .3 59.3 1,000Los Angeles. Calif 1,039.022 1.038.722 89.016 282.329 3,486 663.891 8.6 27.2 .3 63.9 300Memphis. Tenn 121,209 121.709 1.069 47.956 16.200 55.984 .9 39.6 13.4 46.2 --
Milwaukee, Wis 230,701 211.751 19.805 63,377 128.569 9.4 29.9 60.7 18,950New Orleans. La 127,395 123,395 23,190 60.255 39.950 18.8 48.8 -- 32.4 4,000New York, N.Y 2,601,000 2.601.000 232,000 801,000 -- 1.568.000 8.9 30.8 -- 60.3 --Philadelphia. Pa 594,864 594.864 91.057 305,413 -- 198,394 15.3 51.3 -- 33.4 --Phoenix. Ariz 264,320 259.694 13.216 130,706 79 115,693 5.1 50.3 (8/) 44.6 4,626
St. Louis. Mo 110,594 103.560 20.576 37.196 2.353 43.435 19.9 35.9 2.3 41.9 7.034San Antonio. Tex 71.491 73.481 8,740 43,044 -- 21.697 11.9 56.6 -- 29.5 10San Diego. Calif 196.139 195.639 19.458 47,647 1.989 126,545 10.0 24.3 1.0 64.7 500San Francisco. Calif 163,822 163.322 14,748 31,095 220 117.259 9.0 19.0 .1 71.8 500Washington. D.0 269.420 269.420 3/47.931 -- -- 3/221.489 17.8 -- -- 82.2 --
1/ Does not include value of commodities donated by the U.S. Department of Agriculture.2/ Column 2 includes S182.606,000 Federal general revenue sharing.5/ Column 2 includes $8,149,000 Federal general revenue sharing and column 5 includes Federal payment to city estimated to be 27.0 percent
of general appropriations.4/ Does not include moneys for capital outlay and interest on debt handled by schoolhousing authorities.5/ Includes $23.5 aillion fron,area elocattuual agencies.6/ The Department of Education operates as a single school district for the whole government. One-half of the total education budget of
$6.8 illion provides for the actual operation of elementary and secondary schools. The other half provides for all supported servicessuch as libraries, testing, transportation, school lunch, special education, publication, supplies, and facilities.
7/ There la no separation of local and State revenues.8/ Less than 0.05 percent.
NA Not available.
4 6
35

Table U.-Estimated expenditures for public elementary and secondary day schools, with major purpose, current expenditures per pupil, and averageannual salary of other professional/educational staff and classroom teachers, by State vr other area and in large cities: United States,1975-76
Expenditures (in thousa4ds)Annual current expenditure Average annual
per pupil In-- salary for--
State or other areasand city
Totalexpenditures
Current expendituresInterest
on
debt
Averagedaily
membership
Averagedaily Classroom
attendance teachers
Otherprofessional/educational
staff 3/
Elementaryand Other
secondary progrsmsday schools I/
Capital2/ outlay
1 2 3 4 5 6 7 8 9 10
UNITED STATES $67,102,569 $51,436,029 $1,711,704 $5,982,539 $1,970.297 4/51,302 4/51,388 4/5/512,448 5/113,967
Alabama 863,051 779,984 5,147 73.000 4,920 1,038 1,090 10.597 10,803Alaska 211,097 176.225 3,708 42,000 9,164 5/1,982 5/2,096 5/19,312 5/22.327
Arizona 801,446 650,850 NA 130.177 20,419 1.330 1,415 12.394 12,815
Arkansas 432.785 363,001 2.000 55,704 12.080 837 881 6/9,648 NACalifornia 6.595,727 5,660,100 422,300 319,790 193.537 5/1,301 5/1,320 15.200 15,960
Colorado 934.500 750.000 1,500 153,000 30,000 1,361 1,422 12,000 7/12,600
Connecticut 1.055.104 1,002.479 3.021 20,000 29.604 1,540 1.659 11,874 12,586
Delaware 212.610 187.750 1.800 15,000 8.060 1,491 1.606 12.545 14.016
District of Columbla 269.419 228.509 8/11.918 28.992 -- 1.780 1,954 15.297 16,098
Florida 2.587,248 2.018,772 8.382 515,340 44,754 1.298 1.381 10.496 NA
Ceoritla 1.217.237 1.101.337 17.000 73.900 45.000 1.035 1,114 10,622 10,847
Hawaii 285,881 251.461 8.562 24.833 1,025 1,417 1,545 15,209 16.059
Idaho 274.216 204.380 227 59.360 10.249 NA 1,112 10.212 11.969
Illinois 1.457.679 2.952,549 102,913 315.255 86.962 1.322 1.452 NA 9/14,216
Indiana 1.608,500 1.251.000 22.000 295.500 40,000 1.092 1,160 10/11,165 16/15,239
Iowa 946.711 817.966 -- 112.343 16.422 1,368 1.455 11.570 10,084
Kansas 666.894 618.614 400 38,340 9.540 5/1.386 5/1,475 10.710 11.115
Xentutky 705.000 633.000 3,000 43,000 26,000 917 986 9.770 12,662
Loaisian 919.100 820,000 4,100 71.000 24,000 993 1.082 6/10.092 11/15,639
Maine 104.000 272,000 8.000 18,000 6.000 1.120 1.197 10.620 14,126
Maryland 1,457.111 1.200,719 9.176 210.935 36,281 1,372 1.516 13.709 12/16.321
Massachusetts 1.988.200 1.710,000 23.200 100.000 155,000 NA NA 11,900 12.600
Michigan 1,108.125 2.668.125 38,000 290.000 92,000 NA 1,366 15,540 16,030
Minnesota 1.652.761 1.283,095 103,131 209.646 56,911 1.458 5/1,516 5/12,261 5/13.145
MIssissinpl 511.02h 478.109 1.506 26,711 4.500 941 997 9,114 9,649
Missouri 1.176.229 13/1.028.198 11/19.578 101.911 26,542 NA 1.186 10.490 11.06
Montana 268.300 253,700 -- 11,000 3.600 1.477 1,554 11.000 15,502
Nebraska 197.120 383.057 1,395 7.879 4,789 5/1.238 5/1,302 10.017 10.418
Nevada 186.500 160,000 2.500 15,000 9.000 1.160 1.261 5/12.716 5/13.400
New Hampshire 224,827 190.000 7,702 21,625 5,500 1.105 1.175 10.500 12,700
New Jersey 2.792.421 2,477.000 25.000 163,421 77.000 1.718 1.892 13,375 14.283
New Mastro 417.573 329.529 6,941 76.181 4,922 1,200 1.261 11.005 13.500
New York 7.384.536 6.916,954 219,900 300,000 241,682 1.962 2.179 14/15.950 14/18,900
North Carolina 1.537,904 1.221.579 157.045 145.980 13,000 1,044 1.099 11.165 11,312
North Daiwa 174.000 151.000 NA 18,000 3,000 1,167 1.207 9.888 10,688
Ohio 3.023.000 2.650.000 63.000 250.000 63.000 1,176 1,264 5/11.400 14.400
Oklahoma 708,600 627.000 11,000 63.000 7.600 1.072 1.130 9,600 9.700
Oregon 735.000 640.000 1.000 80.000 14.000 1.399 1.501 12.400 12.700
Pennsylvania 4.094,110 3.415.600 184.400 304.000 190.900 :,534 1.660 12.350 14,200
Rhode Island 271,561 234.935 500 16,233 21,895 1.403 1,481 13.381 13,701
South Carolina 701.000 605.000 9.300 70.000 16.500 963 1.030 9.904 10.360
South Dakota 184.571 157,656 1,544 23.261 2,110 1,050 1,094 9.314 10.573
Tennessee 494,701 803,691 13.500 141.750 35.760 915 969 10.299 10.470
Texas 1.294.078 2.772.485 .. 175,738 145.855 1,016 1.094 11,373 13,372
Utah 412,443 314.574 10.761 78.303 8.801 1.020 1.084 11.360 11.800
Vermont 163.024 139,336 5,504 14.021 4,191 1,342 1.398 9,975 10,300
Virginia 1.444.710 1.207.672 24,017 185.021 27.000 1.111 1,197 11.100 11,970
Washington 1.271.465 1,050.675 126.550 70.000 24.240 1.350 1,443 13.615 16.000
West Virglnla 485.309 393.400 3,641 79.646 8.622 1.015 1.071 10.480 10.764
Wisconsin 1,568,134 15/1.193.696 15/20.136 114.982 39.420 1,518 1.618 12.816 13.500
Wyoming 133.191 117.093 599 12.759 2.940 511.433 5/1.489 11.100 11.600
See footnotes at end of table.
4 7
36

Table 11.--Estimated expenditures for public elementary and secondary day schools, with major purpose, current expenditures per pupil, and averageannual salary of other professional/educational staff and classroom teachers, by State or other area and in large cities: United States,
1975-76-Continued
Expenditures (in thousands)Annual current expenditure
per pupil in--Average annualsalary for--
State or other areasand city
Current expenditures
Capitaloutlay
Interestondebt
Averagedaily
membership
Averagedaily
attendanceClassroomteachers
OtherProfessianal/educational
staff 3/
Totalexpenditures
Elementaryand
secondaryday schools
Otherprograma 2/
1/
1 2 4 5 6 8 9 10
OUTLYING AREAS:
American Samoa $ 6.803 S 3,265 S 3,538 -- NA NA $ 5.100 NA
Canal Zone 21,872 18,664 2.428 S 780 81,880 $1,958 NA $17,095
Guam 42.363 33.246 9.117 -- 1.179 1.258 14,554 17,101
Puerto Rico 403.308 368.774 20.234 14.300 515 571 7.472 9.007
Virgin Islands 33,965 32,964 1.001 -- 1.346 1.441 10,481 12,251
DOD Overseas Schools N 0 R E. 0 R T
Trust Territory ofthe Pacific Island N 0 R E 0 R T
LARGE CITIES:
Baltimore, `idBoston, Mass
247.798NA
221.714NA
2,068
NA
13,924
NA$10,092
NA1.335
NA1.609
NA
12,900NA
12/14.919NA
Chicago, Ill 1.162.780 861.396 62.461 204.239 34,684 1,639 1.941 9/16,722 NACleveland. Ohio 228.100 190.300 8.700 19,600 9.500 1.554 1.733 13.620 17,346
Dallas. Tex 203,134 172,265 1.528 14,973 14,368 1,251 1,312 13.500 15.900
Detroit, Mich 360.302 345.200 5.550 -- 9.552 NA 1,475 15,557 17.236
Houston, Tex 238.178 214.456 1.188 7.468 15,066 1.058 1,123 12,135 12,391
Indianapolis. Ind 113,000 102.010 2,500 8,000 490 1,281 1,410 11,000 15.000
Los Angeles, Calif 1,101,684 851.049 117.221 114,141 19.273 1.432 1.454 16.410 17.230
Memphis. Tenn 121.208 114.646 953 1,299 4.310 970 1.037 10.604 13,557
Milwaukee. Wis 259.995 209.159 6,250 41,415 3.171 1,953 2.197 15.003 15.700
New Orleans, La 122.625 111,110 290 6,005 5.020 1,244 1.446 6/10.399 11/17,316
New York. N.Y 2,551,718 2.226.705 115.400 136.300 73.313 2,087 2.507 14/18.200 14/21,600
Philadelphia, PI 608,881 543.629 14.597 20,926 29.729 2,071 2.436 15,664 16.200
Phoenix. Arlz 270.180 216.533 NA 47.786 5,861 1.246 1.125 11.868 12,285
St, Louis. No 110.494 105.130 4.425 267 672 1,238 1,383 12.000 18,000
San Antonio. Tex 73,327 64.915 597 3.558 4.257 1.020 1.120 11,440 15.180
San Diego. Calif 214.241 156.831 12.459 41,495 3.456 1,297 1.317 16,250 17.070
San Francisco, Calif 154.567 133.031 13,279 6,916 1.341 1,945 1.974 15.915 16,710
Washington, D.0 269.419 228.509 _H/11,918 28.992 -- 1,780 1,954 15.297 16,098
1/ Includes value of commodities donated by the C.S. Department of Agriculture.2/ Includes expenditures for summer schools, adult education. community services (such as public libraries operated by school districts,
expenditures for nonpublic schools where authorized by law. community centers, recreational activities, and community colleges and technicalinstitutions under the jurisdiction of local boards of education).
3/ Includes salaries of currlculum specialists, counselors. librarian/media and remedial specialists only. Salaries of classroom teachers,supervisors and principals are not included except as otherwise footnoted, The National computed average salary for column 10 represents
data for only those State, that reported both salaries and staff.4/ Data used by NCES in computing national averages for nonreporting States comprise approximately 10 percent imputations for column 7, 3 percent
for column 8, and 2 percent for column 9,5/ Revised from previously published data.
A/ Includes salaries of librarians and counselors.7/ Includes classroom teacher salaries.II/ Includes tuition grants of $2.8 million for special education students.
-29:/Includes all professional educational staff, excluding principals.
10/ Data are for school year 1974-75.11/ Includes only salaries for supervisors of instruction and special services employees.11/ Excludes curriculum specialist salaries.11/ Column 3 includes expenditures for adult programs and column 4 represents expenditures for community services only.
14/ Salary data reported as median salary.15/ Summer school expenditures are included in column 3 and column 4 does not include expenditures for State vocational technical and adult
education districts.
NA Not available.
48
37

APPENDIX
Survey Report Form
4 9
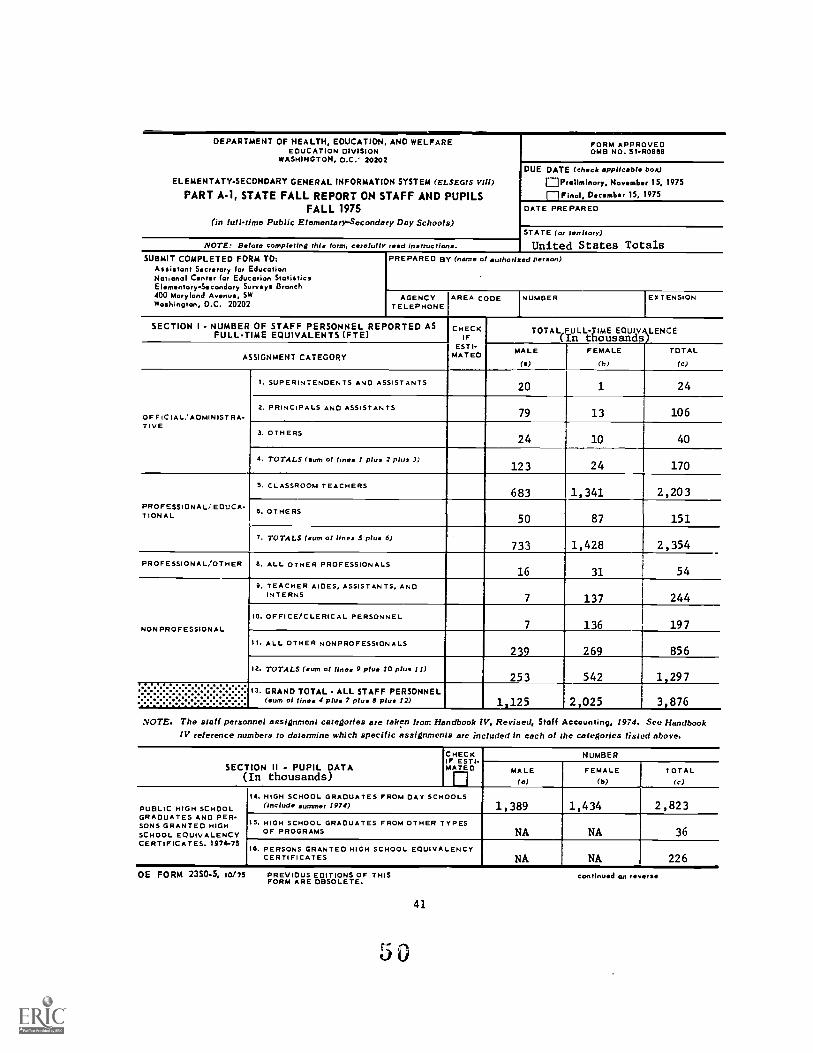
DEPARTMENT OF HEALTH, EDUCATION, AND WELFAREEDUCATION DIVISION
WASHINGTON, D.C. 20202
ELEMENTATYSECONDARY GENERAL INFORMATION SYSTEM (ELSEGIS VIII)
PART A.1, STATE FALL REPORT ON STAFF AND PUPILSFALL 1975
(in lulllime Public Elementary-Secondary Day Schools)
FORM APPROVEDOMB NO. 51-R0858
DUE DATE (check applicable bos)OPtellminary, Novernbet 15, 1975riFinal, Dectornbar 15, 1975
OATE PREPARED
STATE (or territory)
United States TotalsNOTE: Be Iote completing thle (onst, carefully read Instruction..
SUBMIT COMPLETED FORM TO:Assistant Se y far EducationNational Cantor far Education StatisticsElementary-Secondary Survys Branch400 Maryland Ayarnar, SWWashington, D.C. 20202
PREPARED BY (name oi whorised person)
AGENCYTELEPHONE
AREA COOE NUMBER EXTENSION
SECTION I NUMBER OF STAFF PERSONNEL REPORTED ASFULL-TIME EQUIVALENTS (FTE)
CHECKIF
ESTI-MATEO
TOTAL FULL-JIME EOULVALENCE(In thousands)
ASSIGNMENT CATEGORYMALE
(4)
FEMALE
(b)
TDTAL
(c)
OFFICIAL'ADMINISTRA-TIVE
1. SUPERINTENDENTS AND ASSISTANTS 20 1 24
2. PRINCIPALS AND ASSISTANTS79 13 106
3. OTHERS24 10 40
4. TOTALS (rum of lone. 1 plus 2 plus 3)123 24 170
PROFC55IDNAL/EDUCA-TIONAL
5. CLASSROOM TEACHERS683 1,341 2,203
OTHERS50 87 151
7. TOTALS (aum of tines .5 plug; 6)733 1,428 2,354
PROFESSIONAL/OTHER 6. ALL OTHER PROFESSIONALS16 31 54
NONPROFESSIONAL
9. TEACHER AIDES, ASSISTANTS, ANDINTERNS 137 244
10. OFFICE/CLERICAL PERSONNEL136 197
H. ALL OTHER NONPROFESSIONALS239 269 856
12. TOTALS (eons of fines 9 Nue 10 plus I I)253 542 1,297
.
13. GRAND TOTAL - ALL STAFF PERSONNEL(ion ol Ilne 4 Nue 7 plus 8 Plus 17) 1,125 2,025 3,876
:VOTE. The staff personnel assignment categories are taken from Handbook IV, Revised, Staff Accounting, 1973. See HandbookIV reference numbers to determine which specific assignments are included in each of the categories listed above.
SECTION II . PUPIL DATA(In thousands)
CHECKIF ESTI-MATED
0NUMBER
MALE(a)
FEMALE(b)
TOTAL(c)
PUBLIC HIGH SCHOOLGRADUATES AND PER-SONS GRANTED HIGHSCHOOL EQUIVALENCYCERTIFICATES. 1974-75
14. HIGH SCHOOL GRADUATES FROM DAY SCHOOLS(Include eurnmer 1974) 1,389 1,434 2,823
15. HIGH SCHOOL GRADUATES FROM OTHER TYPESOF PROGRAMS NA NA 36
IS. PERSONS GRANTED HIGH SCHOOL EQUIVALENCYCERTIFICATES NA NA 226
OE FORM 23S0.5, 10175 PREVIOUS EDITIONS OF THIS continud on rFORM ARE OBSOLETE.
41

SECTION D PUPIL DATA (continued)HECK IF ES.
17. PUPILS IN MEMBERSHIP AS OF OCTOBER 1. 1973 IMATECLASSIFICATION ELEMENTARY SECONDARY
3,638CLASSIFICATION ELEMENTARY SECONDARY1. Grad* 8
a. Prkindrgarten(In thousands
..: 1.. Grad 9 ::::i:i::::.:::.g:::::;iiii:iii:;;;;K:3,877
b. indrgKattn 1/2,946
::::::::::::::::::::::::::::::::::::
.........,.........-...
:.:4-:::-:.:::::::::. 3,724
c. Grod 13 242
.
rn. Grade 11::::::::::::::::.:.
3, 349
d.Grad 73 035
n.Grad 12 ..N..:::::::::Z:::-:....x.:.%..
::0..::::::::::.x....x::.:.......... 2,984
.. c..d. 23,048 .. P../.c,edu.,,
:....:,:::.U....x.....:$::....x.:....
23
f. G,ade 43,128
p. Ungraded. Non.graded 586 73
g. Goad 53,290 q. Svecol Education
531 264
h. Grad 63,478
r. TOTAL30 545 14 294
i . Grade 73 622
s. GRAND TOTAL(Elernehtaary pl.., NI, and... I 44 838
1/ Includes Prekindergarten.
42
'5

INSTRUCTIONS Fon COMPLETING PART A .1. STATE FALLRLPOIIT UN STAFF AND PUPILS (ELS(= VIII)
IOL Futon 2350-61 IDMLI No. SI-ROOM
General
Reporting in two stages (4 CY.WW,Itdi preliminaryreport to be muhmitted c+-:; at before. Movembee 15, 1975;
°ad. 2) a final report `a, by nubm1tted on cr beforeDecember 15, 1975.
Tho preliminary cohort data will be used in tho adyancepublication thu fKlt _Report. If complete data for et:,
local repo,I,Inl units MI. not available in time for theprclimlnof:, report. thc data entries hould bo estimatud.goch ',Net L ,:iimated should be so indicated bych4ckiSy, the box "EST" for that entry.
The :fuel report should contain the actual datm whereverpee.alible. If any entries are estimated. they also shouldbe so indicated. Please describe the basis for estimation.Also. If the State'e deflnicluns vary from the prescribeddefinitions, please explain any such deviations.
Full-ti.e Equivalence
In Section I enter the number of staff by position assign-ment. Reporting should be in :dims of full-time equivalence,thst is the amount of time employed lu part-time positionexp d in proportion to that required in full-timeposition. with "1" representing one full-time position.Full-time equivalence is derived by dividing the amount oftime employed by the time required in a corresponding full-time position. nesse report in accordance with thefollowing instruction:
a. Include only filled positions; do not countvacant positions.
b. Count part-time positions In terms of full-timeequivalence. Full-time equivalence should becounted in tenths but the aggregate total foreach line should be rounded to the n ...... wholenumber. EXAMPLES: 1) a teaching position isfilled by two persons, each working s half-day,one a male and the other a female -- count eachat 0.5 and add 0.5 to that position category foreach sex: 2) a teacher is employed for 2 hoursper day -- count at 2/6 or 0.3; 3) a teacher isemployed 1 day per week - count at 1/5 or 0.2.
c. A full time employee is given more than one posi-tion assignment. therefore should be counted aspart-time in each assignment. For exsepla a personis assigned 4 hours per day to teaching and 2 hoursper day to counseling -- count 0.7 for teachingand 0.3 for counseling.
Staff Personney._1,cti05
Definitions of each specific position assignment to beincluded in Section I are contained in Handbook IV, RevisedStaff AccountluE. This Handbook reference number and nameof the activity assignment to be included in each line aredefined below. If there is any question aboet particularpositions. the Handbook should be referenced.
Line I. CI009 SuperintendentC1003 Assistant Deputy/Associate Superintendent
Line 2. C1008 PrinripalC1004 Assistant Principal
Line 3. C1001 Admini ttttt ive Assistant
C1002 Admini ttttt ive Intorn
C1006 ForemanC1007 OmbudsmanCI010 Superviaor/Manager/DirectorCI011 TAX Assu4sor/Colicet,r
Line 5. C2005 Teacher
Line 6. C2001 Curriculum SpecialistC2002 CounselorC2003 Librarian/MediaC2004 Reeedial Specialist
Line a. onol AccountantC3002 AnalystC3003 ArrhitectCI004 AndiologietC7005 AlwiltoryC1006 Peutietclo07 Dietitian/NutritioniatCUM EditorClow+ FmtlneerC1010 EvaluationCI011 LegalCU117 NecorWorIr1101 OpiloAloologlool 5 2
C1014 OptumetrietC1415 PersonnelCI016 PhysicianC141/ PlannerC10111 Psychiatristf:1019 PoychologiatCi020 Pohlle/CramonIty Relations0021 Registered NurseC1022 keglat.rarCIA/3 Research 4 DevelopeentC3024 Social WorkC3025 StatisticianC3026 Therapist
Line 9. C500 Tessaing AideC4013 Teaching InternC4012 Inaching Assistant
Line 10. C5001 ZookkeeporC5002 ClerkC5003 MessengerC5004 Records Manager
Line II. All other assignments in the C4000, C5000, C6000.C7000. C8000, C9000 categories not includedsabove.
C4000 TechnicalC5000 Office/Cierlcs1C6000 Crafts 4 TradesC7000 OperativeC8000 LaborerC9000 Service Work
Section II - Pupil Data
A. High School Graduates
Line 14. Report the total number of 1974-75 school yearhigh school grad from the regular publicday school program. Including 1974 Boomer schoolgrad but excluding 1975 summer school.If 1974-75 high school grad ttttt exceed the 12thgrade aembership reported for fall 1974. pleaseexplain.
Line 15. Report the total nuaber of graduates from allother public school programa -- evening school,adult school. etc. -- during the 1974-75 schoolyesr.
Line 16. Report.the total nuaber of persons receiving highschool equivalency certificates during the 1974-75school year.
B. Pupil Membership as of October I, 1975
Line 17. Electric/try/Secondary: Pupils should be reportedby grade as "elementary" or "secondary" accordingto State and local practice. rather than on a1I-8 and 9-12 basis. However, pupils classifiedse "elementary" should not be reported in gradeshigher than grade 8. while pupils classified as
"secondary" should not be reported in grades lowerthan grade 7. It is possible to report sow 7thnnd Sth graders as "elesentary" end others as"secondary" if single classification system isnot Statewide.
Line 17A.Include only those pupils whose prekindergarten176.and kindergarten programa are part of.the regular
school system and are financed by the LEA.
Line 17o.Report as "p duate" only chess pupils whohave graduated from the 12th grade and havere-enrolled for additional high school co ttttt .Do not include pupils enrolled in grades 13 and 14.
Line 17p.Pupils not assigned to grades should be reportedas ungraded/nongraded. DO NOT ifirlude ungradedspecial education pupils here.
Line 17q.Report only handicapped pupils served by specialeducation programa epecifically designed to meetthe needs of handiceprwd children (where handl-rapped refero to either edoeoble mentally ded.trainable mentally retarded. hard-of-hearing,deal. 'speech impaired, vilowslly impaired, seriouslyrelationally dlaturbed. halving disable, crippled.or other health-related handicaps). DO NOT includein line* l7a through 17p soy pupils reported here.
bluTlismSSInns.
Data on staff personnel And pnpil membeluhip should bereported AA et Octoher i, 14/5 or the dearest date thereto;duo stall AshIgnmesia nod plopll swmbefshipa are cenahlcredto he 0[41411:ed. or movie. Cho... ::tnten Odell Imetrd Friday 414 11,dar report ti"o 1Y0q mat ma* tbeqe data.
43

DEPARTMENTOFHEALMEDUCATMN.ANDWELFAREEDUCATION DIVISION
WASHINGTON, D.C. 20202
ELEMENTARY-SECONDARY GENERAL INFORMATION SYSTEM (EI.SEOIS VIII)
PART A.3. STATE FALL ESTIMATES FOR 1975.76
FORM APPROVEDOMB NO. 51-ROBB1
DUE DATE (check applicable box)OPreIlminary, November 15, 1975El Final, Decmber 15, 1975
DATE PREPARED STATE (or Maitory)United States
totalsNora: a.r..... completing this form. carefully rand inatructione.
SUBMIT COMPLETED FORM TOtAssistant Sacretary for EducationNational Center far Education StatisticsElementary-Secondary Surveys Branch400 Maryland Avenu, SWWashington, D.C. 20202
PREPARED BY
AGENCYTELEPHONE
AREA CODE NUMBER EXTENSION
ITEM AMOUNT(thoimande ol dollars)
(HIM 1 Shy% 13)
$32.128.083
$ 341,348
REVENUE RECEIPTS
I. FROM LOCAL SOURCES
2. FROM INTERMEDIATE SOURCES
3. FROM STATE SOURCES(not including Federal flort-through funds. report such on line I) $29,321.594
4. FROM FEDERAL SOURCES$ 5.345.912
6. TOTAL. REVENUE RECEIPTS (oum of line I plus 2 Plum 3 PI.* 4)$67,136,937
NONREVENUERECEIPTS 6. TOTAL NDNREVENUE RECEIPTS FROM ALL SOURCES
$ 3.136,188
$57,436,029
$ 1,713,704CURRENTEXPENDITURES
7. FOR FULL-TIME ELEMENTARY AND SECONDARY DAY SCHOOLS(from ell fund. Including ESEA)
IL FOR OTHER PROGRAMS OPERATED BY LOCAL SCHOOL DISTRICTS(Coainumity ~vice., summer school., adult eduction, ate.)
IL TOTAL. CURRENT EXPENDITURES (aunt of line 7 phm 8)$59,149,733
CAPITAL OUTLAYso. BY SCHOOL DISTRICTS (all fund. including P.L.. 815)
$ 5.982.539
I. BY OTHER AGENCIES (achooMouoing mahoritieff, etc.) 1/_
INTEREST ON DEBTZ. BY SCHOOL DISTRICTS (all fund.)
$ 1,970,297
1/U. BY OTHER AGENCIES (echoolhouaing authoritie, etc.)
AVERAGE SALARY14. CLASSROOM TEACHERS ONLY (C2005.)
$ 12.448
I5. OTHER PROFESSIONAL/EDUCATIONAL (C2001, C2002, C2003, C2001)$ 13,967
Sso InetructionATTENDANCES. AVERAGE DAILY ATTENDANCE (ADA)
(In thousands,
41,371
44,10017. AVERAGE DAILY MEMBERSHIP (ADM)
COMMENTS (Dcribe tho basi. for making thee etiolates,. If nommary, continue On fever.. or uae additional sheets.)
1/ Item 11 included in item 10 and item 13 included in item 12.
OE FORM 23504, 10/75 PPEVIOUS EDITIONS OF THISFORM ARE OBSOLETE.
45
5 3

UOTRUCTIORS FOR COMPLETING PART 4-9, STATE FALLESTIMATES FOR 197544 IELSEGIS
101 F.e. WM/ (CUB N.. 51.601131)
General
1. This report is to be completed for esch ttttt theDistrict of Columbia, outlying ..... , and [b. 20 1
' cities at the tice of the 1970 Decennial Census.
2. The preliminary report 1. due in the Office of theAssistant Secretary for Education, National Canter forEducation Statistics on or before November IS. 1975, withflout report due December 15, 1975.
3. All data are to be estimated for the 1975-76 schoolyear.
4. In estimatina expenditure data. Include diebursementsfrom all funds (general fund, debt service fund, etc.) andfrom all sources (local and county. State and Federal).Estimated espendi ttttt should be rounded to thousandsof dollar..
REVENUt AND NOHREVENUE ReCEIPTS
Revenue receipts mum additions to sssssss which do notincur an obligation that mat he met st some future date,
do not represent exch.:gee of Property for money, end areavailable for expenditure. Stat. contributions to rettre-Rent system, penalons funds, and coast security ere tobe included. Do not include moneys that support or aidin espenditurse for vocational rehabilitation sod .alsriesof personnel for supplementary aervices such a Statelibraries snd Stat. teacher retirement, teacherplacements. etc.
Item 1. Revenue from local ources. Estimate sll revenueproduced within the school diatriet and available to thedistrict in the mount prodocad. Theta school districtsmay be common school districts, ele.entary chool districts.high school district., unified school districts. to,s schooldistricts, city school districts, county school districts.divielots, reorganised school diatricts, cooperative schooldiarricts. dependent school dimtricts, independent schooldistricts, etc.
Ire. 2. Revenue from intermediate sources. Estimate allfund. collected by an intermediate sdmini sssss ive unit. orpoliticel subdivision between school district. and the
State. and used for public eleuentary and secondary schoolpurposes. Do not include money collected by an inter-mediate unit so an agent for the local district, endreturned to the local school district in the Case amount aacollected (or less only collection costs). This le recordedas revenue from local sources. Fsnds from taxation andappropriation. incur from permanent funds and endovuentS.and other csah and not:cash revenue receipts collected byinteruediste units ars to be included.
An 111 ssssss ion of revenue frou fntervediste sources is thecase of county intermediate admtni ttttt ive unit whichcollect. teat. within the several local school districts inthe county. and distributes the money thus collected to thelocal districts an some flat-grant or equalization-Aid basis.Another il berm ttion is county tht fir no, lich001 unitof any kind, but which may collect and distribute money forschool purpose. as described in the preceding illustration.
If the school district operating the schools is countywide,the revenue from county sources should be reported ss revenuefrom local four.,
Item I. Revenue from State Source.. Estimate revenues fromthe State for operation of the State board and State depart-ment of education and all funds collected by the State anddistributed to intermediate and local school diatricts inamounts different fros those which were collected wIthiosuch local units. Examplen of the kinds of :avenue recordedto the accounts under thia clarmlfication are Stat. grantsof money for such things as: Central school purposes.Vocational education, Transportation. Special educe:ion foreadeptionol children, Testbooks. Capital outlay, Debt ser-vice, Tuition, Consolidation aid, Mining caup aid, Aid fororphans. Library aid.. Salaries of officials, Cost-of-living Adjuetments, Visiting teacher progra.a, Drivereducation, Child care can ttttt and Evening school salaries.
Do not include moneys that support or aid in expenditure.for vocational rehabilitation and salaries of personnel torsupplementary services euch as State librarlea and Ststeuusustes, taschar retirement, teacher placements. ere.
Enter the total of all State money collected by the Stateand distributed to local education agencies through Statetaxation and appropriation. State permunent funds andendowments. cash and noncaeh revenue receipts. Includereceipts for school services that do not go throuth the booksof the local school system; e.g.. State contributions toemployee retire.ent !Bretons and value of textbooks furnishedby the State.
DO NOT INCLUDE (unds fro. Fedsral aources which are distrib-uted through the Stet. education agency. Such Federelfunds are to be included, to item 4. This instruction isconsistent with revision of Handbook II made by the U.S.Office of Education - Committee on Educational Data Systene(0E-CEDS) School Finance Standing CdOnittee. The change was
46
5 4
transmitted to the State education agencies by runraoduladated February 16. 1966.
Irem 4. Revenue from Federal sources. Estimate ALL Federalfunds for State and intermediate admint ttttt ion AND Shoosgoing to local achool system, either directly or throughthe State as distribution agency. Do not include Federalfunds going to agencies other than the local public schoolsystems, e.g., that part of ESEA Title 1 dealing with or0-gramma for State operated or supported schools for thehandicapped.
Item 6. Enter the total amount received by local educationagencies fron the sale of bonds and real property andequipment, loans, and proceeds from insurance adjustments.
Item 7. The folloving expenditures should be includedhere: (1) Expend( ttttt for ADMINISTRATION by Stott boardof education and State department of education (excludingexpenditures for vocational rehabilitation and salariesfor personnel for supplementary service, much as Stat.library, State museum, teacher retirement, teecher place-ment. etc.). (2) lspendi ttttt for ADMINISTRATION by countyor other interuediste administrative unit. (3) Total currentexpendi ttttt by local school districts (i.e.. expendi ttttt(or admini ttttt 10n, inatruct ton, ttendsnce, heIth,transp.rtation, and net fthod service (It:eluding value ofcoomodities donated by the U.S. Departeent of Agriculture),and other net expenditures to cover deficits tor ttttt -curricular activitleo tor pupil.), and maintenance andoperation, (4) Direct State eependltures for current oper-ation (e.g.. State (employer) contributions to retirementsystems, pension. bond, or social itv on hehalt ofpublic school emplusees; itate expenditure* for textbook%distributed to loral school district.. and 411 otherexpenditure/1 made hy the State on behal( of tree publicelementary and secondary s,hooly). luslude orreto expend-iture. made lur Vocational ...hnlcal taSecondary education.
!tem.!. This will include vocational to:Antral schools whichdo nut have an elementary or secondary program (tor adulteducation).
lienaCI. Enter the amount to be vpent by the leeal edit...5tongencles to cquire and Improve sit:, construct and equipbuildings, and poreha. other equipment Iciassilled ascpital outlay).
item II. Self-exPlanatdrv.
Item 12. Report here estimated Interest ,n, short term andlong term debt (bond* or 'wt..%) to he paid hY Inraleducational agencies from all funds.
Item LI. Report here estimated interest payment% to he ..teby schoolhousing autheritley or similar asenelea. and pay-ments to be vade directly by Stale, intermediate. county.city, ur other local governmental agency, where eachpayftenta 0111 not he recorded in the luCal education agencyaeeOunta.
luta I. Report the estimated average salary tor onlythose teachers reported on form Part 0-1, ttem 5. Theestimated average salary yhould include gross salarybefore deductions for social security. retire.s.nt. health.tnearance, etc. Average classroom teacher salaries trillnot normally exceed ve rage ,nstruct Iona I stall so I al leo .
Ilea 11. Report the estimated average sslarr for tr.aeother professional educational staff reported on for%Parc A-I, Item 6. The uther profesgiunal educationalstaff include curriculuu opecialiats, eoungelOrm, librarimnaand sedls specialists. And remedial apecialists.
Item. 16 4 1). Refer to tOtal number ot pupLlu ln meuber-ship reported on Part 0-1 form, trete 17s, before or when!urinating ADA or ADM. The total amounts ofADA and ADM should be tor all public day school pupilnenrolled in prekindergarten through grade 12, Includingpostgraduates. Generally the ADM figure will be greaterthen the figure for ADA. the average dolly attendanre (ADA)is [he aggregate days attendant. divided by the nueber ofdays the school Is actually tn ttttt un.
The ...refgo daily membership (ADM) for a school year is theaverage number of puptle "belonging.° whether present orabsent, each day.
Report Average Dolly Attendant.. and Average Daily Membershipin elementary and secondary schools in accordance with theformulas given belout exclude students in uemer school..adult education. or Junior college.. Report to the n ttttttwhole number.
ADA. annual aggregate day attendanceaetoal nother of days taught
annual aggregate days attendant, plusADM. annual aggregte as. ahence
attual number of day taught
Half-day attendance at emrsery school or klndergarten shouldbe counted as full-tiaa for purposes of deteruintng averagedaily attendance and average daily memberghip. For example.if 100 pupils attended nursery school in the morning anddifferent group of 100 pupils attend in the afternoon.
the aggregate attendance for the day would be 200.
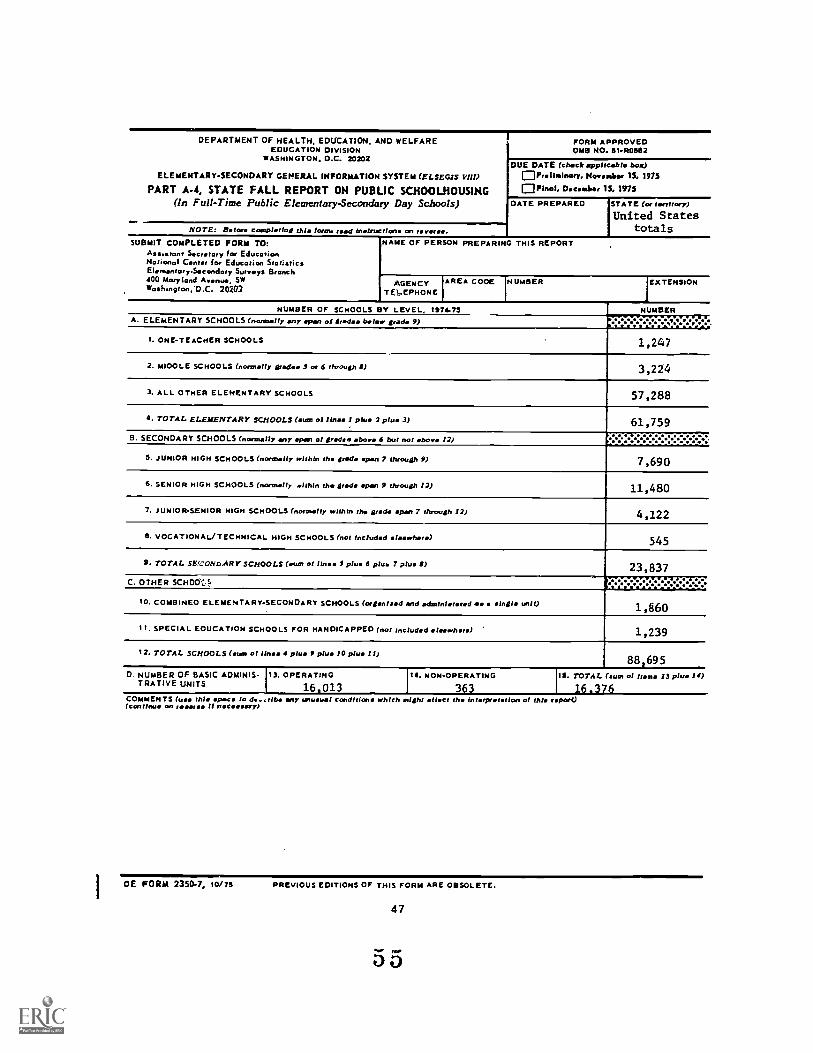
DEPARTMENT OF HEALTH, EDUCATION, AND WELFAREEDUCATION DIVISION
WASHINGTON. D.C. 20202
ELEMENTARY-SECONDARY GEMERAL INFORMATION SYSTEM (ELSEGIS MD
PART A-4, STATE FALL REPORT ON PUBLIC SCHOOLHOUSING(In Full-Time Public Elementary-Secondary Day Schools)
FORM APPROVEDOMB NO. 514105512
DUE DATE (check applicable bac)loon'. Novara Imar IS, 1975
Docoakor 15, 1975II. PrahaIN Final,
DATE PREPARED STATE (or lavatory)
United StatestotalsNOTE: Minors completing this form read insnuctione on re
_Swaim COMPLETED FORM TO:
Ass,mant Socretary for EducalionNationaI Cants. for Education StatisticsEIsnuantory.Socondary Survays Branch400 Maryland Avenuo, SWWashington,'D.C. 20202
NAME OF PERSON PREPARING THIS REPORT ,
AGENCYTE6EPHONE
AREA COOE NUMBER
NUMBER OF SCHOOLS BY LEVEL, 1974.75 NUMBERA. ELEMENTARY SCHOOLS (normally any apart of grades bolos. grade 9) ;XFl;I:.
I. ONE.TEACPIER SCHOOLS 1,247
2. MIOOLE SCHOOLS (normally gradas 5 or 6 through II) 3,224
3. ALL OTHER ELEMENTARY SCHOOLS 57,288
B. TOTAL. ELEMENTARY SCHOOLS (sum ol lines I phrs 2 ph,. 3) 61,759B. SECONDARY SCHOOLS (normally any *pan oi grades above 6 but not above 12)
S. JUNIOR HIGH SCHOOLS (normally within th grade span 7 through 9) 7,690
6. SENIOR HIGH SCHOOLS (normally within the grade span 9 through 12) 11,480
7. JUNIOR-SENIOR HIGH SCHOOLS (normally within the grads *pan 7 through 12) 4,122
B. VOCATIONAL/TECHNICAL HIGH SCHOOLS (not included larwhere) 545
9. TOTAL SE!CONDARY SCHOOLS (sum of lines 5 plus 6 plum 7 pls. 5) 23,837C. OTHER SCHCICS
,.. COMBINE0 ELEMENTARY.SECONDARY SCHOOLS (organised and affmini d as sines win) 1,860
I I. SPECIAL EOUCATION SCHOOLS FOR HANDICAPPED (not included laewhere) 1,239
12. TOTAL. SCHOOLS (sum ol lins 4 plus 9 plus 10 plus 11)88,695
D. NUMBER OF BASIC ADMINIS-TRATIVE UNITS
13. OPERATING
16.013
14. NON-OPERATING
363
IS. TOTAL (sum oi nowt IS pilaff 14)
16.376.
COMMENTS (uae thie apac to do.. rib* any 1.11.161.1,111 conditions which might affect ths intsrprstatlan oi this report)(continu on rot II ncsseryI
IOE FORM 2350.7, 10/75 PREVIOUS EDITIONS OF THIS FORM ARE OBSOLETE.
47
5 5

INSTRUCTIONS FOR COMPLETING PART A-4. STATE FALLREPORT ON PUBLIC SCHOOLHOUSING
(0E Fenn 2330.1) I(WS So. 51-R08.82)
General
A preliminary report is due in che Nacional Center forEducation Statistics. Office of the Assistant Secretary forEducation, on or before November 15, 1975 with a final reportdue December 15, 1975. The report is to be cospleced foreach State, the District of Columbia, the outlyingAnd the 20 largest cities at che time of the 1970 DecennialCensus. Include only those schools op eeeee d by local educa-tional agencies. If there is no entry for a field, leaveblank. Avoid duplication of counting, e.g., do not countmiddle schools in line 2 and also include them in line 3.
For purposes of this report, a school consists of a group ofpupils with one or more teachers who give instruction of adefined type in one or more grades, housed in a school plantof one or sore buildings or in more than one school plant,and organized as one unit. More than one school may behoused in che same school plant, Mt in che case when sep-arately organized elementary and secondary grade levels areho...sed in che same school plant; where this occurs, eachlevel is considered at a separate unit, if adsinisteredseparately. If both elementary and secondary grade levelsAre adminlstered ae mingle unit, it should be consideredas one school.
if ic
Item I. A one-teacher school is a school in which oneteacher is employed to teach all grades offered in che school,regardless of che number of rooms in the building. Theseschools can consist of any grade grouping within gradeskindergarten ti,.ugh grade 8.
Line 2. A middle school is separately organized andadministered school usually beginning with grade 5 or 6or its equivalent and including ac least three grades oryears. Most middle schools presume, in ultimata plan if notin present reality, a 4 year high school for the grades oryears which follow. AO in a 4-4-4 or a --4 plan.
Lino 3. Include those school*, sot reported ix line. or2, regardleas of grade span, 'out not above grade 8. (s..4.
line 10 for those schoola which have grades lower thangrade 8 and include grades higher than grade 8.)
Line 5 A junior high school is a separately organized andsatin! eeeee d secondary school between elementary schoolsand senior high schools, usually including grades 7, 8. and 9(as in a 6-3-3 plan) or grades 7 and 8 (Ais in 6-2-4 plan).
Line 6. A senior high school is secondary school offeringthe final years of high school work accessary for graduationand invariably preceded by a junior high school. Four-yearand incomplete high schools are to be included.
1. A 4-year high school is a 4 year secondary schoolimmediately following the elementary school (asin the 8-4 plan) or a saddle school.
2. An incomplete high school is secondary 'schoolwhich offers less than 4 years beyond grade 8and noreally ends with grade II.
Line 7. A junior-senior high school is secondary schoolwhich usually includes grades 7 through 12 and is admin-istered as a single unit. Such a school would usuallyfollow a middle or other elementary school with no inter-mediate school b
Line a. A vocational technical high school is a separatelyorganized school under the direction of an *dein! eeeee or(such as a principal) for the purpose of offering trainingin one or more skilled or semiskilled trades or occupations.High schools offering vocatloaal/cechnical as part of carprehensive program should not be included hers. (if it ispossible to count these schools separately, please enterzero here, include them as appropriate in lines 6 or 7, andexplain in che commence section.)
Line 10. Include here those schools which serve both ele-mentary and secondary pupils, but which ars organized andadsini eeeee d as a single unit and cannot be classified inany of che categories of elementary or secondary schools.
Line II. Include here only those schools which serveemotionally disturbed and mentally or Physically handicappedpupils exclusively. Do noe include scbloola which offerspecial education along with rho regular program. Reportsuch schools on the appropriate line.
C0merwrifeeweem0
48
6
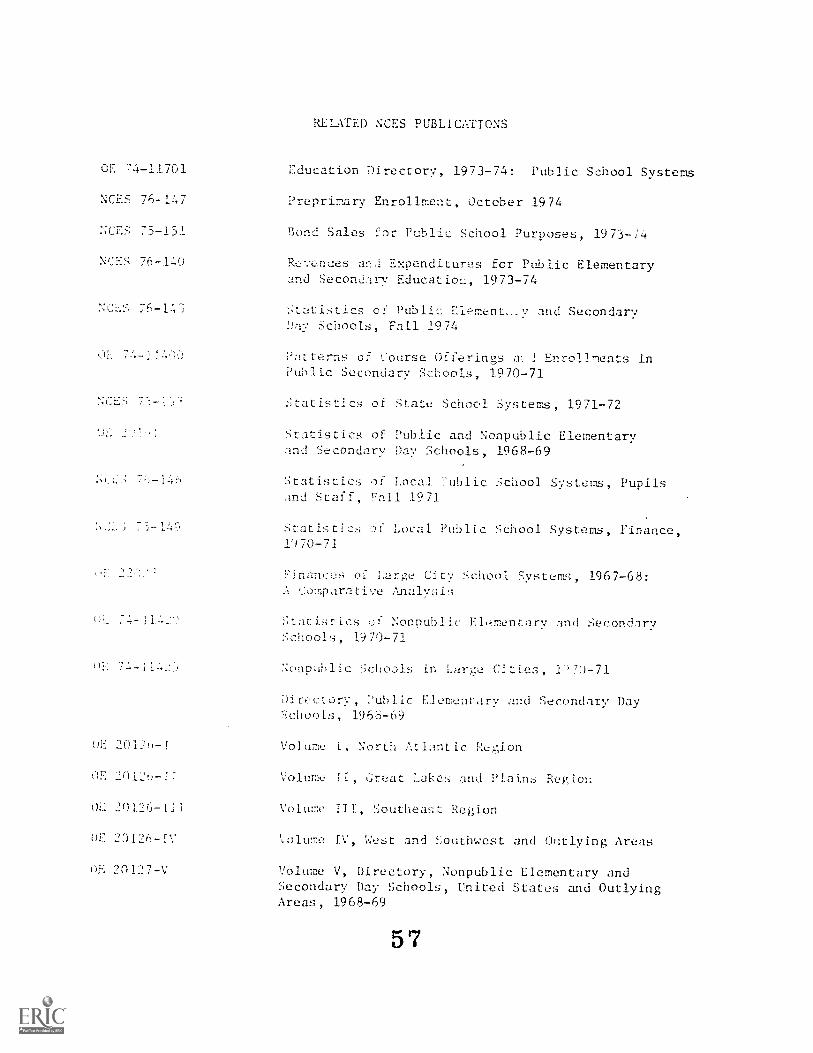
CE 74-11701
NCT:S 76-147
ECE::: 75-151
N
RELATED NCES PUBLICATIONS
Education Directory, 1973-74: Public School Systems
Preprimary Enrollment, October 1974
Ron:1 Sales for Public School Purposes, 1973-44
Revenues and Expenditures for Public Elementaryand Secondary Fducatioli, 1973-74
:;tatistics of Public Element...:v and SecondaryDay Schools, Fall 1974
Patterns of Course Offerings a J Enrollments inPublic Secondary ScNools, 1970-71
NCES Statistics of State School Systems, 1971-72
OF :-'012!)-1
oF. 201"-I"
)01")6-11i
OF 23126-IV
OE 20I27-V
Statistics of Public and Nonpublic Elementaryand Secondary Day Schools, 1968-69
Statistics of Local ';'ublic School. Systems, Pupilsand Staff, Fall 1971
Statistic,_; of Local. Public School Systems, Finance,D70-71
Finanee:-; of Large City School Systems, 1967-68:A ,:omparative Analysis
Nonpublic Elementary and SecondarySchools, 1970-71
NonpaIdic Schools in Large Cities, 1-'7O-71
Directory, Public Elemenrary and SecOndary Daychools, 1966-69
Volume I, North Atlantic Region
Volume LE, 6reat Lakes and Plains Regiol:
Volume IT1, :-;outheat Region
%.'olume IV, West and Southwest and Outlying Areas
Volume V, Directory, Nonpublic Elementary andSecondary Day Schools, United States and OutlyingAreas, 1968-69
5 7