Embed Size (px)
Citation preview

ED 095 265
T7TL
TvFTTTurr,::,N
SPONS AGENCY
P'JD DATEHOTT'.
tTRS PRICE,DESCRIPTORS
IDFNTIFIFPS
ABSTRACT
DOCUMENT RESUME
CE 001 790
Retrospective Study of Employee Mobility in HeadStart Programs, Draft of Final Report.Fonz Allen and Hamilton, Inc., Washington, D.C.office of Child Development (DHEW) , Washington,D.C.'P May 73314p.; Fcr related document, see CE 001 789
ME-V.75 HC-$15.00 PLUS POSTAGEEmployment Patterns; *Employment Trends; *FederalPrograms; *Labor Turnover; *OccupationalNMobility;Questionnaire; Research Methodology*Head Start ProgramS
This report presents the findings from a survey todetermine, the extent, causes, and import of Head Start employeemobility. The findings are based on data from 56 responding programsout of a sampi, of 70 selected from a population of 863 full-yearHead Start programs listed in a 1971 Office of Economic Opportunitiesinventory. The study in its recommendations and findings tried toanswer three broad questions: How much movement is there in terms ofturnover and promotions?; What causal factors can be linked with themobility patterns?; What amount of impact does turnover have uponHead Start Programs? The study was administered through the use ofvarious questionnaires (Current Employee and Former EmployeeOucctionnairrs, Grantee P.gency Project Data Questionnaire, and aneleo,l+-7, Agency Project Data Questionnaire) and subsequent fcllowupintrvie:,ws. One-fourth of the document deals with the studies,findiros, and recommendations, while one-half is devoted to fourappendixes on glossary terms, questionnaires and study guides used,methodology used, a review of the literature concerning employeeturnover, and detailed mobility rates for each Head Startorganizion. (RP)

SCOPE OF INTEREST NOTICEHp' ; .404:y .stsq.pPfi
144
, iu71,,11t th.s VIM olhehth+.11.1h4.
h. Ord tt3 i9ht. 1.`dellt1 teffet t th- spth rdl
U S DEPARTMENT OF HEAL TrtEDUCATION WELFARENATIONAL INSTITUTE OF
EDUCATIONDOC PVC A RE I N RI Pti()
(.5 . I (1 f ItA(It WI If I. W')1,wSON OW OWI.,AN.ZAT rin.014V,IN
A' N;, rt, f A Ow OrNUN%Dr) NOT NC f'tYas4 PDF
Cs NAO. .A, N'.' T.:11 OgI P A - -, oc. 1:4 POt V
'let/ ospective Stud.%Employee Mohility in flead Stnt Pog,:ams
OFFICE OF CHILD DEVELOPMENTDEPA ItTM ENT OF' 'HEALTH, EDI I. ATION.
AND \\ EI,FA
ashinQton, I). C.
This report is of a proprietarv.nature and intended solely forthe information of the client to w1,)ril it is addressed.
\lay 18, 1(.17?)

BOOZ ALLEN PUBLIC ADMINISTRATION SERVICES. Inc '025 Connecticut Avenue N WWashington D C 20036
202 293.3600
May 18, 1973
Mrs. Helen HowertonOffice of Child DevelopmentDepartment of Health, Education, and WelfareRoom 5044400 Sixth Street, S.VWashington, D. C. 20024
Dear Mrs. Ilowerton:
We are pleased to submit this Draft Final Report on a Retrospective
Study of Employee Mobility in Head Start programs. Submission of this
report is in accordance with the requirements of our contract with the
Office of Child Development.
This report presents our findings and recommendations based on data
obtained during the Retrospective Phase of this contract, It is organized
in six chapters and five appendixes:
Chapter I--Presents an overview of the purpose, scopeand methodology of the study.
Chapter II--Summarizes the findings, conclusions, andrecommendations.
Chapter III--Describes the extent of mobility in thesample programs.
Chapter IV--Descrihes the causes of mobility,
Chapter V--Discusses the impacts of mobility on HeadStart programs.
a subsidiary o.' P00? ALLEN & HAMILTON Inc

Chapicr VIPresents recommendati:ms for improvingIlead Start policies which relate to employee mobilityand morale.
Appendix A-- Contains a glossary of terms used in thisreport.
Appendix B--Contains the questionnaires and interviewguides used in the study.
Appendix C'-- Discusses in detail the methodology em-ploved in the study.
Appendix f) -- Contains a review of literature concerningemployee turnover in other organizations.
Appendix E--Contains detailed mobility rates for each'lead Start organization which provided mobility data.
The findings concerning the impact of mobility necessitate word of
caution. ()tn. technique involved measuring the extent to which Ilead Start
Directors perceive an impact from mobility. Whether their perceptions
mirror the actual effects upon the children in the classroom is to Judgment
. which we have not been in a position to make.
The scope of this study has required the assistance and cooperation of
many people to assist in providing data for us to analyze. We appreciate the
efforts put forth by Head Start Agency directo.-s and employees'iji preparing
their responses. Thanks are also due to ()CD personnel, both;-in Washington
and in regional offices, f3r the assistance they have provided,- in this study.
Very truly yours,

TABLE OF CONTENTS
LETTER OF TRANSMITTAL
I. INTRODUCTION
II. EXECUTIVE SUMMARY
III. EXTENT OF MOBILITY
IV. CAUSES OF MOBILITY
V. IMPACT OF MOBILITY
VI. RECOMMENDATIONS
APPENDIXES
A. GLOSSARY
B. QUESTIONNAIRES AND INTERVIEW GUIDES
C. METHODOLOGY
D. LITERATURE REVIEWS
I :. DETAILED METHODOLOGY
PageNumber
1
8
20
46
76
91

INDEX OF EXHIB .TS
I. PROGRAM SAMPLE SELECTED
FollowingPage
FOR EMPLOYEE MOBILITY STUDY 4
II. RELATIONSHr'S BETWEEN DIRECTAND INDIRECT PROVIDERORGANIZATIONS 22
(III HEAD START PROGRAMS BY REGION 23
IV. PROGRAM WEIGHTING FACTORS 24
V. WEIGHTING FACTORS BY REGION 25
VI. WEIGHTED TOTAL STAFFINGPATTERNS 26
VII. WEIGHTED STAFFING PATTERNSBY STRATUM 27
VIII. WEIGHTED TOTAL TURNOVERRATES BY STRATUM
fi
28
IX. TURNOVER RATE GROUPINGS 29

INDEX OF EXHIBITS(Continued)
FollowingPage
X. LENGTH OF TIME EMPLOYEES HAVEBEEN WITH HEAD START 30
XI. TRENDS IN TURNOVER RATES 31
XII. WEIGHTED THREE-YEAR AVERAGETURNOVER RATES FOR PROFESSIONALAND PARAPROFESSIONAL EMPLOYEES 33
XIII. WEIGHTED THREE-YEAR AVERAGETURNOVER RATES BY REGION 34
XIV. WEIGHTED THREE-YEAR AVERAGETURNOVER RATES BY COMPONENT 35
XV. YEARLY TURNOVER RATESBY COMPOT....NT 36
XVI. WEIGHTED TOTAL PROMOTIONRATES BY STRATUM 38
XVII. TRENDS IN PROMOTION RATES 39
XVIII. WEIGHTED THREE-YEAR AVERAGEPROMOTION RATES BY REGION 40
XIX. WEIGHTED THREE -YEAR AVERAGEPROMOTION RATES BY COMPONENT 41

INDEX OF EXHIBITS(Continu,N1)
FollowingPage
XX. YEARLY PROMOTION RATESBY COMPONENT 42
XXI. TURNOVER AND PROMOTION RATESIN INDIRECT PROVIDER GRANTEEAGENCIES 44
XXII. ANALYTICAL MODEL 47
XXIII. RELATIONSHIP BETWEEN BUDGETCUTS AND OUTWARD MOBILITY 49
XXIV. REASONS FORMER EMPLOYEES GIVEFOR LEAVING HEAD STARTEMPLOYMENT
XXV. THREE-Y EAR AVERAGE TURNOVERRATES OF HIGH AND LOW PROMOTIONORGANIZATIONS
XXVI. THREE-YEAR PROMOTION RATESFOR HIGH AND LOW TURNOVERORGANIZATIONS
XXVII. RELATIONSHIP OF TURNOVER RATESBY PROGRAM AND BY STRATA TOPROMOTION RATES
50
55
55
55
XXVIII. HOURS AND MONTHS OF OPERATIONAS RELATED TO OUTW.I.RD MOBILITY 55

INDEX OF EXHIBITS (Continued)
XXIX. CURRENT AND FORMER EMPLOYEESIN HIGHIAND LOW TURNOVERORGANIZATIONS BY PERCENT FEMALE
XXX. PROBLEMS EXPRESSED BY HIGHTURNOVER ORGANIZATIONS IN RECRUITINGAND RETAINING EMPLOYEES
FollowingPage
58
64
XXXI. SIGNIFICANT VARIABLES FOR HIGHAND LOW PROMOTION PROGRAMS 71
XXXII. IMPACT OF AN INDIVIDUAL EMPLOYEE'SDEPARTURE 79
XXXIII. IMPORTANCE OF POSITIONS TOTHE FUNCTIONING OF HEAD STARTORGANIZATIONS 80
XXXIV. TIME REQUIRED TO BECOME FULLYEFFECTIVE IN A POSITION 81
XXXV. EMPLOYMENT STATUS OF FORMEREMPLOYEES INTERVIEWED 84
XXXVI. POSITIONS NOW HELD BY FORMERHEAD START EMPLOYEES 85
XXXVIJ. EXTENT OF SUPPLEMENTARYTRAINING BY COMPONENT 85

I N D E X O F EX II IBITS (Continued)
XXXVIII. INTERNAL MOBILITY DIFFERENCES.. BETWEEN CURRENT AND FORMER
EMPLOYEES
I
FollowingPage
89

I. INTRO1)1 ("HON
This report presents the findings from a tillk to determine
the extent, causes and impact of Head Start employee mobility.
The findings are based on data from 56 espimding progratn-: ,,,:t
(if :1 of 70 programs Whiril WC;t (11()Ser1 r this Study,
This report is organized in six chapters and appendixe..,-,-
Chapter I, IntroductionChapter II, Executive SummaryChapter III, ExtentChapter IV, CausesChapter V, ImpactChapter VI, RecommendationsAppendix A, GlossaryAppendix B, Questionnaires and Inter'.iev: GuidesAppendix C, MethodologyAppendix I), Literature SearchAppendix L, Detailed Mobility Rates
This chapter addresses thi. background of the data collection c ffort..
The chapter is divided into three sections:
Purpose of the StudyScope of the StudyOverview of the Methodology
A more detailed discussion of the Methodology is included in
Appendix t , Volume II.

1. i't 111'()51.: 01- T111: STUD\
idual ift-id Start programs art frequently caught in a
potential conflict. between the two basic objectives of tht total
project: meeting the needs of economically disadvantaged prt-
school cliildrtn; nfid offerina an opportunity for reFidnts- tn cain
mplo,-rnent, training, advancement, and other features essential
for the dt--loptilt II' of career:-:. To assist in resolving thi.4. po-
tential conflict, this study addresses several broad questions:
Hew muk.h :novement thtr in terms to ti.;rri-try-tr prof notion:-
What f:1( .1()r- :tn he 1 thke.1 Ith thethobilit pa: tt111.-i
What :.11!:1)1illt. ): 1111pa. t t :it h+ h;t tp.,:tIle;y1
Within these lir,)ad questions, there: arc a number of. more
sper-_!ific areas to he probed. All are discussed in the next throe
chapters of this report.
2. SCOPE OF THE STUDY
The. study is concerned with employee mobility in full-year
Head Start programs. The Indian and migrant Head Start programs

at exelthid from the scope, as are Porent-Child
Cctitt rf,c. a, used in this study, included promotions
within the lit. ad Start piograms, movements between Head Start
components, anti move,ments cuoevard from the programs into
other organizations en. ti ii state of unemployment. Thu time
fani,.t -..)), the ex-tent of mobility buinii, studied extends from
lulv 1, to Decemi t r 31, 1972.
4 t% Eit LW L METHODOLOGY
The .mthodology employed in this study consists of the
selectior: ,f <i stratifil.d sample of programs, the devtlopment
and adrnini-...ation of questionnair-s 4.0 program administrators
and -tirrt nt and tormer rmployf.es, the interviewing of program
and rig onal personnel, and the analysis of the data collected.
This s, tion 0.-ides an ty, vrvik w of the methodology. Additional
are included m Appndr, (', Volume Ii.
(1) Seventy ProF.ams Which R'pr 'sent a Cross Section ofIlad Start Program Characteristics Were Selected
A of 70 programs was :;elected from a population
to io)3 h ad start program:. listed in a 1971 OE()
in,..toti.)rv. In making tht.- selection, the overall objective
Was to provide representation of a wide range of full-year
pri,orams on a random basi. within minimum constraints of

practicality for visiting the program :sites. To achieve these
objectives, a stra'dfied sample was selected. The total sample
consisted of four strata, each representing 25(ro of the total
1971 Head Start Federal funding. In the stratum containing
the 14 largest Head Start programs, 10 programs were
chosen selectively to include the maximum variation of
characteristics in the sample-set, e.g., only one of four
Mississippi programs was selected in this stratum. In the
other three strata, the programs were chosen on a completely
random 123.Si.S. The 70 samph. programs, segmented by
strata, ...re listed in Exhibit I, following this page.
Since the population was ranked in order of Federal
funding and segmented by equal groups of Fftk.ral dollars
prior to the drawing of the sample, the full range of Federal
funding o; the programs is clearly representea. In fact, the
total sample represents over 30% of the Federal-dollar
value of the program population. Furthermore, the tr.:. of the
Head Start grantees surveyed in this study represent 27% of
the paid staff and 25'7:. of the children in Head Start full-year
programs.

SAMPLE A
EXHIBIT I (1)
Office of Child DevelopmentDepartment of Health, Education and Welfare
PROGRAM SAMPLE SELECTED FOREMPLOYEE MOBILITY STUDY
Grantet- City State
FY 1971Federal
Funds(000)
Agency for Child Duvelopment New York New York $13, 405C'hicag'o Committee Chicago Illinois $ 8,934Economic and Youth Opportunity Los Angeles California $ 8,160Mary Holmes Community Ed. Jackson Mississippi $ 6,531United Planning Organization Washington D. C. $ 4,021Economic Opportunity Miami Florida $ 3,579Seattle-King County Ec. Seattle Washington $ 3,091Harris County Community Houston Texas $ 3,080Act for Poston Community Boston Massachusetts $ 2,527l'nited Community Corp. Newark New .1ursey $ 2,315
SAMPLE H
Grantee
Economic OpportunityDenver Ilead StartMontgomery CommunityCommunity Service OrganizationCommunity Rel. -Social Dev.-Mid-Delta EducationDelta Area Economic Opp.Coahoma OpportunitySan Bernardino CountyMississippi Industrial College
City
Kansas CityDenverMontgomeryJacksonMilwaukeeGreenvillePortagevilleClarksdaleSan BernardinoHolly Springs
State
FY 1971FederalFunds(000)
Kansas $ 1,625Colorado $ 1,615Alabama $ 1,370Mississippi $ '1,253Wisconsin $, 1,190Mississippi $ 1,157Missouri $ 1,123Mississippi $ 1,122California $ 1,075Mississippi $ 1,050

SANIPLE H (('ontinued)
Grantee
ProgresF, for ProvidenceInstitute of Community ServicesTill-Parish Progress
AAP of Greater IndianapolisCommunity AdvancementOrange County CommunitySouthwest MississippiTRI-County CommunityEconomic Opportunityelabarna Council
SAMPLE C
Grantee
City
ProvidenceHolly SpringsC rowleyIndianapolisBaton RougeSanta AnaWoodvilleLaurinburgRiversideAuburn
City,
EXHIBIT I (2)
State
FY 1971FederalFunds(000)
Rhode Island 992Mississippi $ 985Louisiana $ 953Indiana $ 928Louisiana 908California 884Mississippi 841North Carolina S 802C' ali forni a 802Alabama 751
State
FY 1971FederalFunds(000)
Atlantic Human Resources Atlantic City New Jersey $ 640Portland Metro. Steering Corn. Portland Oregon $ 611Lift, Inc. Tupelo Mississippi $ 561ARVAC Inc. Dardanelle Arkansas $ 547Cameron Co. Comm. Rights Brownsville Texas $ 540ACTION !tic. South Bend Indiana $ :468East Missouri Community Flat River Missouri $ \ 453SCOPE Dayton Ohio $ 444Metropolitan Development Tacoma Washington $ 429Montgomery County Dept. Corp. Rockville Maryland $ , 406A, orcester Corn. Action Worcester Massachusetts $1 415Shore Up Inc. Salisbury Maryland $ 406West Lake Cumberland Columbia Kentucky $ 356Experiment in Self-Reliance Winston-Salem North Carolina $ 355The Missouri Ozarks Richland Missouri $ 308Economic Improvement Edenton North Carolina $ 289
1/h

EXHIBIT I (3)
SAMPLE C (('ontinued)
FY 1971FederalFunds
Grantee C i ty State (000)
Piedmont Community Action Spartanburg South Carolina 278Lowndes County Board Haynesville Alabama 263I.ake County Community Waukegan Illinois 253Community Action Rio Grande City Texas 253
S.AMPLE D
Grantee City State
FY 1971FederalFunds(000)
Sussex County CAA Inc. Georgetown Delaware $ 246Central Vermont CAC Inc. Montpelier Vermont $ 245Greater Lawrence Corn. Act. Lawrence Massachusetts 219Muskegon-Oceana C AAP Muskegon Michigan $ 202York County Community Act. Alfred Maine $ 135Somerset Comm. Act. Somerset New Jersey 126Mercer County Econ. Opp, Bluefield West Virginia $ 110Comm. Improvement Council Danville Virginia $ 95,Thompson School District Loveland Colorado $ 77Upper Ocmulgee Econ. .Jackson Georgia $ 68Anderson County CA(' Clinton Tennessee $ 67Delta Comm, Act. dri. Duncan Oklahoma $ 61I Care, Inc. Statesville N. Carolina $ 60Clackamas Co, Eco, Auth. Oregon City Oregon $ 50Scott County Rural Are, Gate City Virginia $ 48C ranston Community Act. ranston Rhode Island $ 42Kno-Ho -Co 'Fri-County Warsaw Ohio $ 42Detroit School District Detroit Texas $ 30Garrett-Keyser-Butler Schl. Garrett Indiana $ 15Kountze Independent Schl. Kountze Texas $ 10

(2) Questionnaires Were Administered to Current andFormer Employees and Interviews Were Conducted
In order to ascertain characteristics, attitudes, and
experiences of Head Start employees, we administered
Current Employee and Former Employee Questionnaires.
These and the other questionnaires are included in Appendix
13 of this volume.
The overall approach was to sample 25% of the total
paid staff in the 70 programs through the use of the Current
Employee Questionnaire and to interview all of the central
staff at the grantee agency and one-third of the field staff.
This meant that approximately 3, 500 employees were to
receive the questionnaireand 1,200 were to be interviewed.
Each of the 70 programs was asked to provide a list
of individuals who left Head Start since July 1, 1970. This
represented the sample of former employees who received
questionnaires. An attempt was made to interview as many
as possible of these former employees via telephone.
-5-

(3) Organizations Were Asked To Provide Data on theExtent of Mobility and Express Their View of WhyEmployees Leave Head Start
The information concerning the extent of mobility, both
promotions and turnover, was collected from responses to
the Grantee Agency Project Data Questionnaire and the
Delegate Agency Project Data Questionnaire. Some grantee
agencies do not themselves operate Head Start centers but
rather delegate all of the center operations to others. In
these cases a Grantee Agency Project Data Questionnaire
was sent to the grantee agency if there were any Head Start-
funded personnel at the grantee agency. Those grantee
agencies which operated any centers were sent Delegate
Agency Project Data Questionnaires.
These forms also provide categorizations of the
director's judgments concerning turnover problems by job
title and indications of the level of training and funding of the
agency's program.
In order to provide a complete picture of why an indi-
vidual left Head Start, the agencies were also asked to com-
plete a Confirmation of Employee Departure and-Reasons
Form for each former employee who was identified to us.
-6-

t
Subsequent chapters of this report detail our findings,
conclusions, and recommendations.
-7-

II. EXECUTIVE SUMMARY
This chapter presents the highlights of our findings and
recommendations. The chapter is organized into the following
sections:
Extent of MobilityCauses of MobilityImpact of MobilityRecommendations
Details concerning these topics are presented in the four chapters
which follow this chapter.
1. EXTENT OF MOBILITY
Turnover rates in Head Start programs were much lower than
anticipated at the initiation of this study, based on studies in similar
occupations. This section discusses those rates, as well as pro-
motion rates.
(1) Staffin Patterns Were Stable Amon Com onents Overthe Three-Year Period
The percentage of employees in each Head Startcomponent have remained almost constant duringProgram Years 1970-1972, indicating that no shiftsin staffing patterns have occurred.

The overall number of employees has risen byabout 12To over the 3-year period. One factorcontributing to this increase has been the fundingof some new grantees and delegate agenciesduring the three-year period.
(2) Overall Turnover Rates for Head Start Programs Are Low
The weighted total three-year average turnoverrate is 13.4%.
The highest turnover rate, 20.0%, iF found inStratum D (the smallest programs), and the lowestturnover rate, 8.1%, is found in Stratum B (thenext-to-largest programs).
Over a third of the programs had a three-yaraverage turnover rate below 10%.
The turnover rate of professional employees ishigher than that of paraprofessionals.
Professionals- -14. 8%Paraprofessionals- -12. 4%
Turnover rates are low in all Head Start components,The highest are:
Social Services-15.7%Health-- 15. 6%
(3) There Were No Trends in the Direction of TurnoverRates Over the Three-Year Period
A statistical analysis was applied to test theexistence of turnover rate trends.
Although turnover rates in each of the four strataincreased from PY1970 to PY1972, the increasesV., ere not large enough to establish statistical trends.

The Overall Promotion Hate Is About Half as Largeas the Turnover Hate
The weighted total three-year average promotionrate is 6.9% (which is 51% of the tur over rate).
The two strata with the highest turnover rates havethe lowest promotion rates, but the individualorganizations with the highest turnover rates havehigher promotion rates than the organizationswith the lowest turnover rates. This apparentcontradictioft stems from the folliming contrastingforces which work upon mobility:
Moderately low promotion rates may causeresentment with resulting departures fromHead Start, causing turnover rates toincrease.
Very high turnover creates opportunities formore promotions and very lo v. turnoverimpedes opportunities for promotions. Thevery low turnover case freq6ently continuesbecause of poor labor market conditions
(5) Promotion Rates Shov, a Rising Trend Over theThreo-Year Period
P-romotion rates show a statistically significantrising trend in every stratum except Stratum A,the largest programs.
The existence of a trend in three stratasuggests that the Career Development effort hashad a positive impact on opportunities for up-ward mobility.

(6) Those Grantee Ojar.izations Which Do Not OverateHead Start Centers Directly Show Higher TurnoverRates and Lower Promotion Rates for Head StartThan Other Organizations
The average turnover rate for those granteeorganizations which do not operate Head StartCenters directly is 42% higher than the overallaverage turnover rate.
The average promotion rates for such organizationsis 36% lower than the overall average promotionrate.
Such organizations exhibit mobility rates similarto those of the Administrative Components of allprograms.
2. CAUSES OF MOBILITY
There is a variety of reasons v. by employees leave Head Start.
Major reasons \lily emplyees leave voluntarily are because:
A Job becomes available with a higher salary ormore opportunity for advancement.
They are dissatisfied with policies or personalrelationships in their Head Start organization.
They have personal reasons, such as familyresponsibilities or moving from the area.

Despite the exist nce of these causes of turnover, it has been
shown that relatively few employees actually leave Head Start. This
immobility is caused primarily by:
The scarcity of attractive alternative Jobopportunities
A strong belief in Head Start concept
The high degree of satisfaction from working1.N ith children
These reasons explain how head Start is able to retain employees
even though some employees report that their earnings have been
reduced over time and though they have faced annual insecurity
crises about whether their programs would be refunded or not.
Recau:.e individual delegate agency organizations v.-ithin Head
Start programs set the climate for employee satisfaction and be-
cause organizations can also be the instruments of policy change,
we have examined causes of mobility by contrasting characteristics
of the 15 highest mobility organizations with those of the 15 lowest
mobility organizations. This section discusses those characteristics
v.hich show(:d a relationship to mobility at the highest levels of
significance.
-12-

111.L...1! t o1,. in i iti t :t I t' rf duttt.In Ir. t.nf «h./ NItur..itn!,
'0./1. t s.! k1k .
!-
1",t!'. Iv I
I(.'. tr in rural!" 1
th,' 7
I .1'1 ' !11!.. -.in% h:11)1..
r-.1 !t .11t. I -t'!,
i.t.., i-1
1 .:1 1 ILI: !i '. t-t ,1 : :t." t r
.1!: it! ,tit i!) tutly,rtt.% 1.1.0.. 1. hi I. .!;;Iri I T ,,"71'11.7;"1,1:41-:.
k h,1 11 n.tt.1:7!(' t-!:.;;I:ti...; t
11.1f!;24'fi th<;::(-r- r .1
..1tti ,.)rt.!';
* 1 :11- - t. Q". !' 1 )
.*:;)!..-* 1 ..? ..t.
,
.1":: ;1:1 i!: ; .r`t C.:1
-1

do"
Such dissatisfaetion, boweVer-, vas not ainor fciiz.4011 given by former (:ti:pli)yes
%t hen asked +.'. by they left Ilead Start.
VolunteerfStaff ratios
High turnover organizations had a consider-ably higlitn- ratio of volunteers to staff thanlow turnover organizations
flits relzitionslitp 1; probably more rt functionof- the urban./ rural %actable than onit ausailt.... of turnover.
'Au V:iiableS 1:1 Their Belatiunz-thip toP Hates
-Juthorit:,- prumotton approval
High promotion organizations had moreat approvalthan lots promotionzrt .
:-,cezr,:-; to indicate that then is .1 ry-11tionship !,..1\yeen ih formality of thestructure and the extent of upward mobility.
Type 1)1 .urganizat
1.1nlited purpose organizations tended tobiki,h promotion rates while school
systems tntied to have low promo.tioti-rates.
This situation serns to be related to thegreater flexibility in Career Developmentplanz; .in the limited purpose organizations.
14

3. IMPACT OF MOBILITY
Head St MI Directors were asked to comment on the effects
of turnover upon their progiam operation. This section discusses
those effects.
(1) Turnover Causes Little Impact on the Quality of Programs
Turnover does not interfere significantly withthe objectives of the program.
Turnover has more impact on individual com-ponents than on the whole program.
Turnover in the supervisory and administrativepositions has the most impact upon programoperations.
(2) Turnover Is Not a Significant Cost
Even in high turnover organizations, only a smallportion of the director's time is expended inrecruiting to fill vacated positions.
Most employees can become fully effective in anew position in less than four months.
Replacements can usually be found in less thantwo months.
It usually costs $100 or less to find and train areplacement.
Replacements usually spend no-more than 40in formal training for their new positions.
-15-

(3) . L-ack-of Turnover Does Not Necessarily Eliminate thePossibility of Promotions
Between the ranges of very high turnover andvery low turnover organizations, the varyingemphasis on Career Development seems todetermine whether the lack of turnover foreclosesthe option of promoting employees or not.
When mobility rates are combined for all programswithin each stratum, an inverse relationshipbetween turnover rates and promotion rates isfound in Strata A, B, and D.
(4) -Lack of Promotions Can Cause Resentment and DecliningInitiative for Employees To Improve Their Capabilities
A smaller percent of employees in low promotionorganizations feel that there is a fair chance toadvance than the percent in high promotionorganizations.
Employees in high promotion organizations aremore likely to have had more supplementarytraining than those in low promotion organizations.
(5) Head Start Served as a Springboard for About ThirtyPercent of the Employees Who Left +-
Approximately 55% of former Head Start employeeb----are now employed.
Of those who are employed , about 55% work inpositions similar to their former positions inHead Start. These individuals constitute about30% of the total number of former employeesresponding.
-16-

4. RECOMMENDATIONS
The following recommendations are directed toward (1)
facilitating the work of Head Start directors and other super-
visory personnel to reduce turnover in those, key positions,
(2) improving employee morale, and (3) improving upward mobility
rates.
The process of grant renewal should be simplifiedand expedited to minimize the annual refundinginsecurity crisis.
The role of the community representative shouldbe expanded to enable the programs to have morefrequent direct access to and assistance froth HEW.
Their number should be expanded so thateach representative can give adequateattention to all. of his programs.
Their responsibilities should be increasedto include a major role in evaluating andimproving program operations.
They should be provided with training fortheir expanded roles.
An effort should be launched to improve communi-cations of Head Start policies to the programs. anda procedure should be developed to sample programreaction to proposed policy changes prior to theiradoption.
More flexibility should be introduced into theprogram budgets.
Funds should be sought to enable programs togive cost-of-living increases.
-17-

Communications should be improved NA' ithirjHead Start programs.
Program directors and key supervisorsshould be trained in administration.
study glioutil-be-undertaken to test thefeasibility of directly funding delegateagencies in some of the largest head Startprograms and of eliminating their granteesas intermediaries.
Employees in components other than educationshould be given a greater feeling of being partof the entire Head Start effort.
Directors should clarify the importance ofall components functioning together.
Cross-component training should be made\
Nontechnical reports concerning successfulCareer Development programs shOuld be dis-tibuted to all programs.
Rewards should be given to employees for im-pro ing their educations and skills.
Certain entry-level positions need a cleareravenue of advancement.
Health aides should have more opportunitiesto advance their capabilities andresponsibilities.
Bus driver/custodians should have a cleareravenue to other components as a rewardfor performance.

In summary, theris low employee mobility in Head Start
programs and the low mobility rates cause little impact upon Ilead
Start o7erations. Thk., greatest impact noted was in key administra-
tive and :;upervisory positions. -TurnoveriST-Aqh-iTrilTfOrtit-Cd
bUdgetary constraints,. which in some cases causes staff to be
terminated, and to the urban/rural factor (labor market character-
Both turnover and promotion rates are related to the
formality of the promotion system. Although turnover is low,
there exist many employee dissatisfactions which may affect pro-
gram quality and which can be alleviated partially through the
implementation of the recommendations in this report.

III. EXTENT OF MOBILITY
This chapter discusses the mobility patterns of employees in
Head Start programs, based on a statistical aepaysis of the reported,
data. The analysis focuses on two general modes of employee mobility:
Employee turnoverEmployee promotions within Head Start
This chapter is organized into the following sections:
The measurement of mobility
Overall staffing patterns
Turnover rates by stratum
Turnover rates by component
Promotion rates by stratum
Promotion rates by component
Relationships between turnover rates andpromotion rates
Turnover and promotion rates in indirect providerorganizations

. 1. THE MEASUREMENT OF MOBILITY\.
This section discusses the analytical approach and the
statistical techniques used to d e Le rnitzie alb ottent-of mobility
observed in the study.
(1) The Extent of Employee Mobility Is Analyzed On a_ "Program" Basis, Causes and Impacts of Mobility
Are Analyzed for 'organizations" Within Programs
In this report, a distinction is drawn between"Program" and 'Organization:"
"Program" refers to the Head Start staffand activities of a grantee agency and ofits -associated delegate agencies
"Organization" refers to any one of theentities involved in a particular HeadStart program, e. g. :
A grantee agency Head Start staffA delegate agency Head Start staff
In two instances, "program" and "organi-zation" become interchangeable:
When a program has no delegateagencies, e. g. , Atlantic City, N. J.
When a program has no Head Startpersonnel in the grantee agency andit has only one delegate agency, e. g. ,Providence, R. I.
Data relating to the extent of mobility arereported on a program basis because programdata must be assembled in order to projectmobility for the entire Head Start .population
-21-

tO
Data relating to causes and impact of mobilityarc reported on an organization basis, because:
Organizational characteristics and extentof mobility vary among delegate agencieswithin a given program
Organizational characteristics arc a majordeterminant of mobility
A distinction is also drawn between "directprovider" organizations and "indirect provider"organizations. Exhibit II, following this page,shows the different possible relationships betweengrantees and Head Start centers, exemplified byhypothetical programs A, B, and C.
A "direct provider" has direct responsibilityfor-operating one or more Head Start centers:
Both grantee agencies and delegateagencies can be direct providers(Programs B and C)
If a grantee agency operates anycenters, even if there are delegateagencies also operating centers,_inthe same program, the grantee isa direct provider (Program B)
An "indirect provider" is a grantee agencywhich monitors and coordinates the opera-tions of delegate agencies, but which doesnot directly operate Head Start centersitself (Program A)
Mobility rates for seven indirectproviders are reported in Section 7of this chapter
Data from these indirect providersare not used in Chapter 111 to identifycauses cif mobility because they arefundamentally different in functionfrom The large sample of directproviders.
-22-

PROGRAM A
1GRANTEEINDIRECTPROVIDER
AGENCY ORGANIZATION
DELEGATEAGENCY
CENTER CENTER
DELEGATEAGENCY
CENTER CENTER
DELEGATEAGENCY
CENTER
DIRECTPROVIDER
ORGANIZATIONS
CENTER
PROGRAM C -2
GRANTEEAGENCY
CENTER CENTER

EXHIBIT H
Office of Child DevelopmentDepartment of Health, Education, and Welfare
RELATIONSHIPS BETWEEN DIRECTAND INDIRECT PROVIDER
ORGANIZATIONS
PROGRAM B
GRANTEEAGENCY -
DIRECT. PROVIDERORGANIZATION
CENTER
*PROGRAM C
GRANTEEAGENCY
" DIRECTPROVIDER
ORGANIZATION
CENTER
CENTER
DELEGATEAGENCY
CENTER
DIRECTPROVIDER
ORGANIZATION
CENTER

(2) The Data Reported in This Chapter Represent Mobilityin 56 Head Start Programs for a Stratified Sample
The reported programs are representative of astratified cross section of Head Staii programs:
The distribution by region of the programsreported are compared with that of the totalpopulation of Head Start programs (1971Office of Economic Opportunity data) inExhibit III, following this page.
The reported programs represent approxi-mately 6. 5% of the total population ofprograms.
The programs reported include representa-tion of two or more strata in every region.
The data for the 56 programs are derived frOmdata accumulated from 144 Head Start organiza-tions, including both grantee and delegate agencies.
Details regarding the use of stratifying techniquesin sample selection are presented in Appendix C,Methodology.
(3) Data From Programs in Which Not All Delegate AgenciesWere Sampled Were Adjusted to Represent the TotalStaff Sizes of These Programs
In some cases, data were accumulated fr0m lessthan 100% of the delegate agencies in a program:
The selection of the sampled delegateagencies is discussed in Appendix C.
These data were expanded to representthe total employees in the programs..
The adjustments were necessary in order tomake all programs statistically comparable.
-23- .
N

EXHIBIT III
Office of Child DevelopmentDepartment of Health, Education, and Welfare
HEAD START PROGRAMS BY REGION
All Head Start Programs
STRATUMA B C D_
!legion . TotalI 1 2 9 54 66
II 2 4 11 51 68
III 1 5 22 61 89IV 4 24 55 100 183
V 3 6 18 108 135VI 1 14 27 90 132
VII 0 4 13 39 56VIII 0 1 4 38 43
IX 1 8 17 27 53
X 1 0 6 31 38Total 14 68 182 599 863
Reported Sample Programs
Re ion
STRATUM
TotalB C
I - 1 1 3 5
II 2 - 1 - 3
III 1 - 2 4 7
IV 1 8 5 3 17
V 1 2 1 3 7
VI 1 - 2 3
VII - 2 2 - 4
VIII 1 - 1 2
IX 1 3 - - 4
X 1 2 1 4
Total 7 18 14 17 56

a
4)
The adjustments were made by using programweighting factors:
-N.
The weighting factor for a program wascalculated by dividing the total reportednumber of employees in the program inPY 71 by the number of employees for whichPY 71 mobility data were reported. (FY 71employee data were more suitable for con-sistency since a few programs did not re-port total staff size for PY 72.)
All staff positions and mobility data in ape9gram were multiplied by the program's
.
weighting factor. ,
. \
The use of program weighting factors allowseach program to be represented by its actualnumber of total employees without changingthe reported mobility rates.
Programs were adjusted in which the sumof employees reported on Project Data .
Questionnaires was less than the totalemployees reported for the program for1971, due to our not having received allquestionnaires.
The weighting factors used are shown inExhibit IV, following this page.
After program weighting factors were applied,staff position and mobility data.from all programsin a given stratum were summed, giving the totalmobility data for the stratum sample.
(4) Data in Each Stratum Were Adjusted To Represent theTotal Em loyees in the Po ulation Contained in theStratum
Stratified sampling is based on the principle thatthe samplv programs in each stratum are a statis-tical representation of all programs in the stratum.
-24-

EXHIBIT IV
Office of Child DevelopmentDepartment of Health, Education, and Welfare
-PROGRAM WEIGHTING FACTORS
, STRATUM A
UNITED COTtAMUNIIY CORPORATION. NEWARK. N s 311MI
. 1 08
AGENCt FOR CHILD DE yELOPmt.NT. NEW YORK. Si y 1205 . 1.5277114
UNITED PLANNING ORGANIZATION WASHINGTON, 0 C 52 5.26100
'CHICAGO COMMITTEE ON URBAN OPPORTUNITY. CHICAGO. ILL 720 1 05684
GREATER LOS ANGELES COMMUNITY ACTION (GLACA) LOS ANGELES CALIF 1492 1 351109
SEATTLE KING CNNTY ECONOMIC OPPr cr- .UNITY BOARD. SEATTLE, WASI4 478 . 3 08155
STRATUM B
ORANGE COUNTY COMMUNITY ACTION COUNCIL,. SAN TA ANA. CALIF 228 465"dg
ECONOMIC OPPORTUNITY BOARD. RIVERSIDE. CALIF 204 371. . 55
SAN BERNARDINO COUNTY BOARD SUP( RVISORS SAN BERNARDINO. Ct IF. 371 4 7079
STRATUM C
MONTGOMERY COUNTY DEPARTMENT OF COMMUNITYDEVELOPMENT, ROCKvtLLE. 125 1.60
STRATUM D
ANDERSON COMMUNITY ACTION COUNCILCLINTON. TENN. 22 2_75

TO make the data in a stratified sample statisticallymeaningful,.. the data in each stratum must beweighted so that the sample pop4lation becomesa statistical repreSent'ation of the total popul\ationof all Head Start programs.
The weighting adjuetments were made by usingstratum weighting factors:
Each stratum weighting factor was calcu-lated by dividing the total number of pro-grams in the stratum by the number ofreported sample programs.
The total number of programs in eachstratum was calculated from the 1971 datawhich were the bases of the sample selected.In a similar manner, weightizig-factarswere calculated for programs within regionswithin strata.
All staff positions and mobility data in astratum were multiplied by the stratum'sweighting factor to give weighted total turn-over and promotion rates for the stratum.
The stratum and region weighting factorsused are shown in Exhibit V, followingthis page.
The use of stratum weighting'ractors does not affectthe mobility rates within each stratum since theweighting factors are applied to both numeratorsand denominators.
After stratum weighting factors were applied,the weighted total numbers of staff positions andmobility data were summed for all four strata,giving the weighted total mobility rates for allprograms.

EXHIBIT V
Office of Child DevelopmentDepartment of Health, Education, and Welfare
STRATUMREGION
A 8
WEIGHTING FACTORS BY REGION
C D
I - 2 . 2 9. 9 54 = 18
1 1 3
11-- 2 = 1 11 =112 1
III 1 1 22 =11 61 =15.251 2 4
IV 4 = 4 24 , 3 55 = 11 100 =33.331 8 5 3
V 3 3 6 = 3 18 =18 108 =36Y1 2 1 3
VI 14 =14 90 =451 2
VII 4 = 2 13 = 6.5
2 2
VIII 1 1 38 = 38
1 1
IX 1 _ 1 8 _ 2.67
1 3
X 1 = 1 6= 3 31 =31
1 2 1
STRATUMWEIGHTING = 2 68 = 3.78 182 = 13 599 =35.24
FACTORS
.147 18 14 17

2. OVERALL STAFFING PATTERNS
This section discusses the overall mix of ernploiees, or
staffing patterns, among the various Head Start program components.
Staffing patterns are presented for each of three program years.
Weighted totals art. given for each stratum and for the four strata
combined.I
(1) No Shifts in Staffing Patterns Were Observed in AnyComponent for the Three-Year Period
The weighted total staffing patterns for all stratafor PY 70, PY 71, and PY 72 are shown inExhibit VI, following this page.
The education component is by far thelargest, employing nearly 60% of HeadStart personnel.
The overall number of employees has risenby about 12% over the 3-year period from45,419 to 50,995.
The percentage of employees in each com-ponent has remained almost identical forthe three years, indicating that no shiftsin staffing patterns have occurred.
The low percentage of employees in thestaff training component reflects thefrequent use of outside contractorsto provide training.

EXHIBIT VI
Office of Child DevelopmentDepartment of Health, Education, and Welfare
WEIGHTED TOTAL STAFFING PATTERNS
Component Percentages of Total Staff
PY 72 PY 71 PY 70
Education 59.5% 59. 7% 59.7%
Health 4.6% 4.7% '4.4%
Social Services 8.2% 8.3% 8.1%
Parent Involvement 3.3% 3.6% 3.2%
Nutrition 10. 1% 10. 1% 10.4%
Staff Training 1.3% 1.2% 1.0%
Volunteers 1.8% 1.7% 1.7%
Administration 12. 1% 12.3%-
Psychological 0.4% 0.4% 0.4%
Total Staff 50,995 49,270 45,419
NOTE: Percentages may add to more than 100% because an employee may-hold more than one position at the same time.

(2) Analysis of Components Within Individual StrataConfirms the Overall Stability In Staffing Patterns
The staffing patterns within each stratum foreach of the three years are shown in Exhibit VII,following this page. (This exhibit provides amethod of analyzing the differences in staffingpatterns among programs of different sizes. )
Except for an increase of 1.7 percentagepoints in administrative employees inStratum D (15.6% to 17.3%) no significantshifts in staffing patterns occurred in anycomponent of any stratum.
Stratum D programs show the largest per-centage of administrative personnel, pos-sibly indicating economies of scale in thiscomponent among larger programs.
The absence of observable shifts in staffingpatterns appears to reflect the Head Start policyof the past few years for programs to continueoperating at about the same funding levels.
3. OVERALL TTJRNOVER RATES BY STRATUM
This section presents the overall turnover rates which were
found, in the analysis of reported mobility data. Turnover rates
are presented by stratum:
For all employeelz""For professional and paraprofessional employeesBy HEW administrative region

Ehl-IMIT VII
-Office of Child Development
Department of Health, Education, and Welfare
WEIGHTED STAFFING PATTERNS BY STRATUM
PY 72
STRATUM A 57.0% 5.6 11.0 4.1 11.7 2.4 1.4 10.5 0.6. 12431
STRATUM B 60.7% 3.6 7.2 3.4 11.4 0.9 0.4 13.9 0.3 13281
STRATUM C 60 8% 3.9 7.81 2.6 8.6 1.1 3.1 9.8 0.3 13969
STRATUM 0 59.1% 5.6 6.8 3.1 8.7 1.0 2.2 17.3 0.3 11312
PY 71
STRATUM A 57.1% 5.4 10.8 3.7 12.0 2.4 1.4 10.0 0.6 11877
STRATUM B 61.1% 3.6 7.1 3.4 11.6 1.0 0.4 13.4 0.3 13076
STRATUM C 60.1% 4.1 8.1 3.4 7.5 0.7 3.1 9.8 0.4 13322
STRATUM 0 60.1% 5.7 6.9 3.8 9.6 0.6 1.9 15.6 0.3 10994
PY 70
STRATUM A 58.8% 5.0 10.2 3.6 12.2 1.5 1.6 9.7 0.7 11663
STRATUM B 61.3% 3.7 6.8 3.2 11.6 1.1 0.3 13.8 0.2 12754
STRATUM C 58.7% 4.0 8.4 2.9 7.5 0.9 3.0 10.4 0.2 11346
STRATUM 0 59.6% 5.1 6.8 2.9 9.8 0.4 2.1 15.6 0.4 45419
Note: Percentage's may add to more than 100% because anemployee may hold more than one position at the same time
..2 74,"A1.1,4,441.1ir

Section 4, below, presents turnover rates by component:
A turnover rate for a given program yearwas determined from the Project DataQuestionnaires as the total number of turnoversdivided by the total number of staff positionsfor that program year.
Turnovers include losses due to resignationor termination and losses due to lateraltransfers out of Head Start.
The three-year average turnover rate wascalculated by. dividing the total number ofturnovers by the total number of stalfpositions for each of the three years.
The three-year average turnover rate isan annualized rate which may be describedas the average yearly turnover rate observedduring the three-year reporting period.
Mobility data were reported for program yearsrather than for fiscal or calendar years because:
Programs usually maintain employee in-formation in time periods that coincidewith their annual funding cycles.
"Program Year" was a term familiar toall organizations.
(1) Overall Turnover Rates for Head Start Programs AreLow
The weighted total turnover rates for each stratumand for all four strata combined are shown inExhibit VIII, following this page.
The weighted total three-year average turnoverrate for all programs is 13.4%, representing19,535 turnovers and 145,681 staff positions.
-28-

EXHIBIT VIII
Office of Child DevelopmentDepartment of Health, Education, and Welfare
WEIGHTED TOTAL TURNOVER
Stratum A
PY 72
RATES BY 'STRATUM
3 yrPY 71 PY 70 Average
Number of Staff 12,431 11,877 11,663 35,973Turnover Rates 14.9% 15.5% 12.9% 14.4%
Stratum B
Number of Staff 13,280 13,074 12,752 39,107Turnover Rates 8.6% 8.4% 7.2% 8.1%
Stratum C
Number of Staff 13,970 13,322 11,346 38,638Turnover Rates 14.1% 11.6% 11.1% 12.4%
Stratum D
Number of Staff 11,312 10,994 9,655 31,962Turnover Rates 21.9% 20.9% 16. 7% 20.0%
Weighted Total
Number of Staff. 50,994 49,269 45,418 145,681Turnover Rates 14.6% 13.8% 11.7% 13.4%
NOTE: The total staff may not equal the sum of the strata staffs because ofrounding.

The total turnover rate for strata is quitelow:
At a turnover rate of 13.4% er year, theaverage program would take ver 7 yearsto experience 100% employee t rnover, asshown in Subsection 3 below.
The Literature Review (Appendix ) dis-:cusses turnover rates in similar tYpes of
organizations. In most cases turnoirerrates were higher in other organizationsthan in Head Start organizations.
The highest turnover rates are found in StratumD, the lowest in Stratum B:
An inverse relationship exists betweenstratum size and turnover, except in thevery largest programs (Stratum A).
The causes of high and low turnover rateswill be examined in detail in Chapter IV.
Average turnover rates in each of the four stratahave increased every year. The possible exis-tence of a rising trend which can be confirmedstatistically is addressed in Subsection 4 below.
(2) Over a Third of the Programs Had a Three-Year Average Turnover Rate Below 10%
The 56 programs reported are grouped into 5categories of 3-year average turnover in ExhibitIX, following this page.
When programs are compared in groupings of10% each, the largest percentage of programsare those having turnover rates between 0% and10%.
There are as many programs with turnover ratesbetween 5% and 10% as with rates between 20%and 30%.
-29-

EXHIBIT IX
Office of Child DevelopmentDepartment of Health, Education, and Welfare
TURNOVER RATE GROUPINGS
Turnover Rate Ranges
Percent of ProgramsWith 3-Year Average
Turnover Ratesin the Range
0-5% 21.4%
5-10% 17.9%
10-20% 37.5%
20-30% 17.9%
Above 30% 5.4%
(Total Number of Programs: 56)

. There are 4 times as many programs with turn-over rates between 0% and 5% as with rates above30%.
(3). More Than 50% of Employees Sampled Have BeenWorking in Head Start Loner Than 3 Years
The lengths of time in Head Start, as reportedin Current Employee Questionnaires, are shownin Exhibit X, following this page.
53.4% said they had been with Head Startlonger than 3 years.
This high percentage of employees whohave been with their programs for a sub-stantial length of time reinforces the lowturnover rates report( earlier.
The percentage also indicates that manyprograms are operating with a large coreof employees who have been working to-gether for a number of years.
(4) Turnover Raters in Each of the Four Strata Do Not ShowStatistically Significant Trends Either Toward or AwayFrom Greater Staff Stability
A test was employed to analyze the realness anddirection of the turnover rate trend for all pro-grams within each stratum:
These analyses gave an error term for eachyear's turnover rate for each stratum as awhole.
The error term was based on the degree towhich each program deviated from theaverage overall trend for its stratum.
-30-

EXHIBIT X-
Office of Child DevelopmentDepartment of Health, Education, and Welfare
LENGTH OF TIME EMPLOYEES HAVE BEENWITH HEAD START
Number of Months With Head Start Percent of Employees in the Range
0-6 11. 1%7-12 9. 0%
13-24 11. 8%25-36 12. 5%37 or more 53.4%
No response 2.2%
(Total responses: 2', 650)

Thege error terms provide a statisticallypossible range of values for each stratum'sturnover rates for each year. (The largerthe error term, the greater the range ofpossible values.)
The statistical rule for a rising turnoverrate trend for a stratum is that the PY 72rate must always exceed the PY 70 rateover the possible range of turnover rates.If any PY 72 rate was less than a PY 7.0 '-rate in the range, the possibility of a fall-ing trend would exist.
The data were analyzed at the 80% con-fidence level:
This level was necessary becauseof the short time interval (3 years)for a trend to be detected.
At this level, one will wrongly assertthat there is a trend, when in factthere is none, once out of five times.
Summary results of the statistical analysis ofturnover rate trends are shown in Exhibitfollowing this page:
In all strata, fewer than half the programsshowed any statistically significant trends.
Although some programs in each stratumshowed rising trends, five programs showedfalling trends. (The names of the programswhich showed statistically significant mo-bility rate trends are given in Appendix E.)
In no stratum was the observed trend strongenough to be considered statisticallysignificant, even at the 80% confidence level.

EXHIBIT XI
Office of Child.DevelopmentDepartment of Health, Education, and Welfare
TRENDS IN TURNOVER RATES
Expected Overall.Total Number of Programs Number Trend for
Number Showing Sidnificant the Stratumof Statistically Significant . at 80% at 80%
Programs Trend at 80% Confidence ConfidenceStratum Analyzed 'Confidence Level Level Level*
(rising) -(falling)
A 2 1. 4 No(1) (1)
18 8 3. 6 No
(6) (2)
C 14 2 2. 8 No(21 (0)
17 3. 4 No(5) (2)
''An overall rising trend exists for a stratum only if,over the range of possible turnover rates at the 80%confidence level. the average turnover rate for thestratum is always greater for PY 72 than for PY 73.

In summary, the following conclusiorr, can bemade regarding staff stability in Her.2. Start',programs: .
The variations in turnover rate trendsamong individual programs are-largeenough that the overall rise in the averageturnover rate found in each stratum isstatistically insignificant, and should notbe considered an indication of a trend awayfro:... stability.
A high percentage of employees have beenwith their programs for more than threeyears, indicating that a large element ofstaff stability has existed for several years.
Most programs have experienced so littleturnover in recent years that while there isno current trend toward greater stability,neither is there a need formore stablestaffing.
(5) The Turnover Rate for Professional Employees IsSlightly Higher Than for Paraprofessionals in Eachof the Four Strata
Professionals were defined for purposes of thisstudy as employees who were in supervisorycapicities or were component heads:.
All teachers, regardless of background,were considered professional employeesin this study.
Administrative personnel other than sec-retaries or clerks were also considered tobe professionals.
Paraprofessionals were defined as employees inone of the following positions, regardless ofbackground or training:
Tetiehees--aide-
-32-

Social worker aide- ---,Health aide
NUtritionist aideOther aide categoriesCookSecretaryClerkDriverMaintenance worker
Standardized definitions were presented in orderthat the data in these categories would be reported-as uniformly as possible in all programs. Insome cases, however, programs were reluctantto deviate from their own definitions of these
-terms.
The weighted three-year average turnover ratesfor professional and paraprofessional employeesare shown in Exhibit XII, following this page:
Professional employees in each of the fourstrata had an average turnover rate whichwas higher than that of paraprofessionals,although the overall difference is not verylarge.
In Strata Cs and D, the differences in turn-over rates between professionals and parapro-fessionals are too small to be of practicalimportance.
In Strata A and B, the differences in turn-over rates between the two employmentcategories are large enough to suggestthat some factors in turnover act differentlyupon the two categories of employees.
Although causes are examined more closelyin the next chapter, one reason for thehigher turnover rates among professionalemployees may be that more employmentopportunities exist for them.

EXHIBIT XII
Office of Child DevelopmentDepartment of Health, Education, and Welfare
WEIGHTED 3-YEAR AVERAGE TURNOVER RATES FORPROFESSIONAL AND PARAPROFESSIONAL EMPLOYEES
Professional Parayrofessional Total
STRATUM A
Number of Staff 15, 217 20, 755 35, 973Turnover Rate 16.9% 12.6% 14.4%
STRATUM B
Number of StaffTurnoyer Rate
STRATUM C
Number of StaffTurnover Rate
STRATUM D
Number of StaffTurnover Rate
WEIGHTED TOTAL
Number of StaffTurnover Rate
14, 40810. 0%
15, 73712.4%
13, 32020.5%
58, 68314. 8%
24, 6986. 9%
22, 90012. 3%
18, 64119. 7%
86, 99712.4%
39,1078. 1%
38,63812.4%
31,96220.0%
145,68113.4%
NOTE: Percentage totals may not equal 100. 0% because of rounding.
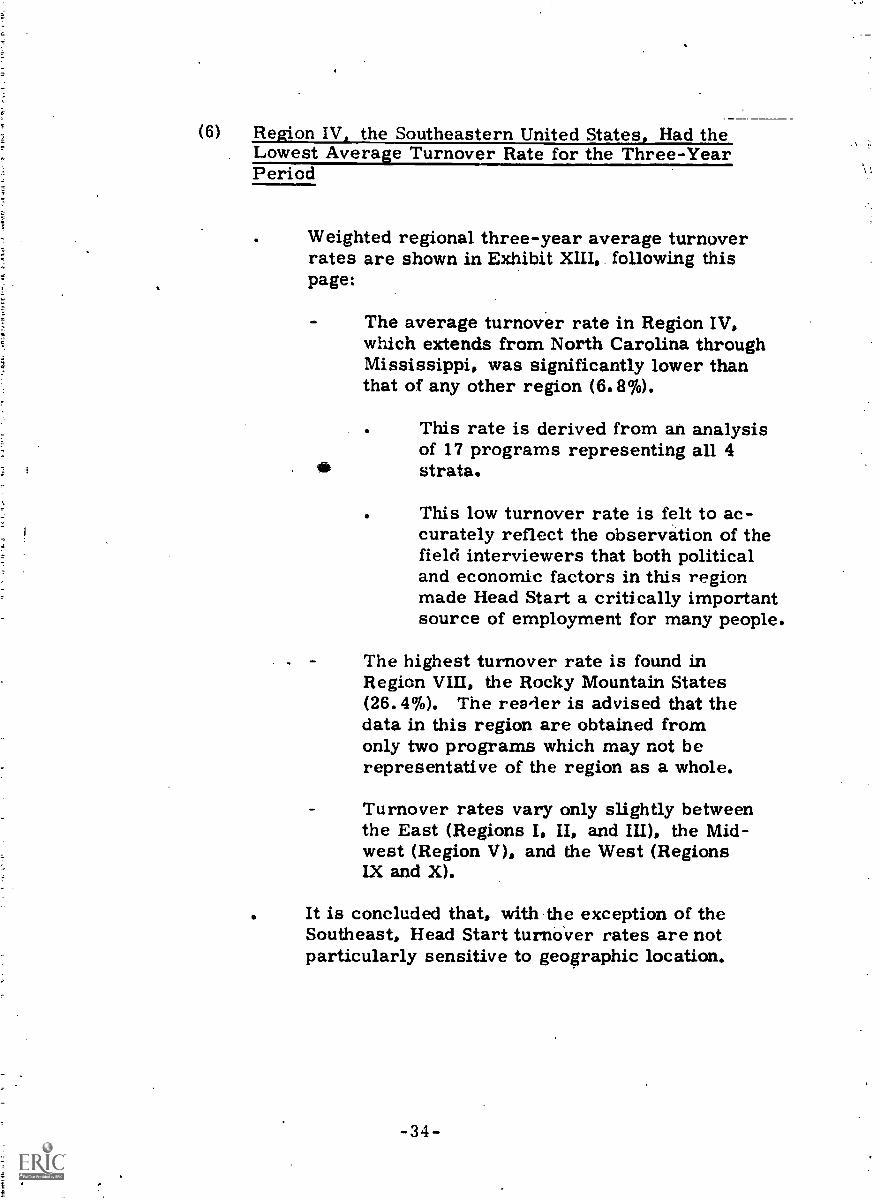
(6) Region IV, the Southeastern United States, Had theLowest Average Turnover Rate for the Three-YearPeriod
Weighted regional three-year average turnoverrates are shown in Exhibit XIII, following thispage:
The average turnover rate in Region IV,which extends from North Carolina throughMississippi, was significantly lower thanthat of any other region (6.8%).
This rate is derived from an analysisof 17 programs representing all 4
4E= strata.
This low turnover rate is felt to ac-curately reflect the observation of thefield interviewers that both politicaland economic factors in this regionmade Head Start a critically importantsource of employment for many people.
The highest turnover rate is found inRegion VIII, the Rocky Mountain States(26.4%). The reader is advised that thedata in this region are obtained fromonly two programs which may not berepresentative of the region as a whole.
Turnover rates vary only slightly betweenthe East (Regions I, II, and III), the Mid-west (Region V), and the West (RegionsIX and X).
It is concluded that, with the exception of theSoutheast, Head Start turnover rates are notparticularly sensitive to geographic location.

S
STRATUM A
Region 1 . Region 2 Region 3 Region 4 It
2'
38816. 1%
2,42 116. 0%
3,06014. 7%
5,86915.3%
4, 53314. 5%
alb
3, 2349. 2",",
.
7, 76712. 5%
1, 63021. 9%
5, 72213, 4%
4, 77322. 7%
12, 12618.1%
14, 5604. 9%
12, 9603, 0%
7, 4038. 9%
4, 23215. 6%
39, 1556, 0%
Number of StaffTurnover Rate
STRATUM B
Number of StaffTurnover Rate
STRATUM C
Number of StaffTurnover Rate
STRATUM D
Number of StaffTurnover Rate
WEIGHTED TOTAL.
Number of StaffTurnover Rate
NOTE: The total staff may not equal the sum of the strata staff because C.
34/62,

EXHIBIT XIII
Office of Child DevelopmentDepartment of Health, Education, and Welfare
WEIGHTED 3-YEAR AVERAGE TURNOVER RATES BY REGION
region 4 Region 5 Region 6 Region 7 Region 8 Region 9 Region 10 Totals
4,560 6,252 4,564 1,533 35,9734. 9% 19.9% 14. 1n 21.3% 14. 4%
2,960 2,625 8,372 2,424 754 6,388 39,1073.0% 8.0% 5.0% 9.0% 22. O'r 12,0% 8.1%
7,403 7,776 2,873 1,026 38,638
8.9% 13.70'n 10. 1% 18.7% 12.4%
4,232 5,508 2,745 1,026 1,736 31,962
15.6% 15.7% 44.3% 29.6% 12.56,'0 20. 1%
39,1556.0%
22,16115.0%
5,2979.9%
1, 78026.4%
10,95312.8%
taff because all strata are not represented in every region.
4,29517.1"'(
14-5", 68213.4%

erN
4. TURNOVER RATES BY COMPONENT
The previous section examined turnover rates on an overall .
basis without a separation into components. This section analyzes
the turnover rates found within each Head Start component. Turn-
over rates by component are presented:
As weighted averages for all programs for thethree years combined
For each year separately for all programs re-ported in the sample
(1) Overall Turnover Rates Are Low in Every Head StartCompopcnt
Weighted component three-year average turnoverrates are shOwn in Exhibit XIV, following thispage:
Although turnover rates are highest inhealth and social services, these rates arenot significantly greater than the oveaverage rate (15.6% and 15.7% compare13.4%). Thus, it may be concluded that inno component is the Mrerall average turn-over rate particularly high.
Stratum D, containing the smallest pro-grams, which has the highest overall turn-over rate, has its greatest turnover rate ineducation (26. 1%).
Reasons for this turnover rate ineducation among small programs arenot readily apparent.
Chapter III examines the relationshipbetween size and turnover in detail.
-35-

WEIGH
STRATUM A
Education HealthSocial
ServicesParent
Involvement Nutrit-
Number of Staff 20,730 1,915 3,837 1,371 4, 2!
Turnover Rate 14.5% 12.8% 16.3% 11.3% 13.-
STRATUM B
Number of Staff 23,876 1', 423 2,763 1, 312 4,5Turnover Rate 8.3% 20.5% 14.0% 10. 9% 3. F
STRATUM C
Number of Staff 23,184 1,560 3,146 1, 172 3, 0:
Turnover Rate 12.3% 11. 7% 12. 8% 8. 9% 16.
STRATUM D
Number of-Staff 19,064 1,762 2,195 1, 057 2,9C
Turnover Rate 26.1% 18.0% 20.0% 16. 0% 9. (.
OVERALL WEIGHTEDTOTAL
Number of Staff 86,855 6,661 11,942 4,914 14,8'Turnover Rate 14.8% 15.6% 15.7% 11. 8% 1.0. Cc
NOTE: Data may add to more than 100% because an employee may hold more than one pc

EXHIBIT XIV
Office of Child DevelopmentDepartment of Health, -Education, and Welfare
WEIGHTED 3-YEAR AVERAGE TURNOVER RATES BY COMPONENT
StaffNutrition Training
4,299 76213.4% 19. O're
4,511 3953.5% 16.3%
3,068 3400
14,87410.2%
1,70914.3%
Volunteer Administration Psychological Totals
525 233 35,9733,62825.8% 18,5% 12.8% 14.5%
147 5,366 107 39,10712.8% 3.9% 14.1% 8.1%
1,206 3,871 114 38,6383.2% 10.4% 0 12.4%
669 5,190 105 31,9626.0% 0 20.0%
2,548 18,056 560 145,6817.614. 9.0'5 8. 0"', 13.4%
than one position at the same time.

C.
The highest turnover rate in administrationis found in Stratum A (18.5%):
This may be a manifestation of thefrustrations frequently expressed inpersonal interviews with administra-tive staff in large multidelegate,.programB.
The general impression gained by thefield interviewers was that adminis-trators in the largest programs were
LI often faced with major political andoperational problems.
On the other hand, an 18.5% turnoverrate, although somewhat larger thanaverage, is not excessively large incomparison with turnover rates foundin the literature (see Appendix D).
(2) Six of Nine Components Exhibit Rising Trends inTurnover Rates
The component turnover rates for each of threeyears are shown in Exhibit XV, following thispage:
These data were obtained from the 144organizations previously mentioned.
No weighting factors were applied to thedata in this exhibit, since a detailed analysisof trends was made previously.
The six components showing rising trends are:
EducationSocial ServicesParent InvolvementNutritionStaffing TrainingAdministration
-36-

EXHIBIT XV
Office of Child DevelopmentDepartment of Health, Education, and Welfare
YEARLY TURNOVER RATESBY COMPONENT
PY 72 PY71 PY 70
Education D 4,992 D 4,881 D 4,70312.2% % 12.1% % 10.2%
Health D 398 D 382 D. 357% 12.1% % 14.7% %io 14.0%
Social Services D 820 D 789 D 736% 16.0% % 14.1% 13.0%
Parent Involvement D 309 D 286 D 261% 12.0% 10.5% 7.3%
Nutrition D 1,077 D 1,043 D 1,022°f00 1% . 8.6% 6.8%
Staff Training D 160 D 154 D 1230o'0 % 16.9% 0% 16.3%
Volunteer D 105 D 99 D 100% 14.3% % 15.2% % 15.0%
Administration D 1,022 D 954 'ID 924/0at 12.9% % 12.3% % 8.6%
Psychological D 31 D 31 D 32,00/ 12.9% 0/
/0 16.1% % 18.8%
NOTE 1: Data may add to more than 100% because an employee may holdmore than one position at the same time.
NOTE 2: The percentages in this exhibit are from an unweighted sampleand cannot be directly compared with data in other exhibits.

Psychological is the ..1:Nnly component showing aconsistently fallir4;:turnovt rate trend, indicatingthat this component is rapidly approaching greaterstaff stability.
Of the two components which showed the highestweighted turnover rates (from Exhibit XIV),health shows no trend and social services showsa slightly rising trend. Neither component showSa strong trend away from stability; thus, neitherappears to be threatening to become a problemin the near future.
This concludes the analysis of the extent of turnover reported
in the study. The next element of mobility to be.dnalyzed is the
upward mobility or promotions.
OVERALL PROMOTION RATES 13Y STRATI-Al
This section presents the overall promotion rate:, iiik.h
found in the analysis. Promotion rates arc presented by stratum
For all employersFor professional and paraprofessional employees
HEW administrative region
Section 6 below presents promotion rates by component.
The promotion rate for a given program year was determined
from the Project Data Questionnaires as the total number of pro-
motions divided by the total number of staff positions for that year.
Total promotions include both promotions within component:-; and
promotions from one component to another. The three-year

', .
average promotion ratwas calculated by dividing the total number
of promotions by the total number of staff positions for each of the
three years. As in the ,case of turnovers, the three-year average
promotion rate is an annualized percentage.
(1) Overall Promotion Rates for Head Start Pro, rams AreA 'roaplatel e as turnover Rates
The weighted total promotion rates for eachstratum and for all four strata combined areshown in Exhibit X171, following this page. Forpurposes of comparison, three-year averageturnover rates are also shown.
The weighted total three-year average promotionrate for all programs is 6. 90, representing10.073 promotions and 145,681 staff pr,sitions
The total promotion rate for all stratais only 5170 as large as the total turnoverraft! (6.97a compared to 13. dri). This isont-;istent with the tWormation obtained inpersonal interviews tLat in most programsthere arc few positions into which peoplecan be promoted due largely to a lack offunds to prrvide more than one or twolevels within most components.
The two strata with ighest turnover rates(I) and A) have the I -est promotion rates
This apparent verse relationsbetween turnove rates and pi omotionrate's suggests that,low promotionrates may be a factor in causingpeople to leave.
Causes of turnover are examinedfurther in the next chapter.

,r
STRATUM A
VI' 7' Pli* 71 PY 70
Number of sfaft 12, -131 11,663-
Promotion Witt'
s'Ilt.:vrum 13
6, '").-r. 5,3(J
Number -}f Staff 13,280 13,074 12,752
PrCrnotian R:t k! 9 47 6, 1:0
STRATUM
) tfy 1.4,3%1.2 11,346
Pr'Jr:1-..t.V2n
s-FRATT.-Ai D
6.
Nurnhcr c riff 41,312 10,9f.44 9.655
Pr()!Tif)tion 5,17. 0,4tr,
EIGliT 1'('T.,11:
Nunther of St.,:iffPt-or:tot:on It ite
")697 O.'',
NOTE 'rho total staff n.at: not quai the sum of t_h t.! strata staf;s bccause of rounding.
, I4.
45,4184,8%
IG

Exuma Nvi
Office of Child DevelopmentDepartment of Health, Edw..-ation, and Welfare
EIGHTF.D TOTA I. PROMOTION RATES BY STRATIT,1
r.`3-Year 3-YearAverage_ Average
Promotion Turnover
PY 71 PY 70 Ratef, Rates
11,877 11, 661 35,973 35,973
3. ?'r6, . 14.4(r.
13,074 12,73') 19,107 39,107
6.. 7:`. 6. 1' 8.1°
13, 11, f ?0, 38,638
n 6. 7' 9,07 12,47
10, 994 9,633 11 96'31
31,962
5. 1' - 0. 4!-- 4.4'''. 20, O'r.
49, 26" 4'), 418 145,681 14-1,621
7. 0' 4. fit'r: 6,9aL. 4-:"
ata staffs 'of rrrarphr
y16

The lowest overall promotion rate was foundin Stratum D:
Small programs lack positions intowhich employees ran be promoted.
Nevertheless, Stratum I) has showna definite rise in promotion rates inthe past two years.
It appears that prior to the past twoyears, upward mobility was almosttotally neille(:ed in the smallestprograms.
Average promotion rates have increasedevery year in each of the four strata, al-though-the growth has not been as great inStratum A as in the other three.
Prol:totionR:Ates Signifiront Rising'Trend. in Ever,. Stratum i-'a Stratum A
tf.!!-t V. ;t,-; lOpited to the prornot ton r:0A.trends in all programs as was used earlier to:walyze turnover r:ite trends in terms of sta-tis--ti al sin Y:once (M)' conflrience).
A surnmar of the results of this statistanalysis is presented in hxhibit \VII, folhwingthis page.

EXHIBIT XVII
Office of Child DevelopmentDepartment of Health, Education, and Welfare
TRENDS IN PROMOTION RATES
Expected OverallT6tal Number of Programs Number Trend for
Number Showing Significant the Stratumof Statistically Significant at 80% at 80%
Programs Trend at 80% Confidence ConfidenceStratum Analyzed Confidence Level Level Level* _,--
(rising) (falling)_ --
A 7 4 1.4 No
(3) (l
B 18 8 3.6 Yes(5) (3)
C 14 3 2.8 Yes(2) (1)
17 4 3,4 Yes(4) (0)
*An overall rising trend exists for a stratum only if,over the range of possible promotion rates at the 80%confidence level, the average promotion rate for thestratum is always greater for PY 72 than for PY 70.
29a.

Although the percentage of programs show-ing statistically significant trends ishighest in Stratum A, it is the only stratumwhich shows no overall trend.
This is caused largely by the signifi-cant variation from the average over-all trend among the other programsin the stratum.
The names of-the programs whichshowed statistically significant mo-bility rate trends are given in Ap-pendix E (pages 27 and 28).
The existence of a real trend in three stratasuggests that the Career Development efforthas had a positive impact on opportunitiesfor upward mobility.
The absence of a trend in Stratum A maybe another indication of operational problemsin the largest programs, since it would beexpected that the most opportunities forpromotions would exist in these programs.
(3) Prynotion Rates Are Slightly Higher in the East (RegionsI, II, and III) Than in Other Parts of the Country
Differences in overall promotion rates are alsoanalyved among the 10 HEW AdministrativeRegions.
Weighted three-year average promotion ratesby region are presented in Exhibit XVIII, followingthis page:
The regions of highest and lowest promotionrates (Regions IX and VI respectively) areboth represented by programs from onlytwo strata. Conclusions regarding thereason for these rates should,. thus, be;ivoided since these programs may not berepresentative of the entire region.
-40-

W EIG
STRATUM .\
Region 1 Region 2 Region 3
Z. 4;
Region 4 Region 5 Region 6 R
Numb,:r of Staff 4, 533 1, 630 14, 560 6,252Promotion RP to 7. 6`ro 10. 06;:, 3. 8% 5. 4a:o
STRATUM I3
Nutnbcr Of Staff 388 12, 960 2, 625 8,372.,t..ornotion Rate 8, 8":, 3. 8°.;) 7. 77:: :3. 5(7,)
STRATUM C
Number of Staff 491 :3,234 5, 722 '1,403 7, 776Promotion Rate 5",, 10. 9'1:, 6. la:, 9. Pri, 11. V:
STRAT I .1.1 I)
Number of Staff 3, 060 4, 773 4,232 5, 508 2, 745Promotion Rate 4. 7"; 1.6(r. 0
WEIGIPTED TOTALPROMOTION RATES
Number of Staff 5, 869 7, 767 12, 126 39, 155 22, 161 11, 117
Promotion Rate 9. 0";, 0";, 7. 3.7, 4. sq,.. 7. on 2 617",
WEIGHTED TOTALTURNOVER RATES
Number of Staff 5, 869 7, 761 12, 126 39, 155 22, 161 11, 117
Turnover Rate 15. 3";. 12. 5",, 18. la:, 6. WI; 15. 00, 13. Tr.
NOTE: Data nav not add. Strata are not represented in every region.

I;XIIII3IT XVIII
Office of Child DevelopmentDepartment of Health, Education, and Welfare
It LIGHTED 3-YEAR AVERAGE PROMOTIO>1 RATES BY REGIC
:on 4 Region 5 Region 6 Region 7 Region 8 Region 9 Region 10 Totals
5.60 6,9395. 4.7:,
4, 5646.0%
1, 5336.4%
?5, 9736. :3 %
960 2,625 8, 372 2,424 754 6, 388 39, 1077. 7": 3. 5':, 11.0 5, VI 13.8% 7.4%
403 7, 776 2, 873 1, 026 38, 638. 11. 3r, 5. 9. 9. 0%
232 5,508 2,745 1,026 1,763 31,962. 2. 6", :3. Tr,, 0 4. 4%
155 22, 161 11, 117 5,297 1, 780 10, 953 4, :322 145, 6816"",) 7. 0": `). 0": 4. 2"., 10. 5"", 4. 4`7", 6. 9%
155 22, 161 11, 117 5, 297 1, 780 10, 953 4, 322 143, 681.0": 15. fr:. 13. 77:, 9. 9":, 26. P.,. 17. 1":, 13.4%
region.4.;
r.
944

Three of the 10,.n. reaions of highest pro-motion rate are located in the East, namelyRegions I, II, and III.
No other apparent correlations appear toexist between promotion rates and geo-graphical lo it ion.
6. PRO)IOTION RATES 13Y COMPONENT
Up to this point, promotion rates have been analyzed on an
overall basis without a separation into components. This section
analyzes the promotions found within each Head Start component.
Promotion rates by component are presented:
As weighted averages for all programs for thethree years combined
For each year separately for all programs re-ported in the sample
(1) Overall Promotion Rates Are Low in Every ComponentExcept Staff Training
Weighted component three-year average promotionrates are shown in Exhibit XIX, following thispage.
The exhibit also shows component promotion rateswithin each of the strata.
The lowest overall promotion rate is in thopsychological component (0.4'5)). This is most
-3 1-

C
WEIGHTED 3
Social ParentEducation Health Services Involvement Nutrition
STRA TU NI A
Number of Staff 20,730 1,915 3,837 1,371Promotion Rate 2.7% 7.0% 8.2%
STRATUM B
Number of Staff 23,876 1,423 2,763 1,312Promotion Rate 8. J";, 4.9% 5.4% 6.8n
STRATUM C
Number of Staff 23,184 1,560 3,146 *, 172Promotion Rate 9.6a; 5.8°,; 8. 3% 1.6%
STRATCM 1)
Number of Staff 19,064 1,762 2,195 1,057Promotion Rate 4.6";) 6.4% 0
WEIGHTED TOTA ,
PROMOTION RATES
Number of Staff 86,855 6,661 11,942 4,914Promotion Rate 6.9";,
WEIGHTED TOTA I.T:JRNOVER RATES
Number of Staff 86,855 6,661 11,¶42 4,914Turnover Rate 15. 7",: 11.8^,;.
4,2994.0%
4,5113%
30611.0,
2,9952.4%
14,8746. lq;
14,874
Data ni:-ty zuld `o more than 10G":. becan-te entploce may hold more than one position at

EXHIBIT XIX
Office of Child DevelopmentDepartment of Health, Education, and Welfare
WEIGHTED 3-YEAR A yERAGE PROMOTION RATES 13Y COMPONENT
NutritionStaff
Train,oq Volunteer Administration Psychological Totals
4,20,4. O,
7629.6n
52523.6(';
3,6286.0{r,
233 35,9736. Trn
4,511 395 147 5,366 107 39,107
7.35 22.05, 17.95 3.95 0
306 340 1,206 3,871 114 38,63819.1q; 5.7"1 0 9.05.
e , 903 211 669 5,190 105 31,962
2,4": 0 1) 7": 4. VI,
14,874 1,709 2,548 18,056 560 145,681
6.15 13.2", 4.4":. 0.4" 6.9C:
14,874 1,709 2,548 18,056 56r 145,681
10. 2'r, 14.30; 9.0", H. V,. 13.4".
oti pisiti)ri at Ow ;mil tun.

likely because there are no positions intowhich a person in this component could bepromoted.
The highest overall promotion rate is instaff training (13. 27,O). Since these posi-tions tended to be filled by people whofilled two roles simultaneously, this maysimply reflect movement to this dual role.
The promotion rates in Stratum D wereparticularly low in administration andnutrition. This probably reflects the lackof positions to which directors, secretaries,and cooks can be promoted in smallprograms.
(2) Four of Nine Components Exhibit Rising Trends inPromotion Rates
It was previously noted that overall promotionrates for the three-year pericd showed statis-tically significant rising trends in Strata B, C. _Au] 1).
Exhibit XX, following this page, presents thepromotion rates for each of three years fol.nd inthe components within the 144 organizations forwhich mobility dit.a were obtained. No weightingfactors were applied to the data in this exhibit,since a detailed analysis of trends was madepreviously.
The lour components showing rising trend:-:are:
EducationStaff trainingN;olunteerAdminitration.
Parent involvement is the only componentshowing consistently falling promotion ratesfor the three-year period.
_42-

alucation
Health
Social Services
Parent Involvement
Nutrition
Staff Training
Volunteer
Administration
Psychological
EXHIBIT XX
Office of Child DevelopmentDepartment of Health, Education, and Welfare
YEARLY PROMOTION RATESBY COMPONENT
PY .72 PY 71 PY 70
D 4,992 D 4,881 D 4,7038.5% 6.2%0 /0 5.0%
D 398 D 382 D 3573.0°70 /0 5.2(1,70 ,0 3.1°,"c
D 820' D -789 D 7366.3% 7.4% /0 6.8%
D 309 D 286 D 2610/0
D%
Dcocoo
Dcr,
4.9%
1,0775.9%
g g
16024.4%
105-24,8%
1,0226.8%
313.2%
,0 7.3% °'0 7.7%
D 1,043 D 1,022% 4.1% (ry
ia 4. 3%
r 154 D 12350 3. 3%cr 13. O To/0
D 99 D 10020.2% 13.0%
D 954 D 9244.3% 3.3%
D 31 D 320%
NOTE 1: Data may add to more than 100% because an employee may holdmore than one position at the same time.
NOTE 2: The percentages in this exhibit are-from an unweighted sampleand cannot be,directly compared with data in other exhibits.

Except for the two small components, stafftraining ;Ind voluntevr, education had thehighest promotion rate in In 72. This isan indication that more programs are fillingteacher vacancies v internal promotionssuggests that Career Development :as had. apositive impact in this, the largest HeadStart con-troni.fit.
This concludes the -analysis of the extent of upward mobility
reported in the study. The. final section of the t.hapte/r
turnover and promotion rates in indiret-t provider 6rganizat ions.
TURNOVER :\\1) PROMOTION RATES FOR \infaxrPROVIDERS
In sever,1 of the -t.irt programs !tire than
one delegate agency, the grantee agency plaed no direct role in
t)i)era'Aile -arc
'n,..itutorini2, and coorlin.itine the oper-itions to- the'delegate igencies.
This section examines the turnover and promotion rates in the
seven indirecl provider organii.ot ions for whik h data were reported.
I
rm)

9: ( 1 For Indirect Provider Or anizations. Turnc...er RatesAre Hi her and Promotion Rates Are Lower Than forthe Overall Average of All Programs
Exhibit XXI, following this page. presents mobility
data for seven indirect provider grantee agencies:
The average' turnover rate for indirect providersis 42% higher than the overall average rate .
(19(7.1, compared to 13.4T0).
The average promotion rate for indirect pro ersis 36'70 lower than the ovcrall average rave14. 4%compared to 6. 9%).
Promotions only occurred in Straturn,..A indirectQ
providers.' This suggests that onlythe largestprograms have been able to provide workablecareer ladders in th, se organizations,
Turnovers were highest in Stratum,19ndirectproviders where no promotions :i`cctirred. Thisagain sua sts that a lack of promotion oppor -tunities may cause employee dissatisfaction andresult in increased out.;.ard mobility.
(2) Indirect Provider Organizations Exhibit MobilityCharacteristics Similar to Those Found in theAdministrative C m onent of Head Start Pro rams
A comparison cif the data in Exhibit XXI with mobility
information from previous exhibits provides further in-
sights into the nature of mobility in indirect provider
organizations.
The average promotion rate or indirect pro-viders is the same. as the average promotionrate in the administrative component of lift
-44-

()It.1.3nt7Ation
l!notH (-11ro;Trnt.::in,
g.tntv t(Ir HtfiNt-A V Y,Irk
t'n:11.0 H ?imtny: 7,1f
ii. (7
4 . P r !?, ,.
"1 f..I.V.T.r
r1;
! 1,
Av.:raps- f-?,,
7,1 t .111 ?177.1
Der
TritNOVER AND PROM.,
r A cr
A41'11'; Rate
0 cr

'11'11\.
StrntN,..:t
EXHIBIT 'XXI
tithyt., if Child Devel-Tricnt,)1 P,1101, Eduratton,
\Nn HAI ES IN INDI 131.1-1 11;411v_IDL.ft GRANTF--,1
1,.-ur:_tot--t
f"
ft
'i
th,
1',/ 4./ few
vrr.i).r
1'3

programs (4.4-i. 'I his is riot surprising sinceindirect pro...-iders arc basically administrative()rganizauons.
'1 b. a..crage turn:)..er rate fur indirect providersis vt-r`; ir-nilar to the turnover rate in the admin-IsTrativf. component of Stratum A programs(i 07. compared to 18. This suggests thatpersonnel zriciirec.:t provider organizations mayhe experiencing similar operational frustrations
acirrunistrati.. perF.onnel in the largest programs.
In conr.luio, anal; cis mobilit:, rates in inihrect
orearLizati-in" inti-ntlfin that their
chara: ti ;-rt. iiiffk. vent that, for the
:-. 'hi, f X` r011. t'1'.:
tail'') f-rnpirlyee mobilpy.
1 he analysis the extf nt of employee mobility has shown that
overall turnover rates are quite low and apparently stable and that
promotion rate-.:, although lower than turnover rates, have shown
a rising trend over the last three years. The overall low turnover
rates found in the analysis suggest that, for Head Start as a whole,
high turnover is currently not a problem. he reader should bear
in mind this fact when he examines the analysis presented in Chapter
Irnpnr-t -,f when he Considers the poll( omphrat,,n-m
of the analysis presented in Chapter IV. Causes of Mobility,, which
follows immediately.
-4

(::\ :1()BILIT\
I L1';')!.4 r '!I !!if. ard ;f i'+,
H,!!'.. i ilf f ritid-art
( 2 . T . T / I t . : 1 t i.51 ) ! . 1: . )1 t
- 11,
,t
.--# . ) . :
I
#.
/:,41;0.4-! 1.4; I 4.)9. gtql
AI:
I:! it :1! !!!:if !,
. ;i, 111W--.t! ;I! k.
4; -'''!..j% \ 14 ! .- 4-
\14;rj41
#
t, i1 'in .111.11'. a :t
01 I :11

certain variables and employee mobility. Themodel is composed of five major categories ofvariables:
External constraint (exogenous) variablesControl variablesJob environment variablesProject experience variablesOutcome variables
The c.iassification of variables into these categoriesis presented in Exhibit XXII, following this page.
The information from which the conclusions inthis chapter were derived was obtained from
Interview notesCurrent and Former Employee QuestionnairesProject Data Questionnaires
(2) Variable Characteristics of Head Start OrganizationsWe re Tested For Relationships with Mobility layExamining the Highest and Lowest Turnover in DirectProvider Organizations
We examined primarily the analytic rer;u14:- -?f thefifteen organizations with the highest outwardmobility (three year average) and thE fifteenorganizations with the lowest outward mobility.These extremes ai.e most apt to reveal the causalrelationships.
W 'also examined for possible causal relationshipsdata from thCa-eVerrty Head Start programs in theemployee mobility sample, for example:
Iiiterviws.xith organization directors. . Per8pectives of former employees
In vit.ntifying the fifteen highest and fifteen lowestmobility organizations, to analyze Head Startvariables, we adopted the constraint that only one

EXHIBIT XXII
Office of Child DevelopmentDepartment of Health, Education, and Welfare
ANALYTICAL MODEL
EXTERNAL CONSTRAINTVARIABLES
ECONOMIC CONDITIONS OF THELABOR MARKETBUDGETARY LIMITATIONSLEGISLATIVE LIMITATIONSADMINISTRATIVEREGULATIONSGEOGRAPHIC LOCATION
JOB ENVIRONMENT VARIABLES4,CAREER DEVELOPMENT OREFFORTMANAGERIAL STYLE AT THEOPERATING LEVELCOMPENSATION RATESWORKING CONDITIONSPROGRAM LIFE CYCLEROLE OF THE REGIONALTRAINING OFFICERETHNIC MIX OF STAFFVOLUNTEER TO PAID STAFFRATIOCHILD TO STAFF RATIO
CONTROL VARIABLESEMPLOYEE ELIGIBILITYSTANDARDS AND SELECTIONCRITERIAOPERATIONAL RESTRICTIONS- FULL YEAR, EIGHT-MONTH- FULL YEAR. MORE THAN
EIGHT MC.' ITHS- PART-DAY
FULL-DAYCHARACTERISTICS OF THEREGIONAL OFFICENATURE OF THE GRANTEEPROGRAM GUIDELINES- STAFFING PATTERNS- MINIMUM DELIVERY
REOUIREMENTS
PROJECT EXPERIENCE VARIABLESEMPLOYEE EXPECTATIONS
ACHIEVEMENT- RECOGNITION- RESPONSIBILITY- ADVANCEMENT- Rown4- JOB CONTENTOCCUPATIONAL INCLINATIONSSTAFF IP. 'FRACTIONS
OUTCOME VARIABLESJOB DECISIONS MADE BYEMPLOYEES- INFLUENCED BY CHOICE AND
OPPORTUNITYTURNOVER SY COMPONENTTURNOVER MI EMPLOYEECHARACTERISTICSLEVEL OF PRODUCTIVITYMOTIVATIONAL LEVELSFAVORABLE ANDUNFAVORABLE EMPLOYEEFLOWS- UPWARDINTERNAL- UPWARD- EXTERNAL- LATERAL-INCREASED
COMPETENCE- DOWNWARD-INTERKAL- DOWNWARD-EXTERNA- LATE RAL-DECREASF
COMPETENCE

organization from a single program wouldhe represented
The 'Mary Holmes program, with headquartersin Jackson, Miss., would haAe constituted 401)of the lox%' mobility group if this precaution hadnot been observed.
This constraint helped to avoid. duplicationsof the same characteristics within a programwhile examining the variables.
We excluded grantees which are only indirectproviders from this section of the anal..sis inor(h to standardt,.? the analysis with organiza-tions %%hich operate Head Start centers.
1. VARIABLES RE:I...ATI:I) '10 NIOBILITY AT .1. 00 CONFIDENCE I.F.VELS
rach or the variahle:-:. in the anal%11( al,-\amined t11rout_111 use of (int of the following:
hi-square to-t einpl(),d upon a ( ontm-iit.4 table
A T-test
\.ariables ir.erued as related to ttirnoz- :itthe l(,. (1 :i1)o
litidgt eutsExtent of Urbani 7:ti i till
promotion authority1 .itista( tion v ith t o- worker,
olunte, riSt;.ft 1?,ith
\on of tn. five in:i,or citeois of the !Lo(!e)prdon.inatd ill its orrelation Itll turnoker

(1) High Turnover Organizations e:12 More FrequentlyAssociated With Budget Cuts Than \\ et .)w
Turnover Oonizations
Nearly every program voiced budget problems,in the form of salaries, budget or staff cuts.Budget cuts constituted the problem listed niost
quentiv among budgetary Innitations (PData Questionnaire, Question ii13).
Within the past f.wo federal fiscal ars eight ofthe highest turnover organizutions (as compark.,dwith two of the lowc.st turnover organizations) hadexputnced budget cuts \k !Itch caused theih tciihunat delegate agenc..
Exhibit XXIII, following this page, demonstrates whichorganizations reported having experienced budget cuts.
1-he budget cutiturnot.-er relationship was also verifiedby cxamining thc c 1.f de ralI funded personne'costs for each oeanization
I tittI1. 1111 .. I th rfrit ml,lots Of :-.1..ent\ -fivein(iic;tted th.it the funding l%l
other ',voider! turh,,%-e. '1 tl,put)hln::; and the. numbe: ()I (!r.,:-ernz:it )( mdi i-.1 tt 11( })t-,)164.m;-,
((iii I I I; (2.0)
`tart I )11,1.: 1;i ': ,,tit .t s t ( rich11,!re.n (31)
I it-ad :Tht art ( loc'ate'd III Iti.t(Iflittistct;i WI% (?.-1)
:4 sk (-4)
La, ,It t'\ 1.(,1. irtii 4 till 11 (t1)
-tr t, t 14. II.. tt14 Wit I ff. ^,1141!1 (2)

EX/11B1'1 XXIII (1)
Office of Child 11)..velopmer tDepartment of Ile..:!th, Educ .tion and Welfare
111MATIONSIIIP BETWEEN BUDGETCUTS AND OUTWARD MOBILITY
Outward l\IIhility'hrci.b-Yeat Average! Organ! nation Name Budget Cuts
53n Chicago Youth Centers - LEARN, Chicago, 111. Yes
43''',3 Bushwicic Community Corporation, New York, N. Y. Yes
43; Kountze Independent School District, Kountze, Tex. No
Seattle Pubiic School.;, Seattle, Wash. ' ;vs
35% Child Care and Development Services, Los Angeles, YesCalif.
Coi.linuritty iftiproVeITICIIt Council, Lanvilfr, Va. Yes
X31 -n Coroni Norco head Start, Corona, Calif. N
Thcmdson School District Rli,1. , I ovend, CoP)
29 t ransi.on . , .. ni&v Action, Cranston, R l
Bonner .;1rinii,- ti. hoi,i NI , Bonner h, 'til
NIWnk, P!Iiit \heti, %vs
24 f'-;t-14 . S:11,.sur%
244% Suss4t County Community Actton Agynt.v, Int .
(i..'4 Out
24n `;t. A 11,.ttl',.; 1)a'. 11a.
PI'T" Ptit'il( Denvf,r, N,,
4".% :iunt 13.1;!/-.1 Eiitikat ton. 11;i., nf,;:vill. A ?i's
4'!'n 111,A aukrt. Pull! Atik,, Vs. 1:-+. N-
4". Itanatolt- I' ut. ( Indiana; N
4'2 Ft : PI"L:14.nr.
r". Tt I A. ¶1441 I .acirmlInt v., N. .
MonWorovt.': L aunty Coli.niuntt, Agent-. , No

EXHIBIT XXIII (2)
.)utuaci Mobility !
ree-Year Average) Organization Name ButigetSLIs
1% Community Service Association, Jackson, Miss. Yes
.13'n Frederick Douglass, Child Development Center No
Los Angeles, Calif.
Vc Coshocton County Beadstart, Coshocton, Oh ii, No
(re Garrett Keyser Butler School District, Garrett, Ind. No
Vo Mooresville Public Schools, Mooresville, N.C. No
West Lake Cumberland Area Development Council. No
Columbia, Ky.
0'?0 Delta Hills Educational Association, Sardis, Miss. No
Mary Holmes- (Rankin county) , Jackson, !)!iss. Yes
The fitlary School, Newark, N.J.

i 111:- t Ili It t.k)N. t. ti k %:
1 itt !"frit tII tA! CrIcricui.r tithors I ii:-1t talked \k Ith. I W ould tht: uutrtastr. Stat tt)f azIckiu.ltV fundinv, for facilitits and iu ttiil
:tteriztl- Arid tht i.f . eat'rt,g.rtay.r. ur111;Itl%cc
In tele:,ht.ine intur% tov, v ere coiliiiictedtt. the fillt...en
lyucii4et ut .t1,1ch1,1. t-litninated v. ere :-eveatud to lie tilt;
:-11".111.1cat1t tak-ttir in leavitie. Ileatt Start
t)I r Itt:t.es v. ho ri.-:-zpontit.H toleft field St:4r' tim'init.o.n.titit
1,ei,-all.-t their pilsititqi elirr.mated
E\Iiihit , 1.)11,)..ifig tilts pagt., lists thk rrint;t.tint It f"rwel.
fit!. It a Start in inter...ft-A ttn
12) rul
rtir 1)t-t);:k)Il1tirt t1 1li1I tYre,all1.*:111(q1:s rcprt:-.critutiif the ilc; 1:1 5t r than 1:It , 4 1 ( , i . t l : r 1 1 , ' \ 1 r411.1:1
- 1 1 ) 7 4 that t UZ nwt r- ettin in 11;t11 .;itt-a.-. tit t/i tilt tlifit2 tII &' tr ht
ct 911' Iahiir It!a /I., el hi', t.ctl.I!:
tf; t !.1t *1.. );r. -

EXHIBIT XXl\'
Office of Child I)evt_bloptnent1)4,n:u-tt.Ifnt Edttotion, and k tqfa
REASUNS FORN1ER EM PLOY EES GIVE Ft)liLEAVING.TIE.".D START F.xiilLovmENT
INTERVIEWS wrrti FoRmER EmmovEESOF HIGH TuinovEn ortGANIzATIoNs
relc,r. most 1.! tiqut.ntly NIcntiontu Rua:sons
16 1)1.- rirl tjtd and position (1r,)i)ptsil
Fattlil% pei.s-+nal orv,laetn
1 (.)ntlict Ith sttper...s:ws a-thninistz.Ation
4.41 EST1ONN IIECEI El) FROMFull\ h PI tY
Four. 110st 1.-ruqucntly Iflt1ofltL4
Per:44.3114d 1. t III 1 1 r .31)10111S
Ii) I ,t !41.! 1/
f.; t() cra, t-,-;144- cti

Because rural areas` do not experience as muchturnover as urban areas. one .ca.tript assume thatthere is no employee dissatisfaction m those progran.s
In contrast to rural areas, the dissatisfaction ofemployees in urban areas is displayed most clearlyby turnover because the individual has moreopportunities i"avenues") avai;able to him.
(3) Fewer of royal Authiarit for Promotionsand Salary Increase Existed in Or anizations of Hi hTurnover
(4)
A chi-square test was performed in the number oflevels of authority in high and yew turnover organi za-tions and the difference w significant at a con-fiden.le ievel = f 900,:.
highest t urgani.tattini- Atiantedauthority r anging
Thr tA. V. n3 six lent: l5 of authorityfor the fifteen turnover agencies. In fai t.eivtit of the fiftv.,en highest organizations had onivone level of approval authority.
Turnoycr may have bctri related to this variabli.because employe...sfelt more subjectively judgedin those organizations with fewer levels of authority.This may have caused resentments and a greaterdesire to gave the program.
Curr'e'nt. Employees Have More Complaints AboutRelatifInshws With Co- Workers in High TurnraverOr ?anizations Than in Low Turnoverni7atii--,:,
Carrf,rit ernpinvcc.s e re asked: well dope- le in Head St:irt get along with.1. r The responses whichsatisfactory relai.onships ..kere "Not t all" iir"a little-.

. .
all. Cot-runt Embh.),..ees (26:10) ir.f..4.1voof tzt:..3t. rt.,st,oust-s
:\t Ow .95% wificitncu level, tho.'hiPheAt. turni:IverSL °It' acturi.?,'!.41 tN. ic .0, '7: .1 on-
at..,-tono t...orket s rnorethsia tht. C C I =
A cut reid .if licadStart. ttit- 1:4)414-.; I 1 C:i rflav
to. !wt. h.-r f,tartpr421-17117
'1"!: *,A)! t r:71.`t (1-Cs%": ti::3Che 71!;:i
tt-"IcTiltt a fier.-;.
Thip-l'are no cltar lumits iii i -pi,
rrrfronFibilities dIltfos.Nteti cr.-t-rstep authority in theCr! 110'0111
Due tt, lack of iallituri.id conI !-j--
ti;ich rJl^ pro-ei-.0..o.-Dtfir:; In Ult. t'lar;stUf,n1
ii,. aid ri` fi r,:t.111.1-411
are text rt ht.11igcrvnt, andt.wcaur.u.: tht v they are
6,Hnk; hen is butare gettinc. paid le-
Pii+- Dire( !,,r, i oki,t.nylutk..1v unre,q)nristvt,to all pt. these
ic..nr-nler empinet:.;,3 .4t4? opt1.1suall:, to : Oi:5::;atisfact:on ith c(),-,xortk..r's as apx.in.:;tplit.-rfon tor tea tang ficad Start.- Onlyc.)1: all former iimployee8, reL,por:thrig to the que:ition-
ti

naire said they leftq3ecause they could not get alongwith other people
In general, former employees gave less .
negative reasons for leaving such as "personalor family problems " which detnoiistrated areluctance to criticize Head kart at all
(5) j Volunteer/Staff Ratios Were H her in H h TurrioverOrganizations
a statistical analySis was made of the relation-ship between volunteer/staff ratios and turnover itwas discovered that the variable was relatedat the .99 confidence level
High turnover organizations have an.aversgeof 2.4 volunteers per staff member
Low turnover' organizations have an average of.69 volunteers, per staff member
This phenomenon is probably more directly relatedto the urban /rural variable than to turnover
There are fewer volunteers in the classroomin rural areas because of the transportationproblem
The rural eharactdristic is associated moreoften with low turnover than with high turn-over crganizations
The interviewers did not encounter any,,g6m-plaints about volunteers (either toosaany ortoo few) which would he seriousfri)ugh tocause employees to leave the,program

2. VARIABLES RELATED TO OUP WARD MOBILITY AT .75CONFIDENCE LEVEL
This section describes two variables for which there is as
great as .one chance in four that a relationship with outward
mobility does not actually exist:
Promotion RatesType of Organization
This confidence level is not highly significant, but does.-indicate
a tendency for a causal relationship to exist..
ti
(1) Promotion Rates Were Directly Related to TurnoverRates in High Mobility Organizations
The relationship between turnover and promotionis one consisting of contradictory associations.
On the one hand, low promotion rates cancause employee discouragement resultingin resignations from the program.
On the other hand, there is la tendency forthe very high turnover organizations to bethe ones with relatively high promotion ratesand for the very low turnover organizationsto have low promotion rates. This is becausethe high turnover organizations have positionsopen into which remaining employees can bepromoted, whereas the low turnover organiza-tions do not
-54-

This contradiction is evident in the oppositeresults, which occur between analyzing aggregatemobility rates for entire strata of programs andanalyzing mobility rates of only those organizationsat the extreme ends of the mobility scale
Exhibits XXV and XXVI, following this page,show that the fifteen high turnover organiza-.tions are more associated with high promo-tion rates and that the fifteen high promotionorganizations are more associated with highturnover rates than their respective fifteenlow mobility organization counterparts
- Exhibit XXVII, following Exhibit- XXVI,demonstrates that for the sample strata asa whole, there is an inverse relationshipbetween turnover and promotion rates. Alinear regression analysis established thisrelationship at the .75 confidence level. Weconclude, however, that this relationshipis not one of causality, which is more aptlyseen from contrasting the extreme organiza-tions, but is more a reflection of the associa-tion of turnover and promotions with programstratum size
Further discussion of the factors relating topromotion rates is found in Section 5 of thischapter
(2) Organizations Affiliated with Public Schools ExperiencedSignificantly Higher than Average Outward Mobility
The proportion of organizations affiliated withpublic schools was twice as great in the highturnover organizations as compared with the lowturnover organizations, as shown in Exhibit XXVIII
-55-

EXHIBIT XXV (1)
Office of Child DevelopmentDepartment of Health, Education, and Welfare
THREE-YEAR AVERAGE TURNOVERRATES OF HIGH AND LOW
PROMOTION ORGANIZATIONS
I Year Average?romotion Rate High Promotion Organizations
3 Year AverageTurnover Rate
266'/0. Council of Affiliated Negro Organizations, Inc.,Santa Ana, Calif.
27%
19%
Day Care Services for Children, Milwaukee, Wisc.
Bloomingdale Family Program, New York, N.Y.
17% West Lake Cumberland Area Development Council,Columbia, Ky.
0%
15% Worcester School District, Worcester, Mass. 16%
13% University of Missouri, Portageville, Mo. 10%
13% Corona Norco Head Start, Corona, Calif. 31%
13% Family Services, Inc., Winston-Salem, N.C. 16%
- -13% Sussex County Community -Action Agency, Inc., 39%Georgetown, Del.
e:
13% Shore Up, Inc., Salisbury, Md. 24%
13% Marcy-Newberry Association, Chicago, III. 21%
12% Alabama Council on Human Relati.2ns, Auburn, Ala. 6%
11% Support Council on Preventive Effort (SCOPE),Dayton, Ohio
14%
11% Atlantic Human Resources, Atlantic City, N.J. 9%
11% Institute of Community Service, Rust College,Holly Springs, Miss.
7%

EXHIBIT XXV. (2)
3 Year AveragePromotion Rate
3 Year AverageLow Promotion Organizations Turnover Rate
0 ThO. Hilary School, Newark, N.J....-
0
0 nigher Horizons Day Care, Bailey's Crossroads, Va. 13%
.2:Community Service Association, Jackson, Miss. 1%
0 Bonner Springs School District #1, Bonner Springs, Ks. 27%
0 Missouri Ozarks Economic Opportunity Corporation,Richland, Mo.
11%
0,-------
Cranston Community Action, Crangton, R.I. 29%
Anderson County School District, Clinton, Tenn. 21%
0 Mooresville Public Schools, Mooresville, N.C. 0
0 Garrett Keyser Butler School District, Garrett, Ind. O.
0 Muskegon Public Schools, Muskegon, Mich. 0
0 Coshocton County Headstart, Coshocton, Ohio 25%
- 0 Kountze Independent School District, Kountze, Tex. 43%
..? 0 Clackamas County Headstart, Oregon City, Ore. 13%
4 .2% Coahoma Opportunity, Clarksdale, Miss. 5%
.5% Milwaukee Public Schools, Milwaukee, Vrisc. 4%

a.
EXHIBIT XXVI (1)
Office of Child DevelopmentDepartment of Health, Education, and Welfare
THREE YEAR PROMOTION RATES 'FOR HIGH AND LOW TURNOVER
ORGANIZATIONS
% OutwardMobility Program Name Promotion Rates
53% Chicago Youth Centers - LEARN, Chicago, III.
43% Bushwick Community Corporation, New York, N. Y. 8%
43% Kountze Independent School District, Kountze, Tex. 0%
41% Seattle Public Schools, Seattle, Wash. 9%
35% Child Care and Development Services, Los Angeles,Calif.
3%
32% Community Improvement Council, Danville, Va. 3%
31% Corona Norco Head Start, Corona, Calif. 13%
30% Thompson School District RILL , Loveland, Colo 4%
29% Cranston Community Action, Cranston, R.I. 0%
27% Bonner Springs School District #1, Bonner Springs, Ks. 0%
25% Muskegon Public Schools, Muskegon, Mich.
24% Shore Up, Inc. , Salisbury, Md. 13%
24% Sussex County Community Action Agency, Inc. ,
Georgetown, Del13%
24% St. Alban', Day Nursery, Miami, Fla.
22% Denver Public Schools, Denver, Colo. % 6%
4% Lowndes County Board of Education, Haynesville, Ala. 2%
4% Milwaukee Public Schools, Milwaukee, Wisc. 0. 5%

EXHIBIT XXVI (2)
%OutwardMobility Pramram Name Promotion Rates
4% Indianapolis Pre-School Corporation, Indianapolis, Ind. 7%
4% Tri-Parish Progress, Crowley, La.
1% Tri-Co Community Action, Laurinburg, N.C. 3%
1% Montgomery County Community Action Agency,Montgomery, Ala.
2%
.
1% Corhinunity Service Association, Jackson, Miss. 0%
Frederick Douglass, Child Development CenterLos Angeles, Calif. 6%
0% Coshocton County Headstart, Coshocton, Ohio 0-,
0%. Garrett Keyser Butler School District, Garrett, Ind. 0%
0% Mooresville Public Schools, Mooresville, N C. 0%
0% West Lake Cumberland ea Development Council,Columbia, Ky;
17%
0% Delta Hills Educational Association, Sardis, Miss. 1%
0% Mary Holmes (Rankin County) , Jackson, Miss. 8%
0% The Hilary School, Newark, N.J. 0%

EXHIBIT XXVII
Office of Child DevelopmentDepartment of Health, Education and Welfare
RELATIONSHIP OF TURNOVER RATESBY PROGRAM AND BY STRATA
TO PROMOTION RATES
3 YEARWEIGHTEDAVERAGE
20
18
16
14
12 TURNOVER RATES
10 PROMOTION RATES8
6
4
2
D ASTRATA

r
ti
% OutwardMobility Orga.laization Name Type of Agency
4 253% Chicago Yoath Centers - LEARN, Chicago, Ill. Limited Purpose
43% Bushwick Community Corporation, New York, N. Y. Community Corporati.
43% Kountze Independent School District, Kountze, Tex. Hoard of Education
41% Seattle Public Schools, Seattle, Wash. Board of Education
35% Child Care and Development Services, Los Angeles,Calif.
limited Purpose
32% Community Improvement Council, Danville, Va. CA l'
.31% Corona Norco Head Start, Corona, Calif. Hoard of F.:ducat-ion
30% Thompson School District RIIJ., Loveland, Colo Board of Education
29% Cranston Community Action, Cranston, R.I. CA P
27% Bonner Springs School District #1, Bonner Springs, Ks. Board of Education
-25%0 Muskegon Public Schools, Muskegon, Mich. Board .of Education
24% Shore Up, Inc. , Salisbury, Md. CA P
24% Sussex County Community Action Agency, Inc. ,Georgetown, Del
CA P
.
-24% St. Alban's Day Nursery, Miami, Fla. Limited Purpose
22% Denver Public Schools, Denver, Colo. Board of Education.
4% Lowndes County Board of Education, Haynesville, Ala. Board of Education
4% Milwaukee Public Schools, Milwaukee, Wisc. Board of Education
4% Indianapolis Pre-School Corporation, Indianapolis, Ind. Single PtArpose
4%. Tri-Parish Progress, Crowley, La. CA l'
1% Tri-Co Community Action, Laurinburg, N.C. CA P
Montgomery County Community Action Agency,Montgomery, Ala.
CAP

Type of Agency
Limited Purpose
Community Corporation
Board of Education
'Board of Education
Limited Purpose
Full Day/Part Day
Full and Part
Full
Part Time
Part Time
EXIIIBIT XXVIII (1)
Office of Child DevelopmentDepartment of Health, Education, and Welfare
HOURS AND MONTHS OF OPERATIONAS RELATED TO OUTWARD MOBILITY
# Months PerYear
11
12
10
!I
l'a t Time 10
CAP Fujll
Board of Education Full
Hoard of Education l'art Time
P Part Time
Board of Education Part Time
Board of Education Full
CA P Full
CA P Full
12
R
8
12
12
1.irnited Purpose Full 19
Board of Education l'a,'t Time 12
. Hoard of Edu,:ation Full 12
Board of Education Part Time 12
Single Purpose Full 12
CA l' Part Time !I
C.AP Full
CAP Full
11
12

% OutwardOrganization Name Type of Agen,
1% Community Service Association, Jackson, Miss. CAP
.8% Frederick Douglass, Child Development Center CAP
0%
Los Angeles, Calif.,
Coshocton County H4adstart, Coshocton, Ohio CAP
0% Garrett Keyser Butler School District, Garrett, Ind. School District
0% Mooresville Public Schools, Mooresville, N.C. CAP
0% West Lake Cumberland Area Development Council+,Columbia, Ky.
CAP
0% Delta Hills Educational Association, Sardis, Miss. Limited Purpose
0% Mary Holmes (lianki9 County) , Jackson, Miss. Limited Purpose
0% The Hilary School, Newark, N.J. Limited Purpose

Ind.
Type of . envy.
C:AP
CAP
C2\1'
S4iool District
CAP
CAI'
Da,*
Part Time
r: 111H11 XN'l III (2)
ii Months 1;et..Vezie
Par: Ti me
I'cr11
Par: Time I0
Part 8
,s. Limited Purpose} Part Ti
Lir.iited Purpose Full
Limit(yd Purrose Part "1'4m
10 1 /2
10
sz.

Limited purpbse organiiations tended to ex-. perience low mobility and CAP organizations
were evenly associated with both categories
The larger bureaucracy with whiCh a school system .,
is associated may have been a sou,fee of frustrationfor individuals leaving high turnover organizations
orne employees in programs not connectedkwith public schools but who had formerly beenpublic school teachers said they greatlyappreciated the more flexible and innovativeatmosphere in Head Start
Employees school_system_remarke.d..they were subject to all the regulations of theschool system but received none of the benefits(perceived as higher salaries, paid vacations,etc. ). This conflict caused much discontent
3. VARIABLES NOT RELATED TO OUTWARD MOBILITY
Tests of significance were performed for each ofthese varial)Itis and it was discovered that little orno statistical significance (i.e. less than . 75) wasassociated between these variables and turnover
These variables represented several of the categoriesof variables in the analytical model
(I) Personn,:i Conflicts with Sipe.rvisors Could Not BeRelated Statistically to Turnover
Current employees were asked how well peoi.,legot along with their supervisors. The negativeresponses- "not- at alt" and-" a little" were
-analyzed a, measures Of conflict with supervisors
-56-

(2)
3.5"; of all current employees gave one of these14:S1)0.11Se:3
There was no statistical significanie betTeen highand low turno..-er organization:: and the negativeresponses about relationships with supervisors
Some individuals expressed concern about theconfidentiality of the survey and ma' have beenreluctant to express their actual opinions .
In general, there appeared to be a reluctanceto criticize supervisors in interviews
Interviewers observed strained relationshipsbetween employers an.; s-uiTetri-scars in someorganizations
_w_er e somewhat less reilitantto criticize superN, is ion
Of the 736 former employees who respondedto the questionnaire, 4'7;) stated-Lthey leftbecause of conflict with supervisors
In telephone interviews with the formeretnployees of the fifteen high turnoverorganizations, conflict with supervisorswas one of the top five reasons which thoseinterviewed gave for leavingi_the program
Feelings of Dissatisfaction With Head Start Were NotAn Greater in High Turnover Organizations Than inLow Turnover Organizations
A 'l' -test re -ealed no significant relationshipbetween dislike of Head Start among-former andcurrent employees of high turnover organizationsand dislike in low turnover orgvnizat ions
-57-
..;

There w as no significant difference between thosecurrent employees in high turnover organizations
ho liked Head Start less than their last lob andcurrent' employees in lore mobility" "organizations wholiked Head Start less
0) Turnover Is Not Affected by Child/Staff Ratios
The child/staff ratios were. similar forboth the highest and lowest turnover agencies
The rates range from 6.2 children per employeein high turnover organizations to 5.5 in low turn-over organizations
(4) No Relationship Was Discovered Between Age andTurnover
-10--15`':, in each group (high to and lowturnover) were under- 35 years of age
(F)) Sex Does N:)t Appear To Be a Factor in OutwardMobility
It was difficult to make a comparison by sexsince females predominate the Head StartProject.
Those that did have a larger percentage of malesemployees showed no more pepondernancetoward mobility than those that did not as shownin Exhibit XXIX, following this page.
-58-

-/
EXHIBIT XXIX (1)
Office of Child DevelopmentDepartment of Health, Education, and- Welfare
CURRENT AND FORMER EMPLOYEESIN HIGH AND LOW TURNOVER
ORGANIZATIONS BY PERCENT FEMALE
HIGH TURNOVER ORGANIZATIONS
Female Employees As Percent of Total
Organization NameCurrent
EmployeesFormer
Employees Variance
Chicago Youth Centers-LEARN,- Chicago, Illinois 76% 100% +24
Bushwick Community Corporation,New York, New York 80% 80% 0
Seattle Public Schools,Seattle, Washington 71% 92% +21
Child Care and Development .--1
Services, Los Angeles, California .8,8% 69% -19
Community Improvement Council,Danville, Virginia 100% 31% -69
Thompson School District RILL .
Loveland, Colorado 89a/0 100% ! +11
i2 Cranston Community Action, \:
Cranston, Rhoda Island 100% luO% Is 0
Bonner Springs School District #1, /Bonner Springs, Kansas 89% 100%! +11
Muskegon Public Schools,Muskegon, Michigan 100% 100% 0
Shore Up, Inc., Salisbury, Maryland 100% 100% 0
Sussex County Community ActionAgency, Inc., Georgetown, Del. 100% 79% -21
Denver Public Schools,Denver, Colorado 82% 95% +13

EXHIBIT XXIX (2)
LOW TURNOVER ORGANIZATIONS
Organization Name
Female Employees As Percent of Total
CurrentEmployees
Former iEmployees Variance
Loundes County Board of Ellucation,Haynesville, Alabama 100% 100% 0
Milwaukee Public Schools,Milwaukee, Wisconsin 100%. 77% -23
Indianapolis Pre-School Cor-poration, Indianapolis, Indiana 96% 95% -1
Tri-Parish County,Crowley, Louisiana 82% 88% +6
Tri-Co Community Action,Laurinburg, North Carolina 72% 88% +16 .
Montgomery County CommunityAction Agency, Montgomery, Ala. 90% 67% -23.
Frederick Douglas ChildDevelopment Center, Los Angeles,California 65% . 0% -65
Mooresville Public Schools,Mooresville, ;North Carolina 100% 100% 0
West Lake Cumberland AreaDevelopment Council,Columbia, Kentucky 94% 90% -4
Delta Hills: Educational Association,Sardis, Mississippi 82% 76% -6
Mary Holmes (Rankin County),Jackson, Mississippi 92% 80% -12
45.

N
(6) Months of Operation and Number of Hours of 0 eration_A're Not Significantly Related to Turnover
The average number of months of operation forboth the highest and lowest turnover organizationswas ten
Most organizations among the thirty highest andlowest operated full day centers, as shown inExhibit XXVIII, following page IV-10
(7) The Extent of Regional Training Officer Assistance Is NotRelated to Turnover
Effectiveness of the regional training officer had noaffect on turnover
Nineteen of the thirty examined organizationsindicated that the role of the training officerwas effective for their training purposes--butwith some limitations
(8) Salary Complaints Were Voiced Frequently Among BothHigh and Low Turnover Groups but Low Pay Is Not aMajor Cause of Turnover
There was a, tendency for a high percentage ofall employees to say that salaries are too low
51% of all current employees felt their salarieswere not fair
13% and 15% respectively of former employees ofhigh and low turnover organizations expressedsalary complaints on their questionnaires
Former employee telephone interviews indicated'that of those who had been employed in high and :towturnover organizations, 6.8% and 5.5% respectivelycited low pay a reason for leaving
-59-
1:

Of all the former employees who responded to thequestionnaire, 37% presently have jobs ;141 ith highersalaries than they had received in Head Start
"I left with reluctance, I have returned to schoolto bolster credentials for a public schookl teachingjob. The pay is better, the benefits are better.Yearly raises almost assured (provided one isresponsible). (After two and a.half years iyreliable employee, my salary was raised $1 0,as a Head Start teacher). "--A Former Emplo9r
"While a fair system of raises should be set upfor teachers, not one of raises for just.those whohappen to be favorites of executives, salary shouldnot be the important thing. "--A Former Employee
(9) The Number of Levels of Hiring Authority Bore NoRelationship to Turnover
The average number of levels of hiring was 2.1for the high mobility programs and 2.6 for thelow mobility programs
60% of those organizations in the high mobilitygroup have two levels of authority
(10) The Level of Education o4Employees Was NotSignificantly Related to Turnover #
T-test indicated no statistical relationship betweenthose individuals with B. A. degrees or graduateschool and outward mobility
27% of current employees` of high mobilityprograms possessed a B.A. or higher degree
37'7,1) of former employees of high Mobilityprograms possessed aB.A. or higher degree
-60-

15% of current-employees of low mobilityprograms possessed a B.A. or higher. degree
18. 5rru of former employees of low mobilityprograms possessed a B, A. or higher degree
These results indicate the possibility that:
Those with college degrees have moreopportunities and leave Head Start morefrequently
Those with more formal education havemore dissatisfactions with Head Start
(11) _Fringe BenefitsAriL Nat Relayed_ to _Outward Mobility
There was no statistical relationship betweenturnover and the rate of fringe benefits
Project Questionnaires revealed a largerange of fringe benefits (from .0068% to 50%)
This shows that different types and amountsof benefits were offered in variousorganizations
This also shows that some organizationaldirectors igtoriati such, universal benefitsas social security payments in reportingthe percentage of fringe benefits
(12) Ethnic Mix of Staff and Program's Longevity WereAlso Found To Be Unrelated to Outward bility
4. OTHER VARIABLES WERE EXAMINED IN RELATION TOOUTWARD MOBILITY BUT WERE FOUND TO BE SUBJECTTO LIMITED STATISTICAL MEASUREMENT
The discussion of the following variables is basedon data secured from:
Interviews with current and former employees
-61-

These data Shave been subject to limited statistical.measurement
We feel the data are important because
The problems were encountered with con-siderable frequency
The problems may have been indirectlyrelated to turnover (a secondary cause under-lying another reason given for resignationfrom Head Start)
The problems as sources of latest dissatis-faction coul_d_trigge_r_mobility at Rome point_in the future if the conditions of the labormarket were to change
(I) There Are Few Job Opportunities Available in theCurrent Labor Market
For many of the programs visited, the labor marketis frequently characterized by
Lack of competitive opportunities
Requirements for highly skilled andexperienced persons
Twenty-two out of seventy-five organizations whichwere interviewed responded that there were no jobsavailable in the immediate labor market
An additional thirty-five said there were onlynonsimilar jobs available
One organization among the high turnover grouplisted the high unemployment rate as one of the mostimportant factors relating to employee stability atevery level. This apparently kept people in HeadStart

It appears that if better paying jobs in a related.child care field were to become available in-dividuals would leave for those jobs
A case in point occurred in an organiza-tion located in Region 4
Federal monies in the form of Title IV-Afunds were granted to the public schoolsfor preschool education
The Head Start Director experienced aflood of resignations including 50%of the central staff and mmy_te_achers_and teacher aides in the field staff
This situation occurred in the fall of1972 but federal funds were held up andthe director was able to retain his staff.He anticipated that the event would repeatitself in January 1973 when the publicschools finally received the money
The Director felt that this would hinderrecruiting for Head Start and it would bedifficult to find qualified personnel
In many rural areas, particularly in Region 4,there was little industry. Some directors therefelt that as industry developed people wouldleave for those better paying jobs
Among teachers responding to the Current EmployeeQuestionnaire, .3% said they took a job with HeadStart specifically because the job market for teacherswas poor. Since teachers represented 30% of HeadStart Employees, this figure represented 1.0% inthe larger population. These data imply that:
People are attracted to Head Start who wouldotherwise not be
-63-

Some peot le remain in Head Start when theywould otherwise leave
This source of discontent could result inmobility if conditions in the labor marketwere to change for the better
Exhibit XXX, following this page, details specificallyhow the labor market influences different positionswithin Head Start. These were the impressions ofthe directors completing the Project Questionnaire,Question #51
For over 50% of the positions there were noproblems in recruiting
Competition was felt to be keen for only threepositions
Educational DirectorHealth Director/ NurseClerical
(2) Some Federal Regulations Were Viewed as Sources ofProblems But Could Not Be Related Directly to Turnover
In interviewing the directors of organizations, fifteendirectors cited federal regulations as causing con-fusion, inconvenience, or conflict in the organization
Four directors statedthat guidelines changed sofrequently and were so vague, it was almost impossibleto follow them
A rural organization felt most OCD guidelines wereurban oriented
Some guidelines caused considerable inconvenience
One organization with predominantly MexicanAmericans stated that the new federal regula-tion requiring citizenship for all employeeswas causing hardship for some employees
-64-

Number ofHead Start OrganizationsPosition Title Navin this Position
Professional orParaprofessional
Position
\lost FrequentlyMentionedProblems
Director 11 Prof. H
Educational Director 7 Prof. C, D, F, 1Head Teacher 3 Prof.Teacher 15 Prof. A
Assistant Teacher 5 Prof. A ,13
Teacher Aide 10 Para. A
Social Worker .4" Prof. F
Social Work-Aide 5 Para. A
Health Director/Nurse 11 Prof.Health Aide 3 Para. Eall)Parent Coordinate- 5 Prof.Volunteer Coordinator ,) Prof.licad Cook/Cook 10 Prof. A
Cook Aide 7 Para. A
Custodian 8 Para. 1)
Driver 5 Para. A
Secretary/Typist 9 Para.Clerk/Bookkeepe 11 Pa ra .
PHOBLE11 CODES
A No problems in recruiting these peopleNo problems in keeping these people
C Competition is keen for these peoplesalary u e can flay hinders recruiting
E Salary we can pay hinders keeping lwople after v.e train themQualified people prefer to work for other organizations
G Lack. of ,promution opportunity is a problemStaff tq-fe tore secure employment
I Staff kiecome disillusioned because of problems and lack of adequate resourcesHigh unemployment rate
% of.Which
r
54.71
100606080-66804566
100505762808863

EXHIBIT XXX
Office of Child Development. DepartmeM of Health, Education and Welfare
Pli0131...E.MS. EXPRESSED BY HIGH TURNOVERORGANIZATIONS IN RECRUITING AND
RETAINING EMPLOYEES
Most FrequentlyMentionedProblems
'!.0 of OrganizatidnsWhich Mentioned the
Problems
Second MostFrequently Mentioned
Problems
":, of OrganizationsWhich Mentioned the
Problem
13 54. 5.,' A 45. 5(t(, 1), 1,', I 71. -1":,
100. 0'1:1A 60. 0.':, 3":,
A 60.0%A 50.0 :, 50. 0',
66. I 55. 6":,A 80. C1,1 60.0C, I, G 45. 5.J
66. 7'1:I) 60.0 I
100. 0A 50. O'''.
57..1 G, ferI) 62. 5 50. 0";)A 80. 0":, I) 60.
88. 77.0C . 6'1'0 54. 5":,
11
idequatc resources

There were required to attend eitiAen-ship classes two nights a week withno transportation or babysittingreimbursement
These classes were in addition tosupplementary training classes whichthe individual pursued on his owntime in this organization
One director felt that purchases of non-consumable items-in the last ninety daysof program )ear were prohibited by aregulation
One director of a rural pm.!ram said it %%i.ISnecessary to close the centers one day aweek when the - employees traveled to anothercity in order to receive supplementary training
He felt in this situation that the objectivesof Career Develorment v.ere in conflictwith the overall obteetives of Head Start
Ihmver, because of the Regional qff-i7.e.restrictions, he did not he had an\options in providing-the training nor ar.p,-options in the scheduling
A few organizations specifically had pobleir,Sthe policy of hiring people and accepting children
ithin a certain income level
They experienced complaints about discrimina-tion by many v,ho desire to 1k rk in or attendHead Start
It was reported that the policy does not makeenough allowances for the large family which isjust slightly above the acceptable incomelevel
A Director in another program felt a certainpercentage uf over income children shouldbe permitted in the classroom to providebalance and an enriched learning experience,but community pressures- made it difficult toenroll over income child -en
-65-"'"..:

(3) State Govci.nmental lie TulationS Caused Problems in SomeHead Start Prolrams
Seven Of so'entv-fivo organization, cited stateregulations as causing operational problems.Such problems increase the frustration hihdi re c ters expe
One example is the requirement.' that HeadStart Centers be licensed, when no similarrequirement exists for public schools.
An:)thcr example is the regulation that.employeesare not, granted compensatory time for nonpaidovertime hours worked
Many complaints were voiced by.3rganizationsaffiliated v ith the public schOol system .
`.:The Hoard of Education does not folkm theletter or the spirit of the Federal Guidelinesor its contract with the grantee agency. Thereis greatqut shun %%hether the administrativeprocedures of the guard can be applied toHead Start and still have value for children,parent's and community. .Some Head Startclasses have had five teachers in one year .
because lov.ered school enrollment was forcingout teachers of Ilead Start because they haveless seniority. Community pleas for keepinga certain teacher were unheeded."-- CurrentLinployee
fhere is a great deal cat uncertainty about theeventual policy regarding the necessity of certifica-
heco.!: v a !lead Start teacher
-11. of the organizations intervie,.s.ed reqi i redteachers to h certified
ir.)1J,111::. tt v11.11-
ma a r-!121,.:1, ntate and in :gie instance evena city
-66-

276.'0 of the organizations interviewed requiredteachers to be certified
Regulations vary from prograth to program with-in a region, state and in one instance even withina eity
The impact of certification cr noncertification-requirements is felt to be considerable
Some programs feel the lack of certificationimpairs the quality of education
"We need to take a good look- at promotingfrom within in terms of a quality... We. needto start thinking about children again. " --A Current Employee
Those programs which do not require teachercertification tend to create more,up.wa_rdmobility and are less apt to be viewed as adead end program
Some Directors were under the impressionthat it is an HEW requirement that teachersbe certified in early childhood education aswell as state certified. This Causes theDirector to go outside of the neighborhood torecruit professional workers, unbala .:ing theethnic mir of the staff reflective of the com-munity, another Head Start policy
(4) A Lack of Job Security Causes Tension and Frustration
Twenty-one organizations responded that a lack ofsecurity about annual refunding caused problems.
Employees stated that often they would notknow until just prior to the beginning of theschool year whether or not they had a job
In telephone inter with former employeesit was discov; that those who- .moved to thepublic school system primarily for better paycited increa, d job security as a significantfactor in cha %!ing jobs
-67-

"Most of the dedicated people don't have the luxuryof staying,because one never can say for certain ifthe program will be refunded for the next year."--A Former Employee
(5) The Success of the Career Development Effort Was NotDirectly Related to Outward Mobility But Was PerceivedAs a Plan on .Paper More Than as an Actuality
Directors in thirty-five organizations indicated thatthey felt that the career development ladder existedon "paper only."
Most employees never seem to reap thebenefits of a realistic career developmentprogram
In at least three organizations career develop-ment plans were non-existent
Several plans were in the process of revisionor implementation
In several organizations where impressive careerdevelopment efforts are underway, outward mobilitystill does not occur
This relates to the economic conditions ofthe labor market
It also relates to racial discrimination in thelabor market in certain areas
The director's own perception of the goal of careerdevelopment tended to influence mobility throughoutthe organization
One director viewed Head Start as a manpowertraining program--her philosophy was up andout
Another director felt job training and careerdevelopment should be handled by a separ-temanpower training program (e.g. WIN) andthat Head Start should not be involved
-68-

Employees appear to have both positive and negitivefeelings towards career development
"I think one of the worst things some people runningHead Start programs have done is to push a teacherup and out, even against her will. My district doesnot do that., but the fear that that might, happen hasbeen part of the reason I am not out of college. "- -A Current Employee
"Seems I am undertrained or under-educated to teachin public school's (sponsored) Head Start but over :trainedfor most other jobs. I feel this Head Start program .
failed in up-grading me (one of Head Start's goals wasto train and up-grade its employee participants) becauseit was not supportive of me and failed to go far enoughin my education and now I am back on the welfarerolls. " - -A Former Employee,.
"They have tremendous turnover, because of their ownguidelines. One says hire from the community,especially a parent. Another says start career:develop-ment. Unless a woman has sixteen kids she can'tbe a parent and stay in career development longenough to advance to a higher level. "--A FormerEmployee
"I 'believe in the Head Start Program as stated ingll the guidelines from Washington, but the programson the county levels bear little resemblance to theguidelines. I met many low income people with highpotential, but it takes more than that to administera good program. Very little of the money and servicesever reach the children."--A Current Employee
(6) Head Start Directors Influence Emplo. ee Morale andUpward Mobility but Not Outward Mobility
Directors who were viewed as enthusiastic andcommitted to the goals of Head Start had a goodworking relationship with employees and more oftenencouraged promotions and upward mobility
-69-

Directors who showed a reluctance toward the useof innovative techniques, an inability to spot andrecognize personnel problems, and a tendency tohire from the outside were associated with organiza-tions with little upward mobility and often pooremployee morale
Both extremes of managerial style, i. e., autocraticor laissez faire were found to exist in each of thesituations described above. For example a directormight run the organization with an iron fist but stillcommand the respect and enthusiasm of his employees
. (7) 1,Vorking Conditions and Inadequate Facilities WereSaid To Be Problems Which Led to Dissatisfaction with.-Head Start
We found it extremely difficult to measure thisvariable, although'it was a complaint which weheard often
Facilities were inadequate
Centers were too small
Centers were located in badneighborhoods
Those centers located in churcheshad no playgrounds and materials had tobe gathered and moved to another partof the church at the end of each week
Vandalism was a problem
"My very specific reason for leaving had to do withthe fact that the parents lacked respect for the staff,the staff sometimes lacked respect for the parentsand by virtue of the location of the center, it wasconstantly being robbed. , We were constantly under-staffed so that I as well as others, had an overloadof work."--A Former Employee

5. VARIABLES RELATED TO UPWARD MOBILITY
Two variables were significant to upward mobilityat the .90 confidence level
"rype of Agency (Control variable)Levels of Authority for Promotions(Pro3ect experience variable)
Two variables v.ere significant to upward mobilityat the .75 confidence level
Program size, as represented by the stratum inwhich the program lies (Job environment variable)
Level of education (Control variable)
(1) Organizations With More Levels of Authority in PromotionApproval Experienced Higher Promotion Rates
The average number of levels of approval in highpromotion organizations was 2.8 and in low pro-motion organizations 1. 9
The data concerning this variable, strata, andtype of agency, are shown in Exhibit XXXI,following this page
The higher promotion organization had up to sixlevels of approval for promotions and salary,,in
might indicate that there is a relation-ship between the formality of the structureand upward mobility
These programs have more people involved(both employees and parents) and hence aremuch more actively promoting employees

?:
rev
MGT' PROMOTION ORGANIZATIONS
Council of Affiliated Negro Organizations, Inc.,Santa Ana, Calif.
STRATA
B
Day Care Services for Children, Milwaukee, Wisc.
Bloomingdale Family Program, New York, N.Y. A
West Lake Cumberland Area Development Council,Columbia, Ky.
WorceF.ter.School District, Worcester, Mass.
University of Missouri, Portageville,
C'o'rona Norco Head Start, Corona, Calif.
Family Services, , Winston-Salem, N.C.
Sussex County Community Action Agency, , I)
Georgetown, Del.
Shore Up, Inc. , Salisbury, Md.
Marcy-Newberry Association, Chicago, Ill. A.
Alabama Council 00 Human Relations, Auburn, Ala.
Support Council on Preventive Effort (SCOPE),Dayton, Ohio
-Atlantic Human Resources, Atlantic City, N.J.
Institute of Community Service., Rust College, Iiholly Springs, Miss.
7/4.

EXHIBIT XXXI (1)
'Office of Child DevelopmentDepartment of Education, and Welfare
SIGNIFICANT VARIABLES FOR HIGH & LOW PROMOTION PROGRAMS
TYPE OFAGE.NCY LEVELS OP PROMOTION APPROVAL
I.imited Purpose 2
. Limited Purpo'se 3
CAP 6
CAP 4
Limited Purpose 1
Limited Purpose 3
Board of Education 1
CAP 9
CAI' 3
CAP 9
Limited Purpose 1
Limited Purpose 4
CAP 4
CAP
Limited Purpose 9
7/I

LOW PROMOTION ORGANIZATIONS STRATA
A
MUI:lit*-5-e-r-Ai-i-e-e---As-soei-a-t-i-c-nr,----Jarks-cm-;---Ntiss-7
Bonner. Springs School District #1, Bonner Springs, Ks.
C
Higher Horizons Day Care, Bailey's Crossroads, Va.
Missouri Ozarks Economic Opportunity Corporation,Richland, Mo.
Cranston Community Action, Cranston, N.J.
Anderson County School District, Clinton, Tenn.
Mooresville Public Schools, Mooresville, N.C
Garrett Keyser Butler School District, Garrett, Ind.
Muskegon Public Schools, Muskegon, Mich.
Coshocton County Headstart, Coshocton, Ohio
Kountze Independent School District, Kountze, Tex.
Clackamus County Headstart, Oregon City, Ore.
Coahoma Opportunity, Clarksdale, Miss.
Milwaukee Public Schools, Milwaukee, Wisc. Ii
The Hilary School, Newark, N.J. A

-
EXHIBIT XXXI (2)
TYPE OF'AGENCY LEVEL CF PROMOTION APPROVAL
Limited Purpose 2
CAP 2
*Board of Education 2
CAP
CAP 1
Board of Education 2
CAP 2
Board of Education 2
Board of Education 5
CAP - delegate non-profit 2
Board of Education 1
CAP 2
CAP 1
Board of Education 1
Limited Purpose 2

(2) Limited Purpose Organizations Experience HigherPromotion Rates Than School Systems
The type of organization, a control variable, wasfound to be significantly related to promotion rates
Seven out of fifteen of the high promotionorganizations were limited purpose organiza-tions
Six out of fifteen of the lower promotionorganizations were affiliated with Boardsof Education
There were equal numbers of CAP organiza- ,tions with both high and low promotion groups
This situation might occur because limited purposeorganizations are more responsive to the communityand more flexible in their career development plans
There are several barriers to promotions whicharise in affiliations with public schools which werediscussed in Section 4(2) and include:
Rigidity of school system
Certification requirements
Hiring of personnel at higher levels so thatno positions are Open to be recipients ofpromotions
(3) Promotion Rates Are Related to Strata or Size of Program
At the .95 confidence level, the promotion rate bystrata tended to be inversely related to size
The promotion rates for each stratum. are
- Stratum A 6.3%- Stratum B 7 . 4%- Stratum C 9.0%
Stratum D 4.4%
-72-

Eight out of fifteen of the low promotion organiza-tions were located in Stratum D which representsthe smallest organizations within the survey
Only one high promotion organization fellwithin Stratum D and was also a ruralorganization
Small organizations have fewer people and there-for fewer positions into which people can be pro-moted
(4) Those Emolo ees Who Have a Bachelor's De ree orWho -Have Attended Graduate school Were Found MoreFrequently in Low Promotion Organizations
The means of those employees with a B.A. orhigher degree in high promotion programs was 17%
The means of those employees with B.A. or higherdegree in low promotion programs was 26%
The difference was statistically significant at .75confidence level
It was our observation that considerably more pro-motions occurred on every level in programs inwhich educational standards were not high
In these organizations
Teacher aides were promoted to teachers
Non-degreed individuals served ascomponent heads
In these same organizations, employees werenot leaving because they were moving up withinthe Head Start organization

6. VARIABLES NOT RELATED TO UPWARD MOBILITY
Tests of significance were made for each of thefollowing variables
Budget cutsExtent of UrbanizationAge
Little or no statistical significance (i.e. less than.75) was associated with them
(1) Budget Cuts Did Not Affect Promotions
There was no statistical evidence that budget cutsinfluenced upward mobility
An equal number of high promotion programssuffered cuts (3) as did low promotion
Twelve organizations in each group experiencedno budget cuts
Staff and positions being eliminated does not adverselyaffect mobility
Furthermore,, since training funds are separatefrom general funding, career development shouldbe separate from budget levels
(2) The Urban; Rural Variable Was Not Related to UpwardMobility
High and low promotion programs were equallylocated in urban and rural environments
In high promotion programs, seven were urbanand eight were rural
In low promotion programs, six were urban andnine were rural
-74-

43) Age Was Not Belated to Upward Mobility
There was no statistical significance betweenage and promotions
Testing those under age thirty-five, there wereno more in nigh than in low promotion programs
This chapter has shown that turnover is primarily related to
the extent of urbanization of the location (which causes differing
labor market conditions), program budget cuts, levels of promotion
authority (fewer levels were associated with higher turnover), and
dissatisfaction with co-workers. Promotion rates b.re related to the
number :A' levels of promotion authority in an organization and the
type of organization. The impacts of turnovers and promotions are
examined in the next chapter.

V. IMPACT OF MOBILITY
This chapter discusses the impact of three types of employee
mobility ir. Head Start:
Outward Mobility of Employees in Direct Pro-vider Organizations
Outward Mobility in Positions External to theDirect Provider OrganizationS
Upward Mobility in Direct and Indirect ProviderOrgan:zations
The sections in this chapter are organized in accordance with the
above three mobility categories.
The technique used in this chapter to measure responses by
-organization _.chreetoz s to questions concerning the impact of
mobility is to report the percentages of the directors who gave
answers which related to the extent of the impacts. To give
statistical recognition to the size of the sample of directors re-
sponding to each question, we have tested the realness of each
percentage by defining the true limits in which the actual percentage
,would lie (with -95 confidence) if one were to measure the responses
of all organization directors- Consequently, wherever the terms
"true value" or "true percentage" are cited in this chapter, they
imply a realness at the .95 confidence level for the declared range
of values-

1. OUTWARD MOBILITY OF EMPLOYEES IN DrECT PROVIDERORGANIZATIONS .
The turnover of employees in organizations which directly
operate Head Start centers may have an impact on the following
three program elements:
Program QualityProgram CostUpward Mobility in the Program
The turnover also impacts upon the departing employees themselves.
The extent of these impacts depends upon the rate of turn-
over and the types of positions being vacated. This section dis-
cusses the overall impact of outward mobility in high turnover
direct provider organizations and the specific impact of outward
mobility within the various components of all direet provider
organizations.
(1) Turnover Generally Causes Little Impact on the Qualityof Head Start Programs
Turnover does not interfere significantly withthe subobjectives of the program.
During the second half of the retrospectivestudy, organization directors were asked ifturnover interferes with the program'sability:
To support and accelerate the develop-ment of children

.1
To strengthen the self-confidence,family confidence and communityconsciousness of children by lettingthem see parents and others iri theircommunity operate in situations ofresponsibility
To develop the community life of theparents
To provide a training ground foremployees in the program to go intoother gainful employment beyondwhat would have been possible with-out their participation in Head Start
Only six of fifty-one directors indicatedany significant impact from turnover.
The true value of a significant impact onprogram subobjectives would lie in therange of 2% to 21% of Head Start organiza-tions.
Turnover has more impact on individual com-ponents than on the whole program.
Sixteen of fifty-three organization directorsfelt that at least one component in theirprogram was affected significantly by turn-over.
The true value of a significant impacton at least one program componentwould lie in the range of 17% to 43%of Head Start organizations.
Only four components were mentionedby the sixteen directors as receivingsignificant impact from turnover.(Some directors cited more than onecomponent)
-78-
Education (9)

Administration (6)Health (4)Social Service (2)
The Confirmation of Employee DepartureQuestionnaire responses also indicatedthe greater impact upon components.
Exhibit XXXII, following this page,shows that only 12..6% of 538 formeremployee departures had a moderatelyor extremely harmful impact ontheir component.
The true value of the above wouldlie in the range of 9.67'to 15.4'5).
Only 7.4% of the employee departureshad a moderately or extremely harm-ful impact on the program as a whole.
The true value of. the above would liein the range of 5.2% to 9.8%.
The predominating response to employeedepartures was "no impact".
For every four responses indicating a"harmful" impact, there was a responsewhich indicated a "helpful" impact fromturnover.
According to organization directors, supervisoryand administrative personnel are the most impor-tant to the functioning of Head Start organizations;consequently, turnover in these positions has thegreatest impact upon program operations.
Question 51 of the Delegate Agency ProjectData Questionnaire asked directors to rankthe importance of positions in terms ofthree index numbers:
(1) - Highest importance(2) - Moderate importance(3) - Lowest importance
-79-

EX
HIB
IT .X
XX
II
Off
ice
of C
hild
Dev
elop
men
tD
epar
tmen
t of
Hea
lth, E
duca
tion
and
Wel
fare
IMPA
CT
OF
AN
IN
DIV
IDU
AL
EM
PLO
YE
E'S
DE
PAR
TU
RE
QU
EST
ION
111
IM
PAC
T O
N C
OM
PON
EN
T
HA
RM
FUL
(36
.29%
)H
EL
PFU
L (
9.1%
),M
ildly
Mod
erat
ely
Ext
rem
ely
Deg
ree
Not
Spe
cifi
edM
ildly
.Mod
erat
ely
Ext
rem
ely
Deg
ree
Not
Spe
cifi
ed
21.7
%10
.2%
2.4%
2. 9
%2.
0%3.
5%1.
3%2.
0%
NO
IM
PAC
TN
O A
NSW
ER
43.7
%0
11.0
%
QU
EST
ION
12,
IM
PAC
T O
N P
RO
GR
AM
HA
RM
FUL
(26
.2%
)H
EL
PFU
L (
7.1%
)M
ildly
Mod
erat
ely
Ext
rem
ely
Deg
ree
Not
Spe
cifi
edM
ildly
Mod
erat
ely
Ext
rem
ely
Deg
ree
Not
Spe
cifi
ed
17.5
%6.
1%
NO
IM
PAC
T
54. 6
%
1.3%
1.3%
1.9%
2.6%
0.7%
1.9%
NO
AN
SWE
R
12.1
%

Exhibit XXXIII, following this page, showshow frequently each Head Start positionwas declared to be among the most impor-tant to the functioning of the organization;for example, in 93.1% of the 101 organiza-tions in which a measurement of importancewas assigned to the Director, that measure-ment was "1" -- highest importance.
Professional positions are moreimportant than paraprofessional posi-tions to the functioning of the organiza-tion.
In the ranking of highest importance,thirteen professional positions arecited before the first paraprofessionalposition is included.
Most of the positions vacated by turnover havebeen filled.
The current status of 468 positions formerlyheld by employees who have left Head Startorganizations, is as follows: (Confirmationof Employee Departure Questionnaires,Question 13)
Filled from within--38.5%Filled by external hire--48.9%V acant- -2.8%Abolished - -9.8%
Although most organizationS have policiesto promote employees into vacant positions,there is a 95% confidence level that morepositions are filled by external hire thanby filling from within.
The true value of "filled from within"the range of 34.0% to 43.0%.
is in
The true value of "external hire" is in therange of 44.3% to 53.5%.

EXHIBIT XXXIII
Office of Child DevelopmentDepartment of Health, Education and Welfare
IMPORTANCE OF POSITIONS TO THEFUNCTIONING OF HEAD START
ORGANIZATIONS
PositionNumber of
Times ReportedPercent
Declared"1"
1. Director 101. 93.1%2. Supervisory Teacher 31 90:3%3. Teacher 106. 86.8%4. Education Director 56 82. 1%
5. Nutrition Director 16 75.0%6. Medical Director 15 73.3%7. Finance/Business Manager 33 72.7%8. Nurse Supervisor 10 -70.05
9. Social Service Director 31 67.7%10. Nurse 36 63.9%
Nutritionist 19 63.1%t11.19. Parent Coordinator 40 60. 0%
13.. Social Worker 56 57. 14%
14. Cook 80 56.25%
45. Child Care Coordinator 11 54.55%
16. Clerical/Secretary 104 57.88%17. Driver 31 45.16%
18. Custodian 61 44.26%
19. Volunteer Coordinator 17 41.2%
20. Community Aide 79 40.5%'21. Teacher Aide 115 39.1%22. Assistant Director 15 33.3%23. Resource Teacher 9 33.3%
24. Psychiatrist 16 31.3%25. Health Aide 29 31.0%26. Training Coordinator 15 26.7%
27. Other Coordinator 16 25.0%
Source: Delegate Agency Project Data Questionnaire, Question 51.

(2) Turnover Is Not a Significant Cost to the Head StartProgram
Even in high turnover organizations, only asmall portion of the director's time is expendedin recruiting to fill vacated positions.
The average percent of a director's timedevoted to recruiting among the fifteenhighest mobility agencies is 5.7%.
The percentages of director's time devotedto recruiting range from 0% to 25%.
Most employees can become fully effective in anew position in less than four months.
The responses to Question 15 of the Con-firmation of Employee Departure Quest-tionnaire provided estimates of the time tobecome fully effective in the 538 vacatedpositions reported upon:
Zero months--29.3%One month - -40.8%Two or three months--23.0%Over three months--6.8%
The responses to Question 51 of the DelegateAgency Project Data Questionnaire of highturnover organizations indicated that certainpositions required a greater median numberof months on the job exnerience before thereplacement could assume full responsibility.
Exhibit XXXIV, following this page,shows that the positions of MedicalDirector, Social Service and Super-visory Teacher require the most"break-in" time for replacements.
These positions all fall into theAdministrative and Supervisory class-ifications of personnel which werepreviously indicated to be of the highestimportance to Head Start organizations.
-81-

EXHIBIT X-XXIV
Office of Child DevelopmentDepartment of Health, Education and Welfare
TIME REQUIRED TO BECOME FULLYEFFECTIVE IN A POSITION
.e"
t
POSITIONMedian Number
of Months
Number ofEstimates forThis Position
Medical DirectorSocial Service DiietorHead Start DirectorOffice Manager.Superiviiory Teacher
129
7.566
1
2
1033
Educaton Director . 4.5 6
Nutritionist 4.5 2
Voluntq:ur Coordinator 4.5 9
Scereta,ty 4 10Pa rent Coordinator 3 3
Cook Aide, 3 6
Social Wotzi:er 3 8
Teacher 3 13
Teacher:i'idt,- 3 13
_13ookkeeli;or 2.5 4
Corn mun fly Aide 2 6
Custodian, 2 7
-.,S*rrviscir: Nurse 2
lieceiebiti4.t 2 1
Cook 1.5 7
Driver 1 5
Health Aide 1 3
Nurse 1 8

Replacements can u ually be found in less thantwo months.
For the 538 positi ns associated with theformer employees overed by the Confirma-tion of Employee De arture Questionnaire,the Question 14 respo ses contained thefollowing distribution f time to find re-placements to fill the positions.
Zero months -- 40.3%One month--45. 5%Two or three months-11.9%Over three months--2.2%
The true percentage of responses less thantwo months lies in the range of 82% and 89%.
It usually costs $100 or less to find and train areplacement.
For the 455 responses to Question 17 of theConfirmation of Employee Departure Quest-tionnaire, the following distribution ofestimated costs to find and train a replace-ment occurred:
- No cost--71.2%$1 - 100 -- 15.8%$101 - 250 - -7.7%$251 - 500 - -3.7%$501 - 1000- -1.3%Over $1000 - -0.2%
The true percentage of replacements costing$100 or less lies in the range of 83.8% to90.2 %.
Replacements usually spend no more than 40 hoursin formal training for their new positions.
The true percentage of replacementsreceiving less Llian nine hours training liesin the range of 43.6% to 52.2% and of
-82-

receiving from 9 to 40 hours traininglies in the range of 37.0% to 45.6 %.
(3) Lack of Turnover Does Not Necessaril Obviate the
Possibility.of Promotions
As discussed in Chapters III and IV, the evidenceshows that high turnover organizations tend tohave high promotion rates and low turnoverorganizations tend to have low promotion rates.
Head Start Directors feel, moreover, that lackof turnover does hamper their ability to give
promotions.
Out of 66 recorded responses to questioningthis relationship in Director interviews,57 Directors' claimed that low turnover didhamper efforts to promote employees.
The true percentage of directors who feelthat low turnover causes low promotionrates lies in the range of 77.9% to 94.8%.
___,. Between the ranges of very high turnover and very
low turnover organizations, however, it is thediffering emphasis on Career Development amongHead Start programs which may determine whetherthe lack of turnover forecloses the option of pro-mo ing employees or not.
In many cases where positions are vacated,directors feel that it is in the best interest ofprogram quality to hire the replacement fromoutside the-program. It was shown previouslythat mcsre positions are filled from outside Head
Start than froin within.

(4) Approximately 55% of Former Head ItELE-pja12,1Are Currently Employed
Of the 734 former employees who responded tothe questionnaire, 410 are currently employed.
The true percent currently employed liesin the range of 52.2% to 59.5%.
The true percent currently seeking a joblies in the range of 26.3% to 33.1%.
The true percent not employed and notlooking for a job lies in the rangq,,of 11.8%to 17.0%.
Head Start served as a springboard for a littleover half of the 410 former employees who arenow employed.
The true percent of the currently employedHead Start former employees who are nowin jobs similar to their former positionsin Head Start lies in the range of 48.7% to58.6%, based on responses to the FormerEmployee Questionnaire.
Based on results of telephone interviewswith former employees as shown in ExhibitXXXV,' following this page, the true per-cent of currently employed Head Startformer employees who are now in jobssimilar to their former positions in HeadStart lies in the range of 45.4% to 56.6%.
The true percent of currently employedHead Start former employees who foundHead Start training to be helpful in theircurrent position lies in the range of 53.9%.to 63.6%.
The true percent of currently employedHead Start former employees who have ahigher salary now than when in Head Startlies in the range of 53.4% to 63.2%.

-
Region IProf
Paraco-yo
NumberInterviewed Unemployed
Current JobSimilar ToHeadstart
Current JobMore ResponsibleThan Headstart
\- CurrerUnli
Beads
22.
16
1045%
956%
9
41%1
6%
1
6%00
2S
638
Total 38 19 10 1 8
50% 26% 2% 21
Region IIProf 30 1 12 6 9
3% 40% 20% 3G
Para 15 4 4 4 2
27% 27% 27% 13
Total 45 5 16 10 11
11% 36% 22% 24
Region IIIProf 21 8 2 1 7
To 39% 10% 4% 33.
Para 27 7 3_
3 10
To 26% 11% 11% 37
Total 48' 15 5 .:. 4 17
% 31% 10% 8% 35
Region IVProf 77 25 23 .8 16
% 32 % 30% 10%. 2G
Para 67 22 10 3 t 21
% 33% 15wo 4% 31
...Total 144 47 33 _. 11 37
% 33% 23% .7% 28-
Region VProf 63 12 26 4 9
°la 19% 41% 6% 14
Para 63 27 19 3 5
% 46% 28%
Total 126 39 45 7 14
To. 31% 36%
60

Current JobUnlike
Head start
2
6380fo
821%
No Information
ExtuBiT X,S.X7i:r (1)
Office of Child De%,'elopmentDepartment of Ilealth, Filucati(in and Welfare
EMPLOYMENT STATUS OF FORMEREMPLOYEES INTERVIEWED
EmployedBy Headstart
o 0
0 00
\9 1 1
,
,
30% 3% 3%
2 1 0
13% 6% 0
11 2 1
24% 47% 27'7,
7
33%1037% 770
10(7,
2nay
lit
17 3 4
35% 6% 8%
16 1 4
20% 1% 5%
21 B 3
31% 12% -37 9 7
26%
9 3 9
14",1.,
5
5",,6
1 4'-'7,
3 .
7% 9% 4%
14 9
1 1 c',.., 7% 1047,;,
/YI

Begton VIProf
11,10
Para
TUtal
iiel.ator:Fro/.
NumberInterviewed UnenTltive:1
C.Ux-r3.-nt
SirntIar
6
46 .
(.11 t1.3311 .1331)
1;3.-;)3313:-.,11113.
114.:11:-tort
I I".
%i !:t I U 6
i.taI 7
Pt.}:.i(311 !1i1`!
1
d
t.
41
4
6
1'5.
4 2
I I
1
14
7
fl
)
1
I I .
":;.
I
.7
I 1.'".
1'1 I I
;,' I
I !Al I f)
;t1".;,
d'vc

Current Jobbit Unlike Employed
Icadstart No Information By ITeadtart
000
1 --)";: 0
o_
00
EXHIBIT XXXV (2)
4 00
1
3I I 1 ,tI o
0U
0U
00
00 00 00 0o 00 0
O U
0 0
0 00 0O 0
000000
00000
1 0 9
0 5
U 011". 0 , 0
0 9
0
106 231 r. 4170

Head Start was the first job for about the samepercentage of former employees as currentemployees.
The true percent of current employees forwhom Head Start was. the first job lies inthe range of 16.7% to 19.8%.
The true percent of former employees forwhom Head Start was the first job lies inthe range of 17.1% to 23.2%.
For the former employees for whom HeadStart was the first job, the true percentnow employed lies in the range of 42.7%to 59.4%.
Former Head Start employees are often employedin the fields of education, child care, and socialwork.
Exhibit XXXVI, following this page, showsthe distribution of current jobs of 396 formeremployees.
Public school teaching and clerical and admin-istrative positions are the predominant jobscurrently held.
Employees in the Education component receive themost extensive supplementary training during theiremployment in Head Start.
Exhibit XXXVII, following Exhibit XXXVI,shows the distribution of components forthose current employees who have receivedvarious amounts of supplementary training.
Fifty-eight permit of the current employeeswho have received 1-15 credit hours of train-ing are in the Education component, but 78%of the current employees who have receivedover 60 credit hours of supplementary train-ing are in Education.

EXHIBIT XXXVI
Office of Child DevelopmentDepartment of Health, Education and Welfare
POSITIONS NOW HELD13Y FORMER HEAD START EMPLOYEES
ERCENT POSITION
3. 5% Nursery School Teacher7.1% Teacher Aide1.5% Babysitting
12.4% Clerical/Bookkeeping/Secretary1.3% Teacher Retarded Children
20..5% Public School Teacher2.3% Cook/Cook Aide.0.5% Driver3.5% Caseworker8.8% Other Education0.5% Volunteer5. 8% Maintenance and Service3. 5% Community Aide
10.4% Administration2.3% Health0. 5% Farming2.8% Insurance0.3% Food2. 5% Beautician3. 3% Factory Worker2. 3% Mental Health1.3% Other professional2. 8% Other Service
99.7%

EXHIBIT XXXVII
Office of Child DevelopmentDepartment of Health, Education and Welfare
EXTENT OF SUPPLEMENTARYTRAINING BY COMPONENT
CREDIT HOURS OF SUPPLEMENTARY TRAINING
Education
1-15 16-45 46-60 Over 60
58% 57% 59% 78%
Health 2% 12% 3% 0
Volunteer Services 0 0 0 0
Social Services 11% 11% 7% 5%46
Nutrition 5% 2% 5% 0
Staff Training 1% 2% 3% 2%
Psychological Services 0 0 0 0
Parent Involvement 1% 3% 9% 70,-'o
Administration 18% 9% 7% 5%
Component Not Identified 4% 4% 7% 3%100% 100% 100% 100%
136

2. THE IMPACT OF TURNOVER IN POSITIONS EXTERNAL TODIRECT PROVIDER ORGANIZATIONS
There are several types of positions which have the potential
to disrupt program operations when vacancies occur in them.
They are:
. Head Start Staff of Grantees Who AreIndirect Providers
Regional Training Officer
Regional/Community Representatives
Other Regional Personnel
Our findings indicate that significant impairments of program
operations do not occur because of turnover in the above positions.
The following paragraphs address the reasons why there is little
apparent impact from such turnover.
(1) Delegate Agency Employees Consider Grantee AgenciesTo Be Controllers of the Purse Strin s More Than ToBe Providers of Technical Assistance
The core services provided by the grantee in-direct providers are concentrated in the StaffTraining and Administration Components. (Notethat administrative and supervisory positionswere previously cited as being the most impor-tant within direct provider organizations)

Of seven grantee indirect providers, thefoliDwing numbers of those organizations pro-vide core services in each of the components.
Education--2Health--2Volunteer Services--2Social Services--1Parent Involvement- -3Nutrition--1Staff Training--6Administration-6Psychological Services--1
Disruptions can occur when the incoming granteeadministrator sets new policies regarding theallocation of funds.
(2) Regional Training Officers Provide Limited Serviceto Head Start Organizations
None of the fifteen highest mobility organizationswas able to indicate without limitations that itsregional training officer was effective. (DelegateAgency Project Data Questionnaire, Question 47).
Effective, with limitations--60%Not effective-33%No response-7%
Most of the limitations concerned the availabilityof the Regional Training Officer.
As discussed in Chapter IV, a statistical analysisshowed that there was no relationship between theeffectiveness of the RTO and turnover.
(3) HEW Representatives Serve So Many Programs ThatThey Can Make Only a Limited Contribution to thePrograms
Organization directors stated that the communityrepresentatives visited their programs infrequently.
-87-

Directors did not consider community representa-tives to be very effective; discussions with fiftydirectors resulted in the following distributionof responses:
Ineffective--46% (True value in the rangeof 31.9% to 60.1%)
Fairly effectiv,! - -40% (True value in therange. of 26.1% to 53.9%)
Very effectiVe--1,4% (True value in therange of 4.2% to 23.8%)
Turnover of community representatives causesno problems in about half the organizations;discussions with 70 directors resulted in thefollowing distribution:
No problems-53% (True value in the rangeof 40.9% to 64.8%)
Some problems-20% (True value in therange of 10.4% to 29.6%)
Many problems-27% (True value in therange of 16. 5% to 37.8%)
3. IMPACT OF UPWARD MOBILITY
A lack of upward mobilitydean cause tur1er and also have
impact on those employees who remain in the program.
(1) Employees Who Leave Head Start Have ExperieticedLess Mobility Within Head Start Than Those WhoRemain
Former Employees had fewer positions in HeadStart than current employees.

Exhibit XXXVIII, following this page, shows thatthe proportion of current employees/who haveheld three or four positions is over 50% greaterthan the proportion of former employees whohave held that many positions.
At the 95% confidence leVel, this difference be-tween current and former employees is signifi-cant.
(2) Lack of Upward Mobility Can Cause Resentment andDeclining Initiative for Current Employees To ImproveTheir Capabilities
Employees in low promotion organizations com-plain that there is not a fair opportunity to getbetter positions.
In the fifteen highest promotion organiza-tions, 54% of the current employees feltthat there was a fair opportunity.
In the fifteen lowest promotions organiza-tions, only 41% of the current employeesfelt that a fair opportunity existed.
These expressed differences are significantat the 95% confidence level.
Employees in high promotion organizations aremore likely to have had more supplementarytraining than those in low promotionorganizations.
In the fifteen highest promotion organiza-tions, 77% of the current employees hadfewer than 11 credit hours of supplementarytraining.
In the fifteen lowest promotion organizations84% of the current employees had fewer than11 credit hours of supplementary training.
-89-

EXHIBIT XXXVIII
Office of Child DevelopmentDepartment of Health, Education and Welfare
INTERNAL MOBILITY DIFFERENCESBETWEEN CURRENT AND FORMER EMPLOYEES
NUMBER OF POSITIONS IN HEAD START
CURRENT EMPLOYEES 1 2 3 4 Total Employees
NUMBER 141& 832 236 134 2650PLRCENT 53.5% 31.4% 10.0% 5.1% 100.0%
FORMER EMPLOYEES
NUMBER 413 254 54 15 736PERCENT 56.1% 34.5% 7.3% 2.0% 99.9%

These differences are significant at the90°,10 confidence level.
In the high promotion organizations, agreater proportion of the employees re-ceived 11 through 45 credit hours of supple-mentary training; the proportions were thesame for those receiving more than 45credit hours.
Although the differences in extents ofsupplementary training can be partiallyexplained by greater accessibility tocolleges in the more urban higher pro-motion organizations, many current em-ployees interviewed stated that they be-lieved that there were no rewards forcompleting college work.
This chapter shows that there is little impact upon the
program quality or cost from turnover of either direct provider
personnel or other Head Start related personnel, but that there
are impacts upon Head Start employees themselves from low
turnover and 19w promotion situations, e.g., employee resent-
ment or lack of. kncentives to pursue additional education. The
next chapter discusses opportunities for improving policies which
affect Head Start employees.

VI. RECOMMENDATIONS
Data presented in earlier chapters show that the amount of
employee mobility in Head Start programs does not appear to be
great enough to be considered a major problem in Head Start. At
the same time,' this study has identified certain conditions which
relate either directly or indirectly to employee mobility in this
study. Recommendations to improve these conditions are dis-
cussed under the following topics in this chapter:
Reducing turnover in critical positionsImproving employee moraleImproving upward mobility rates
1. REDUCING TURNOVER IN CRITICAL POSITIONS
Directors, supervisors, and other administrativepersonnel are felt by the directors of Head Startorganizations to be in the most critical positions.
These personnel feel severe pressure from thedilemma of uncertain and relatively inflexiblefunding while they are held accountable for providingservices in a manner acceptable to HEW, Boardsof Directors, and parenfs44.Juncils.
There are actions which can be taken to facilitztethe work of the directors and their immediatestaffs.
-91-

(1) Simplify and Expedite the Process of Grant Renewalt) Nlininii/e the Annual Refunding Insecurity Crisis
Some employee salaries have not been paid whenscheduled because of the year-to-year disruptionof program operations.
There is additional insecurity caused simply bylack of availability of current information to theprograms about refunding.
When the directors lack information or receivefrequently changing information, they lose cred-ibility with their empio,ees.
(2) Examine the Possibility of Expanding the Number ofCommunity Representatives So That the Pro )rams CanHave More Frequent Direct Access to HE \V
Many community representatives said they hadtime to visit each program only once a year.The infrequent visits were also mentioned bythe organization directors.
The community representatives need to have moreteOlnical and management training in the RegionalOffice Fo that they can provide the additionalassistany,. the programs which the organizationdirectors would like to have.
1.nuncti an Effort To Ins.r)roye Communications ofHead Start Policies to the Programs
This effort should include the reproduLtion andfc...Aarding of eon,plete copies of the currentHead Start Manual.
fkad Start poli-ies should be comn-idniateddirectly to all oti_fanizations, includingf 1e!,.gatt.. a g s

New policies should be accompanied by .suggestionsof how to contend with problems associated piththeir implementation, e.g., the extent to whichfacilities should be altered to serve handicapped.children.
(4) Introduce 112reFle,.tilliiii1211(Lrigri.Ltrl I ud (As
Instead of having many children crowded into_ateacher's private automobile to get to - school,allow the program to decide if it needsto;spendsome of its budget on buses.
Allow greater program flexibility in allocatingmonies to repairs and renovations.
2. IMPROVING EMPLOYEE MORALE
In the organizations ith th12 litghest turr'.over,morale problems were evid,..,!-2ed i,y. erilF!oeedissat)41:-..,Ttion with fellow :ti--orkes.
Although employee d:s:.zatifa4,:tion in ilead St,rttypically does not express ase.if in the form ofresignations from the prog4arns, there appearsto be a latent desire. to ieave if bttte jobs becomeavailable in the field of child,dvt-lopment. At
the same tii:;e, it can be assum.A tht -
faction of this kind has somf impact nnquaiity and content.
The following paragraphs discu6.1fecomilienti;tions to alleviate some of the :-:ourcc:s dist.:atil-z-
f a ct

(I) Ftind Should Fig Sought Tee 1;nable }2.1_1 Trams To GiveCost -1)1-Living Increases
The stagnant salaries for many employees overa period of three cr four years have simply be-come.a hardship on them in the face of risingconsumer costs.
If the raises are not given, however, mostemployees will stall remain in Head Start be-cause they enjoy working with children and be-cause they do not have alternative opportunitiesin the same field.
(2) Communications Need To Be Improved Within HeadStart Programs
Program -directors and supervisors need to:
Do a better job of demonstrating an under-standing of the problems of their employees:thi5 includes listening to them,
Communicate more clearly the reasonsfor, and ramifications of, policy changes.
Show more evidence that all employeeshave a fair chance to advance in the program.
To assist program directors and other key super-visory personnel in accomplishing these improve-ments, a training program in administration shouldbe offered.
We recommend undertaking a study of thefeasibility of directly funding delegate agenciesin some of the large q !lead Start programs andof eliminating their grantees as intermediaries.
The grantee aS51Statice is costly, but notic!v.-ed as highly tivneficial by delegate
ai,!#rncy directors.

The existence of grantee organizations. separate from delegate agencies invites
continual problems in coordination "and
communications between grantees anddelegate agencies.
(3) Employees in Components Need To Be Given a GreaterFeelin, of Rein: Part of the Entire Head Start Effort
Regardless of 'whether an employee gives favor-able or unfavorable comments regarding hisexperience in Head Start, he ir'quite likely to saythat he feels very helpful to his program.
At the same time, however,, employees frequentlyview their own components in. isolation from othercomponents.
Employees feel that they must compete withother component employees for the director'sattention.
Cross-component training should be givento improve the staff teamwork and to provideadditional skills, such as social work trainingfor teacher§ to improve their effectivenessin communicating with Head Start parentsin their homes.
3. IMPROVING UPWARD MOBILITY RATES
Because some programs have been able, to main-tain relatively high promotion rates despite lowturnover, we conclude that it is possible- to initiateeffective Career Development effort .L%-at least inall but the Stratum D-sized programs, which havevery small staffs.
The following paragraphs discuss some optionsfor improving the rates of up,.tard Fr ability.
-95-

(1) Information Concernuig "Successful" Career DevelopmentActiyitis Should Be Distributed to All Programs
Some programs have been particularly effectivein creating linkages with nearby colleges and ininstilling a desire in their employees to pursueadditional education.
Programs of this type should be identified by OCDon a national basis. Their methods of implementingtheir career development efforts should be dis-seminated to other programs as models.
(2) Rewards Should Be Given to Employees for ImprovingTheir Educations and Skills
In programs in which raises and promotions weregiven infrequently, many employees did not feelthat it w as worthwhile to make the sacrificesnecessary to pursue an education while workingfull-time, and often while needing to meet familyresponsibilities as w,:11.
Salary increases should be available to he awardedto employees who receive academic degrees whileworking in Head Start.
(3) Certain Entr.Ni-Level Positions Need a Clearer Avenueof Advancement
Ifealth Aides should have more opportunitiesto advance their capabilities and responsibilities
Bus Drivers; Custodians should feel that goodperformance can be rewarded by a transfer intoother components, e. g. , the Education componentif t}n want to work in the classroom.
-96-

Head Start organizations, like ther organizations, must be
attentive to providing the environmen in which its employees can
work productively. Such an environment is dependent upon a
demonstrated concern for the needs of employees by management
at all levels--HEW National Headquarte-rs,--IfEW -Regional Offices,
grantee agencies and delegate agencies. The recommendations
proposed in this chapter provide options for addressing such needs.
-97-

APPENDIX A (1)
GLOSSARY
Confidence Interval--The upper and lower limits Within which aparameter is expected (with some degree of confidence) to becontained.
Confidence Level--The degree of confidence asociated with aconfidence interval. If one constructs many 75% confidence intervalsand each time asserts that the interval encloses the true value ofthe statistical quantity being estimated, then three out of foursuch assertions will be correct.
Contingency Table--A two-way table of counts. A Chi-Square testis employed to judge whether the difference in the counts from rowto row are consistent from column to ct.;:amn or vice versa.
Delegate Agency-.-An organization within a Head Start program towhich the grantee has delegated funds for the operation of one Drmore Head Start centers.
Direct Provider--A Head Start organization which has direct respon-sibility for operating one or more Head Start centers. Both granteeand delegate agencies can be direct providers. A grantee whichoperates some centers itself is considered a direct provider evenif it delegates the operation of other centers to delegate agencies.
Grantee Agency--The organization which has been designated by theOffice of Child Developm:ent as the primary recipient of funds for aHead Start program.
Indirect Provider--A Head Start grantee agency which monitors andcoordinates the operations of one or more delegate agencies, butwhich does not directly operate Head Start centers itself..
Lateral Transfer--An employee who leaves Head Start for a similarjob elsewhere at approximately the same organizational and salary level.

APPENDIX A (2)
Organization--Any one vi the entities involved with, a particular HeadStart program, including the grantee agency or any one of the delegateagencies under the grantee. Because individual dictanizations withina given program exhibit different characteristics, this study analyzesthe causes of mobility by organization rather than by program.
Outward Mobility--The separation of employees from Head Startprograms due to termination, resignation, or lateral transfer. Out-ward mobility is used interchangeably with turnover.
Paraprofessional Employee - -An employee in one of the followingpositions, regardless o:'. background or training, is considered aparaprofessional for the purpose of this study: teacher's aide, socialworker aide, health aide, nutritionist aide, other aide categories,cook, secretary, clerk, driver, maintenance worker.
Professional Employee--An employee in one of the following positions,regardless of background or training, iF considered a professional forthe purpose of this study: administration, component director, teacher,psychologist, counselor, speech t.erapist, social worker, amsultent,physician, dentist, nurse, physical therapist, nutritionist.
ProgramThe Head Start staff and activities of a grantee agency andof each of its associated delegate agencies.
Program Year (PY)--The twelve month period beginning with the montha Head Start Program's grant is received or renewed. Mobility datahas been gathered on a Program Year basis rather than on a FederalFiscal Year basis because it was found that most programs recorddata in this manner and because the term Program Year was felt tobe more familiar to Head Start personnel.
Promotion- -The upward movement of Head Start employees from onejob category to another accomplished by additional. responsibility. Thetotal promotions for a given program year are obtained from the ProjectData Questionnaires as the sum of promotions within components andpromotions from one component to another.
Promotion Rate--A percentage. determined by dividing the number of pro-motions in a program over a given time by a program's average staff sizeduring that time. For each program year a program's promotion rate isfound from the Project Data Questionnaires by dividing the total promotionsfor that year (defined above) by the total staff positions in that year. Thethree year average promotion rate ,is determined by dividing the sum of thepromotions in each year by the sum\of the staff position in each year. Thisquotient is an annualized rate which may be described as the average yearlyturnover rate observed during the three-year reporting period.

Stratified SampleFor this study, a random sample of programsselected from each of four independent segments (or strata) of thetotal population of full-year Head Start programs. Each segmentrepresented approximately 25% of the total dollar value of FederalHead Start grants in 1.971. This type of sample allowed a greaterrepresentation of large programs in the sample than would havebeen the case under a nonstratified sample.
T-Test--A test statistic employed for judging whether the populationmean for one population is the same as the population mean for anotheron the basis of random samples from the two populations.
Trend--A statistical .assessmeht of the realness of the differencebetween the observed mobility rates between PY 70 and PY 72, usingthe PY 71 mobility rate to obtainl a measure of error. The statisticalassessment is accomplished by constructing an interval around theobserved differenct....-herein one would expect the true value of thedifference to lie with 80% confidence. If the interval does not enclosezero, the difference is judged to be real. In using this procedure, onewill wrongly assert that there is a real difference, when in fact thereis none, one in five times. If the interval does not bracket zero, thetrend is said to be rising if the PV 72 mobility rate is in excess of thePY 70 mobility rate; otherwise, it is said to be falling.
TurnoverThe separation of an empliyee from the program with whichhe has been employed. The total turnover for a given program yearis obtained from the Grantee aryl Delegate Agency Project DataQuestionnaires as the sum of losses due to lateral transfer and lossesdue to resignation and termination for that year.
Turnover Rate--A percentage determined by dividing the number ofturnovers in a given time by a program's average staff size duringthat time. For each program year a program's turnover rate isfound from the Project Data Questionnaires by dividing the totalturnovers for that year (defined above) by the total staff positions inthat year. The three year average turnover rate is determined bydividing the sum of the turnovers in each year by the sum of the staffpositions in each year. This quotieilt is an annualized rate which mayhe described as the average yearly turnover rate observed during thethree-year reporting period.

Upward Mobility--The upward movement of Head Start' employeesfrom one job category to another, accompanied by additionalresponsibility. Upward mobility is used interchangeably withpromotions.
Weighted Total Turnover and Promotion Rates--The weighted totalturnover rate for all programs is found by a three-step process.First a turnover rate for each stratum is calculated by dividing thetotal turnovers for all programs in the stratum by the total staffpositions for those programs. Next the turnovers and staff positionsin each stratum are multiplied by a weighting factor which is the ratioof all Head Start programs in that stratum divided by the number ofprograms for which mobility data were reported. Finally, the sumof the weighted turnovers for all strata is divided by the sum of theweighted staff positions for all strata. The weighted total promotionrate is calculated analogously.

APPENDIX B
TABLE OF CONTENTS
Survey Instrument Lags_4;
Grantee Agency Project B(l)Data Questionnaire
Delegate Agency Project B(11)Data Questionnaire
Current Employee B(26)QUestionnaire
Former Employee B(34)Questionnaire
Confirmation of Employee B(41)Departure and Reasons
Community Representative 13(45,
Interview Guide
Regional Employees B(48)-----Interview Guide / NN
11
Current Employees B(5()Interview Guide
Former Employee B(53)Interview Guide
Grantee Agency Head Start 13(55)
Administrator Interview Guide
Delegate Agency Bead Start B(6I)Administrator Interview Guide

bmn No. 85-S72023
titliVEN" D.
ratAN1I.1." At:1-\4.-1 PPc .11.1"I 9111 Q1'1.:q'Fie!.tiArt I 1-.at 4.1 I I It.ttll IT% 1)1
APPENDIX L (1)("ututnet Punrh
TI- c gtes,te,nnatrr shot11/1 he rtmpletert by the iivati St.: t Progrren DIrootol .1 the Grantee Agen..p-ar;' -,e a t, abet 1,1.1.1;11 ant .rmateln tt,01.)%tnetit rraobtlitv ot Head St . pragram qtaff ant;
!?,1 a ;los. s an )1,1.:- I. improve the H-at .-,turt program and it.: potteles.
I -t ;lam, ;term.% pt
I' cr.arl!, ao a pi- a, I 1I a oro cter. t' , ala.I. ,,it.- all that apply!
I.! 1)--..1
Na .1;o1,,Ptanntne' at I a
bI-- -,stnct
-;,.1 . I, a s Pr ay. I
I -.1r.r('l6It I vt)1, alth S. a
t "el :!.1It. r
I .
,I ;to,.:ter r .;P-aI a ar 11nat an
S III .:pra Ia rg PI 'act
I. ta".'!! In.-01,,errtrtitt't"
;trittun Pr ae.Nitflai
It rutting ,fl.'a-''f Ira
' ; t-lt aa
,a1 par' -1: Mg
.11,4) .nala, r,
t Itning1. t
a' 1aflI'Ii;pnit
reerWarm:1g
pfr;,..... .4,1.Ini r
f' e, ,
414...nn.-ant, t f
Via szer% I.
i"'r-'''- 4 ;rantau:31.)not Con.; 'Ham
;.e II by (;thr Thanra a-vt Delegate
rats Stall gent
Jr e::Intet"seeta .. . ,,,,ne fa' .i.! g a...1
Grant... Hasst grAtateI 11th
tiutseleAgena le; 1.1liat TheRt,
Se rvit taqPra.vvitort
ts :*.
. - I.
,11 11'. t..tft et ,t1!.. a. 11.1 ;40.'t, .!
N.! a a a. .4.a.nt.- ..t e I1 .-.r.11 I .1.- -.pet ..re

13(2)ilfirleniWuqicrr
4. Please attach a copy of your staff selection criteria and a copy of the Johdescriptions for each position with the qualification needed to achieve salaryincrease steps in the ranges given above. If your agency does not havewritten material. please ind:cate here.
No grantee agency selection criteria other than OCD or0E0 vanuals
tin separate grantee agency job descriptions
N ritten qualification for salary increases
In adcliti.in to salary, what fringe benefits do you offer"'
Annual lease weeks
Health insurance
1.i f. it Sec ilent insurance
sick h.:1k t.
C:tht r (CHFCIF'V
f't oterti
All fall-time staff
All part-time staff
pprox.r-inilv re--ntage if grilaris .1 q the fringe benefit package represent')
ut
8 :n -linortine in 1,.e labor market grante.% agency Head Start taff, v.-ho are-trongest
Pr if: 4:c.. mat St; 'I 'a)Pitilic sc*.ol 4 ysternqPrivate 'al ser..ii e agencies
sor:al cervire agencies(.'tr Federallv-fiknded programs such as CEP, Model Cities, etc.Prd'itmaking rhil.r rare centersN ,npr centers and programsOther (SPECIY)
Parapr-oessvonal Staff tai---7,1777school systems
Private social servite agenciesPublic social Spruce agenciesOther Federally- funded programs such as CET). Model cities rtrProfit-making child care centersNonpr.:fit child care centers and programs°the.- tSPFCIF N.)
N-rtr tat For pirty.ceg if this .;;Ir...ev, the f ateg,)ries of otssional and paraprofessionalpersonnel will he divided in ac( ordance with-the list on the following page Ifyou have people in positions not listed, please apply your own definition for then:.

APPENDLX B (3)
PROFESSIONAL
Adtntrustrattve
Teacher
Psychologtst
Counselor
Speech Therapist
Soc:,' ..Irker
consultant
Phystelan
Ounttst
Nurse
FHA vii, .4/ lrap:st
Nutritionist
PAR ?PROFESSION Al.
Secretary. Clerk
1 eat ht.r- A Aid#
Social Worker Nide
Nidp
NutrItrq t't Aide
rr,ck
Dr:.er
Lia:ntinant e Worker

4
1.1 hen % 1.),.s. put' ....1177**i t. T q.1.11 ZilDt ii oi ..ranster of tne staff tnernber,dc takt- -- ii. Ulla r_izen, sh.)14-11, n Questton
N.-
1(1 t!li 1:114.% 4. r t t,,)ut....ti in is please Its-, the tv't,t it( orizantrations tot 1 t.t Ataff
7 11 Itipx!- i,tlt ',it tr ,.pt )1- .4 :Imp- zi sp-)t In stafI ;1.1etIonr ruz ,-;it
12 11 If ftz. 7-11 Qtaff r--r-nt-tcra !:e.-t VA!. .! iity;. r mter.view prospectivepl f-,r t''t` et -rItt -4 taff please st-tte the rtpproxtrintte Iota), -mount-f U P,r *,--1. spent In i tvly,cal
inms .1( ttrrn. tier v!ar
! ! 1 a.i v I t 1 1.; T1:flat!. railtre agenct.
.-.t . : ' -"' e f .1... fin fr.g -
q: I,- .01- '_.1! t:pe 4 if it-'4 ,1.1 these tertnintitt.t1 41:11f
'11 .1.- 1. --nt
12r?..-4.41.nAl1' .!,! -h ,; cterr ;l' . 0-- -1 1! .11 +" .0''n -
1' :hitt 141 i * ;Igen. it.(4h/sr I t-ieral)-. -ittnrielp:grams h as CEP,Pr 3tit-ni.-ik4ng 4,e nt..rsN-inprrtfit -4,111 car.- enters and programslateral transfer ultr.in the grantee agent t"e-
1'1! ;:; ! '. -!:!.
.ite CP' r 1' (1. art.T.:
elt.: ill. -f-m-',t ,fitarn4 .4 1C
(.. .1 ! . ;! -- .' , -1 r .f e, 11,
t 11 `,
f' it.e.s, etc
1.1 t
APPENDIX 13 (4)Column Punch

Ploace ft-.- g nf--,rmat.;:rt rrrtzars-ting all gr:intee :agent:. -!1f Inle ;t.st:-!. LT, r,eva tv. p-agetl. folostartntt its,:n!..%ns cot:IN
t tf:e
Pr Iro .ta.ms mean Pte upwari so .-atise !--y .elcArrlf Svc t'vtat'v Adrnatistrat.:.
1.ateral tran4fers me.ln -ifl!ttr 1t apprmatelvthe qam ,,rgantraLlnal les.e1 anti sa1:4r,. ;eve
P' mara-: or:)gram %ear. PY -efe:s, ht. pr.)gr m year ,tv.!- 4e 1a4! enantt en: ;r1 Pi72' P fa* 72
,t ..t.er -it the present tune. pleaar uae elt,rnateg rfplet the mobtl.tv irtt.Irmata..)nf.11- the rest f t!;as pro gr am :tear
g ! .1! )nth)
7i P: ( !;!
Parnr Ifecgi3nal
)zr-41^
Ps !.-: na! -:1"I'i t-t"
sz Pr crl-
; ?
I:! " :! .
P-. f.t,r nal sttaf:
P- gr!irnV. f. s-.11 4t:iff
ctn''
ning Pr vrart.-al z4"
feqs, snal 41a"
-1 inteer p-,ernmmat qta,"."
Prinr-)f.-asit 'nal .-ta!
1'r f, qsz, 'r11 qtarj
al '4' r-It-
APPENDIX R(
Nw:1-er .:1 Ztaff P-tc.10.)tv;P1 ""
1
PN 71 -----T-' 77-- ...------'
I .11- Part- 1- -11-1
i
Part- AIl -MIa:rret.,,-1 cm T,ne T;rte Tint- 1 rr e - -
,s- --
1 -- -.----! 1
I
1.1
t,or..-ts.

-I; ::;f:.
;ez 5. . he, ttl:4,kg !ti .41 1.141t-tidtVitt -ton af; zieparati,.. 7.1 pr.:trinAtart and terrffitintt are each
.( !!=i4v sy ftte 4.4frse 41arf rna.rrthe.:
Inf--.trniman Re
ri;_::tts.
^ --rrtr, r.: :ft51 .7 7!lt!
.. . a.
11, t
4!fif
;,1, t ',.11;)714.11!... ;141
r-irerst ;!-pit..., ;I,- kp,
t4taf; Progrr:m1%, -4- 4ta1tearacir..ift inat qtaff
!,..gite-t.'r Pr.
::!;=.cA. I.L.If!
Pt ,fr.t1,.--,n314;itAifF_!eig;sr..3!, ltai!
.1346.:6-,51;,/,4 4
4r.din Pr-at-notions
Per,;-annetProtivwsni
'Cat of 1-.1-;6,iComponent toAnolner H S
Con -twtentp r PY
7Ct
and tosises of Per90nnet
Pe -wnnttses Out
H.S Doeto Laterallfrirofer
py P PV72 71 70
Per4aWielloseDar to
elland
I ErninationgPY P%
172 71 711
-
,41.
L
;
1
APPENDIX B (6)Column Punch

. I.C)mtnue,
tik. f -.Or-swing part r th;o7.11..tectton. Illueft r r-,Jtri tiogiffe refers to pet son4101:1 Acre no'. Prt.".,ij-Ftv Patd %tun !lead Start funls For example. a social ienrker
tne t a tionIlead tart fdis..tiun will be treated as flitelj.
4..'t -=0011-4415 ftea4 Start In answering this question. Ple.04$4!'ttit . . a3 Si'.' pa rbte event. i.e tiu promotions or a prrinu:4t...tri ant a lemma: t 1A-,/ et erE9 ever if they involve the same 4taff mt-mtler
I i't
I.r
f;,
IP tr.
I e ,et ( Rç _
f)rrtvr4rn'.----,;.Fq11 4!.0
r4' ` 1 in:ngPr ..fc staff
Pr3fr.PrPa ta'f
14,1rn.frivitratioriPr,feA4, mai 4t4if!I1rqq'3I Its"
P :1 )6.1;:r ";' r',$etr3
tniticr crrIsng flecruating_Sourre of Permunnt.-1
'`4. ;''''''P' .: i "...,,r0-.../ ;.! It 1i ft:umber
;:n-,4 Promohans :SI tiratE' I
!!Ereft 1 Pr urn From of La ler a IW cItt-.rt ft s' Transfera
(--4t,,,-Ir 1 Ilranteo Delegate WithinI( C, Staff Agenr;es It C Claff?i-4 ',I.?, ;
P\ fly P.N. 1 PY 1131 PY PI- Pi PN PI l': -Fa:7:', 77 71 70 72
;
.....11x17 .1=111
_APJELEDIX B ( 7)Column Punet:

f iacn funded }lead start posit.on in vnir grantee agency. Please provide thefolinting infarrnatton
AverageNuynhey
.! V1 prIths)y Neu
L-not-,\
It.0,
n
rsing Oneas HighestRate EachPosition
I, 7. ny 3th Cr er oftrilp.-,rtance
f )r V.).4rAgency
APPENDIX B (8)
Place `C.trrthersof the Facts
Salary Listed Belnu.Range Which Rest Aprt,
r-)rn In to Thic
...*.
11. L
i t- - 1,-t.5 1..4.... $4.4.. ::, '..i y
!!. ,.- .: :7:4F,rtant ri -tat...Lt. _if thy
!9
..44a rhr)1,1t^tr..4 Ui rk", ng the i'pr-Internq in ee.-fr.rig ffiese
nre'er theAc- even .1.4.. .Art fc...4,1 r tr).-.r. pc s 1(1 r 4 .! t-.. se pr. .
"--.313.: r. .;:itay . r4 kvp r: fig 1,.. a'!.
orripr I t)rit f-,r .Jthyr ratwflT.Ar I -.:f
I trhIlrr. an.! trin.ifyy "tq r10. attrar!i-.4- ple
: l' -it -t king tttinn:. ".r...ter%1 t
4.1111 trAy-e ;e!,lor
'41.aff rhilttic.-j 'Pr ice. if i .4r.1 ;.11, 'f a 1,9 cis'et r :!,
I, I (V,k
Column Punct:- =

18. Type of agency (CAP. Board of Education. etc.)
Amount of C;rant
l'eacrat stare
Nnn_Fpdprat rac.h 9hare
Nnn Federal. in -kind rnntributiqns
Total
PY 72 PY 71
APPENDIX 13(9)
t 72 Pt' 71Non ed 1- f: Nf..n- Fed
t'f ;4* :s Share Tot ai Share Share Total
.r.;rn lAs.r.pflt
'1
Column Punch

ADDITION TO GRANTEE AGENCYPROJECT DATA QUESTIONNAIRE
Grantee Agency Central OfficeStaff Size
P rofessionals
Paraprofe.ionalsI
Voltufteers
PY 72 FY 71
wommi1101.1. 1
APPENDIX 13 (10)

. .
OMB No. 85-S72023 APPENDIX 13 (11)SURVEY I. D. NO.
Delegate Agency Project Data QuestionnaireHead Start Employee Mobility Study
(Give to Grantee if Program Has No Delegate Agencies)
This questionna'ire should be completed by the Head Start Project Director of the Delegate Agency.. Its purpose is to gather factual information about the employment mobility of Head Start program staffand its causes in order to improve Head Start and its policies.
1. The name of this delegate agency is
2. How are vie frillowing core sers....7e components provided to your delegate agency Head Start Program(check all treat pply)
Cot; oonent
Eau:at:on art.: Da;lv:lc-to:Hies Programs
Mahn:rigurr is Out:. fvelopment
purc hag ingCla,-roon.instruction
Health "-ter-. if-pc Progrartii.pre!ensive Health-ervtre
Dental Program-reef !-1 Hearing aura
1.angl:age service
Volunteer Ser.t icesri;:tr--unt.-.
c.00rtt i rat on
et; i`rograr..
Parent in-..-01.ert.ent
Nutrition Progrart.',lent. piano:of.;Coutc training and
hyph_ r. is ion1 roue preparation
oo,1 purchasing
staff Iraining PrograirPre - ryIn-serviceSuoplemental traolingCareer development
planningpprccinnel splectinn
and re: rult.1-4
Psychological S..er
Pro-. viedCentrally Provided by Provided by
by Delegate Head Start Another Aget.cv NotAgencx Staff Center Staff or Consultants Pre ided
-..11
...01.www
.11141
4110111.1164. 111.0410.1111.
1111
.11111 .1111

APPENDIX 13 (12)
3. Please attach a copy of your staff selectio rtterta and a copy of the jobdescriptions for each position with the qua cations needed to achievesalary increase steps in the ranges given ab ve. If your agency does nothave written material. please indicate here.
No selection criteria other than OCD or ,0E0 manuals
No separate delegate agency job descriptions
No written qualification for salary increases
4. Our delegate agency staff hiring philosophy is generally to (select one):
Promote from within delegate agency and Head Start center staff if we can
Advertise openly with hire of best candidate applying
7
5. In addition to-salary. what fringe benefits do you offer"'
Annual leave.Health insuranceAccident insurancePa'd sick leaveOther `ispecifyi
weeks
6. Are benefits offered to
All full-time staffAll part- t.!!,.. ;tat!
7. Apprftimatek what percentage of salaries does the fringe benefit package represent')
Ahout
fl. In con oting .n t' labor market for Delegate Agency Head Start staff, who areyour ,tronge,..t , ciir:petitiors-
Professional Staffsysteri...
Private social gPT: ire agenciesPortal set. ire agencies
Other edeval J-funderf programs such as CEP, Model Cities, etcPro!it-rnaking Child are centersNonprofit child car c enters aryl program
Other Head Start lelegate e.I It !:t rot, I f )
tw
Paraprofessional Mar (2)nchool systems
Private sot sal mervtee agent s
Pablo; social service agenciesOther Federally-fundt1 programs Huth ar. CEP. Mcx111Profit-making child care centersNonprofit child care centers and programOther Head Start delegate agenciesOther (specify)
Cities. etc.
Note tal r'or put poses of %tits siurvey. the categories of professional and pars-nr atonal personnel will be divided in areoeilanee with the list onthe I page if you have pe'.ple in positions not listed, pleases y tour awn definition for them

PHCFESSICNAI.
Aim tnt Strati% t.
1
f),Ivt-h
).:ncel.)r
Speet.t; I Therapist
Wor ktr-
9ns,.41tant
PAR PH( 1 I tis=tc \
41b
; '
1;ratt A oft
Niti Llt,ant. A, b,
rt.
APPENDIX B (la)

APPENDIX B (14)
9, When vou lose personnel by resignation or transfer of the staff menaber. do theyprimarily take jobs in the agencies shown in Question8
../ yes /7 no
10. If the answer to Quefitio 9 is no. please list the type: 0! orolizationn to whomyou lose Rtief.
.mel11 61+
t. Approx:eirite.- what fraction nf the project directors time is spent in abaft selectionand recruiting to w.typt; al year
Ahoet
12. If a..1.1iiiarial staff inernes have this duty and/or intemew prospective employeesfor the delegate arence staff for tee center staff, plesee state the approalmazeamount of their time spertt in a tyntcal year.
1"3
man-aie.t.tri 1f time t er year
pa. ;. at. Var,; . a.1. vet: otn,fr :f.--ronetr .irt..gte afpn-vIttft due to 1.. liZetat Y i!...ittAttenfl
14. if t:-.4 LL -4t OUr "K:10111.1- t.::QEAr Aiaff fsr;t1,11g heyarnpir,,,,-Wili in e
r,1"1.,
V-. 1- tr:e t4.At kn...in :fp, .ti nag types tf agetr:zeil 4.I these termieette'lstaff irref entpl; yr7',"ni
staff
t'ublt -4-a-r71
f agent:ie.,ky,;ts!ICIES
(neer. F'effFi iii,,,..furoteit program* SUch as CEP, Model Cities, etc.ear.- cerlitrx
s.eneroli; etiild care eentere end programsaural transfer within the delegate agency
r.40. ito
Peraprof,:eeional Staff
Public irehoe'rl systemsPrivatr social gervte steriCi.11Psabl EMOsol tierv,ce agent,*otke 1. tot-raity.forlerd programa oute an ('EP.Profit-making child care centershtencreofit child care centers and progretheLateral trsnefrr within the delegate agencyOther iiipecify/
Model Cates. etc.

APPENDIX 13 (15)16. Does your delegate agency have a budget which to independent fr..rri the grantee's budgst?
yea 17 no ri not applicat to (we are thiygranteel
17. This pr-igrarn operates co' tern whtch offer (check nil the* apply)
IR
9-7 full-day 3Zsaions 1--7 one' part-day session
110 inai-,y (:loath' a ,ear st..i.es your program, uptet ate'
6 /-7 4 ---' i0 r -71! 12
i7 two part-day sessions
1!I Do op rate a summer program to a!iit toil to your full year program"
0 tf thin is le99 than a 12-month pr.,gram and you do operate a summer program.,are vr.,ur full Fear program staff employed in the tier- .:trier program'
who lAriAlb to belictittions are limited and we only use part of the staffWe use other staff and all regular staff who want ernplcy:nentWe use other staff because.
Site of surr.mor programV44:411Kbe Of regular staffRegular staff wan, a rest in :wittier' to their vaeattonitegutar staff want a reat even thrvi we dor. t oa.e ;land va:attona
21. :f your program) to 11-4A Plan tr.onths and you do ti..t operate a summer program.do v.:%ti nave ,!iffitulty keeping the Rame utaff from yrr ..te-trear
nz--Ve Nei* 14)60 Albelt of of our staff each year
22. !!a9 th. ;?t-,grifT1 r.reri P.f.r.g.r.d
yrs
23. if sw du; this aftvi:i abhty to Niko Or keep staff
No effectThe type mein(. V..rx .n tne program changed.- Made hiring easierMade keeping staff eaat.'r
24. Has the monthly le.gth of ti..e program teen changed'
: no
yea from montha to months
?S. if yes, molt did this affect your ability to hire or keep staff
No effectType of people WhO work in the program rhangedMade hiring eak.er
M.I.M11100
Made keeping staff easierCtthvr
..1.111011*
111.,

APPENDIX Li (16)
28, Do you prepare a written individwil career development plan for your employees
C, yes
' for professional employees
/-7 for paraprotesaionel employees
;
1-7 no
27. Do you conduct your own p:.e-seru'LLe training tor ataft
yra no
28: Do you iise written material in these training sessions"
yea no
29. V... t; 'v f_refiervis e traLrung
Ail start.-are and ediraz:nn tif
All profeasiona: .!itatt.N:1 ,61:.nrofetaf;:onalIthe.r Stier t. (Spec try)
manv toff no-r* per year lo vrni entirnate are derritezt preservicr training
Annst /oTli Tninct:irm ate 4-se.t1 in preparation of material and teachingellaaec
-- otiff rerfennn ttro rapPnt in training rue., 1,'Par
t-:42 train at Rthff pergi.na na. ri yea,
31, f vv,t1 !...i- .4 19 ; ra.nir,ct prugg-42X1
yet,it . . no
Are these Ji, -,in!eriencm approach to !eactor4,1 or
is there re.r,te- rcU.r n
r'4 r t.pre ttbei
-33, Is The ,n-servi,e trai.ning divided 'fat, training far math program
component
AllMos:`,4,74111...All !raining is in ITgaSI group sessions
MIMEO.

a
Eti
I
APPENDIX B (171
34. _Pleas* indicate which program Components receive in-service training andtraining provided.
Component Professional StaffAverage Number Numberinestaion* Length of Eachto Each Session Per Year Sessi-n in Hours1111111M AM=11.w.I.
Education and childINeeare staff .
Health services 1111
Nutrition servicesVolunteer services .4.Social service*Parent InvolvementStaff training services 1101111
OtheraosIoNi
arra: tit Para rofessional StaffAverage Ns:mher NiStrt.-er of Sessions Lerignfot EachIn Each Session Per Year Ironton in HoursEducation ant child
IMI.MIcare staffHealth services 11.Nutrition ffertootte 41111.-olunteer Wtrvtces
=11rIEN11, .*SO(' al I I9l7.P,inCt.tial=6. .1Parent invohement 1
-. Sta" trainii g services-Other
35. !to lt..rpletneritary training*--ailaole to the staff
vett no
aft Doee tht6 trittnng la.! tfa t ithre- st
or It9 equ:73.1ent'
7 vet, to certlfgcote oniv
des to
yeb to AA drib
Vef, to tuEtier 1egrer
tertati-ate or a iievrv early eh!If1r,n,:x1 flt)ritt-rj
no
flupplernerttary tro;n:ng lea,ic. t, .i rett,fiisfite r- to t)ther: ;
f-7 Acy
/7 yea, tto admintstratton
yes. in social sereacris
yea. .tea th servmeft
yes. irt lutritinti4
"--) yea. er tope." Oly t

.7;
APPENDIX B (18)
.."
Mi. ?tow many rrnpio.reea hirve reretireq aurpternetitary trairsing3
C.!osarepent
Eda:ion fah:. ctg.id care
aeryti-vo.
Ner,.Qea
'2titr!,tiort
Number Prf.feaotonal Number Pa.-aprofesatonal
PY 7e. PY P1 72 Pl.' 71 in' ,z",'
...we... ....WI..
mon...MP ..m.M.m Wa.MW. MW.I
*MI
okft_.4Mt..r. 9upplement4.ry training par o1 woui lvtaft7,
nri
4 ,f yt., t'l app:. sr par!v.04ar staff' ".
4t.
MI pwraprr:felsielti1tcifit Is il cr3r3nr P-du,iit 1-.)1(1,1,1
r.rJtr..59eire afid education :staff
Citt,e-r fM(tyi
r Apc.nt t q .9,4 s ; pad Otaff ii,,nt fur those.
4,t ^ errIp;nyeri4 regular wOktrtg
P
^ bpet.ity
43. 1n iris otaff tune off with pay take oupplsmentary iroming'
V.."VC'
VP ;hi Itlait(Xri spvryWO
44. If yrii, ter a qualified yea, non many total man trourfil does this amount to u a year ttmeFbrafeamonal man tliNirtiPataproict.i.tort4i -nor! riouro

Have you used the Regional Training Officer In your program '1
/7 yea 17 noWM.
If yew. ..;)proain .tell' how many hours of trasnIng were provitfe
11.
.1=711110
Hourry plane e4 art FyBeare: in F -72fit.turg in 1:`; 71
41. Un yotl OtIteve the Regional Tramingof providing yottr miff net&tfot.f. tramItng"
t. f.flttql#
Vet. WiTht it icractati.nnsVrn. ;.sat :united smpl. tYeti out 1:Inaeit ,i.atteryeti rmitt itflitte availavility
gt t'S.tt!Nts, tt trt r.4.*4 fferto..e Oecal;gie
effk-ctive vneart*
- ti5ttle 4..ommuntlted, btpartment -t fra.q..A0 training51r.ttgrarntl. -rt h .16 P ar::: A ;- (Jr ',.rat' you 4yeet; perrionnoi,trained or. ittrtfte pfogrrrnti
.... if yet,E.1 *ghat t7 a,rate ttlaff r re; trryrk,
"4Ct..-114
Ct.:1.11 4' 4,- r ti.(' I rang(nker
,"1", npri fNfar trA".nr 'rfnabon ret4,0.'filed
,t1:rla ?,(1 wF 4r .1 ;1.-.ting.ng Sateexareipti,, Tev-hcr 11.11 T r
tt 4C:it ,s. r . V.. r 4,-;*&'16.? 4t PipP17.,.1;tr, atr. .
the q.rn.ae =n1taintealffiflal te-44 find Riaary Level.
rnean5 y sr prJat am yrar tarripla. PV 72 vkftt.rto the pr_igrarn year 4,1u.-.40 lafit rronth mitt ia 1972 i FY 72.4. rte.t ies:r .st the ct ,.torttt tune, pleaate oat! egelettalea 10,.!.nolete tr: t.,-41&itty ininriltatitien f".t trse eatt of :Pot progrsvr
Out vr,,ittnrn neptror 1ffeefi
In unn4c-t-Ifii; galeaav treat evert. ,,er4.,riine1 t:.n a8 l 1eparsieevent. . trr..,tnrIft or 3 pr.irowt,.....n and a te mirtiate-th are each tyro.,ete emir, ii-veto Owl. si-14,1.0. the !game. forrbp1:)yee
r
APPENDIX 13 4191

SO
.te
ont s
nue K
omi:m
yna
nt
Edu
catio
n P
rogr
amC
ompo
nent
Pro
fesi
onal
Sta
ffP
arap
rofe
sse
tona
l
l'Y 7
2Fu
ll 'li
me
Part
'lim
e
Hea
lth S
ery
teem
Pro
gram
ompn
nent
Pro
fess
iona
lS
taff
Par
apro
fess
iona
l
Soc
ial S
ervi
ces
Pro
gram
Com
pone
ntP
rofe
ssio
nal
Sta
ffP
arap
rofe
ssio
nal
Par
ent I
nvol
vem
ent
Pro
gram
Com
pone
ntP
rofe
ssio
nal
Sta
ffPa
rapr
ofea
dto
nal
Nut
ritio
nPr
ogra
mPr
ofes
sion
alSt
air
Para
prO
fess
iona
I
Staf
f T
rain
ing
Prog
ram
Prof
essi
onal
Staf
fPa
rapr
ofes
sion
al
Vol
unte
er P
rogr
amP
rofe
ssio
nal
Par
apro
fess
iona
l
Adm
inis
trat
ion
Pro
fess
iona
lP
arap
rofe
ssio
nal
Psy
chol
ogic
al S
ervi
ces
Prof
essi
onal
Para
prof
essi
onal
4,
Num
ber
Stuf
f pi
sstio
ns
"r 7
1In
70
Full
Ise
Part
%,n
l :11
I cut
ePa
rt .1
isn4
.Ifq
72 1
1.71
in 7
0
/pf I
)) v
II/l $
(.1f
lt,W
ithin
t. ia
intit
snef
,t1,
e r
istis
sr I
1,e
w.c
ng I
lls. (
ssm
pone
nt.
Pers
onne
lP
erso
nnel
sor
root
iims
leav
es d
ueN
umbe
r of
Per
son
o..1
.1 S
him
sS
ir la
tera
l tra
nsne
t pro
mot
ions
to a
noth
er H
ead
fern
foil
of H
ead
Sta
rt c
ompo
nent
Sta
rt P
rogr
amih
l4 (
Of1
11./t
,ntq
l
...1
P17
271
I'1
70ri
71 1
'1:7
0
Pers
onne
l los
sex
due
to r
evis
ena
tion
and
terr
nici
atso
nP
}72
PV
71
PV
70
O

....
IIi-
: 01,
I,I
I It
.
Cor
aeilt
nt
Edu
catio
n Pr
okra
m C
ompo
nent
Prof
essi
onal
Sta
ffPa
rapr
ofes
sion
al S
taff
heal
th S
ervi
ces
Prog
ram
Com
pone
ntPr
ofes
sion
al S
taff
Para
prof
essi
onal
Sta
ff
Soci
al S
ervi
ces
Prog
ram
Com
pone
ntPr
ofes
sion
al S
taff
Para
prof
essi
onal
Sta
ff
Pare
nt I
nvol
vem
ent P
rogr
am C
ompo
nent
Prof
essi
onal
Sta
ffPa
rapr
ofes
sion
al S
taff
Nut
ritio
n Pr
ogra
m C
ompo
nent
Prof
essi
onal
Sta
ffPa
rapr
ofes
sion
al S
taff
Staf
f T
rain
ing
Prog
ram
Com
pone
ntPr
ofes
sion
al S
taff
Para
prof
essi
onal
Sta
ff
Vol
unte
er P
rogr
am C
ompo
nent
-Pro
fess
iona
l Sta
ffPa
rapr
ofes
sion
al S
taff
Adm
inis
trat
ion
Com
pone
ntPr
ofes
sion
al S
taff
Para
prof
ersi
onal
Sta
ff
Psyc
holo
gica
l Ser
vice
s C
ompo
nent
Prof
essi
onal
Sta
ffPa
rapr
ofes
sion
al S
taff
Pers
onne
l Ent
erin
g th
e C
ompo
nent
Num
ber
Hir
edFr
om o
utsi
deH
ead
Star
tPY
72PY
71PY
70
Num
ber
.
Tra
nsfe
rred
Fro
mG
rant
eePY
72PY
71PY
70
Num
ber
Tra
nsfe
rred
Fro
m-
Del
egat
e A
genc
yPY
72PY
71py
70
Num
ber
Tra
nsfe
rred
From
Ano
ther
Hea
dSt
art C
ompo
nent
PY72
PY71
PY70
eim
mM
MO
..8.
Om
NPI
PPII
.SO
mi.
MO
M..
mai

APPENDIX B (22)
For ea..h funded Head Mart position in your delegate ageni,, including all 1:ead Startenter, please provide the following information
Using 1 asAverage HighestNumber Rate Each
of Months Positionfor New 1, 2, or 3
Employee in Order of.N uoPmfthebeTo Importance
Become for Your Facts ListedSalary Effective Agency Below Which
Posit ion Range in This to Function Best ApplyFrom - To Position EffectivelyTitle to This Position
1
2
4
6
7
8
1 ti
11.
1.:
I i -J11.-
14.
16.
17,
18. .101,10.
20.
Fur ra: h livec: above, please place in the last five columns the numbers of the fiveor fewer most important problems relating to stability in this position.
Facts
1. No problems in recruiting these people,2. No problems in keeping these people.3. People prefer, these jobs even when offered other lobe for higher salaries.4. Competition is keen for 'hese people.5. Salary we can pay hinders recruiting.6, Salary we can pay hinders keeping people after we train them.7, C.tualified people prefer to work for other organizations,8. Lark of promotion opportunity is a problem.`A: Family r roblerns and transfer of family members causes staff to leave.
13. Work is not attractive to qualifked people.11. PiNI if al working conditions hinders hiring and keeping people.12. Staff leave as soon as anything better comes Acing13. Staff prefer more secure employment.14, Staff hecome d.sillusioned because of problems and lack of adequate resources.15. Other +Specify)
c

5 Amount of Delegate Agency Grant (with aupplementais)
Federal Share
Non-Federal cash share
Non-Federal in-kind contributions
53. Personnel Costs:
PY 72 PY 71
APPENDIX B (23)
PY 72 PY 71Fed Non-Fed Fed Non-Fed
Salaries and Wages Share Share Total Share Share Total
Fringe Benefits
Total
54. Operating Data PY 72.
Part-day programs
Full-day programs
Number of Children Number of Centers Hours /Day
55. i Do you operate a summer program''
7/ Yes n No
56. Ethnic mix of children (approximate).
ao Mexican-American % Black
°I) Other Spanish surnamed American °A American Indian
'1'. Other White tilo Other (specify)
57. Geographic mix of children (approximate).
'1; Urban % Rural
a

APPENDIX 13 (24)
58. Who has approval authority for hiring and firing? (check as many as applicable)
/ 1 grantee Head Start director 17 delegate agency Head Start director
1-7 Center director / f other Head Start staff
/7 Policy Council /7 Parent Advisory Committee
59. Who has approval authority for promotions and increases in salary' (check asmany as applicable)
I-7 grantee Head Start director 17 delegate agency Head Start director
,17 renter director / I other Head Start staff
!--r Policy Council / l Parent Advisory Committee
60. Who performs the payroll and accoupting functions for the program?
/7 grantee / / delegate agency

-- =ADDITION TO DELEGATE AGENCYPROJECT DATA QUESTIONNAIRE
Total Staff Size
Central Office
Professionals
Paraprofessionals
Volunteers
Center and Field Staff
Pro essionals
P professionals.--
Volunteers
PY 72 PY 71
APPENDIX B (25)
Part Day Full Day Part Day- Full DayCenters Centers Centers Centers
olimaaal.liaMal
Type of Agency (CAP, Board of Education, etc.)

APPENDIX B (26)OMB No. 85-S72024
Column Punch
SURVEY I. D. NO. 1- 8
CURRENT ENIPLOYEE QUESTIONNAIRE
This questrmnatre i, hilng given so that the Office of Child Development can learnmore about why emplaN..ces stay in Head Start or move to another lob. Your name is notattached to this questionnaire, so please feel free to give answers which show your feel-ings about your job. (The survey I. D. Number is the same for everyone in your agency.so it will nc t identify you.
1. How long haN:e you worked in Head Start" months 9-10
2. lAas Head Start v.v.1r :):st lob-) (check one)
a. / 1f.s b. No
3. If not, how many other jobs did you have in the four years before you cameto Head Start?
4. Which of the lobs you had provided useful experiencr for your Head Start work.?
a. None h. Joh 1 ale c. Number of Monthsin This Job
Which of the jobs you had before Head Start did you like the best?
11
12
13
14
15
.Ioh it l 16
6. Why did Vail like that job best" (check two)
a. The work was interesting.
b. /7 The-pay was good
c. i i The ch..nces to get ahead were good.
d. /7 The people there were nice.
e. I got good training.
1. /7 The work was easy.
g. / / My family and friends thought it was a good job.
h. 1 7 It 1.A..as Sterif1V 301).
I . /-7 It let me do useful things for other people.
3. The hours were good.
1. I I I like working with children
k. / / Other
17
18

Why 1 1(1 you go to work in Head Start" (Check tv. o)
a. .111 work seemed interesting
b. I ! The pay wa- good
1 The han, es to get ahead seemed good
the people ,-rernel nir r'
e. r-7 I eoul 112et good training
f. II(' ork seemed easy
"--) \1' taii 11%. and friends thought it would he a good Joh
h. It was a stead% job
r.
k.
it would let me do useful things for other people
The hour:, were good
I like working with children
APPENDIX B (27)
8. How does your present Head Start work compare with the lob you liked the bestbefore working in Head Start? (('heck ones
.1.a. h. ' / i . I ! ch ' iI like the I like moth I like the I didn't have
a 1,th beforeIlea! :--tar: ;rib- abow.ji(1:;)'kri:.:')Irael"Job le,:- the -;.-ir: e working in
Head Start
N.Vhat other po ha.-e you had in Heal >tart ?
Job Titles:
.10 How well lo You know other people in Ilea (check one in each row)
a Don't know
Agency officials
Professionals
Paraprofessionals
Parents
Column Punch
1'1
20
21
92
24
I) Know thema little
e. Know them ri.well, but I
don't considerthem close friends
We'regoodfriend's
/7 I I I 25
/ /7 / 26
/7/7 J J 28
11. How well do people in Head Start generally get along with their supervisors'(Check one)
a. /7 h. /-1 / /
\ot at all .4 little Pretty Ver..well well

APPENDIX B (28)
12. What do you feel are the biggest problems in getting along with supervisors toHead *.zt3 r t " k none, one, two, or three, depending on what answersnP't apple
t'olumn Punch
10a They don't tro.zt their einplovet-4. '31
.32,h. They don -t tell their employees what is gotng on.
Thev eritici:e too much.
The Ain't ask employees for their ideas.
The ion" help their employees enough.
Th.. .1 41'1 know the problems of their employees.
a. the i'le'a~ their o';
11: their employees too much of the hard work.
tither pr thlerns
No major problems, people get along well
13. ilit well to people in Head Start get along with their fellow workers' (check one)
. Not at all.
b, A little.
c ' Pretty well.
d. / er%
14. What do you feel arc the biggest problems in getting along with other workers inHead Start" (('heck none, one, two, or three, depending on what answers best apply.)
a. -7 People don't help each other enough.
b. /7 People d in't tell each other what they are doing.
c. People criticize each other too much.
(1. 1).-)pl don't care whether they do a good job or not.
e. /" Gth,r probt..mq
i i No major problems, people get along well
15. Do VOU think parent.; of !lead Start children should ... (check one)
a.
h. /-7
C.
Have more to Any :ihout the program"
Ifave legq to !iay about the program'
fiayp about the -;arne voice they have now'
34
36
Why" 313

APPENDIX B (291
16. How naau ti :caning ourse:4 have you taken in Head Start '' (estimate if necessary)
a. Pre-service training Ves No
b. In- servile training tourses (workshops) (number)
Leadership Development courses (number)
it. Supplementary training course:3 for which you received collegecredit (number of credit hours)
17. In what fields did you get training with Head Start') (check one or two)
a. F:incation, child development
h. ''c. ti.,ctal v. irk.
i. 1---) Vitrition,
g. ri) training.
la. Did you get tr i.ind an' amount training ..)a ..e anted'.
a.
h.
Di'lnt get the kind I wanted.
nrit some but not enough
( It enough ,lf the kind I wanted.
19. If vou have people ..+r-king for vrei, 'In you fet..I that eno.gh training is available. forthem
a.t-7 b. /7 No
20. How good do vu feel the training to Head tart
p »i-
b. / Fair
c. / Good
:1. : LI, J
Column Punch
40
41
42-43
44
4F.
46
47
48

APPENDIX B (30)column Punch
21. Are vou interested in taking college c.-lurses lkading to a degree and 'orprofessional certification in a field tea.bing, s..:41 work,nutrition, etc. Whecic one)
a.
b.
Ye
tit
I Int v -ourseq were ccnverier.t1,. available
I would he willing to make the necessaryliacrth....es even if inconvenient
Maly are yol intereste4' 74
Not applahle. ! already have a degree in my field of interest.
22. If your answer to question 21 was Yes, please answer this question also.otherwi se, skip to question 23.
r-
Does your Head Start Program prov -ide an adequate training opportunity foryou to obtain a degree',
a, Yes
h. No, be ause: t('he.-k on" or two)
Only a few pelpple in Head Start get to take courses,even though'iraining funds are available
Head Start training funds are not a:.'allable in my fieldof interest
The program does not allow me time off when the trainingbeing held
I Not enough different courses are available in my field ofinterest 76
Other raison related to the provision of training 77
Are there other reasons not related to the Head Start program's.~4
provision of training which prevent you from getting the trainingyou need for a degree or certification' (Check one or two)
7/ Too difficult to work at a full-time .lob and take courses too
/ Family responsibilities
Diffvultv of getting to site of training 78
It takes too "Ing to complete the training when I can onlyattend on a part.time basis 70
/ / Other reason (specify)i

7.
23. 113- !!.. ! !. . . :fite!.. 1, !:,
\ It '
2. 111; t!:f p f 4.- T.: .fr1? -.; .)ntf
a.
:t , ;:.! ; ;.r . . f1tor.
: .I hot f:o raise
pr...0-riJi.ln a.r1t1 a raise,
A PPENDIN 13 1)_
25. no 4: tz, pt 1.44: htterohq. 4; 11.-i ff
n.
c.
r. t.-91f.40. rig . cl )..; 'a a.adablf,
. -4";p1- 7-1; gt1 . 4:an.. f
Iira-t star! Ti:frunt-; 1i:t bffttfr
N lf.ng ti-41. nfrf. fr:p .rtant !'.an l:)Ing a good
19 42.0- .44
26. I)') 1 :eel Sala.. v f 4 :1,1 tali if nt.(:K /)net
27. If r.4.. -.4. f . r 4alary ( t.1-14-4 -,ne beqt
b.
1 c itvft rrFirf wrkwng 44:Imo:IA-hero, I-1.e
C3t1.er peJp1e to ifead,titarl who E.J-3 the same thing 1 do get paid more.
Tms. pav to .).) 1'I live on
28 . In en.. ral. ,A ah
%;
b. f:r ;:rf.r; -.;
r. G-1:31 f r.f Irnrn intt.
ri. . I) re:11P.-
=f!...4,=_-_=f1-=. _ 2.71,M*,*4
.......0
1
544
:416

!., 1.. ! tort k tint
t. t T.
-f
e i ,
- !!'
APPENDIX 13 (32)
Column Pun; tt
.'.-t:t-' 114.1-! -Ztatt terk 5/1
3t, 1-,. t. "r"1.1:1%- f'Rteit onto 5-1
r
:44. .
-
.
.
.'rte Tele :.:)e .nc
1.. SLR'
. ..4 r ::' 'I r.: rte -yr m,r.. aA Applitabl)
,-H
if i A ".%' .. Ir.
St .. rt..' .: brgr VP
te
4
fl I
.

a.
APPENDIX B (33)
tin: a. facing high ..:".hool or ,:ollege ct,urses leading to a degree.have you re.-:eiect any special. training 13E13RE coming to Head Start? (check one)
No
b. " Yes. to technical. or vocational schools
C. YP.i. tr. military. schools
d. Yes. 1,1 course-3 paid for by p7 nvInus cmployera
37. In what fit) was your previ3115 training" (check one)
a. ..)ne
011! tprnnt
S int ..5 .)t-k
c. Vitrttion. ct)ktng
cnotor,v
1R. What IA T:!:t. alt cur current Head start positton''
F. )r h.-)-Jrzi a '.ay are you paid by Head Start'
40. For hlw many wee- 9 a year are you paid by Head Start"
Wr,at yr-ut-nr $ per .lour
per year or $ per week
Column Punch
65
66
67
68
69-73
This ts in*. end of the questionnaire. Tnank you very much for your help.seal the questtonnatre in the envelope provided and
tr: tri; person who gave it to you.

A
OMB No. 85-S72024 APPENDIX B (34)
FORMER EMPI cyrrOUESTIONNAIRE
Iim I )ng aco 114 o,.1 leave Rea i Start month
lt LLat wag vo-.Lr last p.',!4Ation Ith Head Start"' tot, TitIL.-
Vt 4t v.-triter Ln Head Start
T;t1t....1
4. Art .; n-v(_ . .
stRvry I t). Nrs.
a /-1 ec. h. N eh et ,Lne
part-time a. 1' N'eg b. 7-1 No (check one)
i If ,... A are not nYA V. -arkLng, are you--
, ;-,In ml: f )r a full-time 'oh
h
Lt.
I..)ohing only for a pgrt-time Job
Loolung for either a full-time part-time ioh
tio?intereste4 in a Job
Wiieck cm )(the above I
6. :ire Lrking re'i . what is the title of your Lob'
7 Is his AL.:rk similar to Your Head Start Job" (cheek one)
a. ! Nes h. n NoIf ves. how is it similar"'
8. Was Head Start your first job" (cheek one)
es b. 1 ; No
If not, how many other lobs have you had in the past four years')
9 HOW many sobs have you had since you le t Head Start'
I. )1urnr, p

Survey I. D. No.
10. Did the work and training you got in Head Start help prepare you for thejob v011 have now (check one)
a. /7 'es b. /--) No
/
11. Compared with your last position in Head Start, is yourpresent salary:
a. 17 b. / c. / IHigher About the ' Lower
same
(check one of the above)
12. What did you like best about working at Head Start?(..hecii the two best answers)
a. / r The work was interesting
h. The pay was good
c. ' The chances to get ahead were good
I Tht people there were nice
C. / I got good training
f. 1-7 The work was easy
My family and friends thought it was a good job
' / it was a steady job
1. . It let me do good things for other people
The hours were good
k. Other
1 3. 1,4at was the reason given for your leaving Head Start?
14. Did you hale other reasons" (check the one, two. br three hestanswers )
a. I / Ilead Start didn't have enough money to keep me
b. I " Pay %gis too low
c. %// Hours were too short
d. /7 t.ouldn't get'the training I wanted
e. / / Didn't get along with the people
f. / The job didn't use my skills very well
g. / / No chance for promotion
h. /// Found a better job
(Continued)
APPENDIX B (35)
Column Punch .
\./

.
4
7.*
Survey 1.1). No.
14. (Continued)
I Personal or family problems
3. i Didn't like the work
k. Othe r
1. I had no other reasons for leaving
I"). %thy 11,1 you takr your present job' (check two)
a. i The work seemed interesting
h. The pay was good
The .-han,:es tp get ahead seemed good
Te.xpte seerned nice
e. / -ouirl get good training
f. The work seemed easy
g. My My family and friends thought it would be a good job,
h. It was a steady Job
i. It let me do good things for other people
I. The hours were good
k (Wiere.
11,.w doe,: the job you have now conware with your work at Head Start"
a. b. C. / /I liked Ilea.I Start / like's both 1013,3 I liked the Head
work less about the same Start work more
APPENDIX B (36)
Column Punch
17. flow well did you Know the other people in Head Start" (check one in each row)
Didn't know Knew them Knew them well, but Close Friends
I, ... them a little didn't consider them
as friends-..
Agency CAfic fain a. ' / h. ! i v. / 1 (1. ;
Professionals a. / ; h. i / c. / i d. !
Paraprofessionals a. i / h. 11 C. I /
Parents a. / / b. // c. / / d. / /

APPENDIX B (37)
Survey I D. No. Column Punch
fa.- What do you feel were the biggest problenis in getting along with supervisorsin Head Start' (Check none, one, two, or'.three; depending on what answersbest apply)
a. i! They didn't trust their employeei; enough.
b. They didn't tell their employees it.hat was going on.
They criticized too much.
ri. ri 'hey didn't ask employees for their ideas.
e. L_ They didn't help their employees enough.
f. I They didn't know the problems of their employees.
g. ni T\tiev didn't use the ideas their employees had.
h.
.----, \i...'V'e-__p_r.ilalerris ___________._ .
The\ gave their employee too much of the hard work.
19. Uttat rio you feel were the biggest problems in getting along with other workers'(('heck none, one, two, or three, depending on what answers best apply)
a. People each other enough.
r,.
C
People didn't tell Pech other what they were doing.
People criticized each other too much.
d. People didn't care whether they did a good job or not.
e, (.ther problems
2(1 1)o v.).1 think parents of Head Start children should have had (check one)
. a. More to say about the program
h. M I.ess to say ahout the program.
Why"
21. Approximately how many training courses did you take in Head Start'
a. Pre-service Training /7 Yes /7 No
b. In-service training ,,ourse:, (number)
Leadership Development courses (number)
Supplementary (College) courses (number of credit hours)

4
Survey I. D. No.
22. What field!, did you get training in with Head Start? (check one or two1
a. Education. child development.
b, !7 Nledical. health.
V. I I Social work.
d. /7 Nutrition, cooking.
e. t Psychology.
f. I I other
g. /7 Given no training.
2,i. Did you get the kind and amount of training you wanted?
a. /7 Dicin t get the kind I wanted.
b. ;7 (;n1 a little but not enough.
.c. Got enough of the kind I wanted.
24 In general. how did you feel about Head Start?
a. /7 Was good for children.
b. / \% as foodfor_parents.
c. /7 Vas good for the community.
if Did not really help much.
25. How much du ytiu teel y our work helped your Head Start program? (check one)
a. i7 Didn't make much difference.
b. /7 Helped a little.
c. r7 Was very helpful.
26. Have any of your children attended Head Start? (check one)
a. i7 Yes h. /7 No
27, Were you hired from the Head Start community? (check one)
a. /7 Yes b. r-7 No
28. What is your age? years
29. Are you- -a. 1-1 Male b /7 Female (check one)
APPENDIX 13 (38)Column Punch

Survey I. D. No.
30. Are you
t. ,r7b. /7 Mexican-American
c. Other Spanish Surnamed American
d. 17 Other White
e. American Indian
f. Oriental
Other
(Check one of the above)
31. How nianv years of school have you finished? (check one)
a. ' 1-8 grade school
b. /7 9.11 some high school
c. /7 Received a high school diploma
d. 17 Some college
e. 1 7 Received an Associate Degree
r. i-7 Received a Bachelor's Degree
g. / / Other
32. Did you have any special training BEFORE coming to Head Start ? (check one)
a. /7 No.
b. 17 Yes. in public sch(iols.
c. /7 res, in the military.
d. '7 Yes. on-the-job.
e. /7 Other
33. What is your main field of training? (check one)
a. 17 None.
b. /7 Education. child development.
c. /7 Medical or health.
d. /7 Social work.
e. Nutrition.
f. Psychology.
g. /-7 Other
APPENDIX B (39)
Column Punch
I

;7-T-
Survey I. U. No. Column Punch
APPENDIX B (40)
. 34. . How many hours a day did you work' in Head Starr'
35. that was your salary when sou left Head Start $ per year
1Vhat is your current salary' $ per year
This is the end of the questionnaire. Plea Se enclose it in the envelope we haveprocied and mail it to our office in Washington. Thank you very much for yourhelp.

1
OMB No. 85-S72024 APPENDIX B (41)
k"olut1111
dame )I
SI RVIV I D NI
EMPLCA tit: I D
TTF?t NT 'MT STAFF DN
\I MN' VI l"\II'l DEPAHTURF AND HF.AccNs
fie-Ivi ftat.
ait sLit ;.it 'U
11'14
Po4ttt
Date
I at irst Mtddle
zo! start Compri-lent
lit Primar. i..1, Flegar-itng 1 rnpllyce I (che( k n.I
Perc tamiltartt%
ilea
^The Head Start quperviaor most famtliar with tins firmer employee should complete this form.

<
gurvev Number Employee 1. D.
1, What was the afficial reason for the employee's leaving the program',
a.
c.
d,
C
f
g-
Terminat:Jn by program for cause.
Layoff by program due to funding problems.
Mutual program employ...4! decision.
ounit more interesting position.
1.-)und hitter paing position.
round better opportunity for advancement.
htt training program.
h. Unkn-.wn t., program
rthrs, specify
If were )ther reasons for the f,mpluvre leaving program emphyment, whatin you think the major reason was
a. r/ Same as answer to Question 1.
;;;.r.z.3 t: ,r; b.. prIgrarr. )r c 71:1St
c. 1.a ill hy program due to funding problems
31 Mutual program employee decision.
e. !"--; Unknown to program
f. elhers, N pet if':
If the pr 3g: am ttnmated the employee, what was the reason'
a. / ! Inability to perform Auto's.43.
b. Inability to accept direction, regulations.
c. t--7 Inability to work with professional staff.
ri. --7 Inabilit,, t , work with paraprofessional staff.
e. 7 Inability to work with volunteers.
f: /'7 Inability to work with children.
g. F-1 Personal weaknesses (absence, lateness, unreliability).
h. /1 Personal instatolliv (outbursts, pouts).
i . 1-7 Other, specify
APPENDIX 13 (42)
Column

C
If laid off, how was this employee chosen'
I,. /-7;
Abolishment of job category.
Least...-irmority thin lib .-ategory,
C. C:ther, qperify
APPENDIX 13 (43)
column Punch
5 If emplos tuft tp. m4bial :lecision, what was the reason for this decision'
a. Diffic.ilties in periormaig Mities
r.. Difvict.ilttes .fl ac, voting ii rec tion, regulations
r. 1)11'.r lItts in w.irking with professional staff.
d. 1)tific.alties in working with paraprofessional staff.
/"..7 Diffic %Mies in working with volunteers.
f. / Difficulties in working with children.
g. I I Personal problems (health, family).
h, Pet s.-nial traits.
(...thi-rs, Ape( iiv
6. . What were the employee's relationships with the Head Start officials he came incontact with
jIihLv RatiRfactory
b. ---7 4-:atifat
c. I nsatisfa, t.jry
it. II Very unsati.afac tory.
e. / N., (-onto( t.
7. tIfitit:;..verf. the mplovee relati nstups with superN3isors".
:-a. / Highly satisfactory.
.iatisfactory
Unsatisfactory.
%vv., rn.40;itart;::.
I

.11/11,
8. All ,..er the aith coworkers
bSatisfactory
satisfa..tory
r.Unsatisfactory
4-VeryunsatistattOry
if tie a Aiper..:;.)r, !ghat were his relations Nrth subordinates
3. b./belly Satisfattorysattsf.t.tor%
c, 1
1'71ga/1,0a:torydleryuneatiafactory
10. How satisfied did the employee seem to be with his work"
a.1 ery .1..eragesatisfied
'verydissatisfied
this employee s 'departure have on his program component
ltarinful ti.
.Helpful c. 17 None
1. : ' 1. ' Mildly
2. Moderately 2. 1 Moderately
3. Extremely 3. : Ektremely
12. V.1..it as employee's departure hid on the overall program'
a. ' Harmful h. ! Helpful
1 Mildly i
2 Moderately 2. Mcsleriitel:
I. Extremely 1. :7 FSetremely
c. i i None
Mills! is the urent status of the position vacated by the employee"
it has been filled from within program-
It has been filled by external hire.
:a. aney to be filled by suitable external hire when found.
r.
on, petting whether to fill position hi... not yet been completed.
Position has been abolisned.
If the position is urrertli. filled please answer the fcllowing
14. 1.ergth of ftn1 t-ep1.4c.ement tmonthal
; APPNX .: et!.-n! tr, tie htTte able to fully assume responsibilityf,,r -
frnOnths)
1.1:P -pent in formal ..rairongiortentat ton program for this
thnufb)
17: :that r. ',our emir; ate of the overall cost to the program to find and train this
reblai e rit
APPENDIX B (44)

APPENDIX 13 (45)
COMMUNITY REPRESENTATIVE INTERvilAv GUIDE
.1. How long have you been a community representative?
2. What programs are assigned to you?
i3. We will be 1,isiting program in the near future.
a. Do you feel the program functions effectively
b. has it achieved' any noteworthy successes which you coulddescribe?
(Probe for the nature of relations with the community, withparents, and among staff.)
c. Is it bothered by any particular problems° ARepeat aboveprobe.)
d. Has it had problems with turnover of personnel? (Probeforindicators, e.g., high turnovers of staff and causes, e.g. , .
too low salaries. )'
If there is no R. T.O. 'now, 'how long ago was there one?
When there was an R. T.0-. , was this program assistedby the R.T.O. ?
Does this program make more or fewer requests for technicalassistance than most?
.

-;
e
APPENDIX 13 (46)
1. k% hal effect ha;; the CareeTDevelopment Program had onperSonnel in the priigrani? (14obe for effects on stabilityor lack thereof. )
g- How dc,es program rate in comparison with yourother programs in terms of stab'Uity?
...is there a large range of differences among the delegateagencies in the way they ..run their parts of the program?(Probe for nahare of differences, particularly in term % ofcited .,tiiirce ; s or problems.)
What; if ant. problems have you. noticed regarding relationsbetween thei grantee and the delegate agency? '(Probe foreffectOf pr thlems.)
Do you thin relations.beteen the grantee and delegate agencymiv.ht he !proved in some way? (Probe for nature ofimprove:re .4.)
Are there ny particular topics which we should be sure toexplore with the director, or other personnel of pro-gram~ -' (P. obe for personnel knowledgeable by areas.)
Has there. been much employee mobility in yotir programs in general?(Probe tor, nature of mobility and associated causes. e.g.:
Intraprograrn (delegate, delegate-grantee. grantee-regional ?
Lateral transfersPromotion
.External
Lateral transfersPromotion

r.
APPENDIX B (47)
a. Does thi'mobility eauS'e any problems for the program?-(Probe for diffireulties in recruiting replacements.)
b. Do you have any suggestions as to improvements that mighthelp to eliminate the problems?
c. How are you informed about employee mobility? How long doesit take for the information to reach you?
5. Use the Regional Employees Interview Guide to probe for causesand extent of mobility among regional employees.

Name j
APPENDIX B (48)
Office of Child DevelopmentREGIONAL EMPLOYEES' INTERVIEW GUIDE
Telephone HEW Region
Job Title
1. How long have you been in this position?
2. What was your previous position?
3. When you first started your present job, about how long did it takebefore you felt you were functioning effectively? (Probe for effortsneeded to.pbtain confidence of Head Start program personnel anddifficulties encountered.)
4. How would you describe the extent of regional personnel turnoversince you have been in this position? (Probe for type and level ofstaff affected.)
Do you feel this turnover has affected your job or the region's HeadStart programs? (Probe for specific nature of effects and problemsin terms of jobs and programs.)
a. How are programs notified of mobility at Regional Office?
b. How do the proirams perceive the effects of Regional Officeturnover?

APPENDIX B (49)
c. What areas of the programs are most affected?
d. Is there a provision for continuity in Regional Office recordkeeping which would minimize the impact of turnover on localprogramS?
6. What,if any, personnel turnov" problems have you noticed in theprograms in this region? (Probe for prevalence of problems bygrantee and delegate agency by staff type and level.)
a. What is done at the regional office level to assist localpLograms with problems?
7. What do you feel are the major causes of these problems?for each problem cited.)
(Probe
8. What improvements in Head Start policies or operations do you feelcould be made to improve effectiveness? (Probe for each problemcited.)
a. Are there problems in communications?
Within the office?Between the office and the programs?Between the office and the national level?
b. Do all grantees get equal attention from the Regional office?
How is decision made to share time among them?How often are programs visited?

1 for relation to training. )
APPENDIX B (50)
CURRENT EMPLOYEE INTERVIEW GUIDE
To reduce barriers to spontaneity, neither a guide nor a notepad shouldbe present during the actual interview. Comments should be summarizedafter completion of interviews. Explain to the interviewee that purposeof discussion is to explore HIS opinions regarding areas of possible sensi-tivity incompletely covered or omitted from the questionnaire.
1. How long have you been working in Head Start?
2. What is your present position?
3. What things do you like best and least about your work in HeadStart? (Probe for examples of each. )
4. Have you taken any training in Head Start?
5. (If no) do you know of any reasons why you have not received train-ing? (Probe for employee's decision, program's decision, andbasis for either. ) Skip to Question 9.
6. (If yes) do you think it helped you in your work? (Probe for ex-amples of help. )
7. Did you get a raise after your training? A promotion? (Probe
8.- (If NO raise or promotion followed training)Do you think you should have been given a raise or promotion?(Probe for basis for positive or negative answer in relation totraining. )
I

APPENDIX B (51)
9. Do you feel Head Start staff members get along with each other or., , are there problems? (Probe for nature of relations and problems \
among same and different types and levels of nonsupervisory staffin component and in. other components varying examples, e. g., I
teachers, nutritionists, to fit the situation.)
10. Do you have any suggestions as to how relations among Head Startstaff member might be improved? (Probe for solutions to problemscited in No. 9 as well as other effects of improvements. )
11. Do you feel Head Start employees get along with their supervisorsor are there problems? (Probe for nature of relations and prob-lems by levels of supervision by staff type in component and inother components. )
12. Are there any ways in which relations between employees andsupervisors could be improved? (Probe for solutions to problemscited in No. 11 as well as other effects of improvements.)
13. Have you had much contact with parents of Head Start children?(Probe for whether contacts are felt to have been rests icted byprogram. )
- 14. Do you feel that parents are involved enough with the program?(Probe for whether parents or program are primarily responsiblefor sufficient or insufficient involvement and the associated reasons. )
15. Do you feel that parents have too much or too little say about theoperations? (Probe for involvement in hiring and firing, otherpersonnel aspects, and other aspects. )
.16. Do you feel the program involves and is responsive, to the com-munity? (Probe for whether the program or the community isprimarily responsible for sufficient or insufficient involvementand the associated reasons. )

APPENDIX B (52)
17.. Would you have any ideas for improving the program's relationswith parents or the community? (Probe, as necessary, for basisfor suggestions and their anticipated effects.)
18. Do you feel your salary is fair? (PrNcse for basis for positive, ornegative answer.)
.19. Do you feel promotions are decided on a fair basis? (Probe forbasis for positive or negative answer. )
20. Are there other problems involving Head Start policies about whichpeople are unhappy?

APPENDIX B (53)
Former, Employee Interview Guide
Explain to the interviewee that the purpose of this surveyis to improve the Head Start program by finding out what makesemployees leave the program.
What things did you like best about your work in HeadStart?
2. What things did you like least about your work in HeadStart?
3. What was your last position in Head Start?
4. How long did you work in Head Start?
5. Did you get any training in Head Start? -(If no, skipto Question 9, )
6. Did it help you in your work at Head Start?
7. Does it help in your present work? What is your present job ?
8. Did you get a raise in Head Start after your training?A promotion? (If no) Should you have been given araise or a promotion?
9. Did the Head Start staff members get along with eachother? (Probe for nature of problems among staff),
10. How might Head Start staff relations be improved?
11. Did Head Start employees get along with theirsupervisors or were there problems?
12. Are there any ways in which relations between employeesand supervisors could have been improved?
13. Were there any (other) problems which made you feeluncomfortable in Head Start?
14. What caused you to leave Head Start?

APPENDIX B (54)
Former Employee Interview GuidePage 2
15. Are you working now? In what job? (If not asked in question.7.)
16. Did you receive the questionnaire we mailed to you? Have yousent it back to us? If not, please complete it and send it to us.It is important to have your opinion on these subjects.

1.
APPENDIX B (55)
INTERVIEW GUIDE
GRANTEE AGENCY HEAD START ADMINISTRATOR INTERVIEW
(Should only 'be used for programs having one or snore delegate agencies. )
In your overview of delegate agency operations, what, if any, per-sonnel problems exist? (If answer is none, probe for other prob-lems that implicitly reflect personnel problems, e. g. , too fewstaff, inadequately trained staff, etc. )
2. What do you feel are the primary indications that the agency ishaving personnel problems? (Probe for existence of:
High turnover of professional staffHigh turnover of paraprofessional staffHigh turnover of management personnelDifficulties in recruitment of:
ProfessionalParaprofessionalManagement
High rate of internal lateral transfers versus promotions
Also ask for examples as warranted.)
3. What do you see as the most important causes of these problems?(Probe for possible effect of:
Opportunities for promotionTraining for better jobs within Head StartNot enough trainingPromotions not being based on performanceSalaries being too lowHours too short to earn a reasonable incomeWorking with children can become frustrating over timeDo not hire the right peopleDo not manage people wellStaff. relations are poorCommunity relations are poor

APPENDIX B (56)
4. What other factors, if any, contribute to personnel problems? (If.specific causes above not mentioned, probe by asking: "Do youfeel that... is a problem ?")
I
5. What components of programs seem to have had the most personnelproblems?
6. What factors do you feel have 'contributed to the prevelance of prob-lems in these components? (Probe for [1].factors named as beingmost important, No. 3, and [2] factors cited as being of secondaryimportance, No. 4. )
Which components seem to have had the fewest problems?
8. Can you cite any reasons why these components haVe hadfewer problems? (Probe fox. absence or elimination of factorsnamed in Nos. 3 and 4. )
9. How do you" feel personnel problems affect the ability of the delegateagencies "to function effectively?" (Do not say--"to achieve itsgoals"--this is a rather controversial phrase. Probe for effect ofcauses cited as being of primary importance. )
10. Have some delegate agencies done a better job than others in theirhandling of personnel? (Probe for:
Elimination of problemsPositive approaches which have precluded the develop-
ment of problems, e.g., salaries, good staff orcommunity relations, etc. )
11. How would you characterize the overall effectiveness of your CareerDevelopment Committee and/or Program; for example, have theyincreased or decreased personnel stability? (Probe for otherexamples.)
12. What, if any, improvements do you feel are needed in the CareerDevelopment Committee and/or Program?

APPENDIX 13 (57)
13. Have any turnovers among IIEW/OCD Regional employees createddifficulties for the operations of your program? (Probe for thekinds of difficulties and Regional Office positions in which suchturnovers occurred. )
\Only ask if not mentioned as part of answer to No. 9.)
Has turnover in the Regional Training Office position been aproblem?. (Probe for effects it has had. )
ft
15. Do you think that personnel problems could be reduced if people inHead Start received more training in administration? (Probe for:
In which positions might people benefit the most?What kinds of training do you feel are needed?
Learning how to choose the right people for the jobLearning how to manage people betterOther..)
16. Do you feel that the program has experienced problerhs in its rela-tions with its Board of Directors? (Probe for types of problemsand effects.)
17. Do you think that your program's relations with its Board ofDirectors might be improved in some way? (Probe for nature ofimprovements: vis-a-vis: [1] cited problems, and [2] other areas.)
18. What problems, if any, have you noticed regarding relations withthe Policy Committee? (Probe for types of problems and effects. )
19. Do you think that relations with the Policy Committee might beimproved in various ways? (Probe for nature of improvements:vis-a-vis [1] cited problems, and [2] other areas. )

APPENDIX B (58)
20. Do you feel that the program has experienced problems as a resultof turnov.er within this agency or the delegate agencies? (1317abefor nature of problems and effects.)
21. Do you feel these problems are a result of particular conditions orare they common to Had Start programs? (Probe for conditionsand examples. )
, 22: Would you have any suggestions as to how relations between granteeand delegate agencies might be improved? (Probe for nature ofimprovements vis-a-vis [1] cited problems, and [2] other areas. )

APPENDIX B (59).
ADDITION TO HEAD START DIRECTOR INTERVIEW
The following are sonic the purposes. of Head Start programs as theyhave been conveyed to us. For each of these purposes, please tell me.-if it is indeed one of the purposes of your program and if so, if employeemobility has affected your ability to accomplish that purpose.
Purpose Applicable?
1. To support.& accelerate thedevelopment of children
2. To strengthen the self-confidence, family confi-dence-and --corn
iousnesS of children byletting them see parents and.others in their communityoperate in situations of res-ponsibility
3. To develop the communitylife of the parents
4. To provide a training groundfor employees in the programto go into other gainful em-
ployment beyond what wouldhave been possible withouttheir participation in Head Start
5. Other purposes
1M.01
Affected by turnover?

APPENDIX B (60
ATIPIENDU7'.: TO III-7AD srAPTADMINISTRATOR INTERVIEW GUIDES
We will he telephoning the Head of the PolicyCouncil (or Policy Committee). Can youprovide his name and phone number)
11101IMIIISOIlmap1=1.11%Name Phone Number
We would also like to hate the name and phonenilniber of the Ilead ot the Board of Directors otyour agency.
10,Mr...T.I.N.....MY0.-1111.10111.11
Phone Number
' In the Pro:tg:t Data Qt1,-,,tiorrmire., WC askedabout general typt s tom: =.;-gani7.at3ons whocompete with you in the employnient market.Will yr.ni providff me with the exact name and
the::e
.1..01.1.
A final numerical question--11cyw long h ave youtic-F.:1 the dirurtf)r thiFs progr :irr
man : dir(,cti.r..11,:-..-y there been over thehistory of thi g nrf;;Irziuyears has the program f!xiste(r)
Flov. many
.

APPENDIX B (61)
INTELAnw GUIDE
DELEGATE AGENCY HEAD STARTADMINISTRATOR.INTER VIEW
r,.(Should also be us for Grantee Agency Adminfetrator Interview whenprogram has no delegate agency. In thi§ case, omit numbers 19 thi.ough21. )
1. In your overview of the operations of this Head Start Program,what, .if any, personnel problems exist? (If answer is none, probefor other problems that implicitly reflect personnel problems,e.g., too few staff, inadequately trained staff, etc.)
What do you feel. are the primary indications that the program ishaving personnel problems? (Probe for existence of:
High turnover of professional staffHigh turnover of paraprofessional staffHigh turnover of management personnel-,Difficulties in recruitment of:
ProfessionalParaprofessionalManagement
High rate of internal lateral transfers versus promotions
Also ask for examples as warranted.)
3. What do you see as the most(important causes of these problems?(Probe for possible effect of:
Opportunities for promotionTraining for better jobs within Head StartNot enough trainingPromotions not being based on performanceSalaries being too low

APPENDIX B (62)
Hours too short to earn a rea ..,sable incomeWorking with ch ldren can become frustrating over timeDo not hire the right peopleDo not manage people wellStaff relations are poorCommunity relations are pocr
4. What other factors, if any, contribute to personnel problems? (Ifspecific causes above not mentioned, probe by asking: "Do youfeel that... is a problem? ")
5. What components of the program seem to have had the most per-sonnel problems?
6. What factors do you-feel have contributed to the prevalence of prob-. leers in these components? (Probe for [1] factors named as being
most important, No. 3, and [2] factors cited as being of secondaryimportance, No: 4. )
7. Which components seem to have had the fewest problems?
8. Can you cite any reasons why these components have had fewerproblems? (Probe for absence or elimination of factors named inNos. 3 and 4.)
11111=11.
.9. How do you feel personnel problems affect the ability of the program"to function effectively?" (Do not say--"to achieve its goals"--thisis a rather controversial phrase. Probe for effect of causes citedas being of primary importance. )
10. How would you characterize the overall effectiveness of your CareerDevelopment Committee and/or Program; for example, have theyincreased ors decreased personnel stability? (Probe for otherexamples. )
11. What, if any, improvements do you feel are needed in the CareerDevelopment Committee and/or Program?

APPENDIX (63)
12. Have any turnovers among IIEW/OCD Regional employees; createddifficulties for the operations of your program? (Prdbe for thekinds of difficulties and Regio*al Office positions in which suchturnovers occurred, )
(Only ask if not -mentioned as part of answer to No. 9. )
13.. Has turnover in the Regional/Training Office position been aproblem? (Probe for effects it has had. )
14. Do you think that personnel problems could be reduced if people inHead Start received miore training in administration? (Probe for:
In which positions might people benefit the most?What kinds of training do you feel are needed?
Learning how to choose the right people for the jobLearning how to manage people betterOther. )
15. Do you feel that the program has experienced problems in its rela-tions with its Board of Directors? (Probe for types of problemsand effects.)
16. Do you think that your program's relations with its Board of Direc-tors might be improved in some way? (Probe for nature of improve-ments: vis-a-vis: [1] cited problems, and [2] other areas. )
. 17. What problems, if any, have you noticed regarding relations withthe Policy Committee? (Probe for types of problems and effects. )
18. Do you think that relations with the Policy Committee might beimproved in various ways? (Probe for nature of improvementsvis -a -vis [1] cited problems, and [2] other areas. )
19. Do you feel that your progfam has experienced problems as a resultof turnover within the grantee or delegate agencies? (Probe fornature of problems and effects. )

APPENDIX B (64)
20. Do you feel these problems are a result of particular conditions orare they common to Head Start programs? (Probe for conditionsand examples. )
21. Would you have any suggestions as to how relations between granteeand delegate agencies or among delegate agendies might be im-proved? (Probe for natur of improvements Vis-a-vis [1] citedproblems, and [2] other areas.)

APPENDIX B (65)
ADDITION TO HEAD START DIRECTOR INTERVIEW
The following are some of the purposes of Head Start programs as theyhave been conveyed to us. For each of these purposes, please tell meif it is indeed one of the purposes of your program and if so, if employeemobility has affected your ability to accomplish that purpose.
Puryose
1. To support & accelerate thedevelopment of children
2. To strengthen the self-confidence, family confi-dence and community con-sciousness of children byletting them see parents andothers in their communityoperate in situations of res-ponsibility
3. To develop the communitylife of the parents
4. To provide a training groundfor employees in the programto go into other gainful em-ployment beyond what wouldhave been possible withouttheir participation in Head Start
5. Other purposes
Applicable 2 Affected by turnover?

APPENDIX B (66)
ADDENDUM TO nEAD STARTADMINISTRATOR INTERVIEW GUIDES
We will he telephoning the Head of the PolicyCouncil (or Policy Committee). Can youprovide his name and phone number?
Name Phone Number
We would also like to have the name and phonenumber of the Head of the Board of Directors ofyour agency.
Name Phone Number
In the Project Data Questionnaire, we askedabout general types of organizations whocompete with you in the employment market.Will you provide me with the exact name andaddress of each of these organizations?
.11MINE111111.11111...1111.11.
A final numerical question--How long have youbeen the director of this program?How many directors have there been over thehistory of this program ? How. manyyears has the program existed?

s-
APPENDIX C (1)
METHODOLOGY
This appendix contains the method of selecting the survey
sample, the methodology for collecting the data and the extent of
responses from the individuals, end organizations in the sample.
1. SAMPLE SELECTION
(1) A Sample of 70 Programs Was Selected By Stratifyingthe Universe of All Full-Year Head Start Programs
The universe of Head Start Programs consisted of a
1971 0E0 inventory of 995 programs and their associated
characteristics. This information may have excluded the few
new sponsorships introduced into the overall Head Start pro-
gram since 1971, but these data were the most complete
available for use in this study.
The objective for the selection of a sample was to pro-
vide representation of a wide range of full-year programs on
a random basis by size within minimum constraints of prac-
ticality for visiting the program sites. Accordingly, the

APPENDIX C (2)
sample was drawn from a total population of 863 Head Start
programs which represent certain exclusions from the
available roster:
Indian and migrant programs 164)
Parent-child programs (32)
Programs located in other than the continentalUnited States, e. g. , :
Alaska (3)Hawaii (3)Pacific Trust Territories (4)Guam (1)Puerto Rico (2)Virgin Islands (1)
Programs with questionable entries on theavailable roster of programs 05)
Examples of such programs are:
Harford County Community Action Corn-mittee, Bel Air, Maryland
- Oconee Area Community Action Agency,Milledgeville, Georgia
South Carolina Office of Equal Opportunity,Columbia, South Carolina
Hutchinson Board of Education,Hutchinson, Kansas
Multiple programs under one grantee (7)
These exclusions, representing 132, were not included
due to their special ingredients or to geographic features

s.
which would have increased survey
out appreciable benefits.
APPENDIX C (3)
st considerably with-
Using, therefore, a population of 86 a sample of
70 was drawn. This sample was selected in t e following
manner:
The population of full-time Head Start Programs(with the above exclusions) was ranked in accord-ance to size of Federal funding but was not usedas a determinant of ranking, because it frequentlyconsists of in-kind or volunteer contributions,in contrast to monies for maintaining paid staff.
The ranked population was divided into 4 strata,each representing approximately $72 million or25% of the dollar value of the sum of all Federalfunds granted to the population (287, 395).
From each of the 3 strata which do not contain thelargest programs, 20 samples were d awn randomlythrough the application of a table of random numbers.These 3 strata contain 68,182 and 599 programsrespectively. Subsequently, two substitutions weremade for randomly drawn samples to achievegreater representation for Region VI. Four addi-tional substitutions were made when it was learnedthat four selected programs had either been ab-sorbed into other programs or had been defended.These substitutiOns were made within the sameregion of each program being replaced and wereof the same magnitude in Federal funding.
From the stratum containing the 14 largest pro-grams, a sample of tO programs was drawnselectively to achieve geographical land urban/rural representativeness for all of the programsin that segment. A random selection was adjudgedinadequate. Inclusion of all 14 was adjudged tootime consuming within the scope of this assignment.

APPENDIX C (4)
The four excluded programs were rejected forthe following reasons:
Seven Mississippi programs had alreadybeen drawn randomly, and an eighth, thelargest in Mississippi, had been chosenselectively, thus eliminating the need toexamine:
Mississippi Action for Progress,Jackson, Mississippi
Bolivar County Community ActionProgram, Cleveland, Mississippi
Central Mississippi Inc., Winona,Mississippi
The Midwest large urban city was repre-sented by Chicago, thus eliminating theneed to examine the Mayor's Committeefor Human Resources Development, Detroit,Michigan
The final 70 samnles are presented in Exhibit I,
following this page. They are ranked by order of Federal
funding within each sample stratum.
The sample represents a cross section of Head Start
Program characteristics. Since the population was ranked
\in order of Federal funding and segmented by equal groups
of Federal dollars, the full-range of Federal funding is re-
presented. Other measures of representativeness are
shown in Exhibit II,. following Exhibit I.

EXHIBIT I (1)
Office of Child DevelopmentDepartment of Health, Education and Welfare
PROGRAM SAMPLE SELECTED FOREMPLOYEE MOBILITY STUDY
SA PLE A
Grantee City State
FY 1971Federal
Funds(000)
Agency for Child Development New York New York $13,405Chicago Committee Chicago Illinois $ 8,934Economic and Youth Opportunity Los Angeles C alifornia $ 8,160Mary Holmes Community Ed. Jacksoh Mississippi $ 6,531United Planning Organization Washington D.C. $ 4,021.Economic Opportunity Miami Florida $ 3,579Seattle-King County Ec, Seattle Washington $ 3,091Harris County Community Houston Texas $ 3,080Act for Boston Community Boston Massachusetts $ 2,527United Community Corp. Newark New Jersey $ 2,315
SAMPLE B
Grantee City State
FY 1971FederalFunds(000)
Economic Opportunity Fdn Kansas City Kansas $ 4,625Denver Bead Start Denver Colorado $ 1,615Montgomery Community Montgomery Alabama $ 1,370Community Service Organization Jackson Mississippi $ 1,253Community Rel. -Social Dcv. Milwaukee Wisconsin $ 1,190Mid-Delta Education Greenville Mississippi $ 1,157Delta Area Economic Opp. Portageville Missouri $ 1,123Coahoma Opportunity Clarksdale Mississippi $ 1,122San Bernardino County San Bernardino California $ 1,075Mississippi Industrial College Holly Springs Mississippi $ 1,050

SAMPLE B (Continued)
Grantee
Progress for ProvidenceInstitute of Community ServicesTRI- Parish ProgressCAAP of Greater IndianapolisCommunity AdvancementOrange County CommunitySouthwest MississippiTRI-County CommunityEconomic OpportunityAlabama Council
, :v SAMPLE C
Grantee
Atlantic Human ResourcesPortland Metro. Steering Com.Lift, Inc.ARVAC Inc.Cameron Co. Comm. RightsACTION Inc.East Missouri CommunitySCOPEMetropolitan DevelopmentMontgomery County Dept. Corp.Worcester Corn. ActionShore Up Inc.West Lake CumberlandExperiment in Self-RelianceThe Missouri OzarksEconomic Improvement
CCity
ProvidenceIfolly SpririgsCrowleyIndianapolisBaton RougeSanta AnaWoodvilleLaurinburgRiversideAuburn
City
Atlantic CityPortlandTupeloDardanelleBrownsvilleSouth BendFlat RiverDaytonTacomaRockvilleWorccsterSalisburyColumbiaWinston-SalemRichlandEdenton
EXHIBIT I (2)
State
Rhode IslandMississippiLouisianaIndianaLouisianaCaliforniaMississippiNorth CarolinaCaliforniaAlabama
State
New JerseyOregonMississippiArkansasTexasIndianaMissouriOhioWashingtonMarylandMassachusettsMarylandKentuckyNorth CarolinaMissouriNorth Carolina
FY 1971FederalFunds(000)
992985953928908884841802802751
FY 1971FederalFunds(000)
6406115615475404684534444290 641 5
406356355308289

EXHIBIT I (3)
SAMPLE C (Contii.ued)
FY 1971FederalFunds
.;
Grantee City State (000)
Piedmont Community Action Spartanburg South Carolina $. 278Lowndes County Board Haynesville Alabama $' 263Lake County Community Waukegan Illinois $ 253Community Action Rio Grande City Texas 253
SAMPLE I)
Grantee
Sussex County CAA Inc.Central Vermont CAC Inc.Greater Lal.vrence Corn. Act.Muskegon-Oceana CAAPYork County Community Act.Somerset Comm. Act.Merct:,. County Econ. Opp.Carrim. Improvement Council.Thompson School DistrictUpper Ocmulgee Econ.Anderson County CAC.Delta Comm. Act. Fdn.I Care, Inc.Clackamas Cc. Ec.o. Auth.Scott County Rural Are.Cranston Community Act.Kno-Flo -Co Tri-CountyDetroit School DistrictGarrett-Keyser-Butler, Sethi.Kountze Independent Schl.
ry 1971FederalFunds
City State (000)
Georgetown Delaware 246Montpelier Vermont 245Lawrence Massachusetts 219Muskegon Michigan 202Alfred Maine 135Somerset New Jersey 126Bluefield West Virginia 110Danville Virginia S 95,Lokidand Colorado 77Jackson Georgia 68Clinton Tennessee S 67Duncan Oklahoma 61
Statesville N. Carolina 60Oregon City Oregon $
Gate City rginia 48Cr:in:4ton . li:i6de Island 4)Warsaw Ohio 42Detroit Texas :30
Garrett Indiana 15.Kountze Texas 10

f
Regional location
11
Ps pip
747
--20Q
94
2-- 4
4
Op OP
7. ::
ON.
Number of centers
1 through 5 20through 10 --10
Ilthrough 20-161. 21through 30,11Over 30 --11
EXHIBIT 11
Office of Child DevelopmentDepartment of Health. Education, and Welfare
SAMPLE REPRESENTATIVENESS
Community Characteristic
Urban--33Rural --35
Duration of ProgramsDuring Day
Part dayFull day OP OP
3318
Combination 19
Child/Staff Ratio
2:1 through '4.9:1-- 33:1 through 3.9:1-1c4:1 through 4.91--225:1 through 5.9:1--186:1 through 6.9:1 - -107:1 or over -- 2

APPENDIX C .(5)
As indicated in Exhibit III, following this page, the
8% of theHead Start grantees which were surveyed represent
31% of the Federal funds, 27% of the paid staff, and 25% of
the children-in Head Start full-year programs.
(2) Current Employees Were Selected Using Two ApproachesWhich Were Related to the Numbers of Centers andDelegate Agencies in Each Program
In addressing the program of selecting current employees
within the 70 program universe, the following two approaches
were taken;
General approach for all programs in which alldelegate agencies were included in this sample(34 programs)
Special approach for programs with severaldelegate agencies, not all of which were includedin this sample (16 programs)
In essence, these approaches provide a controlled randomized
sample so that the following percentages of centers were
sampled in accordance with the stratum in which the program
falls:
Stratum A--20%Stratum B - -20%Stratum C--20%Stratum D--33%

EXHIBIT III
Office of Child DevelopmentDepartment of Health, Education, and Welfare
SAMPLE RELATIONSHIP TO TOTAL POPULATION
STRATA RELATIONSHIP TO TOTAL POPULATION
StrataGrantees Federal Funds (000) Staff Children
Number Percent Range Percent Number Percent Number Percent
A 14 1.6 $13,405- 25 9, 437 18.5 49, 204 19.62, 027
B 88 7.9 $ 2,014- 25 12,737 25'. 0 64, 000 25. 4695
C 182 21.1 $ 668- 25 13,403 26.3 67,554 26.8
252
D 599 69.4 $ 252- 25 15,440 30.3 70,806 28.1
1
Totals 863 100.0 100 51, 017 100.1 251.564 99.9===
SAMPLE RELATIONSHIP TO STRATA AND TOTAL POPULATION
Grantees Federal Funds (000) taff ChildrenPercent Percent Percent Percent
Sample Number of Stratum Total of Stratum Number of Stratum Number of Stratum
A 10 71 $51,822 73 7,616 81 36,281 74B 20 29 21,426 30 4, 248 33 19, 483 30C 20 11 8,375 12 1, 479 11 7,543 11
D 20 3 1, 948 3 418 \ 3 1.695 2
AT.
Totals 10 8% $83, 571 30110 13-761 27% 65,002 26016

APPENDIX C (6)
The overall goal was to sample 25% of the total
paid staff in the 70 programs through use of the Current
Employee Questionnaire. The goal of the general approach
was to draw respondents as follows:
All employees of the grantee Head Start office
All employees of the delegate agency HeadStart office(s)
All employees of selected centers identifiedby the grantee/delegate agency Head Startdirector using the following scheme:
Referring to an alphabetized list of theagency's centers, at the director selectedcenters starting at the top of the list untilthe directed number, e. g. , had beenaccumulated
The directed number of centcrs wasestablished by Booz, Allen for each pro-gram so that the above percentages areobserved
The goal of the special approach was to draw respondents
as follows:
All employees of the grantee Head Start office
Within a representative subsample of delegateagencies drawn by Booz, Allen to include across-section of delegate agency sizes (in termsof numbers of centers)
All employees of the selected delegateagency Head Start offices

APPENDIX C (7)
All employees of selected centers of thesedelegate agencies identified by the HeadStart director using the above scheme
Note that for the special approach, percentages of employees
within centers were increased sufficiently to assure the same
total program coverage by stratum as specified above.
(3) The Sample of Former Employees Included AllEmployees Who Left Each Organization After July 1, 1970
Each organization in the sample was asked to provide a
listing of individuals who had left Head Start employment
since July 1, 1970. These individuals constitute the sample
of former employees. Former Employee Questionnaires
were mailed to all former employees identified by the organ-
ization lists for two reasons:
Since the turnover rate was revealed as far lessthan 100% for the two year period, former em-ployees were outnumbered by the currentemployees
Experience indicates that the response rate forformer employees is much lower than that forcurrent employees so any oversampling of theformer on an organization basis is useful inoffsetting this tendency
The rates of response for both organizations and
individuals are detailed in the next two sections.

APPENDIX C (8)
2. ORGANIZATIONAL RESPONSE
A total of 123 organizations were visited in the conduct of
this study. One hundred and eight others were sent questionnaires
but were not visited. Seeral types of information were requested
from each organization. This section specifies what was requested
and which organizations responded.
(1) Despite Rigorous Fbllow-Up, Only 32% of AllOrganizations Visited Returned All InformationRequested, But Over 75% Returned the QuestionnaireRelating to the Extent of Mobility
Each organization was asked to:
Complete a Project Questionnaire
Provide a list of former employees
Return Current Employee Questionnairesif they were not available at time of the con-sultant's visit
Complete a Confirmation of Departure Question-naire for each employee included on the formeremployee list
Only 39 out of 124 of the organizations complied with
all of the requests. In general, we observed a higher re-
sponse rate among smaller organizations. Exhibit IV, fol-
lowing this page, shows total numbers of organizations which
responded to each specific request. Exhibit V, following
Exhibit IV, shows by organization, what information was not

Drmation Requested
antee Agencyeject Data Questionnaire
,egate Agency Projectka Questionnaire (a)
of Former Employees (a)indicated no terminations)
;legate Agency Projectta Questionnaire (b)
rifirmatior. of DepartureQuestionnaire
EXHIBIT IV
Office of Child DevelopmentDepartment of Health, Education and Welfare
ORGANIZATION INFORMATIONREQUESTED/PROVIDED
Number ofOrganizations Receiving.
Request
Number OfOrganizations
Responding
16 7
108 87
124 92
108 50
77 37
Sent to grantees who operate Head Start centers directly and to thosedelegate agencies which were selected to receive Current EmployeeQuestionnaires and to be interviewed.
Sent to those delegate agencies which were within sample programs, butwhich were neither to receive Current Employee Questionnaires nor to beinterviewed.

Organization
\tor, ester ::choo Dpat!, eralt,rretr, %Liss.
Action for Boston Comr....initvDevelopment13ston.
( ranst ( :- tionCranston.II- I.
C -ntral Ve: Cori i-unit%Action Ct)ri.c)rat.t: :1, In.-.Montpelier, Vt.
New ark l're-S.'hoolNewark. N.J.
Somerset Co actionCorporation Prorat!,Somerset, X.J.
Agent_ for Child Development.New York, N.Y.
Addle Iitt.New. York, N.Y.
Adults & Childi.i for EducationalDevelopn:entNew York, N.1.
A rctalio,e-,.- Ne., YorkNev. York, N.N
Bank ;Street ( llegeNew York,
Bedford Stio.vesant Y-iith in ActionNew York. N.Y.
EXHIBIT V (1)
Office of Child DevelopmentDepartment of Health, Education and Welfare-
ORGANIZATION NON RESPONSES
n'pi: 01' NIA I ION
Grantee Delegate Current Former ConfirmationProtect Prosect Employee E:ployee ofData Data Questionnaire List Departure
Bronx River Neto:Prnood Center. X
New York. N.Y.
Brownsville Cor:mumtv Council.New York, N.Y.
Builders for Family and Youth X
New York, N.Y.
Bushwik Con munttt Corporation,New Ynrk, N.Y.
UP(I'Washington,
Capital Head Start, XWashington, D.C.
A rlit.gton (*MI die renter. X
Arlington, Va.
**4*
received after deadlineno Head Start EmployeesinformatiOn received but deemed too inadequate for use
X (X)
X
(X)
X
X (X)
X
(X)
X (X)
X
X (X)
X (X)
X (X)
X
X (X)
X
(X) Former Fmi invee I.ist not receive, hence Confirmation Departure neither requested nor received

Organization
EXHIBIT V
TYPE OP' INFORMATION
Grantee Delegate Current Former ConfirmationProject Project Employee Employee ofData Data Questionnaire List D earture
Higher Horizons Day Care,Bailey's Crossroads. Va.
X
Sussex County Community XAction Agenc.. inc.Geo.-getown. Del.
Montgomery County Public Schools XRockville, Maryland
Shore Vp, Inc. XSalisbury. Md.
Lee County Ilaci Start, XAuburn, Ma.
Dade County Community Action Agency XMiami. Fla.
Upper Ocmulgee Economic Opportunity XCouncil,Jackson, G
Mary Holmes Community EducationExtension,Divi ionJackson." Miss.
Coahoma Opportunity XGrenada, Miss.
Community Service Association, X (X)Jackson, Miss.
Institute of Community Service, XRust College,Holly Sprmgs, Miss.
Mid Delta Education Association, X (X)Greenville, Miss.
Southwest Mississipi4 Opportunity. Inc X X (X)Woodville, Miss.
Economic Improvement Council XEdenton. N.C.
Fannly Services. Inc.Winston-Salem, N.C.
Piedmont Community Action, XSpartanburg, SC.
I Care. Inc. X X X (X)Statesville, N.C.
Chicago Comm.ctee on X XUrban Opportunity,Chicago. 111.
Board of Education, XChicago, III.
41.414
** *
received after deadlineno Head Start Employeesinformation received but deemed too inadequate for use
(X) Firmer Ern: live List not received, hence Confirmation Departure neither requested nor received

Organization
EXHIBIT V (3)
TYPE OF INFORMATION
Grantee Delegate Current Fortner ConfirmationProject Project Employee Emplcee of
Data Data Questionnaire List Departure
Chicago Youth Centers - LEARN XChicago, Ill.
Zion Hill Baptist Church XChicago, 111.
ak e qa tit y Aotaukgan, Ill.
A AP Greater indianapoliA,Indianapolis.
le,
1. Y.* X (X)
'Indianapolis Pre-S, two' Corporation XIniitanalvits. 1n 1.
Action,South Bend, Intl.
Muskegon Ocana, CAAP X (X)NIuskegon, Mich.
Cop unity Relation Social XDevelopment CommissionMilwaukee, NA isc.
A rvac X (X)Dardanelle, Ark.
Tri-Parish County, XCrowley, I.a.
Community Advancement, Inc. N X X (X)Bator. L.C. A.11 X X (X)Baton Rouge, La.
Delta Community A. non Foundation X X (X)Duncan, Okla.
Cameron County CIr:r.unity Project,, X XBrownsville, Tex.
Harris County Community Action. x.** X (X)Houston, Tex.
Detroit School t *t:,Detroit, Tex.
Community Action Council of Starr County X X X (X)Texas,Rio Grande City, Tex.
Economic Opportunity Foundatipn, X (X)Kansas City, Kan.
East Missouri Community Action X
Flat River, Mo.
Delta Are. Economic Opportunity Corporation X
Portagville, N:.
*****
received after deadlineno Head Start Employeesinformation received but deemed too inadequate for use
(X) Former Employee List not received. hence Confirmation Departure neither requested nor received

Organization
EXHIBIT V (4)
r%pv. INI.Oli N1ATION
1+
Grantee Delegate Current Former ConfirmationProtect Project Employee Erni.loyee of
Data Data Questionnaire List Departure
Denver Public Schoois, XDenver, Coin.
United 1.r ProgressDenver. colt,.
LABASA lietd Start X X
Denver. ( olo.
(iater 1.os Ailgvivs N X X (X)(oninturtity At tiot: (CI A( A)Lcs Aneeles. Calif.
Child Care an.i 11,-,,e1-1,11:ent Services XLos Angeles, Calif.
Delta Sigma Theta Head Start (X)Los Angeles,*( alif.
Federation of Pre Si.hool and X X X (X)Con.munity E.iucationHavithorne.
Kedran Con:r;unity }lad Start ,z. X (X)Los Angeles, C. alas
Orange Count \ CAC X X (X)Santa Ana. Calif.
Council of Affiliated Negro X (X)Organizat -in, Inv.Santa Ana. (
Economic tipplirtwitty Board N N (X)Hiversiele, (alit.
San Jai-int jlhool District X
Riverside. Calif.
Corona Norco Head Start, X
Corona, Calif.
San Bernardino County Hoard X X (X)Supervisors,San Bernardino, Calif.
V iclorville Schooi Distro. tSan Bernardino. Calif.
North Fontana Head Start N X
San Bernardino, Calif.
Christ ('hurt h IleV.Start.San Bernardino, Calif.
ClaCKanius County Ileadstart X
Oregon City. Ore.
Portland Metropolitan Sterring Co. X
.PortiandeOre.
Seattle King County kronorl:ecnnn i X N (X)
Opportunity BoardSeattle, Wasn.
Neighborhood House N (X)
Seattle, Wash.
TOTALS 9 21 11 32 40

AVYLNDIA L (9)
received. In Chapter III of this report, mobility is discussed
by program. However, since not all delegate agencies within
all programs returned the project questionnaire, the data in
some instances reflect less than 100% of those employed in
the entire program. Exhibit VI, following this page, lists
the programs where not all delegates returned project data
and give the number of employees which this data represents.
An intensive follow-up was done initially by telephone.
Each organization with outstanding information was contacted
at least twice and in most instances three times. A letter
was then mailed to the organization requesting the information
and copies were forwarded to the Regional .office requesting
that they pursue the matter further.
Follow-up w not as extensive in Regions VI and IX
due to the fact that they he visited last in the survey. One
follow-up call was made to organizations in Los Angeles and
Sar.taAna, California to urge submission of material. No
telephone follow-up was conducted in Region VI, because
programs in that region continued to be visited until shortly
before the close of the survey.

11(41. I
II
Ill
1.:::((: . (1:a.-;111:1,.!t-n. 11. t .
!. .! : ,
No . '1
'.!,:.%: .! ( t 11
NT' :(:- ,t, (
7 ,
F'11111 r \ I
4::tt 1 De% el, t:.tI!! ar'..et cf health. 1..:iticatt-r1 an
l'fit)(ill A -II V,! 1 - lIIAX U I (111-1
T (AI - N:- bur -f /..! pp,I- 'r I17,rt
I 're (1::tatr..: -:L (4 71) li !.,
( ! 1, , ( tt1.- : I ;! I : 7.!!) i4 1,:t al e. 11 .
IX \ t 74. V.\ (
IX t)r.o. t
IX 1. .t.aot. II in i 2(44
I? it,1 f.
I \ ".... 44. :,t lo ( (s !.. , , i 7 21 t
!.-,-;-:4:11 Ho t'-. 4: :i;).. ( ii!
it11. F. n ( 1
();31wrtun.t. Boa r,t-1
17
trt.t ,(;-1-oo 4, , 71 !:!., aro ,11,,v, (I 141 thin .X(iihit (21C:tUt.4. P/1-72 thittl were TVA.4. dit
.;

APPENDIX C (10)
(2) Project Questionnaires Were Returned More FrequentlyThan Former Employee Lists or Confirmation ofEmployee Departure Questionnaires
Grantee Agency Project Data Questionnaires were
sent to those grantees who do not directly operate Head Start
centers. When it was known that there were no Head `tart
employees at the grantee level, a questionnaire was not sent.
A total of 16 grantee project questionnaires were mailed to
organizations. Two grantee organizations which were
included in the original survey total and which were visited
had no Bead Start employees. These were counted as
nonresponses. All other grantees and all delegates received
Delegate Agency Project Questionnaires. A total of 108 were
mailed and 91 were received.
In addition, when only some Jf the lelegates were
visited, in a particular program, a Delegate Agency Prcject
Questionnaire was also sent to eachoi the delegates nut
visited. A much lower response rate, however, was observed
in these 'nonvisited delegates." A total of 50 out of 108, or
46% of their project questionnaires were completed and re-
turned as contrasted with 84% of those visited.

0 a a ari 1.01,*
t"me,i)rganizations were unwilling or unable to provide
and atidres of forme. r employees< For example, one
organization refused to give addresses or phone numbers of
former.employees while another organization simply was unable
ile,3t. ptie information beealise its files.were in such poor
condition.
Six organizations notified us that they had not had any
turnover, these were counted as responses. Therefore, a total
of 92 lists_ of former.employee'n4.mes were received.
The Confirrnauon of Employee Departure and Reasons
Questionnaire p'- -o. sided inti.:-rrriation about -why the individual left
iff!af.s Start. A questimmaie was sent to the organizations for.
cacti ff.)rrner employee identified on former employee lists. Over
::t; 300 Conf:r. Aim! of Departime questionnaires were mailed and
538, or 23q.', were returned completed, representing 37 out of
77 progrlims,
(3) 4lot41.._, Data for Sortrarns Incomplete
If a program which was also an organization (a grantee
with nu delgates) tailed to return the project questionnaire or
fa,iled to provide accurate mobility information in Question 50,
then there was ftio !nobility data for that prcigram, however, if

APPENDIX C (12)
several kit.leeztte agcncie,5 responded with accurate information,
the data available were generalized to represent the program.
It was possible to do this with the exception of Dade County CAC
in Miami, Florida, in which case only the small delegate agency
(5 employees) responded .
Exhibit VII, following this page, gives the
Total number of Head Start programs foundin 0E0 data
Sample program selected by this survey
Number of programs for which mobility datawere received
Sornr, of these data were received after the cut-off date and
could not be utilized in this survey.
For some organizations which were visited at the
beginning of the survey, the program year ended after the
project questionnaire was completed. There was no statistically
valid way to adjust these data to reflect the entire program year.
However, we felt that this would not affect the validity of the
study since most turnover occurs at the end of the school
year rather than the beginning. Exhibit VIII, following this
'page. oyes tilt: organizations for which this W3S the rase,

12 :K11:1;11' VII (1)
Child 1)c..-t:lopnwatDep-:i.ttnent 0 I.:dlr.:nu:n.1, and \Vc
NIOBILITY DAT REPORTED BY PROGRAMS
Total IIS Programs By Region From 1971 0E0 Inventory
Itegim. Total_ 171 C: D
1 1 9 9 54 66II 2 -: 11 51 68
III 1 5 22 61 89IV 4 24 55 100 183
V 3 6 16 108 135VI 1 1; 27 90 132
VII 0 4 13 39 56VIII 0 i 4 38 43Ix 1 8 17 27 53
X 1 0 6 31 38Tot-il . 14 68 182 599 863
Sample Programs 13y Region Selected for This Survey
STRATII'aA..... 13_ C D
Region _Total
I 1 1 1 4 7II 2 0 1 1 4
III 1 0 2 4 7IV 2 9 6 3 20V 1 2 3 3 9
VI 1 2 3 3 9VII 0 2 2 0 4
VIII 0 1 0 1 2IX 1 3 0 0 4X 1 0 2 1 4
Total 10 20 20 '20 70

EXHIBIT VII (2).
Mobility Data Reported By Region for This Survey
Region
STRATUM
. TotalA B C D
I - 1 1 3 5II 2 - I.. - 3
III 1 - 2 4 7IV 1 8 5 3 17
V 1 2 1 3 7VI . 1 - 2 3
VII - 2 2 - 4VIII - 1 - 1 --- Z.
IX 1 3 - ,.- ''" 4.X 1 - 2 1 4
Total 7 18 14 17 56

EXHIBIT VIII
Office of Child DevelopmentDepartment of Health, Education, and Welfare
ORGANIZATIONS FROM WHICH DATA WEREDECEIVED BEFORE THE END OF PY '72
Iion ID Organization NameDate
PY '72 Ends
U 30501 Scott County School Board Oct. 31
10100 York County Community Action Oct. 31
50800 Scope Nov. 30
00201 Portland Public Schools Dec. 31
Sussex County CommunityII 30200 Action Agency Dec. 31
Early Childhood DevelopmentV 40900 Program Dec. 31
Hinds County Project, HeadV 41100 Start, Jackson, Miss. Dec. 31
V 41300 Lift, Inc. Dec. 31
TII 70301 University of Missouri Dec. 31
Date MonthsPD Received Difference
Oct. 2
Oct. 2
Oct. 3
Dec. 5
1
1
2
1
Oct. 2 3
Nov. 20 (----'.1
\*)Dec. 6 4-
Nov. 20 1
Nov. 27 1

APPENDIX C (13)
along with dates and difference in the number of months
betwecrf receipt of questionnaires and the end of program
year.
(4) Organization Directors Were Interviewed To AscertainExtent And Causes of Mobility
Directors of organizations were interviewed to gain
information about specific problems regarding turnover be-
yond the data to be accumulated in the questionnaires. The
interview guide used is included in Appendix B. An attempt
was made to interview all other members of central staff
within both the delegate or grantee organizations.
3. INDIVIDUAL RESPONSES
Individual employees of Head Start received questionnaires.
Most of these also participated in group or individual interviews.
Forme.: employees were mailed questionnaires and interviewed by
telephone.
(1) Questionnaires Were Completed by 2, 650 CurrentEmployees and Over 1, 700 Were Interviewed
Over 3, 500 Current Employee Questionnaires were
distributed to Head Start programs within this sample.
An attempt was made to interview the same individuals who

APPENDIX C (14)
had completed the questionnaire, although this was not
always possible. Of the 1,764 employees interviewed,' 556
were central office staff and 1,182 were in the centers. The
interview guide used is found in Appendix B. Employees
were interviewed both individually (661 employees) and in
small group sessions (1, 085 employees).
The following procedure took place in a group interview:
Introduction where interviewer requested eachindividual to state his/her:
JobCurrent position within Head StartAny earlier positions within Head StartNumber of years with Head Start
Interviewer proceeded with specific questionsand whichever individuals wished to respondcould do so
The Head Start Director, as a rule, did notparticipate in these sessions and strict confiden-tiality was stressed

APPENDIX C (15)
(2) Former Employees Were Difficult To Contact EitherBy Mailed Questionnaire or By Telephone Interview
The following table demonstrates the response rate
of former employees to the questionnaire mailed:
Names provided by 92organizations responding
Former EmployeeQuestionnaires mailed
Questionnaires returned dueto noncurrent or otherwiseincorrect address
Questionnaires received
Number Percent
2401
2349* 100.0
334 14.2
823 35.0
*52 individuals were deceased or program had no addressesavailable.
The telephone interview served as follow-up on the
questionnaire as well as a means to gain further information
about feelings concerning Head Start and ideas for improve-
ment which the individual may not have been willing or did
not have the opportunity to express on the questionnaire.
However, there were several problems encountered in trying
to contact people via the phone:
Many Head Start Programs did not furnish thephone numbers of employees as requested

APPENDIX C (16)
Many of the phone numbers which appeared onthe list .were not current
When an attempt was made to obtain the infor-mation through the direetnry assistance:
Many individuals were found to haveunpublished numbers
If employee was a woman, the numberwas under her husband's name andimpossible to identify
In addition, once a working number has beensecured, reaching the individual at home wasdifficultAnd entailed time consuming "call-backs"
Some individuals refused to be interviewed onthe phone
Exhibit IX, following this page, shows the level of effort
and response rate for each organization xkhich provided a list
of former employees.
(3) Information About Regional Office Influencc in HeadStart Programs Was Obtained by Interviewing theFie&ional Office Employees
In the Regiobal Office an attempt was made to interview
all employees connected with head Start including the follow-
ing individuals:
Supervisors of community representatives
Ccrnmtinity representatives

APPENDIX C (17)
Child development specialists
Career development specialists
Other specialists or regional office employeesdirectly concerned with the operations of HeadStart programs
In most instances, the Assistant Regional Director of OCD
was also interviewed. A total of 58 community representatives
and 20 other specialists ivere personally interviewed. The
interview guide used is found in Appendix B.

EXHIBIT IX (1)
Office of Child DevelopmentDtpartrt:tnt of Health. Educ:attun and 1lt.11.1.m.
... .
I. rn.er E:r.11,.
rd.
Nu:r.tierPhr.srtu Nurr`-erF
Ft )11 1.'111.1
Nun.ber tt1(.),,,erating Phone
1-:1111..)N1-'. 1.1)1 I t )%l -UP
Nut:.ber Of TiAalPeople Contacted Fot 1.:u.ploee
Urg.citiat ton Or. Lts! Provi 10:i Or, I tst Nun.bers Secured For Intervie.A Contacted
II r.GION I
'tort Co. t'..1.1 ; 0 4 4;Alfred, \le.
_. .
141111.: De.. II.S.llIrcyst...r. Nlass.
..:u - 1 7 1Ft 14
.ftuater I.:wren:I- H.S. ; 1 2%-I ;v.,. re,nce. 13:-,.s.
Pr.,:ttiem.t:11.5' bi! 4', 18 17 28-1.1-.4-i(irm.e. 11.1
:rartston 11.5. (..: 0 1 1 1 177ranston, R.I.
REGION II
"ttlantit: Ilun,at: 11..:,,.ur,..-. -'1 -i7 I° I' 25-Atlantic. N.J.
ntted Cols u . 4 0 1 I 2')-";fr.t.ark, N..1.
.ea ark ire-Smnr
:4rk. N-
! vr.!ko".... rk. 't .
7', 2 7
1
17
4 -
0-!+...v 1' r-, N. 1'.
Ne.. Y-1 . N. Y
4erett,..i1-1 t
y .rk. N.1
174: :Air .Irogran;Ale-. York. N. Y.
3reu <Oen3STC"' Kt...rt. N. y
U:(;1iiN
11,..4,1.tart'atalsitigtpn, 1).r .
.rItagton (h1"1 1)4"..rlington. a.
Ike:her)a Care (atley's Crossroads. Va.
Sussex Cn. I -*Iv;Ieorgetoso. Dv i
7
: 1.8'"
;

EXHIBIT iN (2)
Ndlier titFt ?t. n'.er Eti&oee S
t Or. I.ist l'ruvided
Nun,lierPhone Number:-
On List
Nundier ofOperating Phone
Secured
Actual Nutnher OfPeople Contacted
For Irterviev.
of TotalPortlier Enipliie-e
COrltat teki
-11.4 U.- 11.5. Iti 1 10 H 50-H... Cat:.
Short- 1-1, 21 14 12N1.1.
Sz-tt Co. U.S.(late Ca.., .t.
1::proi.en tnta.
20
4
0
'3
4
3
3 2.37
0 0
. VA.
12Cilt IN 1N.
1 et C'out.c.. H. S. 70 44 19 16
7, .30,111(3rn, A13.
1,,-Ar.cles (,. 13r: ,f ?; 5 i i 67--.,itt..n.
Havnes-:ille, Al.i.
C.. t. 7 4
1 t - or... V.3.
MO( VA.A 104 U 24 2 .12
\T. et t,
St. All-at - Nor- n.Pl.t.
I p; r ; g. '' hI )(("3"
V. Lake C-i:::.teriand 1 I+ 7. 7
Colts!? Loa, ??.....
\?der.ori I -. :loots 4 I 4
I linton, T.'flfl.
M;irY lkif+If'S C,!' !! , I1;!. 1) 31 2r, 20".
.. . Extension Div.Jackson. Miss.
Coat:on:a 01 rt.r%t . . 0 11
Clariqatiale._12
Delta Dills -177%.
Sardis, Miss.
INV
firsltv Spring?...11 fS 4 1 -4-
1. i l t iii . .( 1 1'
Tupelo, \Its
t.:.crIttorrtsr Irtn.trt,...rment .17 0 2 VI'., Council.Edentrn. ts t. .

N4! 1,44Liz:p11-4,eez.
Orgamzation On 1.4.t 1'ruv4c.1ed
N'..! hi'PhOPV
(3411.4st
-N1!--11er ofI44rs (iptratitig
Nunibers Sutured
t-cr (111.4--.444.
For IntervIt".%
..t 1.1-4ta1
1241n:contacted
Kar..41y 1:te. 27 0 7 2 7Vinston-5411e7.. N.C.
r!, (... .13 11 8 6
1..444e.:41444. N.Y
1'14.4.!:7.1.tit 16 13 10 10 63.7.
I ( tr(-. I!:. 4 2 1 1
:-,!atvs%1111., N. t .
1(1.(,1( ) \
1. 0 2 ,
r.
1 a-7
( ,!,4; 1.41,..F....tt44..r 4-4 20 13 13
(.tit- 111.
C1.4, ago Youth CcrIter 1 Ai 1.8 42 42 27-
( hicago, 111.
( hit ago Z4444411411 1 0 0 0 . 0'III
U
L tucago. 111.
indlian.ipul 41 Pt*:t 1.
n 7 4 5°' --
tin.: .44 34 17 :6 47.
I (V -rt-lit-r..', Ir.!.
rti17 497.
Muskeg4A44. N14,.
1.n C41. 11...4! '4t.44t 1 fl 0%
\bunt
S.-+1171, Fiti 0 18 18 287
1).Avtort. 01444,
1.ti
S.4c4at 11v. (1111V. atIke.:
114tAaukt;t- Pk.1114, s, 21 If; 1010 9
Day- (.,re f..rot141..:4,
14
M41:4N.4aukrt!. tt
HLGION Vt
Tri l'ArNts. Prvtgrese. 71.4 22 If; 1 r, .:137
r-r4..4.14,:4 1 .

ti..r...t.er of Nt...:-...!-cr 3f N..:r..-er ofFt lrrrer En-r-tnyees Pr.,3ne N-,;:-r-,er Opertttr.g. Ph 'hr.
1._t Pro-. rfe:f Or i.rtit Nufr-t:ere Se.....re c:
5
(*.i!: 1+
die. 1
I
Nil ..,; CI 7 1!
Fli, 111;t:1.1.
HEW( H!
DerAer, (
et-11;d (*.Are 1),-..e.:npn,erst 116
I..» Angele, I. .1:1f.
I ri,derick
Ant-'le--.
tser-rt.f.-.OpPrirtuhlty 11 .irdHtversrtle, C :f
::rar.ill"%u: LE/Cur-ha. C;il.f.
ft .1 I h.e,frSat. t
. Chrita Church licazigtar2 . 4
Ontario, Calif.
441.004.)",
Mrtr.i.:Steertng Committvi,Portland, Orr.
14
3
1
-;
.(1
:
9
2
r
A:..441Pecr.ie C...ntatect
For 1nter.14,..r.
r;
,i T !alFrrrer F. hipirlyet
29"
Portland Put..11: !4 24 :7 1 67r,
Portiond, ore,

t "-
""';." :V.41-:1)(-r ft:.1- ,i.;t
(.1.!
/:%7:t.1-!t"i'asi !kilt
I i.f I ( F %("(L

APPENDIX D (1)
LITER:.TUVE RE VIEW
The rint:1 uthes of ,..14.1pItiyei mobility in Head Start relatedfields are those wch examine turnover of Social Service employees, i.e.,social worker :3 and other professinnals ...cho provide st>r!ial services; Thisliterature rtvit7.- has surveyed this follov.ing tol,ics pertaining to eriiployee
. z
"FL: tatt-z;
_14
1-1 t't c%f 141:5 3F!-.:.

APPENDIX D (2)
1. 1.1:13:s;OVER BATES
A comparison of tuz-noyer i ates determined by various studies is made
in the "Overvie... Study of the DynanliCi of V,orker Job Mobility (NatiOnal Study,
of Social Welfare and Rehabilitation workers, Work and Organizational eon-
texts)..:, d the St-)cial and Rehabilitation Service of DHEW in
'Iovernber, 1971. Exhibit following this page, details the annual turnover
rates for various to.pe of lobs found in the stgdies examined by the above
r- port. (The MI r:ICE'S are ;_rovided on the second page of Exhibit IL
Wherea:-", i.e annual 'uroove: rat.. industry in general ,.k as approximately
I (1!.7 I Stu 1', Sart. al). turnov.:- rates for employees in social
service agencies ranged from I V to 50:7.:. with most of the rates clustering
Fri the ten:, arid thit ti!I bra; ratf'z.: iri the higher portion
of the rani:'' may refit,ct Whit Ai Ciitiattfi reaf.:tiOri u. a perceive(!
(.'AI LS TURN0.:ER
(I) Joe' N.,ftlitp....itz, "Personnel Turnover," a Manuscript SubmittedTo Progress in Clinical Psychology, 1970
I.eftkowiti deihonstrates an inverse relations!-.ip of tranfer to le:igth
of employment. Initial problems of a new employee such as his expectations
regarding the nature of the iob and his training an # orientation are issues

STUDY
Author Year-Type
ear
1 Ti31 len
2 Sarri.et al(1970)-
Life iffier.111.
4 frzinsici
I:V.
Fi an
Cohen
'4-4. Maul!. et 7t!
Pt
.7
1 i i!,
11
tet,-f
f.
Type oREmploa'ers
1960 Child Welfare and Fan lilyService
1lf71 Industry to General
EXHIBIT D-1 (1)
ANNUAL EMPLOYEE TURNOVER RATEProfes- Nonprofes-. Case Professional &sionals sionals Workers Non )rofessional
P:470 tai We lfai e & Rehabili- 1 1-'0
Serve. e:-.
196P, Penn. Rehabilitatin
Divistc,n r.f Mtate%Tent Ssten:s
1'6R NV-S( tai Set-,:iee Dept
1`."A LA .\_,..;i:.-..tance Office
I -!b.-) NY State 'A elfare Dept.
v, . T:, tt-r eila re Dept.
1.,-)7 .ti--! !:t.
I. 11:!ri, 70-1
f,t, i -
1::, f2.. f:tr;:: )
27%
30';
,

EXHIBIT D-I (2)
William L. rollen, "Study of Staff Losses in Child Welfare and Family ServiceAgencies," U.S. DREW, 1960
Sarri, R.C.; Tropman, J.E.; Silberman, M.; Pawlak, E.J. ; and Badal,1970 Client Careers and Public. Welfare Structures
Life 0 Tice Mana ement Association, 1970 Home Office Employee Termination'sPertonn 1 Administration Report No. 47, New York: LO NIA
S. M. Irzinski (1968), Factors Related To Counselor Turnover in a StateRehabilitation Agency, Unpublished doctoral dissortation, Pennsylvania StateUniversity
U.:S. Department of Heals , Education, :_lnd Welfare, Division of State MeritSystems, 1968 Analysis Ip(21ri::ent.sLSJ2!aralianseiLeorriotions: PublicAssistance Caseworkers and Employment Security InterviewersWashington; Th4.. Division
Posman, 11. (circa 1968). Poverty A; Social Welfare; Pesearch in PublicAssistance. ('-riir-neo)..
Cohen, J. (1966), A Deseriative Study, ,of the Availability and Usability ofSocial Services in the South central Area of Los Angeles. Los Angeles:
Suuthen, California, School of Social Welfare, Institute ofGoverrmwrit and I-ubl,c Affairs
I..; Hussell, II.C:., Warren, J. J., arid T. (1965).Report of the Nev. York Statr Citizens Committee on Welfare Costs. New
'Die committee
Winte, H. D. (1917). "1-0..-port of the Personnel Turnover Study'," The BoundTab! Vitionzil l'edt:ration of Sttlen,ents, 21, pp I -5.
Tissue T. (1970). "Expected Turnover among Old-Age Assistance Workers . "Welfare tin Review,. 8.4 pp 1-- 4.
Kg-
I.(..ewy, .1. (1968). Characteristies of tile Professional Staff of FSAA Member!NJ:ILI( ies Jarluary 1, 1967 Part 1 t.:2'enural SurnnarLyarid Tr.2nds.Nev, York: Family Service Association of America.
Jones, W.I.. (1965) .''Social Work Staff Turnover in the Alameda CountyWelfare Department", Unpublished Master's Theis, Golden State College,San F:-an, California
Herman, M. (1Y459). Occu iationai Mobility in Social Work: The Jewish Com-munity Center Worker. New S orkt Nat mnal Tewish Welfare Board.

tdmittaT D-1 (3)
Lindenfeld, Frank. Teacher Turnover in Public Elementary and SecondarySchools, 1959-60. U.S. Department of Health, Education, and Welfare,Office of Education.

APPENDIX D (3)
which form important first impr'essions in the employee's mind. Other
important factors, which if unfavorable, lead to a greater turnover, are:
Job satisfactionPhysical work environmentFinancial compensationIntrinsic aspects of the jobPersonal involvementSupervisory leadership styleThe work group
I A:ftictiv, itz fittis ft >trr prin.ar,' cagories of terminations:
Involuntary unavoidal.ieInvoluntary avoidablevtduntartly unavoidable(dunta F'' avoidable
Involuntar y lude:-, layoffs, t urmmai aftivity,
;11,(1 drugs. inv,duniary nvoidable terminations art' at result of such probitMS
as poor !ol, peforinance, or conflict with supervisors. Thy voluntary
unaytwiable t at4.gory includes resignations due to n.ilitay :-;c7rvice, pregnancy,
!iint:-,, family ;,roldemb or marriage. Hie last category, voluntary avoid-
able, includes resignations from anxiety and job dissatisfaction zind going
to a higher paving lob,
(2) Itehrend, "AbRence and Labor Turn:iver in a CliarlvalCliruate". Orcr 2.2112.)al Psyeholmy )4)53 .
lirms to:
attillite:-; the level of en.plovee turnover in induqtrial
Changes in management policy (this applies to ingividualfactories only)

APPENDIX D (4)
A change in the level of wages (important only if it givesa firm a differential advantage over other firms)
A change in uncontrollable lahor turnover (turnover dueto retirement and death and in the case of women, alsomarriage and pregnancy)
Behrend also feels that there are also external factors which
cause employee. losses. or example, a ch.:nge in the cc( nomic climate
Involving a higher nu rate and fewer korking hour s may have
increased labor stability and It-(1 to a reduction in the level of absence
and labor turnover. Thi! appears to he an inverse relationship that.
exists between the level of n!plovlo.-'it and the level of labor turnosict,
Furtherniore, 3 rise in employlnent apparently leads to a reduction
in the 11-.4 I (it I;thor _urilt)v4 r hJi !a, t,,! ht}t tit ! v the t raut recesc;
Supportmv this theory is the fact that "other ra:sons" absences and
"HIM' MtifItiay" :it):-;efli.e rates show thitethi' 'VIA'l Cei voluntary absenteeism
is rt.' (hit in ;i ptti(,d of than full lull cmplo,,ment. Therefore,
there 1.5 an inverse relationship behkeen the level of employment and
the level :ditif`ritt'i'ls111. She also contends that liegional differences
in labor turnover are also found u. correspond to regtonz,I differeAces
the is:vs! itt einplovo!ent.
Iri --4,n-nr!,ary, the fiehrend survey shows that labor turnover de-
( reus :, al prt t iald; in practically alt factories when unemployment in-
c.reasus, trre:; et tive (1'11ex-ctn.-es in the personnel poll& its of individual
factot

APPENDIX D (5)
(3) W.W._Ronan, "A Study of and Sonic Concevts (2, ncernintI.Ltbot-,_Turnover ", Occupational Psychology, 1967.
W.W. Ronan stresses the importance of pay and security to
voluntary terminations fOr both long-term and short-term employee's
quitting. This stud :' was done for a manufacturing concern of 5,000
employees with these leaving voluntarily from 1960-64. Of ninetyone
persons tr.tervlewed duriig this time. 75% voluntarily left the company.
Their first reast,n w as salary and the next was lob security-
Early turnover was usually due to the wotk itself or to work
conditions. Other problems WUrf':
Fork.ma9. u-Iterpetztt...01: of company policies1.,Cro uorl.The foreman's rati_il ;Ability of import ,tic':Dissatisfaction .+c it ?. duties or viork contirt:..n.;New emplo.-re asolattonSupervisory considurationWork and autononis1h fICW emplayci.i: are introduced to the jobIiicognition
involvement
sunIrnarize the Ronan article. the four principle findings are that:
t-crnitriatt- r-ca,: -, dept.:nth-ht. upg.,r)their length of lob tenure
Ilwlwr ei it :)Ittyres lt aye for :-;alary while ii3tt.-1--r levelemplovei- . tve for Joh :it-cirrtt's,
Hall Ail the ilcrsins Icrminat.,ig employment have more thanone reasons for qu.tttng

APPENDIX D (6)
(111IttInV :11'(' 111:_hyl-1'tal tipund t11 ?t)11
it`I't t'i tf.t!!1 t I tilt {1t(11 ::1111 3t1(111
( ;) I I in&lunft-iii, "T, :it Turn(3,..ut. iii Pttbliktit).
Iff+I !it.:1141 rulat ht.:I411w Iwtv. cell the sizt, (II the
i ,t -I t And Vhr school itistetuf
tilt' nh,,t,t sciaration
t
I, ihrtt a-.5.:N!:-z .ifcmitc htv.:t.t!
Ut,t t. .1!1.1 )r t!.i Sk 'lit r;it 1." BUt
H f-11:7!r:rt tyr. !Itrt=ovf,?,
t lr,t1111.: I mdt iti, thy« t t "1:11. OS
1: !` ). ttt. iit it :iI I (I, .4111.1 , 1:4 1'vt I. t,.
!' IT 11.-11 - t
r, = fin -17-1 77-4. ht) ttrf:-(1. Ift th:it '41f1,C af-Aftt'!!':
t a4, :Wt! !licit 111 t titt1 r.itt.
(!r(,-; a rof
.1 !h.:*'! 11:U11. htit rate"' ,,f :4
i'-'4(!tttf.(1, ;t1 tIAtinfi'l-1-4 A tlltti :1 --1,111111.1 tit!4t 1 It t)
;it _1 1i
;i .* i .) f itir
I
nd 2. fur -.:(Izt.t-n.
.t!ti,!;:) th:
,I.';.:ttt
a A " fl th:tri f!tr- t'n 4)n Iiitth eftnrunt:ii- :vid
1 0'%* j . 1:1.11-ktcf i)11 the cif' 1.41,

APPENDIX D (7)
Edward Ruda and Lewis Alhri 7ht."Racial Differences on SelectionInstruments Related to Subse tent Job Performance", PersonnelLthyLL0101121161,
High scores or the weighted appitcation blank were positis.ely
correlated with a tendency to remain on the lob for both white and black.
racial groups. It was also found that high Wonder lic s.'-ore, were
associated with turnover for the white employees, while no relationship
as such tor blacks IA :IS found. Moreover, they found that blacks as a
group tended to stay on tiit lonc:,r than Whites.
3. EFFECTS OF EMPLOYEE LOSE
(11 S. Z. Moss and M.S. Moss, "When a Caseworker Leaves anInu.act ,:n Worker and Client". Social Casework,
1'167
The retira-hlent of a coz--9tkkorker hat, a dual emotional impa,7t. It
affects the t-as....,.0-ker himself. as well as his clients.----,.
For the caseworker, the termination may have both positive and
heo,ativa. teatitn- reachi..0 the -_-;elf-realtza.tion that they
are now able to reach for d ttek f. mplovment experience. A departing
work r- has probably had to r(.:- evaluate his own professional identity. his
past exper!enic; anti future guals.Aor
The v.orker dua fl.!11 ilnflict tlio titning of lei-tying his clients.
Althnurh the vsorkgr go fri !th ht haste role of 1-1* 'ping, the time
of his Icavinp, ti:a: mit be an ideal time= for each individual t Bent.

APPENDIX D (8)
For the client, the reaction is highly dependent ii!on the attande
of the worker toward his termination. As the time. of termination
approaches, the client may fe..r his loss of dependency on iLe worker.
Feelings of abandonment and hostility may develop. He may feel
deserted and treiected. Not unusual is -a -reaction of resistance or denial.
The client may minimize the worker's departure and Underplay his own
need for help. He may deny the termination by suggesting he continue
%%all the worker in his new !Ob. The client may also experience a sense
of relief that a painful process is about to end and this may signify to.
iii?, that he- !eAtit nig% stand on his own. Con,..-cely, the
intensify his efforts: to work an his problem in an effort to make tie
most of a limited expeic.
The client may also feel that the casev.Irker is- breaking the tacit
contract he made when he took. on. the case. The impact is less on a
new client relationship than a fully developc,i or.c:. Other factors play.
a part an the client's reaction, including previous sk-Taratton experiences
with caseworkeTs. Children are .,ometimes especially sensitive to this
Many clients feel anxious about their new caseworker. -The idea
o devt.lopinw, a new rtAation,hip, i:--,tatnishing the required trust, and
retelling the acre facts causes uncertainty.
(2) F. a Study of Turnover for the Housini±ithorit.: ofBalt, re Cit 14°A,
Thc tJf. tr.:31(11(4g : !WA pt::: son int. ludes the non-nroductive time
of the (. workcr and supervi.ior while the new person is learning his
I

APPENDIX D (9)
job. This .-ost may acLrue ovc,r a lengthy period of time.
Twel.,e tElenients of turn6ver.cost can be calculaten_by the personnel
staff:
At: ;1,1ti(-d
Personnel staff tt,orker's_mterviewing time
Testing tune
Coat physieal exammations
hne fri:In the central office to a point
1.1-avi,1 time tt and from the doctor's office
ori,;i.ntation trairr.ing to1JtS
Nunproductive ft:4 inifig on-the-job of supervisors'arid new employees
iit^CrtlatIr:!"iit
PriV roll unit rzri:ICI:'14:.;ing COSt$
14ersonneI t,r.Itt processing costs
emilc pr,:-,c-t..n,sulg tune 0,sts
s. tinic tai. httv.-..-,,,r1 the tittle the employee
and a qualified r.-1,!:iki'r:it:tit ff,und.
Disney aly.11 :71entions hidden costs which ;ire not always obvious to
the pc-rsunni.1 These are training done by co-workers; the titiperVISOCS
tirn'' in tryify, Say tils;..suade the in-nplovee from leaving his lob'. the discussion
turf!. hetv:PPn SIltierVtSOr and the personnel staff before a new employee
is brought In;- and the non-productive period after the appearance a
new ;pi( r .

4.
PPE NDIX D (10)
RECOMMENDATIONS FOB REDUCING ENITYLOYk_: LOSSES
11:akes several useful recornrnendatit,ns for reducing-
employee He found that the heaviest turnover i...)c,ur:..q1 during the
first yt..zir. one part c: pert-;itted a salary only once
a tear tint)l the maximum gradt. was reached. Disney surae:med that a raise
after the f;r:;1 months might h useful in-combatting turns ver, since one-
thrill of the resignations within the fir8t year were due v.: tirinncial reasons.
A positiv,:- ;,..ttitude by the new trnplovve t' he can satisfactorilyI
arisv.er these
`,.khat ztfIrt nf person is his .supervisf.)C"'lire his, ;:c.,--.voriv,rs im.-4f!rdlv and cooN.-rztive")AI, hi,. arifAre ht duties thorou,i4nlv
s he km )w. what h rviser expef.ti,.. of him'')W hat do oti,i'!r ernplovet-s, think r h:s cnrr:pany r au.ncy
k
i!,rea,t the new
ep-Ipte-tvi-.. arn.,inv, hit!: t both co-worker:-. ano i4urrourviings.
Dis;ar, iearriv.ki tha nct turnover 15 caused t;.y
supervit:ory practices s

1.,- .
- s
4;7" "1?
, . . . . .
11_ ilNn't.',Vti ftiP,Au.i'Ait 1)1301:41A.A1';,
-.Nrrrss-rm.
.
M.11
N. !.
.111., s ` . ;
.:"'
1' t, ; . ( (-
.. . .
:14.:1;.,;'`-' :
. 3,'
. . , . t .
1
:r.L-pf.
3.1t Zi74.1
1:4. ..14c, 9. 7 t.' ro. 2i"
7:771 61:4.; jb. 11.11
100 1102.2 . 23.00" 16. "w
4.
701 6:;1 B0021. 3 13. 26'*--
142 1!0' 11M1..1`. 14. 7.7' 13.
:.7 1-7 1 "0)
22. 24.
114
10. "4 I " 24.62-
c,.-... ., I --,.... -:,, i 4" :44 142N...:- . ',., ,. 1:.(;8 :.4 \ .2, :i.,!'
.;-..,..... : ( .,. ! : . 2.; .-.: .: :.'1
-.: -1., . , . it. 0 0
a1f 174
;7 , :71211
2 J.! 222-t: II
."N`yar
16.116-
36404. '.i1;,
`.1J:1
14.17-
21. !:,-
4
h. 21
7141. 1'2-
-11:1
4. F3)-1
61;6t. 111
41
" -7 .2. 07
I
1.-:, : !,
..'8 i2:;
:
( . it ' .I LI !:
I
474
03 1
; 444I. ,.
1 31
S. i
'k

APPENDIX (2)2
TUHNC)VER RATES IN liEAD1.\R I PHOCItiA (Cont.)
PY72 131-71 PN:70 Average
....+.r.C.,.L:1 11 ((ont. )
ti 1
24!)
'1-,
232
11.80
253
941.
18. 12
7i4 .,
I)tIt., A rta
1,1,01.t.1! 111-.t.1 I't23.81 21.74 22.02
"(1r:if:LIP ( : it 41 141S.Inta AtIa. t 17.81" 16.13 12.207. 1:I. 60
1),1 57 1H7I? .tr.-;idt , 23.64- 16. 'is
In fit it,131 .:1.1 lit. . 1 'uI'!\ t) 71. 79 218Snn nar .11 if. 6.2 3.80- 3. ifir
Stratti:r.
1.Vorcester Citrn:r.ur.ity .Action Corporation. 94 90 85 269tt rircester, V.166. 22.227, 14.121'; 15.
A/if-into 104 64 2'14N..1. 11.14 H. 9.18'
rk (*.dint Dritnitt:...tnt to, 81 78 73 232Cor- ...ro!. ,.(.1..1.fro1U 6.17 10.26- In. 61i- 6.05".
12-4 k dl..
ShoreSalirt.hurt.. \18.
I ...1.1 !Ie. tl' I.
). 00'4!!
34.69 r-
31
4812. 30
28
14924.16",
90IlteMP:4'. Ala. 3.2.1 3.37 4.44
ent Lahr 1.1 47 41 132U.,11::;,111.1, K... I) 0 0 0
Aft , 82 89 021. 11'. 0 0 11. 92".
J. .:1.!1-1. In prttver:31.t Ct.ont 11, -o. 21 21 I.
E nittt,n, N.C. i. 77 1.. 4.76 ''.. 5.26
Experit,ent Jr, Self- }fel ',low.. . 71 75 50 2051., inston-Salem. N. C. 26.76 16. OV. 3.39-1:, 16.10°.:,
Suttort eflti.).11 P i'(.' 4flt(V( lilt Ti (SroPF.). 158 158 116 432Da...ton, Otte, 18.15'. *14.56' 6.03. 13.66"..
1-:ast tatit.. A, tb.n. 282Flat It ivt.r. 12.63- H.42- P.701; 9. ft31-,,,
Mtssourl (>zati E. r14):.! ()pi orittmt.... ( Er;).. 52 54 54. 160Htchland. 19. 14.81" 10.63cr.
Portland Nletr.1.,.litan !-;teering ( ,mpany. 57 61 170Portland, Ore. 23.08" 7.02'7% 34.43°'. 21.76.7".
Nletropolitan Develf.pment Conned, 58 37 172. Tacoma, Wa6ti. 17. a4 10.34% 30'i 14.70"*.
. _

TURNOVER RATES IN HEADSTART PROGRAMS (Cont.)
APPENDIX E (3)
Nan*.e of (Irgani:ation P1.72 PY71 PY70 3-Year Average
.z.ztratu.2. IJ
y,:, -.:. Amon. 23 28 25 76A Irct I. 14.29% 8.00'" 11.84%
Cireat.or 1 t' ( "1:.1; Witty Aitl.,11 27 19 7316, ot 7.41'; 11.1% 26.32% 13.70%
. At non, 7 7 7 21C ranston. II1- 0 42.86% 42.86°'; 28.57,
SUSSt X ( )::.:::11:11ty ACI1011 Agem:y, Inc., 57 51 38 146Dl. 38.6r: 21. 57 T. 5.26 23.!17"x.
Scott ('ountv titir:i1 Arta DevtItity.:.tint, 11 11 31Gate (-It I; a: 18.18; 18.18'1
C. ---inity In p oveir.ent Council. 20 20 20 60D.iie.-ille, Va. 35.00n 43.00% 15.00''. 31. 67%
1.1..r,er ('unt.% I:( ,,!-,.nsie Opportunity ('-rii. ,kiluvitelci. '.% . ya. -
2512.00'''"
2412. 50%
2718.52
7614. 47%
Ectinoriiic Oppotunit.... Council, 13 t 13 11 37Jai 30.77% 0 18.22°',
A ode riion C tint CAC'. H H H 2425.00'r, 37.50n 0 20. 83%
I C., r. 8 8 8 24Stat:-0.11I,. 0 0 0 0
Garrett-Keyser- Butler School Distrit t, 3 3 3 9Garrett. Ind. 0 0
\lurikegori O. ana AA11, 20 27 76'Muskegon, 10.34% 15.00% 44.44":, 23.68%
KNO-I10-() Tri County Cornniullity Action 9:i 29 . 14 68C.immission, 0 17.24". 7.141',. 8.82%
St arsaw, Ohio
Delta (",iii..zrurety Action rounlatit.n. 18 18 181)u-). :art, Okla. 50.00";. 33.33% 50. 00% - 44.44%
1,0)11:are Iiidlindrit Sr.'!tto Distrit t, 4 3
Kt-mot/0, x 50. Oun 33.33"..4 0 42.86%
Fhoitiv.oli School District. ti. 9 9 27I.ovlanti. ( '0 li i . 33.33n 33.33% 22.22% 28.63%
Clackarntis County Head Start. 20 19 17 56Oregon Ctty. ()re. :35.00'%° 0 0 12. 50n

APPENDIX E (41
'0
Narr.e of Organi..:iti.in
PROMOTION RATES IN HEAL)START PROGRAMS
P1172 P1-71 PY70 3- year Average
Stratum A .
rr.ited r,,:: -unity Corporation, 305 287 278 870Ne.a ark. N.J. 5.25% 6.62":, 9.71'% 7.13':.
Ncenc.. for Child Development, 870 789 694 2353Nvii York, N. Y. (4.081" 6.46°1, 7.49% 7.73'.
Unite.? Plannino. Organization, 100 100 110 310Washingtilo, 13.00% 9.00", 8.18% 0.00%
Mary lIolmts Community Education, 1178 1205 1257 3640Jackson, Miss. 5.94°*, 3.73% 1.01e7 3.82%
Chicago Committee on Urban Opportunity. 701 684 600 1985Chicago, 5.42To 6.73% 3.83% 5.39%
Greater Los Angeles Community Action 1142 1109 1130 3381(GLACA). Los Angeles, Calif. 7. 18% 5. o5n 4.78", 5. !Ii';
Seattle -King, C ounty, 187 1i5 156 498Seattle. Wash. 5.35% 7.74% 6.41% 6.43%
Stratum B
York County Community. Action, 64 65 85 194Alfred, Me.. 3.13% 7.69% 15.387:.
Aliabatha 149 144 142 435Auburn, Ala. 16.781:. 15.49r., 11.95%
. Montgomery Community , 238 238 238 fiiMontgomery, Ala. 0 0 2.38%
Coahoma Opportunity, 173 171 174 518Clarksdale. Miss. 0.58% 0 0 0.19%
Mississippi InduStrial College, 222 222 222 666Holly Springs, Miss. 3.1 s' :. 0 0 1 o5n
Community Service. Association, 174 174 193 541Jackson. Miss. 0 0 0 0
Institute of Community S.:rvices, 150 157 167 474 "
Roily Springs, Miss. 14.00% 10.19% 8.38% 10.78%.
Mid-Delta Education A. 196 196 196 588Greenville, Miss. 7.65% 3.06% 4. 55% 4.42%
Trt-County Community, 128 128 128 384Laurinburg. N.C.. 1.56% 0.78% 5.47% 2.60%
CAAP of Greater Indian.quil is , 148 148 148 444 3
Indiapapolis Ind. 14.86% 5.41% i.- 0.66% 6.98%
Community Relations Social Devi 9ment, 169 153 109 431Milwaukee, Wise. 1: 83°,'. 9.80% 0.92% 8.35% t.,*
'4 ,,,
Tri-Parish Progress, 197 202 109 598 )Growiey, La. 5.08% 5.45% 0 3.51% ...'
conom C Opportunity 09 87 77 263'Kansas City. Kansas 0 5.75% 1.30% 2.28%

are of Organization
Stratum B(Cont.)
APPENDIX E (5)
PROMOTION RATES IN HEADSTART PROGRAMS (Cont. /
PY72 PY71 PY70 3-Year Average
Delta Area Economic Opportunity Corporation, 333 3110 297 949Portageville. Mo. 9. 0 1 J.3 13.797'0 17.85% 13. 38
1)i iy..er head Start,Denver. Colo.
(1r;o:41. v rontmunity Aition Council,Santa Ana, Calif.
Eco,tornic Oi.portunity Board,Riverside, Calif.
San Bernardino County Board of Supervisors.San Bernar-Rno, Calif.
Stratum C
249 232 -... 253 7542.01% 4.37% 8.700%. 5.04%
57
8017.30%
orter:ter Community Action Corporation, 84Worce6ter. Mass. 19.151'
>tInnti Ilu i .an Resources,Atlantic City. J.J.
1045.7 i':,
Ntontgon.ery Counk. ')epartment of 81r4u, unity Ile viclopment 4.
Rockville, Md. .
Shore rp, 1nr. 52
Sal isbu
31LOW Ilrit (...1.1fit1 lit);t1- d i.dut atom.Haynes vt lle, Ala. 0
West Lake Cumberland, 44
Columbia. Ky. 11.36%
Lift, Inc... 82
Tupelo. Ii s. 6.10%
Economic Improvement Council. 53
Edenton, N.C.0
Experitnent in Self-liel. :..e,Winston-Salem, N.C.
719.86%
Support Council on Pre \ entive Effort (SCOPE). 158
Dayton, Ohio 16.46%
East Missouri Cotntrum:. Action. 95
1"lat.11 i vet% Mo. 12. 63%
-..... Missouri 07arks E.-or..: I Op! ortunity 1' f 1 rp ,. 52
i iChlatiti, Mu.e ,
Portland Metropolitan :ilve ring Company.
0
52
Portland, Ore. 9.62%
1
_
49 41 14126.53% 17.07'; 24.824'
55#
55 16710.91% 10.91r. 10.18%
79 79 ! 2386.33%
90
3.80%
85
9.24%.'.-
26914.44°', 9.41% 14.50%
96 94 29417.71';
78 73 2321.37% 3.45°1.
49 48 14912.24": 0 12.75%
31 28 906.45% 0 2,220'0
tIcf,47 41 132
25.53% 14.63% 17.42%
69 0 1510 0 3.31%
21 21 954.76% 14.29% 4.21%
75 59 20521:33% 6.78% 13.17%
1587.59%
1169.48%
43211.34%
95 92 2827.37% 6.52% 8.87%
54 54 1600 0 0
57 61 17010.53% 11.48% 10.59%
Metropolitan Dcvelopmen: Council, 57 58 57 172
Tacoma, 15.19% 1.72% 5.26% 7.56%

-
APPENDIX E (6)
\I t) FloN RATES IN HEADS FAR r PH( KIRA NIS (i .nt.)
Nii-nie of Orition 12'1'72 1'1'71 l'Y70 :3-Year Average
Stratum L)
23U
287.14'7';
250
76yoi k count.. C'orr.munity .Action,tired. M.
1.4 renee Community Action Corp., 27 27 73Lt ronee, \lass. 0 0 8.22
Cr:In,t..,n C..! :outlay Action,i-rinston, R.I.
,
n7
070
210
.
Su:-.ex County Community Action Agency, Inc.,cle..rgetoAn, Del.
57..24.56' '.
51ll. 80',
380
14613.017;
Scott County Rural Area Development. 11 11 31Gate City. Va. .09. 0 6.45%
Community Improvement Council, 20 20 20 60Danville, Vii. 0 3.33",
Mercer C,.".inty "Economic Opportunity Corp.. 25 24 27 76ItInefielcl, W. Va. 0 8.33'1 0
Upper Orr!tu..1c Economic Opportunity Council, I 13 11i. r. 0 ).41'1
Andy rs,n C.,unty CAC, 8 8 24Clinton, Tenn. 0 0
I Carr, 8 8 24Statesville, N. C. 0
Garrett-Keyser-Butler School District, 3
Garrett, Ind. 0
Muskegon Octana CAAP, 2:1 20 27 76Musktgon, Mich. 0 0 0
.1:NO-110-00 Tri County Community Action )1 2" 14 68Commission, 0 10.34-.. 7.143', 5.88%
. Warsaw, Ohio
Delta Community Action Foundation. 18 18 18 54Duncan, Okla.
Kolintze Independent School District. 4 3liount.te, 0 0 0 0
Thompson School District, 9 9 9 27Loveland, Colo. 11.11q; 0 3.70%
Clackamus County Head Start, .20 19 17 56Oregon City, Ore. 0
0

, APPENDIX E,(7)
TURNOVER RATES IN HEADSTART ORGANIZATIONS
Name of OrganizationStratum A
United Community Corporation, DNewark, N.J. %
Newark Pre-School Council,Newark, N. J.
The Hilary School,Newark, N.J.
D'TO
D%
The Leaguers, DNewark, N.J., %
Agency for Child Development, DNew York, N. Y. To
ABC Montessori,New York, N.Y.
Addie Mae Collins,New York, N. Y.
Archdiocese of New York,New York, N. Y.
Bank Street College,New Ycrk,
D
D%
D-%
D(r,
Bedford Stuyvesant Youth Action DNew -York, N.Y.
Bloomingdale Family Program, LNew York, N. Y. a.13
Breukelen Recreation Room, DNew York, N. Y. %
Brownsville Comm. Council, . DNew York, N.Y. %
Bushwick Comm. Corp.,New York, N.Y.
Cardinal Spellman Center,New York, N.Y.
D6:o
D%
PY72 PY71
3 ,33.3%
2838.1"ro
3
0%
28013.5%
4 4
0%
15 0on
172 746.9% 6, 7%
.12 128.3% 8.3%
27 2714.8% 14.8%
23 2321.7% 8.7%
15 1850%
82 7524.4% 14.6%
16 1612.5% 18.8%
16 1637.50 0%
62 7121% 25.4%
25 2828.0% 57.1%
14 A37.1% 23.1%
P170 3-Yr. Av,
3 9on 11.1%
2719.9%
83410.5%
4 12
0 150%
18 16416.6% 7. 9%
12 3641.6% 19.4%
27 8114.8% 14.8%
23 690% 10.1'
22 550% 27.3%
82 23917.1% 18.8%
16 4825% 18.8%
16 4831.2% 22.9%
69 20213% 19.8%
N/A 53N/A 43.4%
13 4023.1% 17.5%

.
Name of Organization
APPENDIX
PY71
E (8)
PY70 3 -Yr. Av.Stratum A PV72
Community Parents, Inc., D 13 13 13 . 39 %.
New York, N. Y. To 0% 30.7% 0% 10.3%
DeWitt Reformed Church, D 12 12 13 37New York, N. Y. 17:, 25% 16.7% 23. 1% 21.6%
East Side House Settlement.. D 12 12 12 36New York, N. Y. er!
.4) 3% 2.8%.
Communit Life Center, 13- 56 57 57 170New York, N. Y. % 19.6°'0 '7.0% 3.5% 10. 0°.'0
Escuela Hispana Montessori, 1) 32 32 32 96New York, N. Y. To 9.4% 18.8% 0% .9.4%
West Harlem Comm. Organ. , D 12 11 9 32New York, N. Y. '',0 33.3% 18,2% 22.2% 25.0%
C.11, I. L. D. Inc. , D 82 0 0 82New York, N. Y. % 24.4 f. ; .,. 0°,'o 0% 24.4%
Hudson Guild, D 15 15 15 45New York, N. Y. To 13.3% 6.7% 13.3% 11.1% .
Hunts Point Coordinating Counci1,0 11 11 11 33New York, N. Y. % 18.2% 18.2% 18.2% 18.2%
/Job Opportunity & Training Ctr. ,D 13 13 12 38New York, N. Y. cro 15.4% 0% 33.3% 15.8%
McDonough Street Comm. Ctr., D 30 22 19 71Nev. York, N. Y. at 6, 7% 9.1% 10, 5% 8.5%
Manhattanville Pre- School D 15 15 15 45New York, N. Y. % 40.0%
-.iv..1,.
0% 0%.
13.3%
13M.E. N.D. , \. 13 13 13.
.
939
New York, .N. Y. ''f% 7.7% 46.2% 46.2% 33.3%\ ..
Morningside Comm. Center, ii 12 12 14 38Ne* York, N. Y. 17.10 33,3% 41,7% 7.1% 26.3%
North Presbyterian Church, D 14 13 13 , 40New York, N. Y. To 21.4% 7.7% 15.4% 15%
Quick Start, Inc. , D 14 14\ 11 39New York, N.Y. 0/
/0 57.1% 7.1bI0 0% 23.1%
Sea and 1.and Presbyterian Ch. D 15 15 14 44 ...New York, N.Y. . To 20% 6.7% 7.1% 11.4%
,

4
APPENDIX I 1)
Name of organizationStratum A PY72 PY71 PY70 3-Yr. Av.
Sharon Baptist ('hurch,New York, N. Y.
South Bronx Head ~tart,New York, N. Y.
D 13 . 14 14 417.1% On
1) 12 12 N/A 2441.7% 58.3% N/A 50.0 r"
S. lir,)(1111%.1 (k)* Ck)ri' D 12 12 12 36Neer York. N. Y:- 58. 3% 16.7% 16. 7%
S Ctr. Parents/Child, U 18 18 18 54Nt-A York,- N. Y. % 11. In 16, 7% Oci.-'0 9,3%
St. Alhan's ('on.rn. Ctr. , Inc., I) 12 12 12 '36New York, N. V. . n.0 8. 3% on 2.8T,
Torah U:nesorah Society, D 41 41 40 122New York, N. V. % 9. 7% 7.31% 5% 7.4%
Traba a mos ,New York, N. Y-.
D 13 13 13 39D 7.7n 30.7% 15.4% 17.9%
United Families, D 14 14 14 42New York, N. Y. '1.0 7.1(r. 21.4(e. Orro 9,5%
United Planning Organization, D 6 6 9 21
Washington, D. C'. ,-,..., 0% 16.7(".., 33.3% 19.0'7-,
Higher Horizons Day Care,Bailey's Crossroads, Va.
D 9 9 12 30% 33.3% 11.1% on 13.3%
National Capital Area Head Start,D 85 85 89 259Washington, D.0 ,0 22.3% 30.5% 16.8% 23.2%
St. Athan's Nursery,Miami, Fla.
Mary Holuies.,Madison County,
D 5 5 7 17
% 0% 57.1% 23.5%
D . 221 *221 233 6751.8% 9% 1.3% 1.3%
Mary Holmes, D 71 81 89 241Hanki.n County, n on on 0% on
Mary Hoirries-, D 57 57 57 171
Newton, County, % 15.8% 0% 0% 5.3%
Mary Holmes, .C.'opiah COunty,
Mary Holmes,Kemper Count,i,
D 84. 84 86 254q,C, 4.8% 14.3% 1.2% 6.7%
D 75 75 75 225°,',) 1.3% 6.7% 8.0% 5.3%
I

Ndiiie of OrgariihittiutiStratum
1.ia1 -:t Crtalt% ,
\ 1 ; L \ r
S tone ( ount
Mary, 11o1nies, Grantee Office
Xlitry 11olt,:vs,Jaspe--tin,ittl-Countis,
Nlav1.4)1111(11h t:.
max y Ifolthes,Jones (..ounty,
Mary Ilolihes,s.Vashington County,
A rchdlocest: ot ht.( ago,Chicago,
loarti Educ anon,Chicavo, 111.
(icaof, lioy's Club,Chicago, III.
Chicago Fed. ru St-ttie:i.ent6,Chicago, Ill.
Chicago Youth Centers-LEARN,Chicago,
Episcopal Charities.,Chicago, 111.
Greater St. John A11(1!: Church,Chicago, 111.
Lutheran Welfare ServicesChicago, I11.
Marcy-Newberry Association,Chic ago, Ill.
St. Matthev.- Methodist Church,Chicago, Ill.
ENDIX I.: (10)
PV72 PY71 PY70 3-Yr. \v.
1) 7 t 70 80 2201.4 8.7q* 3.6"'
I) 4 41 41 12507% fr.
1) 28 21 22 7117.8". 33.. 3T. 45.5' 31.,
.151 151 15.1 41.;. (
3.p 4.'0%
I) 431 14'' 157 437'., 3.3', 4.0' 1.1 ", 2
D 116 116 116 34607. ri,', 0". 0',-,.
I) 131 13' 150 420 .
'7, 16.87,, 22.. 3.% "1. 3"-",
I) 142 156 10114.1, 5.8 13. '!" 10.
1) 26's . 231 216 71620.3-% 21. "C" 16.
D. 1
D 26421.6',, 15. 18.
D 78 85 110 27352. (:#7,, 26.4'f,, 53.5".
D 23 , 23 23-
'71, 21. 77%, 17.4'% 17.4'1
D 10 2822.27, 22.2T. 14. -1
D 40 40 8 887%, 07,, 0'",., 07',., 0...-..:
.1.5 8 0 8 24', 62.5"7. O'r.. fr. 20,8'-.
D 8 8 . _ 16N .N 18.7-
.

APPENDIX E '11)
.13.:1;e Or_puuzatliotaStratum PV72 PY71 P Y70 3-Yr. Ay.
. .
STEJ.tricChicago, 111. 1.7)
Vl' CA :T( \ Chicago,. DChicago,
ABC fleaclstart, Inc., I)Los Angeles. Calif. 17)
chili; Care Deviloptr_ent Sem-. 1.)Angeici.,,
,Coniii:. Voul.11 Deverup. Agency, D1..07: .101..1,.,les, Calif. 33
Delta Swp:a Theta Road Start, I)Ls A:Igele, Calif.- -...
Fa...in. for Early Childhou-,.: Ej., D. 1..i.) Angeles, Calif. -,.,
J---VO-lerR'iti Douglass C.D. ('tt. D!,os Angeles, C.alif --,.
.
kejran (. ii.v. fit'aostart (Ai% . 1)1.os :\&...t-, Cr.-41:
7 7 9!.57.1
/8 _ to 306.7-,
45 45 55 14513,37:. 52.7 26.
122.
121,38'0
120 3633.5.ro
62 48 47 157.16.17 2.1.1 0" 7.0'
134 136 135 4064.5 "..., 5.2 . 2,2.7. 3,97:
104 102 111 31717,3 --. 23.57,- 6,3 ei 15.571
118 118 118 3541..7'7; 0; .8-.". . .
---
634,8".
616.6i-
5c,
5.17-183
134 134 134 462l'..4.4 -.. 16.47. 29.1. .',.
\
262 250 -,- r.. }a 767-:14.6" 1 -r. 3'7.7., 16.0!
1...tur, .A.%...ric an C r. ik: Assoc., p1.. -A:4:4_,,c,.,, Ca. \:.
s.
.N.:.-.:._-',..--; (7.-',.,..1!:t. Schro,..}1, 1')
1.os Att. Calif. 11.5"A
Parent t'1.: ..*,-.'.\-.ce. Or a ',-8 !,4 '45 2871.tis Aogeles, Calif. '-'. 3.1'1 7,, 5", 4.2'7,-, 4.9'7,,
Seattle Public SC110015, D 46 46 46 138Seattle, \lash. 32.6 34.8 54.4 40.6')
Sch,),,1 District #1, D 7a.. 221Seattle, t1 ash. 3.,9"777 26.. 15.81":.
Central Area Alotty`n. Pgrn.. D 31 38 1.07Seattle, Wash. 32.37; 07.'
Neighborhood !louse, D 32. 0 0 32asA.. 15.61". 0'., 15.
f

.1
";.
r
r 4
.A1,1)Emp....x.F. (12)
N3Z11V C'd Organization '"
ii
PY72.....1111
6 -
PY71 FIN-70Strata :'& 13
Pre it": -Head Start.
oroweibroima
6:.,7..
6,',P VOA,: lattri,ce. -... 10.97 -1-4,. : :24.6 -,.,
Lk.utis fit 1.it.
14'1,
12.1144 142
MontHor, ('O C A A. 238 2:38 2313
NIontgomer alb O'r:v
CilatiO2IV-4. 0.)Pp01111-1111V* 1) 173 171 1741:11-kpAiale, Nlisi.:,:.
!
'`-, 5.2'; 3.4-1 5. Fr
Massi..-..s-ic.qtt Induiritriai (.-:.711Qge. Li 3 3 3
-i 11:',11-,- Sprir.14:-... Ala. .
..-Litita Ill.:, 1-..,.:',;,.;it'i,..:::;,i ,Nr-z-A,;",:. .
.Sar(.1:7... :,..11$'i
I)'7")
66.77,
-211:
0 `77.
.9..-.
21:::0 1%
0'1;
21:,0°",:'
EA111 St;irini2f;./
tH.,11..1
D
11
174
1305.3-
1.14;
174 193
-
157 1675.411r
./ 116
I) 128 128I. a-..:rit';!.:2'1!., N.- C: 2.3 0. 8 1.6
14:.J 148 148
t. fitf:t!"-- . 0 3 4 4
25"',
.4111".t. 11;.b1 S C F:0014 U' 71 71 ',z" 71%1;11.4. :tt:ket: , 1.4'6, 2.874 Fs. 5"'
Dity (' arc- S.,rykys ti}r D 34 34 3417. 61`,. 5
Coalition Head Start. D .59 44 0 ..
Nlii auk clef . 18.61::1 27. :3-0
Proi.tres!,-s D 197 202 199
tic:ono:me Oppf)rtunity D 88
1.07,
87 . 77Kansas et y. T, 9. in- 11.5 3.3°,°0
.7
435
..t. -6
7141,14 .
41-57
Of", .
541
474
yyr58 63'?,
3841.6
444
23: 1
2134.2
102'
10322.3,74
5titi3,7'n;
. 2528.3!,
I
ii
)
ti
"..-73=r-.=
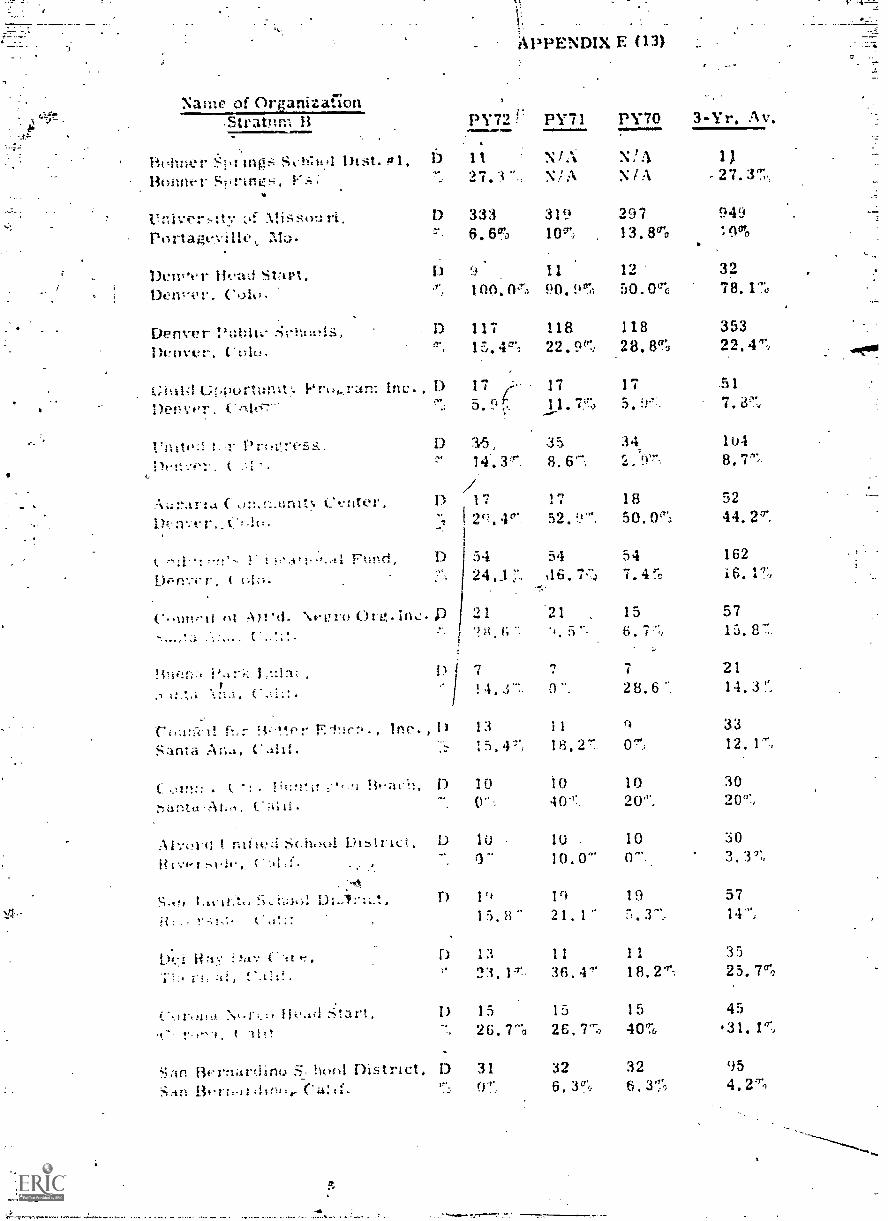
APPENDIX E (13)
Name of Organization,:m B
.-s..-
# Strat; ~MEV IMOPY72 !
Bt.,hrier .".`p: in S,11),4 Dtst. a 1,iierfutt-r Spraws, r:;:
I)''...
1127.3
'
. :
,,
sou 13 333'.. 6.6°
ljetv.t.t-Dent-iyr. 100. O'r.-)
Denver 13:.:1:11:- I) 117
Denvvr,
Vrk),_rarn Inc. 17
Derver. 5. 9
<.,
t ,.!:1..:DP
.
t...4 ( u:t.,_-:..tinit% C.:tag:Yr,
,---- 1. i ?,-.J.!,:...4.1 Fund,t
1) 3.5,
1) 17.. I 2q. 46'.
I
D J54
L.
-.
("*.tmrti III 'ti. ns..0 t.)t-it, in%2 P 217
.1,:.Par.,: 1...:1:1:. ,
t.:1..:. ( -..::....
1) 1
1
7! 4...r..
t1 f,:- TJ...*f.r F.-1.r.:-.. , Ine., 1) 13
S:Irlia Ail...i, Csillf. -,:. 15, 4"'",
C. . Pu°1'.it I) :10
0",
Al.....7.1(1 t nti it..c.: Schr.,01 L'attIt.,i,, L) 10
( ;II: f . . , ... 9"
PY71 PY70
NIAN / A
N?N/A
319 297Ero
90. 50. °L I-
118 11822.9tP::- 28, 8(1;
17 1?11.7'':) 5. 1...
.35 348. 6-,
t ,, .
,
1852. 9. 50.0'r,
54 5416.7".
21 , 154
7 7O'. 28.6.
11 t-
18.27, 07,
10 1020",
10 . 1010.0" 0".
949Tr;
3278. 170
35322, 47-2
.517. in
11)4
5244. 2°'.
16216. 1"..
5715. 8-
21
14.3i
33
12. 17,
3020T,
303.3T.,
.-:,At.t.tti..t.,, S, .::r...'. 1):..:-......., r) pi lii 19 57
5.3", 14",i(......'-;1.:, C.2'.:: 15,, H 21.1"
1 1) 13 11
;21. yr 36.4'
;..: Start, I) 15 15
.t. 26.7' 26. 770
Ssn nernardints 5. hor4 District,i3t-utr-11,111,,..
13 3107.
32
154O''
32 954 . 2 *7.,
3525,7a.o
45.31. V",

ro
.1
:-0, .
APPENDIX E (14)
Nanrzs of OrganizationPY72 PY71 PY70 3-Yr. Av.Stratiirn-43,_
Faniana Unified School Di.itrict,San Bernarthno, Calif.
h.alto Unified School Distri2t, D'San Bernardino, Calif. al.
Victorville School Dist;ict, D
Sar Bernardino, Ca4t. 0-,.,0
.
140-71
7
0-7:0
1526.7'',"0.
,,p/
- 140%
50%
150%
140%
5
0%
150%
420%
170%
458.9%
J., Christ Church Head Start, D 1.7.1 13 13 39San Bernariino, Calif. .
-..0 7.7% 7.7% 23.1% 12.8%
Str'atum C
94 90 85 269tVorcester School Dept. JWorcester, Mass. % 11.7% 22.2% 14.1% 16%
Atic.fitic Ullman Resources, D ,104 96 94 294Atlantic City, N.J. % 11.5% 8.3% 7.5% 9.2%
Montgonsler Co. Public Schools, D 81 78 73 232,0 6.2% 10.3% 11% 9.1(ro
Shore Up, Inc. , D 52 49 48 149Salisbur), % 25% 34.7% 12.5% 24.2%
Lov.ndes (Jo. 13d. of t;duca. , D 31 31 28 90Baynesville, Ala. 76 3.2% 6.5T. 3.6% 4.4%
West Lake Cumberland Dev. Cnl. D 44 -41 - 132Cofurnh-ia, Ky. % On. 0%
Inc., DTupt.10, Miss. To
8222%
69.0%
-0 15111.9%
1.:conunlic 11.1)n)ven.ent f:ouncil, 1) 53 21 21 05Gdenton, N.C. To 3.8% 9.5% 4.8% 5.3%
Family Services, Inc. , D 71 75 59 205Winston- Salem, N.C. % .n 26.8% 16% 3.4% 16.1%
SCOPE, D 158 158 116 /132Dayton, Oho' to 18.5% 14.6°70 6°.1; 13.7%
OE. Missouri Comm. Action, D 95 95 92 282Flat River, Mo. 0-,
0:!arks Econ. Opor.Corp.,D
12.6%
52
8.4%
54
8.7%
54
9.9%
160Richland, NIo. % 9.6% 7.4% 14.8% 10.6%

APPENDIX E (15)
Name of OrpnizattonPY72 PY71 PY70 3-Yr. Av.Stratum C
Portland Public Schools, D . 52 57 61 170Portland, Ore. 23.1% 7% 34.4% 21.8%
Tacoma School District, D 57 58 57 172(7'.0Tacoma, Wash. 17.5% 10.3% 19,3% 15.7%
Stratum D
York Co. Comm. Action Corp. D 23 28 25 76Alfred, Me. % 13.0% 14.3% 8.0% 11.8%
Greater Laurence C.A.C. , D 27 27 19 73Lawrence, Mass. % 7.4% 11.1% 26.3% 13.7%
Cranston Community Action, D 7 7 7 21Cranston, R.I. To 0% 42.9% 42.9% 28.6%
Sussex Co. C. A. A. , Inc., D 57 51 38 146Georgetown, Del. % 38.6% 21. 6% 5, 3% 23.9%
Scott CoUnty School Board, D 11 11 9 31Gate City, Va. 0,10 18.2% 18.2% 22.2% 19.4%
Community Improvement Coun. , D 20 20 20. 60Danville, Va. % 35.0% 45.0% 15.0% 31.7%
Mercer Co. Econ.Oppc,r.Coun. , D 25 24 27 76Bluefield, W. Va. % 12.0% 12.5% 18.5% 14.5%
Upper Ocrnulgee EOC, Inc. , D 13 . 13 11 37Jackson, Ga. % 15.4% 30.8% 0% 16.2%
Anderson Co. School District, D 8 8 8 24Clinton, Tenn. % 25.0% 37. 5% 0% 20.8%
I Care, Inc. , D 6 6 6 18
Statesville, N.C. % 0% 0%
Mooresville Public Schools. D 2 2 2 6
Mooresville, N.C. % 0%
Garrett-Keyser-Butler School D.D 3 3 3 9Garrett, Ind.. 0%
Muskegon Oceana CAAP, D 3 1 N/A 4Muskegon, Mich. % 0% N/A 0%
Muskegon Public Schools, D 26 19. 27 72Muskegon, Mich. % 11.5% 15.8% 44,4% 25.0%

1 \
Name of Organization
APPENDIX E (16)
PY72 PY71 -PY70 3-Yr. Av.Stratum D
Coshocton County Ileadstart, 'D 10 10 N/A 20Coshocton, Ohio % 0% N/A
Kakosing Day Care, D 15 19 14 48Mt. Vernon, Ohio . % 0% 26.35 7.1070 12.5%
Delta Comm. Action Fndn. , D 18 18 18 54Duncan, Okla. 50.0% 33.3% 50.0% 44.4%
Kountze Ind. School District, D 4 3 N/AKountze, Tex. 50.05. 33.3% N/A 42.8%
Thompson School Dist. RIIJ,Loveland, Colo.
Dr°'0
9 933.3%
922.2%
2729,6%
Clackamus Co. Eco. Auth. Inc. ,Oregon City, Ore.
D%
2035.0%
190%
170%
5612.5%

APPENDIX E (17)
PROMOTION RATES IN HEADSTART ORGANIZATIONS
Name of OrganizationStratum A
United Community Corp. , D
Newark, N.J. %
Newark Pre-School Council,Newark, N.J.
The Hilary SchoolNewark, N.J.
D07o
D%
The Leaguers, D
Newark, N.J. ' To
i
Agenc,r for Child Development, D
New York, N. Y. %
ABC Montessori, D
New York, N. Y. %
Acidic Mae Collins,New York, N. Y.
Archdiocese of New York,New York, N. Y.
. Bank Street College,New York, N.Y.
D07
D0
l3edford Stuyvesant Youth Action, D
New York, N.Y. %
131001-ningdale Paimly Program, D
New Y.)rk, N.Y. %
.. Breukclen Recreation Room, D
Newof
ew York, N. N.Y. Y. t
Brownsville Comm. Council, D
New York, N.Y. To
Bushl.viek Comm. Corp ,New York, N. Y.
Cardinal Spellman Center,New York, N.Y.
Community Parents, Inc? ,New York, N. Y.
D
D%
D%
PY72 PY71
3 333.3% 0%
283 2804.9% 6.8%
4 4
15 06.7% 0%
72 741.3% 5.4%
12 120% 16.6%
27 273.7n 22.2%
23 23r
0 4. 3 0
15 1826.7% 11.1%
.
82 7515.8% 1.3%
16 1612.5% 12.5%
16 160% 0%
62 718. 1% 2.8%
25 288.0% 7.1%
14 13.
7.7%
13 130% 15.3%
PY70 3-Yr. Av.
3'
2719.9%
911.1%
8347.2%
4 120% 0%
0 150% 6.7%
18 16:0% 3.0%
12 368.3% 8.3%
27 810% 8.6%
23 690(1', 4.3%
22 5513.6% 16.4%
82 2397.3% 8.3%
16 4831.3% 18. 8%
16 4812.5% -4.2%
69 2022.9% 4.5%
N/A 53'.N/A 7.5%
13 400% 2.5%
13 3915.3% 10.3%

Name of OrganizationStratum A
DeWitt-1i eformed Church, DNew York, N.Y. %
East Side House Settlement, DNew York, N. Y. %
Community Life Center,.New York, N. Y.
D%
Escuela Hisparia Matessori, DNew York, N. Y. %
West Harlem Comm. Org. , DNew York, N. Y. o'0
- .
C. 11,1, L. D. Inc., DNe\r, York, N. Y. 0o
Hudsn Quad, DNew 1 ork,; y. Y. cr.
Hunts Poipt Coord. Council, DNew Yoq, N.Y. %
Job Opportunity & Training Ctr. DNew York, N.Y. %
McDonough Street Comm. Ctr. , DNew 'York, N.Y.
Manhattanville Pr -School DNew York, N. Y. %
M. E. N. D., DNew York, N.Y. %
Morningside Comm. Center, DNewiYork, N. Y. %
North Presbyterian Church,New York, N.Y.
Quick Start, Inc. ,New York, N. Y.
D%
Sea and Land Presbyterian Ch. D
New York, N. Y. %
Sharon Baptist Church,New York, N. Y.
DTo_
PY72
APPENDI'
PY71
E 118)
PY70 3-Yr. Av.9
1233.3%
1216.7%
1323.1%
3724,3%
.12 12 12 360% 0% 16. 7% 5.6%
56 57 57 1.70
1.8% 1.7% 1.8% 1.8%
32 32 32 966.3% 3.1% 0% 3.1%
12. 11 9'3125.6%16.7% 18.2% 11.1% '
82 0 0 8224.4% 0% 0% 24.4%
15 15 15 450% .
11 11 11 339. 1% 0% 3%
13 13 12 387.7% 0% 25.0% 10.5%
30 22 19 713.3% 4.6% 10.5% 5.6%
15 15 15 450% 6. 7% 20.0% 8. 9%
13 13 13 390% 0% 0% 0%
12 12 14 398.3% 0% 7.1% 5.4%
14 13 13 407.1% 7.7% 7.7% 7.5%
14 14 11 3914.3% 0% 0% 5.1%
15 15 14 440% 6.7% 0% 2.3%
13 i4 14 410% 7.1% 0% 2.4%

APPENDIX E (19)
Name of OrganizationPY72Stratum A
South Bronx Heati Start, DNew York, N. Y. (70
128.3%
S. Brooklyn Comm. Corp. , D 12
New York, N. Y. cr,o 0%
S. Jamaica Ctr. Prnts /Chldn D 18
New York. N. Y. % 11.1%
St. Alban's Comm. Ctr. , Inc. , D 12New York, N. Y. % 0%
Torah Umesorah Society, D 41New York, N. Y. % 17. 1%
Trabajamos, D 13New York, N. Y. % 7.7%
United Families, 14New York, N. Y. ,0 14.3%
United Planning Organization, D 6
Washington, D. C % 33.3%
Higher- Horizons Day Care, D 9
Bailey's Crossroads, Va. /0
National Capital Area Headstart, D 85Washington, D.C. % 12.9%
St. Alban's Nursery, D 5
Miami, Fla. % 0%
Mary Holmes, D 221Madison County, % 4.0%
Mary Holmes, D 71
Rankin County, % 18.3%
Mary Holmes, D 57Newton County, (70 3.5%
Mary Holmes, D 84Copiah County, % 5.9%
Mary Holmes, D 75Kemper County, % of 1,3%
Mary Holmes-, D 70_Le ake County* % 1.4%
PY71
1233.3%
12
1827.8%
120%
419. 7%
1315.4%
140%
633.3%
9
853.2%
520.0%
2213.6%
50
8413.1%
750%
700%
PY70 3-Yr. Av.
N/A 24,N/A 20.8%
12 368.3% 2.8%
18 5422.2% 20.4%
12 360%
40 12217.5% 14.8%
13 3915.4% 12.8% \
14 424.7%
9 21_11.1% 23.8%
12 300% 0%
89 2598.9% 10..0%
7 170% 5.8%
233 6753.4% 3.7%
89 -241!2.2% 8.3%
57 1710% 1.2%
86 2542.3% 7.1%
75 2252.7% 1.3%
80 2200% .5%

;
Name of Organization
APPENDIX E (20)
PY72 PY71 PY70 3 -Yr. Av.Stratum A
Mary Holmes, D 43 41 41 125Stone County, . % 11.6% 0% 0% 4.0%
Mary Holmes, D 28 21 22 71
Grantee Office, % 14.3% 23.8% 9.1% 15.5%
Mary Holmes, D 151 151 151 453--Jakper-Smith Counties, % 0% 1.3% 1.9% 1.1%
Mary Holmes, D 131 149 157 437-Loundes County. % 3.8% 5.4% 3,2% 4,1%
Mary Ho lmeg, D 116 116 116 348Jones County, % 1.7% 0% 0% '.6%
Mary Holmes, D 131 139 150 420Washington County, % 17,6% 4.3% 0% 6.9%
Archdiocese of Chicago, D 142 156 101 399Chicago, Ill. . To 5.6% 9% 5% 6.8%
Board of Education, D 269 231 216 716Chicago, Ill. % .7% 4.7% 1.8% 2.4%'
Chicago Boy's Club, D 19 19 19 .57Chicago, III. % 0% 0010 0% 0%
Chicago Fed. of Settlements, D 88 88 88 264Chicago, I-11. % 5.7% 0% 0%. 1.9%
Chicago Youth Ctr. -LEARN, D 78 85 110 273Chicago, Ill. % 14: I% 10.6% 3.6% 8.8%
Episcopal Charities, D 23 23 23 69Chicago, Ill. % 4.4% 4.4% 13.0% 7.2%
Greater St. John AME Church, D 9 9 10 28Chicago, Ill. % 22.2% 22.2% 0% 14.3%
Lutheran Welfare Services, D 40 40 8 88Chicago, Ill. % 2.5% 10.0% 12.5% 6.8%
Marcy-Newberry Association, D 8 8 8 , 24- Chicago, III. % 12.5% 12.5% 12.5% 12.5%
St. Matthew Methodist Church, D 8 8 N/A 16
Chicago, Ill. % 0 0 N/A 0
STEA, Inc. , D 7 21Chicago, Ill. % 57,1% 51.1% 71.4% 61.9%

:7/7
Name of OrganizationPY72
APPENDIX E (21)
PY71 PY70 3-Yr. Av.Stratum A. ,
YWCA of Metropolitan Chicago, D 10 10 10 30Chicago, % 30% 0% 0% 10%
ABC Headstart, Inc. , D 45 45 55 145Los Angeles, Calif. % 8.9% 6.7% 9.1% 8.3%
Child C.are & Dev. Serv. , D 122 121 120 363Los Angeles, Calif. .% ..4.9% 4.1% 0% 3% -.4
Comm. Youth Dev. Agency, D 62 48 47 157Los Angeles, Calif. % 9.7% 12.5% 4.3% 8.9%
Delta Sigma Theta Head Start, D 134 . 136 136 406Los Angeles, Calif.\ .% 2.2% 5.1% 0% 2.5%
Fndn. for Early Childhood Educ. D 104 -102 111 317Los Angeles, Calif. % 1.9% 4.9% 1.8% 2.8%
Frederick Douglass C . D. Ctr. , D 118 118 118 354Los Angeles, Calif. % 7.6% 5.9% 5. 1% 6.2%
Kedran Cmty. Headstart Ctr. , D 63 61 59 183Los Angeles, Calif. % 11.1% .9.8% 6.8% 9.3%
Latin American Civic Assoc. D 134 134 134 402Los Angeles, Calif. cr 1 . 5 % 4.5% 15.7% 10.2%
Los Angeles County School, D 262 250 255 767Los Angeles, Calif. % 8.4% 7.2% 3.5% 6.4%
Parent Child Gdnce. Ctr , D 98 94 95 287Los Angeles, Calif. % 9.2% 3.2% 5.3% 5.9%
..7.
Seattle Public Schools,- D 46 46 46 138Seattle, Wash. % 6.5% 15.2% 6.5% 9.4%
Intermediate School District #1, D 78 71 72 221Seattle, Wash. % 5.1% 1..4% 2.8% 3.1%
Central Area. Motiv'n. Pgm. , D 31 38 38 107Seattle, Wash. % 6.5% 10.5% 13.2% 10.3%
Neighborhood House, D 32 0 0 32Seattle, Wash. % 3.1% 0% 0% 3.1%
Stratum B
Project Head Start, D 64 65 65 194Providence, R.I. % 3,1% 7.7% 15,4% 8.8%

APPENDIX E (22)
Name of OrganizationPY72 PY71 PY70 3-Yr. Av.Stratum B
Alabama Council .on Human Rel. ,D 149 144 142 435telt
Auburn, Ala. % 16.8% 3.5% 15.5% 11.9%. .
Montgomery Co. C A A . D 238 238 238 714Montgomery, Aia. % 7.1% 0% 0% 2.4%
Coahoma Opportunity, D 173 171 174 518Clarksdale. Miss. % .5% 0% 0% .2%
Mississippi Industrial College, D. 3 3 3 9
Holly Springs, Ala. % 0%. 0% 0% 0%
Delta Hills Educational Assoc. D 219 219 219 657Sardis, Miss. % 3.2% 0% 0% 1.1%
;--;,,
Community Service- Assoc., D 174 174 193 541
Jackson, Miss. % 0% 0% 0% 0%
Inst. of Comm. Serv. Rust Coll. D 150 157 167 474Holly Springs, Miss. % 14% 10.2%4: 8.4% 10.8%
Mid-Delta Educ. Assoc. , D 196 196 196 588
7 -Greenville, Miss. % 7.6% 3.1% 2.6% 4.4%
Tri-County Comm. Action D 128 128 128 384Laurinburg, N.C. cp/0 1.6% 0.8% 5.5% 2.6%*ItIndianapolis PS Corp. D 148 '148 148 444Indianapolis, Ind. % 14.8% 5.4% .7% 6.9%
Comm. Rel.Soc.Dev. Comm. , D 5 % 4 4 13
Milwaukee, Wisc. % 0% 0%
Milwaukee Public Schools, D 71 71 71 213
Milwaukee, Wisc. % 0% 1.4% 0% .
Day Care Services for Children, D 34 34 34 102
Milwaukee, Wisc. % 38.2% 26;5% 2.9% 22.6%.
Coalition Head Start, D 59 44 0 103
Milwaukee, Wisc. % 11,9% 11.4% 0% 11.7%
Tri-Parish Progress, D 197 202 199 598Crowley, La. % 5.1% 5.5% 0% 3.5%
Economic Opportunity Fndn. , D 88 87 77 252
Kansas City, Ks. % 0% 5.8% 1.3% 2.4%
Bonner Springs School Dist. #1, D 11 N/A -N/A 11
Bonner Springs, Ks. % 0% N/A N/A 0%

APPENDIX E. (23)
Name of OrganizationStratum B PY72 PY71 PY70
D 333 319 297% 9% 13.8% 17.9%
University of Missouri,Portageville, Mo.
Denver Head Start,Denver, Colo.
Denver Public Schools,Denver, Colo.
Child Opportunity Program Inc. 17Denver, Colo. % 0%
Denver, Colo.
D 9 11 12% 0% 0% 0%
D 117 118 118% .9% 4.3% 13.6%
United for Progress, D 35 35 34% 0% 0% 2.9%
...
Auraria Community Center, D 17 17 , 18at 17.7% 0% 16.7%Denver, Colo. /0
Children's Education Fund D 54 54 54
Denver, Cole). % 1.8% 1.8% 3.7%/0
Council of. Aff'd. Negro Org. Inc. D 21 21 15. 38.1% 19.1% 20.0%Santa Ana, Calif. icti
/.0
Baena Park Lulac,Santa Ana, Calif.
San .Jacinto School District,Riverside, Calif.
Del Ray Day Care,Thermal, Calif.
Corona Norco Head Start,Corona, Calif.
D 7 7 , 7
f',10 14.3% 0%
17 1729.4% 0%
Council for Better Educa. , Inc. , D 13 11 .4 9
Santa Ana, Calif. % 23. 1% 9.1% 0%
Comm. Ctr. Huntington Beach, D 10 10 10
Santa Ana, Calif. % 40% 70% 40%
Alvord Unified School District, D 10 10 10
Riverside, Calif. % 0% 0% 0%
D 19 19 --19% 5.3% 5.3% 10.5%
D 13 11 11
% 15.4% 27.3% 18.2%
D 15 15 15 45.% 13.3 %. 1.3.3% 13.3%
San Beinardino School District, D 31 32 32
San Bernardino, Calif. % 3.3% 9.4% 0%
Fontana Unified School District, D 14 14 14San Bernardino, Calif. . % 57. 1% 0% 14.3%
3-Yr. Av.
94913.4%
320%
3536.3%
519.8%
1041%
5121.8%
162.1... 5 %
5726.3%
214. 8%
35312.1%
30
300%
577%
3520.0%
13..3%
954.2%
42

Name of Organization
APPENDIX E )
Stratum B P172 PY71 PY70 3-Yr. Av.
Rialto Unified School District, D 7 5 5 17
San Bernardino, Calif. % 14.3% 0% 5.9%
Victorville School District, D 15 15 15 45San Bernardino, Calif. % 20% 6.7% 11.1%
. .
Christ Church Head Start, D 13 13 13 39San Bernardino, Calif. % 7.7% 7.7% 0% 5.1%
Stratum C
Worcester School Dept. D 94 90 85 269Worcester, Mass. °A) 19.2% 1,4.4% 9.4% 14.5%
Atlantic Human Resources, D 104 96 94) 294Atlantic City,* N.J. 57) . 5.8% 17.7% 9.6% 10.9%
Moptgomery Co. Public Schools, D 81 78 . 73 .. , 232Rockville, Md. % 4.9% 3.9% 1; 4% 20. 5 To
Shore Up, Inc. D 52 49 48 149Salisbury, Md. % 25% 12.2% 0% 12.8%
Lowndes Co. Bd. of Educ. D 31 31 28 90Haynesville, Ala. % 0% 6.'5% 0% 2.2%
West Lake Cumberland Dev. Cnl. D 44 47 41 132Columbia, Yy. % 11.4% 25.5% 14.6% 17.4%
Lift, Inc. , D 82 69 0 151Tupelo, MisS. % 6. 1% 0% 3,3%
Economic Improvement Council, D 53 21 21 95Edenton, N.C. % '4.8% 14.3% 4.2%
Family Services, Inc. , D 71 75 . 59 205Winston-Salem, N.C. % 9.9% 21.3% 6.8% 13.2%
SCOPE D 158 158 116 . 432Dayton, Ohio % /0 16.5% 7.6% 9.5% 11,3%
E. Missouri Comm. Action D 95 . 95 92 282Flat River, Mo. . % 12.6% 7.4% 6.5% 8.9%
Mo.Ozarks Econ. Oppor. Corp. , D 52 54 54 160Richland, Mo. % 0%
Portland Public Schools, D 52 57 61 170Portland, Ore. % 9.6% 10.5% 11.5% 10.6%

t
Name of Organization .
APPENDIX E (25)
PY72 PY71 PY70 <Stratum C
Tacoma School District, 0 57 58 57Tacoma, Wash. 15.8% 1.,7% 5.3%
Straturn D
York Co. Comm. Action Corp. D 23 28 25Alfred, Me. 010 0% 7.1% 0%
Greater Lawrence C. A.C. , D 27 27 , 19Laurence,. Mass. 22.2% 0% 0%
Cranston Community Action, D 7-tianston, R.I. . % 0%
Sussex Co. C. A.A. , Inc.Georgetown, Del. 3
Dalio
5724.6%
519.8%
380%
Scott County School Board, D 11 11 9Gate City, Va. 9. 1% 9. 1% 0%
Community Improvement Coun. , D 20 20 20
-.3
Danville, Va. 0,/0 5.0% 5.0n .
Mercer Co. Econ.Oppor. Coun. D 25 24 27-Bluefield, W.Va. % 0% 8.3% (P.
Upper Ocmulgee EOC, Inc. D 13 13 1.1Jackson, Ga. (7,70 0% 15.4% 0%
Anderson Co. School District, D 8 8Clinton, Tenn. 50
,80% -0% 0%
I Care, Inc.. D k 6 6 6Statesville, N.C. % 0% 0% 0%
Nlooresville Public Schools, D 2 2Mooresville, N.C. t o 0% . 0%
Garrett-Keyser-Butler S1. Dist. D 3 3 3Garrett, Ind. % 0% 0% 0%
Muskegon Oceava CAAP, D 3 1 N/AMuskegon, Mich. 0% -0% N/A
Muskegon Public Schools, 13 26 .19 27Muskegon, Mich. % 0% 0% 0%
Coshocton County Ileadstart, D 10 ;10 NMCoshocton, Ohio % 0% N/A
Av;orinlwMs
-.1727.6%
762.6%
738.2%
410%
14613.0%.
316.5%
603.3%
76
375.4%
240%
180%
60"ro
9on
4
720%
200%
, .,...,., . . . . r- ,

wy
1
:4
Xame of rganizationStratum D
Kaiiv-z;trtg Day tare,Mt. Vernon. Ohio
Delta Comm,. Action Fruln.,Duncan. Okla,
Kountze Ind. Sc:hool Distpct.Kountze, Tex.
--fftfimpson School Dist,. R11,1,1,1:01alid, Colo.
Vh
1)
17,)
PY72
APPENDIX Ei(261.
rPY71 - 1 70
t w.
tis
Av;-
15Q
1915,
-
f1=!'6
14 483074
D 18 18 18 - 54'':''`o 06.7) On 0'-',7. 0''',3
r
1) 4 3 NIA 7Ito 0% .-:,0% NIA . On ,.
D 9 9 9 27'L, 11,1'770, 0% 0% ... 3 761:)
D. 20 19 17 56
I. 0`., 0 To 0".1J

z_L w
-7
. .
'1 I t .1 1.
Iii
Its 7-.; 1 I t. NE I .1
It I% 1.11 1
iNcrtrAcri:r.
A ( ....411. :22. ft,..21..aft At;11:;tti,t.-N t ( 2', tyr
" t-:1;1 41,14:,,.- eic.:;krit trt: Cr:,0.1t.N, I .
; ( it,. 1%4Lp! ;;., f ...! !t..::
t'u ,41 C-.-ro try S. 1,.. 4:
!tC!!'-! 23,r1;' ., !!!:. _
.19%.
( 1:iu,r./.p_z.,, ()!..1,. Ora!
r t t t
:2 .1 t 7-I 11
I
!s! Tit!. l't
;. 13 r c. IX
;t 1 C tile .
. .
C' rcrItitce: ('"-re-munts, tt?^. (r%411.4(11(n. 14 t0.. i'3+. C jI .
a
APPI:tii/iN (.!7)

PHmili A .11.`-+ Sfi)1k ING STA I ISTICALIASIGNIFICANT PR() MOTION TRENDS
INCREASING
Fnzti.! 1:annw.4 kastitligt..1... I). f'.1):I.:.. 7: .1.-tt..n
.tr 1 - t t C Ion LoS Anevie.s,
'I \ rt-d
. ` : 1 % ! ' . ! ' . . . AL nit!: AgetICy,4. A II' : Its. Intilanart,11,,C. .:.. 1I.-..1. r)*:t.'14.;-1 VrIt 15/0,11. %Ilk% aukrr, 1t
t'ouncti. Santa Ana, Cala.v. I . IL ?:1 .t San fiernurcitno,
;1? 1 rt.
S:11.1. 1 p.:414% Ltelofra, WaStl.
S i HA I 1 :.1
Gr-.1,,t I :t..% ren.. .,-tton Corpnrattta;, I.a%% rent e,Agt.r.(., Inc. , GA`ot.e440An. Del.
t Do; eito:.ent. Gate tits:, Vit.1.4,volan!!, c(.10.
1)Et'R.EASING
:=0. .i ? , N. .1.
r I. 4'. 1.1,% fst e', N.I.1). ita A : ..t. i . tsr-.1% "rtitq:. 14-rtagevillt,
LI' ).!-1..,1-,
S I it \
tf,
Edentmi, N.C.
APPF:NDIX E (28)