Embed Size (px)
Citation preview

DOCUMENT RESUME
ED 050 332 AC 010 320
TITLE An Evaluation of Adult Basic Education in the Stateof New York.
INSTITUTION Research & Technology Corp., Inc., Bethesda, Md.SPONS AGENCY New York State Education Dept. , Albany. Div. of
Continuing Education.PUB DATE [70]NOTE 237".
EDRS PRICE EDRS Price MF-$0.65 HC-$9.87DESCRIPTORS *Adult basic Education, *Continuing Education.
Centers, *Educational Objectives, *ProgramEvaluation, *Student Characteristics
IDENTIFIEPS New York
ABSTRACTSelected aspects of the Adult Basic Education
Program of the State of New York are evaluated, and the program'seffectiveaass in providing basic education that is suite to thecapabilities, problems, interests, and needs of the adultparticipants is assessed. The evaluation and assessment are presentedin three parts: Part I provides; the setting for the study;establishes the parameters; describes the research design; andhighlights the findings, conclusions, and recommendations; Part IIconsists of a description an analysis of the prog7an in terms of thestudents, their characteristics, and factors related to their successor achievement; and Part III provides a current description andanalysis of the program in the areas of instruction and inr,truclionaltechnology, methods and materials, ase of human and physicalresources, program development and coordination, management andsupervision, and staff development. (Author/DB)

U S DEPIRTMEN1 Of HEWN 10110110N & WELFARE
Of/ICE 011011(1110N
%IS El OrUI4Ellf MIS BEEN REPRODUCE) EPICIV IS REGIVR (ROM 1HE
PERSON OR On/NI/CAI ORIGINIIING 11 POINTS Of VOW OR OPINIONS
SEATED DO NOINEUSSIROT REPRISE MT Of FICILE OIFICE Of EDUCVION
POsIlION DR POLICY

re%
pr\
OC)Lc,
LLJ AN EVALUATION OF ADULT BASIC EDUCATION
IN THE
STATE OF NEW YORK
Conducted forThe Division of Continuing Education
State Education DepartmentThe University of the State of New York
Evaluation ConsJltants:
George F. AkerErnestine B. BoclairCharles Divita, Jr.McKinley C. MartinJules PaganoToni A. PowellWayne L. SchroederVida E. Stanius
Cy
RESEARCH & TECHNOLOGY CORPORATION, INC.5711 Wilson Lane
Bethesda) Maryland
2

LIST OF TABLES
TABLE OF CONTENTS
Pageiv
LIST OF ILLUSTRATIONS vi
PART I
SCOPE OF THE EVALUATION
Chapter
I. INTRODUCTION 1
II. BACKGROUND AND PURPOSE 7
III. EVALUATION DESIGN 11
PART II
PROFILE OF ADULT BASIC EDUCATION INTHE STATE OF NEW YORK
I. INTRODUCTION 13
II. PRESENTATION OF DATA 18
III. SUMMARY, CONCLUSIONS AND RECOMMENDATIONS 103
PART III
ABE IN THE BIG 10 CITIES-1970-71
I. BACKGROUND 115
II. ADMINISTRATION AND MANAGEMENT 121
III. RECRUITMENT 125
IV. ATTENDANCE AND DROPOUT 128
V. COUNSELING AND GUIDANCE 131
VI. INSTRUCTION AND CURRICULUM 135
VII. FACILITIES 142
11

TABLE OF CONTENTS.--Continued
Chapter Page
VIII. MATERIALS AND EQUIPMENT 145
IX. LEARNING LABS 149
APPENDIX 151
iii

LIST OF TABLES
Table Page
I. Number of Students Registered by ClassLevel 152
II. Age Range of Students 153
Sex 155
IV. Race of Enrollees 156
V. Race vs Sex 157
VI, Marital Status 159
VII. Children at Home 160
VIII. Citizenship 161
IX. Language Spoken in the Home . 162
X. Citizenship by Class Jevel 163
XI. Percentage of Each Class Level, White,Black, or Oth.r 167
XII. Percentage of Each Racfal CategoryEnrolled in Various Class Levels . . 170
XIII. Number of Years of Previous Schooling . . 171
XIV. Number of Years Previous Schooling vsAge 172
XV. Number of Years Previous SchoolingCompleted, by Sex 177
XVI. Number of Years Previous SchoolingCompleted by Various CitizenshipCategories 179
XVII. Number of Years Previous Schooling vsClass Level 183
XVIII. Number of Years of Previous Schoolingby Race 188
iv
LIST OF TABLES.--Continued
Table Page
XIX. Geographic Area Where Schooling wasCompleted 191
XX. Students Ever Gainfully Employed 192
XXI. Students Ever Gainfully Employed vsNumber of Years of Previous Schooling. . 193
XXII. Students ever Gainfully Employed vs Race. 196
XXIII. Date Last Employed by those Ever GainfullyEmployed 197
XXIV. Present Occupation 199
XXV. Summary of Students Completing, NotCompleting and Recycling in the Program. 201
XXVI. Reasons for nct Completing Program. . . . 202
XXVII. Attendance (1st 100 Hours) 203
XXVIII. Attendance (1st 100 Hours) by Sex . . 204
XXIX. Attendance (1st 100 Hours) vs Years ofPrevious Schooling 206
XXX. Reading Growth After First 100Instructional Hour Perioa 211
XXXI. Reading Growth (1st 100 Hours) vs Age . 212
XXXII. Reading Growth vs Sex (1st 100 Hours) . 214
XXXIIT. Reading Growth (1st 100 Hours) in gradeLevels vs Various Years of PreviousSchooling 215
XXXIV. Reading Growth (1st 100 Hours) vsAttendance (1st 100 Hours) 218
XXXV. Reading Level (1st 100 hours) vs ClassLevel 220
XXXVI. Reading Growth vs Arithmetic Growth . . 223
v
6
Chart
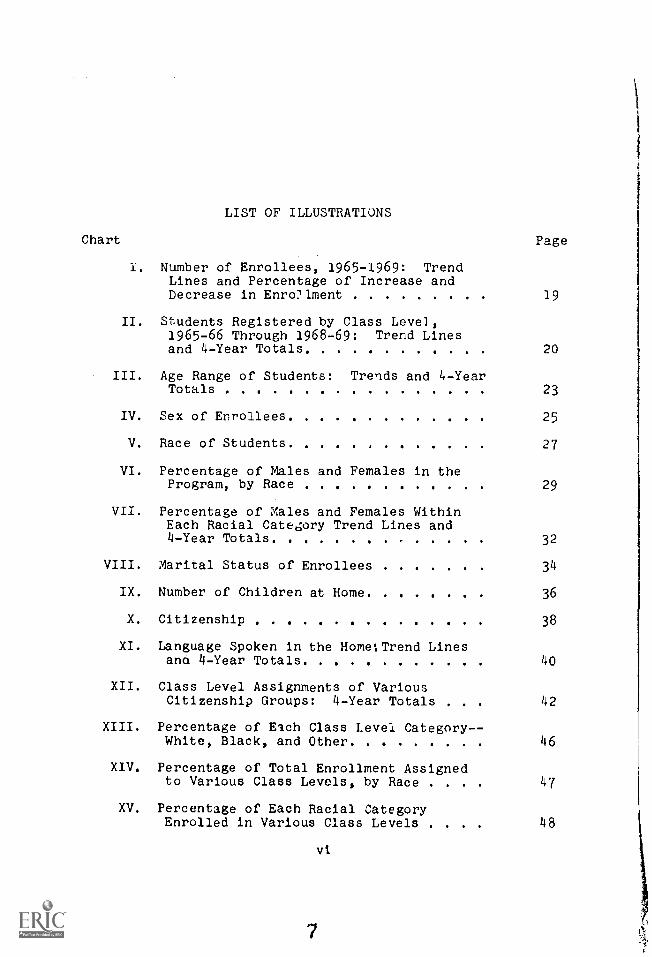
LIST OF ILLUSTRATIONS
Page
1. Number of Enrollees, 1965-1969: TrendLines and Percentage of Increase andDecrease in Enrollment 19
II. Students Registered by Class Level,1965-66 Through 1968-69: Trend Linesand 4-Year Totals 20
III. Age Range of Students: Trends and 4-YearTotals 23
IV. Sex of Enrollees 25
V. Race of Students 27
VI. Percentage of Males and Females in theProgram, by Race 29
VII. Percentage of Males and Females WithinEach Racial Category Trend Lines and4-Year Totals 32
VIII. Marital Status of Enrollees 34
IX. Number of Children at Home 36
X. Citizenship 38
XI. Language Spoken in the Home:Trend Linesaria 4-Year Totals 40
XII. Class Level Assignments of VariousCitizenship Groups: 4-Year Totals . . 42
XIII. Percentage of Each Class Level Category- -White, Black, and Other 46
XIV. Percentage of Total Enrollment Assignedto Various Class Levels, by Race . . . . 47
XV. Percentage of Each Racial CategoryEnrolled in Various Class Levels . . . . 48
vt
7

LIST OF ILLUSTRATIONS.--Contirued
Chart Page
XVI. Number of Years Previous Schooling. . 51
XVII. Years of Previous Schooling vs Age. . . 53
XVIII. Years of Previous Schooling vs Sex. . 55
XIX. Years of Previous Schooling vs Citizenship 58
XX. Number of Years Previous School Completedby Enron.eesin Various Class Levels. . . 61
XXI. Number Years Previous Schooling vs Race . 63
XXII. Geographic Areas Where Schooling wasCompleted 65
XXIII. Proportion of Students Ever GainfullyEmployed:Trend Lines 66
XXIV. Gainful Employment vs Years of PreviousSchooling 68
XXV. Gainful Employment vs Race 69
XXVI. Occupation of Enrollee' 72
XXVII. Students Completing, Not Completingand Recycling: Trend Lines and 4-YearTotals 73
XXVIII. Reasons for Not Completing Program. . . 75
XXIX. Attendance (1st 100 Hours): Trend Linesand 4-Year Totals ... 78
XXX. Attendance (1st 100 Hours) vs Sex . . . 80
XXXI. Attendance (1st 1U0 Hours) vs Years ofPrevious Schooling 84
XXXII. Reading Growth After 1st 100 InstructionalHours: Trend Lines and 4-Year Totals. . 88
XXXIII. Reading Growth (1st 100 Hours) vs Age . . 90
XXXIV. Reading Growth (1st 100 Hours) vs Sex . . 92
vii

Chart
LIST OF ILLUSTRATIONS.--Continued
Page
XXXV. Reading Growth in Grade Levels vs Yearsof Previous Schooling 95
XXXVI. Reading Growth (1st 100 Hours) vsAttendance 97
XXXVII. Reading Growth (1st 100 Hours) vs ClassTotal 99
XXXVIII. Reading Growth (1st 100 Hours) vsArithmetic Growth (1st 100 Hours) . . 101
viii.
9

PREFACE
Now that the evaluation report is in its final form,the members of the evaluation team wish to express theirappreciation to the State staff, the local directors andsupervisors, the ABE counselors and teachers, and the manystudents who contributed their time, energy and experienceto make this study possible.
Without exception, we found the personnel responsiblefor ABE to be open, forthright and sincere in their desireto help us take a "hard" look at the quality and effectivenessof their programs. In turn we have made every possibleattempt to maintain the rigor, discipline, and objectivityrequired to provide an impartial examination and appraisalof the program.
Reliable and valid social sure- ?y procedures werefollowed in all phases of data collection, and the analysisand interpretation of hard data were undertaken by staffmembers who remained detached from the observational andinterview aspects of the study. Consequently, we beli.evethat the following report presents an impartial and unbiasedview, that it accurately reflects the strengths as well asthe weaknesses of the overall program, and that it providesa knowledge base for improving and strengthening Adult BasicEducation in the State of New York.
We are especially appreciative of the helpful andcooperative effcl-ts by Monroe C. Neff, Director of theDivision of Continuing Education; Alfred T. Houghton, Chief;and Neil Carr, Acting Chief of the Bureau of Basic ContinuingEducation; Joseph Winfrey, Coordinator of Federal Adult BasicEducation. New York City; James Warren, Director of WelfareBasic Education, New York City; Mrs. Gladys Alesi, Director,WIN, New York City; and the following Directors and/oCoordinators of Adult Basic Education:
Mrs. Doris Moss, New York City; Mrs. Joan O'Gorman,Yonkers; Edwin Agresta, Schenectady; Garrett 11"rphy,Albany; Jerry Franciosa, Niagara Falls; Jerry Yavno,Buffalo; Bill Jacques, Syracuse; Elliott Lethbridge,White Plains; Don Montano, Utica; and Miss JuneRousseau, Rochester.
ix
10

PART I
SCOPE OF THE EVALUATION
11

CHAPTER I
INTRODUCTION
This report is presented in three parts. Part Iprovides the setting for the study, establishes the parameters,describes the research design and highlights the findings,conclusions, and recommendations.
Part II consists of a description and analysis of theprogram in terms of the r'udents, their characteristics, andfactors related to their -uccess or achievement. This phaseof the study was conducted primarily to establish base linedata and to identify trends and changes which have occurredover a four-year time span.
Part III provides a current description and analysisof the program in tne areas of instruction and instructionaltechnology, method3 and materials, use human and physicalresources, program development and coordination, managementand supervision, and staff development.
Results
Following are the highlights cf the study in termsof strengths, areas for improvement, innovations, andrecommendations.
Strengths
1. Lxceptinnally dedicated, enthusiast.ic, and pro-fesionally competent staff at all le"els of operation.
2. Target audience is being reached in terms of lowlevel jobs held by or unemployment among participants.
3. Excellent coordination of related community servicesand reciprocal referral practices--particularly inthe larger centrally-located facilities.
4. An increase over the past five years in rate ofcompletion among participants and a decrease in therate of dropout. In other words the overall program is
1
12

2
increasing in effectiveness in terms of highercompletion and lower dropout.
5. A large majority of students who drop out do sofor non-program related reasons.
6. ABE programs as they now operate offer a greatdeal in terms of academic achievement for thosewho participate on a regular basis. There hasbeen a slight increase in rate of growth (two gradelevels or more) per 100 hours of instruction overthe past four years.
7. The adoption and implementation of learning labshas enhanced the effectiveness of the programin terms of attendance and rate of lear61.2:.
8. The trend toward the employment of full-timeadministrators, teachers and aides has measurablyincreased program effectiveness in the eoeas ofrecruitment, attendance, dropout and st,!dentachievement.
9. Nearly all programs have high levels of individualizedinstruction.
'.0. The expanding practice of employing former :studentsand neighborhood residents as paraprofessionalsand of seeking greater ethnic and racial represen-tation among the professional staff la.s sreatlyinproved the practice, quality, and relevanc.ofABE in the larger programs.
Areas for Improvement
1. There is a definite trend toward lower enrollmentsand unless funding levels are increased this trend
likely to intensify.
2. The program enrolls a disproportionately highnumber of females in each racial and ethnic group.This disparity is a serious one particularlyamong Blacks.
3. There is a tl,end toward declining participationamong those at the lowest educational level, i.e.,sixth grade level end telow.
4. There is a trend toward declining daily attendancein the overall program.
131

3
5. Local directors and coordinators are frequentlyoverworked, unnecessarily bur:,.enc-1 administra-tive trivia and antiquated buk.,geting requirements.They also suffer from lack of adequate officeassistance, evipment and space.
6. Counseling resources are in short supply and mostprograms suffer because of inadequate number offull-time, trained staff in this area.
7. Outreach centers are generally poorly equipped andinadequate in terms of facilities. They aredecreasing in nyber which further restricts theprogram in terms of serving the lowest educationaland income levels.
8. Child-centered and non-adult materials are stillbeing overly used in certain programs.
9. A few programs are stetfed without regard toethnic or racial representation from the instruc-tional and paraprofessional levels through theadministrative level.
10. Generally, the curriculum (although highly indi-vidualized in terms of learning methods andmaterials) is not relevant or pertinent to thepressing problems and needs of the adult learners,i.e., there is too much emphasis on academicsor on subject matter for its own sake.
The quality of equipment, materials, facilitiesand instruction is usually inversely related todistance from the central facility. In other words,the closer programs are located to staff headquartersor central learning labs, th7, more likely they areto be adequate in these terms.
12. Smaller programs operated by part-time staff haveserious enrollment and attendance problems.
13. The collection and condensation of test scorespurporting to measure reading comprehension,vocabulary development, and numerical abilityraises serious questions about the validity of theoverall achievement data developed at the statelevel.
14,

4
Innovations
1. Extremly effective use of student government andadvisory committees to facilitate policy making,evaluating teacher competence, maintaining morale,recruiting, follow-through and as a device forteaching and practice in social and interpersonalresponsibilities.
2. Contributions to the orientation and in-servicedevelopment of social wo:okers by the ABE administra-tive staff to establish more viable linkages betweenwelfare and ABE with the individual student as thefocal point of concern.
3. Providing office and counseling space for EmploymentAgency personnel within the ABE center to facilitaterealistic and effective occupational counseling andjob placement or upgrading.
4. Effective use of group counseling as a part of theinstructional process to reduce alienation, developself-concepts and acquire the skills of democraticleadership.
5. The establishment of a readily accessible taxonomyof useful and relevant ABE materials classified bysubject matter, cognitive complexities and interestor problem areas.
6. The practice of selecting teachers on the basil. ofprobability of success in ABE and then giving thema trial period or pre-employment overview beforecommitting them to the prog..,am.
7. The establishment of effective and relevant ABEprograms in institutions such as county jails,hospitals, industrial organizations, etc.
Recommendations
In view of the foregoing overview of strengths,weaknesses, and innovations the following recommendationsare offered for improving various elements in ABE as itpresently operates through Title III programs in the Stateof New York. (More specific suggestions for program improve-ment are made in the text of the report in Parts II and III.)
15

5
1. That increased funding be sought and more effortsdirected toward combining various types of ABEprograms which are now in operation.
2. That efforts be mace to employ more staff on afull-time basis, that each city have a full-timecoordinator, and that more resources be directedt')ward the work overload facing local administrators.
3. That the areas of innovations identified and describedin this report be implemented throughout the entire
system.
4. That new, cree.tive and intensive efforts be madeto recruit more males (especially those of minoritygroups) and lower educational level participants.
5. That more reality-centered and adult problem orientedcurricula be established to further the goals ofJ)E and to increase rates of attendance.
6. That dropouts be redefined to include only thosewho leave for program related reasons, i.e.,dissatisfaction, failure experience, low motivation,etc.
7. That programs be evaluated and designed on thebasis of behavioral changes (practical skills)sought among the participants rather than onchild-centered models of grade level gain, subjectmatter learned, etc.
8. That teachers be given intensive in-service trainingto enhance their competence in using a wide rangeof adult education methods designed to functionalizelearning around tie interests, problems, needs andwants of the learners.
9. That resources, when available, be directed towardestablishing mini-labs and mcfe outreach centers.
10. That programs of ABE in institutions (jails, hospi-tals, industries, etc.) be expanded.
11. That action research be undertaken to better adaptABE materials and practices to the rapidly expandingprograms for non-English speaking adults.
12. That all programs begin or expand the use of studentand community advisory committees and neighborhoodrecruiters to reverse the trend toward decliningenrollments.
16,

6
13. That informal inventories be used more frequentlyin assessing student abilities and in making decisionson placement. That standardized achievement testsbe restricted for the purpose of establis:11Ing groupgains or norms, and that uniform testing proceduresbe established throughout the state system.
14. That lea, ling lab and classroom activities be moresystemati,;ally and effectively coordinated toachieve greater continuity in student activitiesand performance.
15. That the administration of ABE convey to all inter-ested parties that present ABE programs are muchmore effective than past or present childhoodeducation programs in terms of motivation to parti-cipate, motivation to learn, holding per andrate of learning. It is not suggested that thesepoints be made to demonstrate superiority ofperformance, but to indicate that innovations anddiscrweries are being made in ABE which have ma'uyimplications for improving the education cf childrenand youth.

CHAPTER II
BACKGROUND AND PURPOSE
Adult Basic Education represents this nation'sgreatest single experiment in adult edunation. Unprecedentedsums (for adult education at least) have been appropriatedto numerous federal agencies for the basic education ofunder-educated,under-employed, and otherwise disadvantagedadults. The urgent and critical need for expanded, realitycentered, effective adult basic education programs is amplydocumented by Congressional Record, Reports of NationalAdvisory Committees, the decay of our central cities, thespread of rural slums, the shortage of highly skilled man-power, the 13 million adults who cannot effectively read anewspaper, and the more than 24 million American adults whofunction below the eighth grade ability levels
Basic education essential to a productive and respon-sible citizenry must provide and build ucon the literacyand learning skills of reading, writing, computation,effective oral communication, and the skills of criticalthinking. As the participant acquires the foregoing compe-tencies he needs opportunities to acquire the essentia:knowledge and skills for competence as worker, parent, con-sumer, manager of resources and responsible citizen.
The U. S. Office of Education has been given a primeresponsftollity for engaging the poor, the alienated, theeducati)nally and socially disadvantaged in significantlearning experiences which will lead to meaningful employ-ment, positive self concepts, enhanced information processingcapacities and increased intellectual, social, family,personal, and civic competence. To fulfill this responsibility,the Office of Education has implemented action programs inthe 50 states and territories and established a variety ofspecial demonstration projects in ABE. To date less thanten per cent of the target audience has been reached bythese programs.
Although some form of adult basic education has beenongoing for over 100 years, its phenomenal growth nationwidein the past five years was activated by a belated recogni-tion that functional illiteracy was widespread, that it wasinexorably linked with *poverty, and that it was a majorimpediment to the social and economic well-being of thedisadvantaged. The continuous evaporation of unskilled jobcategories requiring minimal educational preparation alsoadded to the difficulties of the disadvantaged. Recognitionof these factors led to Federal funding of adult basiceducation through programs under the auspices of the Officeof Economic Opportunity, the U. S. Office of Education,and tile Department of Labor.
7
18,

8
It was perceived that upgrading of reading, computa-tional, and other social living skills was necessary if theadult illiterates were to be moved out of dependency orunderemployment into satisfactory income-producing employment.In fact, there was fairly universal agreement that a frontalattack on functional illiteracy was necessary, but manyquestions arose when large ABE programs were about to beimplemented. Who was prepared to teach, administer, andsupervise ABE? What kinds of curricula and materials shouldbe utilized? What kind of testing program would he valid?Where should classes be held and for how long? How shouldthe programs be organized; what kinds of controls, structures,and communication mechanisms were needed? How could disad-vantaged adults be recruited and their continuous attendancebe assured? Whac kinds of linkages were needed with com-munity organizations for supportive services and with serviceonanizations for basic needs?
It was found at the onset of these programs that alarge proportion of this target population was differentfrom that involved traditionally in adult education andAmericanization programs. They were not immigrants eagerto learn a new language, or highly motivated workers attendingnight school to upgrade their skills, nor were they highschool dropouts seeking a few credits to meet college entrancerequirements. They represented the unemployed or under-employed, the welfare recipient, and the disillusioned highschool dropout and the socially alienated members of "ociety.They were largely native born, undereducated, underskilled,and many were recent migrants from agricultural communitiesto our urban centers. They also represented a large groupfrom an ethnic minority, poorly motivated, disorganized,who did not respond very well to recruitment via mass mediachannels. Most were found to be several years behind inbasic education skills.
It was learned that various traditional teachingmethods and materials were not applicable to this population.It was also discovered that a whole gamut of supportiveservices had to be extended to the students to enable themto attend and maintain attendance in classes. Furthermore,it was found that the standardized testing instrumentsdeveloped for public school children did not accuratelyreflect their achievement levels or progress. Cognitivegaps, visual and perceptual difficulties, fear of failureand testing, and cultural differences were impediments toachievement on standardized instruments. These also mili-tated against them when they applied for jobs in the privateor public sector, or for apprenticeship or MDT training slotswhere screening and testing was mandated; they were invariablyscreened out.
19 °L

9
These and other significant findings challengedthe thinking of adult educators. They led, i.n varyingdegrees, to the development and use of new materials, bothprogrammed and semiprogrammed; to the use of new educationalhardware and visual aids, to a search for new instrumentsfor testing and diagnosis, to new patterns of classroomgrouping and individualized approaches to instruction; tothe recruitment and utilization of paraprofessionals; tothe emphasis on preservice and inservice trainirg of ABEinstructors and supervisory personnel on national, Stateand local levels; and to the evaluation and revision ofprogram structure.
To what degiee this challenge has been met in theState of New York by the adult basic education programs ofthe State Education Department becomes a valid subject ofinquiry based on two important and logical premises:
1. The Division of Adult Education Programs of theU.S. Office of Education has mandated that statewideevaluation!, of ABE programs be undertaken.
2. The Division of Continuing Education in the StateEducation Department of New York has a proprietaryinterest in assessing how the funds with which ithas been entrusted have been used, how its programguidelines have been implemented, and the impactthe various programs have had upon participants.
The purpose of this study is to evaluate selectedaspects of the Adult Basic Education program in the Stateof New York and assess its effectiveness in deliveringmeaningful basic education suited to the capabilities,problems, interests, and needs of the adult participants.
The scope of the evaluation will encompass programeffectiveness at state and local levels as reflected inthe achievement of program objectives and the effectivenessof the means used to accomplish these objectives.
In terms of outcome it is anticipated that theevaluation will contribute to:
1. Identifying strengths and weaknesses in the program
2. Improving the quality of the program throughrational and constructive change
3. Providing data pertinent to educational accountability
20

10
4. Providing a basis for improved in-service trainingactivities
5. Establishing base line data for ongoing assessmentsand future evaluations
6. A more useful theory of and improved practice inadult education
7. Informing participatns, staff and the general publicabout ABE in New York
21.

CHAPTER III
EuALUATION DESIGN
The evaluation was designed to provide data for adescriptive analysis to measure the "state of the art" inABE in terms of efficiency, effectiveness, strengths andweaknesses, and accomplishment of objectives.
The design provided for the acquisition on both hardand soft data and an analysis of these data in terms of pro-c'sses employed (means) and objectives achieved (ends).
The evaluation called for a longitudinal as well asa cross-sectional design to identify trends as well asexamine "in depth" the current status of the program.
In the longitudinal phase of the study the populationwas defined as the total Title III ABE enrollment in theState of New York from 1965 through 1969. Since total popu-lation figures were used in this phase of the evaluation,sampling statistics were not employed. It was assumed thatany differences found within the population were real andnot attributable to chance or sampling error. The data thusobtained were organized to yield demographic profiles ofparticipants, to identify relationships between selectedparticipant characteristics and program success (defined interms of student achievement and persistance of attendance)and to describe trends emerging over a time span of h years.
In the cross-sectional phase of the study the popu-lation was defined as the total AEE program (Title III,Welfare Education, and WIN) in 10 major urban areas. S.rati-fied samples of this population were studied in each of thetype, and location, i.e., location (central city vs outreachor extension center-day vs evenin ), type of facility(learning lab, public school, store front, community center,business-industrial complex, hospital, prison, etc.), type
2S
11

12
of program (Title III, Welfare WIN, combination) (ABE, ESL,combination).
The 10 citier representing the universe of the cross-sectional population included: New York City, Yonkers,Schenectady, Albany, Niagara Falls, Buffalo, Syracuse, WhitePlains, Utica, and Rochester.
Data collection procedures were based upon a casestudy approach in each of the 10 cities through semi-structural interviews with program directors, supervisors,instructional personnel, participants, and selected personnelin cooperating or related agencies or programs. In additionto personal and group interviews, systematic observationswere made at each site and recorded on semi-structuredobservational forms.
Observation and interv'.ew team members were wellprepared in relation to maintenance of objectivity,observance of confidentiality, and similar qualities crucialto the reliable collection of objective as well as subjectivedata.
The Director (and later the Acting Director) ofthe Bureau of Basic Continuing Education, the supervisingand specialist staff of the Bureau and the Big 1C CityDirectors were consulted a:1d involved in developing the evalua-tion in terms of its rationale, purnose, scope and procedures.The process and practice of involving those who have immediateand direct administrative responsibilities for the programproved invaluable in providing information needed to increasethe practical value of the study.
At the suggestion of the state staff and localdirectors, considerable time was given to translating obser-vations of student and teacher activities into a conceptualframework and preliminary instrumentation for future evalua-tion of ABE in terms of changes in student behaviors andattainment of quantifiable adult proficiency .-vets ratherthan upon the child centered concept of grade level advance-ment. The instruments growing out of this aspect of theevaluation are being modified for field testing so thatmeasures of success in ABE can be charted on the basis ofadult competence, proficiency, and effectiveness in thefollowing areas: intellectual and learning skills, acquisi-tion of elementary or OED certificates, job placement andretention, reduction or elimination of dependency, enrollmentin occupational training for which one was previously unquali-fied, employment up-grading, and meeting of adultresponsibilities.
23

PART II
PROFILE 01? ADULT BASIC EDUCATION IN
THE STATE OF NEW YORK
24 ...

CHAPTER I
INTRODUCTION
I. Background of the Problem
Since the initiation of the federally :unded Adult
Basic Education (ABE) program in 1964, more than one million
adults with less than an equivalent of 8 years of formal
schooling have been involved in the program nationwide.
However, in spite of this rather impressive figure, it repre-
sents only about one-eighth of the total number of adults in
this country, 18 years of age or older, with less than, four
years of formal schooling; 1/24 of those adults with less
than 8 years of schooling; and only about 1/50 of those
adults with less than a high school education. In essence,
the task of meeting the educational needs of the under-
educated adults remains an overwhelming one.
In addition to the magnitude of the present problem
of adult undereducation, there are many indications that it
may become greater. Each year, more than one million youths
in this country leave school prior to high school completion.
In an age which increasing demands of high level of education,
these youths too often join those millions of other adults
whose educational deficiencies greatly preclude their
13
25

14
chances for happiness and success in today's highly literate
and highly technological society.
The challenge of meeting the educational needs of
undereducated adults in this country is truly greater today
than ever before. Imaginative educational programs, new
curricula, different institutional forms, innovative
teaching strategies and techniques will have.tu be developed
if this challenge is to be met. Commensurate with such edu-
Jatienal developmen's, must come creative legislation and a
level of funding which will enable such developments to
become realities. In short, the problem of adult under-
education is a concern of all--the educator, the legislator,
the employer, and the citizen; but more Importantly, its
alleviation is a reaponsibility of all. 'No one segment
of society, working alone, can ever hope to solve the problem;
only a well coordinated, united effort on the part of many
groups can succeed. The task of eradicating illiteracy and
functionally illiteracy in this country will be a long and
difficult one. The ABE program has made a beginning toward
the achievement of this goal and that, in itself, is
significant, but not sufficient.
T study contained herein was founded on the belief
that information is essential to the development of the more
effective and relevant prograMS of adult basic education
referred to above. While this report by no means totally
satisfies such an information need, it does contribute a
26

15
great deal of data on certain highly crucial aspects of the
program. For this reason, the present study is expected to
be of considerable assistance to many of the population
segments noted earlier. To state and local level administra-
tors end to teachers and other ABE practitioners, it offers
data vital co program planning, program improvement, and
program evaluation. To the greater educational community
and to concerned private citizens, it offers information
needed to orient such persons about the ABE program and
how they night more effectively relate to it. To state
and federal lawmakers it offers descriptive data necessary
for the wise enactment of legislation affecting the adult
basic education program and subsequently affecting the lives
of millions of undereducated adults in the State of New York
and the nation.
II. Source of Data
Surprisingly enough, in spite of its seven-year old
existence as a federally funded effort, data on ABE programs
are particularly sparce and have, for the most part, been
collected on a rather sporadic and unsystematic basis.
One of the major exceptions to this information deficiency
is the ABE program administrated by the Bureau of Basic
Continuing Education of the New York State Education
Department.
Since 1965, the Bureau has collected data on program
enrollees at entry and at regular intervals during their
27

16
participation in the program. These data have been transferred
to computer cards and subsequently "filed" on magnetic tapes.
The first visible and formal use of these data was a two-
year report published in 1967 by the Bureau. This document
proved to be exceedingly valuable to the Bureau staff. The
present study was an effort to incorporate the findings of
this two-year study with both similar and additioaal data
which have been collected over a fo'.r -year pdhod--from
1965-66 through 1968-69.
III. Purpose of the Study
The purpose of this study was to synthesize, analyze,
and report data on students enrolled in the Title III, Adult
Basic Education program in the State of New York from
1965-66 through 1968-69. Specific intents o: this study
were as follows:
1. To describe the personal characteristics of personswho participated in the program during the four-year period studied
2. To determine enrollment trends or pat.erns fromthese data
3. To examine certain aspects of program performancefor the four-year period, 1965-66 through 1968-69
,4. Rio provide "bench mark" data or established norms'
on key variables which can be utilized in subsequent. ,
Aviauatioria to assess Program c.:ange, etfibieneyi"effectiveness and directions.
t

17
IV. Methodological Note
Readers of this report have been provided with three
means of obtaining the information contained herein. These
are as follows:
1. Tables.--The appendix of this report contains all thetables produced as a.result of "pulling" selecteddata off computer printouts. These tables providedetailed, year to year information on a host oftopics and should be of particular importance tothooe seeking very specific and very detailedinformation.
2. Charts.--From each table in the appendix, at leastone chart was developed and presented in Chapter II.Those charts provide for a visual interpretation ofthe tabled data. The charts consist of
(a) bar graphs which show the four-year totals fora given item of information; or
(b) line graphs which reflect trends over thefour-year period studied; or
(c) both line graphs and bar graphs.
Since the charts were developed by using percen-tages, readers are re:erred to the "backup"tabled data when specific numbers are desired.Persons desiring a moderately detailed "picture"of certain program elements (particularly trends)should find these charts extremely valuable.
3. Text.--A text has been provided which describedthe information and implications of the data shownvisually in the charts. Sometimes the text has beenused to provide for a description of both the dat-.reflected in charts and the "backup" tabled data.

CHAPTER II
PRESENTATION OF DATA
I. Program Description: 1965-66 through1968-69
Total Enrollment
During 1965-66, entry data were collected from
6,734 persons enrolled in the title III ABE program in the
State of New York. tBy 1966-07 enrollment increased by
71.23% and stood at 11,531 persons. :However, since the
time of that drastic increase,. enrollments have steadily
declined. By 1967-68, enrollment fell. to.0,571 students.
One year later (1968769), the nuuber of enrollees declined
to 7,116. The 1967-68 and 1968-69 enrollment figures repre-
sent a decrease of 25.67% and 38.28%, respectively, in the
1966-67 enrollment. Thenumber.ul: ehrollees.from 1965-66
through 1968-69, alohg with the percent of increase and
decrease in enrollMent for this period, is depicted in- J!;
Chart I (Table A-I).
Enrollment by Class Levels
Chart II (Table A-I) shows the percent of enrollee:::
in the various class levels for the period 1965-66 through
1968-69. The non-English level has constituted the largest
18
30*

12000
10000
8000
6000
CHART I (TABLE A-I)
NUMBER OF ENROLLEES,1965-1969:
TREND LINES
AND
PERCENTAGE OF INCREASE AND DECREASE IN ENROLLMENT
---------
11,531>
25,67%
Decrease
38.28%
Decrease
,571)
16.97%
De
crea.-.e.(7,116)
65-66
66-67
67-68
Reporting Year
68-69
69-70

CHART II (TABLE A-1)
STUDENTS REGISTERED BY CLASS
LEVEL, 1965-66 THROUGH 1968-69:
TREND LINES AND 4-YEAR
TOTALS
4o.,
36.
32
28.
4-3
24
.
S.
20
Non
English"--
.-11.11'''''
16
Intermediate
Basic
Upper
x-- .
.........
X''
x,-
'
.-'
... .. .
X-x
128
65166
66167
67-68
68l69
Years
NR - 2.2%
4-Year Totals

21
proportion of the program's enrollment for each of the four
years studied. More than one-third of the enrollment has
consistently been assigned to this level. With the exception
of 1966-67, the second, third, fourth, and fifth largest
levels each year have been the intermediate, basic, upper,
and primary levels, respectively. Examination of the
4-year totals reveal the non-English level has accounted
for 35.7$ of all enrollees during that period; the inter-
mediate level -- 18.9%; basic level--17.1%; upper level- -
13.6%; and the primary level--12.5%.
A further examination of the trend lines in Chart II
reveals that in 1966-67 all levels showed a decrease in
enrollment except for the basic and primary levels. This
point is particularly interesting since the 1966-67 year
was the one in which the total enrollment sharply increased
(see Chart I). In other words, the spurt in total enrollment
experiencedln 1966-67 was accompanied by an increase in the
percentage of persons in the lower achievement and smallest
class levels (the primary and basic levels) and was accom-
panied by a decrease in the percentage of persons in the
higher achievement and largest class levels (the upper,
intermediate, and non-English levels).
Age of Students
Chart III (Table A-II) reflects the age range of
enrollees. Examination of this chart reveals that the
modal age range of ABE students for each year studied was
33 (00

22
20-29 years of age (Categories B anc C). The fewest number
of enrollees were consistently found in the 55 or over age
grouping (Categories I and J). By comparing all the various
age categories in Chart III with one another it is apparent
that,with the exception of the category of persons under age
20, increased age was accompanied by decreased enrollment
in ABE. This general tendency was common to each year's
data studied. This, along with the fact that for each year
the great bulk of enrollees have been under age 40, is
responsible for the skewed appearance of Chart III.
Again, by comparing categories in Chart III with one
another, it may be noted that the "tops" of most age cate-
gories are fairly flat (especially age category 40-44).
This "flatness" indicates little year to year variation in
the age distribution of enrollees. However, note the
extreme exception of the category 15-19 which is definitely
not flat and thus reflect3a great deal of year to year
variation in the enrollment of persons of this age, closer
examination of this age category reveals the nature of the
variation. In 1965-66, only about 1% of the total number
of enrollees were in the age bracket of 15-19 years old.
However, one year later the percent of enrollees of this
age increased nearly tenfold, and, in subsequent years,
there has occurred a continuous increase in the proportion
of enrollees under age 20. This, then, is responsible
for the "step-like" appearance of the category reflecting
persons 15-19 years old.
34.

M

24
Note within age categories 20-24, 25-29, and 30-34
years old, there is also a general step -like progression due
to the fact that the percentage of enrollees in each of
these age categories has gradually increased over the four-
year period studied. On the other hand, note how age category
35-39 and subsequently older categories each reflect a step
like regression, reflective of a general reduction in the
percentage of enrollees in these categories from year to year.
In summary, over the past four years there has been
a steady increase in the percentage of enrollees 34 years of
age or younger, while the reverse has been true for persons
aged 35 or older. The overall conclusion which can be
drawn from Chart III is that the ABE program has primarily
been composed by persons under age 40. This was a char-
acteristic of the program in 1965-66 and has become an
increasingly apparent one since then. The obviou, trend
reflected by Chart III is toward an increasingly larger pro-
portion of the program to ba composed of younger clientele.
Sex of Students
Chart IV (Table A III) reflects the composition of
the program according to the sex of enrollees. In each of
the reporting years the proportion of females in the program
exceeded the proportion of males. In addition, for a three
year period, 1965-66 through 1967-68, the proportion of
female participants steadily increase,. For example, in
1965-66 less than three of five students (57%) were females,
36.

701
605040"
3020
100
Females
Males
CHART IV (TABLE A-III)
SEX OF ENROLLEES
65-6666-67
Years
67-6868-69
4-Year Total

26
but by 1967-68 they represented nearly two of three students
(64.7f) in the program. However, this "trend" toward an
increasing percentage of females in the program appears to
be somewhat in question at th!s particular time because of
the slight drop (-2.3%) in the female enrollment from
1967-68 to 1968-69. The 4-year total enrollment figures
reveal that since 1965, the total program population has
been approximately 61 percent female and 39 percent male.
Race of Students
Chart V (Table A-IV) depicts the racial composition
of the program. For each year in the 4-year period studied
the program was predominantly white.1
With the exception
of the year 1968-69, more than 60 percent of the enrollment
each year was white. The percent of Black enrollees ranged
from a high of 34.3% (1967-68) to a low of 29.1% (1966-67)
over the four year period. Racial groups classified col-
lectively as "other" comprised from a low of 4.0% (1967-68)
to a high 7.9% (1968-69) of ne enrollments. The 4 year
total figures for the period studied show that of the
33,952 enrollees from 1965-66 to 1968-69, 62 per cent were
white, 31.7 per cent were Black and 5.5 per cent were members
of other racial categories. The remaining 0.8 per cent
were non respondents. Examination of the trend 2ireu in
Chart V reveals that the white enrollment has been in a
1Includes persons of Puerto Rican descent.
38 ti allim

20
White x --~
Black
10
Other
....
65-66
66-67
67-68
68:69
Years
CHART V (TABLE A -IV)
RACE OF STUDENTS
.x
..
......
..
1RNR
4-Year Totals

28
downward swing for two consecutive years. During this same
period, Black enrollment showed a rather sharp increase
followed by a slight decrease. It is also significant to
note that after three consecutive years of decrease in the
"other" racial group's enrollment, the proportion of enrollees
in this category nearly doubled in the one year period
between 1967-68 and 1968-69. It appears that the only trend
which might be inferred from Chart V 1s one toward an
increasing segment of the program to consist of non-white
enrollees.
Race vs Sex
Charts VI and VII are concerned with examining the
program's enrollment in terms of race and sex concurrently.
Chart VI (Table A-V) prehents trend lines reflecting the
percent of males and females in the program by race. The
largest category of enrollees for each year studied was
white females--ranging from a low of 30.1 percent in 1965-66
to a high of 43.8 per cent in 1966-67. White males and
Black females consistently constituted the second and third
largest categories of enrollees, except in 1967-68 when
their rankings were reversed. "Other" females and "other"
males in the program consistently represented the next-to-
thelowest and lowest enrollment categories for each of the
four years studied. The trend lines in Chart VI reveal that
wit:lin each racial group, female enrollments always exceed
male enrollmvnts. It is also clear from Chart Vlthat the

40
30
White
Females
White
Males
Black
CHART VI (TABLE A-V)
PERCENTAGE OF MALES AND FEMALES IN
THE PROGRAM, BY RACE
ECL,
4.1
20
Females
10
Black
Males
Other
emales
.............
Other
/** .................. "
Males
x.......
65-66
66-67
67-68
Years
...x
68-69
4-Year Totals
Omitted
1

30
enrollment disparity between males and females for each
racial group has generally increased. Trend lines also
show the most stable groups in terms of the proportion of
the total enrollment they comprise from year to year
were Black males and "other" males. Chart VI data also
serve to shed light on the Possible trend ventured earlier
to the effect that the program was becoming increasingly
non-white. Notice that this increase In non-white enroll-
ment is primarily due to female non-whites. Male non - whites
appear to be contributing very little co such a trend.
Finally, the bar graphs in Chart VI show that of the
33,952 enrollees over the four year period studied, 35.1
per cent were white females; 27.5 per cent were white
males, 22.6 per cent were Black females, 9.5 per cent
were Black males, 3.5 per cent were "other" females and
1.8 per cent were "other" males.
Chart VII (Table A-V) depicts the percent of males
and females within each racial category. While Chart VI
was developed from percentages calculated from the total
enrollment ror a given year, Chart VII was developed from
percentages based on the enrollment from given racial categories
for given years and thus provides a somewhat different picture
of the program's enrollment in terms of the race and sex of
enrollees. Like Chart VI, Chart VII shows that females
always outnumber males for each racial category. Likewise,
it also shows that the disparity between female and male
42

31
enrollments in each racial category has increased through
the years. However, Chart VII reveals several features
with respect to race and sex not apparent in the preceding
chart.
One of the major features revealed is that, com-
pared with all the groups, Black females have nearly always
(through 3 of the 4 years studied) been proportionately
greater in number in the program than any other group.
Conversely, the reverse has been true for Black males.
Chart VII also clearly shows that the disparity between
female and male enrollments has been greater for Blacks
than for all other racial categories of enrollees. A
second major feature reflected by Chart VII concerns the
racial category "other." As previously stated, the
disparity between males and females has been steadily
increasing from year to year until 1968-69 when a break
in the trend occurred for whites and Blacks. However, the
trend has continued to persist for the "other" racial
category. this reason, during 1968-69 the disparity
between the enrollment of males and females was greatest
for the "other" racial category.
Examination of the 4 year totals shows a white
male and female enrollment of 43.9 per cent and 56.1 per cent,
respectively; a Black male and female enrollment of 29.7
per cent and 70.3 per cent, respectively; and an "other"
male and female enrollment of 34.0 per cent and 66.0 per cent,
43 1-';

70Black
Females o--
55
40
25
Other
Females V
White
Females.-
Males
I-,
Other
Males
Black
Males
1
CHART VII (TABLE A-V)
PERCENTAGE OF MALES AND FEMALES
WITHIN EACH RACIAL CATEGORY
TREND LINES AND 4-YEAR TOTALS
1.410.
0-.
x--
X
'''''
-x
4.)
ny
a)1-1caa)C
x.
65-66
66-67
67-68
68-69
4Year Totals
Years

33
respectively. Or, stated another way, the white female
enrollment has been 1.28 times greater than the white male
enrollment; Black female enrollment has been 2.37 times
greater than Black male enrollment; and finally, "other"
female enrollment has been 1.94 times greater than "other"
male enrollment.
The major trend which may be infermu from Chart
VII is one toward an increasing disparity between male
and female enrollments within each racial category,
particularly for the "other" racial category and for Blacks.
Marital Status of Enrollees
Chart VIII (Table A-VI) show the marital status of
enrollees. The largest, second largest, and smallest cate-
gories of enrollees over the 4 year period under study
have consistently been those married who are living with
their spouse, single persons, and those married who are not
living with their spouse, respectively. However, it should
be noted that while the percentage of enrollees married but
not living with their spouse has been fai.ly .;table from
year to year, a trend has developed toward a decrease in
those married and living with spouse, mid a tri-nd toward
an increase in single persons. Whereas, in 1966-67 the
former group represented 15 percent more enro,lees than
the latter (49.6 per cent ne opposed to 34.2 cent),
1967-68 and 1968-69 figures show these two ErJui3 differed
in size only by 7 per cent (10.2 per cent and 3.2 per cent,
45 is

arried
Spouse
X
145
Single
4-)
MC
e,30
La
C)
P.
15
Married w/o
Spouse
CHART VIII (TABLE A-VI)
MARITAL STATUS OF ENROLLEES
.' *
.......
x-
-
.'-
............
65-6666-67
Year
67-68
x
68-69
NR '= 2.4
4-Year Totals

35
respectively). It appears that if such a trend continues,
the percent of enrollees married and living with their
spouse, and the per cent of single enrollees will be equal
and that in the near future a plurality of enrollees will
be single.
Children at Home
The number of children enrollees have at home is
shown in Chart IX (Table A-VII). Each year the majority
of participants have reported having at least one child.
Of those with children, the most frequently reported
number of children at home has consistently been 1-2, the
second most frequently reported number has been 3-4, while
those reporting 5 or more children have consistently
represented the smallest proportion of enrollees.
From the trend lines in Chart IX, it may be noted
that a three year pattern of a decrease in the number of
enrollees reporting no children was broken in 1968-69.
This category of persons in 1965-66 represent 47.5 per cent
but by 1967-68 represented only 38.8 per cent. However,
one year later the proportion of persons in this category
rose to 42.9 per cent. Other possible trends noted in
Chart IX are that the per cent of persons with 1-2 children
has steadily increased over the four year period studied,
while the proportion of persons with 3-4 children has been
relatively stable and the per cent of persons with 5 or
more person: has (with the exception of 1965-66) steadily
decreased.
(17;1

a)
a)
48
44
4036
32
28
24
20
16
1284
None
1-2
x - - - --x-
3-4
x-
5+
CHART IX (TABLE A-VII)
NUMBER OF CHILDREN AT HOME
..
.
x
--x
x--
..
-x............
...".x
65:66
66-67
67 -68
Years
68 -69
None
1-2
3-4
5 or
more
4-Year Totals
NR
5.1

37
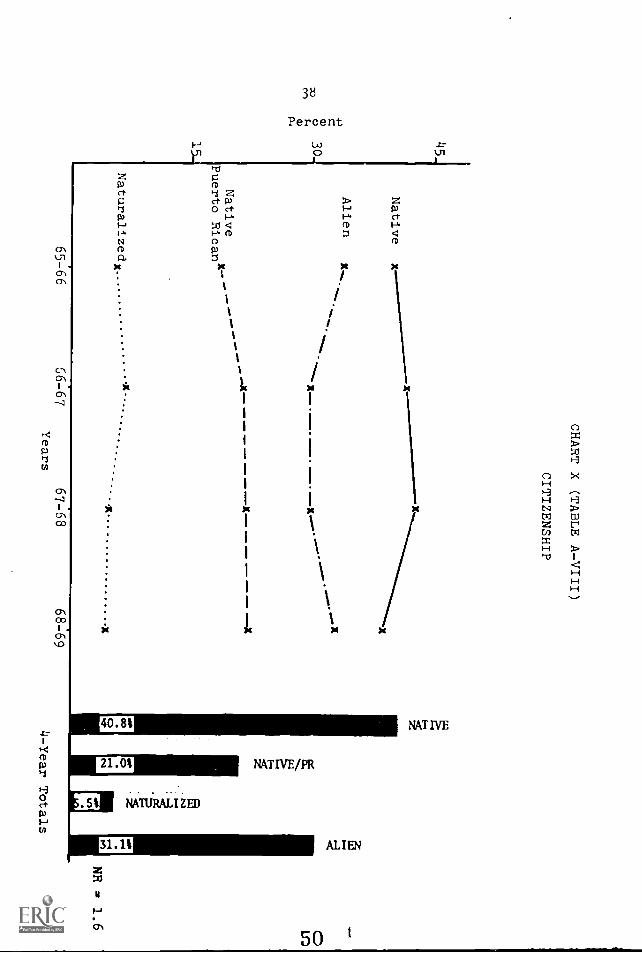
Citizenship Status
The composition of the program in terms of enrollees'
citizenship is shown in Chart X (Table A- VIII). For each
year studied, the largest proportion of participants have
been native U. S. citizens. The second, third, and fourth
largest categories have consistently been aliens, native
Puerto Ricans, and naturalized citizens, respectively.
Examination of the trend lines in Chart X, reveals that the
native group experienced a percentage increase for three
consecutive years only to decrease in enrollment in 1968-69
to a point lower than their 1965-66 enrollment status.
The native Puerto Rican group, on the other hand, has shown
a percentage increase for four consecutive years, although
these increases have been minute ones. The alien group
enrollment decreased in 1966-67, held steady in 1967-68
and experienced an increase in 1968-69. The proportion of
naturalized citizens in the program has remained extremely
stable through the years, ranging from a high of 6.9 per cent
in 1966-67 to a low of 4.4 par cent in 1958-69. The four
year totals in Chart X show that from 1965-66 through
1968-69, 40.8 per cent of the program's enrollment has been
native; 21.0 per cent native Puerto Rican; 5.5 per cent
naturalized; and 31.1 per cent alien. Data with respect
to citizenship status were not available for 1.6 per cent
of enrollees during this period.
4 9c r.
45_
4-)
0030
s.
0a
1
Native
x
Alien
CHART X (TABLE A-VIII)
CITIZENSHIP
x
Native
Puerto Rican"'
Am
.aa.
,11.
t
Naturalizedx .................
-x
x
x
65-66
66-67
Years
67-68
6869
qh
4-Year Totals
NE
1.6

39
Language Spoken in the Home
The primary language which participants use in the
home is reflected by Chart XI (Table A-IX). The largest
number of enrollees for all years studied spoke English in
the home. However, the number of persons using English
in the home has consistently been less than one-half of the
total enrollment. The second most frequently used language
was Spanish, while the use of "other" languages ranked third.
Very little can be said for the trend lines in Chart XI
(since little year to year variation was noted for this
particular variable) except for (1) the use of English in
the home steadily increased between 1965-66 and 1967-68
but decreased slightly in the following year; (2) the use
of Spanish decreased between 1965-66 and 1967-68 but
increased slightly in 1968-69. (3) After a slight decrease
in 1966-67, the proportion of enrollees using "other"
languages in the home steadily increased from 1966-67
through 1968-69. The four-year totals in Chart XI show
that English was used in the home by less than half of the
participants (47.8 per cent), Spanish used by 37.8 per cent,
and 13.5 per cent used "other" languages in the home. Isicn-
respondents totalled 0.9 per cent.
Citizenship vs Class Level
Chart XII (Table A-X) compares the various citizenship
groupingzand the per cent of persons therein assigned to
51

45
o3015
English
x
Spanish
x_
Other
CHART XI(TABLE A-IX)
LANGUAGE SPOKEN IN THE HOME
TREND LINES AND 4-YEAR TOTALS
---------X
x. ............... .x.
. .
65-66
66-57
67-68
68-69
Years
4-Year Totals
CV
NR - 0.9

1
the five class levels of non-English, basic, primary, inter-
mediate, and upper. It should be noted that this chart reflects
only the four year totals--no graphic year to year trend
analysis of data has been presentr.d. However, persons
interested in such an analysis are referred to Appendix A,
Table A-X, the back-up table for Chart XII.
From Chart XII several major features of the citizen-
ship compositions if the various class levels are apparent.
First, the majority of the native Puerto Rican and alien
populations and a plurality of the naturalized population
are enrolled in non-English level classes. Second, as the
academic class level increases (from basic through upper)
the portion of native Puerto Ricans and aliens enrolled in
such levels decreases. Third, a greater portion of the
native enrollees are assigned to the basic through upper
levels than are any other groups--naturalized enrollees
1,anked second in this respect. In short, native enrollees
are more likely to be found at a higher academic class level
than are any other citizenship group; naturalized enrollees
are the second most likely to do so, while native Puerto
Ricans and aliens enrollees are the least likely persons to
be found in these "higher" class levels. Finally, with
respect to class level assignments, the native and
naturalized groups are considerably more heterogeneously
distributed across classes than are the native Puerto Rican
and alien groups.

7060
50400
320
10
CHART XII (TABLE A-X)
CLASS LEVEL ASSIGNMENTS OFVARIOUS CITIZENSHIP GROUPS:
4-YEAR TOTALS
dr
esPc-
oC;
afi
MP
mid.
vI401
Of
CO
.C
71
NB
PI
UN
BP
IU
NBPI U
NB
Native
Native/PR
Naturalized
Alien

143
Race vs Class Level
Charts XIII and XIV (Table A-XI) and Chart XV
(Table A-XII) are all concerned with the racial composition
of the various class levels for the four-year period,
1965-66 through 1968-69. It should be noted that, for the
sake of simplicity, no year to year trend analysis has been
provided in these charts (such a presentation would have
involved 20 different trend lines per chart). Only the
total figures over the four-year period have been analyzed.
Again, readers desiring the detailed year to year data with
respect to the racial compositions of various class levels
are referred to the Appendix, Tables A-XI and A-XII.
Since these three charts all deal with a related
concern, an explanation of the differences between their
origin and intent is in order. Chart XIII (Table A-XI) was
developed from determining the total number of enrollees in
a given class and then determining the proportion of that
class enrollment which was white, Black, or "other." These
data may then be used to show each class level's composition
in terms of race (i.e., The Primary level was 47.5 per cent
white, 48.3 per cent Black, and 4.2 per cent "other," for
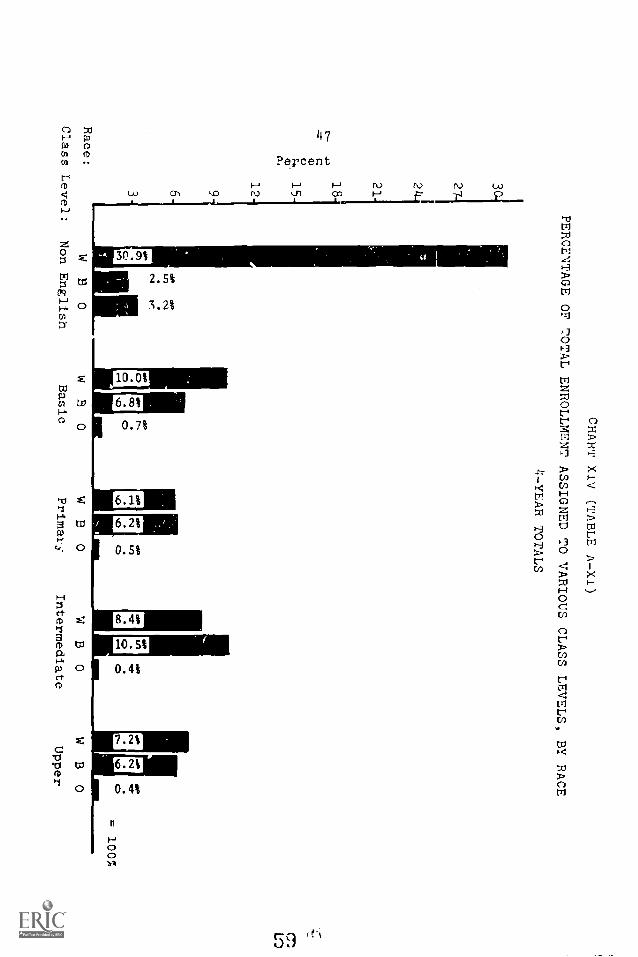
a total of 100 per cent). Chart XIV (Table A-XI) was
developed from determining the total enrollment for all
classes and then determining the proportion of that total
enrollment which was assigned to the various class levels,
by race. These data may then be used to show the racial
r r-
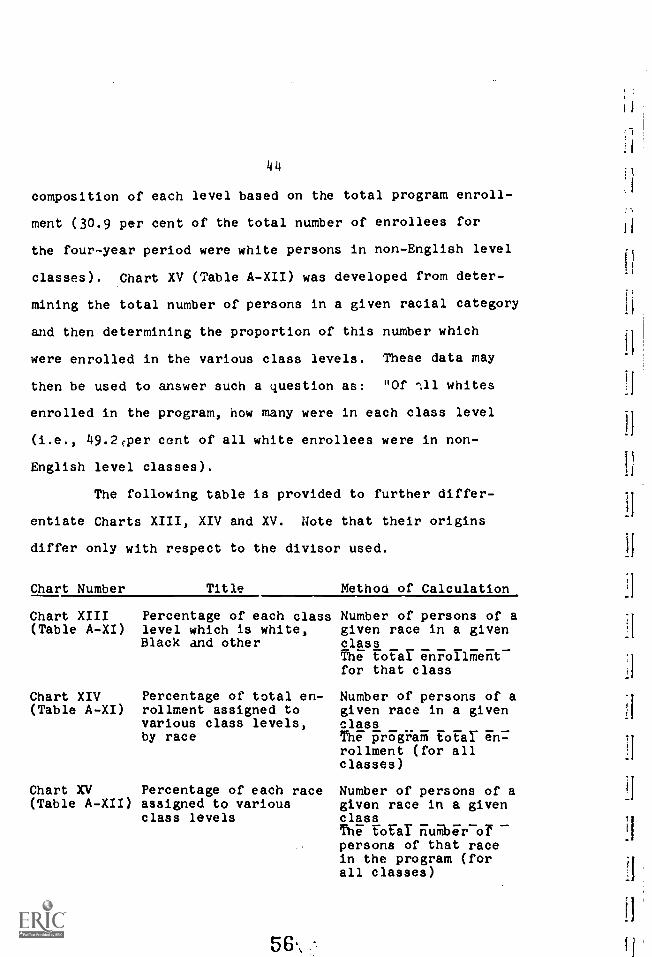
44
composition of each level based on the total program enroll-
ment (30.9 per cent of the total number of enrollees for
the four-year period were white persons in non-English level
classes). Chart XV (Table A-XII) was developed from deter-
mining the total number of persons in a given racial category
and then determining the proportion of this number which
were enrolled in the various class levels. These data may
then be used to answer such a question as: "Of :11 whites
enrolled in the program, how many were in each class level
(i.e., 49.2cper cent of all white enrollees were in non-
English level classes).
The following table is provided to further differ-
entiate Charts XIII, XIV and XV. Note that their origins
differ only with respect to the divisor used.
Chart Number Title Method of Calculation
Chart XIII(Table A-XI)
Percentage of each class Number of persons of alevel which is white, given race in a givenBlack and other .0481
The total enrollment_
for that class
Chart XIV Percentage of total en-(Table A-XI) rollment assigned to
various class levels,by race
Chart XV Percentage of each race(Table A-XII) assigned to various
class levels
56.,
Number of persons of agiven race in a givenclass
en-
rollmentprogram totar en
rollment (for allclasses)
Number of persons of agiven race in a givenclassThe total EuRiarorpersons of that racein the program (forall classes)

45
From Chart XIII (Table A-XI) it is evident that the
non-English, basic, and upper levels have had predominately
white1 enrollments, with the percentage of whites enrolled
being 84.4 per cent, 57 per cent, and 52 per cent, respectively.
Enrollment withil. th' primary level has been almost equal
with respect to the percentage of whites and Blacks at
this level--47.5 per cent and 48.3 per cent respectively.
The intermediate level enrollment over the four-year period
studied has had a majority Black enrollment (53.9 per cent).
For every class level, the smallest racial category repre-
sented was that of "other."
Chart XIV (Table A-XI) shows that the largest group
of all enrollees were whites in non-English level classes.
This group accounted for nearly-31 per cent of all enrollees.
The second largest group was represented by Blacks in inter-
mediate level classes. This group accounted for 10.5 per cent
of the total enrollment. The third largest group, representing
10.0 per cent of the total number of enrollees, was whites
attending basic level classes, while whites in intermediate
level classes represented the fourth largest segment of the
program and accounted for 8.4 per cent of enrollees.
Chart XV (Table A-XII) shows how each racial group has
been distributed across the various class levels for the four-
year period, 1965-66 through 1968-69. Nearly one-half of the
program's white population has been enrolled in non-English
1 Includes Puerto Ricans.

8416654230
186
CHART XIII
( TABLE A-XI)
PERCENTAGE OF EACH CLASS LEVEL CATEGORYWHITE; BLACK, AND OTHER
1White includes
Puerto Ricans
WB
0
Non English
aC
O
WB
0
Basic
WB
0
Primary
WB
0
Intermediate
WB
0
Upper
30
221
21
18
0015
a
12963
Race:
CHART XIV (TABLE A-XI)
PERCENTAGE OF TOTAL ENROLLMENT ASSIGNED TO VARIOUS CLASS
LEVELS, BY RACE
4-YEAR TOTALS
so.
rw
er
Class Level:
WB
0
Non English
WB
0
Basic
WB
0
Primary
WB
0
Intermediate
= 100%

CHART XV (TABLE A-XII)
PERCENTAGE OF EACH RACIAL CATEGORY ENROLLED IN VARIOUS CLASS LEVELS
60-
OP
Ca
Of
4-YEAR TOTALS
dPW
IPL
elV
/
rol= 100%
Ira,t-11
Class Level:
NE
BP
IU
White
hite
(Includes Puerto Rican)
OPMOf
CV
Irool. 100%
NE
BP
IU
Black
NE
BP
IU
Other
= 100%

49
classes. However, it should be remembered that Puerto
Ricans were counted as members of the white race. The
second and third largest percentage of whites were enrolled
in the basic and intermediate levels, respectively. The
largest number of Blacks (32.3 per cent) have been enrolled
in intermediate level classes. The second largest portion
of Blacks (21.2 per cent) were in classes operating at the
basic level. The chart also shows chat more than half of
the Blacks enrolled in the program have been in inter-
mediate and upper level classes. An equal proportion of
Blacks (19.3 per cent) were enrolled in the primary and
upper levels. A comparison of the class level distribution
of whites and Blacks reveals that a proportion of Blacks
in the basic through upper levels was greater than the
proportion of whites in these levels. As mighIc be expected,
the majority of "other" races (59.6 per cent) were enrolled
in non-English level classes. Also evident from Chart XV
is the fact that as the academic class level increase (from
basic to upper) the proportion of "other" race represented
therein decreases.
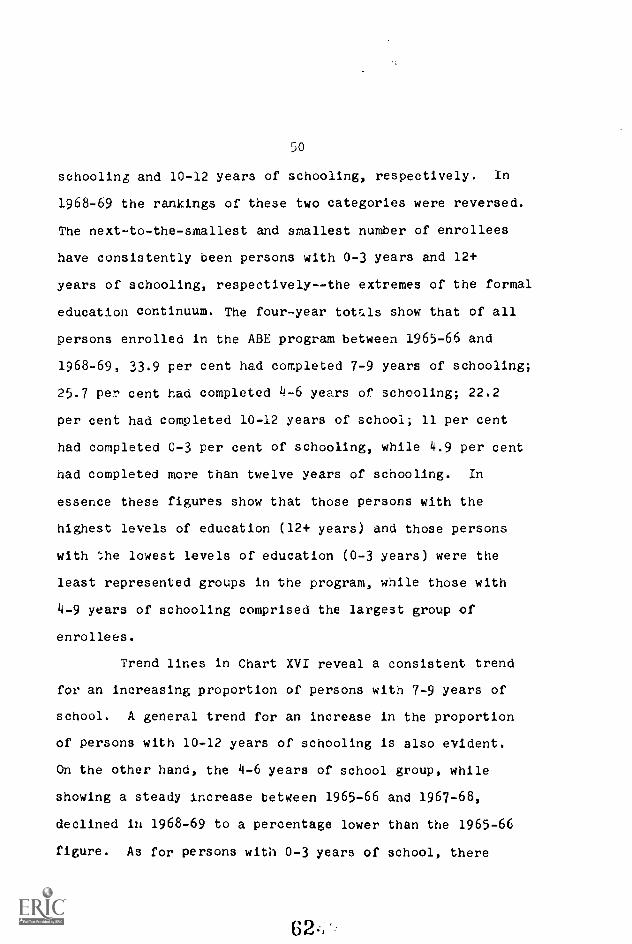
Years of Previous Schooling Completed
Chart XVI (Table A-XIII) shows the number of years
previous schooling completed by enrollees. The modal numbcr
of school years completed has consistently been 7-9 years.
With the exception of 1968-69, the second and third largest
categories of enrollee? have been those .tith 4-6 years of
O 1'
50
schooling and 10-12 years of schooling, respectively. In
1968-69 the rankings of these two categories were reversed.
The next-to-the-smallest and smallest number of enrollees
have consistently been persons with 0-3 years and 12+
years of schooling, respectively--the extremes of the formal
education continuum. The four-year totals show that of all
persons enrolled in the ABE program between 1965-66 and
1968-69, 33.9 per cent had completed 7-9 years of schooling;
25.7 pen cent had completed 4-6 years of schooling; 22.2
per cent had completed 10-12 years of school; 11 per cent
had completed 0-3 per cent of schooling, while 4.9 per cent
had completed more than twelve years of schooling. In
essence these figures show that those persons with the
highest levels of education (12+ years) and those persons
with ':.he lowest levels of education (0-3 years) were the
least represented groups in the program, while those with
4-9 years of schooling comprised the largest group of
enrollees.
Trend lines in Chart XVI reveal a consistent trend
for an increasing proportion of persons with 7-9 years of
school. A general trend for an increase in the proportion
of persons with 10-12 years of schooling is also evident.
On the other hand, the 4-6 years of school group, while
showing a steady increase between 1965-66 and 1967-68,
declined in 1968-69 to a percentage lower than the 1965-66
figure. As for persons with 0-3 years of school, there
62.,

CHART XVI (TABLE A-XIII)
NUMBER OF YEARS PREVIOUS SCHOOLING
4-YEAR TOTALS
4035
3025
020
a
15.
-10-
5 -
7-9
Years
4-6
Years
10-12
Years
0-3
Years
12+
Years
XX--
lex65-66
66-67
...
X
x .x
Years
67 -68
68169
Nr-IM
1.0O
NI
4-I
II
0N
0-=
'ts-
r-I,-1
4-Year Totals

52
also appears to be a trend toward a decline in the propor-
tion of enrollees in this group. The most stable group over
the four year period was those persons with more than twelve
years of school--varying only from a high of 3.1 per cent
(1965-66) to a low of 1.7 per cent (1966-67). Perhaps the
most alarming "trend" in Chart XVI is the decline in the
enrollment of persons with very low levels of education- -
the most likely members of the illiterate and functionally
illiterate categories of undereducated adults. These
persons, the illiterate and the functionally illiterate,
represent the "hard-core" of the undereducated population.
It is this group of persons which is most in need of addi-
tional education, yet they appear to be becoming increasingly
unrepresented in the program.
Years of Previous Schooling vs Age
Chart XVII (Table A-XIV) examines the number of years
of previous schooling completed by different age categories
of enrollees. It will be noted that persons under age 25
constituted the "best educated group" (in terms of years of
school completed). More than three-fourths of this group
had completed seven or more years of school and 37 per cent
completed 10 or more years prior to their enrollment in ABE.
As the age of enrollees increases, it will be noted that the
proportion of persons completing this much schooling progres-
sively decreases. For enrollees age 25-34 the corresponding
figures for completion of 7 or more years or 10 or moie
14
4 4

140-
35-
30-
CHART XVII (TABLE A-XIV)
YEARS OF PREVIOUS SCHOOLING VS. AGE
4-YEAR TOTALS
Years of
Schooling:
Age:
r-1(Y
) VD
CT
1
II
IP
0r-f
I-f
On
%JD
cI
II
0r-IC
\(''")
kiCI
ON
I
o =-
(11
("1%
.1Z,
CT
II
10
-r7.1
0L
s--1
ri
Under Age 25
25-34 Years Old
35-44 Years Old
45-54 Years Old
55 or Older

54
years of schooling are 66.1 and 31.3 per cent, respectively;
age 35-44--54.0 and 20.9 per cent, respectively; age
45-55--49.2 and 17.9 per cent, respectively; and for age
55 or older--35.0 and 10.5 per cent, respectively. Con-
versely, as the age categories of enrollees increase a
consistent increase in the proportion completing six or
fewer years of schooling increases. Also evident from
Chart XVII is a difference among the various age categories
with respect to the modal number of school years completed.
For age categories "under 25," and "25-34" (the youngest
categories) the mode observed for each was 7-9 years of
previous schooling. For the 35-44 age group, the observed
mode was 10-12 years of schooling. The mode for persons
age 45-54 was 4-6 years, while the mod- for the oldest
group of enrollees (those 55 or older) was 0-3 years of
previous schooling completed. Clearly, the older adult is
more likely to have completed fewer years of formal school
and is thus more likely than younger adults to fall within
the realm of the illiterate or functionally illiterate
category of enrollee. No trend line analysis was made for
comparisons of school years completed and age. Table A-XIV in
theAppendix, however, does provide detailed year-to-year
statistics for those desiring to examine such a question.
Years of Previous Schooling vs Sex
Chart XVIII (Table A-XV) examines the number of
years of previous schooling completed, by sex. Like
nf;

CHART XVIII (TABLE A -XV)
YEARS OF PREVIOUS SCHOOLING
VS. SEX
4-YEAR TOTALS
O
tI0
CA
I-I-
II
0C
\ I
1-t
.--1rI
Sex:
Males
Ce1
O
CU
'.0O
N
Females

56
Chart XVII, no trend analyuis was made for these data.
Chart XVIII shows that for both sexes, the smallest portion
of enrollees were those with extremely lower levels of
education (0-3 years) and those with relative high levels
of education (more than 12 years)--a similar discovery
brought out in Chart XVII. Chart XVIII also reveals that
generally female enrollees have completed more years of
formal schooling than have males. Nearly two-thirds
(64.2 per cent) of the female enrollees had completed seven or
more years of school and nearly 30 per cent had completed
10 years of schooling or more. However, ..he corresponding
figures for male enrollees were 59.8 per cent and 24.6
per cent respectively. Fur both groups, however, the modal num-
ber of school years previously completed was 7-9 years.
Years of Previous Schooling vsffiTrEenship
fhe number of years of previous schooling completed
by various citizenship groups is presented in Chart XIX
(Table A-XVI). For the native group, the modal number of
school years competed was 7-9 years. The second largest
category for natives consisted of persons who had completed
10-12 years of school. Nearly 70 per cent of the native
group had completed 7 or more years of schooling--the
largest percentage of any other citizenship group. More
than 28 per cent of the natives had completed 10 or more
years of previous schooling. This percentage was the
68'

57
second largest of all citizenship groups completing as many
years of schooling. The percentage of natives with only
0-3 years of schooling completed ranked next to the lowest
for all groups (10.3 per cent). Curiously, natives ranked
lowest in the percentage of persons with more than 12
years of schooling previously completed.
The distribution of native Puerto Ricans with
respect to the number of years of previous schooling was
almost bimodal. An even per cent of this group had
completed 7-9 years of schooling, while 31.9 per cent had
cenpleted 4-6 years of schooling. The percentage of native
Puerto Ricans completing 7 or more years of schooling (51.2
per cent) constituted the next to the smallest percentage
for all other citizenship groups. Native Puerto Ricans
ranked lowest of all groups in the percentage of persons
completing 10 or more years of schooling and ranked next
to the largest in terms of the percentage of persons with
only 3 years of schooling.
For the naturalized group, the modal number of school
years completed was 4-6 years. This was the lowest modal
number of school years completed for all citizenship groups.
Also, the naturalized group had the highest percentage
(20.3 per cent) of persons who had completed only 0-3 years
of schooling. Less than one -hell (49.3 per cent) of the
naturalized group had completed 7 or more years of school--
the smallest recorded for any group. Slightly mare than
69

1430
CHART XIX (TABLE A-XVI)
YEARS OF PREVIOUS SCHOOLING VS. CITIZENSHIP
4-YEAR TOTALS
dPdP
tiPcet.
tiPte)
1::)%
,C)
MC
4
0 0 0%
CI
csir-4
Ncr
Nr-I
Years of
to
\ 0C
TI
-I-I
IN
School:
oti
r-Ir-1
Citizenship:
Native
,c)I
Cr
1-1
Or-1\
(v)V
D(7N
II
I
e-I
Oe-I
qative/PR
Naturalized
-I-Nr1
e-IC
nA
DC
AI
+I
IC
.C
\ I
CD
e-I
Alien

59
one-fifth (20.9 per cent) had completed 10 or more years of
scheoling. This was the next to the lowest percentage in
that cater y r. any citizenship group. Surprisingly, the
percentage of naturalized with more than 12 years of
schooling was the next to the highest noted for any group.
The alien group distribution for the number of years
of previous schooling was also nearly bimodal. Slightly under
30 per cent (29.9 per cent) had completed 7-9 years while
29.4 per cent had completed 4-6 years. This group ranked
second in terns of the percentage of persons who had completed
10 or more years of schooling (63.5 per cent), while they
ranked first in terms of the proportion completing 10 or
more years. However, in spite of this, the aliens also
constituted the group with the highest percentage of persons
with only 0-3 years of previous schooling.
In sum, it appears that on the whole the native and
alien groups are the "best educated" citizenship groups (in
terms of the number of years previous school completed by
members). Likewise, persons in the naturalized and r.ative
Puerto Rican groups have the lowest levels of education in
this respect.
Years of Previous Schooling,vs class Level
The number of years of previous schooling completed
by enrollees in various class levels is shown in Chart XX
(Table A-XVII). For the non-English level and basic level
7

60
enrollees, the modal number of school years completed was
4-6 years. Nearly one-third (33 per cent) of the former's
enrollment and more than three-tenths (31.7 per cent) of the
latter's enrollment were in this witegory. For the non-English
level enrollees, 54 per cent had completed 7 or more years
of school and 23.9 per cent had completed 10 or more years
of schooling. The corresponding percentages for enrollees
in the basic level were 46.9 per cent and 18.8 per cent,
respectively. On the whole, students in basic level classes
had fewer years of previous schooling completed than did
enrollees in any other class level.
For enrollees in the primary, intermediate, and
upper levels, the modal number of school years completed
was 7-9 years. The proportion of such enrollees in the
primary level was 36.5 per cent, in the intermediate
level--42.5 per cent and in the upper level 42.7 per cent.
Although these groups were similar in that the mode for each
was 7-9 years of previous schooling, it should be noted that
they not only differed with respect to the percentage of
students comprising the mode, but that they also differed
with respect to their second largest category of enrollees.
The second largest proportion of primary enrollees had
completed 4-6 years of schooling, while the second largest
group of intermediate and upper level enrollees had com-
pleted 10-12 years of school.
7;

0-3
4-6
7-9
10-12
12+
0-3
4-6
7-9C)
H
Percent
0 LT1
1.
31.7%
28.1%
10-12 14.9%
12+ 3.9%
0-3
4-6
7-9
10-12
12+
0-3
4-6
7-9
10-12
12+ 4.6%
0-3 1.8%
4-6
7-9
10-12
12+
73
tTsr,

62
It may also be noted that while only 58.4 per cent
of the primarily level students had completed 7 or more
years of schooling and only 21.9 per cent had completed
10 or more years of school, the corresponding proportions
of students in the intermediate and upper levels were 75.7
per cent and 33.2 per cent for the former and 89.5 per cent
and b6.8 per cent for the latter.
Examination of Chart XX reveals that, as a general
rule, the proportion of enrollees with less than 7 years
of schooling decreased as the academic status of the class
level increased(from basic to upper). Conversely, as the
academic status of the class level increased, the proportion
of students with more than 7 or more years of schooling
also increased. It may also be noted from this Chart that
the non-English level enrollees' distribution in terms of
years of previous schooling most closely resembles the
distribution exhibited by intermediate level enrollees.
Number of Years of PreviousSchooling vs Race
The number of years of previous schooling completed
by enrollees of various races is shown in Chart XXI (Table
A-XVIII). The modal number of school years completed by
each racial group was 7-9 years. Generally speaking, Black
enrollees completed more years of schooling than whites or
"others." More than 65 per cent of the Black enrollees
completed 7 or more years of schooling and 30.2 per cent

145
15
CHART XXI (TABLE A-XVIII)
NUMBER YEARS PREVIOUS SCHOOLING VS. RACE
0-3
4-6
7-9 10-12 12+
White
(includes Puerto Rican)
0-3
4-6
7-9 10-12 12+
Black
0-3
4-6
7-9 10-12 12+
Other

64
completed 10 or more years. The corresponding figures for
"others" were 62.1 per cent and 30.6 per cent, respectively;
while for whites, they were 61.1 per cent and 26.2 per cent,
respectively.
Oflograahic Area where Schooling4as Completed
More than one-half of thr ABE enrollees (54.8 per
cent) from 1965-66 through 1968-69 had completed their
schooling outside of the United States--19.4 per cent in
Puerto Rico and 35.4 per cent in other countries. Of those
completing their education in the United States, most were
from the northeast. The second largest group of New York
State ABE enrollees who completed school in this country
were educated in the south. Only a very small proportion
of the enrollees had completed their schooling in the
midwest (0.6 per cent) and farwest (0.2 per cent). These
data are graphically presented in Chart XXII(Table A-XIX).
Pro ortion of Students everGainfully Employed
Chart XXIII (Table A-XX) shows the percentage of
students ever gainfully employed. The overwhelming majority
of enrollees have been gainfully employed at sometime or
another during their lives. This proportion of students
ranged from a high of 84.6 per cent in 1965-66 to a 1..)w of
76.3 per cent in 1967-68. Trend lines for the four-year
period studied show a very gradual and small increase in
76

CHART XXII (TABLE A-XIX)
GEOGRAPHIC AREAS WHERE SCHOOLING WAS COMPLETED: 4-YEAR TOTALS
WestFar
South West
77
Puerto Other NonRico Country Response

90
Yes
756045
301
151
65-66
CHART XXILI
( TABLE A-XX)
PROPORTION OF STUDENTS EVER GAINFULLY EMPLOYED
TREND LINES AND 4-YEAR TOTALS
X
66-67
Years
67-6868-69
Yes
No
4-Year Totals

67
the proportion of enrollees never gainfully employed. This
might be interpreted as meaning that the program has
achieved an increasing degree of success in involving the
hard-core disadvantaged in the ABE program. Examination
of the four -year totals reveal that nearly 80 per cent
(79.5 per cent) have at sometime been gainfully employed,
15.2 per cent have never been gainfully employed; while
no data were obtained for 5.3 per cent of the enrollees
with respect to this matter.
Gainful Employment vs Years ofPrevious Schooling
Chart XXIV (Table A-XXI) provides for an examination
of the relationship between gainful employment and the
number of years of previous schooling completed by enrollees.
In general, it is evident from Chart XXIV that, as the
number of years of previous schooling increases the propor-
tion of enrollees ever having had gainful employment
also increase; or, conversely, as the level of previous
schooling decreases, the proportion of enrollees not ever
having had gainful employment experiences, increases. In
other words the data in Chart XXIV tend to support the widely
noted relationship between level of education of potential
for gainful employment.
Gainful Employment vs Race
Racial differences with respect to ever having been
gainfully employed are presented in Chart XXV (Table A-XXII).
79 >"'

9080
70
60
co
\47
050-
00O4
40.
30-
20_
10.
CHART XXIV (TABLE A-XXI)
GAINFUL EMPLOYMENT VS. YEARS OF PREVIOUS SCHOOLING
Gainfully Employed:
Years of School
Completed:
a)0z
0-3
a)
ow
0
7-9
0.)0
-410-12
w oz
12+

90
8o
CHART XXV (TABLE A-XXII)
GAINFUL EMPLOYMENT VS. RACE
050
4030
2010
LA
Ever Gainfully Employed:
Race:
coa)0Z
>4
White
(Includes Puerto Rican)
coo
>4
zBlack
coa)0
>4 Z
Other

70
The data show that nearly 90 per cent of the Black enrollees
studied had experienced gainful employment. On the other
hand, nearly one-fifth of the whites had never been gain-
fully employed. (Again, white enrollee statistics included
those of Puerto Ricans descent.) Nearly three of every
ten enrollees of "other" racial groups had never been
gainfully employed.
Dates Last Gainfully Employed
Table A-XXIII in Appendix A shows the dates when
enrollees were last gainfully employed. For persons enrolled
during the 1965-66 year, more than 75 per cent of the enrollees
gave that current year as the date of their last employment.
No doubt, some of these persons were reportirg employment
which they then held. In 1966-67 the proportion of persons
giving those current years as dates of their last gainful
employment dropped to 53.9 per cent. More than 58 per cent
of the 1967-68 enrollees reported one of those two years as
the date of their last employment. In 1968-69, 58.7 per cent
of the enrollees reported their date of last gainful employ-
ment to be either 1968 or 1969. In other words, the majority
of each year's en.ollment from 1965-66 through 1968-69 has
reported a date of last gainful employment which was current
for the respective reporting years--most were, at that time,
gainfully employed or had been so as early as 1 or 2 years
previous to the time at which they were asked.
82 (...

71
Occupation of Enrollees
The occupational classifications of persons in the
ABE program over the four-year period studied reveal that
the largest group (23.8 per cent) were housewives. The
second largest groups were semi-skilled workers (15.3 per
cent) and unskilled workers (15.3 per cent). Skilled
workers, the third largest occupational category, constituted
8.7 per cent of the program's population. Domestics (16.8
per cent) ranked fourth, while service trades (4.0 per cent)
and "others" (4.0 per cent) both ranked fifth. In essence,
with exception of the 8.7 per cent of the population which
were in skilled occupations, the great majority of parti-
cipants, if employed at all, worked in lower paying, lower
"occupational ladder," lower status jobs. Also, nearly
16 per cent were reported to be "unemployed" at the time of
their enrollment. The complete breakdown of data is provided
for in Chart XXVI (Table A-XXIv).
Number of Students Completing, NotCompleting, and treWaing
Chart XXVII (Table A-XXV) summarizes statistics with
respect to the number of students who completed (achievement
of a passing score on the minimum competency examination)
the program, dropped out, cr were recycled iz the program
(reassigned to another class). The 4-year totals show that
Since 1965-64, nearly one-third of all enrollees dropped out
of the program, 6.7 per cent completed it, while the vast
83

72
Percent
I-_
0.2% FARM LABOR
SERVICE TRADES
3.2t NON RESPONSE
84 ::'

706050
c.) 40
0a.
30
CHART XXVII (TABLE A-XXV)
STUDENTS COMPLETING, NOT COMPLETING AND RECYCLING
TRENDLINES AND YEAR TOTALS
Recycled
Not
20
Completed
10
Completed
65-66
N.
N.
66-67
67-68
68-69
Vv
mm
v4.)
4-)a)
a)4-1
4)r-4
II0 r-4
0E
E0
oo
wU
um

74
majority (60.7 per cent) were reassigned and thus continued
in the program.
The trend lines in Chart XXVII offered some degree
of encouragement. For instance, for each year since
1965-66, there has consistently been an increase in the pro-
portion of enrollees completing the program. This proportion
more than doubled between 1965-66 and 1968-69. Also, after a
sizeable increase in the dropout rate between 1965-66 and
1966-67, the proportion of dropouts has steadily decreased- -
from more than 38 per cent in 1966-67 to less than 28.9 per
cent in 1968-69.
Reasons for Dropping Out
Chart XXVIII (Table A-XAVI) is concerned with the
reasons dropouts gave for disengaging from the program. For
nearly one-half of the dropout population (48.5 per cent) the
reasons for dropping out were either unknown or did not
clearly cluster under one of the broad headings used by the
program to categorize reasons for dropping out. As noted,
the largest of such categories was employment. Nearly 16
per cent of thc dropouts left the program for employment
purposes. The next largest category of enrollees disengaged
from the program was because they moved. The third largest
category of reasons lois dropping out was illness. Family
reasons and poor motivation rank fourth and fifth, respectively,
while only a very small number, less than one-half of one
per cent, left the program because of hostility.
86k

Reasons:
CHART XXVIII (TABLE A-XXVI)
REASONS FOR NOT COMPLETING PROGRAM:
4-YEAR TOTALS
Poor
Family
Motivation
Reasons Employment
Moved
Illiness Hostility
Other
O
Unknown/

76
In other words, most dropouts who gave specific
reasons for dropping out, named factors which were largely
uncontrollable by the program (i.e., employment, moved,
illness). Conversely, only a very small proportion of the
dropouts listed specific reasons which were within the
realm of controllability of the program (i.e., poor moti-
vation, hostility).
Attendance
Chart XXIX (Table A-XXVII) reflects attendance
patterns of enrollees during the first 100 instructional
hours in which they were in the program. Trend lines reveal
that, with the exception of 1968-69, the plurality of students
have always attended 75 per cent or more of the classes
scheduled during the first 100 instructional hour period.
However, it is especially significant to note that the
proportion of persons in this attendance category has
drastically declined from 44.2 per cent in 1965-66 to
20.3 per cent in 1968-69. This decrease, in excess of 50
per cent, resulted in the 75+ per cent rate of attendance
category being the one with the least proportion of
enrollees in 1968-69.
Equally alarming to the above is the fact tYlt the
"slack" left by the large decrease in the 75+ per cent
attendance category was "taken up" by a steady increase
88

77
over the four-year period in the proportion of students
only attending 25-50 per cent of the scheduled classes.
The percentage of enrollees in the under 25 per cent atten-
dance category and 50-75 per cent category have also
increased from year to year; however, tneir rate of increase
has been less dramatic than that of the 25-50 per cent
category. It should be noted that the 25-50 per cent
category had the fewest percentage of enrollees in 1965-66
(13.7 per cent) but by 1968-69 it constituted the largest
single attendance category (28.2 per cent) of enrollees.
Only a very minute percentage of initial enrollees fail to
ever attend an additional class session. These persons are
represented on the chart as "never attended."
Examination of the four-year totals in Chart XXIX
shows the largest "rate of attendance" category to be the
75+ per cent group. The second, third, and fourth largest
were the 50-75 per cent category, the 25-50 per cent cate-
gory as the under 25 per cent category, respectively. however,
as indicated above, a comparison of the trend lines with
the four year totals makes the deceptive nature of the
latter obvious--if present trends continue, a radical
re-ordering of "per cent of attendance" categories will
occur in the near future.
89 '

145
4.)
30
15
75+%
CHART XXIX (TABLE A-XXVII)
ATTENDANCE (1ST 100 HOURS):
TREND LINES AND 4-YEAR TOTALS
---...............-x
50-75%
.,
..../... ...--".... 4
----
..........1,
--
Under
lt. ...... ............ ;;;,04*...... - .....-- ...
25%
25-50%
*./..*-
Never
dP
GO
Iner Never
65-66
66-67
67-68
68-69
75+
50-75 25-50
25 Attended

79
. attendance vs Sex
Chart XXX (Table XXVIII) examines the attendance
patterns of males and females. Attendance is discussed in
terms of the percentage of classes which enrollees attended
during their first 100 hour instructional period. As may
be noted, the largest "per cent of attendance" category
for both sexes was the 75+ per cent group. In fact, with
one very slight exception, the "rate of attendance"
categories were ranked in the same order for males and
females, namely, 75+ per cent, 50-75 per cent, 25-50
per cent, under 25 and finally "never attended."
Note that in the higher "rate of attendance"
categories the proportion of females always, though only
slightly, exceeded the proportion of males. For example,
while 31.6 per cent of the females were in the 75+
per cent group only 29.1 per cent of the males were;
and while 25.0 per cent of the females were in the
50-75 per cent category of attendance, the corresponding
figure for males was 24.6 per cent. Conversely, for lower
"rate of attendance" categories the proportion of males
always slightly exceeded the proportion of females,
with the exception of the "never attended" category.
01

CHART XXX (TABLE A-XXVIII)
ATTENDANCE (1ST 100 HOURS) VS. SEX:
4-YEAR TOTALS
% of classes
Attended:
75+
Sex:
50-75
25-50
Males
n er
'ever
Under
Never
25
Attended
75+
50-75
25-50
25
Attended
Females

tx
I
81
In liht of the insight gleaned from the trend linen
for attendanc3 shown in the Chart XXX, an examination of
possible trends with respect to sex differences in rates of
attendance is in order. Trend lines, as such, are not
presented for this comparison; however, the data on which
the following discussion is based may be found in the
Appendix in Table A-XXVIII. From Table A-XXVIII it is
evident that the proportion of both males and lemales in
the 75+ per cent attendance category has dropped steadily
over the four-year period studied. The drop in this category,
however, has been slightly more severe for females than for
males. In 1965-66, 41.6 per cent of the males attended
75+ per cent of the scheduled classes. However, by 1968-69
this per cent has decreased to 20.1--on the other hand,
the proportion of females in this same "rate of attendance"
category fluctuated from 44.8 per cent in 1965-66 to
20.5 per cent in 1968-69.
Table A-XXVIII also shows the increase in the pro-
portion of enrollees in the 25-50 per cent rate of attendance
category to be the most consistent and dramatic one over the
four-year period studied. While this was true for both
sexes, the increase in the proportion of males in this
category was more intense than the increase in the proportion
of females in this same attendance category.
Both sexes showed an increase in the proportion of
members in the under 25 per cent attendance category. While
9 3

82
both sexes increased their numbers in this category by
approximately six percentage points from 1965-66 through
1968.59, the increase observed for males was a gradual
year to year increase, while the six percentage points
gained by females resulted only after annually fluctuating
of increases and decreases. This might be intepreted as
meaning the male "trend" toward an increasing proportion
of enrollees under 25 per cent of the 100 hours of classes
is a more stable and reliable one than the corresponding
trend for females. As for the attendance category 50-75
per cent, the proportion of males and females in this
category has fluctuated, but generally increased since
1965-66.
In sum, the four-year totals show that for both
males and female', the plurality are in the 75+ percent
attendance category. However, the year to year data reflect
a steady, four-year decline in the proportion of enrollees
in this attendance category, for both sexes--the moat intense
decline being observed of females. Likewise the proportions
of enrollees in the 25-50 per cent and under 25 per cent
attendance categories have generally increased--with the
increase of the former being the most intense, and being
particularly so for males. For this reason,'one can only
surmise that the rate of attendance during the first 100
hours has experienced considerable decrease, and, if trends
may be inferred from the past year to year data, it appears
9I,

83
such decreases may continue. This holds true for both male
and females; however, it is not yet clear for which sex
these decreases are most severe.
Attendance vs Years ofPrevious Schooling
Chart XXXI (Table A-XXIX) provides for a comparison
of attendance in terms of the years of previous schooling
completed by enrollees. By comparing extreme groups in
terms of the years of previous schooling (thore with 0-3
years vs those with 12+ years) a most revealing relationship
between amount of previous schooling and rate of class
attendance is revealed. Note that those with 0-3 years
of schooling were over three times more likely never to
attend classes after initial enrollment than vere those
with 12+ years of schooling per cent for the former
and 1.1 per cent for the latter). The former only repre-
sented 3.9 per cen, of all persons with 0-3 ynars of
previous schooling, but it was the. nighest proportion noted
for the "never attended" (none) category. By combining
the attendance categories "under 25 per cent" and "none"
for these same groups (0-3 and 12+ years of previous schooling),
it is evident that more than one-fourth of the 0-1 years
of previous schooling group was in such a combined category,
while slightly over one-fifth of the 12+ group was so classi-
fied. This disparity was the largest noted when the same
attendance category was examined for the other "years of
previous schooling" groups.

30
15
% of Classes
Attended:
CHART XXXI (TABLE A-XXIX) PART I
ATTENDANCE (1ST 100 HOURS) VS. YEARS
OF PREVIOUS SCHOOLING:
4-YEAR TOTALS
\L.r\ 0
r.,
tr%w
+I
L.r\o tr\
0r--
L.r\cJ
Years of Pre-
vious Schooling:
0-3 Years
u-Ncl;
tn+'xi
o tr\0
LIN(11
4-6 Years
tr%C
"
En 0
Tr
0)0)
4-I
IVZ
0r--
cv
7-9 Years

CHART XXXI (TABLE A-XXIX) PART II
ATTENDANCE (1ST 100 HOURS) VS. YEARS OF PREVIOUS SCHOOLING:
4-YEAR TOTALS
30
15
4)zC)
V;acuR
.% of Classes
Attended:
incv
in c);..
N- LIN
CD
CD
+I
IV
ZU
. 0in
Z 0
N.
LCI
C\J
M Z
Years of Pre-
vious Schooling:
10-12 Years
Lf \C
V
LI\ 0;-
N- LI \
CD
CD
+I
IV
ZL.n
-;...,Lc,
Z 0
c- inC
u MZ
12+ Years

86
Further reflective of the possible relationship
between class attendance and the years of previous school
was the fact that the highest proportion of students (54.5
per cent) in the 75+ per cent attendance category was noted
for the 12+ years of schooling group. Conversely, the
lowest percentage (46.0 per cent) of enrollees in this
attendance category was among the group with only 0-3
years of schooling. Also, the modal attendance category
for the 12+ years of schooling group was the 50-75 per
cent category, while the 25-50 per cent attendance category
was the mode observed for the 0-3 years of schoolirg group.
By comparing all groups, it may be noted that as
the number of years of previous schooling increases the
proportion of enrollees in the 75+ per cent attendance
bracket generally increases too. Likewise as the years of
previous schooling increase!, a general concomitant increase
in the proportion of students in the 50-75 per cent atten-
dance bracket is noted. The proportion of enrollees in
the 25-50 per cent attendance' category and the under 25
per cent category fluctuates to such a degree that no general
relationship was discernible for such categories.
Reading Growth
The degree of reading growth observed after the
first 100 hours of instruction is presented in Chart XXXII
(Table A-XXX). It should be noted that reading growth
was measured in terms of the number of grade level equivalents
98

87
advanced--specifically 0.0 grade levels, 0.5 to 1.5 grade
levels, or 2.0+ grade levels. Trend lines in Chart XXXII
reveal that for each year studied the majority of enrollees
experience a reading grade level gain of 0.5-1.5. The second
largest group of enrollees (ranging approximately between
31 and 37 per cent), experienced no (0.0) grade level gain
after 100 hours of instruction, while a range 3.2 per cent
to 9.4 per cent showed gains of 2.0 grade levels or more
after the same amount of instruction.
The four-year totals show that 58 per cent of the
enrollees gained 0.5-1.5 grade levels in reading after 100
hours of instruction, 35.3 per cent gained no (0.0) grade
levels, and 6.7 gained 2.0+ grade levels. In other words,
nearly 65 per cent of the students experienced a grade level
growth in reading of 0.5 or greater after 100 hours of
instruction. Perhaps the most interesting and most encouraging
observation noted from examining the trend lines is the
three consecutive years of increase in tio proportion of
persons gaining 2.0 grade levels or more after 100 instruc-
tion hours--nearly tripling from 1965-66 (3.2 per cent) to
1167-68 (9.4 per cent). However, as noted, a decline was
noted in 1968-69. Hopefully this decline reflects only 4
minor fluctuation and not a serious interruption of a
previously established three-year old "trend."
99

CHART XXXII (TABLE A-XXX)
READING GROWTH AFTER 1ST 100 INSTRUCTIONAL HOURS:
TREND LINES AND 4-YEAR TOTALS
70
0.5-1.5
60Grades
sLevels
fxX
504)C)
co
c)
40
0.0
co
Grade
X-
Levels
...
30
20
!!!
10
2.0+
Grade
,evels6566
66=-67
67L68
681'69
0.0
0. -1.5
2.0+
Years
4-Year Totals

89
Reading Growth vs Age
The grade level reading growth obtained after the
first 100 instructional hours period is presented in Chart
XXXIII (Table A-XXXI). The enrollees under age twenty had
the lowest proportion of persons path no (0.0) grade level
growth (32.9 per cent), or conversely, the highest propor-
tion of persons with 0,5 or more grade levels advanced after
the first 100 hour period (67.1 per cent). Enrollees fifty
years of age or older were at the other e'Atreme in terms
of reading achievement. This oldest category of enrollees
had the highest proportion .af persons making no (0.0) grade
level gains in reading after the first 100 hour period
(37.5 per cent) and the lowest proportion with gains of
0.5 or greater (62.5 per cent).
From examining reading growth of the other age
categories of enrollees it becomes even more obvious that
as the age of participants increased, the proportion making
no achievement gains in reading also increased,or stated
another way, as age increased, the proportion of enrollees
gaining 0.5 grade levels in reading after the first 100
instructional period decreased. Note that for enrollees
under 20, the proportion with no reading achievement gain
was 32.9 per cent; for those 20-34-34.4 per cent; for those
35-49-36.0 per cent and for those 50 or older--37.5 per cent.
One curious finding which was somewhat of an excep-
tior, was that the under 20 age group, though generally the
101'

70.
6o
150 -
4030 -
20 -
10 ..
Grade Level Growth:
Age:
CHART XXXIII (TABLE A-XXX)
READING GROWTH (1ST 100
HOURS) VS. AGE:
14-YEAR TOTALS
UL
f1
oO0
cm
Under 20
orO
LINin
HH
I+
I-I-
oLI,
oO
u0
Oo
cm
o0
e
20-34
35-39
1/1
I-4
Otr%
0050 or Older

91
highest achievement group, had the smallest proportion of
persons advancing 2.0+ grade levels. The age category
with the highest proportion of enrollees in this achieve-
ment-gain group was, however, the next-to-the youngest
group--those age 20-34. It should be noted that with this
exception, of the under 20 age group, the same inverse
relationship between age and grade levels advanced in
reading after the first 100 hours held true for the remaining
age categories of enrollees. For example, for the 20-34
age group, 7.2 per cent gained 2.0 or more grade levels in
reading. However, for the 35-49 age group and 50 or older
age group, those experiencing 2.0 or more grade level gains
progressively decreased to 6.7 per cent and 6.0 per cent,
respectively.
Reading Growth vs Sex
The amount of reading growth, by sex, is shown in
Chart XXXIV (Table A-XXXII). It is quite clear from exami-
nation of this chart that female3experienced greater gains
in reading growth after the first 100 hours than did males,
though the differences were not extreme. For males, 37.4
per cent experienced no (0.0) gains in reading growth during
this instructional period, while the corresponding figures
for females was 34.3 per cent. Males with reading achieve-
ment gains of 0.5-1.5 grade levels represented 56.7 per
cent of the total male population, while 58.5 per cent of
the females were in such an achievement category. Also,
10j

4)z
a)
92
CHART XXXIV (TABLE A-XXXII)
READING GROWTH(1ST 100 HOUR) VS. SEX: 4-YEAR TOTALS
60 -
GradeLevelsAdvanced:
H
N;
Sex: Males
104
Females

93
only 5.9 per cent of the males gained two or more grade
levels in reading after the first 100 periods, while 7.2
per cent of the female population did so.
Reading Growth vs Years ofPrevious Schooling
Do enrollees with different levels of formal
schooling differ with respect to grade levels advanced in
reading after the first 100 hour instructional period?
Chart XXXV (Table A-XXXIII) is addressed to this question.
The largest proportion of persons gaining 2.0 or more grade
levels was found among those enrollees who had completed
12 or more years of schooling prior to enrolling in ABE.
This proportion (9.6 per cent) was nearly three times
larger than that observed for enrollees with only 0-3 years
of schooling (3.2 per cent). Also evident from Chart XXXV
is the fact that as the years of previous schooling increased,
the proportion of enrollees gaining 2.0 or more grade levels
consistently increaseitoo. Other insights gleaned from
examining Chart XXXV wore: (1) as the years of previous
schooling increased, the proportion of enrollees experiencing
no (0.0) reading achievement gain generally decreased- -
the highest proportion of "no gains" being observed among
persons with 0-3 years of schonl (42.7 per cent) and the
lowest proportion of "no gains" among persons with 10-12
years of schooling (31.7 per cent); and (2) as years of
previous schooling increased, the proportion of enrollees
. ,
105

4-)a)
c.a)
6050030
2010
CHART XXXV (TABLE
A-XXXIII)
READING GROWTH IN
GRADE LEVELS VS. YEARS
OF PREVIOUS SCHOOLING:,
4-YEAR TOTALS
Grade Levels
Advanced:
O
Previous
Schooling:
0
0-3 Years
H4-N
00
4-6 Years
7-9 Years
.-4I+
0is\
00
0(N
J
10-12 Years
12f

95
gaining 0.5-1.5 grade levels also generally increased--the
lowest proportion (54.1 per cent) being observed among
the 0-3 years of schooling group and the highest proportion
(59.6 per cent) among the group which had completed 10-12
years of previous schooling.
Reading Growth vs Attendance
In Chart XXXVI (Table A- XXXIV), reading growth
experienced during the first 100 hour instructional period
is compared with rates of attendance during that same
period. Consistently, as the rate of attendance decreased
the proportion of enrollees experiencing no (0.0) gains in
reading increased. Of those who attended less than one-
fourth of the classes, 45.7 per cent had no achievement
growth in reading. For those attending from one-fourth
to one-half of the classes, 40.6 per cent did not experience
grade level gains in reading. Of the enrolled who attended
one-half to three-fourths of the classes, 34.9 per cent
showed no reading gains, while for those who attended more than
three fourths of the scheduled class, only 32.6 per cent
did not experience reading growth.
A second consistent finding revealed by Chart XXXVI
was that as attendance increased so did the proportion of
enrollees gaining 0.5-1.5 grade levels. For the group which
attended less than one-fourth of the classes, only 46.0
per cent gained 0.5-1.5 grade levels. Of those who attended
from one-fourth to one-half of the classes, 53.1 per cent
107

96
had gains of 0.5-1.5 grade levels. For enrollees who
attended one-half to three-fourths of the classes, 59.7
per cent had grade levels ranging from 0.5-1.5, while 60.8 per cent
of the group which attended more than three-fourths of
the classes had reading growth gains of 0.5-1.5 grade levels.
One finding revealed in Chart XXXVI which seemed
rather inconsistent with the relationships between reading
growth and attendance presented above was that the highest
proportion of persons gaining 2.0+ grade levels was found
among the group which attended less than one-fourth of the
class meetings; however, the three-fourths attendance group
was observed to have the second highest proportion of such
"gainers." If the 75+ per cent attendance group is excluded,
Chart XXXVI shows a progressively greater proportion of
persons gaining 2.0+ grade levels in reading as attendance
decreases--an observation inconsistent with previously
reported data and logic. One possible explanation might
be that those most capable of gaining 2.0+ grade levels in
the first 100 hour instructional period were also the most
capable self directed learners. Thus such persons with
appropriate materials and guidance could have achieved much
success with a minimum degree of class attendance, while
those less capable students had to attend a greater number
of classes in order to achieve any grade level gains in
reading growth. The essence of this speculation is that
perhaps some of the poorest attenders were very capable
108.
I
I
I

ti
0 \
6o
50
4.)
40
a)
30
a
20
10
Grade Level
Gain:
75+%
No. of Classes
Attended;
CHART XXXVI (TABLE A-XXXIV)
READING GROWTH (1ST 100 HOURS)
VS. ATTENDANCE:
4-YEAR TOTALS
OL
C1
0
50-75%
IPO
P:I
HLr
25-50%
OC \I
O0
Hto
Under 25%
0C\-1

98
students who could do well on their own. Clearly, however,
Chart XXXVI shows that most poor "attenders" were the
poorest performers in terms of achievement gains.
Reading Growth vs Class Levels
Chart XXXVII (Table A-XXXV) is concerned with the
degree of grade level growth in reading exhibited by the
different class levels. All class levels had in excess of
60 per cent of their enrolleeexperiencing achievement
gains in reading. The largest proportion of "gainers" was
noted among students enrolled in the upper level; the
second largest--among primary level enrollees (65.9 per cent);
the third largest--among non-English level enrollees (64.7
per cent); the fourth largest--among intermediate level
enrollees (64.5 per cent) and the smallest proportion- -
among students in the basic level (62.3 per cent).
Excluding the non-English level enrollees, Chart
XXXVII shows that as the academic class level increased from
basic to upper, the proportion of enrollees gaining 2.0
or more grade levels in reading also increased. The per-
centage of 2.0+ "gainers" in the upper level was nearly
three times greater than that observed for the basic level
and more than twice as great as that found for the primary
level.
Also evident from Chart XXXVII is the faot that the
modal reading achievement gain within each class level was
0.5-).5 grade levels. This largest proportion of persons
110.

Q.
Grade Level
Growth:
Class Level: 60453015
oOo
Non English
CHART XXXVII (TABLE
A-XXXV)
READING GROWTH (1ST
100 HOURS) VS. CLASS
LEVEL
HH
1+
I+
uNo
oIs \
00
0N
00
N
Basic
Primary
lc\L
I1
+C
.L
no
0In
\0
Intermediate
Upper

100
making such gains was found within the primary level.
Finally, it is known that the non-English level differs
from the other four levels in that it does not constitute
a component of the academic hierarchy of class levels
(i.e., basic, primary, intermediate, upper)--that is to say
it is probably more heterogeneous in terms of the educational
level of enrollees. However, Chart XXXVII shows that on the
whole non-English level enrollees tend to most closely
resemble the reading growth patterns exhibited by the inter-
mediate level enrollees.
Reading Growth V3 ArithmeticGrowth
Chart XXXVIII (Table A-XXXVI)provides for a compari-
son of the relationship between reading growth and arithmetic
growth during the first 100 hour instructional period.
Controlling for reading growth, reveals that (1) most
(53.6 per cent) who had no reading gain also had no arithme-
tic gains, but that a large proportion (43.9 per cent)
gained 0.5-1.5 grade levels in arithmetic and even 2.5 per
cent gained 2.0+ grades in arithmetic while showing no
reading gains, (2) most (64.5 per cent) of those who gained
0.5-1.5 levels in reading also gained 0.5-1.5 levels in
arithmetic, (3) most (50.8) of those whose gain 2.0+
levels in reading only gained 0.5-1.5 levels in arithmetic,
but that nearly one-third (32.1 per cent) gained 2.0+ levels
in arithmetic also.
112

7060
50
4)
40
0. c.)
30 "
20
10"
CHART XXXVIII (TABLE A-XXXVI)
READING GROWTH (1ST 100 HOURS) VS. ARITHMETIC
GROWTH (1ST 100 HOURS)
Arithmetic
0.5-Growth:
0-0
1.5
2.0+
Reading Growth:
0.0
0.0
0.5-
1.S
0.5-1.5
2.0+
0.5-0.0
1.52.0+
2.0+

102
Controlling for arithmetic growth reveals (1) a
direct relationship beL.ween reading growth and the pro-
portions of enrollees showing gains of 2.0+ in arithmetic- -
as reading growth increased the proportion of persons
gaining 2.0+ levels in arithmetic increased (from 2.5
per cent for person3with no reading growth to 32.1 per cent
for persons with 2.0+ levels of reading growth); and
(2) an inverse relationship between reading growth and
the proportion of enrollees with no arithmetic growth- -
as reading growth increased, the proportion of enrollees
with experiencing no arithmetic growth decreased (from
53.6 per cent for persons with no reading growth to 17.1
per cent for persons with 2.0+ levels of reading growth.

CHAPTER III
SUMMARY, CONCLUSIONS, AND RECOMMENDATIONS
1. Between 1965-66 and 1966-67, the New YorkState ABE program experienced an enrollment increase inexcess of 71 per cent. No doubt this rapid enrollmentgrowth was, in part, a function of the increased fundinglevel made possible through the Adult Education Act of1966. However, since the 1966-67 peak enrollment of11,531 students, enrollments have steadily declined, fallingto 8,571 students in 1967-68 (a decrease of 25.67 per centin the 1966-67 figure) and to 7,116 students in 1968-69(a decrease of 16.97 per cent in the previous yearsenrollment and a 38.28 per cent decrease in the peak enroll-ment established two years earlier). Program administratorsattribute these decreases in enrollment to the re-establishmentof lower levels of funding for the program. Although itappears that downward trends in enrollment have begun totaper off, unless a higher level of funding is restored,f'rther decreases, though slighter ones, may be forthcoming.
2. The largest single class level in the New YorkState ABE program is the non-English level. More than one-third of the 33,952 enrollees from 1965-66 through 1968-69were in non-English classes. The second largest group wasrepresented by the intermediate level, while the basic,upper, and primary levels ranked third, fourth and fifthin order of the proportion of students enrolled in each.No trends in enrollment patterns within the various classlevels were noted.
3. In terms of the age of enrollees, the ABEprogram was found to be a relatively young one. The modalage of participants was found to be 20-29 years of age foreach of the four years studied. Trends toward an increasingproportion of enrollees under 35 years of age were clearlyevident from the data. Nearly three-fourths of the enrolleesfrom 1965-66 through 1968-69 were under 40 years of age.Persons 50 years of age or older constituted only about11 per cent of total enrollment during this period. Anobviouv inverse relationship between age and enrollmentin ABE was revealed in this study.
103
115

104
In light of the fact that older adults were revealedin this study to be more disadvantaged in some respects than
younger adults (see items 14 and 29, for example), it wouldseem important for the program to make an all out effortto recruit a large proportion of older adults. Although thepotential for economic gain may not entirely warrant such amove, certainly the equally important humanitarian gains do.
4. During the period studied, the ABE program wasfound to have a predominately female enrollment. Also, some-what of a "trend" was noted toward an even greater disparitybetween male and female enrollments in the future. Overthe four-year period, for every two males in the programthere have been three female enrollees. Again, the impli-cations for recruitment are obvious--the disproportionate,under-representation of males is undesirable. Under-educated males, particularly the young, heads of householdsand "breadwinners" must be involved in the program. Thedifficulty of securing such involvement will no doubt beas difficult as it will be expensive. Job schedules, apathyand a strange, negative sort of pride are just a few of thebarriers to be overcome in this effort.
5. The ABE program has been predominately comprisedof members of the white race (includes Puerto Ricans) eachyear since 1965-66. Total enrollment figures over the4-year period studied showed nearly twice as many whiteenrollees as Blacks. "Other" races represented only 5.5per cent of the 33,952 persons enrolled in the programduring this period. However some evidence of a trendtoward a decreasing proportion of white enrollees wasnoted. Year to year fluctuations in Black enrollmentsmade any such trends considerably less apparent, however, apast trend toward decreasing proportions of "other" enrolleesappeared to have been revised as evidenced by the proportionof that broup of enrollees nearly doubling during the years1967-68 and 1968-69. Once more, specific recruitment effortsneed to be directed toward the more extensive involvementof "other" racial categories in the ABE program.
6. Examination of enrollment data with respect torace and sex concurrently revealed several interestingfindings:
(a) when comparing race and sex in terms of the totalenrollment, the largest category of enrolleeswas found to be white females. While males andBlack females constituted the second and thirdlargest categories of enrollees, respectively.
116

105
"Other" females and other males were the next tothe smallest and smallest categories of enrollees,respectively;
(b) For each racial group the proportion of femalesalways exceeded the proportion of correspondingmales;
(c) The slight trend toward increasing proportions ofnon white enrollees noted earlier, was found to beprimarily attributable to non-white females ratherthan non-white males;
(d) When comparing race and sex in terms of the totalnumber of enrollees of a given race, it was foundthat the disparity between male and female enroll-ment was greater for Blacks than for any other racialgroup. The second largest such disparity existedamong "other" racial groups. The male-femaledisparity in enrollment for the white race was thesmallest noticed.
(e) For each racial category there were substantialindications of trends toward even greaterdisparities in male-female enrollments--particularlyamong the "other" racial groups and Blacks. Buildingon an earlier recommendation, the male-female enroll-ment disparity is a serious one, particularly forBlacks and "others." Development of recruitmentstrategies fora more extensive involvement ofmale non whites seems to be most urgent. It should,EWFver, be noted here that the existence c,f theabove disparity is by no means unique to New YorkState, the problem has become a common one innearly every state.
7. A plurality of enrollees were married andliving with their spouses. The second largest group ofenrollees were single. Trend lines indicated a generalyear to year decrease in the former category and a similarincrease in the latter. Tf such trends continue it appearsthat these two groups will shortly become equal with respectto the proportion of program each comprises, and thatsingle enrollees may soon represent the plurality of theprogram's enrollment. A much less intense, yet consistentupward trend was also noted for the proportion of enrollees.rho were married but were living without their spouse.
8. Most enrollees had children at home. Of thosewith children the plurality had 1-2. Trend lines revealeda general decrease in the proportion of enrollees reporting
11'7

106
no children at home and in the proportion reporting 5 ormore. At the same time a consistent upward trend was notedfor those with 1-2 children at home and a somewhat lessconsistent upward trend noted for persons with 3-4 suchchildren. The implications are justification for childcare services are inherent in the above findings andtrends.
9. The largest citizenship group represented inthe program was the native U. S. citizen. This held truefor each year's data studied. The second largest groupwas consistently found to be the alien category, while thenext to the smallest and smallest citizenship groups werethe native Puerto Ricans and naturalized categories,respectively. Trend lines with respect to these groupsindicate a trend toward a mildly increasing proportion ofnative Puerto Ricans. Also noted wan a two consecutive yearupswing in the alien group following a decrease in thiscategory in 1966-67. On the other hand the native group wasobserved to decrease in 1968-69,ending a three consecutiveyear increase.
10. Less than half of the program enrollees useEnglish as the primary language spoken in the home. How-ever, the group which did use English in the home repre-sented the plurality of students. The second most frequentlyused language (in the home) was Spanish. In essence, therewould appear to be a need for ESL materials in many, ifnot moat ABE learning environments. Likewise, a concurrentlyindicated need would be the training of teachers in the useof ESL materials and instructional techniques.
11. The majority of alien and native Puerto Ricanswere, as might be expected, enrolled in non-English levelclasses, as was a plurality of the naturalized group. Aninverse relationship was noted for the academic class level(basic through upper) and the proportion of alien and nativePuerto Ricans enrollments in each - -as the academic classlevel increased the percentage of alien and native PuertoRican enrollees decrease. Finally, the largest proportionof enrollees in the upper class level were from the nativecitizenship group.
12. Examination of class levels in terms of theirracial composition revealed that the majority of the enrolleesin the non-English, basic and upper levels were white. illacksconstituted the majority racial group in the intermediatelevel, while the proportion of white and Blacks in the primarylevel was nearly equal. Examination'of racial groups interms of their distribution across class levels revealedthat nearly half of the whites (includes Puerto Ricans)
118

107
were in the non-English level, while one-fourth of the whiteswere in the basic and primary levels and one-fourth in theintermediate and upper level. For Blacks, more than halfwere in the intermediate and upper levels. Nearly 60 percent of the "other" racial categories were in non-Englishlevel courses, while only about 16 per cent were in theintermediate and upper levels.
13. The modal number of previous school years com-pleted was found to be 7-9 years for each year studied.The second largest number of enrolleeiEid completed only4-6 years of schooling prior to entering the program. Thesmallest proportion of enrollees were found among the extremesof the "years of previous school continuim"--those withless than 3 years of schooling and those with more than12 years. Trend lines indicated an increasing number ofenrollees with 7-9 years of schooling. On the whole,trend lines reflected a decline in the enrollment of personswith very low education levels, as measured by years ofprevious schooling completed. In light of such a decline,there would seem to be a need to, again, initiate specificrecruitment efforts aimed at the recruitment of potentialstudents who have completed only very low levels of formaleducation. In other words, increased identification andinvolvement of the illiterate and functionally illiterateinto the program.
14. Persons under age 25 constituted the "best" educatedgroup in terms of years of school completed. More than 75per cent of this group had completed seven or more years ofschooling and 37 per cent had completed 10 or more years.It was noted that as age increased, the proportion of enrolleeswho had completeu the above levels of schooling generallyprogressively decreased. For persons under age 34, themodal number of school years completed was 7-9, for persons35-44 the mode was 10-12 years, while the mode observedfor persons 45 or older was 4-6 years of previous schooling.These data reinforce earlier suggestions made with respectto the "hard-core" nature of the older adult and the necessityof focusing specific kinds of recruitment efforts toward him.
15. Female enrollees were found to have had moreyears of previous schooling than males. Nearly two-thirdsof the former had completed seven or more years of schoolwhile less than 60 per cent of the males had done so.Likewise a larger proportion of females had completed 10or more years of school than had males--30 per cent forfemales and 24.6 per cent for males. However, the modalnumber school years completed by each was 7-9 years.Enrollees at both extremes of the educational continium(.;hose with less than three years of previous schooling
114

108
and those with more than 12 years)were noticeably small in
number. In sum, males tend to have lower levels of formaleducation, yet, as previously reported, only about onethird of the program consists of males. Once again, thesefacts reinforce the need for an effective program ofrecruitment to involve greater numbers of males.
16. In terms of the number of years of previousschooling completed, the native citizenship group, followedby alien enrollees, appeared to be the "best' educated group.Nearly seven of ten native enrollees had completed sevenor more years of schooling, and 28 per cent had completed10 years or more. Pollowing closely, the correspondingproportions noted for alien enrollees were 63.5 per centand 33.6 per cent, respectively. The modal number of schoolyears completed by each of these groups was 7-9 years. Thenative Puerto Rican and naturalized enrollees had the lowestlevels of education for all groups (in terms of years ofprevious schooling). 'When teachers are dealing with thesegroups of students, they should be cognizant of the latter'sprobable level of previous schooling and the various instruc-tional implications thereof.
17. On the whole, basic level enrollees had completedfewer years of previous schooling than had enrollees in theother class levels. For both the non-English level and basiclevel, the modal number of school years completed by enrolleeswas 4-6 years. The mode observed for the primary, inter-mediate and upper leVel was 7-9 years. Generally, it wasnoted that as the academic class level advanced (from basicthrough upper) the proportion of enrollees with 6 or feweryears of schooling decreased, or conversely the proportionof enrollees with 7 or more years of schooling increased.Data in this study made it very apparent that the use of"years of previous schooling completed" to judge an indivi-dual functioning level was to a great extent unreliable- -as evidenced by the fact that nearly half of the basic levelenrollees had completed 7 or more years of formal educationprior to entering the ABE program.
18. The modal number of school years completed byeach racial category of enrollees was 79 years. Generally,Black enrollees were found to be "bet,:er educated" (in termsof previous schooling completed) than were "others" andwhites (whites included those of Puerto Rican descent). Morethan 65 per cent of Black enrollees had completed 7 or moreyears of school while the corresponding figures for "others"and for whites were 62.1 per cent and 61.1 per cent respectively.The largest proportion of persons with only 03 years ofprevious schooling were "others" the smalket proportion ofsuch enrollees were whites.
120

109
19. More than half of the program's enrollment from1965-66 through 1968-69 completed their schooling in acountry other than the United States--19.4 per cent in PuertoRico and 35.4 per cent in other countries. The largestgroup receiving their previous schooling in the UnitedStates were from the northeast. The second largest groupof such enrollees were from the south. Enrollees who hadcompleted their school in the mid or far west constitutedonly a very small proportion of the program's enrollment.Teachers should be aware of these diverse backgrounds ofenrollees, particularly if experiential teaching approaches(say to the teaching of reading) are followed.
20. The great majority of enrollees had at one timeor another been gainfully employed. However, there wassome evidence to indicate a trend toward the program involvingan increasingly larger proportion of persons who had neverbeen so employed. Tais possible trend might be indicativeof the program's involvement of a great proportion of hard-core disadvantaged. adults; however, this interpretation issomewhat in conflict with the data cited earlier with respectto decreases noted in the proportion of enrollees with verylow educational levels (years of previous schooling).
21. A definite relationship was noted between thenumber of years of previous schooling completed by enrolleesand whether or not they had ever been gainfully employed.As the number of years of previous completed schoolingincreased, so did the proportion of enrollees who reportedever being gainfully employed.
22. Examination of racial differences with respectto gainful employment revealed that a larger proportion ofBlacks reported having had gainful employment than aidany other group. Whites in the program (which includedPuerto Ricans) ranked second in this respect, while "others"had had the least success in securing gainful employmentduring their lives.
23. At the time of program entry, most enrolleeswere or had been (within the previous two years) gainfullyemployed.
24. Most participants reported being currentlyemployed at the time of entry registration. However, thejobs held at that time were clearly ones which did not demanda high or even relatively high level of education or pro-ficiency in communicative and computational skills. Examplesof such types of jobs were domestics, housewives, serviceoccupations, and semi-skilled and unskilled workers. Nearlythree of five (57.6 per cent) enrollees were employed 'n such
121

110
occupations. Holders of jobs requiring higher educationallevels and relatively higher proficiencies in communicativeand computation skills, such as clerical workers, salespersonnel, and skilled workers, were noticeably in theminority (11 per cent). Of the 33,952 persons who hadparticipated in the program, nearly 16 per cent were unem-ployed at entry. This rate of unemployment along with thetypes of jobs held by those who were employed both tendedto underscore the relationship between economic deprivationand adult undereducation, and the need for pre-vocationaland vocational education opportunities to become integralcomponents of every ABE program.
25. Over the four-year period from 1965-66 through1968-69, 6.7 per cent of all enrollees completed the program,32.6 per cent did not complete the program and 60.7 per centwere recycled. While this one-third dropout rate was highand undesirable, it should be noted this figure closelyparalleled that commonly experienced by secondary schools.This point is alluded to not to justify the observed drop-out rate but merely to provide some perspective of theserious, yet common, problem of maintaining enrollments ineducational programs.
Trend lines with respect to the above data wereencouraging:
(a) since 1965-66 a steady increase in the proportionof persons completing the program was observed;
(b) since 1966-67 the dropout rate declined -.from38.5 per cent in 1966-67 to 28.9 in 1968-69; and
(c) since 1966-67, yearly increases in the proportionof students who recycled were evident.
Finally, one interesting point noted W2s that the dropoutrate sharply increased in 1965-66. This was also the yearthat the program experienced by increase in enrollment ofmore than 70 per cent. Although this is sheer speculation,the sharp increase in dropouts which accompanied the sharpincrease in enrollment might be explained by the program'sinvolvement of a larger proportion of people who would nothave ordinarily been reached by the program. The increasedfunding made possible by the Adult Education Act of 1966no doubt facilitated the recruitment of a larger proportionof "hard-core" undereducated and disadvantaged adults. Withsuch a possible change in the nature of the program'spopulation, an increase in the proportion of dropouts wouldnot be a particularly surprising occurrence.
122..

111
26. The dropout rate alluded to above was alsoput in a better perspective when reasons for dropping outwere examined. Most of these giving specific reasons fordropping out cited factors largely out of the influence of
the ABE program. Chief among such reasons was employment,others were illness and moving. Only a very small proportionof those giving specific reasons cited factors within therealm of influence of the program (i.e., hostility, poormotivation).
It seemed rather paradoxical that the most frequentlygiven reason for dropping out was related to employment.The ABE program, either directly or indirectly, is concernedwith making the undereducated odult more employable. However,when persons disengage from the program because of employment,they contribute to "increases" in the dropout rate. Thisphenomenon has been somewhat detrimental to all ABE programsin that one of the primary criticisms level at its concernsthe dropout rate. However, as shown in this study, theprogram-related reasons for dropping out were the least fre-quently given, while the most frequently given reason, employ-ment, was perhaps an indirect indicator of the program'seffectiveness rather than an indicator of program failure.
In any event, a major recommendation is for thedropout problem to be analyzed in greater detail. Such ananalysts should serve to give direction to the developmentof measures to increase retention rates. Obviously, the mostcrucial areas to be dealt with in an attempt to alleviatethe dropout rate, concerns the non-program related reasonsfor dropping out. Until the ABE program can develop agreater influence over participants' "extra -class "environmentand problems, maximum facilitation of students' in-classprogress cannot be attained.
27. Attendance totals for the four-year periodstudied revealed that the majority of participants attendedthe majority of scheduled classes and that a plurality ofenrollees attended more than three-fourths of the scheduledclasses. However, there is reason for serious concern overthe radical and consistent drop in the 75+ per cent attendancecategory since 1965-66. The proportion of enrollees inthis attendance category dropped in excess of 50 per centover the four-year period, and for the latest year studied,1968-69, it constituted the smallest attendance category.On the other hand, the 25-50 per cent attendance categoryshowed the most persistent and dramatic increase over thesame period. This category which more than doubled from1965-66 to 1968-69, constituted the smallest attendancecategory in the former year and the largest one in thelatter year This radical and negative re-ordering ofattendance categories has already occurred since 1965-66,however, if present trends are not reversed, it appeared
12

112
that the rate of class attendance will become even worse.The latest data, 1968-69,showed that the plurality of studentsonly attend 25-50 per cent of the classes. The second largestproportion attended 50-75per cent of the classes; however,nearly as many attended lees than one-fourth of the classes,while the smallest proportion attended more than 75+ percent of the classes. A concerted effort on the part of allstaff is needed to (a) determine the factors contributingto the above reductions in attendance and (b) implementmeasures to compensate for these factors. In light of therelationship between attendance and achievement, it isparticularly urgent to do so.
28. Attendance patterns for males and femalesshowed both to have suffered decreases in the 75+ per centattendance categories, the most severe being observed forfemales. On the other hand, the proportion of males andfemales in the other attendance categories,(50-75 per cent,25-50 per cent and under 25 per cent), increased. The largestof such increases for both males and females occurred in the25-50 per cent category but was most noticeable among males.In essence the decreases in class attendance (noted earlier)affected males and females in slightly different ways.However, there was insufficient evidence to suggest thatthese decreases had a greater effect among members of onesex as opposed to the other.
29. There was a general relationship found betweenyears of previous schooling and rate of class attendance.As the degree of formal education increased so did the per-centage of classes attended. The modal percentage ofclasses attended by persons with less than three years ofprevious schooling was found to be 25-50 per cent, whilemode flr persons with more than 12 years of previous was50-75 per cent. Such data strongly suggested that teachers,administrators, and paraprofessionals will have to makeextra special efforts in order to motivate entering students,with low levels of formal education, to attend classes ona regular basis.
30. Nearly two-thirds of the) enrollees experiencedgrade level growth in reading during the first 100 hourinstructional period. Most of these gained 0.5-1.5 gradelevels.Throughout the four-year period studied, the 0.5-1.5"gainers" and'ho gainers" remained relatively stable;however, a consistent increase in the proportion of personsgaining 2.0 or more grade levels in the first 100 hourswas noted from 1965-66 through 1967-68. The four-year totalsshowed that 58.0 per cent gained 0.5-1.5 grade levels, 35.3per cent gained no grade levels and 6.7 per cent gained 2.0+grade levels. These statistics should provide useful "norms"
124.

113
for judging the relative effectiveness and efficiency ofthe program in raising the reading growth level of enrollees
in subsequent years.
31. Data revealed a solid relationship betweengrade level gains in reading and the age of enrollees. As
age increased, the number of grade levels advanced decreased.Although the modal number of grade levels advanced for each
age group was 0.5-1.5, a direct relationship between increasingage and the proportion of "no gainers" was evident, as wasa general, inverse relationship between increasing age andthe proportion of enrollees gaining 2.0+ grade levels during
the first 100 instructional hours. The obvious implicationof these data was that teachers must give particular attentionto the older adult student if this student is to experiencegrade level gains which are equivalent to those attainedby younger students in the program.
32. Examination of the reading growth gains experiencedby the sexes during the first 100 hour instructional periodshowed that females slightly exceeded males in terms ofgrade level advancements. Fewer females gained no gradelevels, more females gained 0.5-1.5 grade levels, andmore females gained 2.0+ grade levels than did males.
33. Reading growth after the first 100 hour instruc-tional period was found to vary in accordance with thenumber of years previous schooling completed by enrollees.In general, those with higher former educational levelstended to achieve higher grade level gains. The largestproportion of "no gainers" was noted among the group with3 or fewer years of previous schooling. On the other hand,the highest proportion of 2.0+ "gainers" was observed amongpersona with 12+ years of previcus schooling. However,the modal reading growth for each "years of previous schooling"category was 0.5-1.5 grade levels. Again, a major implicationdrawn from these data was that the student with a lower levelof formal education will have to receive special attentionif the grade level gains he experiences are to be equivalentto those experienced by students with higher levels of formaleducation. Though all ABE students enter the program "edu-cationally disadvantaged," clearly the above findings (alongwith those reported in item 29) show that some students aremore disadvantaged than others. In essence, differentiallevels of "compensatory" education must be initiated foreach individual in the ABE program if "equal" educationalopportunities are to be provided for all.
34. A strong inverse relationship was noted betweenrate of class attendance and grade level gains in reading.As attendance decreased, the proportion of enrollees making0.0 grade level gains increased. A direct relationship was
125-

1114
noted between attendance and reading growth of 0.5-1.5 gradelevels in the first 100 hour instructional period. Theserelationships tended to underscore the importance ofreversing past trends toward decreases in the rate of classattendance (items 25-26). It appears that the ABE programcan offer a great deal (i.n terms of academic gains) forpersons who are able or willing to regularly attend class.If effectiveness of the program is to be maximized, so toomust be enrollees' attendance. A detailed study of thereasons for declines in attendance patterns was fullywarranted by the results of this investigation. Such astudy is requisite to initiating measures to alleviatefactors contributing to declines in attendance.
35. In excess of three-fifths of the enrollees inevery class level experienced grade level gains in readingafter only 100 hours of instruction. The largest proportionof gainers was noted for enrollees in the upper level classes,while the basic level had the smallest proportion of gainersin an equivalent instructional period. As the academicclass level increased from basic to upper, a consistentincrease in the proportion of enrollees with gains of 2.0+grade levels was noted for each class. Such gainers werethree times more prevalent in the upper level as in thebasic level. The modal achievement gain noted for eachclass was 0.5-1.5 grade levels. Comparison of the achieve-ment patterns within the non-English level, revealed thatsuch enrollees exhibited growth patterns which were verysimilar to the intermediate level. The above data make itclear that generally the student in the beginning loweracademic class level is not as adequately prepared to learnas is the entering student found in a high class level.Teachers working in lower class levels should take particularcare to get such enrollees "ready to learn." This will nodoubt involve teaching the learner learning skills and howto learn more efficiently.
36. Considerable evidence of correlation betweenreading growth and arithmetic growth was revealed in thisstudy. Generally, as reading growth increased, so didarithmetic growth. However, it was also noted that asizeable proportion of persons experiencing no readinggrowth still progressed in arithmetic.

PART III
ABE IN THE BIG 10 CITIES--1970-71
127,

CHAPTER I
BACKGROUND
Introduction
As previously described in Part I "Evaluation
Design," this phase of the study called for the collection
of information through observation and interview techniques
to assess the effectiveness of the means and procedures
followed to achieve the objectives of adult basic education.
Although primary attention was given to an appraisal of the
Title III program, the programs of Welfare Education and
WIN were also examined.
Field visits and interviews were held in the
following areas: New York City, Yonkers, White Plains,
Utica, Niagra Falls, Buffalo, Schnectady, Rochester, Albany
and Syracuse.
In a majority of the cities nearly all or all of the
ABE classes were observed, and in all but Buffalo end New
York City at least half of the classes were obsxved. (In
115
128

116
New York City approximately 10% out of some 200 Title III
classes were-observed.)
It should be noted that all of 'Ile programs examined
were urban in character and that the oh ,:rvations reprted
herein may not be characteristic of ABE as it operates in
smaller communities, semi-urban, and rural settings. Each
urban area was found to be unique in terms of target popu-
lations, community organization and structure, scope and
magnitude of problems pertinent to ABE, etc. Consequently,
no attempt was made to provide a comparative analysis between.
or among the 10 cities studied.
The format developed for the analysis and synthesis
of information obtainea from the field survey identifies the
nature, scope and range of selected characteristics, problems,
strengths, weaknesses, and innovations as they relate to
selected program elements in ABE.
':he ABE program elements which are described in
general as well as specific terms include:
General observationsAdministration and managementRecruitmentParticipation (attendance and drop out)CounselingInstruction (student-teacher interactions)FacilitiesMaterials and equipmentCurriculumLearning labs
The following discussion of the ABE program elements
is based upon an objective analysis of the data obtained via
129

f
I
I
I
I
I
I
I
117
the field visits. Data from the field visits represent
objective measures of certain program elements,
subjective measures of others, and the expressed opinions
and beliefs held by ABE directors, coordinators, counselors,
teachers, aides, and students.
Observations
In general it can be stated that the elements of the
"ideal" program in ABE as conceptualized in the literature
of the field and by noted authority are to be found within
the overall program as it operates in the State of New York.
It can also be stated that no single program has achieved
the ultimate or the ideal state--although sore are of extra-
ordinary quality and may well represent the closest we have
to the "ideal model" at the present time.
The programs are generally well organized in terms
of administration and management, although most directors
and coordinators are understaffed and overtaxed. State
staff are highly regarded at the local level, and they
represent a dedicated and professionally competent group.
It would be helpful if the members of the state staff could
spend more time in assigned and delimited geographical
areas for intensive as3istance in selected problem areas.
Emphasis on recruitment techniques vary from city
to city with no single device being "the answer" to all
problems in this area.
130

118
In at least one program recruitment activities have
all but ceased because facil:I.ties and resources are being
used at the maximum level and "walk-in" appliCants are
placed on a waiting list until openings occur.
Word of mouth communication by students and former
students and the use of paraprofessional community recruiters
appear to be the most effective recruiting devices. In
general the lowest educational levels, particularly among
minority group males, are not being effectively reached
and increased recruiting efforts are recommended in this
regard.
Participation and attendance range from very high
to very low levels. Welfare education and WIN programs have
stronger attendance records (and lower rates of dropout)
than thc Title III programs. Programs established in
cooperation with other agencies; i.e., business and industry,
hospitals, community centers, etc., generally have higher
rates of attendance than those likited to the public school
organization. Learning labs appear to have the highest
drawing and holding power and satellite centers in neighbor-
hood elementary school locations have the lowest rates of
attendance and participation.
Counseling activities were found to be crucial to
program success in every city. The major weaknesses in the
counseling program is that there are insufficient resource.)
for this critical function. Programs which employ full-time
131.:

I
119
counselors were usually stronger than those which had to
rely upon part-time staff.
In the area of instruction, including student-
teacher interactions, are to be found the strongest as well
as the weakest aspects of the program. Perhaps the greatest
thing ABE has going for it is the commitment, motivation,
enthusiasm and desire to succeed on the part of the
teachers and teacher aides. Programs employing full-time
teachers and paraprofessionals appear to be more responsive
in reaching and meeting student needs. While all programs
are approaching the ultimate in individualizing instruction,
nearly all need to be strengthened in the use of instruc-
tional strategies and methods to make the curriculum more
functional and reality centered in terms of the pressing
problems and needs of the participants.
A wide range of facilities are being effectively used,
although nearly all are in need of renovation and improve-
ment. Overcrowding, poor ventilation, inadequate lighting,
and noise pollution appear to be the rule rather than the
exception. Centrally located adult education centers and
learning labs rate highest in terms of facilities and
outreach locations the lowest. While the staff are to be
commended for what they have already done with existing
facilities, it is hoped than existing facilities can be
greatly improved in the future.
132

120
The effective use of materials and equipment varies
greatly from location to location. Learning labs generally
have attained maximum and highly effective use of both
software and hardware. In general, the materials in use
are among the best that are available although child-centered
and non-adult materials are still being used in too many
locations. As a general observation the closer to the
central facility, the higher the quality, the greater the
range, and the more effective is the use of materials and
equipment.
In the area of staff selection, practices range from
the undesirable one of employing whoever is available on
waiting lists maintained by the school board (usually without
any attempt to achieve racial or minority group representa-
tion) to innovative methods in which effective teachers are
sought out and given trial roles before employment to
determine their capabilities and aptitudes for Adult Basic
Education.
In-service and training and pre-service orientation
programs for instructional staff were found in all programs.
Although there is a wide range in the quality as well as
quantity of staff development activity, most programs are
committed to improving opportunities for in-service training
on a continuing basis.

CHAPTER II
ADMINISTRATION AND MANAGEMENT
Particular attention was given to the performance
and competence of the professional/administrative staff at
the state and local levels. Allowing for certain variations
in background, experience and present operations, it can
be stated that there are no serious problems pertaining
to professional competence among the administrative staff.
Stated positively and more emphatically, each evaluation
team member was impressed as to the high level commitment,
dedication, professionalism,awareness of problems, and
sensitivity of the key administrators.
Strengths in this regard relate to the fundamental
knowledge, skills and professional enthusiasm of the state
coordinators, and the effective and open communication
channels between them and the local directors or coordinators.
It is evident that there is generally a team
approach and cooperative esprit de corps in the administrative
organization for ABE in the state of New York. The periodic
conferences held by the Big City Directors and frequent
visits of state staff to provide technical assistance,
consultation, information and staff training contribute to
121
13'

122
continued program improvement, the adoption of new practices
and effective problem solving.
Observations from the field suggest that the services
of state staff are spread too thin and that each region needs
more generalized help in which intensive relationships are
established with one or two members of the state staff.
It was observed that a majority of the city coordina-
tors are intimately knowledgeable about other ABE type programs
and related programs operating within their communities. In
nearly every city the ABE director/coordinators assumed a
leadership role in developing effective linkages with these
other programs and agencies in order to minimize duplication
of effort and maximize supportive or complimentary efforts.
It is worth mentioning that in several programs
there is high level cooperation in the areas of sharing
facilities, staff, recruitment efforts, equipment, etc.,
between ABE and IOTA, employment service, welfare, industry,
hospitals, prisons, etc. Most programs have achieved a
balance between resources allocated to a central learning
center and outlying facilities located in public schools,
churches, store fronts, etc.
In the largest programs it is clear that ethnic
group representation has been achieved at the administrative
and instructional levels. In some of the smaller programs
there is virtually no Black or Spanish-speaking representa-
tion in the administration and little or none on the part
of the professional staff.
135

123
Related to ethnic and racial representation were the
observations that where such representation exists at all
levels, participants express high satisfaction in terms of
the program being relevant, useful, practical and, of the
kind which meets their real needs.
Innovations observed relative to administration
included a very effective use of student advisory committees
to establish internal policies, evaluate program, effectiveness
and teacher performance in one program. In fact, this program
has developed the concept of student government and social
responsibility to the point that such affairs represent a
significant portion of the educational nature of the program
and have practically eliminated administrative concerns per-
taining to recruitment, morale, and dropout.
Other areas of Innovations included the orientation
and in-service training of social workers by the ABE director
to achieve greater rapport and cooperation between the two
agencies, providing space for job placement personnel of
the Employment Service, and the use of representative com-
munity advisory committees.
In general it can be concluded that the local manage-
ment of ABE performs at high level efficiency, that there is
a continuous flow of ideas from students and teachers which
are responded to in a positive way, and that there is genuine
concern and feeling for the need for total ethnic representation
136'

124
at all levels of staffing. With only a few exceptions the
following description of one coordinator is fairly typical
of the administration.
"This ABE administrator can best be described as a
very humanistic type administrator who cares and therefore
knows. He knows what's going on in his program; he relates,
it seems, directly to his teachers; he knows his teachers;
he knows what they're doing; he knows what they're doing
good, what they're doing bad and how well they relate to the
students. He also knows the students regardless cf the
fact that there are over 300 of them. He knows many of them
on a first name basis. Here is a program that has as its
leader a real fine administrator; an administrator who cares
about his program--is interested in doing a good Job, seems
creative, he knows his people and he knows his students.
This all has allowed him to build what s:-ems to be an above
average kind of program, but one however that could be
improved. . . ."
Areas where improvement 'an be made include greater
precision in role clarification and function on the part
or state staff, more democratic leadership or delegation of
responsibilities by a few local administrators, more assistance
and help for routine affairs for local administrators,
improved facilities (space and equipment) for local administra-
tors, and a more efficient modern-ized system for program
record keeping and budgeting,
.1.3

CHAPTER III
RECRUITMENT
Nearly all of the recommended procedures ''or recruit-
ment of students are being employed in a majoril,y of the
programs examined. It is clear that "word of mouth" com-
munication by participants (Eatisficd customers) une of
the more effective mt!ans of re:..ruitng new students into
the program.
Several programs have greatly enhanced their recruit-
ment activities through the use of community and participant
advisory committees.
Referrals by other egenoies have proven to be a
superior recruiting device under the following conditions:
(1) when time and effort is given to developing cooperative
relationships with other agencies, (2) when referrals are
made in both directicns; i.e., welfare or the employment
agency makes referrals to ABE and ABE refers cliee'.s to
welfare, etc., and (3) when facIlities are shared Jointly
between ABE and the cooperating agencies.
Door to door recruitment by staff hat-, %thieved
limited success in recmiting and the mass media approach
has led to varying degrees of success.
125
I8

126
In those cities where there are good working rela-
tionships between manpower programs, employment service,
welfare, gene2a1 adult education and ABE, a large portion
of recruitment is provided through referrals by the other
agencies.
In at least one large city the program is so well
received and public awareness ie high enough that there is
no recruitment problem. In fact, this program is already
overtaxed and potential students have to wait for openings
before being admitted. While this program is exemplary
in terms of sucless in recruitment, it also highlignts the
need for larger or additional programs in certain areas.
In only one city was recruitment identified as a
major problem--one which seriously affected the impact
of the program. In this case a total approach via all possible
communication channels is recommended. In addition, a
:e- examination of personnel policies is recommended so that
the background of the minority group participants achieves
rlre than token representation emon the administrative and
instructional staff.
For reasons not fully understood there is consider-
able pressure to focus programs in single centrally located
letvoning centers at the .!xpense of maintaining satellite
or outreaching neighbornood centers. It is recommended that
this practice be reversed when possible so that th programs
139

127
will be more readily accessible to the vast numbers of
adults who lack the time, child care, ee.onomic and
transportation facilities required to come to a central
center.
In conclusion there is considerable range in success
and practices followed in recruitment among the 10 cities.
Those programs where recruitment is considered to be a
small problem--or no problem--were found to he characterized
as being the more viable programs, better represented by
minority group personnel in staff positions, more likely to
have active community advisory committees, and more adept
in individualizing instruction around the practical needs
of the learners.
While there is some evidence that enrollment has
increased during 1970-71, thus ending a trend toward declining
enrollment, better strategies and techniques of reoroitment
are generally called for if those who could profit most
from ABE are to be involved in it.
The practice of employing indigenous iparaprrfessional)
recruiters should be expanded as should the use of advisory
committees well represented by students, former students
and neighborhood leaders.
140-i

CHAPTER IV
ATTENDANCE AND DROPOUT
Enrollment in the Big 10 City programs (Title III)
ranges to slightly more than 150 participants in the smallest
city to over 4000 in the largest. It was found that number
enrolled is proportional to size of city and target audience
and that only a fraction of the potential audience has been
reached thus far.
cdany of the programs ere about equally divided between
Blacks, whites ani Spanish-speaking groups. In general, the
range in ethnic and racial distributior is very great. In
this regard programs vary from more than 50 per cent Spanish-
speaking to more than 75 per cent Black to one in which 35
different foreign-born nationalities were counted. It is
clear that ESL is becoming an increasingly important com-
ponent of ABE, that it is already the largest component in
the largest program, and that speoial'efforts are required
to more effectively adopt ABg to non-English speaking
participants.
Attendance appears to be higher and dropout lower
when there is a purpossfml blending if Title III ABE, WIN,
and welfare education, where students are enoouraged to
128
14A,

129
move into the GED program, where job training programs
operate in the same faciliti^s, when other agencies cooperate
in providing space, recruiting, etc.,when ftal-time counselors
are provided in day programs an..i part-time counselors are
available for evening programs, when full-time teachers
and paraprofessionals are employed in plaee of part-time
staff, and when the ethnic-composition of students is
reflected on the part of administrative and instructional
staff.
There is some evidence that the stronger programs
have gr,l,stly enhanced their attractiveness and holding
power over the past few years and that the weaker programs
have lost ground in this regard. In fact, observations in
a few programs indicate that attendance figures are con-
siderably exaggerated with average class size less than half
of what is reported.
Interviews with counselors, teachers, students and
former students revealed that dropout data are rather
meaaingless at the present time. Many students (a majority
in some programs) drop out because they have actleved the
goals of the program, because they solved the problem which
led them into the program, or becaust of some other. positive
factor. In other words, students who move out and into a
job training program, full-time or upgraded employment, or
a high school or community college program are counted as
1421-

130
dropouts if they leave before the final achievement tests
are given. Unfortunately these "successful" dropouts are
reflected in data which casts the program in a. negative
light. Consequently it is recommended that reporting
procedures be developed and implemented which emphasize
reporting the achievement of intellectual, social and
personal goals; the solving of problems; the improvement
of standards of living, etc., als.d dropouts be redefined
to include only those persons who choose to drop eu
because they are dissatisfied with the program.
It is obvious that the programs are accomplishing
mach more than reflected by existing data collection
procedures.
1143

CHAPTER V
COUNSELING AND GUIDANCE
Every program visited had made provisions for
certain counseling and guidance services. In too many
:1.r3tances (particularly in the smaller programs), counseling
was limited to the efforts of part-time staff who frequently
had additional responsibilities in administration, curriculum
development or instruction. Certainly each city should have
at least one or more Pull-time hounselors on the basis of
present enrollment.
At the other end of the continuum aertain programs
had adequate cuunseling resources; i.e., full-tim, profes-
sional and paraprofessional staff assigned to this function.
It would be desirable if more paraprofessional as
well as professional counselors were employed--especially
with a view of achiev:.ng racial and ethnic group representation.
In adult baeic education teachers themselves are
frequently placed in the role of counselor as well as
learning diagnostician. Consequently special in-service
training sh..uld be provided to all teachers and aides per-
taining to their responsibilities in adult counseling and
guidance.
131

132
All programs had initial interviewing, testing and
placement services. Unfortunately, initial co) ,seling
services frequently appeared more likely to he threatening
than helpful to potential or incoming participants.
The tendency to use standardized intelligence and
achievement tests (which are as vet of questionable
validity for the target groups) places the incoming student
into an anxiety-producing situation. Consequently, it
recommended that informal interviews, specially planned "get
acquainted" and orientation sessions and informal reading and
interest inventoier be used in thg: early stages of guidance,
counseling and placement.
If standardized tests are to be used, it is suggested
that their use be restricted to establishing measures of
group norms and group chanGe and not be relied upon as
measures of actual or potential ability of individual stududts.
As in previous evaluations it is also recommended that the
stale adopt system-wide procedures for uniform testing
through the use of critical (or at least comparable) instru-
ments. At present there is considerable variation in tesv,s
used--not only between programs but even within -- certain,
programs. The collection and condensation of test scores
.purprIrting to measure reading, comprehension, vocabulary, and
numerical abilities obtained from non-compatible tests raises
serious questions about the validity of the overall achieve-
ment data developed at the state level.
I
I
I
I
I
I
I
I
I
3,
111

133
Among the innovations observed in the area of
counseling the most noteworthy centered around group counseling
activities or reality-centered counseling in which small
groups of participants learned to reinforce positive atti-
tudes, further the development of self concepts, reduce
feelings of alienation and learn the cognitive and effective
skills of democratic participation, group leadership, and
problem solving.
Another innovation worthy of wider adoption was the
use of a counseling team composed of a social caseworker,
ABE counselor, and one or more other professional staff
member.
The most serious needs in counseling relate to the
shortage of full-time counselors, especially qualified to
work in the adult setting and with the unique cultural
attributes of the predominant ethnic and racial groups in
the program. It would appear that bilingual counselors ',re
urgently needed in the programs which have high levels of
non-English speaking participants.
Ilcreasing the counseling staff could also help
alleviate serious shortages of personnel for follow-
through activities; ;.e., counselors or counseling teams could
be assigned certain post program or exit function to assist
a terminating student in becoming stabilized, in entry into
vocational training, in re-entry into ABE or general adult

134
education, or in other ways to maximize the impact of the
ABE experience on subsequent activities of the partici-
pants and their families.

CHAPTER VI
INSTRUCTION AND CURRICUT,UM
During the site visits, ranging from 100 to 10 per
cent of the classrooms in a given city, special attention was
given to observing and recording teacher behaviors. Following
are the major strengths which were recorded:
1, Most teachers were sincere and desirous of
doing the best they could do. They were conscientious,
reasonable, flexible, and apparently ready to adapt to
changing conditions in the classroom. Most teachers have
been fairly well sold on the ideal of individualizing
instruction and were making an honest effort to do so.
2. Usually teachers Were empathetic; at least they
were making efforts to try to understand students and their
reactions to subject matter. They didniZ; seem to be taking
themselves too seriously; that is to say they could find
humor in what they were doing and often found it possible
to laugh with the students rather than at them.
j. Many teachers, when asked the question "What's
the biggest problem that you encounter in teaching adults,"
would come forth with what seemed most appropriate answers
ranging from what they called relevance (meaning what is
taught in a subject matter sense to adults has to relate to
135. .

136
what they consider to be their needs, interests or problems,
and to what could be considered retention or in the negative
sense dropout. Others would say recruitment. Nearly all
responses had to do with facilitating the engagement of
students in the program and keeping them there once they
were enrolled. Interestingly enough, few of the solutions
to the latter problem were focused on what teachers or
students were doing. Rather, they t3eemed to divert attention
to such matters as money, childcare, and transportation.
4. In numerous instances teachers displayed a high
level of creative behavior. For example, in one ESL class
there were signs all over the wall that had been made by
the teacher and on the all there was a sign that said
"wall." There was another sign that had an arrow pointing
to the window and it said window and then shade, and all
objects were named in the room.
5. Still another positive teacher behavior related to
flexibility that was obvious throughout the operation.
Students were moving in and out of classes freely, smoking
was allowed in many of the rooms. Finally) when one moved
into the classrooms it was the exception rather than the
rule to see students who were obviously physically and
mentally disengaged. Quite the contrary they showed facial
expressions which were indicative of interest and concern.
6. Most teachers were very active; that is, physically
as well as intellectually activethey were moving around
14.9

g
137
in their classrooms and they were helping students. Usually
instruction was being individualized. Each student was
working on materials and the teaching job was largely one
of helping individuals cope adequately with materials.
Some tepchers pointed out that it took them quite awhile
to get used to relating to students and their reaction to
materials on an individual basis. They called themselves
super - clerks and glorified baby si;.i:ers without much of a
role to play. At least that's what was thought at the out-
set, but since then they have moved into the notion that
the teacher in the situation is there to lead students into
the appropriate materials and to help them when difficulty
becomes obvious.
On the negative side of teacher behaviors there
was frequently too mAch emphasis on the academic; that is
to say, subject matter for the sake of subject matter- -
learning of parts of speech, for instance, with little
effort to relate such learning to the practical needs and
concerrs of the students. One of many notable exceptions
was an instance in the teaching of history. It was, in a
sense, history of revolt. Rather than talking about the
revolutionary war for its own sake, the teacher took the
concept of revolt and projected it into the present and
asked the class to identify instances of revolution now and
what are the whys and wherefores of that right here and
now? And beyond that, raising the question Who among

138
you desires to revolt or disagree with something in an
effective way that's going on right now? How might one
proceed in order to be effective? How might one exert
some power and influence on certain kinds of things that
are occurring in the 1970's that you disagree with?"
Back to the negative aspects of instruction. Fre-
quently, instances of teaching subject matter for its own
sake occurred in the teaching of mathematics. All kinds
of opportunities were apparent to teach math in the context
of certain kinds of mathematical problems that are
encountered daily by students; but instead of doing that
teachers tended to academize it by simply throwing cold
problems on the board or on ditto sheets for the sake of
disouseing them in their own right. Here, they could have
easily gotten into Consumer education, change making, and
for people who were interested in carpentry, board feet,
etc.
There were also indications of behavior which might
be appropriate when its emitted in the direction of youth
or children but which seemed quite inappropriate with
adults. Following are a few examples:
a. One teacher was overheard saying to her class,"you at the end of the table quit fouling aroundand get back to work."
b. Still another said, "I want you people to all beat the same place tomorrow."
151;,:

139
c. Still another teacher was overhead to say, "Youreally don't have to ask me that question- -all the necessary information is in the book,just go look it up."
Student behavior.--On the negative side, many
students, particularly the young, were quite bored with the
whole affair. This came through in the exprebsions on their
faces, the way they sat in chairs, the way they physically
moved about is the rooms. There were some differences
observed here between day and evening programs. Perhaps
that is in part attributable to the fact that the day
programs are to a larger extent stipended than the evening
programs. In addition, the day programs hag, as compared
to the evening, an over representation of younger students.
In the evening programs students showed high levels of
interest and desire to learn.
The positive aspects of student behaviors and inter-
actions with teachers, fellow students and materials far
outweighed any negative elements in the program.
As previously stated the disinterested or poorly
motivated student was the exception. In general, students
and teache:'e alike were highly involved in learning activi-
ties designed for individuals, small groups, and at times
for the entire class.
The major criticism which can be made of the
overall instructional program relates to the relevance 'f
152

140
the curriculum to the everyday lives and needs of the stu-
dents. Generally, the program is too academic, with too
much emphasis on reading, writing and arithmetic for its
own sake. There appears to be an overemphasis on the
academic in terms of book learning and workbook learning
rather than on teaching things that students need to now
to function more effectively right here and now in 1971.
Teachers appear to be overly concerned about
individualizing instruction--so much so that they seldom
move into group discussions, and when they do, it seems
that they degenerate int) question and answer sessions
where teacher asks que.,tions, ...tudents aL3wer, e_c.
Programs which have high retention rates (dropouts
below 25%), waiting lists for participants, full-time
administrative, counseling and teaching staff were found
to be superior in terms of teacher-student interactions,
meaningful curricula, and learning outcomes which had a
dynamic impact on improving the lives of the participants.
Nearly all tc chess need int.insive inservice
training in the use of a wide variety of adult education
methods and techniques to complement and supplement their
expertise in individualized instruction so that subject
matter can be more effectively related to the interests,
needs,, wants and problems of the students.
This will require training in the use of small
group discussion methods, panels, sy.npoaia, role playing,
15 4,i;

I
I
t
fJ
1.
;
1'i
bviain storming, demonstrations, skits, preparation of
special materials for unique situations, etc. With the
competence, desire to succeed and motivation displayed by
the teachers there is little doubt that they can quickly
learn to make the ABE curriculum functional as well as
practical from the student's point of view.

CHAPTER VII
FACILITIES
Facilities were examined at all sites visited and
were appraised for adequacy in terms of safety features,
accessibility and location, lighting, ventilation, main-
tenance and classroom arrangements.
It was obvious that no single program had the ideal
in terns of facilities and some classes were conducted
in far from satisfactory ones. On the other hand, more
facilities could be rated on the adequate aide of the
facility measures than on the inadequate side. The range
in locations and types of facilities, i.e., from churches
to community centers, to converted downtown department
stores, to jails to hospitals, to elementary schools to
abandoned high schools, to ultra modern central learning
labs end technically-sophisticated industrial facilities
accounts for the wide variation in ;heir adequacy.
It is worthy to note that with few exceptions,
staff were committed and creative in making the best possible
use of facilitieswhatever their condition, and that (with
the exception of learning labs) little, if any, relationship
was found between the adequacy of the facility and the
quality of teaching or the extent of learning taking place.
142
14,§.

1 143.
Negative aspects of certain facilities included sub-
! standard ventilation and illumination, poor maintenance,
overcrowdin (this was a general characteristic of centrally
located larger facilities) and questionable safety features
ranging from fire hazards to physical defe,ts in floors,
stairs, etc. It is suggested that efforts be given to
relating vo-tech education and job skill development in
the building trades to the renovation of ABE facilities
whenever and wherever possible. Planning for minor as well
as major improvements in the learning environments could
also serve as a tasis for instruction in ABE as such planning
relates to measurement, decision making, home repair, etc.
Generally, the use of elementary schools resulted
in the use of child-size chairs and desks and a non-adult
climate or atmosphere. Conversely, although seldom adequate,
store fronts and community centers provided a much more
adult centered environment and a richer atmosphere for
flexible teaching.
On the bright side, most of the larger and more
centrally-located facilities were quite adequate--especially
the learning labs. The improved facilities in these
central locations appears to account for the tendency to
Imove away from neighborhood facilities and toward larger
centralized facilities.
Although most (but not all) of the administrators
felt that ABS had outgrown the church and the store front
156-

144
facility, it is obvious that the pressure to centralize
the program in more desirable locations is in some ways
reducing the likalihood of reaching into the crucial areas
of the target audience. In other words, as long as ABE
isolates itself from neighborhood population centers, it
will coLtinue to draw the more highly motivated, higher
edrcational level segments of the population--which is
exactly what the trend data (discussed in Part II) reveal
is happening.
Consequently, it is recommended that special mini-
labs be established at the community level to serve ae
feeder stations for the well - organized central facilities.
With the availability of new and better software, hardware
and competent paraprofessionals representative of the ethnic
qualities of target groups, it is suggested that renewed
efforts be made to reach out to people where they are- -
and where they live.

CHAPTER VIII
MATERIALS AND EQUIPMENT
It is difficult to generalize about the adequacy
or inadequacy of materials or equipment or about the
effectiveness of their use.
In one of the big 10 cities there wee everywhere a
rich array of both software and hardware- -with both being
present in large amounts in the learning laboratory. You
name it, they have it. To say that the learning laboratory
was blessed with hardware and software is nJt to say that
the classrooms were not. Moreover, materials were adult,
contemporary and reflective of who the ..arget audience(s)
were. Most classrooms were well decorated with all sorts
of commerciLlly developed and teacher-made materials,
ranging from posters to dittos to pamphlets, to bulletins
to hardback books, etc. As one looked at these materials,
he found that they were related to many contemporary
problems ra-,ging from birth control to drug addiction to
nutrition to .=sumer education, etc.
At the other extreme, in another city is a learning
lab moderately equipped with hardware, inadequately equipped
with software and for some reason the materials there are
145
15d

146
relatively inaccessible to the teachers. In this instance
there is a wide discrepancy between what the teachers say
they need and what the coordinators 'ay (or believe) they
have.
Most programs fall somewhere in between the two
extremes discussed above, In general, the learning labs
are well equipped with a wide range of hardware--from audio
equipment to video tape recorders, from language masters to
cassettes, from overheads to film loops, from speetreaders
to 16 mm projects, etc. In addition, there is usually
ample software to support the lab and the teachers (and
students) know how to use and apply it.
Equipping outreach centers is a very trying task
compounded where teachers rust move their rooms in their
attache case, share facilities in gypsy-like fashion, get
along with little or no storage space where valuable
materials, hard yr soft, can be stored until the next class
meeting, and function without many other things that are
considered essential in a central-center facility. let,
it is incumbent on the programs' 3eaders to be in constant
communication with the outreach staff and middle manage-
ment personnel to guarantee that staff members who work at
outreach points are as much as possible) equally equipped
with software and to some degree portable hardware. The
learning labs are too well equipped to find people in the
field with virtually nothing to work with but concern and
159

147
dedicatton. The administration should take immediate steps
to work out this minor shortcoming with lightning-like
speed and precision-like competence.
The materialt, (advisory bulletins) developed by the
state staff on how to select and use materials are excellent
and in many cases need to be reprogrammed into the in-service
teacher training activities so that the existing materials
and equipment can be used more effectively.
One program which has produced several innovations
in The use of equipment has developed a master taxonomy of
materials, classified by content and grade level. Nearly all
commercially available adult central ABE materials are to
he found in this taxonomy, and its use has greatly facilitated
the individuarAzation of instruction around student interests
and needs and it has magnified the effectiveness of the
learning lab approach.
Conspicuous by their absence in nearly all programs
are adu'.t interest materials at the primary levels and in
areas of cultural or ethnic concern. No materials were
found relating to the traditions, background and culture
of Puerto Rico, for example. Although some programs had
modest col'.ections on Black history, there were virtually
no materials reflecting the oultural heritage of non-English
speaking students.
In conclusion, there is generally an effective use
of equipment and materials in central facilitiee--although
160

148
some teachers still rely on the materials they used when
teaching children--even though they are surrounded by better
quality adult level materials.
The extension or outreach centers are usually inade-
quately equipped with even software--no wonder success is
lacking under such conditions.
On the positive side, teachers are anxious to have
and make effective use of the best materials they can find.
More attention to the use, selection and preparation of
materials appears to be in order for future in-service
training.
161,';,

I
CHAPTER IX
LEARNING LABS
Although the quality and superiority of the learning
labs have been frequently documented in this report, the
following conclusions and recommendations can be made on
the basis of the field observations.
Generally, mcre efficient and effective learning
was found to be taking place under laboratory conditions
than under classroom conditions. Teachers require special
skills in the effective management of a learning lab and
most of them who work in the labs have mastered these
skills.
On the other hand, it should be pointed out that
the learning lab is best for only certain kinds of learning,
i.e., remediation, drill, independent study, following
programmed materials, et-. It. appears to represent a
superior approach to instruction in ABE when it is used
in conjunction with viable, dynamic, interpersonal class-
rcom experiences. in the most .effective programs the
learning lab is used to supplement and compliment an
adult-centered classroom approach. However, in the
149
1621

150
instances the "classrooms" are not classroom3 in the tradi-
tional sense. Rather they can be descrtt i a adrlt-
centu,ed learning environments where a variety of techn!lues
are being employed--usually simultaneously--where subject
matter is developed because it is pertinent to the needs
and problems of the learnersand where the enhancement
of social skills, motivations, and attitudes is as important
as the development of certain cognitive skills.
Thu learning lab concept can and in some instances
Js being misused as the panacea for all problems in ABE.
Under such circumstances the environment is cold and non-
supportive, attitudes and self concepts change little,
and the creative pleasures of learning are seldom discovered.
Because of the demonstrated success of the learning
lab as an integral component of ABE, it is recommended
that attempts be made to establish mini-labs in the
outreach locations to test the viability and effectiveness
of this approach under local neighborhood conditiuns.
At the same time it is suggested that attention be
given to supporting a full time director for each existing
learning lab, and that all orograms adopt the practice of
providing at least one hour of lab time for all students
enrolled in the larger centers where learning lab facilities
exist.
In addition it is recommended that special lab
facilities be developed for ESL programs where English is
not the predominant language.

I.
I
I
a.
APPENDIX
lq,4

TABLE A-I
NUMBER OF STUDENTS REGISTERED BY CLASS LEVEL
Year
Non
English
Basic
Primary
IAtermediate
Upper
NR
Total
1,--6
CM
1965-66
Crt
N %
2,459 36.5
1,046
15.6
875
12.9
1,244 18.5
1,002
14.9
108 1.6
6,734
100
1966-67
N %
4,016 34.8
2,373 20.6
1,517 13.2
1,933
16.7
1,437 12.5
255 2.2
11,531
100
1--,
.n w
1967 -63
N2,977
1,354
1,049
1,831
1,189
171
8,571
%34.7
15.8
12.2
21.4
13.9
2.0
100
1968-69
N $
2,655 37.3
1,042
14.6
808
11.4
1,401 19.7
990
13.9
220 3.1
7,116
100
Total
N12,107
5,815
4,249
6,409
4,618
754
33,952
$35.7
17.1
12.5
18.9
13.6
2.2
100
Printout Coordinates 999/100-105

TABLE A-II
AGE RANGE OF STUDENTS
Year
15-19
20-24
25-29
30-34
35-39
1965
-66
N66
71,145
1,095
908
861
10.4
17.0
15.3
13.4
12.7
1966
-67
N1,241
1,669
1,893
1,617
1,485
10.8
14.5
16.4
14.0
12.9
N1,163
1,400
1,542
1,230
1,029
1967-68
14
16
18
15
12
1968-69
N1,058
1,285
1,207
1,026
857
%15
18
17
15
12
N4,129
5,499
5,737
4,781
4,23
2Total
12.2
16.2
16.9
14.1
12.5

- N
M -
MIN
EW
IN&
%M
IMI
ME
NPm
"!!'.
1"
TABLE A -II. --Continued
Year
40-44
45-49
50-54
55-59
60
NR
Total
620
446
352
228
243
169
6,734
1965-66
9.2
6.6
5.2
3.4
3.5
2.3
100
C)
4CI
1966-67
N1,058
843
593
418
628
86
11,531
-Fr
%9.2
.7.3
5.1
3.6
5.4
.8
100
)-,
-N
809
498
370
236
194
100
8,571
`11.
1967-68
%9
64
32
3.
100
N663
380
250
155
148
87
7,116
1968-69
%9
54
22
1100
N3,150
2,167
1,565
1,037
1,213
442
33,952
Total
%9.3
6.4
4.5
3.1
3.6
1.2
100
Printout Coordinates 999/506-516

155
TABLE A-III
SEX
Year Male Female NR Total
1965-66N
%
2,885
42.9
3,848
57.1
1
0.0
6,734
100
N 4,616 6,903 12 11,531
1966-67% 40.0 59.9 0.1 100
N 2,993 5,543 35 8,7511967-68
34.9 64.7 .4 100
N 2,640 4,443 33 7,116
1968-6937.1 62.4 .5 100
N 13,134 20,737 81 33,952Total
38.7 61.1 .2 100
Printout Coordinates 999/520-22
164* I

TABLE A-IV
RACE OF ENROLLEES
Year
White*
Black
Other
NR
Total
N4,166
2,14
5423
6,73
41965-66
61.9
31.9
6.2
100
1966
-67
N7,632
3,352
547
11,531
%66.2
29.1
4.7
100
16 1 0 \
rT5,21L
2,9?9
341
81
8,571
1967-68
60.8
34.3
4.0
.9
100
N4,031
2,339
565
181
7,116
1968-69
56.6
32.9
7.9
2.6
100
N21,039
10,775
1,876
.262
33,952
Total
%62.0
31.7
5.5
.8
100
Includes Puerto Rican
Printout Coordinates 999/640-43

TABLE A-V
RACE VS. SEX
Year
White (includes Puerto Rican)
Black
Males
Females
Cell Total
Males
Females
Cell Total
N2,637
2,168
4,205
706
1,479
2,185
1965-66
%CT
48.4
51.6
100
32.:
67.7
1CD
%T
30.1
31.9
10.4
21.8
N3,336
4,276
7,612
1,080
2,268
3,348
1966-67
%CT
43.8
56.2
loo
32.3
67.7
loo
%T
29.1
37.3
9.4
2.9.8
N2,115
3,077
5,192
748
2,180
2,928
:--,
1957 -68
%CT
40.7
59.3
loo
25.5
74.5
loo
%T
25.o
36.4
8.8
25.8
N1,747
2,278
4,025
674
1,658
2,332
1968-69
%CT
43.4
56.6
loo
28.9
71.1
loo
%T
25.3
32.9
9.7
24.o
N9,235
11,799
21,034
3,208
-
7,585
10,793
Total
%CT
43.9
56.1
100
29.7
70.3
100
%T
27.5
35.1
9.5
22.6

- M
os V
MS
WW
I PM
* PP
M,
Woe
PP.."
101"
4"'
"'S
h.4
WaM
INI
TABLE A-V. - -Continued
Year
Other
Total
Male
Female
Cell Total
N170
226
396
6,786
1965-66
%CT
42.9
57.1
100
%T
2.5
3.3
loo
N178
318
496
11,456
1966-67
%CT
35.9
64.1
100
%T
1.6
2.8
loo
co
N105
235
340
8,46o
1967-68
%CT
30.9
69.1
100
%T
1.2
2.8
100
N156
404
560
6,917
1968-69
%CT
27.9
72.1
100
%T
2.3
5.8
100
N609
1,183
1,792
33,619
Total
%CT
34.0
66.0
loo
%T
1.8
3.5
100
Printout Coordinates 641-43/521-22

TABLE A-VI
MARITAL STATUS
Year
Married W/Spouse Married NW/Spouse
Single
NR
Total
1965-66
N3,226 47.9
858
12.7
2,507 37.3
143 2.'
6,734
100
1966-67
5,71
4 49.6
1,713
14.8
3,942 34.2
162 1.4
11,531
100
1967-68
%
3,992
46.6
1,181
13.8
3,121
36.4
277 3.2
8,571
100
1968-69
N %
3,077
43.2
974
13.7
2,8'5
40.0
219
.-./
7,116
100
Total
N16,009
4,726
12,416
801
33,952
%47._
13.9
36.6
2.4
10J
Printout Coordinst'"s 999/600-606
'`g

TABLE A -VII
CHILDREN AT HOME
Year
None
12
34
5+
NR
Total
N3,198
812
849
593
359
564
359
6,734
1955-66
%47.5
12.1
12.6
8.8
5.3
8.4
5.3
100
N4,867
1,380
1,591
1,243
793
1,235
422
11,531
1966-67
%42.2
12.0
13.8
10.8
6.8
10.7
3.7
100
N3,327
1,108
1,355
976
584
659
562
8,571
1967
-68
38.8
12.9
15.8
11.4
6.8
7.7
6.6
100
N3,051
919
1,147
753
426
423
397
7,116
1968-69
42.9
12.9
16.1
10.6
6.0
5.9
5.6
100
N14,443
4,219
4,942
3,565
2,162
2,881
1,740
33,952
Tot
al42.5
12.4
14.6
10.5
6.4
8.5
5.1
100

161
TABLE A-VIII
CITIZENSHIP
Year Native NativePuerto Rican
Naturalized Alien NR Total
1965-66N 2688
% 39.9
1242
18.4
368
5.5
2280
33.9
156
2.3
6734
100
N 4744 2454 790 3413 130 115311966-67
% 41.1 21.3 6.9 29.6 1.1 100
N 3651 1856 408 2539 117 85711967-68
% 42.6 2t.7 4.8 29.6 1.3 100
N 2767 1569 316 2329 1351968-69
% 38.9 22.0 4.4 32.8 1.,
N 33850 7121 1882 10561 538Tc.ta1
% 40.8 21.0 5.5 31.1 1.)
Printout coordinates 999/680-684.
174. :

162
TABLE A-IX
LANGUAGE SPOKEN IN THE HOME
Year English Spanish Other NR Total
1965-66N 3,097
46.0
2,695
40.0
879
13.1
C3
0.9
6,734
100
N 5,515 4,500 1,459 57 11,5311966-67
47.8 39.1 12.6 0.5 100
N 4,267 3,022 1,192 90 8,5711967-68
49.8 35.3 13.9 1.0 100
N 3,346 2,07 1,048 105 7,1171968-69
47.0 36.8 14.7 1.5 100
N 16,:25 12,834 4,578 315 33,952Totai
47.8 37.8 13.5 .9 100
Printout coordinate 999/651-654.
175`:

TABLE A -X
CITIZENSHIP BY CLASS LEVEL
Year
Native
Nan
English
Basic
Primary
Intermediate-
Upper
Cell
Total
1965-66
N %CT
%T
49 1.8 .7
570 21.0
8.6
51418,9
7.7
853 12.8
73026.9
11.0
2,716
100
N265
1,153
819
1,327
1,089
4,653
1966-67
%CT
5.7
24.8
17.6
28.5
23.4
100
%T
2.4
10.3
7.3
11.9
9.8
1-6
)--
.4....1
N32
614
666
1,346
921
3,579
m l-A
3
Zr)
1 9
6 'T
6 5
%CT
.9
17.2
18.6
37.6
25.7
100
%T
.4
7.4
8.0
16.2
11.1
N127
421
462
927
738
2,675
1968-69
%CT
4.7
15.7
17.3
34.7
27.6
100
%T
1.9
6.2
6.8
13.7
10.9
473
2,758
2,461
4,453
3,478
13,623
Total
%CT
3.5
20.2
18.1
32.7
35.5
%T
1.4
8.4
7.5
13.6
10.6

TABLE A-X.--Continued
Year
Total
Non
Cell
English
Basic
Primary
Intermediate
Upper
Total
N845
142
98
97
62
1,249
1965-66
%CT
67.9
11.4
7.9
7.8
5.0
100
xT
12.7
2.1
1.5
1.5
.9
N1,555
423
11.8
154
84
2,404
1966-67
%CT
64.7
17.6
7.8
6.4
3.5
100
-a
%T
13.9
3.8
1.7
1.4
.8
1-.
N1,112
294
150
164
73
1,793
1967-68
%CT
62.0
16.4
8.4
9.1
4.1
100
%T
13.4
3.5
1.8
2.o
.9
N1,024
149
97
160
77
1,507
1968-69
%CT
67.9
10.0
6.4
10.6
5.1
100
%T
15.1
2.1
1.4
2.4
1.1
N4,536
1, 008
533
575
296
6,946
%CT
65.3
4.5
7.7
8.2
4.8
loo
%T
13.8
3.1
1.6
1.8
.9
Native--/P.R.

TABLE A-X.--Continued
Year
Naturalized
Non
Cell
English
Basic
Primary
Intermediate
Upper
Total
N89
69
55
86
72
371
1965-66
%CT
24.0
18.6
14.b
23.2
19.4
100
%T
1.3
1.0
.8
1.3
1.1
N169
153
170
189
98
779
1966-67
%CT
21.7
19.6
21.8
24.3
12.6
100
%T
1.5
1.4
1.5
1.7
.9
118
6944
97
78
1967-68
%CT
29.1
17.0
10.8
23.9
19.2
100
00
%T
1.4
.8
.6
1.2
.9
N95
64
26
82
42
309
1968-69
%CT
30.7
20.7
8.4
26.5
13..6
100
%T
1.4
1.1
.4
1.2
.8
Total
N %CT
%T
471
355
295
454
290
25.3
19.0
15.8
24.3
15.5
1.4
1.1
.9
1.4
.9
1,86
510
0

TABLE A-X.--Continued
Alien
Non
Cell
Year
English
Basic
Primary Intermediate
Upper
Total
Total
N1,428
284
234
218
149
2,313
6,644
1965-66
%cT
61.7
12.3
10.2
9.4
6.4
100
%T
21.5
4.3
3.5
3.3
2.4
100
N1,966
622
333
239
151
3,311
11,147
1966-67
%cse
59.4
18.8
10.1
7.2
4.5
10o
%T
17.6
5.6
3.0
2.1
1.4
100
N1,673
356
176
200
107
2,512
8,290
1967-68
%CT
66.6
14.2
7.0
8.0
4.3
10o
%T
20.2
4.3
2.2
2.4
1.3
100
N1,382
384
208
208
101
2,283
6,774
1968-69
%CT
60.5
16.8
9.1.
9.1
4.5
100
%T
20.4
5.7
3.G
3.0
1.4
100
6,449
1,646
951
865
508
10,419
32,855
Total
%CT
61.9
15.8
9.1
8.3
4.9
100
%T
94.6
5.0
2.9
2.6
1.5
100
Printout Coordinates 680-683/100 -104

TABLE XI
PERCENTAGE OF EACH CLASS LEVEL, WHITE; BLACK, OR OTHER
Year
' Non English
Basic
White
Black
Other
Cell
White
Black
Other
Cell
Total
Total
N2,142
130
219
2,491
516
509
52
1,077
65-66
%cT
86.0
8.8
loo
47.9
47.3
4.8
loo
%T
31.7
1.9
3.2
7.6
7.5
.8
N3,392
287
305
3,984
1,383
895
86
2,364
66-67
%CT
85.1
7.2
7.7
100
58.5
37.9
3.6
loo
%T
30.2
2.6
2.7
12.3
8.0
.8
cr.
ON
2,550
121
194
2,965
8o4
49,
36
1,333
67-68
%CT
89.4
4.1
6.5
100
60.3
37.0
2.7
100
%T
:7
.8
1.5
2.3
9.7
5.9
.4
1,985
299
314
2,598
597
358
61
1,016
68-69
%CT
76.4
12.0
12.1
100
58.8
.35.2
6.0
100
%T
29.5
4.4
4.7
8.9
5.3
.9
N10,169
837
1,032
12,038
3,300
2,255
235
5,790
"otal
%CT
84.4
7.0
8.6
100
57.0
38.9
4.1
100
%T
30.9
2.5
3.2
10 0
6.8
0.7

TABLE XI.-Continued
Year
Primary
Intermediate
White
slack
Other
Cell
Total
White
Black
Other
Cell
Total
N428
440
44
912
616
617
29
1,262
65-66
%CT
%T
47.9
6.3
48.2
6.5
4.8 .7
100
48,8
9.1
48.9
9.1
2.3 .4
100
N793
682
37
1,512
1,007
890
29
1,926
66-67
%CT
52.4
45.1
2.4
100
52.3
46.2
1.5
100
-...4
00
%T
7.1
6.1
.3
9.0
7.9
.3
1.;.&
N456
553
25
1,034
639
1,146
38
1,823
67-68
%CT
44.1
53.5
2.4
100
35.1
62.8
2.1
100
%T
5.5
6.6
.3
7.7
13.8
N339
371
71
781
528
784
51
1,363
68-69
%CT
43.4
47.5
9.1
100
38.7
57.5
3.7
100
%T
5.0
5.5
1.1
7.9
11.7
N2,016
2,046
177
4,239
2,790
3,437
147
6,374
Total
%CT
47.5
48.3
4.2
100
43.8
53.9
2.3
100
%T
6.1
6.2
0.5
8.4
10.5
0.4

TABLE XI.--Continued
Upper
Years
White
Black
Other
Cell
Total
Total
N485
480
50
1,015
6,757
65-66
%CT
47.8
47.3
4.9
100
%T
7.2
7.2
.8
N877
530
26
1,433
11,219
66-67
%CT
61.2
37.0
1.8
100
-%T
7.8
4.7
.2
00
D.:
N579
572
22
1,173
8,328
57-68
%CT
49.4
48.7
1.9
100
%T
7.0
6.9
.2
N451
471
42
964
6,722
68-69
%CT
45.8
48.9
4.
100
%T
6.7
7.0
.6
Total
N2,392
2,053
140
4,585
33,026
%CT
52.2
44.8
3.0
100
%T
7.2
6.2
u.4
Printout coordinates
641-643/100-104.
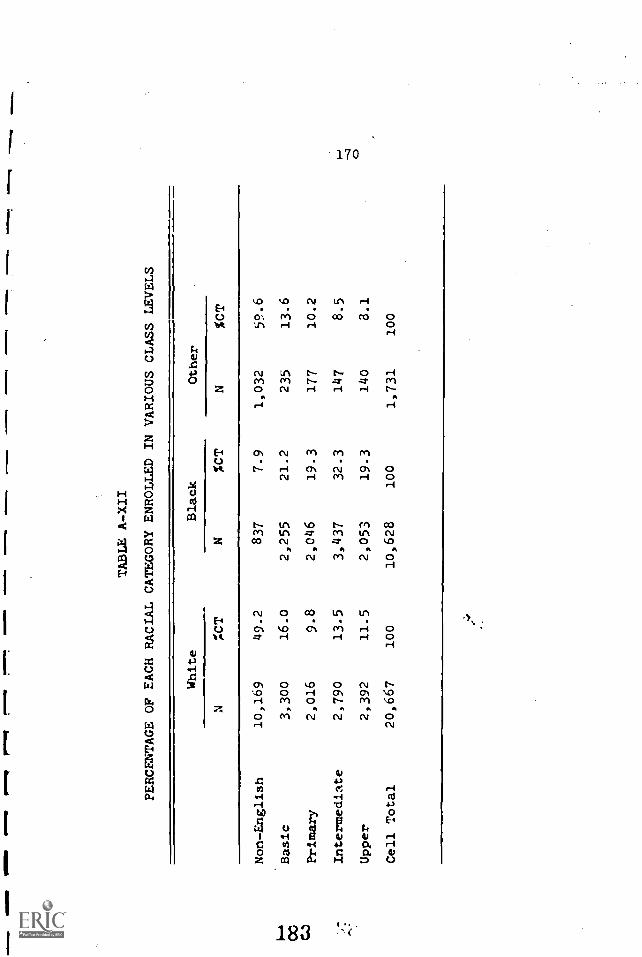
TABLE A -XII
PERCENTAGE OF EACH RACIAL CATEGORY ENROLLED IN VARIOUS CLASS LEVELS
1+00
G.,
White
Black
Other
%CT
N%CT
N%CT
Non-English
Basic
Primary
Intermediate
Upper
Cell Total
10,169
3,300
2,016
2,790
2,392
20,667
49.2
16.0
9.8
13.5
11.5
100
837
2,255
2,046
3,437
2,053
10,628
7.9
21.2
19.3
32.3
19.3
100
1,032
235
177
147
140
1,731
59.6
13.6
10.2
8.5
8.1
100
--4 0

Year
171
TABLE A-XIII
NUMBER OF YEARS OF PREVIOUS SCHOOLING
0-3 4-6
NMINIMMINNEIMMIIME
7-9 10-12 12+ NR Total
N 822 1673 2225 1411 393 210 6734
1965-66% 12.3 24.8 33.0 21.0 5.8 3.1 100
N 1578 3049 3878 2291 544 191 11531
1966-67% 13.7 26.5 33.6 19.8 4.7 1.7 100
N 779 2349 2913 1952 393 185 8571
1967-68% 9.1 27.4 34.0 22.8 4.6 2.1 100
N 542 1667 2500 1869 339 199 7116
1968-69% 7.6 23.4 35.1 26.3 4.8 2.8 100
TotalN 3721 8738 11516 7523 1669 785 33952
% 11.0 25.7 33.9 22.2 4.9 2.3 100
Printout coordinates 999/200-214.
184

TABLE A -XIV
NUMBER OF YEARS PREVIOUS SCHOOLING COMPLETED VS. AGE
LIM
Unaer 25
School
Cell
Year
Completed
0-3
4-6
7-9
10-12
12+
Total
N86
316
731
582
116
1,831
1965-66
%CT
4.7
17.3
40.0
31.8
6.3
100
%T
0.2
4.8
11.0
8.8
1.7
N162
569
1,158
841
133
2,863
1966-67
%CT
5.7
19.9
40.4
29.4
4.6
100
%T
1.5
5.1.
10.4
7.6
.1.2
N93
537
979
818
101
2,528
1967-68
%CT
3.7
21.2
38.7
52.4
4.0
100
%T
1.1
6.4
11.7
9.8
1.2
N84
421
870
832
95
2,302
1968-69
%CT
3.6
18.3
37.8
36.1
4.1
100
%T
1.2
6.2
12.6
12.2
1.4
N425
1,843
3,733
3,073
445
Total
%CT
4.5
19.4
39.1
32.3
4.7
%T
1.3
5.6
11.3
9.3
1.4
9,52
410
0

TABLE A-XIV.--Continued
Year
ASe
25-34
Sct.00l
Cell
Completed
0-3
4-6
7-9
10-12
12+
Total
N185
510
698
481
155
2,029
1965-66
%CT
9.1
25.1
34.4
34.4
23.7
100
:T
2.8
7.7
10.5
7.2
2.3
N350
923
1,185
788
226
3,472
1966-67
%CT
10.1
26.6
34.1
22.7
6.5
1n0
%T
3.1
8.3
10.6
7.1
2.0
N205
715
959
662
182
2,723
1967-68
%CT
7.5
26.3
35.2
24.3
6.7
100
%T
2.5
8.6
11.5
$.0
2.2
127
519
778
616
143
2,183
1968-69
%CT
5.8
23.8
35.6
28.2
6.6
10o
%T
1.9
7.6
11.4
9.0
2.1
N867
2,667
3,620
2,547
706
Total
%CT
8.3
25.6
34.8
24.5
6.8
%T
2.6
8.1
11.o
7.7
2.1
10,407
100

TABLE A-XIV.--Continued
Year
Lge
School
Completed
5-14
14
0 -3
4-6
7-9
10-12
12+
Cell
Total
lV
215
474
487
240
1965-66
%CT
14.4
31.6
32.5
16.0
%T
3.2
7.1
7.3
3.6
82 5.5
1.2
1,49
810
0
N412
773
728
392
102
1966-67
;CT
17.1
32.1
30.3
16.3
4.2
)...4
XT
3.7
6.9
6.5
3.5
0.9
0 -4
N213
621
594
310
66
1967-68
%CT
11.8
31.4
32.9
17.2
3.7
%T
2.6
7.5
7.1
3.7
0.8
2,40
710
0
1,804
100
159
421
562
263
46
1968-69
%CT
11.0
29.0
38.7
18.1
3.2
%T
2.3
6.2
8.2
3.8
0.7
1,45
110
0
ii
999
2,289
2,371
1,205
296
Total
%CT
14.0
32.0
33.1
16.8
4.1
%T
3.0
6.9
7.2
3.7
0.9
7,16
010
0

TABLE A-XIV.--Continued
Year
45-54
School
Cell
Completed
0-3
4-6
7-9
10-12
12+
Total
N152
263
249
111
30
805
1965-66
%CT
18.9
32.7
30.9
3.8
3.7
loo
%T
2.3
4.o
3.7
1.7
0.5
N226
460
444
194
42
1,366
1966-67
%CT
16.5
33.7
32.5
14.2
3.1
100
%T
2.0
4.1
4.0
1.7
0.5
).--
N158
301
243
124
28
854
00
1967-68
%CT
18.5
35.2
28.5
14.5
3.3
100
00
%T
1.9
3.6
2.9
1.5
0.3
N90
199
204
91
31
615
1968-69
%CT
14.6
32.4
33.2
14.8
5.o
loo
%t
1.3
2.9
3.0
1.3
0.4
N626
1,223
1,140
520
131
Total
%CT
17.2
33.6
31.3
11.3
3.6
%T
1.9
3.7
3.5
1.6
0.4
3,61
4010
0

TABLE A-XIV.--Continued
Year
_AIES
School
Complete:
55 or Older
0-3
4-6
7-9
10-12
12+
Cell
Total
Total
N193
135
103.
32
18
482
6,645
1965-66
%CT
40.0
28.2
21.4
6.6
3.7
100
%T
2.9
2.0
1.6
0.5
0.3
100
362
313
248
66
39
1,028
11,136
-...6
1966-67
;CT
35.2
30.5
24.1
6.4
3.8
100
00
co.
%T
3.3
2.8
2.2
0.6
0.4
100
..-
1967-68
N %CT
10524.8
161 38.0
11727.6
27 6.4
14 3.3
424
100
8,233
%T
1.3
1.9
1.4
0.3
0.2
100
N79
98
78
22)
13
292
6,843
1968-69
%CT
27.1
33.6
26.7
8.2
4.4
100
%T
1.1
1.4
1.1
0.4
0.2
100
N739
7)8
546
149
84
2,226
32,957
Total
%CT
33.2
31.8
24.5
6.7
3.8
100
%T
2.2
2.1
1.7
0.5
0.3
100
Printout Coordinates 200-213/506-515
C

TABLE A -XV
NUMBER OF YEARS PREVIOUS SCHOOLING COMPLETED,
BY SEX
Year
Males
0-3
4-6
7-9
10-12
12+
Cell
Total
N349
742
988
593
196
2,868
65-66
%CT
12.2
25.9
34.4
20.7
6.8
100
%T
5.2
11.1
14.8
8.9
2.9
ri
662
1,312
1,552
789
217
4,532
56 -67
%CT
14.6
26.9
34.3
17.4
4.8
100
%T
5.9
11.6
13.7
7.0
1.9
289
937
1,027
541
136
2,93
067-68
%CT
9.9
31.9
35.1
18.5
4.6
100
%T
3.5
11.2
12.3
6.5
1.6
N225
665
969
571
135
2,565
68-69
%CT
8.8
25.9
37.7
22.3
5.3
100
%T
3.3
9.6
14.1
8.3
1.9
N1,525
3,656
4,536
2,494
684
12,895
Total
%CT
11.8
28.4
35.2
19.3
5.3
100
%T
4.6
11.0
13.6
7.5
2.1
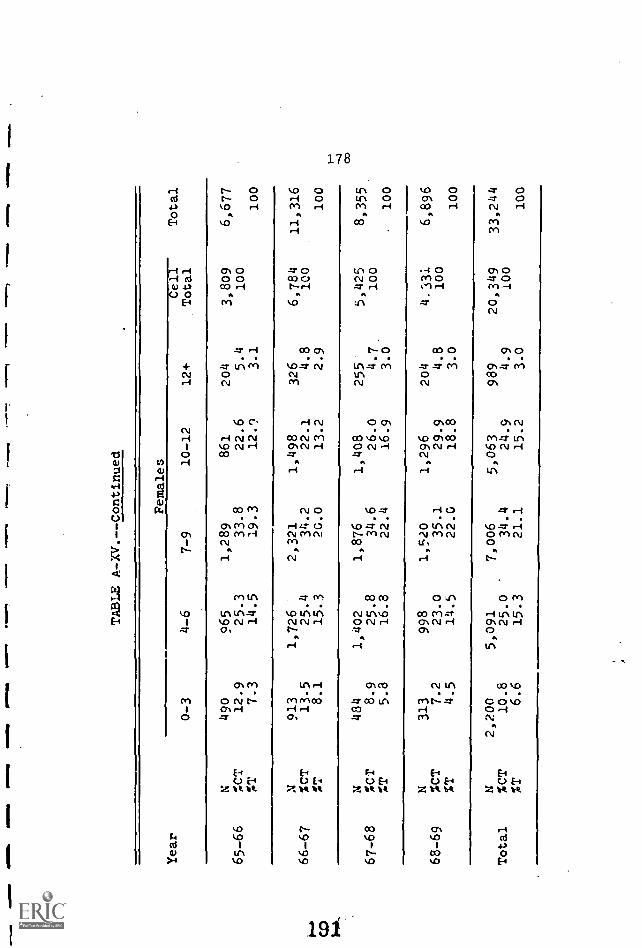
TABLE A-XV.--Continued
Year
Females
Total
0-3
4-6
7-9
10-12
12+
Cell
Total
490
965
1,289
861
204
3,809
6,677
65-66
%CT
12.9
25.3
33.8
22.6
5.4
100
%T
7.3
14.5
19.3
12.7
3.1
100
N913
1,726
2,321
1,498
326
6,784
11,316
66-67
%CT
13.5
25.4
3'..2
22.1
4.8
100
CO
i..k.
%T
8.1
15.3
20.0
13.2
2.9
100
N484
1,402
1,876
1,408
255
5,425
8,355
67-68
%Cr
8.9
25.8
34.6
26.0
4.7
100
%T
5.8
16.8
22.4
16.9
3.0
100
N313
998
1,520
1,296
204
4.331
6,896
68-69
%CT
7.2
23.0
35.1
29.9
4.8
100
%T
4.5
14.5
22.0
18.8
3.0
100
2,200
5,091
7,006
5,06243
989
20,349
349
33,244
Total
%CT
10.8
25.0
34.4
.9
4 .9
%T
6.6
15.3
21.1
15.2
3.0
100

TABLE A -XVI
NUMBER OF YEARS PREVIOUS SCHOOLING COMPLETED BY VARIOUS CITIZENSHIP CATFGCRIES
Year
Native
0-3
4-6
7-9
10-12
12+
Cell
Total
N331
650
1,103
570
41
2,69
51955-66
%CT
12.3
24.1
40.9
21.2
1.5
100
%T
5.0
9.9
16.8
8.7
.6
N591
1,103
1,934
970
84
4,682
1966-67
%CT
12.6
23.6
41.3
20.7
1.8
100
CD
%T
5.3
9.8
17.2
8.6
.7
INZ
N2Q1
637
1,439
1,117
110
3,59
41967-68
%CT
8.1
17.7
40.0
31.1
3.1
100
%T
3.5
7.7
17.3
13.5
1.3
N200
436
1,073
943
60
2,71
21968-69
%CT
7.4
16.1
39.5
34.8
2.2
100
%T
2.9
6.4
15.7
13.8
.9
N1,413
2,826
5,549
3,600
295
13,6
83Total
%CT
10.3
20.6
40.6
26.3
2.2
100
%T
4.3
8.6
16.9
10.9
.9

TABLE A-XVI.--Continued
Year
Native/Puerto Rican
0-3
4-6
7-9
10-12
12+
Cell
Total
N225
395
368
183
32
1,203
1965-66
%0T
18.7
32.8
30.6
15.2
2.7
100
3.4
6.0
5.6
2.8
.5
N510
785
730
331
64
2,420
p-i.
1966-67
%CT
21.1
32.4
30.2
13.7
2.6
100
cD
%T
4.5
7.0
6.5
3.0
.6
Co
N281
625
580
289
40
1,815
1967-68
%CT
15.5
34.4
32.0
15.9
2.2
100
%T
3.4
7.5
7.o
3.5
.5
N162
420
561
348
55
1,5116
1968-69
%CT
10.5
27.2
36.3
22.5
3.5
100
%T
2.4
6.2
8.2
5.1
.8
N1,178
2,225
2,239
1,151
191
6,984
Total
%CT
16.9
31.9
32.o
16.5
2.7
loo
%T
3.6
6.8
6.8
3.5
.6

TABLE A-XVI.--Continued
Year
Naturalized
0 -3
4-6
7-9
10-12
.
12+
Cell
Total
N103
100
83
63
20
1965-66
%CT
27.9
27.1
22.5
17.1
5.4
100
ZT
1.6
1.5
1.3
1.0
.3
--+
co
bA.
1966-67
N %CT
%a.
20326.1
1.8
25833.2
2.3
18824.2
1.7
8911.5 .8
39 5.0 .3
777
100
1-,
N39
115
144
83
19
400
ic-13
1967-68
%CT
9.7
28.7
36.0
20.8
4.8
100
%T
.4
1.4
1.7
1.0
.2
N32
91
112
60
15
310
1968-69
%CT
10.3
29.4
36.1
19.4
4.8
100
%T
-5
1.3
1.6
.9
.2
N377
564
527
295
93
1,856
Total
%CT
20.3
30.4
28.4
15.9
5.0
100
%T
1.1
1.7
1.6
.9
-3

TABLE
A-XVI.--Continued
Year
Alien
0-3
4-6
7-9
10-12
12+
Cell
Total
Total
N167
526
689
623
297
2,302
6,569
1965-66
%CT
7.3
22.8
29.9
27.1
12.9
100
%T
2.5
8.0
10.5
9.5
4.5
100
N264
865
985
873
352
3,339
11,218
1966-67
%CT
7.9
25.9
29.6
26.1
10.5
100
CO
%T
2.4
6.-
7.7
8.9
7.8
3.1
100
Crt
N163
952
712
445
220
2,492
8,301
-1967-68
%CT
6.5
38.2
28.6
17.9
8.8
100
%T
t.0
11.5
8.6
5.4
2.6
100
N142
707
717
493
198
2,257
6,825
1968-69
%CT
6.3
31.3
31.8
21.8
8.8
100
%T
2.1
10.4
10.5
7.2
2.9
100
N736
3,050
3,103
2,434
1,067
10,390
-32,913
Total
%CT
7.1
29.4
29.9
23.3
10.3
100
%T
2.2
9.3
9.4
7.4
3.2
100
Printout Coordinates

TABLE A-XVII
NUMBER OF YEARS PREVIOUS SCHOOLING VS. CLASS LEVEL
Yeal'
Nnn-Rnfz.lish
0-3
4-6
7-9
10-12
12+
Gell
Total
N319
713
711
517
169
2,429
1965-66
%CT
13.1
29.3
29.3
21.3
7.0
100
%T
4.8
10.7
10.7
7.8
2.5
N612
1,199
1,152
726
230
3,919
1966-67
%CT
15.6
30.6
29.4
18.5
5.9
100
%T
5.5
10.8
10.4
6.6
2.1
1-4
I-,
CD
N354
1,144
839
401
156
2,894
wco
Cr;
1967-68
%CT
12.2
39.5
29.0
13.9
5.4
100
%T
4.3
13.9
10.2
4.9
1.9
N249
846
861
491
133
2,580
1968-69
%CT
9.7
32.8
33.3
19.0
5.2
100
%T
3.7
12.6
12.8
7.3
2.0
N1,534
3,902
3,563
2,135
688
11,822
Total
%CT
13.0
33.0
30.1
18.1
5.8
100
%T
4.7
12.0
10.9
6.5
2.1
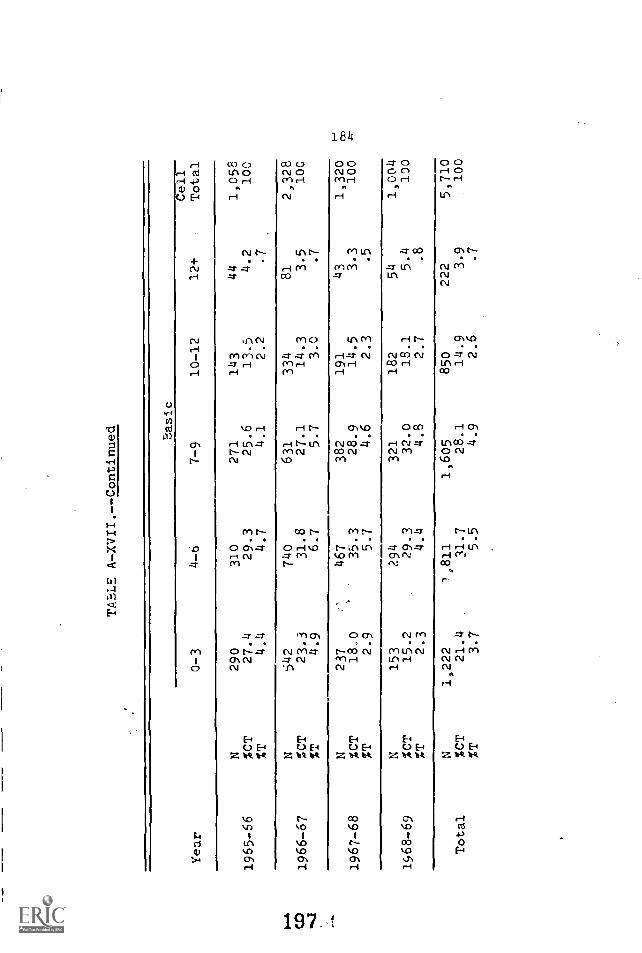
TABLE A-XVII.--Continued
Year
Basic
0-3
4 -b
7-9
10-12
12+
Cell
Total
N290
320
271
143
44
1,058
1965-56
%CT
27.4
29.3
25.6
13.5
4.2
100
%T
4.4
4.7
4.1
2.2
.7
0.4
N542
740
631
334
81
2,328
CO
1966-67
%CT
23.3
31.8
27.1
14.3
3.5
100
%T
4.9
6.7
5.7
3.0
.7
N237
467
382
191
43
1,320
1967-68
%CT
18.,0
35.3
28.9
14.5
3.3
100
%T
2.9
5.7
4.6
2.3
.5
N153
294
321
182
54
1,004
1968-69
%CT
15.2
29.3
32.0
18.1
5.4
100
%T
2.3
4.4
4.8
2.7
.8
N1,222
1,811
1,605
850
222
5,710
Total
%CT
21.4
31.7
28.1
14.9
3.9
100
%T
3.7
5.5
4.9
2.6
.7

TABLE A-XVII.--Continued
Primary
Cell
Year
0-3
4-6
7-9
10-12
12+
Total
1965-66
1966-67
1967-68
1968-69
%CT
,1
133
263
314
145
'34
15.0
29.6
35.3
16.3
3.8
2.0
4.0
4.7
2.2
.5
889
100
N243
442
521
233
52
1,491
%CT
16.3
29.7
34.9
15.6
3.5
100
%T
2.2
4.0
4.7
2.2
.5
N112
292
393
196
32
1,025
g?:
%CT
10.9
28.5
38.3
19.2
3.1
100
%T
1.4
3.6
4.8
2.4
.4
N80
182
299
201
26
788
%CT
10.2
23.1
37.9
25.5
3.3
100
%T
1.2
2.7
4.5
3.0
.4
Total
N568
3,179
1,527
775
144
%CT
13.5
28.1
36.5
18.5
3.4
%T
1.7
3.6
4.7
2.4
.4
4,19
3100

TABLE A-XVII.--Continued
p--.
C.0
CO
Year
Intermediate
H,
cP,
0-3
4-6
7-9
10-12
12+
Cell
Total
1965-66
N %CT
74T
62 4.9 .9
313
24.9
4.7
527 42.0
7.9
29023.1
4.4
64 5.1
1.0
1,256
100
1966.67
N %CT
%T
116 8.7
1.0
1451 2.1
4.1
C, '9
43.8
7.5
43622.9
3.9
7C 3.7.6
1,908
100
1567-68
N %CT
ern
N.
41 2.3.5
29616.3
3.6
75841.9
9.2
61333.9
7.5
101 ,<
R....
1.2
1,809
....,.
.,100
1968-69
N %CT
aT
31 2.3.5
238 17.3
3.5
575 8.6
47534.5
7.1
58 4.2.9
1,377
100
Total
N %CT
pT
250 3.9 .8
1,298 20.4
4.o
2,695 8.3
1,81428.6
5.6
293 4.6
6,350
100
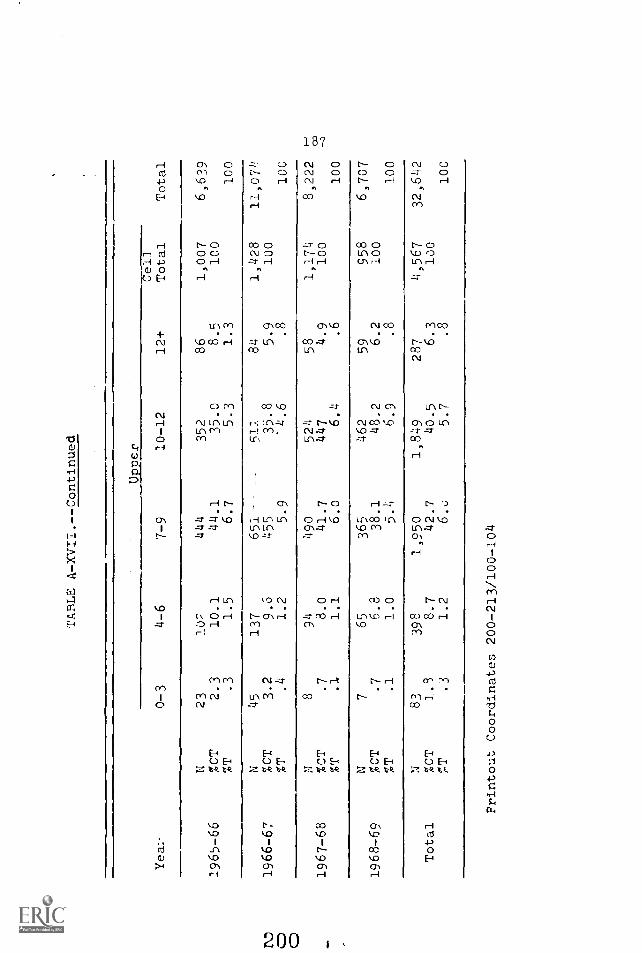
TABLE A-XVII.--Continued
Yea:-
U )Dper 10-12
12+
Cell
Total
Total
0-3
4-6
7-9
N23
102
444
352
86
1,007
6,639
1965-66
%CT
2.3
10.1
44.1
35.0
8.5
100
%T
.3
1.5
6.7
5.3
1.3
100
N45
137
651---
511
84
1,428
11,07
r\D
1966-67
%CT
3.2
9.6
455
35.8
5.9
loo
=5T
.4
1.2
5.9
'4.6
.8
100
0N
894
490
524
58
1,174
8,222
1967-68
%CT
.7
8.0
41.7
447
4.9
100
%T
.1
1.1
6.o
6.4
.6
100
N7
65
365
462
59
958
6,707
1968-69
ACT
.7
6.8
38.1
48.2
6.2
100
%T
.1
1.0
5.4
6.9
.8
100
83
398
1,950
1,849
287
4,567
32,642
Total
ACT
7.9
8.7
42.7
40.5
6.3
100
%T
.3
1.2
6.0
5.7
.8
100
Printout Coordinates 200-213/100-104
--.

TABLE A-XVIII
NUMBER OF YEARS OF PREVIOUS SCHOOLING BY RACE
Year
White
0-3
4-6
7-9
10-12
12+
CeLL
Total
472
1,057
1,389
928
292
4,138
1965-66
%CT
11.4
25.5
33.6
22.4
7.1
100
%T
7.1
15.9
20.8
13.9
4.4
N977
2,062
2,536
1,497
403
7,475
N.,
1966-67
%CT
13.1
27.6
33.9
20.0
5.4
100
CD
%T
8.6
18.1
22.3
13.2
3.5
N458
1,661
1,792
951
247
5,109
1-
1967-68
%CT
9.0
32.5
35.1
18.6
4.8
100
To
%T
5.5
20.0
21.5
11.4
3.0
311
1,038
1,423
930
222
3,924
1968-69
%CT
7.9
26.5
36.2
23.7
5.7
100
ZT
4.6
15.3
21.1
13.7
3.3
N2,218
5,818
7,140
4,306
1,164
20,646
Total
10.7
28.2
34.6
20.9
5.6
100
%T
(.7
17.6
21.4
13.0
3.5

TABLE A-XVIII.--Continued
Black
Year
0-3
Cell
4-6
7-9
10-12
12+
Total
N313
551
770
455
62
2,151
1965-66
%CT
14.5
25.6
35.8
21.2
2.9
100
4.7
8.3
11.5
6.8
.9
513
838
1,181
792
89
3,413
1966-67
%CT
15.0
24.6
34.6
23.2
2.6
100
%T
4.5
7.4
10.4
7.0
DO CD
N273
594
1,012
907
118
2.904
1957-68
%CT
9.4
20.5
34.8
31.2
4.1
100
co
%T
3.3
7.1
12.2
10.9
1.4
N184
466
814
742
81
2,287
1963-69
%CT
8.0
10.4
35.7
32.4
3.'
100
%T
2.7
6.9
12.0
11.0
1.2
Tor a.1
N1,283
2,449
3,777
%CT
11.9
22.8
35.1
%T
3.9
7.4
11.4
2,896
350
10,755
26.9
3.3
100
8.7
1.1

TABLE A-XvIII.--Continued
Other
Year
0-3
4-6
7-9
10-12
12+
Cell
Total
Total
N55
100
112
66
46
379
6,668
1965-66
%CT
14.5
26.4
29.6
17.4
12.1
100
%T
.8
1.5
1.7
1 1.0
.7
100
osp
CD
1966-67
N %CT
6216.8
128
26.2
142 29.0
90
18.11
47 9.6
489
100
11,377
%T
.7
1.1
.5
.4
100
N44
80
86
71
25
306
8,319
1967-68
%CT
14.4
26.1
28.1
23.2
8.2
100
%T
.5
1.0
1.0
.9
.3
100
N37
130
207
155
29
558
6,769
1968-69
%CT
6.6
23.3
37.1
27.8
5.2
100
%T
.5
1.9
3.1
2.3
.4
100
N218
438
547
382
147
1,732
33,133
Total
%CT
12.6
25.3
31.5
22.1
8.5
100
%T
.7
1.3
1.7
1.2
.4
100
Printout Coordinates 200-213/641-643

TABLE A -XIX
GEOGRAPHIC AREA WHERE SCHOOLING WAS COMPLETED
Year
North
East
Mid-west
South
Far West Puerto
Rico
Other
Country
NR
Total
N1,284
42
1,341
11
1,175
2,621
260
6,734
1965-66
19.2
0.6
19.9
0.2
17.5
38.9
3.7
100
ND
N2,540
71
2,213
14
2,336
3,993
364
11,531
CD
1966-67
':.
%22.0
0.6
19.2
0.1
20.3
34.6
3.2
100
N2,030
51
1,600
20
1,691
2,861
318
8,571
1967-68
23.7
.6
18.7
.2
19.7
33.4
3.7
100
N1,720
38
1,149
23
1,384
2,566
236
7,116
1968-69
24.2
.5
16.2
.3
19.4
36.1
3.3
100
N7,574
202
6,303
68
6,586
12,041
1178
33,952
Total
%22.3
0.6
18.6
0.2
19.4
35.4
3.5
100
Printout coordinate 999/631-637.

192
TABLE A-XX
STUDENTS EVER GAINFULLY EMPLOYED
Year Yes No NR Total
65-66N 5,699
84.6
752
11.2
283
4.2
6,734
100
N 9,265 1,746 520 11,53166-67
80.4 15.1 4.5 100
67-68N 6,537 1,486 548 8,571
76.3 17.3 6.4 100
N 5,486 1,174 456 7,11668-69
77,1 16.5 6.4 100
N 26,987 5,158 1,807 33,952Total
79.5 15.2 5.3 100
Printout coordinate 999/721-723.
205"st

TABLE A-XXI
STUDENTS EVER GAINFULLY EMPLOYED VS. NUMBER OF YEARS OF PREVIOUS SCHOOLING*
Years
0-3
4-6
Yes
No
0ell
Yes
No
Total
Total
Tl
695
108
803
1,456
187
1,643
1965-66
%(7T
86.5
13.5
100
88.6
11.4
100
%T
10.8
1.7
22.6
2.9
N1,243
261
1,504
2,209
520
2,729
I\D
1966-67
%CT
82.6
17.4
100
80.9
19.1
100
0 C'D
%T
11.6
2.4
20.7
4.9
i-
N'562
162
724
1,831
160
1,991
w1967-58
%CT
77.6
22.4
100
92.0
8.0
100
%T
7.2
2.1
23.6
2.1
N378
130
508
1,284
294
1,578
1968-69
XCT
74.4
;75.6
100
81.4
18.6
100
%T
5.8
2.0
19.7
4.5
N2,878
661
3,539
6,780
1,161
7,941
Total
81.3
18.7
100
85.3
14.7
100
%T
9.2
2.1
21.6
3.7

O
TABLE A-XXI.--Continued
Year
7-9
10-12
Yes
No
Cell
Total
Yes
No
Cell
Total
1965-66
N %CT
%T
1,94388.6
30.2
25111.4
3.9
2,194
100
1,23688.0
19.2
16812.0
2.6
1,404
100
N3,189
538
3,727
1,872
332
2,204
1966-67
%CT
85.6
14.4
100
84.9
15.1
100
%T
29.9
5.1
17.5
3.1
N2,250
394
2,644
1,514
519
2,033
1967-69
%CT
85.1
14.9
100
74.5
25.5.
100
%T
29.0
5.1
19.5
6.7
N2,016
361
1,453
307
1,760
1968-69
%CT
84.8
15.2
100
82.6
17.4
100
%T
5.5
22.2
4.7
rr9,398
1,544
10,942
6,075
1,326
7,401
Total
%CT
85.9
14.1
100
82.1
17.9
100
%T
29.9
4.9
19.4
4.2

TABLE A-XXI.--Continued
Year
1-4
Total
Yes
No
Cl
Toetall
1965-66
%CT
%T
345 89.6
5.5
4010.4
0.6
385
100
6,429
100
N445
Cl
506
10,670
1966-67
%CT
87.9
12.1
100
0.,
xi
4.2
0.6
100
312
55
367
7,759
1967-68
4CT
85.0
15.0
100
%T
4.0
0.7
100
N265
46
311
6,534
1968-69
4CT
85.2
14.8
100
%T
4.1
0.6
100
N1,367
202
1,569
31.392
.otal
%CT
87.1
12.9
100
%T
4.4
0.6
100
Printout Coordinate:. 721-723/200-213

TABLE A -XXII
STUDENTS EVER GAINFULLY EMPLOYED VS RACE'
Year
White
Black
Other
Total
Yes
No
Cell
Total
Yes
Igo
Cell
Total
Yes
No
Cell
Total
N3,475
549
4,024
1,961
138
2,099
279
76
355
6,478
65-66
%CT
86.4
13.6
100
93.4
5.6
100
78.6
21.4
100
%T
53.6
8.5
30.3
2.1
4.3
1.2
100
EV O O
N5,936
1,314
7,250
2,947
287
3,034
337
132
469
10,953
66-67
%CT
81.9
18.1
100
91.1
8.9
100
71.9
28.1
100
%T
54.2
12.0
26.9
2.6
3.1
1.2
100
N3,905
979
4,884
2,409
382
2,791
168
118
286
7,961
67-68
%CT
80.0
20.0
100
86.3
13.7
100
58.7
41.3
100
%T
49.1
12.3
30.3
4.8
2.1
1.5
100
N3,049
728
3,777
1,964
277
2,241
358
138
496
6,514
68-69
%CT
80.7
19.3
100
87.6
12.4
100
72.2
27.8
100
%T
46.3
11.2
30.2
4.2
5.5
2.1
100
N16,365
3,570
19,935
9,281
_,084
10,365
1,142
464
11606
60
31,906
Total
%CT
82.1
17.9
100
89.5
10.5
100
71.1
28.9
100
%T
51.1
11.2
2(
13.4
3.6
1.5
100
Printout Coordinates 721- 723 -641 -643.
rn

TABLE A
DATE LAST EMPLOYED BY THOSE EVER GAINFULLY EMPLOYED
Year
6968
6766
6564
63
N745
3,565
35b
163
65-6
613.1
62.6
6.3
2.9
N514
4,4P5
1,795
435
325
66-6
75.5
48.4
19.4
4.7
3.5
N1;117
2,682
989
539
175
132
67-6
817.1
41.0
15.1
8.2
2.7
2.0
N77
3,145
912
358
212
120
82
68-6
91.4
57.3
16.6
6.5
3.9
2.2
1.5
N77
4,26
24,108
6,577
6,111
1,088
702
Total
-315
.815.2
24.4
22.6
4.0
2.6

TABLE A-XXIII.--Continued
Year
62
61
60
55-
59
50-
54
Before
50
NRa
Total
N138
81
94
207
106
119
123
5,699
65-6
62.4
1.4
1.6
3.6
1.8
2.1
2.2
100
N213
150
200
429
194
246
273
9,265
66-6
7%
2.3
1.7
2.2
4.6
2.1
2.7
2.9
100
N124
93
129
239
109
99
110
6,537
67-6
81.9
1.4
2.0
3.7
1.7
1.5
1.7
100
N53
38
46
116
49
57
221
5,486
68-6
91.0
.8
2.1
.9
1.1
4.0
100
N328
368
469
991
458
521
727
26,987
Total
2.0
1.4
1.7
3.7
1.7
1.9
2.7
100
aNR = those ever
gainfully employed minus those who
responded.
Printout coordinates ?21/724 -738.

TABLE A -XXIV
PRESENT OCCUPATION
Year
Housewife
Clerical
Farm
Labor
Domestic
Sales
Servize
Trades
65-6
6N
1,330 19.7
126 1.9
12 0.2
496 7.4
62 0.9
316 4.7
66-6
7N
2,923
25.4
180 1.6
34 0.2
718 6.2
90 0.8
415 3.6
67-6
8N
2,262 26.4
167 1.9
14
.2
625 7.3
56
.8
32b 3.8
68-6
9N
1,613
22.7
229 3.2
21
.3
455 6.4
74 1.0
301 4.2
N8,128
702
81
2,294
282
1,360
Total
23.8
2.1
0.2
6.8
0.8
4.0

TABLE A-XXIV.--Continued
Year
Semi
Skilled
Skilled
Labor
Unskilled
Other
Unemployed
NR
Total
N1,183
694
1,116
210
925
264
6,73b
65-66
%17.6
10.3
16.6
3.1
13.7
3.9
100
t\D
E--+
N1,741
970
1,826
458
1,930
246
11,531
C...-J
66-67
15.1
8.4
15.8
4.0
16.3
2.1
100
N1,254
677
1,166
327
1,349
346
8,571
67-68
14.6
7.9
13.6
3.8
15.7
4.0
100
N1,001
601
1,071
350
1,170
230
7,116
68-69
14.1
8.4
15.1
4.9
16.4
33
100
N5,179
2,942
5,179
1,345
5,374
1,086
33,952
Total
15.3
8.7
15.3
4.0
15.8
3.
100
Printout coordinates999/7U1-712

TABLE A -XXV
SUMMARY OF STUDENTS COMPLETING,
NOT COMPLETING AND RECYCLING IN THE PROGRAM
Year
Completed
Not Completed
Recycled
Total
65-66
N311 4.7
1,476 21.9
4,947 73.4
6,734
100
66-67
N551 4.8
4,442 38.5
6,538 56.7
11,531
100
67-68
N614 7.2
3,210 36.3
4,847 56.5
8.571
100
68-59
N790
2,055
4,271
7,116
Total
11.1
28.9
60.0
100
2,266
11,083
20,603
33,952
6.7
32.6
60.7
100
*Data secured from revised print out.
Printout coordinates 999/865 -867.
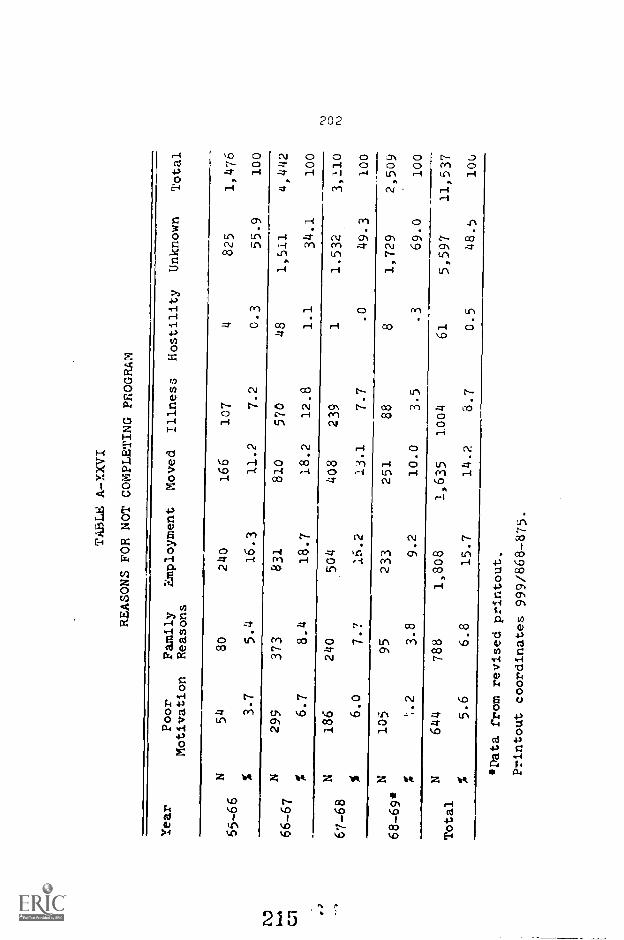
TABLE A -XXVI
REASONS FOR NOT COMPLETING PROGRAM
Year
Poor
Motivation
Family
Reasons
Employment
Moved
Illness
Hostility
Unknown
Total
54
80
240
166
107
4825
1,476
65-66
3.7
5.4
16.3
11.2
7.2
0.3
55.9
100
N299
373
831
810
570
48
1,511
4,442
66-67
6.7
8.4
18.7
18.2
12.8
1.1
34.1
100
(\.)
N186
240
504
408
239
11.532
3,110
f.)
67-68
%6.0
7.7
16.2
13.1
7.7
.0
49.3
100
N105
95
233
251
88
81,729
2,509
68-69*
3.8
9.2
10.0
3.5
.3
69.0
ioo
N644
788
1,808
1,635
1004
61
5,597
11,537
Total
5.6
6.8
15.7
14.2
8.7
0.5
48.5
10u
'Data from revised printout.
Printout coordinates 999/868-875.

TABLE A -XXVII
ATTENDANCE (1ST 100 HOURS)
Year
Percent
of Classes
Attended During 1st
100 Hours
75+ %
50-75 %
25-50 %
Under
Never
25 %
Attended
NR
Total
1965-66
N3,290 44.2
1,448 19.4
1,020 13.7
1,337
1"=,.0
109 1.5
241 3.2
7,445
100
1966-67
N2,800 27.9
2,550 25.5
1,947
19.4
1,928 19.2
41
.4
766 7.6
10,032
N100 cf,
1967-68
2,088 27.5
1,827
24.2
1,900 25.3
1,580 20.9
76 1.0
81 J.1
7,552
100
1968-69
1,255 20.3
1,615
26.2
1,735 28.2
1,551 25.1
12
.2
1
.0
6,169
100
9,433
7,440
6,602
6,396
238
1,089
31,198
Total
%30.2
23.8
21.2
20.5
.8
3.5
100
Printout Coordinates 999/910-915

TABLE A-XXVIII
ATTENDANCE (FIRST 100 HOURS) VS SEX
Year
Males
75+
50-75
23 50
Under 25
None
Cel
lTotal
N1,221
639
412
608
57
2,937
65-66
%CT
41.6
21.8
14.0
20.7
1.9
100
%T
17.8
9.3
6.0
8.9
.8
N1,032
1,031
803
766
18
3,650
i'V
66-67
%CT
28.3
28.2
22.0
2-0
.5
100
1,-.
%T
11.2
11.2
8.7
8.3
.2
4N
602
569
706
629
26
2,532
67-68
%CT
23.8
22.5
27.9
24.8
1.0
100
%T
8.1
7.7
9.5
8.5
.3
N455
566
656
591
32,271
68-69
%CT
20.1
24.9
28.9
26.0
.1
100
%T
7.4
9.2
10.7
9.6
.0
N3,310
2,805
2,577
2,594
104
11,390
Total
%CT
29.1
24.6
22.6
22.8
.1
100
%T
11.2
9.5
8.6
8.7
.4

TABLE A-XXVIII.--Contlnued
Females
Year
15+
5045
25-50
Under 25
None
Cell
Total
Total
N1,757
766
618
726
56
3,923
6,800
65-66
%CT
44.8
19.5
15.8
18.5
1.4
%T
25.6
11.2
9.0
10.6
.8
100
N1,759
1,514
3,138
1,156
23
5,590
9,240
66-67
%CT
31.4
27.1
20.4
20.7
.4
100
%T
19.0
16.4
12.3
12.5
.2
100
0N
1,476
1,248
1,187
944
50
4,90
57,437
67-68
%CT
30.2
25.4
24.2
19.2
1.0
100
%T
19.8
16.8
16.0
12.7
.6
100
N791
1,040
1,074
951
93.865
6,136
68-69
%CT
20.5
26.9
27.8
24.6
100
%T
12.9
17.0
17.6
15.5
.1
100
N5,783
4,568
4,017
3,777
138
16,263
29,673
Total
ACT
31.6
25.0
22.0
20.7
.7
100
%T
19.5
15.4
13.5
12.7
.5
100
If
I...
erre
...M
M.
Lmw 6mw
lommm
immw
:mom

TABLE A -XXIX
ATTENDANCE (FIRZT 100 HOURS) VS Y.:ARS OF PREVIOUS SCHOOLING
School
co
leted
0-3 Years
oclasses
attended
75+
50-
75
25-
50
Under
25
None
Cell
Total
N424
747
950
626
197
2,944
65-66
%CT
14.4
25.h
32.2
21.3
6.'(
100
%T
6.3
11.1
14.2
9.3
2.9
N363
361
257
259
61,246
66-67
%CT
29.1
29.0
20.6
20.8
.5
10o
%T
4.0
4.0
2.8
2.8
.06
N168
151
162
3
67-68
%CT
21.6
24.9
26.7
20.3
.5
loo
%T
2.3
2.1
2.2
1.7
.0
N90
102
125
105
422
68-69
%CT
21.3
24.2
29.6
24.9
100
1.5
1.7
2.1
1.8
N1,045
1.361
1,494
1,113
206
5,219
Total
%CT
20.0
26.1
28.7
21.3
3.9
100
pT
3.6
4.7
5.1
3.8
.7
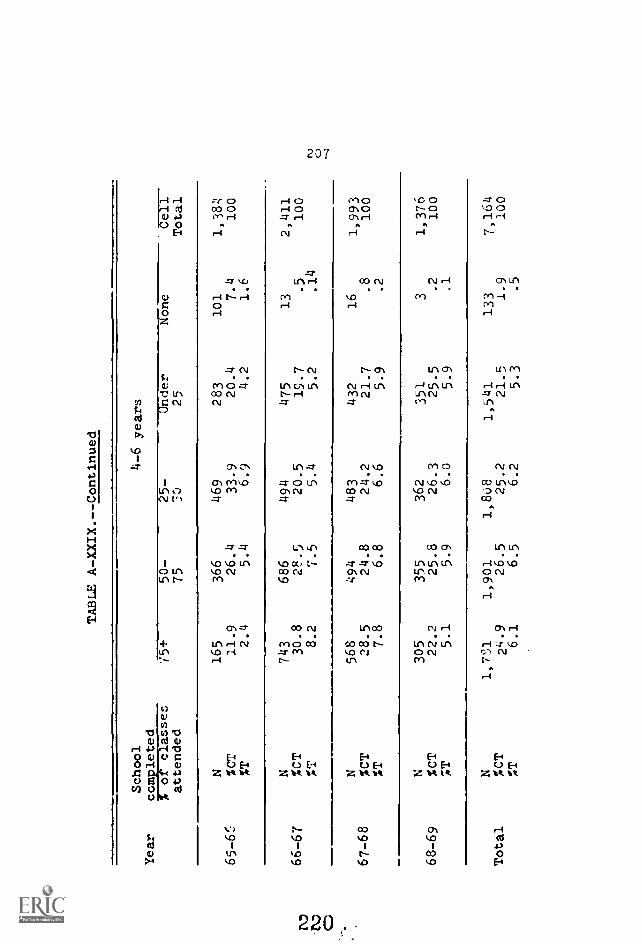
TABLE A-XXIX.--Continued
School
4-6 years
Year
completed
%of
classes
'/5+
50-
25-
Under
attended
75
"3:)
25
None
Cell
Total
N165
366
469
283
101
1,384
%CT
11.9
26.4
33.9
20.4
7.4
100
%T
2.4
5.4
6.9
4.2
1.6
N743
686
494
475
13
2,411
66-67
%CT
30.8
28.5
20.5
15.7
.5
100
#1
8.2
7.5
5.4
5.2
.14
N568
494
483
432
16
1,993
67-68
%CT
28.5
24.8
24.2
21.7
.8
100
%T
7.8
6.8
6.6
5.9
.2
N305
355
362
351
31,376
68-69
%CT
22.2
25.8
26.3
25.5
.2
100
;T
5.1
5.9
6.0
5.9
.1
N1,751
1,901
1,8u8
Total
%CT
24-9
26.5
25.2
%T
6.1
6.5
6.2
1,541
133
21.5
1.9
5.3
.5
7,16
410
0

TABLE A-XXIX.--Continued
Year
School
completed
7-9 years
% of classes
75+
50-
25-
Under
None
Cell
attended
75
50
25
Total
N111
255
361
218
52
997
65-66
%CT
11.1
25.6
36.2
21.9
5.2
100
%T
1.6
3.8
5.3
3.2
.3
r\D
(NJ
N898
618
686
654
12
3,078
66-67
5CT
29.1
26.6
22.3
21.6
.4
100
%T
9.9
9.0
7.5
7.3
.13
1.) 0 a)
N709
597
690
544
30
2,570
67-68
%CT
27.6
23.2
26.8
21.2
1.2
100
%T
9.7
8.2
.4
N463
558
590
543
32,157
68-69
%CT
21.5
25.9
27.4
25.2
.1
10u
%T
7.7
9.3
9.9
9.1
.1
N2,181
2,228
2,327
1,969
97
8,802
Tctal
%CT
24.8
25.3
26.4
22.4
1.1
100
%T
7.5
7.6
8.0
6.6
.3

IV
TABLE A-XXIX.--Continued
Year
School
completed
10-12 yea=s
% or classes
attended
75+
50-
75
25-
50
Under
25
None
Cell
Total
65-66
N %CT
%T
137 10.4
2.L
346 26.4
5.1
473-)6.1
7.0
28522.0
4.3
68 5.1
1.0
1,312
100
66-67
N %CT
%T
614 32.2
6.8
497 26.1
5.5
38720.3
4.3
400
21.0
4.4
7.4
.07
1,905
100
67-68
N %CT
%T
514
2E0.8
7.0
44324.8
6.0
44625.0
6.1
363 20.3
5.0
20 1.1 .3
1,786
100
68-69
N %CT
%T
305 17.8
5.1
455 26.5
7.6
517 30.1
8.6
434 25.3
7.3
5
.3
.1
1,716
100
Total
N %CT
%T
1,57023.4
5.4
1,714 25.9
6.0
1,82327.1
6.3
1,485 22.1
5.0
100 1.5 .3
6,719
100

TABLE A-XXIX.--Continued
School
12+ years
Year
completed
% or classes
75+
50-
25-
Una ,-r
None
Cell
attended
75
50
Total
Total
N13
32
35
22
10
112
6,749
65-66
%CT
11.6
28.6
31.3
19.6
8.9
100
%T
.2
.5
5.3
.1
loo
DJ DJ
139
134
91
e_
2452
9,092
66-67
%CT
30.9
29.6
20.1
19.0
.4
103
%T
1.5
1.5
1.0
1.0
.0
100
0
N96
101
84
72
4357
7,313
67-68
%CT
26.9
28.3
23.5
20.2
1.1
100
%T
1.3
1.4
1.1
1.0
.1
100
N63
95
86
68
1313
5,984
68-69
%CT
20.1
30.4
27.5
21.7
.3
100
%T
1.0
1.6
1.4
1.1
.0
100
Total
N311
362
296
248
17
1,234
29,138
%CT
25.2
29.4
24.0
20.1
1.4
100
%T
1.1
1.2
1.0
.;
.1
100
Printout coordinates 200-213/910-914.

211
TABLE A-XXX
READING GROWTH AFTER FIRST 100 INSTRUCTIONALHOUR PERIOD
Year
Growth Rate in Grade Levels
0.0 0.5-1.5 2.0 or more Total
65-66N 1,007
37.0
1,630
59.8
88
3.2
2,725
100
66-67N 1,228
36.8
1,861
55.8
248
7.4
3,337
100
67 68N 923
31.2
1,79
5,.4
281
9.4
2,963
100
68-69708 1,137 107 1,952
36.3 58.2 5.5 100
TotalN 3,866 6,357 724 10,977
35.3 58.0 6.7 100
224

1110
00m
i.1.1
101
,11.
TABLE A-XXXI
READING GROWTH (FIRST 100 HOURS) VS AGE
Year
Under 20
0.5-
2.0 or
0.0
1.5
more
N53
142
9
65-66
%CT
26.0
69.6
4.4
r\.,
%T
2.1
5.5
.3
n.,
ci
N107
171
27
66-67
%CT
35.1
56.0
8.9
XT
3.2
5.2
.8
N116
180
12
67-68
%CT
37.7
58.4
3.9
XT
4.0
6.2
.4
20-34
Cell
Total
0.0
0.5-
1.5
2.0 or
more
Total
204
370
638
36
1,044
100
35.4
61.2
3.4
100
14.3
24.8
1.4
305
525
804
95
1,424
100
36.9
56.5
6.6
100
15.9
24.3
2.9
308
434
873
166
1,473
100
29.5
59.3
11.2
100
14.8
29.8
5.7
N85
186
968-69
%CT
30.4
66.4
3.2
%T
4.4
9.6
.5
N361
679
57
Total
%CT
32.9
51.9
5.2
%T
s.4
6.3
.5
200
338
514
48
900
100
37.6
57.1
5.3
100
17.5
26.5
2.5
1,097
1,667
2,829
345
4,641
100
34 _4
58.4
7.2
100
15.5
26.3
3.2

TABLE A-raI.--Continues.
35-49
50 or older
Year
0.0
0.5-
2.0 or
Cell
0.0
0.5-
f.0 or
Cell
Total
1.5
rare
Total
1.5
more
Total
N324
507
32
863
197
259
114
470
2,581
65-66
%CT
37.5
58.8
3.7
100
41.9
55.1
3.0
100
%T
12.6
19.6
1.2
7.6
10.1
.5
100
N393
565
75
1033
195
302
49
54E
3,308
66-67
%CT
38.o
54.7
7.3
100
35.7
55.3
9.o
100
DJ
%T
11.9
17.0
2.3
5.9
9.1
1.5
100
NDCO
N275
533
83
891
91
150
13
254
2,926
67-58
%CT
30.9
59.8
9.3
100
35.8
59.1
5.1
100
%T
9.4
18.2
2.8
"3.1
5.2
.4
100
333
38
597
52
95
9156
1,933
68-69
%CT
37.9
55.8
6.3
100
33.3
60.9
5.8
100
%T
11.7
17.2
2.0
2.7
4.9
.5
100
N1218
1938
228
3384
535
806
85
1426
10,748
Total
%CT
36.0
57.3
6.7
700
37.5
56.5
6.o
100
%T
11.3
18.0
2.1
5.0
7.6
.8
100
Printout coordinates 300-309/506-515.

TABLE A-XXXII
READING GROWTH VS SEX (FIRST 100 HOURS)
years
Readtng Growth in Grade Levels
Total
Male
Female
0.0
0.5-1.5
2.6+
Cell
Total
0.0
0.5-1.5
2.0+
Cell
Total
N373
613
38
1,024
579
861
53
1,493
2,517
65-66
%CT
36.4
59.9
3.7
100
38.8
57.7
3.5
100
ST
14.8
24.4
1.5
23.0
34.2
2.1
100
N521
745
92
1,358
705
1,115
154
1,974
3,332
66-67
%CT
38.4
54.9
6.7
100
35.7
56.5
7.8
100
ST
15.6
22.4
2.8
21.2
33.4
4.6
100
N290
470
53
813
629
1,281
222
2,132
2,945
67-68
%cT
35.7
57.8
6.5
100
29.5
60.1
10.4
100
ST
0.8
16.0
1.8
21.4
43.5
7.5
100
N251
348
42
641
456
780
65
1,301
1,942
68-69
%CT
39.2
c4.3
6.5
100
35.0
60.0
5.0
100
ST
12.9
17.9
2.2
23.5
40.2
3.3
100
N1,435
2,176
225
3,836
2,369
4,037
494
6,900
10,736
Total
%CT
37.4
56.7
5.9
100
34.3
58.5
7.2
100
ST
13.4
20.2
2.1
22.1
37.6
4.6
100
Printout coordinates 300-309/521-522.

READING GRCWTH
(1ST 100
TABLE A-XXXIII
HOURS) IN GRADE LEVELS VS.
VARIOUS YEARS OF PREVIOUS SCHOOLING
Year
Schooling
0-3
4-6
Reading
0.0
0.5-1.5
2.0+
CT
0.0
0.5-1.5
2.0+
CT
N138
195
7340
231
396
17
644
1965-66
%CT
40.6
57.4
2.0
100
35.9
61.5
2.6
100
%T
5.4
7.6
.3
9.0
15.4
.7
N169
207
18
394
302
409
40
751
1966-67
%CT
42.9
52.5
4.6
100
40.2
54.5
5.3
100
%T
5.2
6.3
.6
9.2
12.5
1.2
Da
83
88
6177
206
387
27
620
.00
1967-68
%CT
46.9
h9.7
3.4
100
33.2
62.4
4.4
100
%T
2.8
3.0
.2
7.1
13.3
0
N30
42
173
122
159
20
301
1968-69
%CT
41.1
57.5
1.4
100
40.5
52.8
6.7
100
%T
1.6
2.2
.0
6.4
8.3
1.0
N420
532
32
984
861
1,351
104
2,316
Total
%CT
42.7
54.1
3.2
100
37.2
58.3
4.5
100
%T
3.9
5.0
.3
8.1
12.7
1.0

TABLE A-XXXIII.--Continued
n.,
N.;
cc.
Year
Schooling
7-9
10-12
N)
cr.
1-
teasing
0.0
0.5-1.5
2.0+
CT
0.0
0.5-1.5
2.0+
CT
1965-66
N %CT
%T
34438.4
13.4
52058.o
20.2
32 3.6
1.2
896
100
167 31.5
6.5
335 63.o
13.0
29 5.5
1.1
531
100
1966-67
N %cT
pr
414 34.9
12.6
669 56.4
20.4
104 8.7
3.2
1,187
loo
267 34.o
8.1
44156.2
13.4
77 9.8
2.3
735
100
1967-68
N %CT
%T
34231.5
11.7
64759.5
22.2
98 9.0
3.4
1,087
100
245 27.7
8.4
53360.1
18.3
10812.2
3.7
886
100
1968-69
N %CT
%T
271 35.5
14.2
450 58.9
23.5
43 5.6
2.3
764
100
232 34.6
8.4
40360.2
21.1
35 5.2
1.8
670
100
Total
N %CT
%T
1,571 39.9
14.7
2,236 58.1
21.4
277 7.0
2.6
3,934
100
911 31.7
8.5
1,712 59.6
16.0
249 8.7
2.4
2,87
2100

TABLE A-XXXIII.--Continued
Schooling
12+
Total
Year
Reading
0.0
0.5-1.5
2.0+
CT
N
1965-66
%cT
%T
59
94
37.1
59.1
2.3
3.7
6 3.8 .2
159
100
2,570
100
N56
99
.7
162
3,279
1966-67
%CT
34.6
61.1
14.3
100
%T
1.8
3.0
.2
100
N34
76
37
147
2,917
IV
1967-68
%cT
23.1
51.7
25.2
100
GJ
%T
1.2
2.6
1.2
100
0N
39
59
510
31,911
1968-69
%CT
37.9
57.3
4.8
100
%T
2.0
3.2
.3
130
N188
328
55
571
10,677
Total
%cT
32.9
57.5
9.6
100
%T
1.8
3.1
.5
100
Printout Coordinates
300-309/200-213

TABLE A -XXXIV
READING GROWTH (FIRST 100 HOURS) VS ATTENDANCE (FIRST 100 HOURS)
Year
% of classes
attended
75 +%
50-75%
Grade levels
Advanced
0.0
0.5
1.5
2.0 or
more
Cell
Total
0.0
0.5
1.5
2.0 or
more
Cell
Total
N725
1,237
57
2,019
252
391
27
670
65-66
%CT
35.9
61.3
2.8
100
37.6
58.4
4.0
100
%T
24.1
41.0
1.9
8.4
13.0
.9
ZVCa
1-4
66-67
N %CT
46332.4
85760.1
107 7.5
1,427
100
417 38.2
63057.6
46 4.2
1,093
100
%T
14.5
26.8
3.4
13.1
19.7
1.4
N373
829
152
1,354
276
554
77
907
67-68
%CT
27.5
61.2
11.3
100
30.4
61.1
8.5
100
%T
12.6
28.1
5.2
9.4
18.8
2.6
N221
401
47
669
221
419
31
671
68-69
%CT
33.0
59.9
7.0
100
32.9
62.5
4.6
100
%T
11.3
20.7
2.4
11.3
21.5
1.6
N1,782
3,324
363
5,469
1,166
1,994
181
3,341
Total
:CT
32.6
60.8
6.6
100
34.9
59.7
5.4
100
%T
16.1
29.9
3.3
10.5
18.0
1.6
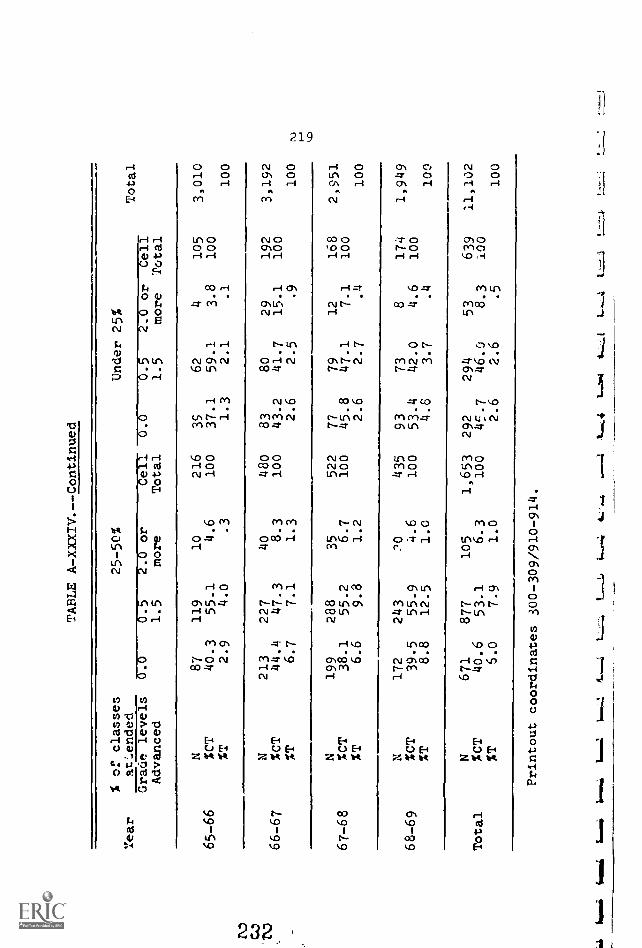
TABLE A-XXXIV.--Continued
Year
% of classes
at.ended
25-50%
Under 25%
Total
Grade levels
0.0
0.5
2.0 or
Cell
0.0
0.5
2.0 or
Cell
Advanced
1.5
more
Total
1.5
more
Total
N87
119
10
216
39
62
4105
3,010
65-66
%CT
40.3
55.1
4.6
100
37.1
59.1
3.8
100
%T
2.9
4.0
.3
1.3
2.1
.1
100
IV
'TV
N213
227
40
480
83
80
29
192
3,192
66-67
%CT
44.4
47.3
8.3
100
43.2
41.7
15.1
100
%T
6.7
7.1
1.3
2.6
2.5
.9
100
R.)
1-.
N199
288
35
522
77
79
12
168
2,951
67-68
%CT
38.1
55.2
6.7
100
45.8
47.1
7.1
100
XT
6.6
9.8
1.2
2.6
2.7
.4
100
N172
243
70
435
93
73
8174
1,949
68-69
%CT
39.5
55.9
4.6
100
53.4
42.0
4.6
100
%T
8.8
12.5
1.0
4.8
3.7
.4
100
N671
877
105
1,653
292
294
53
639
11,102
Total
%CT
40.6
53.1
6.3
100
45.7
46.0
8.3
100
%T
5.0
7.9
1.0
2.6
2.6
.5
100
Printout coordinates 300-309/910-914.
ice:
Tro
rmi
111

TABLE A -XXXV
READING LEVEL (FIRST 100 HOURS) VS.
CLASS LEVEL
Class
Non-English
Basic
Year
r.177,7r7.
0.0
0.5-1.5
2.0+
CT
0.0
0.5-1.5
2.0+
CT
N152
280
14
446
195
275
4474
1965-66
%CT
34.1
62.8
3.1
100
41.1
58.1
.8
100
%7
%T
5.9
10.8
.5
7.5
10.6
.2
:0
.-
N226
291
43
560
303
431
31
765
1966-67
%CT
40.4
51.9
7.7
100
39.6
56.3
4.1
loo
1..)
%T
6.9
8.9
1.3
9.3
13.2
.5f.) 0
N116
267
27
410
164
297
23
484
1967-68
%CT
28.3
65.1
6.6
100
33.9
61.4
4.8
loo
%T
4.0
9.3
.9
5.8
10.3
.8
N57
77
9143
100
182
18
3rJ
1968-69
%CT
39.9
53.8
6.3
100
33.3
60.7
6.o
100
%T
3.0
4.1
.5
5.3
9.6
1.0
N551
915
93
1,559
762
1,185
76
2,023
Total
%CT
35.3
58.7
6.0
100
37.7
q8.6
3.7
100
%T
5.2
8.6
.9
7.2
11.2
.7

TABLE A -XXXV. --Continued
Class
Primary
Tntermediate
Year
Growth
0.0
0.5-1.5
2.0+
CT
0.0
0.5-1.5
z.u+
,,,,
-...
N162
290
10
469
251
405
28
684
1965-64
%CT
36.o
61.9
2.1
100
36.7
59.2
4.1
100
T6.5
11.2
.4
9.7
15.8
1.1
N186
331
28
545
287
464
53
8012
1966-67
%CT
34.1
60.8
5.1
100
35.7
57.7
6.6
100
DJ
T5.7
10.1
.9
8.8
14.2
1.6
C..3
IV
4N,
N148
277
23
4D8
289
498
129
916
1967-68
%CT
33.0
61.8
5.2
100
31.6
54.4
14.0
100
T5.1
9.7
.8
10.0
17.3
4.5
N94
179
15
288
261
1968-69
%CT
32.6
62.2
5.2
100
39.6
5.0
9.5
.6
.8
368 55.8
19.5
3o
659
1!.6
loo
1.6
N597
1,077
76
1,750
1,088
1,735
240
3,063
Total
%CT
34.1
61.6
4.3
100
35.5
56.7
7.8
100
T5.6
10.1
.7
10.3
16.3
2.3
2 Lam
L10,4
6%64
imm4
Aummip
6.1.4
inw4
L=.2_1

TABLE A-YXXV.--Continued
Year
Class
Upper
Total
Growth
0.0
0.5-1.5
2.0+
CT
N180
297
34
511
2,584
.,965-66
%CT
35.2
58.1
6.7
100
%T
7.0
11.5
1.3
100
N201
308
88
597
3,271
1966-67
%CT
33.7
51.6
14.7
100
r\.,
%T
6.1
9.4
2.7
100
GO
1967-68
N %CT
166
26.8
377 60.9
7612.3
619
100
2,877
C.:1 _
r.)N ti
%T
5.8
13.1
2.6
100
163
296
35
499
1,889
1968-69
%CT
33.7
59.3
7.0
100
%T
8.9
15.7
1.9
100
N715
1,278
233
2,226
10,621
Total
%CT
32.1
57.4
10.5
100
%T
6.7
12.0
2.2
100
Printout Coordinates 100-104/300-309

TABLE A-XXXVI
READING GROWTH VS. ARITHMETIC GROWTH
Reading
0.0
0.5-1.5
Cell
Cell
Year
Arithmetic
0.0
0.5-1.5
2.0+
Total
0.0
0.5-1.5
2.0+
Total
N448
510
11
969
608
974
55
1,637
1965-66
%CT
46.2
52.7
1.1
100
37.1
59.5
3.4
100
N%T
16.7
19
.4
22.7
36.2
2.0
CZ =
N638
401
26
1,065
494
1,090
71
1,655
1966-67
%CT
59.9
37.7
2.4
100
29.8
65.9
4.3
loo
%T
22.1
13.9
.9
17.1
i7.7
2.5
N484
373
29
886
473
1.149
81
1,703
1967-68
%cT
54.6
42.1
3.3
100
27.8
67.5
4.7
100
%T
16.9
13.1
1.0
16.6
40.2
2.8
N343
286
24
653
318
719
6o
1,097
1968-69
%CT
52.5
43.8
3.7
100
29.0
65.5
5.5
loo
%T
18.5
15.4
1.3
17.2
38.8
3.2
N1,913
1,570
90
3,573
1,893
3,932
267
6,092
Total
%CT
53.6
43.9
2.5
100
31.1
64.5
4.4
100
%T
18.6
15.3
.9
18.4
38.2
2.6
LPrI
,*~
-1Lsoz:11
t-*L1--1-
L-1
I--;

TABLE A -XXXVI. - -Continued
Year
1965-66
1966-67
1967-68
1968-69
Total
Reading
2.0+
Total
Arithmetic
0.0
0.5-1.5
2.0+
Cell
Total
N13
47
18
78
2,684
%CT
16.7
60.3
23.o
100
%T
.5
1.8
.7
100
N25
89
52
166
2,886
%CT
15.0
53.7
31.3
100
%T
.9
3.1
1.8
100
N40
124
105
269
2,858
%CT
14.9
46.1
39.0
100
%T
1.4
4.3
3.7
loo
N27
53
23
103
1,853
%CT
26.2
51.5
22.3
100
%T
1.5
2.9
1.2
100
N105
313
198
616
10,281
%CT
17.1
50.8
32.1
100
%T
1.1
3.0
1.9
100
co
rintout Coordinates