Embed Size (px)
Citation preview

Document No. D13/521909
AER 2014-19 Technology Operating Expenditure Plan Overview
TRIM ID: D13/446348 For Official Use Only AER 2014-19 Technology Operating
Expenditure Plan Overview
Released: 29 May 2014 For Official Use Only Page: 2
Contents
Glossary ........................................................................................................................................................................... 3
Executive Summary .......................................................................................................................................................... 7
1. Introduction ........................................................................................................................................................... 11
2. Outcomes last period ............................................................................................................................................. 14
3. Base year opex for 2014-19 regulatory period ........................................................................................................ 18
4. 2014-19 IC&T strategy ............................................................................................................................................ 22
5. Forecast method .................................................................................................................................................... 48
6. High level review .................................................................................................................................................... 51
Appendix A – Supporting documents ............................................................................................................................... 52
TRIM ID: D13/446348 For Official Use Only AER 2014-19 Technology Operating
Expenditure Plan Overview
Released: 29 May 2014 For Official Use Only Page: 3
Glossary Name Description
Alcatel The telephony system including the PABX and desk phone sets.
ARC Call centre online help. Web-based portal
AutoCAD Design & drafting platform
B2B Browser & Gateway Processing of B2B transactions - E-Hub, Systems & databases, B2B Service Orders. B2B Forms + B2B Server
BALIN (Engineering Information Index)
Balin is Ausgrid's Engineering Information Index. It contains engineering policies, standards and guidelines as well as reference material and links to other systems.
CBA Diamond Services / Commbiz
Data retrieval system to monitor bank accounts within CBA. (not to be confused with micro treasury) Diamond Services Individual Funds Movement
Complete Human Resource Information System (CHRIS21)
Maintains personnel, payroll, position control, training & development, recruitment, Occupational Health & Safety details about employees.
Computer Aided Service System (CASS)
CASS is a despatching and mobile computing application that enables the electronic issue of customer premise jobs to the field, such as reconnect orders and single premise outage jobs. The jobs are updated and completed in a CASS mobile solution in the field and updates on the progress of these jobs are available in CASS and the Outage Management System (OMS) via an interface. It is used primarily by System Control's Despatch sections and Emergency Service Operators (EMSOs).
Dereg- Billing Generates the Billing information for TCA Clients based on the Dereg Data.
Dial before You Dig A "One Stop Shop" service to supply information about buried cables, pipes, conduits, etc. so that they can be avoided during excavation work and not damaged.
Disconnect & Reconnect Order System (DAROS)
Requests for disconnects, reconnects, alterations to electricity network
Distribution Network Management System (DNMS)
The Distribution Network Management System / Distribution Management System (DNMS/DMS) is an advanced SCADA system used by Ausgrid control rooms to monitor and control the electrical network.
Distribution Performance Reporting and Billing System (DPBRS)
Provides job, Performance, Utilisation Reports of the Operation as well as billing Base
DOR Primavera Primavera System is Ausgrid's Project Management System. It is used by staff across three divisions, Transmission & System Operations, Distribution Operations & Reliability, and Office of the CIO to manage projects and critical resources.
External Website The Ausgrid website is hosted by Safecom, an external vendor.
EA Gateway The EA gateway is a service for file transfers both internal and external.
Finance - Management Reports
The System generates high level management reports based on the Dereg Data.

TRIM ID: D13/446348 For Official Use Only AER 2014-19 Technology Operating
Expenditure Plan Overview
Released: 29 May 2014 For Official Use Only Page: 4
Name Description
FigFleet FigFleet is a Progress database used by Fleet Management at Ausgrid. The system contains details of all vehicles and plant including allocation of units, fuel transactions, service and repair details, tyres and fringe benefits tax details. FigFleet provides financial transactions including depreciation of fleet assets and billing details, all of which are interfaced with SAP. The system is used extensively by the Fleet Management group to manage Ausgrid's fleet of over 4000 vehicles and plant.
Fleet Management System Manages fleet leasing business.
General Load System Analyses and forecasts system loads for system planning. (merge SCADA and Pacific Power data).
Genesys A system used in the contact centre to route calls to call agents.
Geographical Information System (GIS)
The corporate Geographic Information System details spatial information for EA's field assets.
InfoSpan ANZ Purchase Card Software. Maintains Details of Purchases made with Visa Cards ( .psr files ).
Ingrian DataSecure Appliance Ingrian appliances encrypt data on various hardware (e.g. servers) to provide an increased level of security.
Itron Enterprise Edition A repository of interval meter configurations (standing data) for which Ausgrid fulfils the Meter Data Provider role on the national market.
KnowRisk (OT&I Risk Repository)
A Thick Client/Server app used for the tracking and management of Cyber Security risks.
Lotus Notes Client Email messaging, RSS feeds, Instant Messaging, document and file sharing (through add-on products).
Meter Configuration System The Meter Configuration System is an Intranet based front-end application that supports the creation, amendment, and removal of meter configurations.
Meter Data Warehouse The Meter Data Warehouse is a database that extracts meter reading data from Nemstar and Metering Business System (MBS) for analytics and report queries from business stakeholders.
Metering Business System The Metering Business System (MBS) supports the network metering requirements of the Australian contestable energy market and provides a comprehensive suite of functions for the management of Meter Reading, Meter Provision, Meter Data Provider and Network services.
Mobile Asset Management The SAP MAM application is a full offline mobile application that assists the field service and the field maintenance technicians to perform their daily activities within plants with all the needed data synchronized onto their handheld devices from the SAP backend system.
Multi Vendor Reading System Electronic meter reading system for remote (ERT) meter reading.
nemSTAR National Electricity Market STAR: Meter Data Agent's load profile storage system. Used for creating reports for the National Electricity Market and MDA customers.
NICE - Record On Demand (ROD)
Voice recording application for the Call Centre.
Outage Management System (OMS)
The Outage Management System (OMS) is a computing application that predicts network fault locations based on a combination of customer outage calls and network device operations. This system is used across Ausgrid at the time of an outage to process customer outage calls, provide feedback to customers for known outages, and to assist with managing outage identification and restoration.
TRIM ID: D13/446348 For Official Use Only AER 2014-19 Technology Operating
Expenditure Plan Overview
Released: 29 May 2014 For Official Use Only Page: 5
Name Description
Data sourced from OMS is used by claims groups to process any customer claims resulting from outages and also for internal and external regulatory reliability reporting.
Primary users of OMS and OMS data include the Contact Centre, Control Room, Despatch, Field Services, Network Security, Network Reliability and Network Claims.
Physical Network Inventory (PNI)
Geographic Information System used to model the Physical Network Inventory for Communications
Property Management Information System (PMIS)
The Property Management Information System (PMIS) records and maintains information relating to Ausgrid's property portfolio, including; floor space areas, easements, associated leases, licences and service contracts. It also has a job tracking facility in relation to property acquisitions, easement and leases.
PMIS captures operating costs by individual property, billing of external tenants and it has a comprehensive suite of standard reports. It is integrated with the OneCall Lotus Notes system used by the Contact Centre to capture internal and external requests regarding building maintenance issues.
The system has a flexible search engine providing the capacity to search by any reference number, land title information, address, property name, usage, local government area. The relevant PMIS reference number is cross referenced with the asset number recorded in SAP for all Ausgrid-owned properties.
PMIS has the functionality to capture billing file data from Sydney Water, Hunter Water and OSR for Land Tax, including consumption data for water and electricity usage for individual properties.
SAP SAP is our company-wide information management system that includes financial, procurement, project, scheduling, asset management, customer and HR data.
SAS SAS portal is a website from which staff can access the following applications:
- General Load System (Genload): reporting of feeder and transformer loads at sub-transmission, zone and distribution levels.
- Loadcycle: load cycles and peak loads for sub-transmission and zone transformers.
- Protection Grading (a.k.a Grade): analysis of system protection to achieve safe fault clearing times.
- TIS Query & Reporting: legacy reports against the Network Reporting Database.
SCADA The Supervisory Control and Data Acquisition (SCADA) system is used by Ausgrid control rooms to remotely monitor and control the electrical network. The historical data gathered by the SCADA system is used by staff for electrical network investigations and reporting
SEQOS System to support warehouse-control picking & put away process.

TRIM ID: D13/446348 For Official Use Only AER 2014-19 Technology Operating
Expenditure Plan Overview
Released: 29 May 2014 For Official Use Only Page: 6
Name Description
SharePoint SharePoint is a Microsoft application. It is a browser-based platform that can deliver a range of solutions, such as intranet portals, websites, document and file management, collaboration spaces, and process information. At Ausgrid SharePoint is used to deliver The Wire and a number of team file sharing and collaboration sites, called InfoShare.
SINCAL An application developed by Siemens Austria that allows a user to construct a model of an electrical network. Using a system called Electricity Supply Network Planning (ESNP), Distribution Planning Systems (DPS) are able to automatically build a zone model of any Ausgrid distribution network. Two of the functions provided by ESNP are the ability to automatically produce a schematic layout of a Sincal zone model and perform a number of network analysis tasks, such as seasonal load analysis.
TDMS The Technical Documents Management System (TDMS) is a web based document repository of engineering information.
TIBCO A middleware platform for integrating applications.
TM1 Business unit and corporate reporting and budgeting models.
TRIM / REX TRIM is Ausgrid's corporate Electronic Document and Records Management System. It provides records management capability for physical and electronic business records and information. TRIM is designed to provide Ausgrid with the ability to capture, manage, and secure business information in order to support day to day business operations and meet governance and regulatory compliance obligations.

TRIM ID: D13/446348 For Official Use Only AER 2014-19 Technology Operating
Expenditure Plan Overview
Released: 29 May 2014 For Official Use Only Page: 7
Executive Summary
Our Information, Communications & Technology (IC&T) Opex plan has been developed with our network customers top of mind. As IC&T is a key enabler for achieving operational cost reductions, the plan seeks to ensure our core platforms and capabilities as a Network Service Provider (NSP) are maintained and compliance obligations are met
The purpose of this document is to provide an overview of our forecast IC&T Operating Expenditure (opex) to meet our network business objectives for the 2014-19 regulatory period. IC&T opex for the 2014-19 regulatory period includes information technology, telecommunications and operational technologies (such as SCADA and Network control systems) which are integral to performing key network and corporate functions such as Asset Lifecycle Management, Asset Operations, Customer and Market Management and Financial Reporting. The prudent and efficient implementation of technology enables Ausgrid to maintain services to our customers and reduce our cost to serve.
In the 2014-19 regulatory period, Ausgrid has an overarching strategic objective to contain average network tariff increases to CPI for its customers. Therefore, both the IC&T capex and associated opex plans have been developed to maximise cost reduction whilst ensuring that our core platforms and capabilities are maintained to ensure business operations within acceptable risk levels, as well as ensuring our compliance obligations are adequately met.
Efficient base for the 2014-19 IC&T opex forecasts
The IC&T opex in 2012/13 of $61.7 million ($ nominal) is the base used in the IC&T opex forecasts for the upcoming regulatory period, 2014-19. This expenditure includes labour, labour hire, software, hardware and other costs associated with maintaining the Non-network IT & Communications and SCADA & Network Control systems.
According to a recent independent benchmarking review of Distribution Network Service Providers (DNSPs) in Australia, Ausgrid’s 2012/13 the Non-network IT & Communications opex was largely more efficient than the industry mean for key performance metrics comparing IT opex to the number of DNSP’s customers, employees, end users and devices. Ausgrid reported just below the industry mean for 2012/13 when comparing Non-network IT opex to annual total opex. This is as a result of Ausgrid’s ongoing commitment to reducing total corporate operating expenditure which IC&T partly enabled. Furthermore, Ausgrid’s total Non-network IT expenditure (opex and capex) per DNSP customer was below the mean by $17 per DNSP customer.
It is noted that compared to the base year for the 2009-14 regulatory submission (2006/07), there has been an expected step change in IC&T opex due to an increase in opex from strategic capital investments made in Ausgrid’s core platforms. The graph in Figure A. below shows the year on year step changes since 2006/07 with the plateau of opex seen in 2012/13 to 2013/14.

TRIM ID: D13/446348 For Official Use Only AER 2014-19 Technology Operating
Expenditure Plan Overview
Released: 29 May 2014 For Official Use Only Page: 8
Actuals Projection AER Allowance Actual Trend
Figure A: IC&T operating expenditure step changes 2006-2014 ($million, nominal, rounding differences)
This step change is a result of the incremental opex associated with strategic capital investments made in 2007/08 and 2008/09. These capital investments established Ausgrid’s core platform and has been instrumental in the network business achieving $30 million in cost savings over the 2009-14 regulatory period, thereby offsetting the majority of the incremental IC&T opex.
IC&T Opex Forecast during the 2014-19 Regulatory Period
Going forward into the 2014-19 period, Ausgrid has an overarching strategic objective to contain average network tariff increases to CPI for its customers. As such, the 2014-19 IC&T capex and opex plans have been structured to achieve cost reductions and continue to maximise Ausgrid’s opportunities for lowering costs. Having established a robust technology platform in the previous regulatory periods and significantly reduced IC&T capex, the focus of our IC&T strategy for the 2014-19 regulatory period is to maintain compliance, maintain core IC&T platforms and capabilities that support network activities.
Using the building block approach with 2012/13 as the base year, the resulting 2014-19 IC&T Opex forecast for business as usual activities is outlined in Table A. below:
$M ($ real 13/14) 2014/15 2015/16 2016/17 2017/18 2018/19 Total 2014-19
$M $M $M $M $M $M
Standard control services
63.3 69.4 72.5 74.2 75.5 354.9
Alternative control services
4.5 4.6 4.6 4.7 4.7 23.1
Total Business as Usual Operating expenditure
67.8 74.0 77.2 79.0 80.4 378.4
Table A: 2014-19 Forecasted IC&T Opex (Summary, $ millions, real 13/14)
The cost escalations applied to the Technology costs are consistent with Ausgrid’s cost escalation methodology. This cost escalation methodology is detailed in the Overview of the cost escalation methodology document (Document ID 36536).
37.5
6.5
8.8
12.7
(1.4)
3.8 (5.9) 0.3
62.0
0.00
10.00
20.00
30.00
40.00
50.00
60.00
70.00
Baseline for AER 2007/2008 2008/2009 2009/2010 2010/2011 2011/2012 2012/2013 2013/2014 TOTAL OPEX End of Current Regulatory
Period
($M) ICT Opex Trend - Network Line of Business

TRIM ID: D13/446348 For Official Use Only AER 2014-19 Technology Operating
Expenditure Plan Overview
Released: 29 May 2014 For Official Use Only Page: 9
Note: the above forecast includes expenditure related to Standard Control Services and Alternate Control Services. This approach is consistent across the document (unless otherwise stated). The Regulatory Proposal adjusts these forecasts in accordance with the approved CAM.
TRIM ID: D13/446348 For Official Use Only AER 2014-19 Technology Operating
Expenditure Plan Overview
Released: 29 May 2014 For Official Use Only Page: 10
Opex step changes
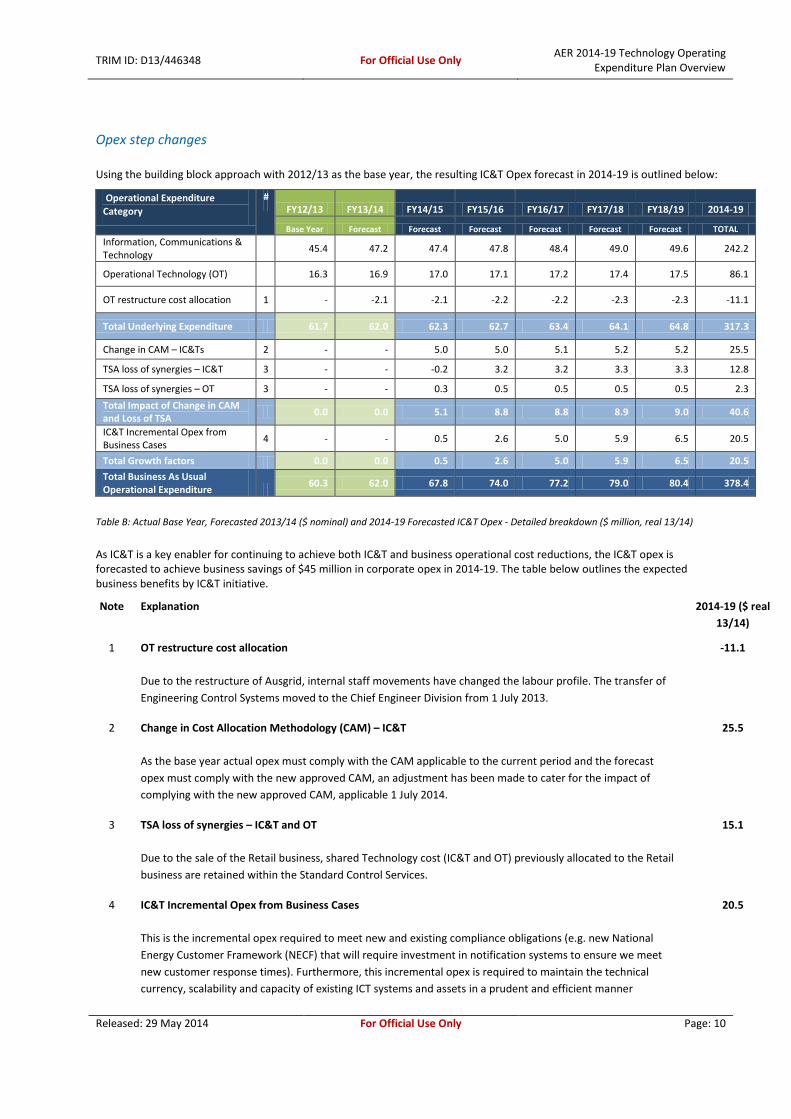
Using the building block approach with 2012/13 as the base year, the resulting IC&T Opex forecast in 2014-19 is outlined below:
Operational Expenditure Category
# FY12/13 FY13/14 FY14/15 FY15/16 FY16/17 FY17/18 FY18/19 2014-19
Base Year Forecast Forecast Forecast Forecast Forecast Forecast TOTAL Information, Communications & Technology
45.4 47.2 47.4 47.8 48.4 49.0 49.6 242.2
Operational Technology (OT) 16.3 16.9 17.0 17.1 17.2 17.4 17.5 86.1
OT restructure cost allocation 1 - -2.1 -2.1 -2.2 -2.2 -2.3 -2.3 -11.1
Total Underlying Expenditure 61.7 62.0 62.3 62.7 63.4 64.1 64.8 317.3
Change in CAM – IC&Ts 2 - - 5.0 5.0 5.1 5.2 5.2 25.5
TSA loss of synergies – IC&T 3 - - -0.2 3.2 3.2 3.3 3.3 12.8
TSA loss of synergies – OT 3 - - 0.3 0.5 0.5 0.5 0.5 2.3
Total Impact of Change in CAM and Loss of TSA
0.0 0.0 5.1 8.8 8.8 8.9 9.0 40.6
IC&T Incremental Opex from Business Cases
4 - - 0.5 2.6 5.0 5.9 6.5 20.5
Total Growth factors 0.0 0.0 0.5 2.6 5.0 5.9 6.5 20.5
Total Business As Usual Operational Expenditure
60.3 62.0 67.8 74.0 77.2 79.0 80.4 378.4
Table B: Actual Base Year, Forecasted 2013/14 ($ nominal) and 2014-19 Forecasted IC&T Opex - Detailed breakdown ($ million, real 13/14)
As IC&T is a key enabler for continuing to achieve both IC&T and business operational cost reductions, the IC&T opex is forecasted to achieve business savings of $45 million in corporate opex in 2014-19. The table below outlines the expected business benefits by IC&T initiative.
Note Explanation 2014-19 ($ real 13/14)
1 OT restructure cost allocation
Due to the restructure of Ausgrid, internal staff movements have changed the labour profile. The transfer of Engineering Control Systems moved to the Chief Engineer Division from 1 July 2013.
-11.1
2 Change in Cost Allocation Methodology (CAM) – IC&T
As the base year actual opex must comply with the CAM applicable to the current period and the forecast opex must comply with the new approved CAM, an adjustment has been made to cater for the impact of complying with the new approved CAM, applicable 1 July 2014.
25.5
3 TSA loss of synergies – IC&T and OT
Due to the sale of the Retail business, shared Technology cost (IC&T and OT) previously allocated to the Retail business are retained within the Standard Control Services.
15.1
4 IC&T Incremental Opex from Business Cases
This is the incremental opex required to meet new and existing compliance obligations (e.g. new National Energy Customer Framework (NECF) that will require investment in notification systems to ensure we meet new customer response times). Furthermore, this incremental opex is required to maintain the technical currency, scalability and capacity of existing ICT systems and assets in a prudent and efficient manner
20.5

TRIM ID: D13/446348 For Official Use Only AER 2014-19 Technology Operating
Expenditure Plan Overview
Released: 29 May 2014 For Official Use Only Page: 11
reducing the risk of potential failure and/or unplanned production outages to the network customer.
1. Introduction Technology provides the business with the critical support required to enable Ausgrid to meet its obligations as a Network Service Provider (NSP) in the National Electricity Market.
The purpose of this document is to provide an overview of our forecast opex to meet our obligation in delivering technology services for the 2014-19 Regulatory period. Technology provides critical business systems support to enable Ausgrid to meet its obligations and business objectives as a Network Service Provider (NSP). This includes core business activities such as operating the network, undertaking effective asset management planning for the network and fulfilling regulatory and statutory reporting obligations.
Non-network IT & Communications and SCADA & Network control systems are integral to performing key network and corporate functions such as Asset Lifecycle Management, Asset Operations, Customer and Market Management and Financial Reporting. The prudent and efficient implementation of technology enables Ausgrid to deliver better services to our customers and reduce our cost to serve.
Supporting documents to this overview provide more information on our models, input assumptions and planning frameworks. Refer to Appendix A for the full listing.
Key objectives
Technology services provide critical business systems support to meet our obligations. In the absence of technology we would not be able to operate our current network, undertake effective planning of the network or fulfil our corporate obligations. There are two main reasons for using technology at Ausgrid:
• IT systems, communications and operating technology are instrumental to perform our network and corporate functions such as customer management, asset management, network operations, and financial reporting.
• Prudently adopting technology enables us to deliver services to our network customers at a lower cost over time.
The key objectives of the Technology Opex program are to:
• Meet new and existing compliance obligations – In order for Ausgrid to appropriately manage its business processes and fulfil its regulatory and statutory obligations, the IC&T systems must be updated to adhere to these obligations. Failure to invest in maintaining the IC&T systems would result in lack of compliance with regulatory and audit requirements and potentially result in the loss of license and monetary fines (Australian Taxation Office, Market Rules, etc); and
• Maintain core platforms and capabilities – Investment required to maintain the technical currency, scalability and capacity of existing IC&T systems and assets to provide for standard control services in a prudent and efficient manner reducing the risk of potential failure and/or unplanned production outages. Failure to maintain these platforms would lead to increased business and technical operational cost to support regulatory and statutory processes, failure to meeting specific regulatory processing requirements and introduce potential errors in processing resulting in erroneous data with IC&T Systems and data being released into the market.
Scope of Technology Plans
The majority of our opex is related to maintaining existing technology systems, licence fees to operate assets, and providing service and delivery support to the business. We carefully consider how technology can most efficiently be utilised to
TRIM ID: D13/446348 For Official Use Only AER 2014-19 Technology Operating
Expenditure Plan Overview
Released: 29 May 2014 For Official Use Only Page: 12
provide support to our DNSP and corporate activities. Many of our assets are common to one or more business functions. The key types of assets used to run our technology service include:
• Infrastructure provides the foundation for technology services including processing power, memory, storage and security. Key examples include servers, data networks, and data centres. As a DNSP we are also required to have telecommunications infrastructure to operate and manage the network. This includes switches, routers and connectivity;
• Applications, Licenses and Platforms enable our staff to perform specific tasks related to our network and corporate obligations. For example, our SAP platform enables us to perform a range of activities from financial reporting, billing to procurement and tracking maintenance of network assets. We also have a number of other specific applications related to our activities as a DNSP including GIS for tracking our assets, distribution management and outage management systems to detect faults and metering systems to help us accurately bill our customers;
• Workplace Technology assist our staff perform their daily tasks. This includes devices such as computers and phones, intranet services, and email systems; and
• Operational Technology – assets used to directly operate or manage devices on the electricity network, including SCADA support system or telecommunications between substations. It also includes a range of technologies that are collectively known as Smart Grid initiatives.
Requirement for activities
We are required to maintain the IC&T assets in order to fulfil our market obligations and expenditure objectives including:
• Meeting customer demand and/or manage expected growth of the network; • Supporting the business in the supply of standard control services; • Maintaining and supporting network safety; Complying with all applicable regulatory obligations or requirements; and • Maintaining the quality of, reliability and the security of IC&T services.
Prudent and efficient approach to identifying the need and managing risk
Ausgrid have a robust process for identifying investments in which a top down and bottom up methodologies are applied. For example from a “bottom up” perspective we have visibility regarding the end-of-life or end-of-support of our applications and infrastructure as indicated by our vendor roadmaps. In a “top down” approach, the business units would identify a need based on changes to legislation or improvements that could be made to the provision of standard control services.
We use best practice methods to identify arising needs in the longer term. Our approach to identify needs is guided by a number of key artefacts which include:
• Our Business Strategy and Corporate Scorecards; • External drives such as government bodies, legislation, cyber security risks etc; and • IC&T Technology Strategy and Enterprise Architecture and roadmaps.
Through our project initiation process we identify efficient and feasible options to address the needs including new and emerging cloud based services. This is based on an understanding of the business requirements, value proposition (benefits) and a number of other factors including the maturity of the cloud offerings within Australia. A strategy decision tree is applied and guides the users towards five (5) strategic options for each application:
• Continue – No change required, except bug fixes, configuration or reporting changes; • Maintain –Install a more recent software version or re-install the software on newer hardware; • Enhance –Make significant changes to the application; and • Replace – Replace the application with a brand new application or migrate it to another existing application
Each option is costed using a bottom up, building block approach with a cloud based cost assessment undertaken when significant investments are made. The IC&T capital planning model includes standardised project costing / benefit templates to be used in the bottom up costing of all potential options assessed to deliver an investment need.
Refer to Section 5. Forecast method for further information on this process.
TRIM ID: D13/446348 For Official Use Only AER 2014-19 Technology Operating
Expenditure Plan Overview
Released: 29 May 2014 For Official Use Only Page: 13
NetworksNSW Alignment and Efficiencies
All three operating companies as part of NetworksNSW have worked together to develop a Technology Strategic Plan. The key objective is to leverage technology and enable the transition of NetworksNSW to the new efficient business model. The plan’s scope includes information technology and telecommunications, as well as operational and grid technologies.
Across the three operating companies, there are significant differences in levels of information technical currency and overlapping trials of smart grid technologies. This state provides opportunities to leverage existing systems by providing services to more than one company from a single system, and provides opportunity to consolidate technology trials and apply learnings from these trials across the three companies.
The key focus areas and objectives of the NetworksNSW alignment are to:
• Implement pragmatic common processes and governance, joint procurement opportunities, and consolidated functions where appropriate to leverage the existing capabilities within the three operating companies;
• Execute enterprise mobility strategy, mobile crews, process automation, re-engineer meter to cash processes and utilise smart grid monitoring and control tools to limit manual data capture and unnecessary field site visits;
• Implement improved decision support systems using data based analytics from smart grid, metering and transactional systems to support improved decision making;
• Use blended delivery models to automate flows of data from contractor partners into internal business processes and enhance social media presence to improve communications; and
• Implement enabling technologies to support network performance business objectives in the area of automated distribution management and customer load control.
Operational constraints
The organisation faces the following operational constraints in delivering these services
• Following the Sale of the Ausgrid Retail Business to EnergyAustralia (Formerly TRUenergy) in March 2010, Ausgrid continues to undertake its technology commitments and obligations contained within the Transitional Services Agreement (TSA). At the time of writing the Joint Transition Plan (JTP4), the completion of the TSA is planned for 27 November 2014, with a post go-live 3 month Warranty period. All Ausgrid technology commitments and obligations continue to be met under the Transitional Services Agreement and Joint Transition Plan (JTP4).
• Networks NSW (NNSW) announced in July 2013 plans to investigate the sale of Ausgrid and Endeavour Energy's contestable metering businesses to focus on core operations associated with the running of the NSW electricity network. In response, a project has been formed to investigate and manage the sale of these businesses and potentially implement a transitional service structure with the purchasing entity (if required).

TRIM ID: D13/446348 For Official Use Only AER 2014-19 Technology Operating
Expenditure Plan Overview
Released: 29 May 2014 For Official Use Only Page: 14
2. Outcomes last period During the 2009-14 period, Ausgrid spent $321 million on IC&T opex to deliver its objectives and contributed in the achievement of $33 million in savings to our network customers.
The purpose of this section is to identify the outcomes of opex in the 2009-14 period and the reasons for variation to forecasts.
2.1 Circumstances during 2009-14 period
Ausgrid’s actual IC&T opex for the current 2009-14 regulatory period is forecast to be $321 million (average of $64 million per annum) against an approved AER IC&T operational expenditure of $257 million.
$M 2009-10 2010-11 2011-12 2012-13 2013-14 Total 2009-14
Actual $M $M $M $M $M $M
Operating expenditure
65.5 63.8 67.6 61.7 62.0 320.6
Allowance 49.5 49.5 51.1 52.6 53.9 256.6
Variance to Allowance
+16.0 +14.3 +16.5 +9.1 +8.1 +64.0
Table 1: Comparison of 2009-14 actual IC&T opex to AER allowance ($ millions, nominal)
The main driver for the increase was the incremental opex from capital investments made in IC&T after a period of underinvestment in technology. Since 2007/08, Ausgrid invested in the renewal and consolidation of ageing core technology systems and infrastructure underpinning its key business processes. This resulted in Ausgrid successfully establishing a robust technology platform that supported the delivery of quality, reliable and secure network services to our customers.
In the 2009-14 IT opex forecasts proposal, Ausgrid included $44.1 million in for the incremental opex related to the proposed IT capital program. AER approved the IT capital program but did not allow the associated incremental IT opex required for the ongoing costs related to the capital program. Instead, Ausgrid was to offset the incremental opex with benefits achieved across the network business. The major IT capital projects and associated incremental opex are detailed below:
IC&T capital investment 2007/08 and 2008/09 IC&T Capex ($million)
IC&T Opex ($million)
Integrated Asset Management Investment Program $72m $4.5m
Data Centre Consolidation Program $60m $1.0m
Removing risks on IT critical exposures $12m $1.5m
Field Computing Program $44m $1.9m
New Licensing needs due to expanding user base & new technology investment $18m $2.5m
Infrastructure Refresh Program $12m $0.5m
Table 2: Major IT capital investments in 2007/08 and 2007/09 with the IC&T opex impact ($ millions, nominal)

TRIM ID: D13/446348 For Official Use Only AER 2014-19 Technology Operating
Expenditure Plan Overview
Released: 29 May 2014 For Official Use Only Page: 15
During the 2009-14 period, the IT program delivered approximately $34 million of cost reductions across the network business and additional intangible benefits (such as productivity savings and cost avoidance). This estimate is based on internal and/or external Post Implementation Reviews (PIRs) conducted.
Benefits achieved in 2009-14 Estimated benefit from PIR($million)
Comments
Integrated Asset Management Investment Program
$27.1m
Achieved from divisional finance FTE reduction, reduced overtime costs, elimination of administrative contracted services, reduced maintenance plan charges from changing pole inspections timings and reduction in mainframe costs from decommissioning.
Data Centre Consolidation Program $4.9m
Achieved reduced facilities management expenditure and decommissioning of network links. Note: file server consolidation project was de-scoped and hence forecasted capex and benefits were reduced.
Infrastructure Refresh Program $2.1m
Achieved through lower maintenance changes for virtual services, lower power consumption, removal of opex hardware maintenance on Fujitsu managed servers, reduction in the number of virtual servers, reduced infrastructure and licensing costs from consolidating citrix farms.
TOTAL $34.1m
Table 3: Benefits achieved in 2009-14 from the ICT capital program ($ million, nominal)
Further reductions of $10 million were anticipated, however these benefits have been eroded or deferred by Ausgrid’s recent cost reduction initiatives and changes as part of the network industry reform program.
2.2 Opex outcomes during the 2009-14 period
IC&T expenditure over the 2009-14 regulatory period can be further broken down into the following cost categories:
Cost Category 2009-10
$M 2010-11
$M 2011-12
$M 2012-13
$M 2013-14
$M Total 2009-14 $M
Actual Actual Actual Actual Estimated
Labour 19.1 12.7 14.1 13.5 11.7 71.1
Labour Hire 17.1 19.5 22.8 22.0 22.9 104.3
Contracted Services
4.1 4.5 2.1 2.3 2.4 15.4
Hardware Maint
2.0 6.2 3.6 2.6 2.7 17.1
Software Maint
7.7 8.5 12.8 12.8 13.4 55.2
Facilities Mgmt
6.8 7.2 6.4 5.5 5.7 31.6
Other IT Expense
8.7 5.2 5.8 3.0 3.2 12.1
TOTAL $65.5 $63.8 $67.6 $61.7 $62.0 320.5
Table 4: IC&T opex breakdown ($ million, nominal)

TRIM ID: D13/446348 For Official Use Only AER 2014-19 Technology Operating
Expenditure Plan Overview
Released: 29 May 2014 For Official Use Only Page: 16
Key expenditures include:
• Labour and Labour Hire resources to support and maintain current applications and infrastructure
• Contracted Services for third party maintenance and support;
• Hardware Maintenance services for repairs, upgrades and/or maintenance support of Ausgrid owned IC&T hardware
provided for by third party vendors;
• Software Licence Maintenance to ensure ongoing vendor support and up-to-date versions of software;
• Facilities Management services for infrastructure housing, data backup, batch processing, capacity and performance
monitoring, security monitoring, fault management, system patching and preventative maintenance by third party
vendors; and
• Telecommunications infrastructure maintenance and support including network infrastructure, PABX units, routers,
switches, on-ramps / frame relays, etc.
2.3 IC&T opex spend trending down
At the start of the current 2009-14 regulatory period IC&T opex had already increased by $15.3 million to $52.8 million from the base year allowance $37.5 million due to the opex tail from IC&T capital investments in the prior regulatory period. Over the next three (3) years to 2011/12, further incremental opex resulting from capital investment occurred widening the gap between the flat lined determination allowances. However, the last two years of the current regulatory period has seen a significant cost reduction from the peak 2011/12 figure due to a number of key savings achieved in IC&T opex over that period. In particular, savings have been achieved from outsourced contract renegotiation, capital project benefits, headcount reductions and discretionary expenditure savings. The gap between the allowance and actual IC&T cost has trended down such that the first year and last year’s gap is approximately cost neutral.
Actuals Projection AER Allowance Actual Trend
Figure 1: ICT operating expenditure step changes 2006 to 2014 ($ millions, nominal - rounding differences)

TRIM ID: D13/446348 For Official Use Only AER 2014-19 Technology Operating
Expenditure Plan Overview
Released: 29 May 2014 For Official Use Only Page: 17
2.4 Variations to allowance
During the 2009-14 period IC&T opex is forecast to exceed the allowance by $66 million. The main driver for this variance was the IC&T capital investment in major IC&T capital projects during 2007/08 and 2008/09 that significantly increased IC&T opex prior to the current 2009-14 regulatory period. This incremental opex tail associated with these key initiatives was not factored into the approved 2009-14 allowances by the AER.
The 2012/13 actual IC&T opex of $61.7 million will be used as the base year opex for the 2014-19 period. Details of the key variations to the AER 2006/07 base year allowance of $37.5 million are detailed below:
Base Year 2006/07 $37.5m
Incremental Opex Step Changes to 2008/09 + $15.3m
iAMS Program $4.5m Data Centre Consolidation Program $1.0m Outage Management Program $1.2m Field Computing Program $1.9m IT Critical Exposures Program $1.5m New Enterprise Licensing $1.3m Infrastructure Refresh Program $0.5m Operational Technology Program $1.6m Wage & CPI Increases $1.8m
Actual IC&T Opex 2008/09 $52.8m
Incremental Opex 2009/10 to 2012/13 +$17.9m
Labour CPI & adjustments $4.3m IT Capital Program Opex $8.6m OT Capital Program Opex $5.0m
Incremental Savings 2009/10 to 2012/13 ($9.0m)
IT Capex Program Savings ($3.0m) Data Centre Consolidation Program Savings ($1.8m) Outsourced Contract Negotiation Savings ($2.1m) Headcount & Discretionary Cost Savings ($2.1m)
Base Year Opex for next Regulatory Period 2012/13 $61.7m

TRIM ID: D13/446348 For Official Use Only AER 2014-19 Technology Operating
Expenditure Plan Overview
Released: 29 May 2014 For Official Use Only Page: 18
3. Base year opex for 2014-19 regulatory period
The 2012/13 actual IC&T opex will be used as the base year opex for the 2014-19 period.
3.1 Overview and approach
This section outlines the base year IC&T functional breakdown including the “customer view” of the outcomes and services offered by IC&T. This section is structured as follows:
• Base year 2012/13 opex by cost category; • Inclusion of support for OT systems within IC&T; • Business organisational restructure impacts; • ICT savings initiatives; • Opex outcomes by Business Function; • Changes in Cost Allocation Model (CAM) and Loss of Synergies (Retail TSA); and • NERP savings and efficiency programs
3.2 Base year 2012/13 opex
The 2012/13 actual IC&T opex (i.e. the fourth year of the previous regulatory control period) will be used as the base year opex or starting point for the 20014-19 period. The table below shows controllable IC&T expenditure.
3.2.1 Base year 2012/13 opex by cost category
The breakdown of IT opex cost in 2012/13 is as follows:
2012/13 Actual ($ million, nominal)
Cost Category OCIO OT Network LOB IC&T
IC&T controlled spend
Labour 10.4 3.1 13.5
Labour Hire 17.7 4.3 22
Contracted Services 1.6 0.7 2.3
Hardware Maint 1.5 1.1 2.6
Software Maint 10.4 2.4 12.8
Facilities Mgmt 5.2 0.3 5.5
Other IT -1.4 4.4 3
Total 45.4 16.3 61.7
Table 5: Base year 2012/13 opex by cost category ($ million, nominal)

TRIM ID: D13/446348 For Official Use Only AER 2014-19 Technology Operating
Expenditure Plan Overview
Released: 29 May 2014 For Official Use Only Page: 19
3.2.2 Inclusion of support for OT systems within IC&T
As a result of the Technology restructure at Ausgrid, IC&T expenditure now includes both Non- network IT and SCADA & Network Control charges. Specifically support for some Network only applications is encompassed within IC&T.
This includes the following applications:
• Physical Network Inventory (PNI); • Switching Request Register (SRR); • Pi Historian (PI); and • Ratings and Impedance Calculator (RIC).
3.2.3 Business organisational restructure impacts
Adjustments to the base year opex to account for changes in circumstances that will drive changes in opex in the forecast regulatory control period include an adjustment for the transfer of the Engineering Control Systems group to the Chief Engineer Division. Approximately $2 million in operating expenditure was moved as a result of an organisational restructure, made effective on 1 July 2013.
3.2.4 Base year 2012/13 opex outcomes by Business Function / Domain
Domain Applications Outcomes of IC&T opex
Asset Lifecycle Management
GIS, OMS, CAD/DMS, Sincal
Enable network design, capture of the physical location of an asset and its position in relation to other assets, outage identification and restoration, provide customer outage information to customer systems and provide public safety services with Dial Before You Dig services.
SAP Plant Maintenance/MAM/ Materials Management/ Investment Management and Project System Modules, DOPS/EMSOS Field Computing Tools
Enables enterprise asset management, providing an integrated view of asset technical, financial and physical information, procurement and tracking of materials, management of capital project investments. Support of devices used to access information in the field for use by district operators and the emergency service officers.
Works Management
Primavera and SAP MRS Module Enables planning and managing both construction and maintenance work, tracking the cost of each job (labour and materials), work scheduling and dispatching.
Asset Operations OT Application Support Telecommunications Management Support
Market Management
Metering Business System (MBS), ITRON IEE, Mobile Collection System (MCS) interface, MVRS including Handheld Devices, Meter Data Warehouse, nemSTAR
Enables Ausgrid to interact with other energy providers and the National Electricity Market in order to serve consumers, this includes meter data processing and energy pricing. Enables route management and scheduling in the collection of meter data, as well as, the validation and distribution of the data to market participants. Enables management of the metering equipment.
Customer Management
Genesys, NICE Call Recording, IVR, Avalanche
Enable Ausgrid to receive and direct customer calls to the appropriate call centre staff. These systems also record conversations and provide customers automated communications of outages.
SAP Customer Care System (CCS) Industry Solution for Utilities
Enable network billing and customer notification requests. This includes compliance for NECF.
Enterprise Management
SAP Finance and Controlling, SAP HR, ESS, MSS and CATS Modules, TM1, CHRIS
Enables finance and payroll capabilities. Enables HR capabilities in the management of employees which includes health and safety, payroll, recruitment, learning and development, retention, utilisation, performance management and retirement. The SAP licensing costs are included here.

TRIM ID: D13/446348 For Official Use Only AER 2014-19 Technology Operating
Expenditure Plan Overview
Released: 29 May 2014 For Official Use Only Page: 20
Domain Applications Outcomes of IC&T opex
SAP BI, SAP BPC, Business Objects, SAS
Enables decision making to monitor, manage and report on the status of the Network assets maintenance and corrective programs, allows interpretation and analysis of electrical load to assist with future demand and rates of growth, and provides regulatory reporting.
Property Management Information System (PMIS)
Enables the capture of all details relating to properties and easements, associated leases, licences for substation tenure, commercial leases for office accommodation, telecommunication towers, and service contracts. Provides the ability to track any job in relation to a specific property or easement. Enables calculation and recovery of revenues and expenses, as well as billing to tenants.
The WIRE, Lotus Notes Applications/Team Rooms, External Website, TRIM, MS SharePoint
Enables customers’ access to information via the external website. Enables document management, knowledge management and collaboration across the business.
IT Management
Solution Mgmt, Testing, Bus Process, Business Continuity
Enables business systems continuity and disaster recovery preparedness. This includes regression testing any changes and designing solutions that fit with the current application capabilities.
TIBCO, Oracle and SQL databases Enables communications and data transfer between applications and external service providers, such as, banks and market providers.
SAP Technical Environment, SAP Batch Processing & Application Security
Enables business to use the SAP applications, including performing automated batch processing and monitoring. Enables business users’ access to the suite of business applications.
Infrastructure & Telecommunications Service Management Support (Help Desk, Storage, Servers, Telephony, Mobile services)
Enables business support of work processes and access to applications via the help desk, facilities management and communications equipment.
2012/13 SUBTOTAL 61.7 million
Table 6: Base year 2012/13 opex outcomes by Business Function / Domain ($ million, nominal)
3.2.5 Change in Cost Allocation Methodology (CAM) and Loss of Synergies (Retail TSA)
As the base year actual opex must comply with the CAM applicable to the current period and the forecast opex must comply with the new approved CAM, an adjustment has been made to cater for the impact of complying with the new approved CAM, applicable 1 July 2014. Ausgrid will undergo significant organisational change as the design of current systems which internalise in-area retail-network transactions will have to be modified to externalise and route these transactions through the appropriate AEMO based market and B2B interfaces.
The long lead time required to achieve this future state has resulted in significant difficulty in forward planning for major systems upgrades. There is still a level of uncertainty regarding the final schedule for winding down the Transitional Services Arrangement (TSA) for the Purchaser of the EnergyAustralia Retail business. In addition, the timing of regulatory and broader industry decisions surrounding the common Metering framework that will apply to each operating company also complicates this imperative.
The following table quantifies the total value of the changes in the CAM and the loss of synergies from the divesture of the currently integrated and shared corporate systems and the decommissioning of the Retail only systems as at FY12/13. TSA wind down is currently scheduled for November 2014. The amount included within the submission has been prorated in 2014/15 and escalated in accordance with Ausgrid’s forecasting methodology.
Change in CAM and Loss of Synergies (FY12/13 actual $)
IC&T division Labour
Software Maint.
Facilities Mgmt
Hardware Maint.
Other NBC Total (Annualised)
Business Technology Services
2,692,144 2,001,778 859,214 $0 1,999,135 $7,552,271
IS $388,179 $158,947 $2,659 8,546 60,861 $619,192
OT Operations – – – – 485,958 $485,958
Total $3,080,324 $2,160,724 $861,873 $8,546 $2,545,953 $8,657,420

TRIM ID: D13/446348 For Official Use Only AER 2014-19 Technology Operating
Expenditure Plan Overview
Released: 29 May 2014 For Official Use Only Page: 21
Table 7: High level summary of Loss of Synergies assessment (FY12/13 actual $)
3.2.6 Productivity savings program – Efficiency initiatives
The network business has identified two key strategic initiatives to make labour intensive processes more productive and cost efficient through technology enablement. These initiatives result in additional IT and business opex which are to be offset by business benefits. These initiatives include:
• Distribution Monitoring & Control (DM&C) project – continuation of the rollout of pre-purchased DM&C devices to replace ageing equipment and for enhanced monitoring and control functionality; and
• Fieldforce Automation (FFA) program – implementation of fieldforce automation technology to achieve cost reductions in Ausgrid’s labour workforce and inventory stock management.
Note: these technology capex, incremental and one-off operating expenditure are included within the Technology Plan 2014-19 Opex forecast.
3.2.7 IC&T Benchmarking results
Using figures from the 2013 Utilities IT Benchmarking Survey facilitated by KPMG, Ausgrid’s IC&T operating expenditure for 2011/12 and 2012/13 appears to be efficient and trending below the industry average in the majority of all key performance metrics used for Distribution Network Service Providers (DNSP).
Ausgrid Mean Min. Max. Notes
Annual Non-network IT&C opex as percentage (%) of annual total opex
FY2012-13 11.88% 11.93% 4.59% 28.86% Sample size: 9 FY2011-12 10.76% 11.30% 5.50% 16.92% Sample size: 8
Annual Non-network IT&C opex per DNSP customer FY2012-13 $38 $44 $12 $74 Sample size: 9 FY2011-12 $41 $43 $14 $68 Sample size: 9
Annual Non-network IT&C Opex per DNSP employee FY2012-13 $11,086 $14,702 $4,884 $119,300 Sample size: 9 FY2011-12 $11,678 $13,226 $5,676 $114,720 Sample size: 8
Annual Non-network IT&C Opex per DNSP end user
FY2012-13 $9,648 $12,402 $6,661 $44,179 Sample size: 7 FY2011-12 $8,564 $7,010 $7,010 $18,198 Sample size: 6
Annual Non-network IT&C Opex per DNSP device FY2012-13 $7,814 $9,959 $3,351 $42,671 Sample size: 9 FY2011-12 $8,108 $9,381 $4,102 $18,763 Sample size: 8
Annual Non-network IT&C Totex (Opex and Capex) per DNSP customer FY2012-13 $55 $72 $42 $147 Sample size: 9 FY2011-12 $64 $79 $46 $118 Sample size: 8
Table 8: KPMG 2013Utilities IT benchmarking survey results
When reviewing the IC&T metrics and/or making comparisons (in particular to the minimum value) it is important to note that a number of the other DNSPs surveyed maintain completely separate Corporate and Operations telecommunications networks and network devices (i.e. dual routers, switches, firewalls, etc per site). According to the AER Expenditure Forecast Assessment Guidelines only shared communication link charges need be included in IC&T. Since there are no shared communication links between the standalone Corporate and Operations networks, expenditure relating to the Operations network has been excluded at these other DNSPs according to the guideline.
This is a key difference in the approach to telecommunications between Ausgrid, who has one shared network and the other DNSPs. Furthermore, it also rationalises how some of the reported minimum value scores are even possible, given telecommunications (in particular the Operations network more so than the Corporate network) is normally one of, if not the largest technology expenditure items.

TRIM ID: D13/446348 For Official Use Only AER 2014-19 Technology Operating
Expenditure Plan Overview
Released: 29 May 2014 For Official Use Only Page: 22
4. 2014-19 IC&T strategy Ausgrid’s IC&T operations appear to be efficient and trending below the industry average. The focus for the 2014-19 period is to meet new compliance obligations, maintain core functions, achieve further cost reductions and continue to increase productivity.
In the 2014-19 period Ausgrid is actively seeking to reduce price pressures faced by consumers, achieve cost reductions and pursue sustainable productivity improvements. We believe we have taken a prudent approach to balance both an efficient outcome of the objectives above, but also managing risk so as to ensure current levels of safety, security and reliability are maintained and not compromised.
Over the last decade, Ausgrid has invested in the renewal and consolidation of core IC&T systems underpinning its key business processes which resulted in significant efficiency gains. These gains need to be sustained which means that Ausgrid needs to continue to invest in the maintenance and upkeep of these systems. Every attempt has been made to “sweat the assets” and where possible defer capital has been pursued, i.e. upgrades will be considered only if the increased risk and cost of alternative support options are not in Ausgrid’s long-term interest and technology roadmap.
In addition there have been new strategic and efficiency opportunities identified, such as increased automation which could deliver a positive return on investment in less than 4 years that should be pursued. In particular, a tighter integration of field service activities with back-end operations and workforce scheduling have been identified as two key areas which could benefit from a redesign of the related business processes and the implementation of supporting mobility technology. The analysis for these programs is included in this section.
At a high level, it can be seen that the forecast for the period is consistent with the opex from the 2009-14 period.
Figure 2: Ausgrid IC&T operating expenditure 2008 – 13 ($000 nominal).
Key reasons for this trend is that whist we have successfully reduced operating expenditure in the Facilities Management category twice (in 2011/12 and 2012/13) through contract re-negotiation we have also pre-paid Telstra hardware maintenance services in advance during 2010-11.
$19.1 $12.7 $14.1 $13.5 $11.7
$17.1
$19.5 $22.8 $22.0 $22.9
$4.1
$4.5 $2.1 $2.3 $2.4
$2.0 $6.2 $3.6
$2.6 $2.7
$7.7 $8.5 $12.8
$12.8 $13.4
$6.8 $7.2
$6.4 $5.5 $5.7
8.7 5.2 5.8
3 3.2
$0
$10
$20
$30
$40
$50
$60
$70
Actual FY2009/10
Actual FY2010/11
Actual FY2011/12
Actual FY2012/13
Estimated FY2013/14
Labour Labour Hire Contracted Services Hardware Maint Software Maint Facilities Mgmt Other IT Expense

TRIM ID: D13/446348 For Official Use Only AER 2014-19 Technology Operating
Expenditure Plan Overview
Released: 29 May 2014 For Official Use Only Page: 23
Savings
Cost category FY09/10 FY10/11 FY11/12 FY12/13 Total
Labour - 0.6 - - $0.6 Software maintenance - 0.4 - 0.2 $0.6 Facilities Management 1.4 0.8 2.1 1.8 $6.1 Total $1.4 $1.8 $2.1 $2.0 $7.3
Table 9: Facilities management contract renegotiation savings ($ nominal)
Major IC&T capital programs such as (but not limited to) the Integrated Asset Management (iAMS) and the Data Centre Consolidation have been estimated to have delivered significant savings to the business over the 2009-14 regulatory period.
4.1 Key circumstances during 2014-19 period
Key circumstances and themes that impact the 2014-19 period forecast include:
• Implications of previous 2009-14 period performance; • Established robust technology platform; • Key focus on Continuous improvement and Efficiency for the 2014-19 period; and • Increased customer focus (i.e. NECF).
4.1.1 Implications of previous 2009-14 period performance
Based on the KPMG utilities benchmarking results available (refer to Section 3.2.7 Benchmarking), Ausgrid’s IC&T operations appear to be efficient and trending below the industry average.
4.1.2 Established robust technology platform
During the past few regulatory periods, Ausgrid has invested in the renewal and consolidation of core IC&T systems underpinning its key business processes. This has resulted in Ausgrid successfully establishing a robust technology platform that supports the delivery of quality, reliable and secure IC&T services as well as achieving significant efficiency gains.
4.1.3 Key focus on Continuous improvement and Efficiency for the 2014-19 period
The focus of the IC&T opex strategy for the 2014-19 regulatory period is to maintain compliance, maintain core IC&T platforms and capabilities that support network activities and continue to pursue strategic and efficient IC&T initiatives that do not increase the risk and/or cost profile of Ausgrid. Examples include:
IC&T savings – Review and optimisation of software licensing models; and IC&T savings – Service Delivery Model changes.
In each instance Ausgrid has sought to minimise price pressures to the full extent possible by investigating and assessing the prudency and efficiency of alternate options in either scope or delivery (including “Do Nothing”) of the forecast activity or investment in capital. This is further detailed in Section 5. Forecast Method.

TRIM ID: D13/446348 For Official Use Only AER 2014-19 Technology Operating
Expenditure Plan Overview
Released: 29 May 2014 For Official Use Only Page: 24
4.1.4 Increased customer focus (NECF obligations)
New national laws regulating the retailing and distribution of electricity and gas commenced on 1 July 2013. The new laws are called the National Energy Customer Framework (NECF) and moved the regulation of the sale and supply of energy from a state-based framework to national regulation.
All existing electricity and gas contracts will automatically transition to the new framework. Under the NECF regime, households will have greater protection and increased access to information about their energy use.
4.2 Key operational drivers and variables
Key operational drivers and variables that had an impact and shaped the proposed IC&T investment for the 14-19 period include:
• Meeting new and existing compliance obligations – For example, new National Energy Customer Framework (NECF) obligations will require investment in notification systems to ensure we meet new customer response times.
• Maintain core platforms and capabilities – Investment required to maintain the technical currency, scalability and capacity of existing IC&T systems and assets to provide for standard control services in a prudent and efficient manner reducing the risk of potential failure and/or unplanned production outages;
• Strategic and Efficiency initiatives – Identification and assessment of labour intensive processes that through IT enablement could be made more productive cost efficient. Examples include Mobility, Network Billing, Metering Efficiencies and Labour Time Management.
4.3 Technology Capital Expenditure Plan
As a result of these circumstances and drivers the following Technology Plan has been developed and aligned to AER Capital (NER 6.5.7(a)) and Operating (NER 6.5.6 (a)) expenditure objectives.
Asset Lifecycle Management
Asset Investment & Maintenance
Asset Planning
Asset Mapping
WorksManagement
Scheduling & Dispatch
Warehousing
Field Computing
Operate & Maintain
Monitor & Control
Reliability
National Electricity Market Interaction
Meter Data Processing
Energy Pricing
New Connections
Customer Interactions
Contact Centre
Safety
Human Resources
Financial & Procurement Mgmt
Enterprise Information Management
Service Delivery & Support
IT Security & Risk
SAP Core Maintenance
SAP Ratings SAP SD SAP CCS
SAP MRS
SAP MAM
SAP OH&S / EHS
SAP FI / CO
SAP BW / BI
SAP Business Objects
Servers Backup & Recovery Storage Archiving Security / Remote Access
Data Centre Devices Corporate Environment Voice and Video
Workplace Technology
Corporate Desktop SOE Email & Collaboration Devices
Infrastructure
Telco
6
7
DNMS and SCADA
Fieldforce Automation
8
9
SAP Solution Manager
SAP ProductivityPak
OSSData Centre 10G Growth
4
SAP HR
SAP Time Entry
SAP Asset Management
SAP IM / PS / PM
SAP iAMS
12
11
Com
plia
nce
Mai
ntai
n C
ore
Plat
form
s an
d C
apab
ilitie
sSt
rate
gic
&
Effic
ienc
y
NECF Obligations1
ICT Security
ICT Licensing Growth
3
2
GIS
TDMS
BALIN
AutoCAD
PNI
Dial Before You Dig
PRIMAVERA
CASS
TELCO BSS/OSS
Grid Analytics (ION)
Real-time Ratings
MBS
Market Systems
nemSTAR
IEE
Genesys
Avalanche
Webgraphs
Meter Data Warehouse
CHRIS
SAS
Websites
TM1
TRIM
ARIS
Policies & Procedures
HP Testing Tools
Switching Request Register
TIBCO
OMS
PNI (GIS)
Application Maintenance
MVRS
Payroll ATO Obligations
Metering
Mandatory Compliance
Data Centres
Enterprise InformationOMS & TelcoGIS SAP Middleware5
DM&C Rollout10
18
MSATS
AssetOperations
MarketManagement
CustomerManagement
EnterpriseManagement
ITManagement
Network Secondary Systems Platform
Figure 3: Technology Plan AER1419 Framework
TRIM ID: D13/446348 For Official Use Only AER 2014-19 Technology Operating
Expenditure Plan Overview
Released: 29 May 2014 For Official Use Only Page: 25
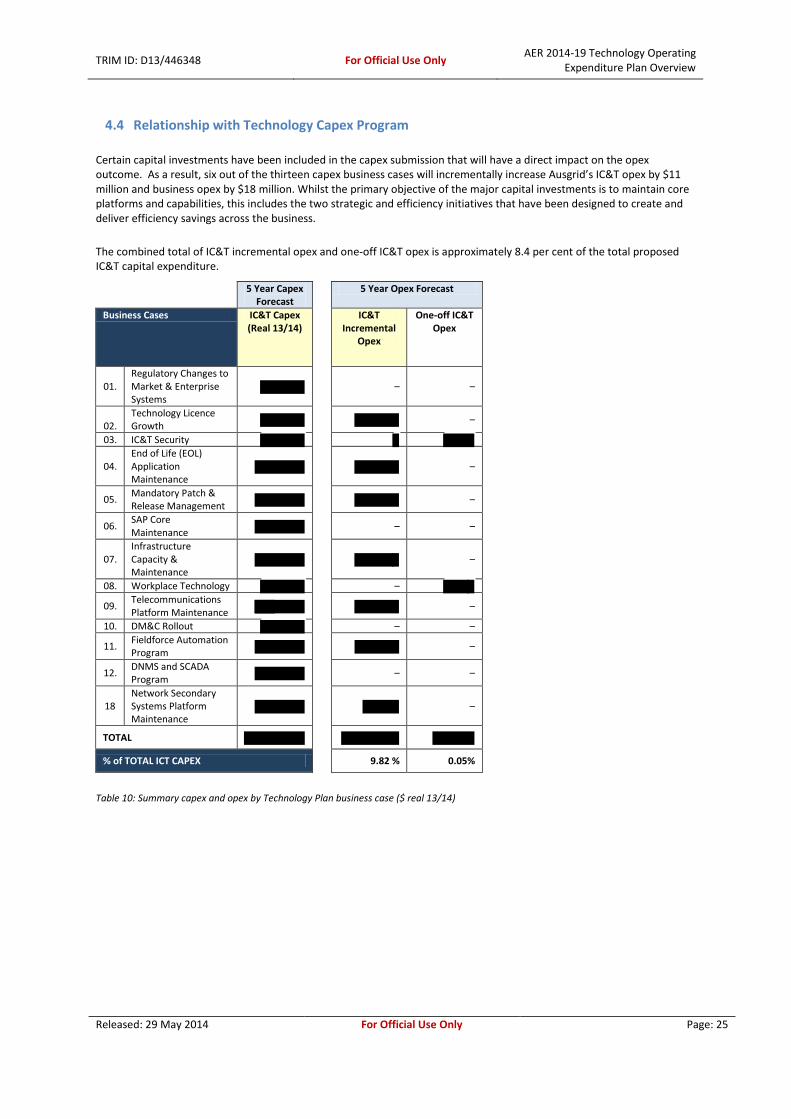
4.4 Relationship with Technology Capex Program
Certain capital investments have been included in the capex submission that will have a direct impact on the opex outcome. As a result, six out of the thirteen capex business cases will incrementally increase Ausgrid’s IC&T opex by $11 million and business opex by $18 million. Whilst the primary objective of the major capital investments is to maintain core platforms and capabilities, this includes the two strategic and efficiency initiatives that have been designed to create and deliver efficiency savings across the business.
The combined total of IC&T incremental opex and one-off IC&T opex is approximately 8.4 per cent of the total proposed IC&T capital expenditure.
5 Year Capex Forecast
5 Year Opex Forecast
Business Cases IC&T Capex (Real 13/14)
IC&T Incremental
Opex
One-off IC&T Opex
01. Regulatory Changes to Market & Enterprise Systems
– –
02.
Technology Licence Growth
–
03. IC&T Security
04. End of Life (EOL) Application Maintenance
–
05. Mandatory Patch & Release Management
–
06. SAP Core Maintenance
– –
07. Infrastructure Capacity & Maintenance
–
08. Workplace Technology –
09. Telecommunications Platform Maintenance
–
10. DM&C Rollout – –
11. Fieldforce Automation Program
–
12. DNMS and SCADA Program
– –
18 Network Secondary Systems Platform Maintenance
–
TOTAL
% of TOTAL ICT CAPEX 9.82 % 0.05%
Table 10: Summary capex and opex by Technology Plan business case ($ real 13/14)

TRIM ID: D13/446348 For Official Use Only AER 2014-19 Technology Operating Expenditure Plan Overview
Released: 29 May 2014 For Official Use Only Page: 26
4.5 Expenditure outcomes
Outlined below is all incremental and one-off operating expenditure which will be incurred, but has not been included in the base year.
4.5.1 Recurrent and Non-recurrent IC&T opex by Division and Cost Category
Recurrent IC&T
IC&T incremental opex constitutes 72 per cent of all incremental opex within Ausgrid’s proposed Technology Plan. From the table below we can observe that the majority of IC&T incremental opex relates to cost categories:
• Software – $12.3 million for licence maintenance and support; • Labour – $3.7 million for additional FTEs to support new applications and module of SAP; and • Contracted Services – $2.6 million in Facilities Management services required to host additional servers to meet future capacity and growth. This covers both existing and new
applications in business case: o 04. End of Life (EOL) Application Maintenance; and o 07. Infrastructure Capacity & Maintenance.
5 Year Incremental Opex 5 Year Non-recurrent Opex
COST CATEGORY
DIVISION
Hardware maint.
Software Contracted Services (FM)
Labour TOTAL Labour TOTAL Explanatory comment
IC&T • Additional UXC third party support during rollout • Training delivery and change management
Chief Engineer – Network Development – – – – – • Training delivery and change management Network Operations – – – – – • Training delivery and change management All – – – – – • Training delivery and change management TOTAL
Table 11: Recurrent and non-recurrent opex summary ($ real 13/14)
Note: * The $20.4 million IC&T opex is inclusive of $2.5 million of SCADA & Network Control costs.

TRIM ID: D13/446348 For Official Use Only AER 2014-19 Technology Operating Expenditure Plan Overview
Released: 29 May 2014 For Official Use Only Page: 27
Non-recurrent IC&T
From the table above we can observe that the non-recurrent IC&T opex relates only to the Labour cost category. This allocation includes:
• $54,522 for training delivery and change management during IC&T Security program (Business Case 3. IC&T Security); and • $53,621 for additional third party UXC support during Workplace Technology (Business Case 8. Workplace Technology) upgrade.
Refer also to Section 4.6 Step changes between periods for further information and analysis by individual business case.
4.5.2 Non-network IC&T Recurrent and Non-recurrent Opex split by NER objectives/drivers
A full breakdown of Non-network recurrent and non-recurrent IC&T by NER objective and cost categories is provided below.
5 Year Incremental Opex 5 Year Non-recurrent Opex
NER objective / driver with underlying Business Cases
Hardware maint.
Software Contracted Services
(FM)
Labour IC&T Incremental Opex Total
IC&T Labour
One-off IC&T Opex Total
Comment
1. Meet or manage the expected demand for standard control services over the 14-19 period
$0 $0 $0 $0 $0
02. Technology Licence Growth 2. Comply with all applicable regulatory obligations or requirements associated with the provision of standard control services.
$0 $0 $0 $0 $0 $0 $0
01. Regulatory Changes to Market & Enterprise Systems – – – – – – – 3. Maintain the quality, reliability and the security of the distribution system and/or the supply of standard control services
$0
03. IC&T Security – – – – – • Training delivery and change management
04. End of Life (EOL) Application Maintenance – – – –
05. Mandatory Patch & Release Management – – – – –
06. SAP Core Maintenance – – – – – – –
07. Infrastructure Capacity & Maintenance – – – –
08. Workplace Technology – – – – – • Additional UXC support during rollout
09. Telecommunications Platform Maintenance – – – – 4. Strategic and Efficiency Initiatives 11. Fieldforce Automation Program – – Total
Table 12: Breakdown of IT & Communications non-network recurrent and non-recurrent ($ real 13/14)

TRIM ID: D13/446348 For Official Use Only AER 2014-19 Technology Operating Expenditure Plan Overview
Released: 29 May 2014 For Official Use Only Page: 28
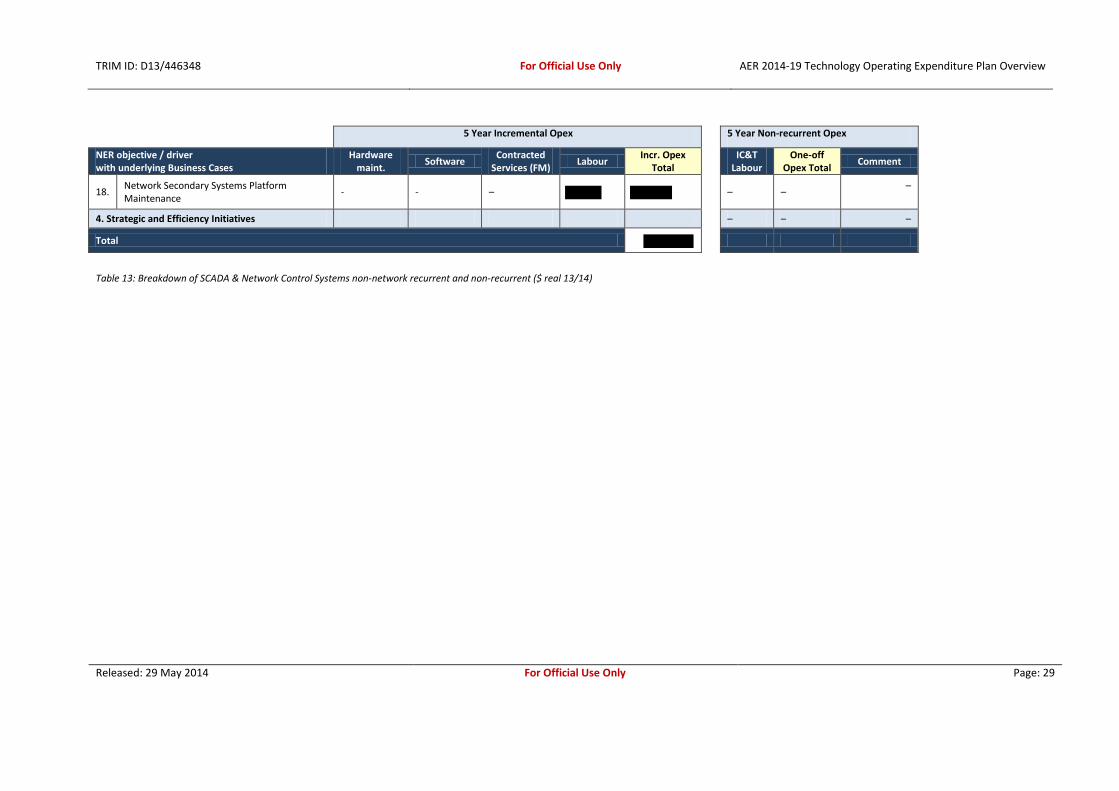
4.5.3 SCADA & Network Control Systems Recurrent and Non-recurrent Opex split by NER objectives/drivers
SCADA & Network Control systems recurrent IC&T opex
From the table below we can see that the majority of SCADA & Network Control incremental opex relates to cost categories:
• Software – $1.3 million for licence maintenance and support costs (Business Case 02. Technology Licence Growth, Business Case 04. EOL Application Maintenance, Business Case 09. Telecommunications Platform Maintenance and Business Case 18. Network Secondary Systems Platform Maintenance);
• Hardware Maintenance – $0.6 million for maintenance and support for new 10Gb ports, DNMS / SCADA; • Labour – $0.4 million for support for Network Secondary Systems Platform Maintenance; and • Contracted Services – $0.2 million in facilities management services required to host additional servers to meet future capacity and growth (Business Case 04. EOL Application
Maintenance).
Refer also to Section 4.7 Inclusions of SCADA & Network Control Systems application support for further information and analysis.
SCADA & Network Control systems non-recurrent (one-off) opex
There is no SCADA & Network Control non-recurrent opex required. A full breakdown of SCADA & Network Control recurrent and non-recurrent expenditure by NER objective and cost category is provided below.
5 Year Incremental Opex 5 Year Non-recurrent Opex
NER objective / driver with underlying Business Cases
Hardware maint.
Software Contracted
Services (FM) Labour
Incr. Opex Total
IC&T
Labour One-off
Opex Total Comment
1. Meet or manage the expected demand for standard control services over the 14-19 period
$0 $0 $0 – – –
02. Technology Licence Growth – – – – – –
3. Maintain the quality, reliability and the security of the distribution system and/or the supply of standard control services
– – –
04. End of Life (EOL) Application Maintenance – – – –
05. Mandatory Patch & Release Management – – – – – – – –
07. Infrastructure Capacity & Maintenance – – – – – – – –
09. Telecommunications Platform Maintenance – – – – –
TRIM ID: D13/446348 For Official Use Only AER 2014-19 Technology Operating Expenditure Plan Overview
Released: 29 May 2014 For Official Use Only Page: 29
5 Year Incremental Opex 5 Year Non-recurrent Opex
NER objective / driver with underlying Business Cases
Hardware maint.
Software Contracted
Services (FM) Labour
Incr. Opex Total
IC&T
Labour One-off
Opex Total Comment
18. Network Secondary Systems Platform Maintenance
- - – – – –
4. Strategic and Efficiency Initiatives – – –
Total
Table 13: Breakdown of SCADA & Network Control Systems non-network recurrent and non-recurrent ($ real 13/14)

TRIM ID: D13/446348 For Official Use Only AER 2014-19 Technology Operating
Expenditure Plan Overview
Released: 29 May 2014 For Official Use Only Page: 30
4.6 Step changes between periods (if applicable)
The total opex expenditure for the 2014-19 regulatory period was forecast by summing all operating expenditure captured from the preferred options. During this period, a small number of step changes have been incorporated into the IC&T opex forecast. This has resulted in a total incremental IC&T opex of $18 million and potential savings of $45 million to be realised across the business. A bottom up approach has been adopted in calculating the incremental costs and benefits. All items were reviewed to:
• Ensure the operating expenditure had not been included in the efficiency base year; • Determine if incremental labour requirements could be catered for through productivity measures. This review
resulted in a reduction of the labour component of the incremental opex request; • Ensure all facilities management (FM) costs reflect recent FM reductions achieved through contract renegotiations
with Ausgrid vendors; • Ensure vendor software maintenance costs were not estimated but based on vendor quotes; • Validate incremental license costs were driven by network growth; and • Validate if incremental opex could be offset by efficiency benefits.
Our total forecast opex analysis has identified the overlaps which will occur between operational activities and capital investment programs. For each of these step changes the following assessment criteria have been applied and supporting evidence outlined. The step change criteria were derived from the Better Regulation: Expenditure Forecast Assessment Guidelines for Electricity Distribution released by the AER in November 2013. These include (but are not limited to) whether the:
• Proposed step change is a result of a new “binding” (i.e. uncontrollable) change in regulatory obligations; • Option selected is efficient and appropriate steps have been taken to minimise the cost of compliance (where
applicable) from the time the event was foreseeable; • The costs associated with making the step change are efficient; • Efficient forecasts have been developed using “revealed costs” (i.e. past actuals) as the starting point; • Incremental costs can be met from existing regulatory allowances or from other elements of the expenditure
forecasts; and • Proposed works can be realistically achieved within the regulatory period.
4.6.1 IC&T Opex step change to meet or manage expected demand
02. Technology Licence Growth
Relevant NER operating expenditure objective and Binding change (where applicable):
Mapping to the relevant “Operating expenditure objective(s)” (Chapter 6, National Electricity Rules)
The forecasted capital expenditure is considered necessary to achieve:
6.5.6(a)(1) meet or manage the expected demand
for standard control services over that period;
• The proposed expenditure seeks to meet or manage expected growth and demand in the number of connections.
• CCS, OMS, GIS, IEE and PI Historian support a number of mission and business critical processes relating to customer, customer connection, revenue, and market or network management. CCS, OMS and GIS are integral to Ausgrid’s NECF compliance and workforce/public safety obligation. IEE is critical to ensure Ausgrid can meet its market and licence compliance obligations.
There is no new “binding” (i.e. uncontrollable) change in obligations that would affect Ausgrid’s efficient forecasting of operating expenditure. The proposed expenditure, however, seeks to meet or manage expected demand, for standard control services (i.e. growth in the number of connections).
TRIM ID: D13/446348 For Official Use Only AER 2014-19 Technology Operating
Expenditure Plan Overview
Released: 29 May 2014 For Official Use Only Page: 31
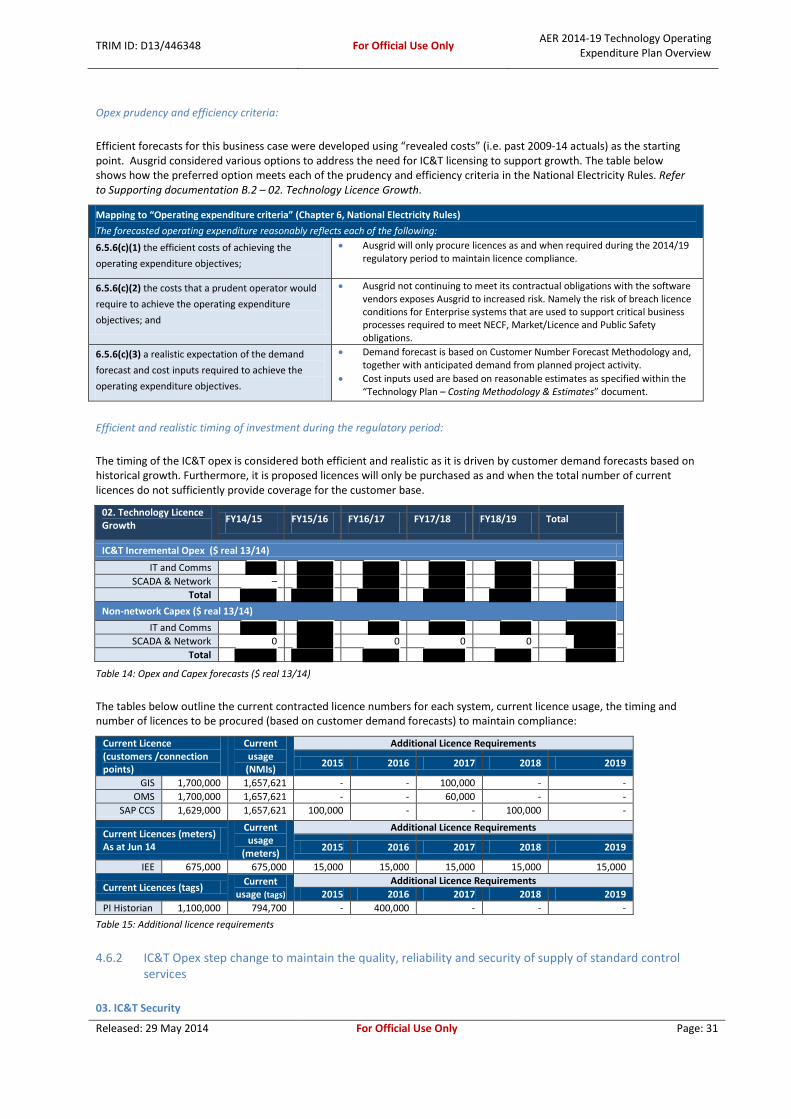
Opex prudency and efficiency criteria:
Efficient forecasts for this business case were developed using “revealed costs” (i.e. past 2009-14 actuals) as the starting point. Ausgrid considered various options to address the need for IC&T licensing to support growth. The table below shows how the preferred option meets each of the prudency and efficiency criteria in the National Electricity Rules. Refer to Supporting documentation B.2 – 02. Technology Licence Growth.
Mapping to “Operating expenditure criteria” (Chapter 6, National Electricity Rules)
The forecasted operating expenditure reasonably reflects each of the following:
6.5.6(c)(1) the efficient costs of achieving the
operating expenditure objectives;
• Ausgrid will only procure licences as and when required during the 2014/19 regulatory period to maintain licence compliance.
6.5.6(c)(2) the costs that a prudent operator would
require to achieve the operating expenditure
objectives; and
• Ausgrid not continuing to meet its contractual obligations with the software vendors exposes Ausgrid to increased risk. Namely the risk of breach licence conditions for Enterprise systems that are used to support critical business processes required to meet NECF, Market/Licence and Public Safety obligations.
6.5.6(c)(3) a realistic expectation of the demand
forecast and cost inputs required to achieve the
operating expenditure objectives.
• Demand forecast is based on Customer Number Forecast Methodology and, together with anticipated demand from planned project activity.
• Cost inputs used are based on reasonable estimates as specified within the “Technology Plan – Costing Methodology & Estimates” document.
Efficient and realistic timing of investment during the regulatory period:
The timing of the IC&T opex is considered both efficient and realistic as it is driven by customer demand forecasts based on historical growth. Furthermore, it is proposed licences will only be purchased as and when the total number of current licences do not sufficiently provide coverage for the customer base.
02. Technology Licence Growth
FY14/15 FY15/16 FY16/17 FY17/18 FY18/19 Total
IC&T Incremental Opex ($ real 13/14)
IT and Comms SCADA & Network –
Total
Non-network Capex ($ real 13/14)
IT and Comms SCADA & Network 0 0 0 0
Total
Table 14: Opex and Capex forecasts ($ real 13/14)
The tables below outline the current contracted licence numbers for each system, current licence usage, the timing and number of licences to be procured (based on customer demand forecasts) to maintain compliance:
Current Licence (customers /connection points)
Current usage (NMIs)
Additional Licence Requirements
2015 2016 2017 2018 2019
GIS 1,700,000 1,657,621 - - 100,000 - - OMS 1,700,000 1,657,621 - - 60,000 - -
SAP CCS 1,629,000 1,657,621 100,000 - - 100,000 -
Current Licences (meters) As at Jun 14
Current usage
(meters)
Additional Licence Requirements
2015 2016 2017 2018 2019
IEE 675,000 675,000 15,000 15,000 15,000 15,000 15,000
Current Licences (tags) Current
usage (tags) Additional Licence Requirements
2015 2016 2017 2018 2019 PI Historian 1,100,000 794,700 - 400,000 - - -
Table 15: Additional licence requirements
4.6.2 IC&T Opex step change to maintain the quality, reliability and security of supply of standard control services
03. IC&T Security

TRIM ID: D13/446348 For Official Use Only AER 2014-19 Technology Operating
Expenditure Plan Overview
Released: 29 May 2014 For Official Use Only Page: 32
Relevant NER operating expenditure objective and Binding change (where applicable):
Mapping to the relevant “Operating expenditure objective(s)” (Chapter 6, National Electricity Rules)
The forecasted operating expenditure is considered necessary to achieve:
6.5.6(a)(3) to the relevant extent:
(iii) maintain the quality, reliability and security of
supply of standard control services; and
(iv) maintain the reliability and security of the
distribution system through the supply of standard
control services;
• The proposed expenditure seeks to establish two security initiatives that are crucial in assisting to safeguard Ausgrid’s information assets and data including customer records and business plans.
• A “Do Nothing” approach will maintain the current situation and increase opex costs through the correlation of security events using manual processes. The currently deployed solutions also are limited in their scale, features and functionalities to support and cater for the projects Ausgrid has in the pipeline including Fieldforce Automation and DNMS remediation.
6.5.6(a)(2) comply with all applicable regulatory
obligations or requirements associated with the
provision of standard control services
• These initiatives will allow Ausgrid to maintain its compliance with relevant Australian and New South Wales governments’ regulatory and legislative requirements in a most cost effective manner.
Opex prudency and efficiency criteria:
Ausgrid considered various options to address the need to maintain the quality, reliability and IC&T security of services supporting mission and business critical systems and processes. The table below shows how the preferred option meets each of the opex prudency and efficiency criteria in the National Electricity Rules. Refer also to Supporting documentation B.3 – 03. IC&T Security.
Mapping to “Operating expenditure criteria” (Chapter 6, National Electricity Rules)
The forecasted operating expenditure reasonably reflects each of the following:
6.5.6(c)(1) the efficient costs of achieving the
operating expenditure objectives;
• The current practice of having different solutions managed by different groups not only has a higher Total Cost of Ownership (TCO) but has also led to deployment of solutions with varying levels of security and assurance.
• By consolidating these processes using proven technologies, Ausgrid will strengthen the current practices and ensure that they are implemented in a cost effective manner and operating consistently across the organisation.
6.5.6(c)(2) the costs that a prudent operator would
require to achieve the operating expenditure
objectives; and
• By not replacing the legacy solutions with a centralised PKI and Security Information and Event Management (SIEM) deployment, Ausgrid will be exposed to the risk of insecure practices, increasing operational expenditure and inefficient processes required to manage the multiple point security solutions. This could lead to possible data breaches, fines and penalties.
6.5.6(c)(3) a realistic expectation of the demand
forecast and cost inputs required to achieve the
operating expenditure objectives.
• Cost inputs used are based on reasonable estimates as specified within the Supporting documentation C – Technology Plan - Costing Methodology & Estimates.
Efficient and realistic timing of investment during the regulatory period:
The proposed timing for this small “one-off” opex (i.e. there is no IC&T incremental opex) investment in 2015/16 is considered “efficient” as it is scheduled in the early years of the 2014-19 regulatory period so as to reduce the ongoing IC&T opex requirements as soon as possible. To “Do Nothing” and maintain current operations and manual processes will lead to inefficiencies, including increased opex expenditure and effort to keep pace with the growing network traffic and potential for increased security incidents and events.
We consider this initiative can be completed over the 2014-19 regulatory period. The timing and effort required to deliver this project is realistic as it has been based on a bottom-up, building block approach using “revealed” costs (past 2009-14 actuals). Please refer to Section 5 Forecast method, Supporting documentation C – Technology Plan - Costing Methodology & Estimates.

TRIM ID: D13/446348 For Official Use Only AER 2014-19 Technology Operating
Expenditure Plan Overview
Released: 29 May 2014 For Official Use Only Page: 33
03. IC&T Security FY14/15 FY15/16 FY16/17 FY17/18 FY18/19 Total
Non-network Incremental Opex ($ real 13/14)
IT and Comms – – – – – – SCADA & Network – – – – – –
Total – – – – – – Non-network non-recurrent Opex ($ real 13/14)
IT and Comms – – – – SCADA & Network – – – – – –
Total – – – – Non-network Capex ($ real 13/14)
IT and Comms – – – SCADA & Network – – – – – –
Total – – –
Table 16: Opex and Capex forecasts ($ real 13/14)
Refer to Supporting documentation B.3 – 03.IC&T Security Business Case for further information on the consideration and assessment of alternate options and their efficient costing.
We consider the projects can be effectively completed over the 2014-19 regulatory period. The timing and effort required to deliver the projects is realistic as it has been based on a bottom-up, building block approach using “revealed” costs (past 2009-14 actuals). Please refer to Section 5 Forecast method, Supporting documentation C – Technology Plan - Costing Methodology & Estimates.
04. End of Life (EOL) Application Maintenance
Relevant NER operating expenditure objective and Binding change (where applicable):
Mapping to the relevant “Operating expenditure objective(s)” (Chapter 6, National Electricity Rules)
The forecasted operating expenditure is considered necessary to achieve:
6.5.6(a)(3) to the relevant extent:
(iii) maintain the quality, reliability and security of
supply of standard control services; and
(iv) maintain the reliability and security of the
distribution system through the supply of standard
control services;
An End of Life Applications maintenance program of work has been established to
apply application upgrades to Mission Critical, Business Critical and Business
Important rated IT applications to ensure they continue to be vendor supported
and their technical currency is maintained reducing the risk of potential failure
and/or unplanned production outages. This is in-line with the operating
expenditure objective 6.5.6 (a)(3) to ensure:
• Quality, reliability and security of IT systems and services; • Stability of IT systems; • Continuation of IT vendor support; and • Compliance of IT systems.
6.5.7(a)(4) maintain the safety of the distribution
system through the supply of standard control
services. (Secondary objective)
The proposed expenditure seeks to maintain End of Life IT applications (i.e.
Mission Critical, Business Critical and Business Important rated) that support the
monitoring and safety of the distribution system and reduce the risk of potential
failure and/or unplanned production outages. This is in-line with the capital
expenditure objective 6.5.7 (a)(4).
Opex prudency and efficiency criteria:
Ausgrid considered various options to address the need to maintain the quality, reliability and security of applications supporting mission and business critical systems and processes. Efficient forecasts for application upgrades were developed using “revealed costs” (i.e. past 2009-14 actuals) as the starting point. The table below shows how the preferred option meets each of the opex prudency and efficiency criteria in the National Electricity Rules. Refer also to Supporting documentation B.4 – 04. End of Life (EOL) Application Maintenance.
Mapping to “Operating expenditure criteria” (Chapter 6, National Electricity Rules)
The forecasted operating expenditure reasonably reflects each of the following:
6.5.6(c)(1) the efficient costs of achieving the
operating expenditure objectives;
Ausgrid has considered numerous options and undertaken analysis, where the
project was selected on the basis of:

TRIM ID: D13/446348 For Official Use Only AER 2014-19 Technology Operating
Expenditure Plan Overview
Released: 29 May 2014 For Official Use Only Page: 34
Mapping to “Operating expenditure criteria” (Chapter 6, National Electricity Rules)
The forecasted operating expenditure reasonably reflects each of the following: • Being the only option to address the risks associated with the failure to
upgrade (Do Nothing) mission and business critical IT applications; • Achieving a significant level of risk reduction as determined by the risk
mitigation analysis; • Allowing Ausgrid to: o Maintain the existing availability of IT services; o Maintain integrity of IT services; and o Comply with regulatory obligations or requirements.
6.5.6(c)(2) the costs that a prudent operator would
require to achieve the operating expenditure
objectives; and
The operating expenditure is necessary in order to maintain the integrity of
services by ensuring:
• Stability and continuation of IT vendor support; • Security and integrity of business information; • Quality and reliability of IT systems; and • Compliance of IT systems.
If EOL application upgrades are not implemented this exposes Ausgrid to an
increased operational risk and could potentially result in the failure to meet the
obligations under the operating expenditure objective 6.5.6 (a)(3).
6.5.6(c)(3) a realistic expectation of the demand
forecast and cost inputs required to achieve the
operating expenditure objectives.
• Cost inputs used are based on reasonable estimates as specified within Supporting documentation C – Technology Plan - Costing Methodology & Estimates.
Efficient and realistic timing of investment during the regulatory period:
Based on the total IC&T capex investment figure of $36.5m, the total IC&T incremental opex constitutes only 9.3 per cent, of which IT and Comms accounts for 6.8 per cent and SCADA & Network control 2.5 per cent. The proposed timing of IC&T opex investment is considered “efficient” as upgrades have been delayed until the period just prior to the date when vendor support ceases for an application.
To “Do Nothing” would lead to increased software maintenance and support expenditure (i.e. premium priced Extended and Sustaining support where provided) and increased operational risk if the application became unsupported. However, in certain instances where practical, Ausgrid has taken “efficient timing” of investment a step further where additional savings can be achieved without increasing the overall risk and cost profile. Specific examples of this include:
• Oracle Upgrade – Ausgrid has made a conscious decision to allow the Oracle platform to go into Extended support mode (i.e. next level of support available when Standard support ends). Whilst this may result in Ausgrid incurring incremental opex for Extended support in the short term, it does eliminate the requirement to upgrade the Oracle platform twice during the 2014-19 regulatory period and thus defers capital investment and overall achieves a more efficient outcome.
• SAS BI 9.2, SAS Miner 9.2 and SAS PC 9.1 Upgrades – Ausgrid continuing to operate elements of the SAS platform with reduced support (i.e. on September 30 2013, the vendor reduced support for SAS BI 9.2, Miner 9.2 to Level B and Level C for SAS PC 9.1) in the short term and defer investment until 2015/16 and 2018/19 when two major product upgrades are anticipated in line with the vendor’s roadmap.
04. End of Life (EOL) Application Maintenance
FY14/15 FY15/16 FY16/17 FY17/18 FY18/19 Total
Non-network Incremental Opex ($ real 13/14)
IT and Comms SCADA & Network -
Total Non-network Capex ($ real 13/14)
IT and Comms SCADA & Network
Total
Table 17: Opex and Capex forecasts ($ real 13/14)

TRIM ID: D13/446348 For Official Use Only AER 2014-19 Technology Operating
Expenditure Plan Overview
Released: 29 May 2014 For Official Use Only Page: 35
Refer to Supporting documentation B.4 – 04. End of Life (EOL) Application Maintenance Business Case for further information on the consideration and assessment of alternate options and their efficient costing.
We consider these activities can be effectively completed over the 2014-19 regulatory period. The timing and effort required to deliver the projects is realistic as it has been based on a bottom-up, building block approach using “revealed” costs (past 2009-14 actuals). Please refer to Section 5 Forecast method, Supporting documentation C – Technology Plan - Costing Methodology & Estimates.
Resulting benefit:
Opex investment in End of Life (EOL) Application Maintenance will enable the delivery of:
• Benefits equivalent to 96 per cent of the total (Business + IC&T) opex, i.e. savings completely offset the recurrent and non-recurrent opex;
• $1,448,361 in benefits to IC&T; and • $358,233 in benefits to the business.
Refer to Section 4.10 Benefits for further details.
05. Mandatory Patch & Release Management
Relevant NER operating expenditure objective and Binding change (where applicable):
Mapping to the relevant “Operating expenditure objective(s)” (Chapter 6, National Electricity Rules)
The forecasted operating expenditure is considered necessary to achieve:
6.5.6(a)(2) comply with all applicable regulatory
obligations or requirements associated with the
provision of standard control services
The proposed expenditure seeks to implement mandatory patches and
releases to Ausgrid systems in response to regulatory requirements and
statutory reporting changes so that Ausgrid (as a market participant) can
maintain regulatory compliance such as, AEMO, NEM, NECF, ATO, NER, NSW
Treasury and continuity in daily business operations.
6.5.6(a)(3) to the relevant extent:
(iii) maintain the quality, reliability and security of supply
of standard control services; and
(iv) maintain the reliability and security of the
distribution system through the supply of standard
control services;
The proposed expenditure also seeks to implement business changes that
impact Ausgrid systems such as, organisational restructure; Networks NSW
requirements so that Ausgrid can continue to meet the changing business
needs and maintain continuity in daily business operations.
6.5.7(a)(4) maintain the safety of the distribution system
through the supply of standard control services.
The proposed expenditure seeks to implement mandatory patches and
releases to Ausgrid systems in order to maintain safety in daily business
operations and compliance with relevant external Safety agencies.
Whilst not a new obligation, The proposed expenditure based on seeks to implement mandatory patches and releases to Ausgrid systems in response to regulatory requirements and statutory reporting changes so that Ausgrid (as a market participant) can maintain regulatory compliance such as, AEMO, NEM, NECF, ATO, NER, NSW Treasury and continuity in daily business operations.
Opex prudency and efficiency criteria:
Efficient forecasts for this business case were developed using “revealed costs” (i.e. past 2009-14 actuals) as the starting point. Further, Ausgrid considered various options to address the need to perform Mandatory Patch & Release Management to maintain the quality, reliability and security of applications supporting mission and business critical systems and processes. The table below shows how the preferred option meets each of the opex prudency and efficiency criteria in the National Electricity Rules:
Mapping to “Operating expenditure criteria” (Chapter 6, National Electricity Rules)
The forecasted operating expenditure reasonably reflects each of the following:
6.5.6(c)(1) the efficient costs of achieving the
operating expenditure objectives;
• By performing regulatory and statutory compliance activities as and when they are required.

TRIM ID: D13/446348 For Official Use Only AER 2014-19 Technology Operating
Expenditure Plan Overview
Released: 29 May 2014 For Official Use Only Page: 36
Mapping to “Operating expenditure criteria” (Chapter 6, National Electricity Rules)
The forecasted operating expenditure reasonably reflects each of the following:
6.5.6(c)(2) the costs that a prudent operator would
require to achieve the operating expenditure
objectives; and
• Maintaining regulatory and statutory compliance and continuity in daily business operations enables Ausgrid to fulfil its operating expenditure objective under 6.5.6(a)(2) and (3).
6.5.6(c)(3) a realistic expectation of the demand
forecast and cost inputs required to achieve the
operating expenditure objectives.
• Demand forecast is based on historic cost / volume of change from the previous regulatory period (AER 2009-14).
• Cost inputs used are based on reasonable estimates as specified within Supporting documentation C – Technology Plan - Costing Methodology & Estimates.
Efficient and realistic timing of investment during the regulatory period:
The proposed timing of necessary IC&T opex expenditure for Mandatory Patch & Release Management is consider efficient as it is driven by regulatory and statutory compliance activities. These will only be scheduled and performed as and when they are required.
05. Mandatory Patch & Release Mgmt
FY14/15 FY15/16 FY16/17 FY17/18 FY18/19 Total
Non-network Incremental Opex ($ real 13/14)
IT and Comms
-
SCADA & Network
– – – – – $0
Total $0
Non-network Capex ($ real 13/14)
IT and Comms
SCADA & Network
Total
Table 18: Opex and Capex forecasts ($ real 13/14)
Refer to Supporting documentation B.5 – 05.Mandatory Patch & Release Management Business Case for further information on the consideration and assessment of alternate options and their efficient costing.
We consider these activities can be completed over the 2014-19 regulatory period. The timing and effort required to deliver these activities is realistic as it has been based on a bottom-up, building block approach using “revealed” costs (past 2009-14 actuals). Please refer to Section 5 Forecast method, Supporting documentation C – Technology Plan - Costing Methodology & Estimates.
07. Infrastructure Capacity & Maintenance
Relevant NER operating expenditure objective and Binding change (where applicable):
Mapping to the relevant “Operating expenditure objective(s)” (Chapter 6, National Electricity Rules)
The forecasted operating expenditure is considered necessary to achieve:
6.5.6(a)(3) to the relevant extent:
(iii) maintain the quality, reliability and security of
supply of standard control services; and
(iv) maintain the reliability and security of the
distribution system through the supply of standard
control services;
The proposed expenditure seeks to refresh ageing critical IT infrastructure assets
underpinning the key business applications which support the critical business
processes in order to maintain the quality and reliability of supply of standard
control services.

TRIM ID: D13/446348 For Official Use Only AER 2014-19 Technology Operating
Expenditure Plan Overview
Released: 29 May 2014 For Official Use Only Page: 37
6.5.6(a)(2) comply with all applicable regulatory
obligations or requirements associated with the
provision of standard control services
The increase in application data stored increases the need to adequately retain
digital records. Some expenditure is directed at maintaining the data backup
infrastructure to stay compliant with relevant regulations on document retention
(such as State Records Act 1988 (NSW)).
Opex prudency and efficiency criteria:
Ausgrid considered various options to address the need to maintain the quality, reliability and security of infrastructure supporting mission and business critical systems and processes. Efficient forecasts for infrastructure and capacity upgrades were developed using “revealed costs” (i.e. past 2009-14 actuals) as the starting point. The table below shows how the preferred option meets each of the opex prudency and efficiency criteria in the National Electricity Rules:
Mapping to “Operating expenditure criteria” (Chapter 6, National Electricity Rules)
The forecasted operating expenditure reasonably reflects each of the following:
6.5.6(c)(1) the efficient costs of achieving the
operating expenditure objectives;
• Refreshing only the critical end of life IT infrastructure. Otherwise vendor support for ageing IT infrastructure would result in incremental operating expenditure.
• Deferring replacement of IT infrastructure, where vendor support of ageing infrastructure does not result in an increase to operating expenditure, and consolidating server purchases to obtain economies of scale.
• Purchasing more cost effective technology to meet forecasted demand rather than continuing to upgrade the enterprise class technology (“top of the range”), which previously met the requirements of the business, but now given technological advancements would cater well beyond Ausgrid’s forecasted demand.
• Implementing proven technologies to manage business demand, such as implement storage optimisation technologies to reduce the storage capacity requirements.
6.5.6(c)(2) the costs that a prudent operator would
require to achieve the operating expenditure
objectives; and
• By not maintaining the existing IT infrastructure supporting critical business processes this exposes Ausgrid to unacceptable levels of risk to its business operations, potentially resulting in the failure to meet the operating expenditure objective 6.5.6(a)(3).
• Implementing proven technologies (such as storage optimisation technology) helps limit spend on the IT infrastructure required to keep up with business growth.
6.5.6(c)(3) a realistic expectation of the demand
forecast and cost inputs required to achieve the
operating expenditure objectives.
• Demand forecast is based on historical server capacity and storage growth, together with anticipated demand from planned project activity.
• Cost inputs used are based on reasonable estimates as specified within Supporting documentation C – Technology Plan - Costing Methodology & Estimates.
Efficient and realistic timing of investment during the regulatory period:
Based on the total IC&T capex investment figure of $39.2m, the total IC&T incremental opex constitutes only 10.2 per cent. The proposed timing of IC&T opex investment is considered “efficient” as:
• Refreshing only the critical end of life IT infrastructure. Otherwise vendor support for ageing IT infrastructure would result in incremental operating expenditure;
• Deferring replacement of IT infrastructure, where vendor support of ageing infrastructure does not result in an increase to operating expenditure, and consolidating server purchases to obtain economies of scale; and
• Purchasing more cost effective technology to meet forecasted demand rather than continuing to upgrade with enterprise class technology as advancements in mid-range technology would now very efficiently meet Ausgrid’s forecasted demand.

TRIM ID: D13/446348 For Official Use Only AER 2014-19 Technology Operating
Expenditure Plan Overview
Released: 29 May 2014 For Official Use Only Page: 38
07. Infrastructure Capacity & Maintenance
FY14/15 FY15/16 FY16/17 FY17/18 FY18/19 Total
Non-network Incremental Opex ($ real 13/14)
IT and Comms 0 SCADA & Network
– – – – – $0
Total $0
Non-network Capex ($ real 13/14)
IT and Comms SCADA & Network
Total
Table 19: Opex and Capex forecasts ($ real 13/14)
In addition, Ausgrid has looked to identify and implement proven technologies during the 2014-19 regulatory period to better manage business demand and achieve operational savings without significantly impacting the overall risk and cost profile. Specific examples of this include:
• Storage optimisation technologies – Ausgrid propose to implement compression and de-duplication technologies to better leverage the existing physical storage available. In a further application of “efficient timing” to investments, the implementation of optimisation technologies is scheduled to occur prior to any capacity upgrades in an effort to reduce the true amount of additional storage capacity required following compression and minimise cost (i.e. opex avoidance).
• Infrastructure as a Service (IaaS) – Ausgrid also propose to implement IaaS for data storage which will result in a capex / opex trade-off. Whilst Ausgrid will be likely to incur incremental opex, it will avoid capital expenditure normally required to purchase additional Terabytes (TB) of data storage. The graph below shows actual storage growth and the storage requirement estimates in terabytes by year.
Figure 4. Storage requirements (actual and estimated) in Terabyte by year
Refer to B.7 – 07. Infrastructure Capacity & Maintenance Business Case for further information on the consideration and assessment of alternate options and their efficient costing.
TRIM ID: D13/446348 For Official Use Only AER 2014-19 Technology Operating
Expenditure Plan Overview
Released: 29 May 2014 For Official Use Only Page: 39
We consider these projects can be effectively completed over the 2014-19 regulatory period. The timing and effort required to deliver the projects is realistic as it has been based on a bottom-up, building block approach using “revealed” costs (past 2009-14 actuals). Please refer to Section 5 Forecast method, Supporting documentation C – Technology Plan - Costing Methodology & Estimates.
08. Workplace Technology
Relevant NER operating expenditure objective and Binding change (where applicable):
Mapping to the relevant “Operating expenditure objective(s)” (Chapter 6, National Electricity Rules)
The forecasted operating expenditure is considered necessary to achieve:
6.5.6(a)(3) to the relevant extent:
(iii) maintain the quality, reliability and security of
supply of standard control services; and
(iv) maintain the reliability and security of the
distribution system through the supply of standard
control services;
The proposed expenditure seeks to update the critical workplace technology
components used to access the key business applications supporting the critical
business processes in order to maintain the quality and reliability of supply of
standard control services.
Workplace Technology incorporates the Desktop SOE, the email system and
mobile devices which are all integral to the day-to-day working requirements for
both office and field staff at Ausgrid. It is the platform that provides access to all
of the key business applications which supports the critical business processes and
the medium for communication both internally and externally. Appropriately
scheduled refreshing to these components is vital in maintaining reliability of
supply.
6.5.6(a)(2) comply with all applicable regulatory
obligations or requirements associated with the
provision of standard control services
Mobile devices used in the field are required to provide support ensuring field
staff have access to all OH&S and safety regulations.
6.5.7(a)(4) maintain the safety of the distribution
system through the supply of standard control
services. (Secondary objective)
The proposed expenditure seeks to update critical workplace technology
components used in the field to access and support asset maintenance activities
and processes. This ensures the continued safe operation of the distribution
system and hence the risk of potential failure and/or unplanned production
outages is reduced.
Opex prudency and efficiency criteria:
Ausgrid considered various options to address the need to refresh workplace technology software and mobile hardware devices which support critical business processes in order to maintain the quality and reliability of supply. Efficient forecasts were developed using “revealed costs” (i.e. past 2009-14 actuals) as the starting point. The table below shows how the preferred option meets each of the prudency and efficiency criteria in the National Electricity Rules.
Mapping to “Operating expenditure criteria” (Chapter 6, National Electricity Rules)
The forecasted operating expenditure reasonably reflects each of the following:
6.5.6(c)(1) the efficient costs of achieving the
operating expenditure objectives;
• Delaying the refresh of the Desktop SOE and Email tools to the end of “extended” vendor support.
• Extending the life of Lotus Notes rather than implementing a new tool or technology.
• Completing the current Desktop SOE project to avoid having to manage two operating systems.
• Replacing ageing mobile devices only when vendor support will cease or devices fail.
6.5.6(c)(2) the costs that a prudent operator would
require to achieve the operating expenditure
objectives; and
• By not maintaining the existing Workplace technology software and mobile hardware devices supporting critical business processes this exposes Ausgrid to unacceptable levels of risk to its business operations, potentially resulting in the failure to meet the operating expenditure objectives 6.5.6(a)(2) and (3).
6.5.6(c)(3) a realistic expectation of the demand
forecast and cost inputs required to achieve the
operating expenditure objectives.
• Cost inputs used are based on reasonable estimates as specified within Supporting documentation C – Technology Plan - Costing Methodology & Estimates.

TRIM ID: D13/446348 For Official Use Only AER 2014-19 Technology Operating
Expenditure Plan Overview
Released: 29 May 2014 For Official Use Only Page: 40
Efficient and realistic timing of investment during the regulatory period:
The proposed timing of non-recurrent or “one-off” IC&T opex (i.e. there is no IC&T incremental opex) for the Workplace Technology Business Case is considered most efficient as Workplace Technology assets have been “sweated” as much as possible. Specific examples of this include:
• Extending the life of the Desktop SOE and Email tools beyond the standard support and thus delaying the technology refresh till after the end of “Extended” vendor support period has ended;
• Maintaining the existing Lotus Notes solution instead of replacing it with an alternative solution; and • Replacing ageing mobile devices only when they fail or vendor support is no longer provided.
08. Workplace Technology
FY14/15 FY15/16 FY16/17 FY17/18 FY1/19 Total
Non-network Incremental Opex ($ real 13/14)
IT and Comms – – – – – – SCADA & Network – – – – – –
Total – – – – – –
IC&T Non-recurrent Opex ($ real 13/14)
IT and Comms – – – – SCADA & Network – – – – – –
Total – – – –
Non-network Capex ($ real 13/14)
IT and Comms SCADA & Network – –
Total
Table 20: Opex and Capex forecasts ($ real 13/14)
Refer to Supporting documentation B.8 – 08. Workplace Technology Business Case for further information on the consideration and assessment of alternate options and their efficient costing.
We consider the projects can be completed over the 2014-19 regulatory period. The timing and effort required to deliver these activities is realistic as it has been based on a bottom-up, building block approach using “revealed” costs (past 2009-14 actuals). Please refer to Section 5 Forecast method, Supporting documentation C – Technology Plan - Costing Methodology & Estimates.
09. Telecommunications Platform Maintenance
Relevant NER operating expenditure objective and Binding change (where applicable):
Mapping to the relevant “Operating expenditure objective(s)” (Chapter 6, National Electricity Rules)
The forecasted operating expenditure is considered necessary to achieve:
6.5.6(a)(3) to the relevant extent:
(iii) maintain the quality, reliability and security of
supply of standard control services; and
(iv) maintain the reliability and security of the
distribution system through the supply of standard
control services;
The proposed expenditure seeks to upgrade/refresh the critical
telecommunications network infrastructure underpinning mission and business
critical applications and processes in order to maintain the quality and reliability of
supply of standard control services.
6.5.7(a)(4) maintain the safety of the distribution
system through the supply of standard control
services. (Secondary objective)
The proposed Operational Support Systems (OSS) capital expenditure seeks to
provide extended maintenance required to end to end management tools that
maintain, report and monitor Ausgrid’s network management systems as well as
provide secure access to data centre resources. The Property IT infrastructure
investment also supports the delivery of workplace safety while maintaining core
functions.
Opex prudency and efficiency criteria:

TRIM ID: D13/446348 For Official Use Only AER 2014-19 Technology Operating
Expenditure Plan Overview
Released: 29 May 2014 For Official Use Only Page: 41
Ausgrid considered various options to address the need to maintain the quality, reliability and capacity of telecommunications services providing connectivity for mission and business critical systems and processes. Efficient forecasts were developed using “revealed costs” (i.e. past 2009-14 actuals) as the starting point. The table below shows how the preferred option meets each of the opex prudency and efficiency criteria in the National Electricity Rules:
Mapping to “Operating expenditure criteria” (Chapter 6, National Electricity Rules)
The forecasted operating expenditure reasonably reflects each of the following:
6.5.6(c)(1) the efficient costs of achieving the
operating expenditure objectives;
• Continuing to maintain an asset where its end of life has not been announced by the vendor and any dependent critical assets are not approaching end of life;
• Refreshing an asset only once the end of life has been announced by the vendor and is within the 2014-19 regulatory period;
• If refresh of an asset reaching end of life with the manufacturer was ignored, Ausgrid would be exposed to major operational risk and/or increased Operational expenditure costs and tactical workarounds or solutions; and
• Ausgrid’s strategy is to adopt new technology and service models where the offerings are mature, commercially sound and do not increase business exposure.
6.5.6(c)(2) the costs that a prudent operator would
require to achieve the operating expenditure
objectives; and
• By not maintaining the existing telecommunications infrastructure supporting critical business and operational processes (including the monitoring of the electricity network management systems), this exposes Ausgrid to the risk of service unavailability due to decreased reliability through higher failure rates of ageing hardware, unsupported software and limited network capacity; and
• Adopt new technology and service models where the offerings are mature, commercially sound, do not increase business exposure and help limit spend on telecommunications infrastructure required to keep up with business growth.
6.5.6(c)(3) a realistic expectation of the demand
forecast and cost inputs required to achieve the
operating expenditure objectives.
• Demand forecast is based on historical and anticipated demand from planned project activity; and
• Cost inputs used are based on reasonable estimates as specified within Supporting documentation C – Technology Plan - Costing Methodology & Estimates.
Efficient and realistic timing of investment during the regulatory period:
Based on the total IC&T capex investment figure of $29.5m, the total IC&T incremental opex constitutes 17.8 per cent, of which IT and Comms accounts for 11.5 per cent and SCADA & Network Control accounts for 6.3 per cent. The proposed timing of IC&T incremental opex is considered efficient as Ausgrid will continue to maintain a telecommunications’ asset where an end of support date has not been announced by the vendor and only refresh an asset once the end of vendor support date is known and it falls within the 2014-19 regulatory period.
09. Telco Platform Maintenance
FY14/15 FY15/16 FY16/17 FY17/18 FY18/19 Total
Non-network Incremental Opex ($ real 13/14)
IT and Comms SCADA & Network
Total
Non-network Capex ($ real 13/14)
IT and Comms SCADA & Network
Total
Table 21: Opex and Capex forecasts ($ real 13/14)
Refer to Supporting documentation B.9 – 09. Telecommunications Platform Maintenance Business Case for further information on the consideration and assessment of alternate options and their efficient costing.
We consider this project can be completed over the 2014-19 regulatory period. The timing and effort required to deliver these activities is realistic as it has been based on a bottom-up, building block approach using “revealed” costs (past 2009-14 actuals). Please refer to Section 5 Forecast method.
TRIM ID: D13/446348 For Official Use Only AER 2014-19 Technology Operating
Expenditure Plan Overview
Released: 29 May 2014 For Official Use Only Page: 42
18. Network Secondary Systems Platform Maintenance
Relevant NER operating expenditure objective (where applicable):
Mapping to the relevant “Operating expenditure objective(s)” (Chapter 6, National Electricity Rules)
The forecasted operating expenditure is considered necessary to achieve:
6.5.7(a)(2) comply with all applicable regulatory obligations or
requirements associated with the provision of standard control
services
The proposed expenditure seeks to drive a significant increase in the
usage of measured data into business systems and processes in order
to safely maximise the utility of existing assets and minimising the
introduction of new assets while also maintaining quality and
reliability of supply. This expenditure will defer and reduce the risk of
system capital over investment or system failure.
Furthermore, efficiencies and consistent work practices introduced
by putting in place the new network policy and procedures will align
Ausgrid to their regulatory obligations and further improve good
business practice which will ensure the sustainability of Ausgrid’s
quality and reliability of supply.
6.5.7(a)(3) to the extent that there is no applicable regulatory
obligation or requirement in relation to:
(i) the quality, reliability or security of supply of standard
control services [prescribed transmission services]; or
(ii) the reliability or security of the distribution system through
the supply of standard control services [prescribed transmission
services],
to the relevant extent:
(iii) maintain the quality, reliability and security of supply of
standard control services [prescribed transmission services];
and
(iv) maintain the reliability and security of the distribution
[transmission] system through the supply of standard control
services;
6.5.7(a) (4) maintain the safety of the distribution system
through the supply of standard control services.
Opex prudency and efficiency criteria:
Ausgrid considered various options to address the need to maintain the quality, reliability and capacity of telecommunications services providing connectivity for mission and business critical systems and processes. Efficient forecasts were developed using “revealed costs” (i.e. past 2009-14 actuals) as the starting point. The table below shows how the preferred option meets each of the opex prudency and efficiency criteria in the National Electricity Rules:
Mapping to “Operating expenditure criteria” (Chapter 6, National Electricity Rules)
The forecasted operating expenditure reasonably reflects each of the following:
6.5.6(c)(1) the efficient costs of achieving the
operating expenditure objectives;
• By incorporating increased measured data into our network analysis and business decision making we are able to better optimise and perform regulatory compliance and licence conditions activities as and when they are required.
6.5.6(c)(2) the costs that a prudent operator would
require to achieve the operating expenditure
objectives; and
• By not maintaining regulatory compliance and continuity in daily business operations, this exposes Ausgrid to unacceptable levels of risk to its business operations, potentially resulting in the failure to meet the capital expenditure objective 6.5.7(a)(3).
6.5.6(c)(3) a realistic expectation of the demand
forecast and cost inputs required to achieve the
operating expenditure objectives.
• The greater incorporation of measured data increases the confidence that demand forecasts are realistic and represent an objective state of both loads and network capacity into the future. In addition greater measurement allows Ausgrid to accurately extract optimal asset utilisation and capacity and hence determine appropriate asset capital expenditures.
• Cost inputs used are based on reasonable estimates as specified within the “Technology Plan – Costing Methodology and Estimates” document.
Efficient and realistic timing of investment during the regulatory period:
Based on the total IC&T capex investment figure of $11.9, the total IC&T incremental opex constitutes 2.5 per cent. The proposed timing of IC&T incremental opex is considered efficient as Ausgrid will continue to maintain the network secondary system asset where an end of support date has not been announced by the vendor and only refresh an asset once the end of vendor support date is known and it falls within the 2014-19 regulatory period.

TRIM ID: D13/446348 For Official Use Only AER 2014-19 Technology Operating
Expenditure Plan Overview
Released: 29 May 2014 For Official Use Only Page: 43
18. Network Secondary Systems Platform Maintenance
FY14/15 FY15/16 FY16/17 FY17/18 FY18/19 Total
IC&T Incremental Opex ($ real 13/14)
IT and Comms – – SCADA & Network – – – – – –
Total $0 $0 Non-network Capex ($ real 13/14)
IT and Comms – – – – – – SCADA & Network
Total
Table 22: Opex and Capex forecasts ($ real 13/14)
Refer to Supporting documentation B.18 – 018. Network Secondary Systems Platform Maintenance Business Case for further information on the consideration and assessment of alternate options and their efficient costing.
We consider this project can be completed over the 2014-19 regulatory period. The timing and effort required to deliver these activities is realistic as it has been based on a bottom-up, building block approach using “revealed” costs (past 2009-14 actuals). Please refer to Section 5 Forecast method.
4.6.3 IC&T Opex step change supporting a strategic or efficiency initiative
11. Fieldforce Automation Program
Relevant NER operating expenditure objective (where applicable):
Mapping to the relevant “Operating expenditure objective(s)” (Chapter 6, National Electricity Rules)
The forecasted operating expenditure is considered necessary to achieve:
6.5.7(a)(3) to the extent that there is no applicable regulatory
obligation or requirement in relation to:
(i) the quality, reliability or security of supply of standard
control services [prescribed transmission services]; or
(ii) the reliability or security of the distribution system through
the supply of standard control services [prescribed transmission
services],
to the relevant extent:
(iii) maintain the quality, reliability and security of supply of
standard control services [prescribed transmission services];
and
(iv) maintain the reliability and security of the distribution
[transmission] system through the supply of standard control
services;
The proposed expenditure seeks to extend asset applications to the
field staff to enable direct updates to SAP as part of Asset
Operations’ critical business processes. Resulting in reduced
operational expenditure and improved quality and reliability of asset
data.
6.5.7(a) (4) maintain the safety of the distribution system
through the supply of standard control services.
The proposed expenditure will enable an increased quality and
reliability of asset data available to make accurate and timely
decisions regarding works scheduling and safety.
Opex prudency and efficiency criteria:
Ausgrid considered various options to address the need to maintain the quality, reliability and capacity of telecommunications services providing connectivity for mission and business critical systems and processes. Efficient forecasts were developed using “revealed costs” (i.e. past 2009-14 actuals) as the starting point. The table below shows how the preferred option meets each of the opex prudency and efficiency criteria in the National Electricity Rules:

TRIM ID: D13/446348 For Official Use Only AER 2014-19 Technology Operating
Expenditure Plan Overview
Released: 29 May 2014 For Official Use Only Page: 44
Mapping to “Operating expenditure criteria” (Chapter 6, National Electricity Rules)
The forecasted operating expenditure reasonably reflects each of the following:
6.5.6(c)(1) the efficient costs of achieving the
operating expenditure objectives;
• The preferred option leverages the current SAP platform. Hence reduces the complexity, cost and risk associated with introducing new applications and interfaces into the organisation, avoids duplication of data and improves data quality eliminates ongoing reconciliation process.
• The preferred option is proposed with a cost effective implementation strategy of using a blended engagement model driven by a System Integrator (SI) with the skills and experience to manage and deliver the scope of the project. Ausgrid’s technical and functional resources will be led by the SI team to reduce overall costs and to also allow for seamless knowledge transfer and transition to operational support.
6.5.6(c)(2) the costs that a prudent operator would
require to achieve the operating expenditure
objectives; and
• By not leveraging proven technological advancements in fieldforce automation, Ausgrid cannot continue to improve the integrity of data, required for critical business processes in Asset Operations whilst delivering operating cost reductions.
6.5.6(c)(3) a realistic expectation of the demand
forecast and cost inputs required to achieve the
operating expenditure objectives.
• Cost inputs used are based on reasonable estimates as specified within the “Technology Plan Costing Methodology and Estimates”. A detailed plan has been developed for Stream 1A.
Efficient and realistic timing of investment during the regulatory period:
Based on the total IC&T capex investment figure of $14.4m, the total IC&T incremental opex constitutes 54 per cent. The proposed timing of IC&T incremental opex is considered efficient as Ausgrid will complete the project currently underway and only deliver functionality that will deliver the efficiency savings forecasted.
11. Fieldforce Automation Program
FY14/15 FY15/16 FY16/17 FY17/18 FY18/19 Total
IC&T Incremental Opex ($ real 13/14)
IT and Comms – SCADA & Network – – – – – –
Total $0
Non-network Capex ($ real 13/14)
IT and Comms – SCADA & Network – – – – – –
Total $0
Table 23: Opex and Capex forecasts ($ real 13/14)
Refer to Supporting documentation B.11 – 011. Fieldforce Automation Business Case for further information on the consideration and assessment of alternate options and their efficient costing.
We consider this project can be completed over the 2014-19 regulatory period. The timing and effort required to deliver these activities is realistic as it has been based on a bottom-up, building block approach using “revealed” costs (past 2009-14 actuals). Please refer to Section 5 Forecast method.

TRIM ID: D13/446348 For Official Use Only AER 2014-19 Technology Operating
Expenditure Plan Overview
Released: 29 May 2014 For Official Use Only Page: 45
4.7 Inclusions of SCADA & Network Control Systems application support
As a result of the consolidation of IT and OT, the IC&T 2012/13 opex base year is now inclusive of SCADA & Network Control Systems application and infrastructure support costs which previously would have not have been included. This has result in a step change of $2.5m. The table below summarises the Network application and infrastructure support costs now included in the base year opex.
NER objective / Driver with underlying Business Cases
Project Name Cost Category
5 Year IC&T Incremental Opex ($ real 13/14)
Explanatory comments
1. Meet or manage the expected demand for standard control services over the 14-19 period
02. Technology Licence
Growth PI Historian Licence True-up Software • License maintenance & support
3. Maintain the quality, reliability and the security of the distribution system and/or the supply of standard control services
04. End of Life (EOL)
Application Maintenance Electric Thinking Program (ETP) Platform
Software • DataPower SOA appliance software and support costs
Facilities Mgmt
• Facilities management for additional ESB server. With increasing transaction volumes the existing ESB server is reaching capacity.
09. Telecommunications Platform Maintenance
Network Infrastructure Growth (10 Gb Port Upgrade)
Hardware Maint.
• Maintenance & support for new 10Gb ports.
• If new ports are not installed the server consolidation project doesn’t go ahead as Infrastructure Services will need to stay on 1Gb ports.
Certificate of Practical Completion (CPC) Communications Management
Software • Maintenance & support contract with the Ethernet switch vendor (PDH Mux)
Operational System Support (OSS) Refresh and Upgrade
Software • License maintenance & support
18. Network Secondary Systems Platform Maintenance
Secondary Systems Standards, Process and Alignment
Labour • Senior Application Support Officer
TOTAL
Table 24: SCADA & Network control systems incremental opex forecasts ($ real 13/14)

TRIM ID: D13/446348 For Official Use Only AER 2014-19 Technology Operating
Expenditure Plan Overview
Released: 29 May 2014 For Official Use Only Page: 46
4.8 Alternate Control Services
In March 2013, the Australian Energy Regulator (AER) announced a re-classification of 'Metering Services for Type 5 and Type 6 meters' from a Standard Control Service provided the by NSW distribution businesses to an Alternative Control Service from 1 July 2014. As a result of this decision, Ausgrid is required to un-bundle the cost of those Metering Services from Standard Control distribution services and submit to the AER as a separate cost recovery submission for the 2014-2019 regulatory period.
Alternative Control Services (5 Year Total)
Cost Element Type 5 & 6 Metering Services
(68 per cent) Ancillary Fees Service
Items (5 per cent)
Metering Systems Services Operational Expense 2014-2019 Non-MSS Direct Metering Operational Expense 2014-2019 Non-MSS Incremental Operational Expense Resulting from 2014-2019 Capital Program
Total Operational Expense
Table 24: Alternate Control Services opex ($ real 13/14)
Refer to AER Regulatory Submission 2014-2019 IC&T Metering Alternative Control Services document for further detailed information on Alternate Control Services.
4.9 Benefits
This section details the business cases with an IC&T benefit within the AER1419 period directly related to IC&T Capital Investment.
i. IC&T benefit summary
Business Cases
5 Year IC&T Capex Forecast ($real 13/14)
5 Year IC&T Incremental Opex
Benefit Type IC&T Benefit $ (5 year)
IC&T Benefit as a % of IC&T opex
04. End of Life (EOL) Application Maintenance
Cost reduction 1,448,361 0.81%
TOTAL $1,468,792 0.81%
Table 24: ICT Benefits summary ($ real 13/14)
Refer to Supporting documentation B.1 - B.18 for a detailed breakdown and explanation of each benefit type and amount for each individual business case.
Ausgrid has four standard benefit types which all projects should be assigned to. Benefit types are outlined below and they include Cost Reduction, Productivity Enhancements or Cost Avoidance.
Benefit Type Measures Category Key Requirements
Cost Reduction – These benefits are “hard” cost savings derived from investments that provide tangible bottom line direct savings.
• Procurement Opportunity • Improved Efficiency • Automation of Manual Process
• Lower Business or Technology Cost • Resources saved via automated
process improvement • Reduction in prices paid for goods or
services Productivity Enhancements – These benefits can be shown as “hard” if they are forecast to lead to a direct bottom line cost savings. However, if there is no tangible bottom line direct savings derived from the investments but rather productivity gains provided via process improvement, they must be shown as “soft” savings and not shown in NPV / Payback models.
• Improved Efficiency • Doing same with less staff • Doing more with same staff
• Time Saved • Improved Output
Cost Avoidance – These benefits will occur when the avoided costs can be clearly linked and quantified to a workload driver
• Avoidance of hiring new full-time employees (FTEs)
• Business or Technology Costs Avoided • Additional Resources Avoided

TRIM ID: D13/446348 For Official Use Only AER 2014-19 Technology Operating
Expenditure Plan Overview
Released: 29 May 2014 For Official Use Only Page: 47
Benefit Type Measures Category Key Requirements
(e.g. unless this project occurs, increasing processing volumes will require additional future headcount). Cost avoidance may sometimes incur higher costs in the short term but the final and longer term cost will be lower.
• Avoidance of future operations and maintenance (O&M) costs
• Avoidance of the need for new infrastructure investments.
• Infrastructure Investments Avoided
For each of the business cases with identified benefits, the key underlying projects and the nature of the benefits have summarised by Benefit Type. In addition, further detailed information on the Ausgrid Technology Projects Benefits Framework utilised can be found in Supporting documentation A.

TRIM ID: D13/446348 For Official Use Only AER 2014-19 Technology Operating
Expenditure Plan Overview
Released: 29 May 2014 For Official Use Only Page: 48
5. Forecast method We have relied on a combination of a bottom-up, building block approach using “revealed” costs (past 2009-14 actuals) and establishing an efficient base year opex in forecasting for the 2014-19 period.
This section provides an overview of the process we have used to derive the total opex forecast for IC&T. In doing so, we have taken into account the business as usual (BAU) operations carried forward from the 2009-14 period and the circumstances in the 2014-19 period as described in Section 2.
We have supplemented the information with Supporting documentation C – Technology Plan – Costing Methodology & Estimates. This includes specific data and analysis relating to our forecast processes, and derivation of key inputs such as cost escalators and volume drivers (if applicable).
5.1 General approach
Ausgrid has developed a separate Technology Plan for each IC&T activity and/or investment need. Each investment need is mapped to a Business Function (“Domain”) roadmap and business cases are developed. Refer to Section 4.3 IC&T Operational strategy. Individual projects are then identified and developed. Each project will then The Technology Plan has been developed utilising a detailed bottom up approach and “revealed” costs (past 2009-14 actuals). Forecasting for outer years 2017/18 and 2018/19, however, we have relied somewhat on high level modelling. Our forecasting method across the Technology Plans is based on robust assumptions. Synergies with other plans such as Metering and NERP “Power of 3” initiatives are considered and are accounted for at a high level. The impact of material step changes has also been incorporated in the forecast.
A summary of our high level investment driver approach is set out below. Information that sets out the forecasting model approach is discussed overleaf.
Figure 5: Process outlining the high level IC&T investment driver approach
Domains
Asset Lifecycle Management
Works Management
Asset Operations
Customer Management
Enterprise Management
Market Management
IT Management
Investment Driver
Compliance
Maintain Core Platforms
Efficiency
All investment made will:
• Meet or manage the expected demand for standard control services
• Comply with all applicable obligations or requirements associated with provision of standard control services
• Maintain the quality, reliability and security of supply of standard control services
• Maintain the reliability, safety and security of the distribution system through the supply of the standard control services
1. Our current technology environment supports core business functions required to provide standard control services
2. 1419 investment need was identified based on the following drivers:
• Meeting new compliance obligations
• Maintaining the currency and capacity of existing systems so that core business functions can continue
• Enabling cost efficiencies and alignment with strategic initiatives
Option 1
Option 2
Option 3
Preferred Option
3. Alternate options to meet an investment need were considered. The preferred option was selected based on:
• NPV / Efficiency Test
• Alignment to Technology Principles
• Risk Profile
Investment NeedFor application end of life investments the following options were considered:
• Do nothing
• Extend vendor support
• Upgrade
• Replace

TRIM ID: D13/446348 For Official Use Only AER 2014-19 Technology Operating
Expenditure Plan Overview
Released: 29 May 2014 For Official Use Only Page: 49
5.1.1 2014-19 IC&T forecasting methodology approach
Ausgrid’s BAU IC&T forecast has been based on a combination of a bottom-up, building block approach using “revealed” costs (past 2009-14 actuals) and establishing an efficient base year opex.
Unlike other capital plans where a whole project represents a unit cost, given the variability of project costs within IC&T, each project has been developed using a building block approach which includes applying standardised unit costs in order to develop a forecast cashflow for each project.
Figure 6: 2014-19 IC&T forecasting methodology – Building block approach
These unit costs have been sourced from historical data and adjusted relative to external benchmarks (where available). Global escalators have been applied for real escalation and indexation. The global escalators have been applied consistently across all Ausgrid plans.
5.1.2 Key assumptions
Our forecast methods are based on consistent and robust assumptions of the future. The key assumptions include: Internal labour, Hardware (storage / servers / network), Software, Facilities maintenance and Hardware and software maintenance.
Internal labour
Internal labour consists of employees (full and part time) under Enterprise Bargaining Agreements (EBA) and Senior Contract, as well as, labour hire. The internal labour unit cost is based on the 2012/13 actual blended rates. These are comparable to the available market information including an external Greythorn study. The Greythorn report surveyed over 2,500 IT professionals to adequately forecast market trends in 2012/13.
Hardware (storage / servers / network)
Hardware costs are made up of server, storage and network costs. Servers are physical computers dedicated to run one or more services. Based on the future state architecture proposed as part of the IC&T 2014-19 plan, we assessed the future server requirements for each project and those required on an ongoing basis. This assessment was based on variables such as number of users, number of transactions, vendor recommendations and risk profile. Server unit costs were forecast based on reduced vendor contracts from FY12.

TRIM ID: D13/446348 For Official Use Only AER 2014-19 Technology Operating
Expenditure Plan Overview
Released: 29 May 2014 For Official Use Only Page: 50
Software
The initial software purchase cost has been forecast, by project, by reviewing existing contracts and/or consultation with vendors either through negotiations or publicly available information. A major project would typically include consultation with the vendor and a competitive tender process once the project has been approved.
Facilities maintenance
Within Ausgrid Facilities Maintenance (FM) includes defined processes to maintain and develop the IT services which support and improve the effectiveness of the IC&T function. The scope of FM is 'Space & Infrastructure' (planning, design, workplace, construction, lease, occupancy, maintenance, furniture, cleaning, etc.) and 'People & Organisation' required to provide this service. Server FM costs have been used based on existing contracts with individual vendors.
Hardware and software maintenance
Software maintenance has been forecast by project; however, the high level guidance used was an annual 17 to 20 per cent of the software purchase price. This guidance was based on current vendor pricing arrangements. For major projects, we have consulted with vendors to identify where further efficiencies could be achieved through negotiations.
5.1.3 Other relevant key assumptions
Other relevant key assumptions included in the Technology Plan include:
• EnergyAustralia (TRUenergy) Transitional Services Agreement (TSA): The end date for the EnergyAustralia TSA is currently being renegotiated and is expected to continue through 2014. We have not included costing for any separation work into our proposal as it is expected that this will be funded through the TSA. However, should the TSA be extended, it will cause disruption to the proposed Technology Plan.
• Metering Strategy: Ausgrid will continue the current metering strategy of replacing existing meters as like for like and installing accumulation (type 6) meters for new requirements. Ausgrid will not continue the accelerated meter replacement program.
• Network/External cost allocation: Ausgrid will continue to operate with an external business (including street lighting, external revenue). IT solutions for the business that operate across both Network and External lines of business will continue to be subject to the cost allocation methodology (as described in the CAM).
• Compliance obligations: Ausgrid will ensure compliance with the following statutory and regulatory obligations: o Australian Energy Market Operator (AEMO) and National Electricity Market (NEM) regulations; o National Energy Customer Framework (NECF); o Commonwealth Taxation Law; and o The National Electricity Law and the National Electricity Rules (NER) legal framework.
Global escalation factors
Global escalators have been applied for real escalation and indexation. The global escalators have been applied consistently across all Ausgrid plans. These include:
• Labour by asset class; • Material by asset class; • Facilities Maintenance by asset class; and • Software by asset class.
The detailed forecast model explanations and calculations can be found in Supporting documentation C – Technology Plan Costing Methodology & Estimates.

TRIM ID: D13/446348 For Official Use Only AER 2014-19 Technology Operating
Expenditure Plan Overview
Released: 29 May 2014 For Official Use Only Page: 51
Cj
6. High level review Our forecast opex reflects the efficient costs that we would require to deliver the outcomes we are required to deliver by the National Electricity Rules. It also reasonably reflects the prudent costs that a prudent cost that a prudent operator would require and a realistic expectation of the demand forecast and cost inputs required to achieve these outcomes.
The purpose of this section is to demonstrate that our proposed opex meets the opex objectives and criteria, with regard to the opex factors in the Rules.
6.1 Meeting the opex objectives
Our forecast incremental IC&T operating expenditure of $18.0 million is required to achieve NER objectives:
1. Meet or manage the expected demand for standard control services over the 14-19 period; 2. Comply with all applicable regulatory obligations or requirements associated with the provision of standard control
services; and 3. Maintain the quality, reliability and the security of the distribution system and/or the supply of standard control
services.
For each of the IC&T opex step changes in Section 4.6, the opex objective has been identified by Business Case. This forecast also represents expenditure that is properly allocated to Standard Control services in accordance with the principles and policies set out in Ausgrid’s cost allocation method.
6.2 Meeting opex criteria
Chapter 6 of the NER sets out the criteria that the AER must be satisfied before it can accept our proposed opex forecast. For each of the proposed IC&T opex step changes in Section 4.6, the opex criteria (6.5.6(c)) has been considered and we believe reasonably reflects for each Business Case.
1. The efficient cost of achieving the opex objectives; 2. The prudent cost that a prudent operator would require to achieve the opex objectives; and 3. A realistic expectation of the demand forecast and cost inputs required to achieve the opex objectives.
We understand that the AER in an effort to make a decision whether the proposed forecast opex is prudent and efficient will also account a number of factors, including, but not limited to:
• Most recent annual benchmarking report and the benchmark opex that would be incurred by an efficient DNSP over the next period (see Section 3.2.7);
• The actual and expected opex incurred by Ausgrid during the previous period (see Section 2); • The extent to which the opex forecast includes expenditure to address the concerns of electricity consumers as
identified by Ausgrid in the course of its engagement with electricity consumers; (see Section 4); • The relative prices of operating and capital inputs (see Section 5 and Supporting documentation C); and • The substitution possibilities between operating and capital expenditure (see Section 4.6).

TRIM ID: D13/446348 For Official Use Only
Released: 30 May 2014 For Official Use Only Page: 1
Appendix A – Supporting documents The following list of documents provides support to the proposed expenditure for demand related capex on the distribution network.
# Document
ID17345 Technology Strategy
Attachment 5.27 Technology Capex Plan – Overview
ID00109 Technology Plan Business Case 01 - Regulatory Changes to Market & Enterprise Systems
ID00111 Technology Plan Business Case 02 - Technology Licence Growth
ID00115 Technology Plan Business Case 03 - Information, Communication & Technology Security
ID00116 Technology Plan Business Case 04 - End of Life Application Upgrades
ID00117 Technology Plan Business Case 05 - Mandatory Patch & Release Management
ID00118 Technology Plan Business Case 06 - SAP Core Maintenance
ID00119 Technology Plan Business Case 07 - Infrastructure Capacity & Maintenance
ID00120 Technology Plan Business Case 08 - Workplace Technology
ID00121 Technology Plan Business Case 09 - Telecommunications Platform Maintenance
ID00122 Technology Plan Business Case 10 - Distribution Monitoring & Control Rollout
ID00123 Technology Plan Business Case 11 - Fieldforce Automation Program
ID00124 Technology Plan Business Case 12 - Distribution Network Monitoring System (DNMS) and Supervisory Control and Data Acquisition (SCADA)
ID00137 Technology Business Case 18 - Network Secondary Systems Platform Maintenance
ID17472 Technology Plan – Costing Methodology & Estimates
ID00003 AER Regulatory Submission 2014-2019 IC&T Metering Alternative Control Services
ID00138 Ausgrid Technology Projects Benefits Framework