Embed Size (px)
Citation preview

Document name WECC Solar Plant Dynamic Modeling Guidelines Category ( ) Regional Reliability Standard
( ) Regional Criteria ( ) Policy (X) Guideline ( ) Report or other ( ) Charter
Document date April 2014 Adopted/approved by
TSS
Date adopted/approved
May 8, 2014
Custodian (entity responsible for maintenance and upkeep)
M&VWG
Stored/filed Physical location: Web URL: http://www.wecc.biz/committees/StandingCommittees/PCC/TSS/MVWG/Shared%20Documents/MVWG%20Approved%20Documents/WECC%20Solar%20Plant%20Dynamic%20Modeling%20Guidelines.pdf
Previous name/number
N/A
Status (X) in effect ( ) usable, minor formatting/editing required ( ) modification needed ( ) superseded by _____________________ ( ) other _____________________________ ( ) obsolete/archived)

1
Western Electricity Coordinating Council Modeling and Validation Work Group
WECC PV Power Plant Dynamic Modeling Guide
Prepared by WECC Renewable Energy Modeling Task Force
April 2014

2
Contents 1 Introduction ............................................................................................................................. 3 2 Background ............................................................................................................................. 3 3 General Considerations for Dynamic Simulation of PV Plants .............................................. 5
3.1 Appropriate Models for Bulk System Simulations .......................................................... 5 3.2 Load Flow Representation ............................................................................................... 5 3.3 Implications of Collector System Equivalencing ............................................................. 6 3.4 Active and Reactive Power Control ................................................................................. 6 3.5 Fault Ride-Through and Representation of Protection Limits ......................................... 6 3.6 Model parameters ............................................................................................................. 7
4 WECC Generic Models .......................................................................................................... 7 4.1 Technical Specifications for the WECC Generic Models ................................................ 7 4.2 WECC Generic Model for Large-scale PV Plants ........................................................... 8
4.2.1 Model Structure ........................................................................................................ 8 4.2.2 Model call ................................................................................................................. 9 4.2.3 Scaling for the PV plant size and reactive capability ............................................. 10 4.2.4 Volt/Var controls options ........................................................................................ 11 4.2.5 Active power control options .................................................................................. 11 4.2.6 Representation of Voltage and Frequency Protection ............................................ 12 4.2.7 Sample simulation results ....................................................................................... 12
4.3 WECC Generic Model for Distributed and Small PV Plants......................................... 12 4.3.1 Model Structure ...................................................................................................... 12 4.3.2 Model call ............................................................................................................... 13 4.3.3 Scaling for the PV plant size and reactive capability ............................................. 14 4.3.4 Volt/Var Controls.................................................................................................... 14 4.3.5 Active Power Controls ............................................................................................ 14 4.3.6 Generation tripping ................................................................................................. 15 4.3.7 Sample simulation results ....................................................................................... 15
5 Summary ............................................................................................................................... 16 Appendix – Detailed Model Description ...................................................................................... 17
5.1 Renewable Energy Generator/Converter Model (REGC_A) ......................................... 17 Description ............................................................................................................................ 17 Block Diagram ...................................................................................................................... 17 Parameters and Default Settings ........................................................................................... 18 Internal Variables and Output Channels ............................................................................... 18
5.2 REEC_B – Renewable Energy Electrical Control Model for PV Plants ....................... 19 Description ............................................................................................................................ 19 Block Diagram ...................................................................................................................... 19 Parameters and sample settings ............................................................................................ 20 Internal variables and Output Channels ................................................................................ 20
5.3 REPC_A - Renewable Energy Plant Control Model ..................................................... 22 Description ............................................................................................................................ 22 Block Diagram ...................................................................................................................... 22 Parameters and sample settings ............................................................................................ 23 Internal Variables and Output Channels ............................................................................... 24
Document Version Control ....................................................................................................... 25

3
1 Introduction Grid-connected photovoltaic (PV) systems cover a wide range of applications. Most PV systems are residential (up to several kW) and commercial scale (up to several MW) connected to distribution networks. However, many PV systems are large generation facilities (some exceeding 100 MW) and are connected to the transmission system. NERC Reliability Standards require that power flow and dynamics models be provided, in accordance with regional requirements and procedures. Under the existing WECC modeling guidelines1 all PV power plants with aggregated capacity 20 MVA or larger must be modeled explicitly in power flow and dynamics. This means that these plants must not be load-netted or modeled as negative load. Manufacturer-specific dynamic models commonly provided for interconnection studies are not adequate for regional planning. For this application, WECC requires the use of approved models, that are public (non-proprietary), are available as standard-library models, and have been tested and validated in accordance to WECC guidelines. Approved models are listed in the WECC Approved Dynamic Model List. This document is a guide for the application WECC PV power plant generic dynamic models recently been adopted by WECC. The user should always refer to module documentation maintained by the simulation software vendor. For additional technical details, the user can reference the WECC-approved model specifications2. Subject to some limitations, and with proper selection of model structure and parameters, the models are suitable for representation of large-scale PV plants and distribution-connected PV aggregated to a transmission bus. Both PV system models require explicit representation of the generation in the power flow model. PV power plant modeling will continue to be an area of active research. Models will continue to evolve with changes in technology and interconnection requirements. Also, PV power plants model validation against reference data remains a challenge due to limited industry experience. 2 Background Solar power plants are different than conventional power plants. The interface to the grid is an inverter (see Figure 1) connected to a PV array.
Figure 1 – A topology commonly found in utility-scale three-phase PV inverters.
1 WECC Data Preparation Procedural Manual for Power Flow Base Cases and Dynamic Stability Data”, WECC System Review Work Group, Approved March 27, 2013. 2 Model specifications are accessible from the WECC website in this folder.

4
Inverters are characterized by low short circuit current contribution, lack of mechanical inertia, and high-bandwidth (fast) controls. A primary function of the inverter controls is to make the most efficient use of available energy being produced by the PV array, while ensuring that the magnitude of AC current does not exceed the rating of the inverter. PV plants do not have any inherent inertial or frequency response capabilities. Figure 2 shows the topology of a large PV power plant. Large PV plants typically have several medium voltage radial feeders. The PV inverters are connected to the feeders via step-up transformers, with several inverters sharing one step-up transformer. Some plants designs include capacitors or other reactive support systems that work in conjunction with the inverters to meet reactive power capability and control requirements at the point of interconnection. A plant controller provides the power factor reference to the inverters3 and plant-level reactive power support equipment, if present. The plant controller processes measurements at the point of interconnection and commands issued from the fleet remote operations center or directly from the transmission system operator.
Figure 2 – Typical PV Power Plant Topology Much of the existing PV generation in WECC consists of small PV systems deployed in customer premises, connected directly to distribution service voltage. These systems do not typically have a plant controller, and the inverter manages the grid interface. Some PV systems as large as 20 MW are connected directly to distribution substations using a dedicated medium voltage feeder.
3 Although not used commonly, the plant controller could also provide active power to the inverters to prevent the plant output from exceeding a certain limit.

5
PV plants are considered non-dispatchable because the energy source (solar irradiance) is variable. However, reactive power is dispatchable within the capability of the inverters and plant-level reactive compensation. 3 General Considerations for Dynamic Simulation of PV Plants 3.1 Appropriate Models for Bulk System Simulations
The WECC generic models were designed for transmission planning studies that involve a complex network, and a large set of generators, loads and other dynamic components. The objective is to assess dynamic performance of the system, particularly recovery dynamics following grid-side disturbances such as transmission-level faults. In this context, WECC uses positive-sequence power flow and dynamic models that provide a good representation of recovery dynamics using integration time steps of one quarter cycle. This approach does not allow for detailed representation of very fast controls and response to imbalanced disturbances. It should be noted that generic dynamic models for inverter-based generator tend to produce a short-duration (a cycle or shorter) voltage spike at fault inception or clearing. These spikes should be ignored in most cases, as they do not represent the performance of actual hardware. They are simply a consequence of the model's limited bandwidth, integration time step, and the way current injection models interface with the network solution. 3.2 Power Flow Representation
The WECC generic dynamic models described in this guideline assume that the PV generators are represented explicitly in power flow, representing a single large plant or the aggregated output of multiple smaller plants connected to distribution systems. For bulk system studies, it is impractical and unnecessary to model the collector system network inside the plant to the level of detail shown in Figure 2. In accordance with the WECC PV Plant Power Flow Modeling Guide4, PV power plants must be represented by a simplified system consisting of one or more equivalent generators and unit transformers, equivalent collector system, substation transformer, and plant-level reactive support system, if present. For most PV plants, the single-generator equivalent model shown in Figure 3 is adequate for bulk-level power flow and dynamic simulations. The WECC PV Plant Power Flow Modeling Guide also describes a methodology to derive the parameters for the single-machine representation, including a way to derive the collector system equivalent from design data.
4 WECC Guide for Representation of Photovoltaic Systems in Large-Scale Load Flow Simulations, WECC Renewable Energy Modeling Task Force, Approved January 2011.

6
Figure 3 – Single-Generator Equivalent Power Flow Representation for a PV Power Plant Similarly, it is impractical to represent the large number of PV systems connected to distribution systems. When it is necessary to study the effects of distributed PV generation in a given area, the aggregated PV generation could be represented at a suitable transmission node by an equivalent generator, preferably behind an equivalent station transformer and equivalent medium voltage feeder. The dynamic models suggested for distributed PV plants are simpler than the dynamic models used for PV power plants. 3.3 Implications of Collector System Equivalencing
It is important that the equivalent impedance of the collector system be represented in dynamic simulations. Since PV systems typically extend over a large geographical area, the electrical impedance between the terminals of each PV system and the point of interconnection could be significantly different, leading to a diverse dynamic response. It is not possible to capture this level of detail with a single-machine equivalent. The same argument applies to situations where multiple distributed PV systems are aggregated into an equivalent generator. Therefore, it should be understood that the modeling approach provides an indication of the average response of the inverters, as opposed to the response of any particular inverter in the plant. 3.4 Active and Reactive Power Control
Average irradiance over a large PV plant can change appreciably during the span of a typical dynamic simulation (up to 30 seconds). By default, the WECC generic models assume a fixed reference generator output in the solved power flow case. Presently, there is no provision for incorporating simulation of irradiance variability in large-scale system studies. The generic models do allow for the specification of active power control, including ramp rate limits, frequency response and active/reactive power priority during voltage dips. Reactive power capability and response characteristics are an important consideration in system studies. A variety of reactive power control modes can be implemented in a PV power plant. Very large PV systems typically control voltage at the point of interconnection. Smaller plants are typically operated in power factor control mode. During a dynamic event, the reactive power response is the combined contribution of fast inverter response (in cycles) and slower supervisory control (in seconds) via the plant controller. 3.5 Fault Ride-Through and Representation of Protection Limits
An important part of a dynamic performance evaluation is whether the PV system will trip off line for a given voltage or frequency disturbance. The equivalent representation and simplified dynamic models described here are not recommended for evaluation of fault ride-through. Whether or not an inverter will ride through a voltage disturbance depends on the type of fault and the magnitude of the remaining voltage at the inverter terminals. The control actions that affect the behavior of the inverter during the span of a short fault are generally not modeled in detail in the generic dynamic models. This limitation is acceptable because system studies focus on the characteristics of the dynamic recovery, rather than on system conditions during the fault. Considering that terminal voltage can vary significantly across the plant, a single machine representation has obvious limitations with respect to assessment of voltage ride through.

7
3.6 Model parameters
As with any other equipment, appropriate parameters must be selected to represent the dynamic behavior of the corresponding PV plant. Default parameters provided are intended only for model testing, and do not represent any particular project. Consistent with established WECC practice, input from the plant operator and equipment manufacturer is required to correctly parameterize the model5. This is also true for the power flow representation. 4 WECC Generic Models This section contains a general description of the WECC generic models based on REMTF technical specifications approved by WECC. The models are available as standard-library models in commercial simulation platforms used in WECC. The purpose of this document is to help model users understand the limitations of the models, the model structure, user-selectable options, requirements for scaling the plant size, and representation of protection settings.
4.1 Technical Specifications for the WECC Generic Models
The WECC generic models for PV plants are based on the following technical specifications:
• The models shall be non-proprietary and accessible to transmission planners and grid operators without the need for non-disclosure agreements.
• The models shall provide a reasonably good representation of dynamic electrical performance of solar photovoltaic power plants at the point of interconnection with the bulk electric system, and not necessarily within the PV power plant collector system.
• The models shall be suitable for studying system response to electrical disturbances, not solar irradiance transients (i.e., available solar power is assumed constant through the duration of the simulation). Electrical disturbances of interest are primarily balanced transmission grid faults (external to the solar PV power plant), typically 3 - 9 cycles in duration, and other major disturbances such as loss of generation or large blocks of load.
• Plant owners, inverter manufacturers and model users (with guidance from the integrators and manufacturers) shall be able to represent differences among specific inverter and/or plant controller responses by selecting appropriate model parameters and feature flags.
• Simulations performed using these models typically cover a 20-30 second time frame, with integration time steps in the range of 1 to 10 milliseconds.
• The models shall be valid for analyzing electrical phenomena in the frequency range of zero to approximately 10 Hz.
• The models shall incorporate protection functions that trip the associated generation represented by the model, or shall include the means for external modules to be connected to the model to accomplish such generator tripping.
• The models shall be initialized from a solved power flow case with minimal user intervention required in the initialization process.
• Power level of interest is primarily 100% of plant nominal rating. However, performance shall be valid, within a reasonable tolerance, for the variables of interest (current, active power, reactive power and power factor) within a range of 25% to 100% of rated power.
5 Periodic model validation is also required. This topic is addressed in a separate WECC guideline.

8
• The models shall perform accurately for systems with a short circuit ratio of 3 and higher at the point of interconnection. However, it should be noted that these generic models are NOT intended for studying parts of the system that are subject to very low short-circuit levels. In such cases, detailed vendor specific models may be needed.
• External reactive compensation and control equipment (i.e., external to the PV inverters) shall be modeled separately using existing WECC-approved models.
WECC approved the use of two generic dynamic models for PV plants: (a) a model consisting of plant controller, electrical controls and grid interface modules, intended for large-scale PV plants, and (b) a simplified model intended for distribution-connected, aggregated PV plants. 4.2 WECC Generic Model for Large-scale PV Plants
4.2.1 Model Structure
Dynamic representation of large-scale PV plants requires the use of three new renewable energy (RE) modules listed below and shown in Figure 4. These modules, in addition to others, are also used to represent wind and PV power plants. It is required that the PV plant be modeled in power flow, preferably using the single-generator equivalent system discussed in Figure 3.
• REGC_A module, used to represent the Generator/Converter (inverter) interface with the grid. It processes the real and reactive current command and outputs of real and reactive current injection into the grid model.
• REEC_B module, used to represent the Electrical Controls of the inverters. It acts on the active and reactive power reference from the REPC_A module, with feedback of terminal voltage and generator power output, and provides real and reactive current commands to the REGC_A module.
• REPC_A module, used to represent the Plant Controller. It processes voltage and reactive power output to emulate volt/var control at the plant level. It also processes frequency and active power output to emulate active power control. This module provides active reactive power command to the REEC_B module.
Q Control
P Control
Current Limit Logic
IqcmdIqcmd’
IpcmdIpcmd’
Generator Model
Network Solut ion
Plant Level V/ Q Control
Plant Level P Control
VrefVreg
QrefQbranch
PrefPbranchFreq_ref
Freg
Qext
Pref
REPC_A
Pqf lag
REEC_B REGC_AVt Vt
Iq
Ip
Figure 4 – Block Diagram Showing Different Modules of the WECC Generic Models
These modules do not include inverter or plant protection. However, existing generator protection models can be used to represent time-delayed voltage and frequency protection settings. Table 1 shows the list of PV power plant simulation modules implemented in two simulation platforms commonly used in WECC. As indicated, the plant controller and protection

9
modules are optional. Although the internal implementation may differ across simulation platforms, the modules have the same functionality and parameter sets. Table 1 – REMTF models for PV power plants implemented in the PSLF™, PSS®E, and PowerWorld platforms Module PSLF™ modules PSS®E modules PowerWorld Grid interface regc_a REGCAU1 regc_a Electrical controls reec_b REECBU1 reec_b Plant controller (optional) repc_a REPCAU1 repc_a Voltage/frequency protection (optional)
lhvrt / lhfrt VRGTPA / FRQTPA lhvrt / lhfrt
Strictly speaking, only the REGC_A module is required to run a simulation; however, the rest of the modules are needed to enable control functionality. The appendix contains a detailed description of the large-scale PV plant dynamic modules. Default parameters are provided; however, these are intended for model testing only. They do not represent the performance of any particular plant or equipment. Consultation with the inverter manufacturer and the plant operator is required to properly select appropriate model parameters.
4.2.2 Model call
The model call varies according to the software platform. Users must follow the instructions provided with the model documentation. The model calls shown below for the various software platforms refer to the simple test system shown in Figure 5. This example is for a PV plant with total inverter capacity of 110 MVA and100 MW, which would correspond to PV inverters sized for 0.95 leading or lagging power factor at rated power and rated voltage. In this particular hypothetical example, the equivalent generator is controlling voltage at bus 5.
Figure 5 – Test system for large-scale PV plant model
GE PSLF™ regc_a 5 "Test" 0.6 "1 " : #9 mvab=111. "lvplsw" 1. "rrpwr" 10.0 "brkpt" 0.9 "zerox" 0.4 "lvpl1" 1.22 "vtmax" 1.2 "lvpnt1" 0.8 "lvpnt0" 0.4 "qmin" -1.3 "accel" 0.7 "tg" 0.02 "tfltr" 0.02 "iqrmax" 999. "iqrmin" -999. "xe" 0. reec_b 5 "Test" 0.6 "1 " : #9 "mvab" 0. "vdip" -99. "vup" 99. "trv" 0.2 "dbd1" -0.5 "dbd2" 0.5 "kqv" 0. "iqh1" 1.5 "iql1" -1.5 "vref0" 0. "tp" 0.5 "qmax" 0.4 "qmin" -0.4 "vmax" 1.1 "vmin" 0.9 "kqp" 0.0 "kqi" 0.1 "kvp" 0.1 "kvi" 100. "tiq" 0.2 "dpmax" 999. "dpmin" -999. "pmax" 1. "pmin" 0. "imax" 1.3 "tpord" 0.4 "pfflag" 0. "vflag" 1. "qflag" 1. "pqflag" 0.

10
repc_a 5 "Test" 0.6 "1 " : #9 "mvab" 0. "tfltr" 0.2 "kp" 18. "ki" 5. "tft" 0. "tfv" 0.15 "refflg" 1. "vfrz" -1. "rc" 0. "xc" 0. "kc" 0. "vcmpflg" 1. "emax" 999. "emin" -999. "dbd" 0. "qmax" 0.44 "qmin" -0.44 "kpg" 0.1 "kig" 0.5 "tp" 0.25 "fdbd1" 0. "fdbd2" 0. "femax" 999. "femin" -999. "pmax" 999. "pmin" -999. "tlag" 0.1 "ddn" 20. "dup" 0.0 "frqflg" 0.
PowerWorld Simulator regc_a 5 "Test" 0.6 "1 " : #1 mva=111. "lvplsw" 1. "rrpwr" 10. "brkpt" 0.9 "zerox" 0.4 "lvpl1" 1.22 "vtmax" 1.2 "lvpnt1" 0.8 "lvpnt0" 0.4 "qlim" -1.3 "accel" 0.7 "tg" 0.02 "tfltr" 0.02 "iqrmax" 999. "iqrmin" -999. "xe" 0. reec_b 5 "Test" 0.6 "1 " : #1 "mvab" 0. "vdip" -99. "vup" 99.0 "trv" 0.2 "dbd1" -0.5 "dbd2" 0.5 "kqv" 0. "iqh1" 1.5 "iql1" -1.5 "vref0" 0. "iqfrz" 0.15 "thld" 0. "thld2" 0. "tp" 0.5 "qmax" 0.4 "qmin" -0.4 "vmax" 1.1 "vmin" 0.9 "kqp" 0. "kqi" 0.1 "kvp" 0.1 "kvi" 100. "vref1" 0. "tiq" 0.2 "dpmax" 999. "dpmin" -999. "pmax" 1. "pmin" 0. "imax" 1.3 "tpord" 0.4 "pfflag" 0. "vflag" 1. "qflag" 1. "pflag" 0. "pqflag" 0. repc_a 5 "Test" 0.6 "1 ": #1 "mvab" 0. "tfltr" 0.2 "kp" 18. "ki" 5. "tft" 0. "tfv" 0.15 "refflg" 1. "vfrz" -1. "rc" 0. "xc" 0. "kc" 0. "vcmpflg" 1. "emax" 999. "emin" -999. "dbd" 0. "qmax" 0.44 "qmin" -0.44 "kpg" 0.1 "kig" 0.5 "tp" 0.25 "fdbd1" 0. "fdbd2" 0. "femax" 999. "femin" -999. "pmax" 999. "pmin" -999. "tlag" 0.1 "ddn" 20. "dup" 0. "frqflg" 0.
Siemens PTI PSS®E 5 'USRMDL' 1 'REGCAU1' 101 1 1 14 3 4 1 0.20000E-01 10.000 0.90000 0.50000 1.2200 1.2000 0.80000 0.40000 -1.3000 0.20000E-01 0.70000 9999.0 -9999.0 1.0000 / 5 'USRMDL' 1 'REECBU1' 102 0 5 25 6 4 0 0 1 1 0 -99.000 99.000 0.0000 -0.50000E-01 0.50000E-01 0.0000 1.0500 -1.0500 0.0000 0.50000E-01 0.43600 -0.43600 1.1000 0.90000 0.0000 0.10000 0.0000 40.000 0.20000E-01 99.000 -99.000 1.0000 0.0000 1.8200 0.20000E-01 / 5 'USRMDL' 1 'REPCAU1' 107 0 7 27 7 9 2 0 0 '0 ' 1 1 0 0.20000E-01 18.000 5.0000 0.0000 0.75000E-01 0.0000 0.0000 0.0000 0.20000E-01 0.10000 -0.10000 0.0000 0.0000 0.43600 -0.43600 0.10000 0.50000E-01 0.25000 0.0000 0.0000 999.00 -999.00 999.00 -999.00 0.10000 20.000 0.0000 / The parameters shown are intended for model testing only, and do not represent the performance of any particular PV plant or equipment.
4.2.3 Scaling for the PV plant size and reactive capability
Model parameters are expressed in per unit of the generator MVA base (mvab parameter in the regc_a module in the example above). The specification of MVA base is implementation-dependent. For example, in the PSLF™ implementation, if the MVA base for those modules is zero, the MVA base entered for the REGC_A module applies to the electrical controls (REEC_B) and plant controller (REPC_A). A different MVA base can be specified for those modules, if desired. To scale the dynamic model to the size of the plant, the generator MVA base parameter must be adjusted. The reactive range can be adjusted with the qmin and qmax parameters in the REEC_B module. Normally, the MVA base and reactive limits are the same as those used in power flow, taking into consideration that the capability is being specified for the equivalent generator, not the point of connection.

11
4.2.4 Volt/Var controls options
The plant-level control module allows for the following reactive power control modes:
• Closed loop voltage regulation (V control) at a user-designated bus with optional line drop compensation, droop response and dead band.
• Closed loop reactive power regulation (Q control) on a user-designated branch, with optional dead band.
Different function calls are required to specify the regulated bus or branch. In the electrical control module, additional reactive control options are available:
• Constant power factor (PF), based on the generator PF in the solved power flow case • Constant reactive power, based either on the equivalent generator reactive power in the
solved power flow case or from the plant controller • Defined reactive power injection during a user-defined voltage-dip event
Various combinations of plant-level and inverter-level reactive control are possible by setting the appropriate parameters and switches. Table 5 shows a list of control options, and the models and switches that would be involved. The entry "N/A" indicates that the state of the switch does not affect the indicated control mode. Table 2 – Reactive Power Control Options for large-scale PV plant generic model Functionality Models Needed PfFlag Vflag Qflag RefFlag Constant local PF control REEC_B 1 N/A 0 N/A Constant local Q control REEC_B 0 N/A 0 N/A Local (gen terminals) V control REEC_B 0 0 1 N/A Local coordinated V/Q control REEC_B 0 1 1 N/A Plant level Q control REEC_B, REPC_A 0 N/A 0 0 Plant level V control REEC_B, REPC_A 0 N/A 0 1 Plant level Q control + local coordinated V/Q control REEC_B, REPC_A 0 1 1 0
Plant level V control + local coordinated V/Q control REEC_B, REPC_A 0 1 1 1
4.2.5 Active power control options
The plant controller allows a user to specify the active power control options listed below. Table 4 shows the active power control modes as well as the models and parameters involved.
• Constant active power, based on the generator output in the solved power flow case • Governor droop response with different characteristics for over and under frequency
conditions, based on frequency deviation at a user-designated bus. Table 3 – Active Power Control Options Functionality Models Needed Freq_flag Ddn Dup No governor response REGC_A, REEC_B 0 N/A N/A Governor response with down regulation, only REGC_A, REEC_B, REPC_A 1 > 0 0
Governor response with up and down regulation REGC_A, REEC_B, REPC_A 1 > 0 > 0

12
In situations where current limit of the equivalent inverter is reached, the user can specify whether active or reactive power takes precedence, by setting the Pqflag parameter in the REEC_B module.
4.2.6 Representation of Voltage and Frequency Protection
Frequency and voltage tolerance is required for transmission-connected PV plants. Because they are simplified, the WECC generic models may not be suitable to fully assess compliance with voltage and frequency ride-through requirement. The same limitation applies to other positive-sequence models. Voltage ride-trough is engineered as part of the plant design, and requires far more sophisticated modeling detail than is possible to capture in a positive-sequence simulation environment. It is recommended that a standardized (existing) protection model with voltage and frequency thresholds and time delays can be used to indicate the minimum disturbance tolerance requirement that applies to the plant.
4.2.7 Sample simulation results
Figure 6 shows the results of a PV plant response to a 3-cycle fault bus 2, using the hypothetical test system and model parameters shown in Section 4.2.2. Transformer and equivalent generator parameters are as follows:
• GSU: R = 0.0 pu, X = 0.05 pu on 100 MVA base • Station transformer: R = 0.0 pu, X = 0.1 pu on 100 MVA base • Equivalent collector system: R = 0.015 pu, X = 0.025 pu, B = 0.01 pu on 100 MVA and
34.5 kV base
Figure 6 – Dynamic response of the sample PV plant from Section 4.2.2 to a 3-cycle bolted fault at Bus 2 (P and Q measured at Bus 2). 4.3 WECC Generic Model for Distributed and Small PV Plants
4.3.1 Model Structure
The generic model PVD1 shown in Figure 7 is recommended to represent distribution-connected small PV plants or multiple PV plants aggregated at a high voltage bus that is represented in power flow. The PVD1 model is much simpler than the modules discussed in Section 4.2, and

13
provides a basic set of control options. It requires that the PV generator be explicitly represented in power flow, preferably behind an equivalent transformer and feeder.
Figure 7 – Block Diagram Showing Different Modules of the WECC Generic Models
At its core, the PVD1 model is a simple current injection with the following basic functionality for reactive power control, active power control and protection.
4.3.2 Model call
The model call varies according to the software platform. Users must follow the instructions provided with the model documentation. The example described below is for the PSLF™ platform, using the simple test system shown in Figure 8. This example would be applicable to a single distribution-connected PV plant or multiple distribution-connected PV systems with total capacity of 25 MW, deployed in the vicinity of a transmission bus (bus 2) where generation and load is aggregated. In this case, the aggregated generation is modeled behind an equivalent substation unit transformer and feeder impedance.6
6 Consideration should also be given to modeling the load behind the transformer and equivalent impedance.

14
Figure 8 – Test system for PVD1 model
pvd1 5 "Test" 0.6 "1 " : #1 mvab=28. "pqflag" 1. "xc" 0. "qmx" 0. "qmn" 0. "v0" 0.9 "v1" 1.1 "dqdv" 0. "fdbd" -99. "ddn" 0. "imax" 1.1 "vt0" 0.88 "vt1" 0.9 "vt2" 1.1 "vt3" 1.2 "vrflag" 1. "ft0" 59.5 "ft1" 59.7 "ft2" 60.3 "ft3" 60.5 "frflag" 0. "tg" 0.02 "tf" 0.05 "vtmax" 1.2 "lvpnt1" 0.8 "lvpnt0" 0.4 "qmin" -1.3 "accel" 0.7 The parameters shown are intended for model testing only, and do not represent the performance of any particular case.
4.3.3 Scaling for the PV plant size and reactive capability
To scale the dynamic model to the size of the aggregated PV generation, the generator MVA base MVA (mvab parameter in the example above) must be adjusted. In this case, fixed power factor was emulated by setting the reactive limits (qmin and qmax in the example above) to zero.
4.3.4 Volt/Var Controls
The model allows two basic reactive power control modes, listed below.
• Constant reactive power, based on generator output in the solved power flow case • Volt/var control at the generator terminals, with user-defined Q versus V characteristic
and optional line drop compensation In the example above, volt/var control is disabled by setting the reactive range (Qmx and Qmn) to zero.
4.3.5 Active Power Controls
The model allows two basic active power control modes, listed below.
• Constant active power, based on generator output in the solved power flow case • Over-frequency response, with user-defined dead band and droop
In the example above, frequency response is disabled by setting the droop gain parameter (Dbn) to zero; thus, the plant operates in constant active power mode.

15
Similar to the large-scale PV plant model, the user can specify whether active or reactive power takes precedence, by setting the Pqflag parameter.
4.3.6 Generation tripping
The model allows for tripping of all or a portion of the generation based on over- and under- voltage and frequency monitored at the equivalent generator terminals. The user can set the voltage and frequency dead bands (vt1 to vt2 and ft1 to ft2, respectively), how much generation trips, and what fraction of the generation is restored as the disturbance subsides. In the example above, generation would disconnect outside the 0.9 to 1.1 pu voltage range, with all generation assumed to be disconnected when voltage goes below 0.88 or above 1.2 pu. Similarly, generation would disconnect when frequency is outside the range 59.7 Hz to 60.3 Hz, with all generation assumed to be disconnected when frequency goes below 50.5 Hz or above 60.5 Hz. In the example shown above, the parameters vfflag and frflag (labeled vr_recov and fr_recov in Figure 7) are set to 1 and 0, respectively. This means that, as voltage and frequency recover within the dead band, all of the generation disconnected on voltage reconnects, but none of the generation disconnected on frequency would reconnect. Partial tripping is relevant when the equivalent generator represents distributed generation systems, each of which would experience a transmission-level disturbance very differently depending on the electrical distance to the bus where they are aggregated7. It should be noted that trip thresholds in this model are not time-dependent. If this functionality is desired, a standard generator protection model can be used.
4.3.7 Sample simulation results
Figure 9 shows the results of a PV plant response to a 3-cycle fault bus 2, using the hypothetical test system and model parameters shown in Section 4.3.2. Transformer and equivalent generator parameters are as follows:
• GSU: R = 0.0 pu, X = 0.05 pu on 50 MVA base • Station transformer: R = 0.0 pu, X = 0.1 pu on 50 MVA base • Equivalent collector system: R = 0.015 pu, X = 0.025 pu, B = 0.01 pu on 50 MVA and
12.5 kV base
7 At present, applicable interconnection requirements emphasize tripping requirements for off-nominal frequency and voltage, as opposed to fault ride-through capability. The REMTF is integrating distributed generation model into the existing WECC composite load model (CMPLDW), which would provide a better indication of conditions that distributed generation experience. This topic falls outside of this document.

16
Figure 9 – Dynamic response of the sample aggregated, distribution-connected PV plant from Section 4.3.2 to a 3-cycle bolted fault at Bus 2 (P and Q measured at Bus 2). 5 Summary The PV plant generic models described in this document are intended for general bulk system planning studies. The general guidelines discussed in this document should be used in conjunction with the model documentation provided as part of the relevant simulation platform. Selection of appropriate model parameters requires consultation with inverter manufacturer and plant operator. PV plant dynamic modeling is an area of active research. As with any other model, the WECC generic PV plant models will evolve based on industry experience and technology evolution.

17
Appendix – Detailed Model Description 5.1 REGC_A – Renewable Energy Generator/Converter Model
Description
The model incorporates a high bandwidth current regulator that injects real and reactive components of inverter current into the external network during the network solution in response to real and reactive current commands. Current injection includes the following capabilities:
• User settable reactive current management during high voltage events at the generator (inverter) terminal bus
• Active current management during low voltage events to approximate the response of the inverter PLL controls during voltage dips
• Power logic during low voltage events to allow for a controlled response of active current during and immediately following voltage dips
The current injection model is identical to that which the WECC REMTF is proposing to utilize for the Type 3 and Type 4 generic wind turbine models.
Block Diagram
REGC_A
Ipcmd 11 + sTg
LVPL & rrpwr
lvpnt0 lvpnt1
gain
V
1
0×
Ip
INTERFACE TO
NETWORK MODEL
LOW VOLTAGE ACTIVE CURRENT
MANAGEMENT
Iqcmd -11 + sTg
Iq×
Volim
-Khv
0
0
Vt ≤ Volim Vt > Volim
HIGH VOLTAGE REACTIVE CURRENT MANAGEMENT
Iolim
Vt
-
V
Zerox Brkpt
Lvpl1
LVPL
V
LOW VOLTAGE POWER LOGIC
0
1
Lvplsw1
1 + sTf lt r
Iqrmin
Iqrmax
+
+Upward rate limit on Iq act ive when Qgen0 > 0
Downward rate limit on Iq act ive when Qgen0 < 0

18
Parameters and Default Settings
REGC_A Input Parameters Name Description Typical Values Tfltr Terminal voltage filter (for LVPL) time constant (s) 0.01 to 0.02 Lvpl1 LVPL gain breakpoint (pu current on mbase / pu voltage) 1.1 to 1.3 Zerox LVPL zero crossing (pu voltage) 0.4 Brkpt LVPL breakpoint (pu voltage) 0.9 Lvplsw Enable (1) or disable (0) low voltage power logic - rrpwr Active current up-ramp rate limit on voltage recovery (pu/s) 10.0 Tg Inverter current regulator lag time constant (s) 0.02 Volim Voltage limit for high voltage clamp logic (pu) 1.2 Iolim Current limit for high voltage clamp logic (pu on mbase) -1.0 to -1.5 Khv High voltage clamp logic acceleration factor 0.7 lvpnt0 Low voltage active current management breakpoint (pu) 0.4 lvpnt1 Low voltage active current management breakpoint (pu) 0.8 Iqrmax Maximum rate-of-change of reactive current (pu/s) 999.9 Iqrmin Minimum rate-of-change of reactive current (pu/s) -999.9
Internal Variables and Output Channels
REGC_A Internal Variables Name Description Vt Raw terminal voltage (pu, from network solution) V Filtered terminal voltage (pu) LVPL Active current limit from LVPL logic (pu on mbase) Iqcmd Desired reactive current (pu on mbase) Ipcmd Desired active current (pu on mbase) Iq Actual reactive current (pu on mbase)

19
5.2 REEC_B – Renewable Energy Electrical Control Model for PV Plants
Description
The active power control subsystem provides the active current command to the current injection model. The active current command is subject to current limiting, with user-selectable priority between active and reactive current. The active current command is derived from a reference active power and the inverter terminal voltage determined in the network solution. The reference active power is the initial active power from the solved power flow case; or, in the case where a plant controller model (REPC_A) is included, from the plant controller. The reactive power control subsystem provides the reactive current command to the current injection model. The reactive current command is subject to current limiting, with user-selectable priority between active and reactive current. The following reactive power control modes are accommodated:
• Constant power factor, based on the inverter power factor in the solved power flow case • Constant reactive power, based either on the inverter absolute reactive power in the
solved power flow case or, in the case where a plant controller model (REPC_A) is included, from the plant controller.
The option to process the reactive power command via a cascaded set of PI regulators for local reactive power and terminal voltage control (refer to Figure 3), or to bypass these regulators and directly derive a reactive current command from the inverter terminal voltage, shall be provided. In addition, a supplementary, fast-acting reactive current response to abnormally high or low terminal voltages (again, refer to Figure 3) shall be provided.
Block Diagram
Current Limit LogicQ Priority (Pqf lag =0): Ipmax = (Imax2- Iqcmd2)1/ 2, Ipmin = 0 Iqmax = Imax, Iqmin = - IqmaxP Priority (Pqf lag =1): Ipmax = Imax, Ipmin = 0 Iqmax = (Imax2- Ipcmd2)1/ 2, Iqmin = - Iqmax
÷ Ipcmd11 + sTpord
Pmax & dPmax
Pmin & dPmin
Iqcmd
÷
Iqmax
Iqmin
Iqh1
Iql1
Kqvdbd1,dbd2
Vref0
Vt -
iqinj
REEC_B
pfaref
×
tan Qmin
Qmax11 + sTpPe 1
0
PfFlag
Qext Qgen
-Kqp + Kqi s
Vmax
Freeze state if Voltage_dip = 1Vmin
1
0Vmin
Vf lag VmaxIqmax
Kvp + Kvi s
Freeze state if Voltage_dip = 1Iqmin
11 + sTrv
Vt_f ilt
if (Vt < Vdip) or (Vt > Vup) Voltage_dip = 1else Voltage_dip = 0
Current Limit Logic
1
0
QFlag
-
Vt_f ilt 0.01
11 + sTiq Freeze state if
Voltage_dip = 1
Vt_f ilt0.01
Ipmax
Ipmin =0
Imax
Pqf lag
Freeze state if Voltage_dip = 1
Pref
+
+
++
+
20
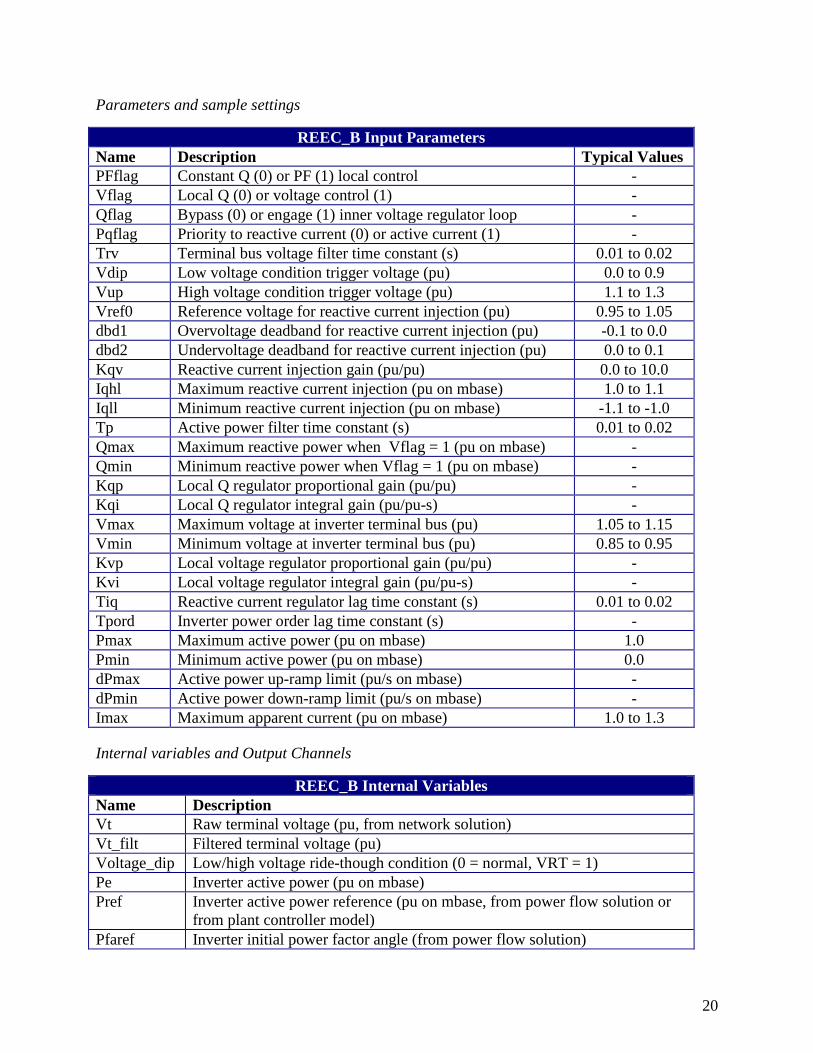
Parameters and sample settings
REEC_B Input Parameters Name Description Typical Values PFflag Constant Q (0) or PF (1) local control - Vflag Local Q (0) or voltage control (1) - Qflag Bypass (0) or engage (1) inner voltage regulator loop - Pqflag Priority to reactive current (0) or active current (1) - Trv Terminal bus voltage filter time constant (s) 0.01 to 0.02 Vdip Low voltage condition trigger voltage (pu) 0.0 to 0.9 Vup High voltage condition trigger voltage (pu) 1.1 to 1.3 Vref0 Reference voltage for reactive current injection (pu) 0.95 to 1.05 dbd1 Overvoltage deadband for reactive current injection (pu) -0.1 to 0.0 dbd2 Undervoltage deadband for reactive current injection (pu) 0.0 to 0.1 Kqv Reactive current injection gain (pu/pu) 0.0 to 10.0 Iqhl Maximum reactive current injection (pu on mbase) 1.0 to 1.1 Iqll Minimum reactive current injection (pu on mbase) -1.1 to -1.0 Tp Active power filter time constant (s) 0.01 to 0.02 Qmax Maximum reactive power when Vflag = 1 (pu on mbase) - Qmin Minimum reactive power when Vflag = 1 (pu on mbase) - Kqp Local Q regulator proportional gain (pu/pu) - Kqi Local Q regulator integral gain (pu/pu-s) - Vmax Maximum voltage at inverter terminal bus (pu) 1.05 to 1.15 Vmin Minimum voltage at inverter terminal bus (pu) 0.85 to 0.95 Kvp Local voltage regulator proportional gain (pu/pu) - Kvi Local voltage regulator integral gain (pu/pu-s) - Tiq Reactive current regulator lag time constant (s) 0.01 to 0.02 Tpord Inverter power order lag time constant (s) - Pmax Maximum active power (pu on mbase) 1.0 Pmin Minimum active power (pu on mbase) 0.0 dPmax Active power up-ramp limit (pu/s on mbase) - dPmin Active power down-ramp limit (pu/s on mbase) - Imax Maximum apparent current (pu on mbase) 1.0 to 1.3
Internal variables and Output Channels
REEC_B Internal Variables Name Description Vt Raw terminal voltage (pu, from network solution) Vt_filt Filtered terminal voltage (pu) Voltage_dip Low/high voltage ride-though condition (0 = normal, VRT = 1) Pe Inverter active power (pu on mbase) Pref Inverter active power reference (pu on mbase, from power flow solution or
from plant controller model) Pfaref Inverter initial power factor angle (from power flow solution)

21
Qgen Inverter reactive power (pu on mbase) Qext Inverter reactive power reference (pu on mbase, from power flow solution or
from plant controller model) Iqinj Supplementary reactive current injection during VRT event (pu on mbase) Ipmax Maximum dynamic active current (pu on mbase) Ipmin Minimum active current (0) Iqmax Maximum dynamic reactive current (pu on mbase) Iqmin Minimum dynamic reactive current (pu on mbase, = -iqmax) Ipcmd Desired active current (pu on mbase) Iqcmd Desired reactive current (pu on mbase)

22
5.3 REPC_A - Renewable Energy Plant Control Model
Description
The plant controller model is an optional model used when plant-level control of active and/or reactive power is desired. The model incorporates the following:
• Closed loop voltage regulation at a user-designated bus. The voltage feedback signal has provisions for line drop compensation, voltage droop response and a user-settable dead band on the voltage error signal.
• Closed loop reactive power regulation on a user-designated branch with a user-settable dead band on the reactive power error signal.
• A plant-level governor response signal derived from frequency deviation at a user-designated bus. The frequency droop response is applied to active power flow on a user user-designated branch. Frequency droop control is capable of being activated in both over and under frequency conditions. The frequency deviation applied to the droop gain is subject to a user-settable dead band.
The plant controller model is identical to that which the WECC REMTF is proposing to utilize for the Type 3 and Type 4 generic wind turbine models.
Block Diagram
REPC_A
1
0
Vreg
Vref
Freeze state if Vreg < Vfrz
Ibranch
Kc
-
Qbranchemax
emin
Kp + Ki s
Qmax
Qmin
1 + s Tf t1 + s Tfv QextRefFlag
dbd
11 + sTf lt r
VcompFlag|Vreg – (Rc+jXc)· Ibranch|
11 + sTf lt r
1
0
Qref
-
femin
femaxPbranch
Plant_pref
Ddn
Dup
0
0Freq_ref
- fdbd1,fdbd2
- Kpg + Kig s
Pmax
PminFreg
11 + sTp
11 + sTlag
Pref
+ +
+
+
+
+
+
+
+ 0
1
Freq_f lag

23
Parameters and sample settings
REPC_A Input Parameters Name Description Typical Values RefFlag Plant level reactive power (0) or voltage control (1) - VcompFlag Reactive droop (0) or line drop compensation (1) - Freq_flag Governor response disable (0) or enable (1) 0 Tfltr Voltage and reactive power filter time constant (s) 0.01 to 0.02 Vbus Monitored bus number - FromBus Monitored branch “from” bus number - ToBus Monitored branch “to” bus number - Ckt Monitored branch circuit designation - Rc Line drop compensation resistance (pu on mbase) -
Xc Line drop compensation reactance (pu on mbase) when VcompFlag = 1 -
Kc Reactive droop (pu on mbase) when VcompFlag = 0 -
dbd Reactive power deadband (pu on mbase) when RefFlag = 0; Voltage deadband (pu) when RefFlag = 1 -
emax Maximum Volt/VAR error (pu) - emin Minimum Volt/VAR error (pu) - Kp Volt/VAR regulator proportional gain (pu/pu)m - Kq Volt/VAR regulator integral gain (pu/pu-s) - Qmax Maximum plant reactive power command (pu on mbase) - Qmin Minimum plant reactive power command (pu on mbase) - Vfrz Voltage for freezing Volt/VAR regulator integrator (pu) 0.0 to 0.9 Tft Plant controller Q output lead time constant (s) - Tfv Plant controller Q output lag time constant (s) 0.15 to 5.0 fdbd1 Overfrequency deadband for governor response (pu) 0.01 fdbd2 Underfrequency deadband for governor response (pu) -0.01 Ddn Down regulation droop (pu power/pu freq on mbase) 20.0 to 33.3 Dup Up regulation droop (pu power/pu freq on mbase) 0.0 Tp Active power filter time constant (s) 0.01 to 0.02 femax Maximum power error in droop regulator (pu on mbase) - femin Minimum power error in droop regulator (pu on mbase) - Kpg Droop regulator proportional gain (pu/pu) - Kig Droop regulator integral gain (pu/pu-s) - Pmax Maximum plant active power command (pu on mbase) 1.0 Pmin Minimum plant active power command (pu on mbase) 0.0 Tlag Plant controller P output lag time constant (s) 0.15 to 5.0

24
Internal Variables and Output Channels
REPC_A Internal Variables Name Description Vreg Regulated bus voltage (pu, from network solution) Vref Regulated bus initial voltage (pu, from power flow solution) Ibranch Branch current for line drop compensation (pu on mbase) Qbranch Branch reactive power flow for plant Q regulation (pu on mbase) Qref Regulated branch initial reactive power flow (pu, from power flow
solution) Qext Reactive power command from plant controller (pu on mbase) Pbranch Branch active power flow for plant P regulation (pu on mbase) Plant_pref Initial branch active power flow (pu on mbase, from power flow solution) Freq Frequency deviation (pu, from network solution) Freq_ref Initial frequency deviation (0) Pref Active power command from plant controller (pu on mbase)

25
Document Version Control
• March 10, 2014 – Original draft by Sandia National Laboratories (Ellis, Elliott) • March 21, 2014 – Added reference link to folder containing model specifications in
Section 1.1. Added caveat in Section 3.1 regarding voltage spikes. (Ellis) • April 8, 2014 – Editorial changes from Pourbeik (EPRI) and Tacke (MID) • April 9, 2014 – Model calls added for PSSE and PowerWorld platforms (Karlson, Weber,
Senthil)