Embed Size (px)
Citation preview

Japan Advanced Institute of Science and Technology
JAIST Repositoryhttps://dspace.jaist.ac.jp/
Titleメタンの酸化的カップリングに関するハイスループッ
ト実験と触媒インフォマティクス
Author(s) NGUYEN, THANH NHAT
Citation
Issue Date 2020-09
Type Thesis or Dissertation
Text version ETD
URL http://hdl.handle.net/10119/17004
Rights
Description Supervisor:谷池 俊明, 先端科学技術研究科, 博士

Doctoral Dissertation
High-Throughput Experimentation and Catalyst Informatics
for Oxidative Coupling of Methane
Thanh Nhat Nguyen
Supervisor: Assoc. Prof. Toshiaki Taniike
Graduate School of Advanced Science and Technology
Japan Advanced Institute of Science and Technology
September 2020

Referee-in-chief: Associate Professor Toshiaki Taniike
Japan Advanced Institute of Science and Technology
Referees: Associate Professor Yuki Nagao
Japan Advanced Institute of Science and Technology
Associate Professor Shun Nishimura
Japan Advanced Institute of Science and Technology
Associate Professor Dam Hieu Chi
Japan Advanced Institute of Science and Technology
Associate Professor Keisuke Takahashi
Hokkaido University

1
High-Throughput Experimentation and Catalyst Informatics
for Oxidative Coupling of Methane
Thanh Nhat Nguyen
1720408
Materials informatics (MI) is one rising area, which applies data-oriented approaches
to the research and development of materials science. One of fundamental requirements for MI
is the presence of a proper dataset in terms of consistency, distribution, and size. Once such a
dataset is prepared, an appropriate learning method is selected from the toolbox. While
enormous materials data have been accumulated in literature, they suffer from an insufficient
scale, non-uniformity, and anthropogenic biases towards good data with the burial of poor data.
Moreover, materials properties such as catalyst performance are highly sensitive to process
conditions, while individual research groups have commonly employed their own conditions.
In order to overcome the problem of the data scarcity in MI, high-throughput experimentation
is considered to be the most promising and effective approach. In this thesis, I attempted to
establish complete high-throughput experimentation for the generation of a proper dataset, and
implement catalyst informatics to extract knowledge from the obtained dataset. The concept
was demonstrated by taking oxidative coupling of methane (OCM) reaction as a case study,
which is a long researched reaction toward industrialization.
In Chapter 2, a high-throughput screening instrument was successfully developed for
automatic performance evaluation of 20 catalysts at a series of predefined conditions in a fixed-
bed configuration. The catalytic test was done in steady states at 900 to 850, 800, 775, 750, and
700 °C. At each temperature, the total flow volume, the CH4/O2 ratio, and the Ar concentration
were stepwise varied, leading to 216 conditions per catalysts and 4320 observations for 20
catalysts in a single automated operation. By only 3 operations, 59 catalysts of a Mn-
Na2WO4/SiO2 type were successfully evaluated in OCM, which enabled knowledge extraction
using common visualization tools and machine learning techniques. It was found that the OCM
reaction is generally sensitive to the process conditions, and catalyst design has a great impact
on the process dependence. In particular, the modification of Si-based support affects the
performance of Mn-Na2WO4 in terms of the low-temperature activation of CH4 and the
selectivity tolerance against high O2 concentration.
Figure 1. Concept of catalyst informatics achieved in this thesis.
In order to explore the origin of the low-temperature CH4 activation, in Chapter 3, a
series of catalysts were prepared by depositing the Mn–Na–W active phase on various Si-based
supports which differed in the pore size, the structure, and the amount of foreign elements (Al,
Ti). The OCM performance of these catalysts was acquired on the developed HTS instrument

2
under various reaction conditions. It was found that high-silica supports were good supports in
general, while mesoporous silica supports appeared to be superior at low temperature
specifically. From the characterization results, it was elucidated that high-silica supports are
advantageous in forming the α-cristobalite phase, which is known to stabilize tetrahedral WO42–
and Mn2O3 active species. The mesoporous silica offered the largest accessible surface area to
improve the dispersion of the active phase.
In Chapter 4, I aim to discover new catalysts by means of random sampling from a
vast materials space, HTS, and data analysis. 300 M1–M2–M3/support catalysts were prepared
and evaluated, where M1, M2, M3, and support were randomly selected from a given library.
By statistical analysis, I successfully identified individual elements and their binary
combinations which are positive for the OCM performance. Machine learning was employed
to generalize the effective catalytic system for OCM. The results not only rediscovered known
catalysts obtained in the past three decades, but also newly discovered novel combinations that
have never been explored so far.
Based on all of these results, I successfully demonstrated the implementation and
power of the MI in the research and development of OCM catalysts, where the presence of
high-throughput experimentation was truly indispensable for obtaining a proper dataset.
Keywords: High-throughput experimentation, Catalysts informatics, Oxidative coupling of
methane, Machine learning, Combination effect

3
Preface
The present thesis is submitted for the Degree of Doctor of Philosophy at
Japan Advanced Institute of Science and Technology, Japan. The thesis is
consolidation of results of the research work on the topic “High-Throughput
Experimentation and Catalyst Informatics for Oxidative Coupling of Methane”
under the supervision of Assoc. Prof. Toshiaki Taniike during October 2017–
September 2020 at Graduate School of Advanced Science and Technology, Japan
Advanced Institute of Science and Technology.
Chapter 1 describes a general introduction and the purpose of this thesis.
Chapter 2 focuses on the development of high-throughput screening instrument
and its demonstrative application to catalyst informatics in oxidative coupling of
methane. Chapter 3 pursues the origin of a low-temperature activation ability of
Mn-Na-W catalysts supported on different types of silica materials. Chapter 4
reports a study of combination effects in the design of OCM catalysts on the basis
of catalyst informatics. Chapter 5 describes the general summary and conclusion
of this thesis. To the best of my knowledge, the work is original and no part of this
thesis has been plagiarized.
Thanh Nhat Nguyen
Graduate School of Advanced Science and Technology
Japan Advanced Institute of Science and Technology
April 2020

4
Acknowledgements
First of all, I would like to express the deepest sense of gratitude to my
supervisor Assoc. Prof. Toshiaki Taniike, Graduate School of Advanced Science and
Technology, Japan Advanced Institute of Science and Technology for his continuous
support, and enlightening suggestions throughout my Ph.D course. I am thankful to him
for his never ending patience, motivation and immense knowledge.
I would also take an opportunity to thank Senior Lecturer Patchanee
Chammingkwan, Asst. Prof. Ashutosh Thakur, Asst. Prof. Toru Wada for thier valuable
inputs, cooperation and stimulating discussions.
I am also heartily grateful to all other members of Taniike laboratory for their
valuable suggestions, cooperation and support.
I am also thankful to Assoc. Prof. Keisuke Takahashi in Hokkaido University,
for his valuable suggestions and continuous support related to informatics. My sincere
thankfulness is extended to those people who work for a catalysts informatics project.
I would like to thank members of my review committee, Assoc. Prof Yuki
Nagao (JAIST), Assoc. Prof. Shun Nishimura (JAIST), Assoc. Prof. Dam Hieu Chi
(JAIST), and Assoc. Prof. Keisuke Takahashi (Hokkaido University) for their helpful
comments and valuable suggestions.
I would like to thank my second supervisor, Assoc. Prof. Kazuaki Matsumura,
and my advisor for minor research, Prof Tatsuo Kaneko for the time they spent for me.
I would like to thank my parents for always encouraging me and supporting my
ambitions. And last but not the least; I am particularly grateful to my wife Tran Phuong
Nhat Thuy for her unconditional supports in all aspects of my life.

5
Table of contents
Chapter 1 ...................................................................................................................... 7
General introduction ................................................................................................... 7
1.1. Material informatics ................................................................................................ 8
1.1.1. Overview of material informatics ...................................................................... 8
1.1.2. Implementation of materials informatics ............................................................... 11
1.2. Machine learning ................................................................................................... 15
1.3. High-throughput experimentation ....................................................................... 19
1.4. Catalysts informatics ............................................................................................. 21
1.5. Oxidative coupling of methane ............................................................................. 24
1.5.1. Reaction mechanism of OCM ............................................................................... 25
1.5.2. Catalyst for OCM .................................................................................................. 26
Chapter 2 .................................................................................................................... 38
High-throughput experimentation and catalyst informatics for ........................... 38
oxidative coupling of methane .................................................................................. 38
2.1. Introduction ................................................................................................................ 40
2.2. Experimental and analytical details.......................................................................... 43
2.2.1. Catalyst library ...................................................................................................... 43
2.2.2. Instrumental ........................................................................................................... 52
2.2.3. Data analysis .......................................................................................................... 57
2.3. Results and discussion ................................................................................................ 60
2.3.1. High-throughput experimentation and OCM dataset ............................................ 60
2.3.2. Machine learning ................................................................................................... 71
2.4. Conclusions ................................................................................................................. 78
Chapter 3 .................................................................................................................... 84
Factors to influence low-temperature performance of supported Mn–Na2WO4 in
oxidative coupling of methane .................................................................................. 84
3.1. Introduction ................................................................................................................ 86
3.2. Experimental ............................................................................................................... 88
3.2.1. Materials ................................................................................................................ 88
3.2.2. Catalyst preparation ............................................................................................... 89
3.2.3. Catalyst test ........................................................................................................... 89
3.2.4. Catalyst characterization ....................................................................................... 90
3.3. Results and discussion ................................................................................................ 92
3.3.1 Catalytic test ........................................................................................................... 92

6
3.3.2. Catalyst characterization ....................................................................................... 99
3.4. Conclusion ................................................................................................................. 106
Chapter 4 .................................................................................................................. 110
Learning catalyst design based on bias-free dataset ............................................. 110
for oxidative coupling of methane .......................................................................... 110
4.1. Introduction .............................................................................................................. 112
4.2. Materials and methods ............................................................................................. 114
4.2.1. Materials .............................................................................................................. 114
4.2.2. Catalyst library .................................................................................................... 114
4.2.3. Catalyst evaluation .............................................................................................. 121
4.2.4. Data preprocessing .............................................................................................. 122
4.2.5. Data analysis ........................................................................................................ 123
4.3. Results and discussions ............................................................................................ 124
4.3.1. Catalyst data acquisition, visualization, and interpretation ................................. 124
4.3.2. Decision tree classification .................................................................................. 135
4.4. Conclusions ............................................................................................................... 144
Chapter 5 .................................................................................................................. 150
General conclusion ................................................................................................... 150

7
Chapter 1
General introduction

8
1.1. Material informatics
1.1.1. Overview of material informatics
The evolution in the field of materials science is comparable to the way how
sciences and technologies have been developed. Thousand years ago evidenced the
growth of purely empirical science, as clearly observed by the metallurgical evolution
throughout three periods of “age” (stone, bronze, iron) [1]. After that, the 17th century
witnessed the paradigm of theoretical models with the finding out numerous “laws” and
mathematical equations (such as laws of thermodynamics in materials science). But in
some problems, the theoretical models are not practical or infeasible owing to the
difficulty in measurements or no analytical solutions. The last few previous decades
saw the rise of computational science, which allowed the simulations of complex real-
world phenomena. For example, density functional theory (DFT) and molecular
dynamics (MD) simulations are perhaps two greatest progresses which were brought in
material science in the third period. Nowadays, the three paradigms of science, which
are based on experiments, theories, and computations/simulations, are commonly used
in all scientific domains [2,3]. In the last decade, the significant increase in the amount
of data being generated by has prompted the emergence of the next paradigm of science,
i.e. data science (Figure 1.1) .
Data science has been has been considered as the “fourth paradigm” of science
[1]. Machine learning has been continuously studied since the middle of the previous
century and used in numerous applications such as data mining, image recognition and,
materials discovery [2,3]. The power of machine learning is to mimic the human
cognitive functions in decision making [2]. When a new situation is encountered,
cognitive systems (including humans) have a tendency to make a decision based on

9
past similar encounters. Even completely new situations occur, human mind still makes
the correct decision based on assumptions and extrapolation of the past experiences [4].
Machine learning aims to mimic this human sense by training algorithms on “prior
experiences”, made of past data, and then leveraged to make predictions for “future
events” such as the performance of unknown materials for a specific purpose. Such
application of machine learning to improve the understanding and discovery of
materials in materials science is called materials informatics.
Figure 1.1. The four paradigms of science: empirical, theoretical,
computational, and data-driven science. Reproduced from Ref. [1].
A number of algorithms have been applied to create intuition in machines [5,6].
Artificial neural nets and random forest are well-known algorithms, which were
developed for modeling the brain functions of animals or handwritten numbers
classifications [7]. Both of these algorithms, along with many more not described here,
were developed for different applications at different stages of computer technology,
and many have since been adopted for application in the materials sciences.

10
The dawn of materials informatics plausibly came from atomistic calculations.
The atomistic calculations have been frequently used in materials science [8]. These
calculations describe properties of a solid on the basis of physical interactions among
atoms in the solid. In general, atomistic calculation techniques have allowed them to
calculate a wide range of materials problems [9]. More recently, the burgeoning of
computational infrastructures and algorithms enables ‘‘high-throughput” calculations,
which dramatically speed up the prediction up to thousands of materials within single
studies [10]. It must be noted that the computational cost intrinsically limits the scale
of problems feasible (i.e. the space and time scales for calculations). Even a few
calculations containing trillions of atoms or spanning over a millisecond have been
reported in some reports; they are not such easy to achieve and only possible with
simplified models for the interatomic interactions [11,12]. Besides, more precise
prediction generally requires further greater computational cost. One strategy to reduce
the computational costs is to predict the properties of new materials based on the
previous calculations using data-driven approaches. As stated in the last paragraph, the
rise of data-driven technologies such as machine learning may enable to predict
properties of new materials from the previously obtained data. Such the research
direction gradually became prevalent, and eventually it was called “materials
informatics”. The ultimate target of materials informatics is to extract knowledge from
the datasets of materials properties. This knowledge can take several views. More
specifically, the knowledge could be a predictive model for a complex material property
based on simple and easier-to-compute properties of the materials. Or, it could be a
small set of previously-unknown factors that help explain materials behaviors. Of
course, these could be also goals of conventional scientific practice. The advantage of
materials informatics is that creating models and learning descriptors can be done

11
quickly and sometimes even automatically. Nowadays, much of efforts have been
devoted to material informatics, which may be attributed to the Materials Genome
Initiative (MGI), a trigger of this paradigm shift towards computational solutions for
materials discovery [1]. The ultimate goal of the MGI is to accelerate the speed of
materials discovery by combining computational tools, experimental tools, and
standardized materials data cataloging [13]. In doing so, databases of experimentally
and computationally determined materials properties are leveraged by machine learning
algorithms to predict new materials composition with targeted properties. Following
the success of MGI, many databases for storage data generated from first-principles
calculations are opened for readily using such as the Open Quantum Materials Database
(OQMD) [14], Automatic Flow for Materials Discovery (AFLOW) and the Novel
Materials Discovery repository (NoMad) [15], and [16]. Recent works have used data-
driven approaches for predicting the physical properties of solid, inorganic materials,
organic materials [10,17], and Metal Oxide Frameworks (MOFs) [18,19].
1.1.2. Implementation of materials informatics
Generally, implementation of material informatics required requires 3 three
fundamental ingredients: A set of target variables (output), a set of materials features
(input), and a machine learning algorithm to establish a mapping between the two sets
[4]. This architecture of the implementation for materials informatics is shown in Figure
1.2

12
Figure 1.2. Implementation of materials informatics.
The target variable in this example is the measured experimental data.
Connection exists between this measured data and the corresponding materials features,
such that some features cause positive changes in the measured data and other features
cause negative changes. If the amount of data becomes sufficiently large, the
connection between the target variable and materials features become challenging for
human mind to understand. In such cases, machine learning is powerful to solve this
task. The machine learning can then be used to predict the target variable of new
materials, or extract knowledge related to the system of materials.
The target variables are usually properties of the materials. The property of
interest varies depending on individual applications, which, for example, includes
materials hardness, conductivity, band gap, catalytic performance, etc. [20,21]. The
prerequisite for the target variable is the presence of a proper dataset in terms of
consistency, distribution, and size [22]. The target variables could be obtained either
from simulation or experimental data. For simulations/computations, the data are
calculated for a variety of materials to create a training dataset, and machine learning

13
is used to learn from these calculation results, and then drastically speed up materials
discovery by bypassing the computational cost of the calculations [23,24]. Through the
acquisition of datasets by computations are fast, low cost, and consistent, but these lack
of information of processes and their conditions, thus applicable only in simple cases,
e.g. band gap of perfectly crystalline materials. For experiments, even the datasets are
the best fit to a practical target as it contains material properties under process
conditions. However, acquiring a sufficiently large dataset in a short time span is
difficult, and using conventional experimental techniques is impractical. For this
purpose, high-throughput experimentation techniques can dramatically accelerate the
speed of dataset creation [25-27].
The second component of materials informatics is the set of materials features,
called descriptors. These features could be any information that relate to the materials.
Prevalent features are enumerated by the materials composition or elemental properties,
such as electronegativity or atomic radius. These features are easily available and
therefore most frequently used in terms of the ease of usage to estimate materials
behaviors. Nevertheless, they are usually not good features as they are not directly
correlated with fundamental phenomena within the materials. For example, the atomic
radius may be a valid predictor to estimate whether a certain phase will be formed or
not, since it contributes to the geometry of the material [28]. However, the atomic radius
alone would not make accurate predictor, and must be combined with other features in
order to achieve any degree of accuracy. In some case, the use of a single feature may
be enough for prediction in a simple system such as mono-metallic materials. However,
it is not sufficient for the prediction of binary or tertiary metallic systems as there is an
interaction among elements. Thus, researchers have developed so-called synthetic
descriptors for describing the interaction between elements. For example, Meredig et

14
al. proposed the weighted average or the maximum difference of atomic masses or
electronegativity values of elements present in the system. In some literature, more
complex descriptors like the skewedness and kurtosis of d-bands were used [29]. More
complex operations, such as “the absolute values of sums of differences”, have also
been proposed [30]. Materials behaviors do not only depend on materials themselves
but also depend on the process conditions. In such cases, information related to
materials synthesis such as the type of precursors or the preparation methods should be
included as features [31]. For some applications, such process-related features such as
the pH of a particular environment or a reaction temperature were included [32].
In addition, materials features could be obtained by computation methods, for
example, density functional theoretical calculations for adsorption and activation
energies, bond distances, molecular geometries, etc. [33,34]. This type of descriptors
can be used to provide extremely accurate chemical information as long as models
employed in the computations are sufficiently realistic (this requisite is not trivial for
solid materials) [4]. Broad descriptors are better for general screening or materials
discovery endeavors, while fine descriptors are best suited for high-accuracy
understanding of chemical phenomena in a narrow materials space [4]. Since the
subject of this thesis is materials, discovery, fine descriptors will not be covered in
depth here.
The third component in the implement in material informatics is the machine
learning algorithm. There are so many algorithms suited for specific situations;
however, there is no such algorithm that always gives the best results [35]. Rather, the
performance of machine learning depends on the data structure or the number of
descriptors [55]. Therefore, to determine which algorithm has the best performance,
many algorithms should be applied and compared for a given dataset. There are,

15
however, heuristics, which can narrow the range of algorithms considered for an
application. Artificial neural networks (ANNs) are frequently used for a wide range of
applications, but typically require huge datasets [36]. ANN requires at least 10000 data
points, which are usually infeasible in material informatics [22]. Rather, other machine
learning methods such as decision tree, random forest and support vector machine are
more prevalent till now [37].
1.2. Machine learning
Machine learning has recently received a lot of interests due to its ability to
predict materials properties from materials data. There are two categories of machine
learning: supervised and unsupervised learning. Unsupervised machine learning
algorithms classify the data based on similarity of features. These unsupervised
algorithms need a set of materials features in order to perform classification.
Unsupervised algorithms are typically utilized in classification (clustering) problems,
in which the target is to associate a particular material with a class of materials. There
are several unsupervised machine learning algorithms, like k-means clustering,
Gaussian mixtures model, and principal component analysis (PCA).
On the other hand, supervised machine learning algorithms could correlate a
feature set with materials labels (provided) with the ultimate target of correctly
predicting the labels from the feature set. The data features could be any properties that
describe a material system, e.g. material compositions, synthesis methods, morphology,
or other factors. Materials labels are the conclusion obtained through expert analysis or
from the measurements or calculations. Supervised machine learning algorithms are
sub-categorized into regression and classification algorithms. Regression algorithms
are used to predict continuous variables, while classification is used to assign a category

16
to each material. The classification algorithms generally work similarly to the
unsupervised algorithms. However, the main difference is that supervised classification
algorithms have access to the true class labels of materials during the training step,
while unsupervised algorithms automatically generate their class labels based on
feature similarity. Thus, it is natural that supervised algorithms tend to have better
classification accuracy since it adjusts the model to maximize the accuracy of the train
set. However, due to the adjustment to the train data, supervised classification also
suffers from bias and human error through the misclassification.
Due to the vast number of machine learning algorithms available, detailed
explanations will be given only for decision tree and random forest algorithms, which
are used in my research. Other, there are many algorithms, which include K-means
clustering, hierarchal clustering, and density-based spatial clustering, kernel ridge
regression (KRR), and support vector machines (SVM), LASSO, ridge regression.
Random forest and decision tree
The random forest algorithm is a method of supervised machine learning, which
was proposed by Tin Kam Ho [7]. This algorithm is based on the decision tree
algorithm, which has been known as a very popular classification technique. However,
decision tree is suffered from training bias and the model became easily over-learning.
In order to avoid this, random forest includes many decision trees and each tree has its
own bias, and vote all the tree results. By referring to the results of many trees, the bias
problem of decision tree is removed in random forest.
Decision tree is the basic unit of random forest. Decision tree is established from
a dataset using a process so-called binary recursive splitting, where a split occurs on a
particular feature at a specified value. Each individual location on the decision tree is

17
called a node, and nodes that do not split are called leaves (Figure 1.3). At the
beginning, decision tree selects a feature among all the available features that is best to
split at this position by using information entropy or Gini index. However, the exact
implementation depends on the variable is discrete (typically in classification
problems) or continuous (in regression problems).
Figure 1.3. A basic structure of decision tree.
For discrete variable, the information entropy of a feature is calculated as:
H(X) = −∑ P(xi)log2P(xi)ni=1 , where H(X) is the entropy of feature X, n is the sample
number described by feature X, P(xi) is the probability mass function of xi, and xi is the
individual feature value for sample i. To select the best feature, the information gain is
calculated as: IG(X) = H(X) − ∑ H(X|α)ni=1 , where IG is the information gain of
feature X, n is number of categories in feature X, and H(X|αi) is the information entropy
when feature X is used and split along the ith attribute of a. From the equation, feature
where obtained maximized information gain is selected to split. In the case of
continuous variable, the information entropy along the continuous set of value is
calculated by: H(X) = −∫P(x)ln(P(x))dx, where H(X) is the information entropy, x
is an individual feature, and P(X) is the probability function for feature x. However,

18
calculating the information gain for continuous variable is computationally complex
unlike discrete variable, because there are infinite split locations, rather than the finite
“bins” or categories encountered in the discrete case. To deal with this problem,
extremely randomized trees (ERT) algorithm is often utilized to create a set number of
equally spaced split locations and calculate the information gain for only these discrete
locations.
Next, stopping criteria needs to be consider for build a decision tree. This
criteria determines at what point the tree terminates the splitting process. There are
several approaches for stopping criteria. First, it is possible to building a full tree, when
all leaves node are contain a single sample (totally pure), however, this approach often
leads to significant over fitting for the decision tree, since machine memory the
connection between features and target variable rather than learning from the trends.
Another approach is the threshold tree, which uses a residual sum of squares (RSS)
approach to optimize the tree. The RSS, calculated as equation ∑ ∑ (𝑦𝑖 − �̂�𝑖)2
𝑖∈𝑅𝑗𝑗𝑗=1 ,
is the sum of the differences in each leaf node between the average value and each
individual sample value. In the case of building full decision tree, RSS equal to 0, since
all leaves nodes are pure so the average value would be the value of the sample. In this
approach, a threshold RSS is established, and the tree is constructed until that threshold
is reached. This approach generally performs better than the full tree, but threshold have
to be chosen carefully to prevent over fitting or under fitting. The third approach (called
cost complexity pruning) is frequently used to escape from the need of threshold
optimization. This approach initially build a full tree and then systematic evaluate the
splitting from the bottom up. Split which do not show the improvement of the accuracy
of predictions are pruned. This approach could significantly avoid the over fitting.

19
All of the implementations above are referred to as a top-down, greedy
approach. In other words, a decision tree algorithm does not search for a global
optimum; rather, the algorithm searches for the best binary split at each node (local
optimum), and uses the collection of local optima to make predictions. This decision
tree can suffer dramatically from high variance. Small variation in the training set can
result in the large variation in the tree architecture, and consequently, significantly
varies in the model predictions. Hence, the decision tree algorithm might not be a strong
predictor, but the creation of many decision trees, making prediction from reviewing
many decision trees leading to more accurate prediction and robust models. This is the
philosophy of random forest algorithm, which make the final predictions from
reviewing many decision trees. The idea of random forest is shown in Figure 1.4, where
each decision tree have a different results of prediction and the average prediction of
each decision tree is contributed to the final conclusion of random forest.
Figure 1.4. Example of the random forest algorithm ensemble approach. An
ensemble of decision trees are created and used to generate an overall prediction for the
algorithm.
1.3. High-throughput experimentation

20
Catalysis appears in all aspects of industrially process. Nowadays, even many
catalysts have been invented for industrial application; research always motivates
themselves to develop a novel catalyst with the ultimate aim reducing of more and more
the cost, time, and energy for production. However, catalyst finding has mostly
depended on the trial–and–error process, which is time–consuming and relies on
serendipity. With the increasing demand for reducing time to release to market, an
effective methods for catalyst development need be considered. High–throughput
experimentation, which promises to speed up the discovery and development processes,
has evolved rapidly during the last decade.
The catalyst preparation is a crucial step for the success for high–throughput
screening. Preparation time is a pre-requisite component for HTS. The key for
accelerating catalyst synthesis is to use a straightforward method such as impregnation
and precipitation. These methods can be scaled up relatively quickly to numerous
samples per day. In addition, the introduction of synthetic robots that can contribute
greatly for enhancing the catalyst preparation process. The automation could
significantly increase the synthesis throughput, otherwise, minimizing the mistake
taken by human errors.
Another concern in high–throughput experimentation topics is the bottleneck of
catalyst evaluation. While the catalyst preparation could be achieved numerous
catalysts per day, the high-throughput screening (HTS) technique must take some effort
to catch up that quantity. The common techniques for product evaluation are
chromatography and spectroscopy. The key advantage of chromatography is high
sensitivity, it is highly time–consuming. For example, if the product can be determined
in five minutes using GC, it costs over five hours to analyze all 64 reactors [38].
Conversely, spectroscopic analysis enjoys the high speed screening but requires of

21
multivariate calibrati,n or deconvolution to obtain the concentrations of individual
component. However, despite several weakness, spectroscopic analysis (IR and mass
spectrometry) are now mature and frequently applied in HTS [39-41] in the various
catalytic reaction such as OCM, coupling of methane with ammonia or aldol
condensation of acetone . For example, mass spectrometry enables to obtain catalyst
finding with capacity up to 80 catalysts per round. However, they only reported for
catalyst information, while a few reaction conditions are measured. As catalyst
performance is process dependent, reaction conditions is deemed to as crucial as
catalyst information.
1.4. Catalysts informatics
Heterogeneous catalysis plays a vital role over 70% industrial chemical
processes and greatly contributes to the global GDP [42]. Consequently, catalyst
discovery and optimization greatly help to boost process efficiency, thus reducing the
prices of the products and environmental footprints of the production [42]. The
discovery and optimization process has been dominantly taken place via an Edisonian
trial-and-error approach, which has been most successful yet costly and slow
[37,43,44]. The speed of catalyst discovery and optimization could be expedited by
more intelligent approaches such as design of experiments (DOE) and high-throughput
experimentation [45]. Advances in computer infrastructures resulted in the
breakthrough in computational techniques such as density functional theory (DFT),
which allows implementation of in-silico catalyst design. Each of these techniques
could accelerate catalyst discovery over the traditional Edisonian approach.

22
Another avenue for catalyst discovery that has gained popularity recently is
machine learning [46]. Much similar to materials informatics, the application of
machine learning for giving a better understating on a catalyst system or predicting new
catalysts is called catalyst informatics. One of the earliest examples of catalysts
informatics is related to the application of artificial neural networks (ANN) and genetic
algorithms (GA) to experimental catalysis data [47]. Following this, due to the
development of computational catalysis, many machine learning algorithms were
applied for speeding up the catalyst finding and knowledge extraction from DFT
databases. The purposes of these studies are to efficiently identify the most likely
reaction mechanisms for CO hydrogenation [48], to discover more selective catalysts
for chiral reactions, to learn atomistic potentials, and to predict the performance of
catalysts [49]. Till now, most of efforts in the implementation of catalyst informatics
have been limited to computational datasets, as they can be obtained in a very quick
and consistent manner [37]. However, as stated in 1.1.2, computational datasets lack
consideration of process conditions. This is more than critical for predicting catalysts,
which are integral components of chemical processes and quite sensitive to process
conditions. Therefore, this thesis focuses exclusively on the developments in
experimental catalysis.
One of the earliest examples of catalysis informatics was reported in 1994 by
Kito et al. [37]. They used an ANN to predict the product yield in oxidative
hydrogenation of ethylbenzene when the surface area, the amount of a catalyst, and
other catalyst materials information such as ionic radius, electronegativity, and standard
heat of formation of oxides were given as the input. They training set contained the data
of 18 promoted/unpromoted SnO2 catalysts. Such severe restriction in the parametric

23
space was suitable for accurate prediction within interpolation but not adequate for the
discovery of new catalyst compositions.
Following these pioneering paper, many research groups tried to explore
catalyst informatics in optimizing the experimental conditions, and catalyst
compositions, e.g. Sasaki et. al [50], Hou et al. [51]., Holena and Baerns [52-55] for
NO decomposition, propane ammoxidation reaction, dehydrogenation of ethane
(ODHE) to ethylene. However, these models only memorized the performance of the
given compositions (i.e. data interpolation) rather than learned from the data, and thus,
the prediction outside the training set gave poor results. The problems may come from
the limited data size and the materials diversity.
More recent studies in catalyst informatics have focused on the past literature
data to predict new catalysts. The Yildirim group made a statistical analysis of literature
data for trans-esterification reactions using an ANN and a decision tree. 1324 data
points were collected from 31 experimental publications [56]. Based on the decision
tree and ANN analysis, they found that the most important variable for high conversion
was the reaction time, and the other descriptors such as the catalyst loading, reactant
amount, temperature, and type of supports exhibited only less than 10% relative
importance.
Another effort by the same Yildirim group was on the collection of literature
data for CO oxidation over Cu- and Au-based catalysts [57,58]. An ANN model well
predicted within the data-rich regions, whereas the prediction was unfeasible in the
other sparse regions. The Yildirim group also collected 4360 experimental data points
on the Pt- or Au-catalyzed water gas shift reaction (WGS), which converts CO and H2O
to CO2 and H2 [59]. The dataset was studied using several data mining tools to extract

24
knowledge: Decision trees, ANNs and support vector machines. In particular, i)
decision trees were utilized to comprehend the empirical rules and conditions for high
CO conversion, and ii) ANN and support vector machines were used to assess the
relative importance of a variety of experimental variables and their effects on the
catalytic activity.
1.5. Oxidative coupling of methane
Methane, which is deemed as the major constituent of natural gas, is mostly
being used for heating and for the production of electricity [60]. In some aspects,
methane is a good fuel because of generating the highest heat of combustion regarded
to the amount of CO2 formed, among a wide ranges of hydrocarbons. Besides, methane
is an under-utilized resource for producing chemicals and liquid fuels [39]. Known
resources of natural gas are abundant and can be compete with liquid petroleum.
Moreover, the known reserves of methane are increasing more rapidly than those of
liquid petroleum. Methane are mostly found in located area, which is far away from
industrial complexes [61]. This means its high cost for transportation is uneconomical.
Transportation issues and the surging oil price have resulted in the great efforts for
converting methane into easy transportable (methanol) and value-added products, such
as ethylene (feedstock for petrochemicals), aromatics and liquid hydrocarbon fuels.
One promising reaction to convert methane into C2 building blocks is the oxidative
coupling of methane (OCM), which was first published by Keller and Bhasin in 1982
[49].

25
1.5.1. Reaction mechanism of OCM
In the OCM process the following reactions occur simultaneously or
sequentially [62,63]:
2CH4 + 0.5O2 → C2H6 + H2O (1)
C2H6 + 0.5O2 → C2H4 + H2O (2)
C2H6 → C2H4 + H2 (3)
CH4 + 2O2 →CO2 + 2H2O (4)
CH4 + 1.5O2 → CO + 2H2 O (5)
C2H6, C2H4, H2 + O2 → CO, CO2, water (6)
The reaction starts with the coupling of methane to ethane (1). After that,
ethylene is formed by either oxidative or non-oxidative dehydrogenation of ethane
(2,3), while the reaction (3) occurs at a much rate than (2). The oxidative reactions (1)
and (2) are slightly exothermic, and the combustion reactions (2), (4) and (5) are
extremely exothermic, results in the excessive heat formation in the OCM process.
Although the gas-phase free radical process plays a crucial role in the overall process,
the contribution of a catalyst is significant. According to literature, methane
dehydrogenates on surfaces of catalysts to form methyl radicals that can react on the
surfaces or in the gas phase. The abstraction of a hydrogen atom is caused by oxygen
atoms on the surfaces of the catalyst. Besides the efficient formation of methyl radicals,
coupling of the radicals is also a key. It is true that coupling of CH3• radicals takes place
in the gas phase [64]. Several catalyst and reactor designs have been utilized.

26
1.5.2. Catalyst for OCM
Since the first reports by Keller and Bhasin [65] as well as by Hinsen and Baerns
[66] in early 1980s, around 2300 publications have been published about OCM in
literature. As reported in Ref. [60], about 50% of the publications was made in the first
decade of the 30 years history of OCM, and then quickly lost attention after that. This
is because no catalyst was found to meet an industrial target (C2 yield higher than 30%
using non-diluted reaction feeds and single pass reactor) [67]. Nevertheless, from 2000
to 2005, due to the newly discovery of huge reserves shale gas as well as due to the
forecasted shortage of oil reserves, the OCM comes again as a hot topic. The
Kondratenko group listed the recent progress of OCM catalysts, and depicted the
published data on C2 selectivity against methane conversion obtained over various
catalysts under various reaction conditions [47]. They pointed out only four data points
could achieve over 30% C2 yield, however, all the four data points came from either a
special reactor or an unstable catalyst, i.e. practically infeasible [60].
A numerous number of catalysts with and without supports have been evaluated
for the OCM reaction with the target to explore active and stable catalysts. Table 1.1
shows the overview of the best-known performant catalysts, together with the reported
values of the C2 yield, the C2 selectivity, temperature, CH4/O2, and lifetime. Note that
direct comparison among the catalysts is not straightforward because various reactor
configurations and reaction conditions were used among different research groups [68-
71].
Table 1.1. List of best-known OCM catalysts.
Catalyst Temperature
(°C)
CH4/O2/diluent
(mol/mol/mol)
C2 yield
(%)
C2 selectivity
(%)
Lifetime
(h)
Eu2O3 [69] 725 6.7:1:0 17.7 72.4 n.d.
Ce/La2O3 [69] 775 4–5:1:0 22.3 66 n.d.
Li/MgO [70] 750 4:01:00 19 65 <100
La–Ce/MgO [69] 850 4–5:1:0 16.1 72.4 >10

27
Mn–Na2WO4/SiO2
[71,72] 800/850 various 20 80 >100
The Mn–Na2WO4/SiO2 system was an excellent catalyst in terms of high
activity and good stability. It was also called the highest effective catalyst in literature
from a review of Lunsford [62]. Other systems that have comparable activity show the
lack of stability, or not reported. The optimum temperature is about 800°C is for most
of the catalysts. Diluting reactant with an inert gas (He, Ar, or N2) show better
performance as gas-phase reactions are contributed less.
1.5.3. Catalysts informatics studies for OCM
Following the rise of catalysts informatics, Zavyalova et al. made statistical
analysis of literature OCM data collected from 343 references and amounting to 1800
data points. Their aim was to find out optimal compositions of catalysts in terms of the
C2 yield [68]. Statistics analysis using various parameters such as the composition,
process conditions, and the fabrication method withdrew hints for catalyst design, like
“combining Mg or La with Cl positively affects the C2 yield”. This study was next
followed by the report by Kondratenko et al., which was based on a neural network of
a radial basis function (RBF) type and a traditional quadratic response surface to find
out the optimum OCM catalysts [72]. They found that the RBF model provided higher
accuracy more often than the quadratic response surface model. They also encountered
a great difficulty in predicting catalysts from literature data due to the sparsity of the
data: The catalysts were prepared based on different methods, and their performance
was evaluated in different reaction conditions. To deal with these problems, the authors
decided to ignore variation in the reaction and synthesis conditions, and instead to

28
consider only the catalyst composition. Another efforts on the implementation of
catalyst informatics were reported by Takahashi et al. Based on the 1800 literature data
and random forest classification, they predicted 56 undiscovered OCM catalysts
expected to achieve the C2 yield over 30% at their respective optimum conditions (yet
not experimentally validated) [32]. They also noted that the literature data is quite noisy
and not consistent in terms of the exerimental setup and its methodology, the type of
catalysts, etc. Hence the implementation of regression was found to be nearly
impossible.
The above-reviewed works are regarded the best representatives of the studies
of the catalysts informatics for practical catalysis, such as OCM. It is seen that most of
such catalyst informatics studies employed datasets acquired from literature: They
suffer from severe scarcity, inconsistency, and human biases, which prevent the
implementation of catalyst informatics as well as the prediction of breakthrough
catalysts thereby. Thus, I conclude that the creation of systematic and bias-free datasets
is the most important first step for the implementation of catalysts informatics.
1.6. Purpose of the Present Research
Catalyst informatics has emerged as an attractive field, which expects to bring
irreversible change in the research and development of materials science. While the
data mining and analysis tools have been well-developed, the implementation of
catalysts informatics is bottlenecked by the lack of systematic and bias datasets. In this
thesis, I set my focus on breaking-through this bottleneck and exploiting the true
potential of catalyst informatics based on the acquisition of a systematic and bias-free
dataset with high-throughput experimentation. The concept was proven by taking the

29
OCM reaction as a case study, which is a long researched reaction toward yet
unsuccessful industrialization.
The first step to achieve my ultimate purpose is to develop the high-throughput
screening (HTS) instrument for the evaluation of OCM catalysts. In Chapter 2, I
successfully developed such a instrument, which enables to produce a systematic
dataset with the capacity up to 4300 data/day under a parametric space of materials and
process conditions in a fully automated fashion. It was proven that the HTS instrument
can provide a machine-learnable dataset consisting of over 12,000 data points in a few
days, and such a dataset is indeed very powerful to extract the knowledge about
catalysis and performance improvement.
In Chapter 3, I investigated a hypothesis that was derived from catalyst
informatics in Chapter 2. In detail, factors affecting the OCM performance of supported
Mn‒Na2WO4 were clarified based on the high-throughput screening and multilateral
characterization.
In Chapter 4, I demonstrated a non-empirical exploration of new catalysts for
OCM reaction with the aid of random sampling of a huge materials space and catalyst
informatics. Here, 300 M1‒M2‒M3/Support catalysts were prepared and evaluated for
the OCM reaction. Thus obtained bias-free dataset was deeply analyzed to successfully
extract generalized rules of combinatorial catalyst design.
Based on all of the above-explained researches and achievements, I believe the
thesis made a critical progress in the field of catalyst informatics.

30
References
[1] A. Agrawal, A. Choudhary, Perspective: Materials informatics and big data: Realization of
the “fourth paradigm” of science in materials science, APL Mater., 4 (2016) 053208.
[2] M.I. Jordan, T.M.J.S. Mitchell, Machine learning: Trends, perspectives, and prospects, 349
(2015) 255-260.
[3] Y. Liu, T. Zhao, W. Ju, S. Shi, Materials discovery and design using machine learning, J
Materiomics, 3 (2017) 159-177.
[4] R. Ramprasad, R. Batra, G. Pilania, A. Mannodi-Kanakkithodi, C. Kim, Machine learning
in materials informatics: recent applications and prospects, Npj Comput. Mater., 3 (2017) 1-13.
[5] F. Oviedo, Z. Ren, S. Sun, C. Settens, Z. Liu, N.T.P. Hartono, S. Ramasamy, B.L. DeCost,
S.I.P. Tian, G. Romano, A. Gilad Kusne, T. Buonassisi, Fast and interpretable classification of
small X-ray diffraction datasets using data augmentation and deep neural networks, Npj
Comput. Mater., 5 (2019) 60.
[6] H. Ding, I. Takigawa, H. Mamitsuka, S. Zhu, Similarity-based machine learning methods
for predicting drug–target interactions: a brief review, Brief. Bioinform., 15 (2014) 734-747.
[7] T.K. Ho, Random decision forests, Proceedings of 3rd international conference on
document analysis and recognition, IEEE, 1995, pp. 278-282.
[8] L. Ward, C. Wolverton, Atomistic calculations and materials informatics: A review, Curr.
Opin. Solid State Mater. Sci., 21 (2017) 167-176.
[9] R.O. Jones, Density functional theory: Its origins, rise to prominence, and future, Rev. Mod.
Phys., 87 (2015) 897-923.
[10] W. Setyawan, S. Curtarolo, High-throughput electronic band structure calculations:
Challenges and tools, Comput. Mater. Sci., 49 (2010) 299-312.

31
[11] P.L. Freddolino, F. Liu, M. Gruebele, K. Schulten, Ten-microsecond molecular dynamics
simulation of a fast-folding WW domain, Biophys. J., 94 (2008) L75-L77.
[12] T.C. Germann, K. Kadau, Trillion-atom molecular dynamics becomes a reality, Int. J. Mod.
Phys. C, 19 (2008) 1315-1319.
[13] J.J. de Pablo, N.E. Jackson, M.A. Webb, L.-Q. Chen, J.E. Moore, D. Morgan, R. Jacobs,
T. Pollock, D.G. Schlom, E.S. Toberer, New frontiers for the materials genome initiative, Npj
Comput. Mater., 5 (2019) 41.
[14] S. Kirklin, J.E. Saal, B. Meredig, A. Thompson, J.W. Doak, M. Aykol, S. Rühl, C.
Wolverton, The Open Quantum Materials Database (OQMD): assessing the accuracy of DFT
formation energies, Npj Comput. Mater., 1 (2015) 1-15.
[15] C. Draxl, M. Scheffler, NOMAD: The FAIR concept for big data-driven materials science,
MRS Bull., 43 (2018) 676-682.
[16] S. Curtarolo, W. Setyawan, G.L.W. Hart, M. Jahnatek, R.V. Chepulskii, R.H. Taylor, S.
Wang, J. Xue, K. Yang, O. Levy, AFLOW: an automatic framework for high-throughput
materials discovery, Comput. Mater. Sci., 58 (2012) 218-226.
[17] T.D. Huan, A. Mannodi-Kanakkithodi, R. Ramprasad, Accelerated materials property
predictions and design using motif-based fingerprints, Phys. Rev. B, 92 (2015)
014106(014101)- 014106(014109).
[18] M. Fernandez, N.R. Trefiak, T.K. Woo, Atomic property weighted radial distribution
functions descriptors of metal–organic frameworks for the prediction of gas uptake capacity, J.
Phys. Chem. C, 117 (2013) 14095-14105.
[19] M. Fernandez, P.G. Boyd, T.D. Daff, M.Z. Aghaji, T.K. Woo, Rapid and accurate machine
learning recognition of high performing metal organic frameworks for CO2 capture, J. Phys.
Chem, 5 (2014) 3056-3060.

32
[20] Y.M. Arisoy, T. Özel, Machine learning based predictive modeling of machining induced
microhardness and grain size in Ti–6Al–4V alloy, Mater. Manuf., 30 (2015) 425-433.
[21] K. Kim, L. Ward, J. He, A. Krishna, A. Agrawal, C. Wolverton, Machine-learning-
accelerated high-throughput materials screening: Discovery of novel quaternary Heusler
compounds, Phys. Rev. Mater., 2 (2018) 123801.
[22] K. Takahashi, L. Takahashi, I. Miyazato, J. Fujima, Y. Tanaka, T. Uno, H. Satoh, K. Ohno,
M. Nishida, K. Hirai, J. Ohyama, T.N. Nguyen, S. Nishimura, T. Taniike, The rise of catalyst
informatics: Towards catalyst genomics, ChemCatChem, 11 (2019) 1146-1152.
[23] Z.W. Ulissi, M.T. Tang, J. Xiao, X. Liu, D.A. Torelli, M. Karamad, K. Cummins, C. Hahn,
N.S. Lewis, T.F. Jaramillo, K. Chan, J.K. Nørskov, Machine-Learning Methods Enable
Exhaustive Searches for Active Bimetallic Facets and Reveal Active Site Motifs for CO2
Reduction, ACS Catal., 7 (2017) 6600-6608.
[24] Z. Li, X. Ma, H. Xin, Feature engineering of machine-learning chemisorption models for
catalyst design, Catal. Today, 280 (2017) 232-238.
[25] J. Hattrick-Simpers, C. Wen, J. Lauterbach, The Materials Super Highway: Integrating
High-Throughput Experimentation into Mapping the Catalysis Materials Genome, Catal. Lett.,
145 (2015) 290-298.
[26] M.L. Green, C.L. Choi, J.R. Hattrick-Simpers, A.M. Joshi, I. Takeuchi, S.C. Barron, E.
Campo, T. Chiang, S. Empedocles, J.M. Gregoire, Fulfilling the promise of the materials
genome initiative with high-throughput experimental methodologies, Appl. Phys. Rev., 4
(2017) 011105.
[27] A. Zakutayev, N. Wunder, M. Schwarting, J.D. Perkins, R. White, K. Munch, W. Tumas,
C. Phillips, An open experimental database for exploring inorganic materials, Sci. Data, 5
(2018) 180053.

33
[28] B. Meredig, C. Wolverton, Dissolving the periodic table in cubic zirconia: Data mining to
discover chemical trends, Chem. Mater., 26 (2014) 1985-1991.
[29] L. Ward, A. Agrawal, A. Choudhary, C. Wolverton, A general-purpose machine learning
framework for predicting properties of inorganic materials, Npj Comput. Mater., 2 (2016)
16028.
[30] X. Ma, Z. Li, L.E.K. Achenie, H. Xin, Machine-learning-augmented chemisorption model
for CO2 electroreduction catalyst screening, J. Phys. Chem, 6 (2015) 3528-3533.
[31] J.M. Serra, A. Chica, A. Corma, Development of a low temperature light paraffin
isomerization catalysts with improved resistance to water and sulphur by combinatorial
methods, Appl. Catal., A, 239 (2003) 35-42.
[32] K. Takahashi, I. Miyazato, S. Nishimura, J. Ohyama, Unveiling hidden catalysts for the
oxidative coupling of methane based on combining machine learning with literature data,
ChemCatChem, 10 (2018) 3223-3228.
[33] A.J. Medford, A. Vojvodic, J.S. Hummelshøj, J. Voss, F. Abild-Pedersen, F. Studt, T.
Bligaard, A. Nilsson, J.K. Nørskov, From the Sabatier principle to a predictive theory of
transition-metal heterogeneous catalysis, J. Catal., 328 (2015) 36-42.
[34] A.J. Chowdhury, W. Yang, E. Walker, O. Mamun, A. Heyden, G.A. Terejanu, Prediction
of adsorption energies for chemical species on metal catalyst surfaces using machine learning,
J. Phys. Chem. C, 122 (2018) 28142-28150.
[35] D.H. Wolpert, W.G. Macready, No free lunch theorems for optimization, IEEE Trans.
Evol. Comput., 1 (1997) 67-82.
[36] R. Kozma, C. Alippi, Y. Choe, F.C. Morabito, Artificial Intelligence in the Age of Neural
networks and Brain computing, Academic Press2018.
[37] A.J. Medford, M.R. Kunz, S.M. Ewing, T. Borders, R. Fushimi, Extracting knowledge
from data through catalysis informatics, ACS Catal., 8 (2018) 7403-7429.

34
[38] H.F.M. Boelens, D. Iron, J.A. Westerhuis, G. Rothenberg, Tracking chemical kinetics in
high‐throughput systems, Chem. Eur. J., 9 (2003) 3876-3881.
[39] L. Olivier, S. Haag, H. Pennemann, C. Hofmann, C. Mirodatos, A.C. van Veen, High-
temperature parallel screening of catalysts for the oxidative coupling of methane, Catal. Today,
137 (2008) 80-89.
[40] S. Moehmel, N. Steinfeldt, S. Engelschalt, M. Holena, S. Kolf, M. Baerns, U. Dingerdissen,
D. Wolf, R. Weber, M. Bewersdorf, New catalytic materials for the high-temperature synthesis
of hydrocyanic acid from methane and ammonia by high-throughput approach, Appl. Catal., A,
334 (2008) 73-83.
[41] H. Wang, Z. Liu, J. Shen, Quantified MS analysis applied to combinatorial heterogeneous
catalyst libraries, J. Comb. Chem., 5 (2003) 802-808.
[42] M. Boudart, Heterogeneous catalysis by metals, J. Mol. Catal., 30 (1985) 27-38.
[43] D. Xue, P.V. Balachandran, J. Hogden, J. Theiler, D. Xue, T. Lookman, Accelerated search
for materials with targeted properties by adaptive design, Nat. Commun., 7 (2016) 1-9.
[44] B. Cao, L.A. Adutwum, A.O. Oliynyk, E.J. Luber, B.C. Olsen, A. Mar, J.M. Buriak, How
to optimize materials and devices via design of experiments and machine learning:
Demonstration using organic photovoltaics, ACS nano, 12 (2018) 7434-7444.
[45] R.J. Hendershot, C.M. Snively, J. Lauterbach, High-Throughput Heterogeneous Catalytic
Science, Chem. Eur. J., 11 (2005) 806-814.
[46] Z. Li, S. Wang, H. Xin, Toward artificial intelligence in catalysis, Nat. Catal., 1 (2018)
641-642.
[47] T. Williams, K. McCullough, J.A. Lauterbach, Enabling catalyst discovery through
machine learning and high-throughput experimentation, Chem. Mater., (2019).

35
[48] Z.W. Ulissi, A.J. Medford, T. Bligaard, J.K. Nørskov, To address surface reaction network
complexity using scaling relations machine learning and DFT calculations, Nat. Commun., 8
(2017) 1-7.
[49] Z. Li, S. Wang, W.S. Chin, L.E. Achenie, H. Xin, High-throughput screening of bimetallic
catalysts enabled by machine learning, J. Mater. Chem. A, 5 (2017) 24131-24138.
[50] M. Sasaki, H. Hamada, Y. Kintaichi, T. Ito, Application of a neural network to the analysis
of catalytic reactions Analysis of NO decomposition over Cu/ZSM-5 zeolite, Appl. Catal., A,
132 (1995) 261-270.
[51] Z.Y. Hou, Q. Dai, X.Q. Wu, G.T. Chen, Artificial neural network aided design of catalyst
for propane ammoxidation, Appl. Catal., A, 161 (1997) 183-190.
[52] U. Rodemerck, D. Wolf, O.V. Buyevskaya, P. Claus, S. Senkan, M. Baerns, High-
throughput synthesis and screening of catalytic materials: Case study on the search for a low-
temperature catalyst for the oxidation of low-concentration propane, Chem. Eng. J., 82 (2001)
3-11.
[53] D. Wolf, O.V. Buyevskaya, M. Baerns, An evolutionary approach in the combinatorial
selection and optimization of catalytic materials, Appl. Catal., A, 200 (2000) 63-77.
[54] M. Holeňa, M. Baerns, Feedforward neural networks in catalysis: a tool for the
approximation of the dependency of yield on catalyst composition, and for knowledge
extraction, Catal. Today, 81 (2003) 485-494.
[55] U. Rodemerck, M. Baerns, M. Holena, D. Wolf, Application of a genetic algorithm and a
neural network for the discovery and optimization of new solid catalytic materials, Appl. Surf.
Sci., 223 (2004) 168-174.
[56] N. Alper Tapan, R. Yıldırım, M. Erdem Günay, Analysis of past experimental data in
literature to determine conditions for high performance in biodiesel production, Biofuels,
Bioproducts and Biorefining, 10 (2016) 422-434.

36
[57] M.E. Günay, R. Yildirim, Knowledge extraction from catalysis of the past: a case of
selective CO oxidation over noble metal catalysts between 2000 and 2012, ChemCatChem, 5
(2013) 1395-1406.
[58] M.E. Gunay, R. Yildirim, Neural network analysis of selective CO oxidation over copper-
based catalysts for knowledge extraction from published data in the literature, Ind. Eng. Chem.
Res., 50 (2011) 12488-12500.
[59] Ç. Odabaşı, M.E. Günay, R. Yıldırım, Knowledge extraction for water gas shift reaction
over noble metal catalysts from publications in the literature between 2002 and 2012, Int. J.
Hydrog. Energy, 39 (2014) 5733-5746.
[60] E.V. Kondratenko, T. Peppel, D. Seeburg, V.A. Kondratenko, N. Kalevaru, A. Martin, S.
Wohlrab, Methane conversion into different hydrocarbons or oxygenates: current status and
future perspectives in catalyst development and reactor operation, Catal. Sci. Technol., 7 (2017)
366-381.
[61] H. Liu, X. Wang, D. Yang, R. Gao, Z. Wang, J. Yang, Scale up and stability test for
oxidative coupling of methane over Na2WO4-Mn/SiO2 catalyst in a 200 mL fixed-bed reactor,
J. Nat. Gas Chem., 17 (2008) 59-63.
[62] J.H. Lunsford, Catalytic conversion of methane to more useful chemicals and fuels: a
challenge for the 21st century, Catal. Today, 63 (2000) 165-174.
[63] R. Spinicci, P. Marini, S. De Rossi, M. Faticanti, P. Porta, Oxidative coupling of methane
on LaAlO3 perovskites partially substituted with alkali or alkali-earth ions, J. Mol. Catal. A:
Chem., 176 (2001) 253-265.
[64] J. Sun, J.W. Thybaut, G.B. Marin, Microkinetics of methane oxidative coupling, Catal.
Today, 137 (2008) 90-102.
[65] G.E. Keller, M.M. Bhasin, Synthesis of ethylene via oxidative coupling of methane: I.
Determination of active catalysts, J. Catal., 73 (1982) 9-19.

37
[66] W. Hinsen, M. Baerns, Oxidative coupling of methane to C2 hydrocarbons in the presence
of different catalysts, Chem. Inform., 14 (1983).
[67] B.L. Farrell, V.O. Igenegbai, S. Linic, A Viewpoint on Direct Methane Conversion to
Ethane and Ethylene Using Oxidative Coupling on Solid Catalysts, ACS Catal., 6 (2016) 4340-
4346.
[68] U. Zavyalova, M. Holena, R. Schlögl, M. Baerns, Statistical analysis of past catalytic data
on oxidative methane coupling for new insights into the composition of high-performance
catalysts, ChemCatChem, 3 (2011) 1935-1947.
[69] T.V. Choudhary, D.W. Goodman, CO-free fuel processing for fuel cell applications, Catal.
Today, 77 (2002) 65-78.
[70] S. Arndt, T. Otremba, U. Simon, M. Yildiz, H. Schubert, R. Schomäcker, Mn-
Na2WO4/SiO2 as catalyst for the oxidative coupling of methane. What is really known?, Appl.
Catal., A, 425-426 (2012) 53-61.
[71] M. Yildiz, Y. Aksu, U. Simon, T. Otremba, K. Kailasam, C. Göbel, F. Girgsdies, O. Görke,
F. Rosowski, A. Thomas, R. Schomäcker, S. Arndt, Silica material variation for the MnxOy-
Na2WO4/SiO2, Appl. Catal., A, 525 (2016) 168-179.
[72] E.V. Kondratenko, M. Schlüter, M. Baerns, D. Linke, M. Holena, Developing catalytic
materials for the oxidative coupling of methane through statistical analysis of literature data,
Catal. Sci. Technol., 5 (2015) 1668-1677.

38
Chapter 2
High-throughput experimentation and catalyst informatics for
oxidative coupling of methane

39
Abstract: The presence of a dataset that covers a parametric space of materials and
process conditions in a process-consistent manner is essential for the realization of
catalyst informatics. Here, an important piece of progress is demonstrated for oxidative
coupling of methane. A high-throughput screening instrument is developed for enabling
an automatic performance evaluation of 20 catalysts in 216 reaction conditions. This
affords an OCM dataset comprised of 12708 data points for 59 catalysts in three
successive operations. Based on a variety of data visualization analysis, important
insights on catalysis and catalyst design are successfully extracted. In particular,
simultaneous optimization of the catalyst and reactor design is found to be essential for
improving the C2 yield. The consistent dataset allows the accurate prediction of the C2
yield with the aid of non-linear supervised machine learning.
Keywords: High-throughput experimentation, Catalyst informatics, Oxidative
coupling of methane, Machine learning, Data visualization

40
2.1. Introduction
Materials informatics (MI) is one rising area of materials science. It applies
data-oriented approaches with expectation to bring irreversible change in the research
and development of materials science [1–3]. The prerequisite of MI is the presence of
a proper dataset in terms of consistency, distribution, and size [2]. Once such a dataset
is prepared, an appropriate learning method is selected from the toolbox [4,5].
Tremendous efforts made in this emerging field of study have highlighted key
challenges specific to materials. In particular, the most important challenge is on the
data themselves [6]. Despite the growing accumulation of materials data in literature,
the availability of proper datasets is often limited. This is partly because many materials
properties are process dependent (e.g. mechanical properties of polymers, activities of
catalysts), while researchers employ their own protocols and conditions. Another
difficulty derives from the complicated structures of materials [7]. Properties of solid
materials depend not only on their chemical structure but also on structures/morphology
of different scales such as higher-order structures of polymers, grain boundaries, pores
of inorganic materials, etc [8]. This multivariate dependence has been often neglected
in conventional x,y structure-performance studies, where potentially important but un-
focused features are even un-reported. These problems likely do not affect conclusions
in individual literature, but when collected, can result in an inconsistent and sparse
dataset.
The problem of process dependence is maximized when MI is employed in the
development of catalysts, i.e. integral component of chemical processes. Here, the
problem is briefly illustrated by taking oxidative coupling of methane (OCM) as an
example. The OCM is an important class of reactions in terms of the abundance of
methane and its direct upgrading without mediating syngas. A wide variety of catalysts

41
have been explored to address a conversion-selectivity tradeoff that arises from the poor
reactivity of methane with respect to desired products [9,10]. In 2011, Zavyalova et al.
collected 1870 OCM literature data of the past three decades [11], which assessed both
positive and negative aspects of catalyst informatics. The negative aspects are seen to
relate to the dataset directly. First, the dataset size is insufficient with respect to the
parametric space (a multidimensional space spanned by catalyst features and process
conditions). Second, past research has more or less focused on a few to several catalyst
systems such as Mn-Na2WO4/SiO2, Li/MgO, and La-Sr/CaO. This concentration,
together with the deviation of process windows among different catalyst systems, leads
to heavily biased sampling [12]. Third, differences in reactor design and temperature
protocol among literature can introduce deviation in the resultant performance even
when the same catalyst is employed. The total heat balance becomes impactful for
largely exothermic/endothermic reactions and when a few-percentage improvement is
regarded significant. For example, the best-of-literature C2 yield of the Mn-
Na2WO4/SiO2 OCM catalyst varied from 16.0 to 26.4% in a typical fixed-bed reactor
configuration [11,13,14]. Lastly, desire for positive data has resulted in the burial of an
enormous quantity of so-called poor data, which can potentially provide good insights
for researchers as well as machines [12,15]. In a recent publication, a negative impact
of such anthropogenic biases is discussed. The anthropogenic biases make data
distribution highly disproportionate, and this leads to the prediction outcome inferior to
random sampling in the amine-templated synthesis of crystalline metal oxides [16]. To
be important, the research field of OCM is regarded rather saturated and therefore the
dataset problem is believed to be common in other catalysis. On the basis of the above
discussions, high-throughput experimentation is proposed as a key issue of catalyst
informatics to produce a proper catalyst dataset on-demand under unified process

42
conditions [17,18]. In this chapter, I report an important piece of progress for the
implementation of catalyst informatics, which includes:
i) Development of a high-throughput screening (HTS) instrument: The
instrument realizes automatic performance evaluation of 20 catalysts at a series of
predefined conditions in fixed-bed reactors. This affords a few thousand catalyst data
per day in a process-consistent manner.
ii) Creation of an OCM dataset: A consistent OCM dataset (12708 data) was
produced for Mn-Na2WO4/SiO2-type catalysts. The catalysts varied in the elements of
active phases, support type, and chemical composition. The performance of 59 catalysts
(including reference materials) was evaluated at different feed compositions, contact
times, and temperatures.
iii) Open database: The above-mentioned dataset is uploaded in a web platform
"Catalyst Acquisition by Data Science (CADS)" for shared usage [19].
iv) Machine learning: It signified the importance of a consistent dataset for
achieving reliable prediction. A model based on random forest regression accurately
described the dependence of the C2 yield on reaction conditions via interpolation filling
.

43
2.2. Experimental and analytical details
2.2.1. Catalyst library
Table 2.1 shows the catalyst library used in this chapter. Among the 59 entries,
40 were derived from Mn-Na2WO4/SiO2, one of the most effective catalysts for OCM.
They are represented in the form of M1-M21-2M3O4/support. M1 was picked up from
a wide range of transition metal and lanthanide elements; M2 and M3 came from
commercially available tungstates or molybdates; supports were selected from
commonly used materials. The metal loadings to a unit gram of a support were fixed at
0.371 mmol for M1, 0.370 or 0.185 mmol for M2 (depending on the valence), and 0.185
mmol for M3. These correspond to the optimum composition for Mn-Na2WO4/SiO2 in
literature [20–22]. The remaining 19 entries are reference samples, which include blank
(no catalyst material), bare supports, and samples that lack one or two metallic
components from Mn-Na2WO4/SiO2.
The catalysts were prepared based on a co-impregnation method [20,21]. 1.0 g
of a support was impregnated with 4–5 mL of an aqueous solution of specified metal
precursors at 50 °C for 6 hours. After vacuum drying at 110 °C, the product was
calcined at 1000 °C under air for 3 hours to yield a catalyst. When a water-sensitive
metal alkoxide was employed, the impregnation was sequentially performed in the
order of an aqueous solution of a tungstate and an ethanol solution of a metal alkoxide.
The obtained catalysts were thoroughly ground before any usage. The catalyst
preparation was appropriately parallelized with the aids of a parallel hot stirrer (Reacti-
Therm, Thermo Scientific) and a centrifugal evaporator (CVE-3100, Eyela). 20
catalysts were produced in one batch. The samples were characterized by X-ray

44
diffraction (XRD) and scanning electron microscopy (SEM). These results are
shown in Figures 2.1 and 2.2.
Mn-
Na2WO4/BN
Mn-
Na2WO4/MgO
Mn-
Na2WO4/Al2O3
Mn-
Na2WO4/SiO2
Mn-
Na2WO4/SiC
Mn-
Na2WO4/SiCnf
Mn-
Na2WO4/BEA
Mn-
Na2WO4/ZSM-
5
Mn-
Na2WO4/TiO2
Mn-
Na2WO4/ZrO2
Mn-
Na2WO4/Nb2O5

45
Mn-
Na2WO4/CeO2
Mn-
Li2WO4/SiO2
Mn-
MgWO4/SiO2
Mn-
K2WO4/SiO2
Mn-
CaWO4/SiO2
Mn-
SrWO4/SiO2
Mn-
BaWO4/SiO2
Mn-
Li2MoO4/SiO2
Mn-
Na2MoO4/SiO2
Mn-
K2MoO4/SiO2
Mn-
FeMoO4/SiO2
Mn-
ZnMoO4/SiO2
Ti-
Na2WO4/SiO2

46
V-
Na2WO4/SiO2
Fe-
Na2WO4/SiO2
Co-
Na2WO4/SiO2
Ni-
Na2WO4/SiO2
Cu-
Na2WO4/SiO2
Zn-
Na2WO4/SiO2
Y-
Na2WO4/SiO2
Zr-
Na2WO4/SiO2
Mo-
Na2WO4/SiO2
Pd-
Na2WO4/SiO2
La-
Na2WO4/SiO2
Ce-
Na2WO4/SiO2
Nd-
Na2WO4/SiO2

47
Eu-
Na2WO4/SiO2
Tb-
Na2WO4/SiO2
Hf-
Na2WO4/SiO2
BN
MgO
Al2O3
SiO2
SiC
SiCnf
BEA
ZSM-5
TiO2
ZrO2

48
Nb2O5
CeO2
Na2WO4/SiO2
Mn-WOx/SiO2
Mn-MoOx/SiO2
Mn-Na/SiO2
WOx/SiO2
Na/SiO2
Figure 2.1. SEM images of catalyst samples. The scale bars are applied to individual
columns. Micrographs were acquired on JCM-6000Plus NeoScope operated at an
acceleration voltage of 15 kV.

49

50
Figure 2.2. XRD patterns of catalyst samples (except bare supports). The XRD patterns
were recorded on Rigaku SMARTLAB using Cu Kα (1.5418 Å) radiation. A step scan
mode was employed in the 2θ range of 5–90° at the step size of 0.008°.

51
Table 2.1. List of catalysts. Catalyst name Precursor Supporta M1b M2b M3b
Mn-Na2WO4/BN Mn(NO3)2·6H2O, Na2WO4 BN Mn (40) Na (40) W (20)
Mn-Na2WO4/MgO Mn(NO3)2·6H2O, Na2WO4 MgO Mn (40) Na (40) W (20)
Mn-Na2WO4/Al2O3 Mn(NO3)2·6H2O, Na2WO4 Al2O3 Mn (40) Na (40) W (20)
Mn-Na2WO4/SiO2 Mn(NO3)2·6H2O, Na2WO4 SiO2 Mn (40) Na (40) W (20)
Mn-Na2WO4/SiC Mn(NO3)2·6H2O, Na2WO4 SiC Mn (40) Na (40) W (20)
Mn-Na2WO4/SiCnf Mn(NO3)2·6H2O, Na2WO4 SiCnf Mn (40) Na (40) W (20)
Mn-Na2WO4/BEA Mn(NO3)2·6H2O, Na2WO4 BEA Mn (40) Na (40) W (20)
Mn-Na2WO4/ZSM-5 Mn(NO3)2·6H2O, Na2WO4 ZSM-5 Mn (40) Na (40) W (20)
Mn-Na2WO4/TiO2 Mn(NO3)2·6H2O, Na2WO4 TiO2 Mn (40) Na (40) W (20)
Mn-Na2WO4/ZrO2 Mn(NO3)2·6H2O, Na2WO4 ZrO2 Mn (40) Na (40) W (20)
Mn-Na2WO4/Nb2O5 Mn(NO3)2·6H2O, Na2WO4 Nb2O5 Mn (40) Na (40) W (20)
Mn-Na2WO4/CeO2 Mn(NO3)2·6H2O, Na2WO4 CeO2 Mn (40) Na (40) W (20)
Mn-Li2WO4/SiO2 Mn(NO3)2·6H2O, Li2WO4 SiO2 Mn (40) Li (40) W (20)
Mn-MgWO4/SiO2 Mn(NO3)2·6H2O, MgWO4 SiO2 Mn (50) Mg (25) W (25)
Mn-K2WO4/SiO2 Mn(NO3)2·6H2O, K2WO4 SiO2 Mn (40) K (40) W (20)
Mn-CaWO4/SiO2 Mn(NO3)2·6H2O, CaWO4 SiO2 Mn (50) Ca (25) W (25)
Mn-SrWO4/SiO2 Mn(NO3)2·6H2O, SrWO4 SiO2 Mn (50) Sr (25) W (25)
Mn-BaWO4/SiO2 Mn(NO3)2·6H2O, BaWO4 SiO2 Mn (50) Ba (25) W (25)
Mn-Li2MoO4/SiO2 Mn(NO3)2·6H2O, Li2MoO4 SiO2 Mn (40) Li (40) Mo (20)
Mn-Na2MoO4/SiO2 Mn(NO3)2·6H2O, Na2MoO4 SiO2 Mn (40) Na (40) Mo (20)
Mn-K2MoO4/SiO2 Mn(NO3)2·6H2O, K2MoO4 SiO2 Mn (40) K (40) Mo (20)
Mn-FeMoO4/SiO2 Mn(NO3)2·6H2O, FeMoO4 SiO2 Mn (50) Fe (25) Mo (25)
Mn-ZnMoO4/SiO2 Mn(NO3)2·6H2O, ZnMoO4 SiO2 Mn (50) Zn (25) Mo (25)
Ti-Na2WO4/SiO2 Ti(OiPr)4, Na2WO4 SiO2 Ti (40) Na (40) W (20)
V-Na2WO4/SiO2 VOSO4·xH2O (x=3-5), Na2WO4 SiO2 V (40) Na (40) W (20)
Fe-Na2WO4/SiO2 Fe(NO3)3·9H2O, Na2WO4 SiO2 Fe (40) Na (40) W (20)
Co-Na2WO4/SiO2 Co(NO3)2·6H2O, Na2WO4 SiO2 Co (40) Na (40) W (20)
Ni-Na2WO4/SiO2 Ni(NO3)2·6H2O, Na2WO4 SiO2 Ni (40) Na (40) W (20)
Cu-Na2WO4/SiO2 Cu(NO3)2·5H2O, Na2WO4 SiO2 Cu (40) Na (40) W (20)
Zn-Na2WO4/SiO2 Zn(NO3)2·6H2O, Na2WO4 SiO2 Zn (40) Na (40) W (20)
Y-Na2WO4/SiO2 Y(NO3)3·6H2O, Na2WO4 SiO2 Y (40) Na (40) W (20)
Zr-Na2WO4/SiO2 ZrO(NO3)2·2H2O, Na2WO4 SiO2 Zr (40) Na (40) W (20)
Mo-Na2WO4/SiO2 (NH4)2MoO4, Na2WO4 SiO2 Mo (40) Na (40) W (20)
Pd-Na2WO4/SiO2 Pd(OAc)2, Na2WO4 SiO2 Pd (40) Na (40) W (20)
La-Na2WO4/SiO2 La(NO3)3, Na2WO4 SiO2 La (40) Na (40) W (20)
Ce-Na2WO4/SiO2 Ce(NO3)3·6H2O, Na2WO4 SiO2 Ce (40) Na (40) W (20)
Nd-Na2WO4/SiO2 Nd(NO3)3·6H2O, Na2WO4 SiO2 Nd (40) Na (40) W (20)
Eu-Na2WO4/SiO2 Eu(NO3)3·5H2O, Na2WO4 SiO2 Eu (40) Na (40) W (20)
Tb-Na2WO4/SiO2 Tb(NO3)3·5H2O, Na2WO4 SiO2 Tb (40) Na (40) W (20)
Hf-Na2WO4/SiO2 Hf(OEt)4, Na2WO4 SiO2 Hf (40) Na (40) W (20)
Blank
BN BN
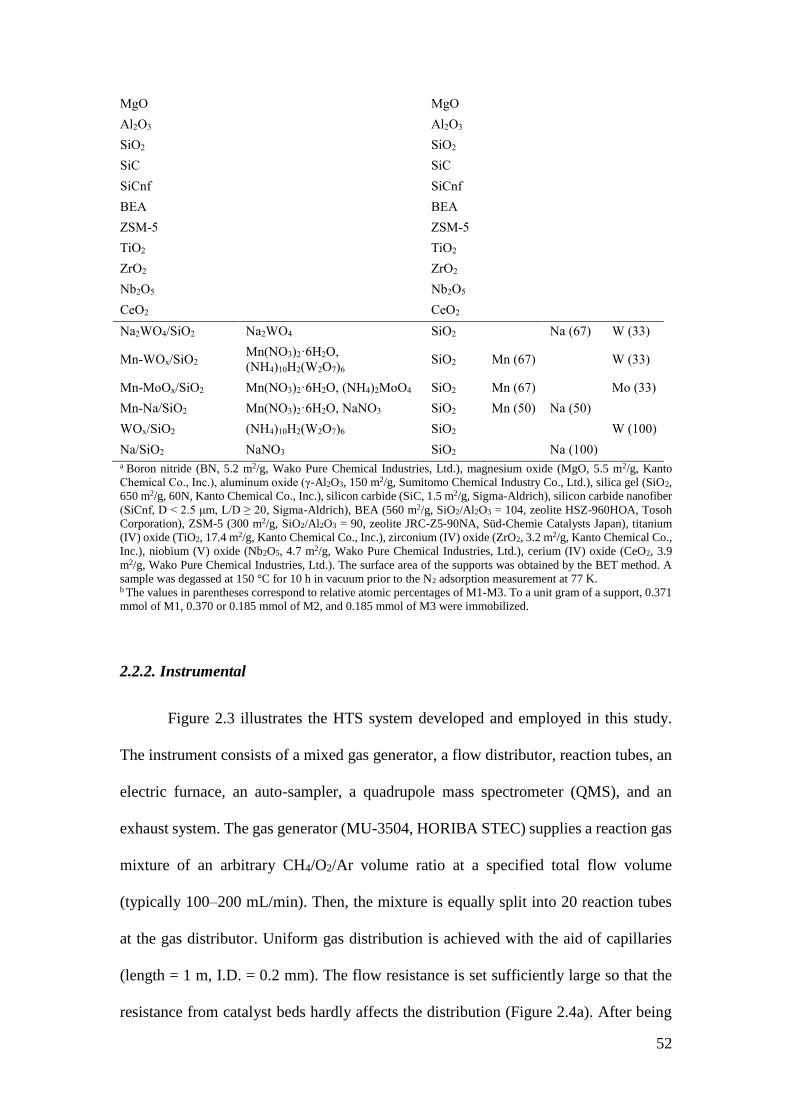
52
MgO MgO
Al2O3 Al2O3
SiO2 SiO2
SiC SiC
SiCnf SiCnf
BEA BEA
ZSM-5 ZSM-5
TiO2 TiO2
ZrO2 ZrO2
Nb2O5 Nb2O5
CeO2 CeO2
Na2WO4/SiO2 Na2WO4 SiO2 Na (67) W (33)
Mn-WOx/SiO2 Mn(NO3)2·6H2O,
(NH4)10H2(W2O7)6 SiO2 Mn (67) W (33)
Mn-MoOx/SiO2 Mn(NO3)2·6H2O, (NH4)2MoO4 SiO2 Mn (67) Mo (33)
Mn-Na/SiO2 Mn(NO3)2·6H2O, NaNO3 SiO2 Mn (50) Na (50)
WOx/SiO2 (NH4)10H2(W2O7)6 SiO2 W (100)
Na/SiO2 NaNO3 SiO2 Na (100) a Boron nitride (BN, 5.2 m2/g, Wako Pure Chemical Industries, Ltd.), magnesium oxide (MgO, 5.5 m2/g, Kanto
Chemical Co., Inc.), aluminum oxide (γ-Al2O3, 150 m2/g, Sumitomo Chemical Industry Co., Ltd.), silica gel (SiO2,
650 m2/g, 60N, Kanto Chemical Co., Inc.), silicon carbide (SiC, 1.5 m2/g, Sigma-Aldrich), silicon carbide nanofiber
(SiCnf, D < 2.5 μm, L/D ≥ 20, Sigma-Aldrich), BEA (560 m2/g, SiO2/Al2O3 = 104, zeolite HSZ-960HOA, Tosoh
Corporation), ZSM-5 (300 m2/g, SiO2/Al2O3 = 90, zeolite JRC-Z5-90NA, Süd-Chemie Catalysts Japan), titanium
(IV) oxide (TiO2, 17.4 m2/g, Kanto Chemical Co., Inc.), zirconium (IV) oxide (ZrO2, 3.2 m2/g, Kanto Chemical Co.,
Inc.), niobium (V) oxide (Nb2O5, 4.7 m2/g, Wako Pure Chemical Industries, Ltd.), cerium (IV) oxide (CeO2, 3.9
m2/g, Wako Pure Chemical Industries, Ltd.). The surface area of the supports was obtained by the BET method. A
sample was degassed at 150 °C for 10 h in vacuum prior to the N2 adsorption measurement at 77 K. b The values in parentheses correspond to relative atomic percentages of M1-M3. To a unit gram of a support, 0.371
mmol of M1, 0.370 or 0.185 mmol of M2, and 0.185 mmol of M3 were immobilized.
2.2.2. Instrumental
Figure 2.3 illustrates the HTS system developed and employed in this study.
The instrument consists of a mixed gas generator, a flow distributor, reaction tubes, an
electric furnace, an auto-sampler, a quadrupole mass spectrometer (QMS), and an
exhaust system. The gas generator (MU-3504, HORIBA STEC) supplies a reaction gas
mixture of an arbitrary CH4/O2/Ar volume ratio at a specified total flow volume
(typically 100–200 mL/min). Then, the mixture is equally split into 20 reaction tubes
at the gas distributor. Uniform gas distribution is achieved with the aid of capillaries
(length = 1 m, I.D. = 0.2 mm). The flow resistance is set sufficiently large so that the
resistance from catalyst beds hardly affects the distribution (Figure 2.4a). After being

53
split into 20 fractions, the gas mixture passes through reaction tubes. A reaction tube is
made of a quartz tube whose internal diameter changes from 4 mm in the feed side to 2
mm in the effluent side. This design of the reaction tube assures not only the inertness
of the reactor wall at an elevated temperature but also the suppression of undesired gas-
phase reactions in the effluent side. A specified height of catalyst powder is fixed at the
neck position of the reaction tube with the aid of quartz wool. The reaction tubes are
symmetrically placed in a hollow electric furnace. The furnace consists of three
temperature zones (T1–3), each of which equips a thermocouple and ceramic heater for
PID control. The catalyst beds are placed in the middle of the center zone, i.e. when the
same temperature is applied for the three zones, the other two zones become a buffer to
stabilize the temperature of the catalyst beds at the center zone. The effluent gas from
the 20 reaction tubes is transferred to the sampling line of the auto-sampler, which is
connected to a diaphragm pump and the inlet of the QMS (Transpector® CPM 3,
INFICON). The auto sampling is achieved by a programmed action sequence of
pneumatically-actuated diaphragm valves (MEGA-ONE®, Fujikin). Typically, the
effluent gas of one reactor tube is sampled for 1.6 seconds, and the sampling line is
cleared by evacuation for 7.0 seconds, thus corresponding to 172 seconds for one round.
The un-sampled fraction of the effluent gas is discharged through the exhaust system.
During the sampling, the effluent gas is continuously transferred to the QMS, and the
mass spectra are recorded for a predetermined set of mass numbers. 12 mass spectra
are acquired in 1.6 seconds. The mass signal intensities are converted to the relative
pressure of individual gas species using external calibration, where scaling factors are
obtained for a few major fragments to deal with overlapping fragments. As can be seen
in Figure 2.4b, the relative pressure is accurately determined based on the above-
mentioned protocol. Finally, cooperation among the programmed gas generation,

54
temperature, and auto-sampling enables full automation in evaluating the performance
of 20 catalysts for a predetermined set of reaction conditions. A safety management
system also backups the automation. Here, it is worth noting that HTS instruments
having more or less similar mechanic design were reported in literature [23-26], but
these instruments were mostly used for catalyst screening at one or a few fixed
conditions. The developed instrument enables the acquisition of a dataset that covers a
parametric space for both catalysts and process conditions by means of parallelization
and automation, respectively. The consistency of results among 20 channels was
carefully confirmed using a Mn-Na2WO4/SiO2 catalyst (Figure 2.5).
Figure 2.3. Illustration of the developed HTS system.

55
Figure 2.4. Validation of (a) gas distribution and (b) relative pressure determination
in the HTS system.

56
Figure 2.5. Confirmation on the reproducibility of catalytic tests: (a,b) channel 1 and
(c,d) channel 2 using Mn-Na2WO4/SiO2 as a catalyst. Ar_Flow/CH4_Flow/O2_Flow
= 6/18/6 mL/mL/mL
Figure 2.6 summarizes the programmed sequence of reaction conditions
employed in this chapter. Once catalysts are activated at 1000 °C for 160 minutes under
O2, the temperature is stepwise declined from 900 to 850, 800, 775, 750, and 700 °C.
At each temperature, the total flow volume (10, 15, 20 mL/min/channel), the CH4/O2
ratio (2, 3, 4, 6 mol/mol), and the Ar concentration (PAr = 0.15, 0.40, 0.70 atm) are
stepwise varied. One reaction condition is held for 6–7 min, which allows 2–3 rounds
of sampling in the same condition for acquiring the error range of observations. The
ascending temperature protocol was not employed as it causes excessive CO and CO2
production due to the combustion of carbon deposits. The height of the catalyst bed was
fixed at 10 mm, leading to a contact time of 0.75, 0.50, or 0.38 seconds at the given
total flow volumes. Combined variations in the temperature, the total flow volume, the

57
CH4/O2 ratio, and the Ar concentration lead to 216 conditions per catalyst and 4320
observations for 20 catalysts in a single automated operation.
Figure 2.6. Employed programmed sequence of reaction conditions. Note that each
temperature step includes a program for the gas flow volume and composition.
2.2.3. Data analysis
Evaluation of 40 catalysts and 19 references under 216 conditions generated an
OCM dataset comprised of 12708 data (36 data were lost for Na/SiO2 at 900 °C due to
an experimental mistake). The size of the dataset is one digit larger than hundreds in
past HTS studies [23,24] and 1870 in the literature OCM dataset [11]. Moreover, it was
acquired in a process-consistent manner, where good and poor catalysts were equally
evaluated under the same series of conditions. The dataset relates a catalyst to its
performance at a specific condition. A catalyst is described by 7 features: M1-M3,
Support, M1-M3_mol, and M1-M3_mol%. The Mx_mol corresponds to the mole of
Mx per gram of a support, while Mx_mol% corresponds to the relative atomic
percentage of Mx in M1+M2+M3. A condition is represented by Temp (in degree
Celsius), Total_flow (in mL/min), Ar_flow, CH4_flow, O2_flow, CT (contact time in

58
seconds), and CH4/O2 (the molar ratio). Performance is given by CH4_conv as well as
the yield and selectivity values for each of major products, e.g. C2H6y and C2H6s. The
dataset is uploaded in a web platform "Catalyst Acquisition by Data Science (CADS)"
for shared usage (Figure 2.7).[19]
Figure 2.7. Snapshot of the OCM dataset uploaded in Catalyst Acquisition by Data
Science (CADS) [19].
The dataset was preprocessed for data visualization and machine learning,
where numerical variables were assigned for symbolic information such as atomic
elements and supports. Regression models within supervised machine learning were
used in order to predict the C2 yield and selectivity of CO, CO2, C2H4, and C2H6. In
particular, both of linear and non-linear regression models were considered. Linear
regression supervised machine learning, least squares linear regression (LSLR), support
vector regression with linear kernel (SVRL), and kernel ridge (KR) while non-linear
regression supervised machine learning, random forest regression (RFR), and support
vector regression (SVR) with radial basis function (RBF) kernel, were implemented
within scikit-learn [4]. Hyper parameters of KR, RFR, and SVR were also tuned. Note
that the random state of RFR was fixed at the highest score in cross validation. C and

59
gamma in SVR were optimized and set to 10 and 0.01, respectively. Accuracy of the
trained machine learning models was evaluated through cross validation, where the data
was randomly split into 20% test and 80% trained data. The average scores of 10
randomly split test and trained data were taken and evaluated. All the data analysis was
implemented under the guidance and supervision of Dr. Keisuke Takahashi, Hokkaido
University, Japan.

60
2.3. Results and discussion
2.3.1. High-throughput experimentation and OCM dataset
A total of 12708 data points were obtained by executing three automated
operations with the HTS instrument. This data is much larger in volume than the
literature data of past 30 years [11]. Moreover, the performance of 59 catalyst entries
including references was uniformly evaluated in each condition. A variety of qualitative
tendencies are manifested by three-dimensional representation of the whole data based
on scatter plots. For example, Figure 2.8a demonstrates the relationship between the
CH4 conversion and C2 selectivity with the C2 yield depicted in the color axis. The
limitation of the C2 yield caused by the tradeoff between the CH4 conversion and C2
selectivity is well known, but more clear trends are observed with the acquired dataset:
Distribution of the CH4 conversion and the C2 selectivity limits the C2 yield below 20–
21%. The main factor of this restriction can be explained by analyzing the relationship
between by-products and the C2 yield. In Figure 2.8b, data points having high C2 yield
are distributed in a region of the CO selectivity of 0–40% and the CO2 selectivity of
10–50%. Hence, the more fundamental problem is the formation of CO2. Note that CO2
production has an adverse effect on both the conversion and selectivity in a sense that
it consumes the largest amount of O2 per CH4. This is further confirmed by the
distribution of data points along reaction conditions. For example, CH4 conversion is
obviously dependent on the amount of O2 (Figure 2.8c), where the upper limit of the
CH4 conversion is determined by the scarcity of O2 due to undesired over-oxidation
which consumes extra O2. Temperature is also an important parameter (Figure 2.8d).
High temperature favors high conversion and low selectivity due to the occurrence of
over-oxidation. Although low temperature is preferred for high selectivity, the catalyst
is not sufficiently active for the main reaction. Therefore, the middle range of

61
temperature is found to be suitable in terms of the tradeoff. In this way, the catalyst big
data acquired by high-throughput experimentation is very powerful for quick overview
of the general behavior of the catalytic reaction.
Figure 2.8. Visualization of 12708 data points based on scatter plots. (a) CH4
conversion vs. C2 selectivity and (b) CO selectivity vs. CO2 selectivity with the C2 yield
indicated by color. Distribution of data points in terms of (c) the CH4/O2 ratio and (d)
temperature.
Now, the dataset is subdivided to compare the performance of different
catalysts. In past HTS research, the performance of OCM catalysts was measured at
one or a few fixed condition [23,26]. Meanwhile, the dataset obtained here provides the
performance of 59 catalysts over a sufficiently wide range of reaction conditions. One
obvious profit of such a dataset is that the potential of different catalysts is fairly
evaluated at respective sweet spots. Thus, the best C2 yields of individual catalysts

62
(among 216 conditions) are compared in Figure 2.9. The corresponding conditions are
listed in Table 2.2. Comparison is made in terms of supports, M2,3 metals, and M1
metals based on the formula of M1-M21-2M3O4/support. In Figure 2.9a, bare supports
hardly promoted the C2 production as compared to blank, i.e. the gas-phase reaction
between CH4 and O2. Improvement over the gas-phase reaction was attained by
depositing Mn-Na2WO4 as the active phase, where the extent of the improvement was
observed to be sensitive to the supports. In Figure 2.9b, the best C2 yields are compared
on the removal or the replacement of M2,3 metals in Mn-M21-2M3O4/SiO2. The
removal of M2 or the utilization of non-alkali metals as M2 (except Mg) led to a
dramatic deterioration in the C2 yield. Meanwhile, the replacement of Na by other alkali
metals or the replacement of W by Mo caused moderate deterioration. Figure 2.9c
reports the alternation of M3. It was found that Mn and Ti are the only metals that can
enhance the C2 yield, i.e. other metals gave more or less deteriorated C2 yields when
compared to that of Na2WO4/SiO2. It should be mentioned that Ti-Na2WO4/SiO2 was
never reported before at the best of my knowledge.
Figure 2.9. Best C2 yield of individual catalysts: (a) Mn-Na2WO4/support, (b) Mn-
M21-2M3O4/SiO2, and (c) M1-Na2WO4/SiO2.

63
Table 2.2. List of the conditions corresponding to the best C2 yield for individual
catalysts.
Name Temp
(°C)
Total flow
(mL/min)
CH4/O2 ratio
(mol/mol)
PAr
(atm)
CH4 conversion
(%)
C2 yield
(%)
Mn-Na2WO4/BN 800 15 3 0.15 20.8 7.8
Mn-Na2WO4/MgO 800 15 3 0.7 22.5 9.3
Mn-Na2WO4/Al2O3 750 20 3 0.15 22.7 8.1
Mn-Na2WO4/SiO2 800 15 2 0.7 43.5 21
Mn-Na2WO4/SiC 800 15 3 0.7 31.5 19.6
Mn-Na2WO4/SiCnf 800 20 2 0.7 41.1 19.2
Mn-Na2WO4/BEA 800 20 3 0.7 28.4 15.6
Mn-Na2WO4/ZSM-5 800 20 3 0.7 30.9 19.9
Mn-Na2WO4/TiO2 750 20 2 0.7 41.7 18.3
Mn-Na2WO4/ZrO2 800 20 4 0.7 20.6 11.2
Mn-Na2WO4/Nb2O5 800 20 3 0.15 23.8 8.3
Mn-Na2WO4/CeO2 775 10 2 0.7 38.8 18
Mn-Li2WO4/SiO2 800 15 2 0.7 42.5 18.8
Mn-MgWO4/SiO2 775 15 2 0.7 38.3 16.1
Mn-K2WO4/SiO2 775 10 2 0.7 39.4 18.6
Mn-CaWO4/SiO2 850 20 4 0.7 21.3 8.5
Mn-SrWO4/SiO2 850 20 4 0.7 24 10.7
Mn-BaWO4/SiO2 850 20 6 0.7 16.6 10.2
Mn-Li2MoO4/SiO2 800 20 2 0.7 38.9 14
Mn-Na2MoO4/SiO2 775 15 2 0.7 36.4 15.4
Mn-K2MoO4/SiO2 800 20 3 0.7 26.9 16.6
Mn-FeMoO4/SiO2 850 20 6 0.7 18.5 12.6
Mn-ZnMoO4/SiO2 850 15 7 0.7 20 13
Ti-Na2WO4/SiO2 800 10 2 0.7 43.5 20.2
V-Na2WO4/SiO2 775 15 2 0.4 30.2 8.6
Fe-Na2WO4/SiO2 800 10 2 0.7 38.4 15.2
Co-Na2WO4/SiO2 850 20 3 0.7 30.5 16.1
Ni-Na2WO4/SiO2 800 15 2 0.7 39.4 17.7
Cu-Na2WO4/SiO2 800 20 2 0.4 32.2 9.1
Zn-Na2WO4/SiO2 850 20 2 0.7 38.4 12.6
Y-Na2WO4/SiO2 850 15 3 0.7 25.2 12.6
Zr-Na2WO4/SiO2 800 10 2 0.7 37.2 13.9
Mo-Na2WO4/SiO2 800 15 2 0.7 30.5 11
Pd-Na2WO4/SiO2 800 10 2 0.7 36.8 15.5
La-Na2WO4/SiO2 850 20 3 0.7 30.7 15.4
Ce-Na2WO4/SiO2 800 10 2 0.7 40.3 16.8
Nd-Na2WO4/SiO2 850 20 3 0.7 30.2 15.9
Eu-Na2WO4/SiO2 850 20 2 0.7 40.8 16.1
Tb-Na2WO4/SiO2 850 20 3 0.7 29 15.8
Hf-Na2WO4/SiO2 850 20 2 0.7 39.3 16
Blank 775 20 2 0.4 23.8 8.6
BN 750 15 2 0.15 24.7 8.9
MgO 750 20 2 0.4 30.7 7.5
Al2O3 750 15 2 0.15 26.1 7.4
SiO2 750 20 3 0.15 21.3 8.1
SiC 775 20 2 0.15 31.8 8.6
SiCnf 900 20 6 0.15 17.6 6.2
BEA 775 20 2 0.15 30.6 7.3
ZSM-5 750 20 2 0.4 25.4 7.9
TiO2 850 20 3 0.15 23.1 7.6
ZrO2 750 20 2 0.15 32.3 8.1
Nb2O5 700 10 2 0.4 21 7.7
CeO2 775 20 3 0.15 21.4 8.8
Na2WO4/SiO2 800 15 2 0.7 40.7 18.7
Mn-WOx/SiO2 850 15 7 0.7 15.9 9.9
Mn-MoOx/SiO2 850 20 3 0.15 21.6 6.9
Mn-Na/SiO2 850 20 2 0.7 37.3 9.7
WOx/SiO2 775 20 2 0.4 20.7 7.2
Na/SiO2 750 15 2 0.15 22.1 8.2

64
In Figure 2.9, I reached a known conclusion that Mn-Na2WO4/SiO2 is the best
OCM catalyst among M1-M21-2M3O4/support, and its modification hardly improves
the C2 yield. Here, the validity of the observed tendencies is discussed based on past
literature. The excellence of Mn-Na2WO4/SiO2 has been ascribed to the synergistic
combination of Mn-Na-W-Si [22,27]. The active site of this catalyst is tetrahedral
WO42- [27,28]. It goes up and down between W6+ and W5+/4+ in the catalytic cycle
involving homolytic dissociation of CH4 and subsequent oxidation [22]. The primary
role of Na or other alkali metal is at the stabilization of the tetrahedral WO42– against
octahedral one [29,30]. Mn of Mn2O3 mediates the O spillover to aid the recovery to
W6+ [14,22,27,31]. Such cooperation of the two redox cycles at W and Mn promotes
the OCM. The support exerts its influence by stabilizing tetrahedral WO42–, where the
cristobalite phase of SiO2 is believed to be important [31,32]. The second role of Na is
to facilitate the formation of the cristobalite phase at lower temperature, e.g. 800 C,
below typical calcination temperature [22,31–33]. Hence, the observed deterioration in
performance due to the modification of Mn-Na2WO4/SiO2 would be ascribed to a
possibility that the modification caused a negative influence on the said mechanisms
otherwise opposed the formation of the desired active phase. For instance, the poor
performance of Mn-Na2WO4 on Al2O3, MgO, or ZrO2 was attributed to the fact that
these supports mediate the formation of poorly crystalline or undesired mixed oxides
instead of preferred oxides [34]. Phase transition to α-cristobalite and the formation of
the preferred oxides by high-temperature calcination were reported for catalysts
supported on Si-based materials other than SiO2 such as SiC and TS-1 zeolite [35,36].
The results of Figure 2.9a successfully discriminates these good and poor supports. Ji
et al. studied the effect of substitution of Na in Mn-Na2WO4/SiO2 with Li, K, Ba, Ca,
Fe, Co, Ni, or Al, where the best performance was obtained for Na and K followed by

65
Li [29], which is consistent with Figure 2.9b. The deterioration in performance caused
by the substitution of Na with alkaline earth or transition metals is ascribed to the
inability of these metals to induce the low-temperature α-cristobalite formation as well
as the formation of a significant amount of octahedral WO6 in the form of MnWO4 [14].
Anions of strong acid other than the best WO42-
such as MoO42-, SO4
2-, PO43- have an
ability to stabilize Mn2O3 on the catalysts, thus yielding reasonable OCM performance
[14,22]. Finally, in relation to the earlier explained cooperative redox mechanism,
Malekzadeh et al. found a correlation between the electrical conductivity and the C2
yield for M1-Na2WO4/SiO2 [31]. The C2 yield followed the order of V < Zn < Fe < Co
<< Mn, showing agreement with the results of Figure 2.9c.
The dataset is also useful for discussing the process dependence of catalysts.
Figure 2.10 compares the performance of the 40 catalysts and 19 reference materials at
three representative conditions. The CH4 conversion and C2 selectivity are represented
after being normalized to the corresponding values of Mn-Na2WO4/SiO2 at the
respective conditions. Among the three conditions, the best C2 yield (20.88%) was
obtained by Mn-Na2WO4/SiO2 at 800 °C and the CH4/O2 ratio of 2 (Figure 2.10a).
Indeed, the literature data for this catalyst has been reported around similar conditions
[37]. Lower performance of the other catalysts is associated with both/either lower
conversion and/or lower selectivity, while some catalysts showed comparable C2 yields
in the following two cases. i) Catalysts with comparable or even higher conversion:
Mn-M22WO4/SiO2 (M2 = alkaline metal other than Na) and Mn-Na2WO4/Si-based
supports (SiC, ZSM-5); ii) Catalysts with comparable C2 selectivity: M1-Na2WO4/SiO2
(M1 = none, Ti, Ni, Co). Interestingly, some M1 metals such as Nd, Eu, Hf, and Tb
exhibited relatively high C2 selectivity (though the conversion was low).

66
The performance ranking for the catalysts greatly differed when the O2
concentration was reduced at the same temperature, i.e. 800 °C and the CH4/O2 ratio of
4 (Figure 2.10b). Mn-Na2WO4/SiO2 was no longer the best catalyst at this condition
(C2y = only 14.75%). Higher C2 yields were obtained for Mn-Na2WO4 when
immobilized on specific supports such as ZSM-5 (C2y = 19.40%), SiC (C2y = 17.17%),
CeO2 (C2y = 16.84%), and BEA (C2y = 15.44%). Mn-K2WO4/SiO2 (16.46%) was also
a reasonable catalyst. Based on the comparison at the two conditions, an important
suggestion is derived: Mn-Na2WO4/SiO2 has an ability to retain high C2 selectivity at a
higher O2 concentration, but the conversion sharply drops at a lower concentration. On
the other hand, the performant catalysts at the CH4/O2 ratio of 4 correspond to the
catalysts which are less C2 selective but relatively good in the conversion at the CH4/O2
ratio of 2. It is considered that the high activity of these catalysts could be effectively
utilized to enhance the C2 yield when operated at a milder condition (in other words,
these catalysts tend to lose the C2 selectivity at a more severe condition). This idea is
further confirmed in Figure 2.10c by lowering the temperature to 750 °C at the CH4/O2
ratio of 4. A few catalysts having high activity were definitely advantageous at this
condition: Mn-Na2WO4 supported on ZSM-5 (C2y = 18.76%), SiC (C2y = 16.17%),
and BEA (C2y = 14.64%) in contrast to 5.14% for Mn-Na2WO4/SiO2. Thus, analysis
of the dataset proves that the performance of Mn-Na2WO4 is sensitive to the
modification of Si-based supports in terms of the low-temperature activation of CH4
and the selectivity tolerance against a high O2 concentration. This finding is plausibly
related to a past report, where Mn-Na2WO4/SBA-15 was superior to Mn-Na2WO4/SiO2
at the condition of 750 °C and the CH4/O2 ratio of 4 [38]. However, including this
example, the performance of OCM catalysts had been mostly compared at one
condition in literature. To be important, the above-explained aspects which are useful

67
for catalyst design could be derived only by comparing the performance of different
catalysts at multiple conditions.

68
Figure 2.10. Process dependence of catalyst performance at (Temp, CH4/O2) = (a) (800
°C, 2 mol/mol), (b) (800 °C, 4 mol/mol), and (c) (750 °C, 4 mol/mol). The total flow
volume and the partial pressure of Ar are set at 20 mL/min and 0.70 atm, respectively.
The CH4 conversion and the C2 selectivity are normalized to those of Mn-Na2WO4/SiO2
at the identical conditions: (CH4_conv, C2s) = (35.96%, 58.06%) at (800 °C, 2
mol/mol), (21.22%, 69.51%) at (800 °C, 4 mol/mol), and (7.88%, 65.23%) at (750 °C,
4 mol/mol).
It was earlier seen that the limited C2 yield mainly comes from the CO2 by-
production (Figure 2.8b). Meanwhile, the electric furnace of the HTS instrument
consists of three temperature zones (T1: inlet, T2: catalyst bed, T3: outlet). The three
temperatures can be independently set if the temperature difference of neighboring
zones does not exceed 100 C. In an attempt to optimize the three temperatures, I found
that the C2 yield was improved when T1,3 (especially T1) were lowered with respect to
T2 (Figure 2.11). This fact suggests that the C2 yield is sensitive to the suppression of

69
non-selective oxidation in the gas phase [9,10,36] and may explain why the literature
data is largely distributed among different groups.
Figure 2.11. Dependence of the C2 yield on the temperature protocol. T2 was fixed at
800 C, while T1 and T3 were independently varied. The C2 yield was optimized in
terms of the total flow (Q), the Ar pressure (PAr) and the CH4/O2 ratio using Mn-
Na2WO4/SiO2 as the catalyst.
According to the above result, the performance of selected 20 catalysts was re-
evaluated in 216 conditions, where T1,3 was set equal to T2−100 C. The results are
summarized in Figure 2.12a. By suppressing the gas-phase reaction, the upper boundary
line of the C2 yield shifted from ca. 21% to ca. 26% (Figure 2.12a). The best C2 yield
was updated from 21.03% for Mn-Na2WO4/SiO2 to 25.84% for Mn-Na2WO4/SiC. The
best C2 yield is compared between the original isothermal and new non-isothermal
conditions for individual catalysts (Figure 2.12b). One can see that the new condition

70
does not necessarily upgrade all the catalysts, and the presence of Mn is essential for
the upgrade. Indeed, lower temperature of the inlet (T1) likely reduces the CH4
conversion by suppressing the initial radical formation (CH3•) [22,39]. The C2 yield
would not be improved unless the CH4 conversion was maintained and/or the
deterioration was overcome by the C2 selectivity. The role of Mn was investigated by
comparing scatter plots in the absence and presence of Mn (Figure 2.13), where the data
points are restricted over 10% of the C2 yield for visibility. Without Mn, high C2 yield
was obtained over the CH4 conversion of 40% for the isothermal condition, while data
points of high C2 yield were concentrated in a region of the CH4 conversion of 36–39%
and the C2 selectivity of 51–54% for the non-isothermal condition. The improvement
in the C2 selectivity was thus compensated by lower CH4 conversion in the absence of
Mn. The deterioration of CH4 conversion in the non-isothermal condition was hardly
observed in the presence of Mn. In this case, data points of high C2 yield were
distributed around the CH4 conversion of 38–44% and the C2 selectivity of 55–60%. It
is clear that Mn promotes the activation of CH4 as well as its selective oxidation. Lastly,
the best C2 yields of top 6 catalysts were identified in a very narrow range (18.80–
21.03%) in the isothermal condition, and the use of the non-isothermal condition
expanded the span to 20.05–25.84%. The suppression of the gas-phase reaction raised
the impact of the catalyst design, and this in turn dictated the importance of
simultaneous optimization of the catalyst and reactor design in OCM.

71
Figure 2.12. Comparison between two temperature protocols: (a) Scatter plot and (b)
best C2 yield of individual catalysts.
Figure 2.13. Role of Mn in OCM. Scatter plots are compared in the (a) absence and
(b) presence of Mn for two temperature protocols, where the data points are limited
based on the C2 yield > 10%. The circled areas provide relatively high C2 yield in the
non-isothermal temperature protocol.
2.3.2. Machine learning
Linear and non-linear regression analysis was implemented for predicting the
C2 yield and the selectivity of CO, CO2, C2H4, and C2H6. 11 descriptors were employed
for each model: 7 features related to the catalyst design (M1_atom_number,
M2_atom_number, M3_atom_number, Support_ID, M1_mol, M2_mol, M3_mol) and
4 features related to experimental process conditions (Temp, Ar_flow, CH4_flow,
O2_flow). Here, the goal of the machine learning is to reveal how catalyst design and
process conditions affect the yield and the selectivity of OCM. The cross validation
scores for predicting the C2 yield and the selectivity of CO, CO2, C2H4, and C2H6 using
the 11 descriptors are collected in Table 2.3. It was demonstrated that the C2 yield can

72
be well predicted using RFR with a cross validation score of 0.88 and moderately
predicted with SVR, leading one to consider that the prediction of the C2 yield is a non-
linear matter. True and predicted C2 yields using RFR are visualized in Figure 2.14.
Here, the test data is well predicted, whereas any of the regression models are unable
to do so when implemented on literature OCM data collected from the past 30 years
[11,12]. The importance of 11 descriptors for predicting the C2 yield in RFR is
summarized in Figure 2.14. The importance was determined by reviewing the generated
decision trees in order to determine descriptor prominence and frequency throughout
the decision process. It was found to be consistent with experimental observations.
Table 2.3. Cross validation scores for predicting the C2 yield and the selectivity of CO,
CO2, C2H4, and C2H6 using 11 descriptors and 5 different machine learnings.
Objective
variable LSLR SVRL KR RFRa SVRb
C2y 0.16 −0.15 0.16 0.88 0.66
COs 0.55 0.21 0.45 0.84 0.72
CO2s 0.09 −0.68 −0.01 0.8 0.22
C2H4s 0.24 −1.38 0.22 0.7 0.5
C2H6s 0.59 −0.37 0.2 0.79 0.7 a The number of trees were set to 100. b C and gamma were optimized and set to 10 and 0.01, respectively.

73
Figure 2.14. True and predicted C2 yields using RFR and the importance of
corresponding 11 descriptors in RFR.
The scarcity of poor data constitutes one of the major problems of literature data
for machine learning. Here, additional random forest regression was performed, where
poor data corresponding to the C2 yield below 10% were omitted during training. As
seen in Figure 2.15, the omission of poor data during the training process results in
overly optimistic or otherwise largely inaccurate predictions.
Figure 2.15. True and predicted C2 yields using RFR when poor data (C2 yield < 10%)
is omitted during training. The score for the test set is −3.49. It must be noted that poor
data cannot be predicted when only good data are used for the training.
The OCM data generated by the high-throughput experimentation produced a
highly dispersed and consistent dataset, thereby resulting in the ability to apply
regression models. The selectivity of CO, CO2, C2H4, and C2H6 was also predicted
using RFR and SVR with the same 11 descriptors, as shown in Table 2.3. Overall, RFR
resulted in a higher cross validation score when compared to SVR. More importantly,

74
one can see that the selectivity of CO and C2H6 exhibited a higher score than that of
CO2 and C2H4, particularly for the results produced using SVR. This suggests that the
catalyst and process conditions more directly affect the selectivity of CO and C2H6. On
the other hand, the selectivity of CO2 and C2H4 could be considered to be more involved
with other factors. From this, machine learning implied the order of reactions, where
CO and C2H6 has a more direct relation with the initial conditions while CO2 and C2H4
are more indirectly affected by such conditions. This implication likely agrees with the
proposed OCM reaction mechanism reported using microkinetic analysis: C2H6 is
produced by CH3•, followed by dehydrogenation to form C2H4 [39].
The power of machine learning lies in interpolation filling using a trained
machine. Here, trained RFR with 11 descriptors are used to map out how the C2 yield
changes by experimental process conditions. Figure 2.16a is the surface plot of the
CH4/O2 ratio and temperature against the C2 yield, where the 24 actual data points are
extracted for Mn-Na2WO4/SiO2 at the total flow (Q) of 20 mL/min and the Ar pressure
of 0.40 atm. Figure 2.16a shows a discreetness of data points, meaning that the optimum
CH4/O2 ratio and temperature remain inaccurately determined for maximizing the C2
yield. Then, interpolation filling of experimental conditions was performed using RFR
that was trained for a full set of data. As shown in Figure 2.16b, the interpolation filling
made the surface plot much smoother. The accuracy of the interpolation filling was
primarily assured in Figure 2.14, and further validated by comparing the surface plot
with 15 data points acquired from separate experiments for the same catalyst [40],
where the newly added data points clearly matched with the trends given by RFR.
Similar interpolation filling of how the flow of Ar, CH4, and O2 impacts the C2 yield is
performed for Mn-Na2WO4/SiO2 at 800 C. The predicted scatter plot of the flow of the
three gases against the C2 yield displays the sensitivity of the C2 yield to the flow of Ar

75
and O2 (Figure 2.17). Higher Ar flow (i.e. shorter contact and more dilution) and an
optimal O2 flow range between 2 and 3 are found to be preferred. Data science provides
a means of unveiling trends within data which can then act as guides and provide hints
when attempting to design catalysts. Figure 2.18 shows the predicted performance of
M1-Na2WO4/SiO2 catalysts, where the atomic number of M1 is varied from 22 to 72
with the exception of non-metals. The C2 yield is predicted along the temperature while
the other conditions are fixed as (Q, CH4/O2, PAr) = (20 mL/min, 2 mol/mol, 0.40 atm).
Mn is found to exhibit the highest C2 yield at 800 C, which is in accordance to the
original data. Interestingly, heavy elements, lanthanoids in particular, are predicted to
result in a high C2 yield at a higher temperature. These results suggest that the
combination of high-throughput experimentation and machine learning allows for the
prediction of catalysts and process conditions simultaneously.
Figure 2.16. Surface plot of the CH4/O2 ratio and temperature against the C2 yield for
Mn-Na2WO4/SiO2: (a) Actual data points, (b) interpolation filling by RFR, and (c)
validation with separate experimental data points. Color bar indicates the C2 yield
(C2y) in %.

76
Figure 2.17. Predicted scatter plot of the flow of Ar, CH4, and O2 against the C2 yield
for Mn-Na2WO4/SiO2 at 800 °C. Color bar indicates the C2 yield (C2y) in %.

77
Figure 2.18. Predicted C2 yield for M1-Na2WO4/SiO2 catalysts at different
temperatures. Color bar indicates the C2 yield (C2y) in %.

78
2.4. Conclusions
The presence of a catalyst dataset that covers a parametric space of materials
and process conditions in a process-consistent manner is essential for the realization of
catalyst informatics. In this chapter, a HTS instrument was developed and exploited for
preparing such a dataset for OCM catalysis. The instrument enables an automatic
performance evaluation of 20 catalysts at a series of predefined conditions in fixed bed
reactors, affording a dataset comprised of 12708 data for 59 catalysts. Thus far, the
performance of OCM catalysts has been compared at one or a few fixed conditions
within literature reports. This has resulted in ambiguity regarding whether a catalyst
itself is superior or the catalyst is more suited to the employed condition. Importantly,
OCM catalysts are sensitive to process conditions owing to competition between the
activation of inert CH4 and excessive oxidation, while different catalysts have their own
sweet spots for peak performance. In this sense, I successfully demonstrated the
usefulness of a dataset that covers a parametric space in terms of both catalysts and
process conditions for overviewing the catalysis itself based on scatter plots,
understanding process dependence of individual catalysts, and eventually acquiring
how to improve catalysts and processes in a cooperative manner. Important findings
are summarized below.
i) The restriction of C2 yield comes from the tradeoff between the CH4
conversion and C2 selectivity, where the by-production of CO2 is most
detrimental.
ii) The comparison of the best C2 yield among different catalysts has confirmed
the superiority of a synergetic combination among Mn-Na-W-Si.

79
iii) The OCM reaction is generally sensitive to the process conditions, and catalyst
design has a great impact on the process dependence. In particular, the
modification of Si-based support affects the performance of Mn-Na2WO4 in
terms of the low-temperature activation of CH4 and the selectivity tolerance
against high O2 concentration.
iv) The combination of support modification for activity improvement and
suppression of the gas phase reaction based on non-isothermal temperature
control was found to be promising for upgrading the supported Mn-Na2WO4
system.
v) Combining the HTS data and regression in machine learning, accurate
prediction of the C2 yield becomes achievable via interpolation filling. The
non-linear nature of the model suggests intrinsic complexity of OCM reaction.
vi) The supervised machine learning regression model was successfully
implemented using the consistent HTS data, where previous efforts had failed
when applied towards 1869 OCM data gathered from literature [12].
Based on all given demonstrations and achievements, I believe that the present
contribution constitutes an importance piece of progress towards the implementation of
catalyst informatics.

80
References
[1] Takahashi, K.; Takahashi, L.; Miyazato, I.; Fujima, J.; Tanaka, Y.; Uno, T.; Satoh, H.;
Ohno, K.; Nishida, M.; Hirai, K.; Ohyama, J.; Nguyen, T. N.; Nishimura, S.; Taniike, T., The
Rise of Catalyst Informatics: Towards Catalyst Genomics. ChemCatChem 2019, 11, 1146-
1152.
[2] Ramprasad, R.; Batra, R.; Pilania, G.; Mannodi-Kanakkithodi, A.; Kim, C., Machine
Learning in Materials Informatics: Recent Applications and Prospects. Npj Comput. Mater.
2017, 3, 54.
[3] Agrawal, A.; Choudhary, A., Perspective: Materials Informatics and Big Data: Realization
of the “Fourth Paradigm” of Science in Materials Science. APL Mater. 2016, 4, 053208.
[4] Pedregosa, F.; Varoquaux, G.; Gramfort, A.; Michel, V.; Thirion, B.; Grisel, O.; Blondel,
M.; Prettenhofer, P.; Weiss, R.; Dubourg, V.; Vanderplas, J.; Passos, A.; Cournapeau, D.;
Brucher, M.; Perrot, M.; Duchesnay, É., Scikit-learn: Machine Learning in Python. J. Mach.
Learn. Res. 2011, 12, 2825.
[5] Schütt, K. T.; Kessel, P.; Gastegger, M.; Nicoli, K. A.; Tkatchenko, A.; Müller, K. R.,
Schnetpack: A Deep Learning Toolbox for Atomistic Systems. J. Chem. Theory Comput. 2019,
15, 448-455.
[6] Takahashi, K.; Tanaka, Y., Materials Informatics: A Journey Towards Material Design and
Synthesis. Dalton Trans. 2016, 45, 10497-10499.
[7] Schmidt, J.; Marques, M. R. G.; Botti, S.; Marques, M. A. L., Recent Advances and
Applications of Machine Learning in Solid-State Materials Science. Npj Comput. Mater. 2019,
5, 83.
[8] Taniike, T.; Funako, T.; Terano, M., Multilateral Characterization for Industrial Ziegler–
Natta Catalysts toward Elucidation of Structure–Performance Relationship. J. Catal. 2014, 311,
33-40.
[9] Sun, J.; Thybaut, J. W.; Marin, G. B., Microkinetics of Methane Oxidative Coupling. Catal.
Today 2008, 137, 90-102.
[10] Kondratenko, E. V.; Peppel, T.; Seeburg, D.; Kondratenko, V. A.; Kalevaru, N.; Martin,
A.; Wohlrab, S., Methane Conversion into Different Hydrocarbons or Oxygenates: Current
Status and Future Perspectives in Catalyst Development and Reactor Operation. Catal. Sci.
Technol. 2017, 7, 366-381.

81
[11] Zavyalova, U.; Holena, M.; Schlögl, R.; Baerns, M., Statistical Analysis of Past Catalytic
Data on Oxidative Methane Coupling for New Insights into the Composition of High-
Performance Catalysts. ChemCatChem 2011, 3, 1935-1947.
[12] Takahashi, K.; Miyazato, I.; Nishimura, S.; Ohyama, J., Unveiling Hidden Catalysts for
the Oxidative Coupling of Methane Based on Combining Machine Learning with Literature
Data. ChemCatChem 2018, 10, 3223-3228.
[13] Liu, H.; Wang, X.; Yang, D.; Gao, R.; Wang, Z.; Yang, J., Scale up and Stability Test for
Oxidative Coupling of Methane over Na2WO4-Mn/SiO2 Catalyst in a 200 mL Fixed-Bed
Reactor. J. Nat. Gas Chem. 2008, 17, 59-63.
[14] Hou, S.; Cao, Y.; Xiong, W.; Liu, H.; Kou, Y., Site Requirements for the Oxidative
Coupling of Methane on SiO2-Supported Mn Catalysts. Ind. Eng. Chem. Res. 2006, 45, 7077-
7083.
[15] Kondratenko, E. V.; Schlüter, M.; Baerns, M.; Linke, D.; Holena, M., Developing
Catalytic Materials for the Oxidative Coupling of Methane through Statistical Analysis of
Literature Data. Catal. Sci. Technol. 2015, 5, 1668-1677.
[16] Jia, X.; Lynch, A.; Huang, Y.; Danielson, M.; Lang’at, I.; Milder, A.; Ruby, A. E.; Wang,
H.; Friedler, S. A.; Norquist, A. J.; Schrier, J., Anthropogenic Biases in Chemical Reaction
Data Hinder Exploratory Inorganic Synthesis. Nature 2019, 573, 251-255.
[17] Maier, W. F.; Stöwe, K.; Sieg, S., Combinatorial and High-Throughput Materials Science.
2007, 46, 6016-6067.
[18] Hagemeyer, A.; Strasser, P.; Volpe, A. F., Jr., Eds. High Throughput Screening in
Catalysis; Wiley-VCH: Weinheim, Germany, 2004.
[19] Catalyst Acquisition by Data Science [CADS] homepage https://cads.eng.hokudai.ac.jp/
[accessed September 13, 2019]. The dataset will be available to the public after the decision of
publication.
[20] Wang, D. J.; Rosynek, M. P.; Lunsford, J. H., Oxidative Coupling of Methane over Oxide-
Supported Sodium-Manganese Catalysts. J. Catal. 1995, 155, 390-402.
[21] Wang, J.; Chou, L.; Zhang, B.; Song, H.; Zhao, J.; Yang, J.; Li, S., Comparative Study on
Oxidation of Methane to Ethane and Ethylene over Na2WO4-Mn/SiO2 Catalysts Prepared by
Different Methods. J. Mol. Catal. A: Chem. 2006, 245, 272-277.

82
[22] Arndt, S.; Otremba, T.; Simon, U.; Yildiz, M.; Schubert, H.; Schomäcker, R., Mn-
Na2WO4/SiO2 as Catalyst for the Oxidative Coupling of Methane. What Is Really Known?
Appl. Catal., A. 2012, 425-426, 53-61.
[23] Olivier, L.; Haag, S.; Pennemann, H.; Hofmann, C.; Mirodatos, C.; van Veen, A. C., High-
Temperature Parallel Screening of Catalysts for the Oxidative Coupling of Methane. Catal.
Today 2008, 137, 80-89.
[24] Moehmel, S.; Steinfeldt, N.; Engelschalt, S.; Holena, M.; Kolf, S.; Baerns, M.;
Dingerdissen, U.; Wolf, D.; Weber, R.; Bewersdorf, M., New Catalytic Materials for the High-
Temperature Synthesis of Hydrocyanic Acid from Methane and Ammonia by High-Throughput
Approach. Appl. Catal., A. 2008, 334, 73-83.
[25] Wang, H.; Liu, Z.; Shen, J., Quantified MS Analysis Applied to Combinatorial
Heterogeneous Catalyst Libraries. J. Comb. Chem. 2003, 5, 802-808.
[26] Ras, E.-J.; Gomez-Quero, S., Oxidative Coupling of Methane in Small Scale Parallel
Reactors. Top. Catal. 2014, 57, 1392-1399.
[27] Li, S.-B., Oxidative Coupling of Methane over W-Mn/SiO2. Chin. J. Chem . 2001, 19, 16-
21.
[28] Wu, J.; Li, S.; Niu, J.; Fang, X., Mechanistic Study of Oxidative Coupling of Methane
over Mn2O3-Na2WO4/SiO2 Catalyst. Appl. Catal., A. 1995, 124, 9-18.
[29] Ji, S.; Xiao, T.; Li, S.; Chou, L.; Zhang, B.; Xu, C.; Hou, R.; York, A. P. E.; Green, M. L.
H., Surface Wo4 Tetrahedron: The Essence of the Oxidative Coupling of Methane over M-W-
Mn/SiO2 Catalysts. J. Catal. 2003, 220, 47-56.
[30] Palermo, A.; Vazquez, J. P. H.; Lambert, R. M., New Efficient Catalysts for the Oxidative
Coupling of Methane. Catal. Lett. 2000, 68, 191-196.
[31] Malekzadeh, A.; Dalai, A. K.; Khodadadi, A.; Mortazavi, Y., Structural Features of
Na2WO4–MOx/SiO2 Catalysts in Oxidative Coupling of Methane Reaction. Catal. Commun.
2008, 9, 960-965.
[32] Palermo, A.; Vazquez, J. P. H.; Lee, A. F.; Tikhov, M. S.; Lambert, R. M., Critical
Influence of the Amorphous Silica-to-Cristobalite Phase Transition on the Performance of
Mn/Na2WO4/SiO2 Catalysts for the Oxidative Coupling of Methane. J. Catal. 1998, 177, 259-
266.
[33] Wu, J.; Li, S., The Role of Distorted WO4 in the Oxidative Coupling of Methane on
Supported Tungsten Oxide Catalysts. J. Phys. Chem. 1995, 99, 4566-4568.

83
[34] Elkins, T. W.; Hagelin-Weaver, H. E., Characterization of Mn–Na2WO4/SiO2 and Mn–
Na2WO4/MgO Catalysts for the Oxidative Coupling of Methane. Appl. Catal., A. 2015, 497,
96-106.
[35] Wang, H.; Schmack, R.; Paul, B.; Albrecht, M.; Sokolov, S.; Rümmler, S.; Kondratenko,
E. V.; Kraehnert, R., Porous Silicon Carbide as a Support for Mn/Na/W/SiC Catalyst in the
Oxidative Coupling of Methane. Appl. Catal., A. 2017, 537, 33-39.
[36] Wang, P.; Zhao, G.; Wang, Y.; Lu, Y., MnTiO3-Driven Low-Temperature Oxidative
Coupling of Methane over TiO2-Doped Mn2O3-Na2WO4/SiO2 Catalyst. Sci. Adv. 2017, 3,
e1603180.
[37] Godini, H. R.; Gili, A.; Görke, O.; Arndt, S.; Simon, U.; Thomas, A.; Schomäcker, R.;
Wozny, G., Sol–Gel Method for Synthesis of Mn–Na2WO4/SiO2 Catalyst for Methane
Oxidative Coupling. Catal. Today 2014, 236, 12-22.
[38] Yildiz, M.; Aksu, Y.; Simon, U.; Kailasam, K.; Goerke, O.; Rosowski, F.; Schomäcker,
R.; Thomas, A.; Arndt, S., Enhanced Catalytic Performance of MnxOy–Na2WO4/SiO2 for the
Oxidative Coupling of Methane Using an Ordered Mesoporous Silica Support. Chem.
Commun. 2014, 50, 14440-14442.
[39] Karakaya, C.; Zhu, H.; Loebick, C.; Weissman, J. G.; Kee, R. J., A Detailed Reaction
Mechanism for Oxidative Coupling of Methane over Mn/Na2WO4/SiO2 Catalyst for Non-
isothermal Conditions. Catal. Today 2018, 312, 10-22.
[40] Ohyama, J.; Nishimura, S.; Takahashi, K., Data Driven Determination of Reaction
Conditions in Oxidative Coupling of Methane via Machine Learning. ChemCatChem 2019, 11,
1-8.

84
Chapter 3
Factors to influence low-temperature performance of supported Mn–
Na2WO4 in oxidative coupling of methane

85
Abstract: The oxidative coupling of methane is an effective approach for directly
upgrading methane to valuable products. Among known OCM catalysts, Mn–
Na2WO4/SiO2 is a promising candidate for an industrial application with superior
catalytic performance and high stability. In the last chapter, I had found that the
performance of Mn–Na2WO4 significantly depends on the choice of support materials.
Here, a variety of Mn–Na2WO4 catalysts were prepared using different Si-based
materials as supports. The OCM performance of these catalysts was evaluated by a
high-throughput screening instrument that had been developed in the last chapter. The
relationship between the catalyst performance and the choice of support materials was
studied in detail on the basis of characterization using Raman spectroscopy, X-ray
diffraction, elemental mapping, and X-ray photospectroscopy.
Keywords: Oxidative coupling of methane, Mn–Na2WO4, support materials, high-
throughput screening, characterization.

86
3.1. Introduction
Owing to the enormous proven reverses of natural gas and the depleting reserves
of crude oil, research interests have been focused on the development of technology
towards selective conversion of methane into more valuable products [1,2]. Currently,
methane is industrially transformed into methanol or higher hydrocarbons through
stream reforming (to form a mixture of CO and H2), followed by the Fisher-Tropsch
process [3]. However, this transformation consists of multiple energy intensive
processes [1,3]. Thus, one-step or direct conversion of methane to ethylene, methanol,
and formaldehyde has been desired [3]. Among them, the oxidative coupling of
methane (OCM) into C2 products has been intensively studied over three decades [4].
The major challenge of this reaction arises from the fact that methane, comprised solely
of weakly polarized C-H bonds, is extremely stable [5]. The C-H bond activation of
methane requires a relatively high temperature as well as oxygen-rich atmosphere,
resulting in undesired side reactions (e.g. complete combustion) [5,6]. This
encompasses a tradeoff between the conversion and selectivity as an intrinsic nature of
OCM and the main reason of unsuccessful industrialization. Hence, the development
of novel OCM catalysts with a special emphasis on the conversion-selectivity tradeoff
is an emerging task.
In an endeavor to find performant OCM catalysts, a number of catalysts have
been reported in the past three decades. However, few catalysts could fulfill the C2 yield
over 30% (criteria for industrialization) in a fixed-bed reactor configuration [4]. So far,
the best OCM catalysts could give 30–50% of the methane conversion and 40–80% of
the C2 selectivity, resulting in the C2 yield from 18 to 25% [4,7]. Li/MgO, one of the
most studied catalysts, tends to lose its activity in just a few hours on stream [8]. Mn–
Na2WO4/SiO2 is one of a few promising catalysts for OCM due to its good C2 selectivity

87
and high stability [9]. Attempts to improve the performance of this ternary system have
been hardly successful [9-11]. For example, substituion of Mn by other redox-active
elements [12], substituion of Na by other alkaline or alkaline earth elements [9],
replacement of WO42– by other Lewis acidic anions [13], and utilization of other
support materials [11,14] were found to lower the C2 yield in most of cases, except
when unusual conditions for Mn–Na2WO4/SiO2 were adopted [5,15]. In chapter 2, I
developed a high-throughput screening (HTS) instrument that automates the
performance evaluation of 20 catalysts placed in parallel fixed-bed reactors at a
predefined set of reaction conditions. The instrument was used to evaluate 40 catalysts
that were derived from Mn–Na2WO4/SiO2 [16]. In agreement with previous literature,
any substitution did not largely upgrade the best C2 yield of individual catalysts from
that of Mn–Na2WO4/SiO2. Contrary, by testing the catalysts in a wide range of
conditions, it was newly found that the choice of supports largely changes the response
of Mn–Na2WO4 to different reaction conditions, especially, in terms of low-
temperature methane activation and C2 selectivity tolerance to harsh conditions, i.e. two
most important properties for coping with the conversion-selectivity tradeoff.
In this chapter, I report a subsequent research: Mn–Na2WO4 catalysts supported
on 20 different Si-based materials were tested in a wide range of conditions using the
above-mentioned HTS instrument. Their responses to the reaction conditions and the
origin of different responses were studied with the aid of Raman spectroscopy, X-ray
diffraction, elemental mapping based on scanning electron microscopy, and X-ray
photoelectron spectroscopy. The mechanism of good activity at low temperature of
some Si-based supports will elucidated, which promise a better performance for Mn–
Na-W-Si system toward the industrial target.

88
3.2. Experimental
3.2.1. Materials
Metal precursors, manganese (II) nitrate (Wako) and sodium tungstate (Sigma-
Aldrich), were used as received. In the last chapter, it was found that some types of Si-
based supports showed superior performance under milder conditions. In order to
explore better Si-based supports for the Mn–Na2WO4 as well as to obtain a mechanistic
insight, several types of supports were selected here with variations in the pore size and
shape, the amount of impurity (aluminum or titanium), the cation type, and the surface
area. These supports are listed in Table 3.1. They were supplied from Tosoh
Corporation, Japan Reference Catalyst (JRC) Committee of the Catalysis Society of
Japan, ACS Material, Kanto Chemical Corporation, and Sigma-Aldrich.
Table 3.1. List of supports
Type Name Trade name Pore size Si/Al(Ti)a
Cation type SBET
b
(Å) (mol/mol) (m2/g)
Al-Si zeolite BEA(25) JRC-Z-HB25 6.5 25 H+ 494
BEA(28) HSZ-930NHA 6.5 28 NH4+ 590
BEA(41) HSZ-940NHA 6.5 41 NH4+ 580
BEA(42.2) HSZ-941HOA 6.5 42.2 H+ 520
BEA(104) HSZ-960HOA 6.5 104 H+ 560
BEA(150) JRC-HB150 6.5 150 H+ 607
BEA(440) HSZ-980HOA 6.5 440 H+ 500
BEA(1700) HSZ-990HOA 6.5 1700 H+ 470
ZSM(22.5) HSZ-820NHA 5.8 22.5 NH4+ 510
ZSM(23.9) HSZ-822HOA 5.8 23.9 H+ 330
ZSM(37) HSZ-840HOA 5.8 37 H+ 330
ZSM(39) HSZ-840NHA 5.8 39 NH4+ 330
ZSM(90) JRC-Z5-90NA 5.8 90 Na+ 300
ZSM(1880) HSZ-891HOA 5.8 1880 H+ 310
ZSM(2120) HSZ-890HOA 5.8 2120 H+ 310
Ti-Si zeolite TS-1 TS-1 5.0 80 n.a. 420
Mesoporous silica SBA-15 SBA-15 60 n.a. n.a. >550
MCM-41 MCM-41 45 n.a. n.a. 1000
Silica gel SiO2 60N 60 n.a. n.a. 650
Silicon carbine SiC SiC n.a. n.a. n.a. 1.5 a,b
The information of Si/Al ratio and surface area are taken from producers, where information from
SiC was measured.

89
3.2.2. Catalyst preparation
The catalysts were prepared based on a co-impregnation method. A support
powder (1.0 g) was impregnated with an aqueous solution (4–5 mL) containing
Mn(NO3)2·6H2O (0.345 mmol) and Na2WO4·2H2O (0.269 mmol) at 50 °C in 6 hours.
The product was dried at 110 °C, followed by calcination at 1000 °C for 3 hours. The
theoretical amounts of the active components were 5.0 wt% for Na2WO4 and 2.0 wt%
for Mn to the support.
3.2.3. Catalyst test
The OCM performance of catalysts was evaluated based on the high-throughput
screening (HTS) instrument, which had been developed in the last chapter [16]. The
instrument consists of a mixed gas generator, a flow distributor system, 20 reaction
tubes, an electric furnace, an autosampler, and a quadrupole mass spectrometer (QMS).
The gas mixer provides a gas mixture of CH4/O2/Ar with the desired gas composition.
The gas mixture is equally divided into 20 portions, and transferred to 20 reaction tubes
made of quartz. A catalyst bed of 10 mm in height is set in the middle of each reaction
tube with the aid of quartz wool. The 20 reaction tubes are placed symmetrically in a
hollow electric furnace. The furnace consists of three temperature zones (T1–3). Here,
the temperature of the middle zone (T2) was set 100 °C higher than the temperature of
the upstream and downstream zones (T1,3) in order to suppress less selective gas-phase
reaction [16]. Effluent gas which comes out from the 20 reaction tubes is sequentially
transferred to the sampling line, and then analyzed by QMS. The programmed sequence
of reaction conditions is shown in Figure 3.1. The temperature was varied from 900 to
850, 800, 750, and 700 °C, and at each temperature, the total flow volume (Q = 10, 15,

90
and 20 mL/min/channel), the CH4/O2 ratio (2, 4, and 6 mol/mol), and the Ar
concentration (PAr = 0.15, 0.40, 0.70 atm) were stepwise varied. The OCM performance
of 20 catalysts was thus evaluated at 135 conditions in an automated fashion.
Figure 3.1. Employed programmed sequence of reaction conditions. Note that each
temperature step includes a program for the gas flow volume and composition.
3.2.4. Catalyst characterization
Selected catalysts were characterized by several techniques. Raman spectra of
the catalysts were recorded on a Laser Raman spectrometer (NRS-4100, JASCO) with
a 532 nm laser. A polynomial method was used for background subtraction. Powder X-
ray diffraction was performed (CuKα radiation, λ = 0.154 nm) on a SmartLab (Rigaku)
X-ray diffractometer. The diffraction patterns were collected in the 2θ range of 5–40°
with a step size of 0.008°. The surface morphology and elemental distribution of the
catalysts were studied by scanning electron microscopy with energy dispersive X-ray
spectroscopy (SEM-EDS). A small amount of a sample powder was placed on a carbon
tape. The measurements were performed on a tabletop microscope (Hitachi TM
3030Plus, 15 kV) equipped with an EDS detector. The near surface chemical analysis
was performed based on X-ray photoelectron spectroscopy (XPS, Kratos AXIS-Ultra
DLD) using monochromatic Al-Kα radiation. The pass energy of the concentric

91
hemispherical analyzer was set at 40 eV. A narrow scan was recorded in 240 s with a
step increment of 0.1 eV and repeated at least 5 times for each element. Powder samples
were loaded on a sample holder through double-sided adhesive copper tape. The
binding energies (BE) were calibrated using the C1s peak of surface hydrocarbons at
285.0 eV as the internal reference.

92
3.3. Results and discussion
3.3.1 Catalytic test
The OCM performance of 20 catalysts, comprising of Mn–Na2WO4 supported
on different Si-based supports, were evaluated in 135 reaction conditions. The obtained
2700 data are represented in a scatter plot, where the relationship between the CH4
conversion and the C2 selectivity is displayed with the corresponding C2 yield depicted
in the color axis to understand a general behavior of catalyst performance (Figure 3.2).
There was a boundary of limiting the CH4 conversion and C2 yield. The maximum CH4
conversion and C2 yield were respectively recorded at 47% and 25.6%, while the C2
selectivity varied from 0 to 100%, which results in C2 yield varied from 0-25 %.
Figure 3.2. Visualization of 2700 data points based on a scatter plot for the CH4
conversion and C2 selectivity. The C2 yield as their product is indicated by the color.
Next, I compare the impact of different Si-based supports on the OCM
performance of the catalysts. For this, the color axis of the scatter plot in Figure 3.2 was

93
changed to various features of the supports, and then the Si/Al ratio was identified as
the most impactful feature. This is shown in Figure 3.3a. It can be seen that the upper
boundary of the C2 yield becomes less than 10% for the supports having the Si/Al ratio
lower than 50. The best C2 yield of individual catalysts was compared in Figure 3.3b,
and relevant data are listed in Table 3.2. These again confirmed the negative influence
of using Al-rich zeolites as support materials. All of the catalysts using pure silica
supports (SBA-15, MCM-41, SiO2) and SiC exhibited high performance: 43–47% CH4
conversion, 53–57% C2 selectivity, and 24.3–25.6% C2 yield, in agreement with the
literature data [9-11,16], TS-1, a titanium-silicate zeolite, could also be a good support
(23.4% C2 yield) [5]. On the contrary, the performance of catalysts using aluminum
silicate zeolites was greatly different, especially in relation to the variation in the Si/Al
ratio. The performance became comparable to that of the pure silica when high-silica
zeolites were employed, while the C2 yield became less than 10% for Al-rich zeolites.
Figure 3.3. Catalyst performance among Mn–Na-W/Si-based supports with their
impurity a) Scatter plot of all data with color map depicted Si/Al ratio, b) best C2 yield
of all catalysts.

94
Table 3.2. List of data corresponding to the best C2 yield for individual catalysts.
Sample C2 yield
(%)
CH4 conv.
(%)
C2 sel.
(%)
Temp.
(°C)
Q
(mL/min)
CH4/O2
(mol/mol)
PAr
(atm)
ZSM(22.5) 8.7 33 26.4 800 20 2 0.4
ZSM(23.9) 8.5 27.6 30.9 800 20 2 0.7
BEA(25) 8.4 33.1 25.4 800 20 2 0.15
BEA(28) 8.3 31.5 26.3 800 20 2 0.4
ZSM(37) 7.4 34.5 21.5 800 20 2 0.15
ZSM(39) 8.3 26.3 31.6 800 20 2 0.7
BEA(41) 7.3 32.5 22.3 800 20 2 0.7
BEA(42.2) 8.6 30.5 28.2 800 20 2 0.4
ZSM(90) 23.1 44.6 51.9 800 20 2 0.7
BEA(104) 12.6 37.3 33.9 800 20 2 0.7
BEA(150) 22.6 43.3 52 800 20 2 0.7
BEA(440) 23.5 44.6 52.6 800 20 2 0.7
BEA(1700) 22.6 44.8 50.6 800 20 2 0.7
ZSM(1880) 24.4 45.1 54.2 800 20 2 0.7
ZSM(2120) 24.6 46.8 52.6 800 20 2 0.7
TS-1 23.4 43.9 53.3 800 20 2 0.7
SBA-15 25.6 46.2 55.4 800 20 2 0.7
MCM-41 25.0 47 53.2 800 20 2 0.7
SiC 24.3 43.5 55.9 800 20 2 0.7
SiO2 24.6 43.2 56.9 800 15 2 0.7

95
Figure 3.4. Variation of the C2 yield in response to the temperature and the CH4/O2
ratio.
In general, SiO2 is believed as the best support for Mn–Na2WO4. A potential
explanation is that the cristbalite phase of SiO2, formed at a calcination temperature in
the presence of Na+, strongly stabilizes tetrahedral WO42– as active species [12,13,17].
On the other hand, in Chapter 2, I found that the choice of Si-based supports greatly
affected the response of the catalysts to the variation of reaction conditions, especially
when the conditions were deviated off the best conditions [16,18]. This differentiated
the ability of catalysts in terms of low-temperature methane activation as well as C2
selectivity tolerance to harsh conditions.
Accordingly, the performance of the catalysts with the best C2 yield over 20%
was compared at different temperatures and CH4/O2 ratios (Figure 3.4). At 800 °C and

96
the CH4/O2 ratio of 2, corresponding to the best conditions for all the good catalysts,
the C2 yield was not largely different among the catalysts (22-25.5%). However, the
difference among the catalysts largely expanded when the reaction conditions were
deviated from the optimum ones: 9–16% at (750 °C, CH4/O2=2), 6–13% at (750 °C,
CH4/O2 =4), and 22–25.5% at (800 °C, CH4/O2 =2). Further deviation rather reduced
the difference, as all the catalysts were basically not performant in these conditions. To
comprehend the different behaviors of the catalysts at deviated conditions, the C2 yield
is broken down into the CH4 conversion and the C2 selectivity, as depicted in Figure
3.5.

97
Figure 3.5. Process dependence of catalyst performance: (a) (Temp, CH4/O2) = (a)
(800 °C, 2 mol/mol), (b) (750 °C, 2 mol/mol), (c) (750 °C, 4 mol/mol), and (d) (800 °C,
2 mol/mol). The total flow volume and the partial pressure of Ar are fixed at 20 mL/min
and 0.70 atm, respectively.

98
As can be seen in Figure 3.5a, Mn–Na2WO4 showed consistent performance at
800 °C and CH4/O2 = 2 when immobilized on silica-rich supports (SBA-15, MCM-41,
ZSM(2120), ZSM(1880), ZSM(90), BEA(440), BEA(150), SiO2 and, SiC). The CH4
conversion of 40‒50% and the C2 selectivity of 50‒60% resulted in the C2 yield of 22‒
25.6% C2 yield. Such high performance of Mn–Na2WO4 at similar conditions was
reported in many literature reports [4,10,16]. On the other hand, the deviation of process
conditions from the optimum ones increased the deviation of the performance among
these catalysts: a great difference when the temperature decreases to 750 °C with
CH4/O2 ratio of 2. At this milder condition, the performance among the performant
catalysts were decrease sharply because of the trade-off between conversion and
selectivity; but their variation was comparable among Si-based supports. The
mesoporous sillica (MCM-41, SBA-15) and BEA(1700) exhibited the highest CH4
conversion. Non-ordered structured like SiC and SiO2 showed the least activity. In
general, BEA-type zeolite support showed higher CH4 conversion compared to ZSM-
typed zeolite, while ZSM keep much higher C2 selectivity. Top 4 catalysts with the
highest C2 yields were obtained for Mn–Na2WO4 when cooperated in supports such as
SBA-15 (15.93%), MCM-41 (15.72%), TS-1 (15.17%), and BEA(1700) (14.96%),
which were able to keep reasonable high CH4 conversion and C2 selectivity. Such
observation was further validated at milder condition by an increase at the CH4/O2 ratio
of 4 at 750 °C in Figure 3.4c. At this condition, methane activation becomes more
difficult, catalysts which exhibited better CH4 conversion at CH4/O2 ratio of 2 are
obviously advantageous toward C2 yield at high CH4/O2 ratio. However, under harsh
condition (850 °C and CH4/O2=2), SiO2 give the highest C2 yield. The highest C2 yield
might come from the kept high C2 yield, while the CH4 conversion appeared not much
deviated among catalysts supports. Therefore, characterization should be conducted for

99
clarifying the origin of difference between catalysts activity among Mn–Na2WO4/Si-
based catalysts.
3.3.2. Catalyst characterization
In order to clarify the origin of different performance of Mn–Na2WO4 supported
on various Si-based supports, catalysts were characterized by several techniques. First,
Raman spectroscopy was employed to investigate the structure of catalysts. The spectra
of the catalysts are shown in Figure 3.6. Mn–Na2WO4/SiO2 is regarded as the most
standard catalyst. Its spectrum exhibits two bands at 960 and 926 cm−1 due to the
tetrahedral WO42‒, and strong band at 409 cm−1 ascribed to α-cristobalite and the exist
of Mn2O3 peak in some catalyts. The co-existence of tetrahedral WO42‒, Mn2O3, and
SiO2 in the α-cristobalite form is believed as the prerequisite for obtaining highly
selective Mn–Na2WO4 catalysts [13,17,19,20]. The main active site of this catalyst is
tetrahedral WO42‒, which undergoes a catalytic redox cycle between W6+ and W5+/4+
based on the homolytic dissociation of CH4 and subsequent oxidation [9,13,16]. Hence,
it was considered that Si-based supports being able to form tetrahedral WO42‒ Mn2O3,
and α-cristobalite would afford the performance comparable to that of Mn–
Na2WO4/SiO2. This hypothesis was confirmed by cross-referencing between the
catalytic performance in Table 3.2 and the Raman spectra in Figure 3.6: The catalysts
which exhibited the best C2 yield over 20% satisfied the prerequisite. On the other hand,
any Si-based supports, which mediate the formation of undesired mixed oxides instead
of preferred oxides, would result in poor performance [9,10,17]. Indeed, the poor
catalysts possessed a band at around 890 cm−1 for octahedral tungstate [21], while the
bands of the tetrahedral WO42‒ and α-cristobalite almost completely vanished. In the

100
case of Al-rich zeolites, no peak of Al was observed in the spectra. The high-
temperature calcination melts zeolites. The Al atoms are distributed in the resultant
SiO2, thus restricting the formation of α-cristobalite [9,10,17]. Besides, acidic Al sites
binds ethylene for its combustion [17].
Figure 3.6. Raman spectra of Mn–Na2WO4 catalysts prepared using different Si-based
supports. Na2WO4 (▼), α‒cristobalite (●), MnWO4 (▲), Mn2O3 (), and MnTiO3
MnTiO3 (✧), Si-C (Δ).
The XRD spectra further confirmed the phase difference among the catalysts
(Figure 3.7). It is clear that the XRD patterns among good catalysts shared similar
features arising from the co-existence of Na2WO4, Mn2O3 and α-cristobalite phase
[14,22,23]. A minor presence of MnWO4 was observed in some catalysts (SiC, TS-1,
and SBA-15). In addition, besides of Na2WO4, Mn2O3 and α-cristobalite, there are

101
several peak of SiC at 33, 36, 38° [24,25]. The crystallite sizes of Na2WO4 and Mn2O3
calculated based on the Scherrer equation were found to be in agreement with literature
results [26]. The poor catalysts showed poor crystallinity (as seen from noisy XRD
patterns) and contained the undesired mixed oxides (MnWO4, NaWO3, and Mn2O3).
Likewise, the Raman and XRD results afforded a consistent picture: The formation of
tetrahedral WO42‒, as the main active phase, premises the formation of α-cristobalite,
otherwise it forms non-selective mixed oxide phases. Mn–Na2WO4/TS-1 is exceptional
catalyst: there is the peak of interaction between Ti and Mn, which peak of MnTiO3
shown in XRD and Raman analysis. In the literature, it could be found that the addition
of Ti accelerate the generation of oxygen spillover from Mn2O3 to the Na2WO4, thus
increasing the performance of Mn–Na2WO4.

102
Figure 3.7. XRD patterns of Mn–Na2WO4 catalysts prepared using different Si-based
supports. Na2WO4 (▼), Tridymite (■),α-cristobalite (●), MnWO4 (▲), Mn2O3 (),
NaWO3 (∇).
The good and poor catalysts were clearly differentiated based on the phase
structure of oxides. Next, I attempted to understand the difference among the good
catalysts. It was suspected that the different performance of the catalysts at mild
conditions could originate from different surface properties, such as the morphology,
the dispersion of the active phase, and the surface composition. Accordingly, SEM–
EDS measurements were performed for selected catalysts with the best C2 yield over
20% (Figure 3.8).

103
Figure 3.8. SEM and EDS results for selected Mn–Na2WO4 catalysts with the best C2
yield over 20%. Scale bar indicated 5 μm.
The EDS mapping results in Figure 3.8 reveals that SiO2- and SiC-supported
catalysts possess an inhomogeneous distribution of the active metals. In particular, the
SiO2-supported catalyst exhibited a local enrichment of Mn, while the Na and W special
distribution was inhomogeneous for the SiC-supported catalyst. Contrary, the EDS
results for catalysts based on ordered-porous supports (BEA(1700), TS-1, SBA-15)
showed a homogeneous dispersion of all the three active elements.. Their morphology
also looked similar with each other. .

104
Cross-referencing the results for catalytic activity at 750 °C (Figures 3.5b,c) and
the EDS results (Figure 3.8) suggests that the catalytic activity at a lower temperature
is correlated with the uniform distribution of active elements throughout the surfaces
of the supports. Supports with irregular pores exhibited a less uniform distribution of
the active elements and thus poorer performance compared to supports with ordered
pores (SBA-15 or high-silica zeolites). Metal precursors dispersed better in the ordered
pores of zeolites or mesoporous silica during the impregnation. This leads to a uniform
distribution of active elements after the calcination. Better dispersion of active elements
results in more accessible sites which is believe to be important to enable low-
temperature activation of CH4.
Table 3.3. Near-surface composition for selected Mn–Na2WO4 catalysts with the best
C2 yield over 20%.a
Support O(1s)(MOx) O(1s)(SiO2) Si(2p) W(4f7/2) Na(1s) Mn(2p)
BE %a BE %a BE %a BE %a BE %a BE %a
BEA (150) 529.9 2.9 532.3 59.5 103 32.3 35.3 0.9 1072 4.1 641.5 0.2
BEA (440) 530.2 4.2 532.4 55.7 103.2 34.5 35.4 1.1 1072 4.2 641.7 0.4
BEA
(1700)
530 5.0 532.4 55.1 103.2 35 35.4 1.1 1072 3.4 641.6 0.3
ZSM (90) 529.8 2.9 532.1 59.2 102.7 29.9 35 0.9 1072 6.7 641.5 0.4
ZSM
(2120)
530.2 4.4 532.5 56.3 103.2 34.7 35.3 0.9 1072 3.1 641.8 0.4
ZSM
(1880)
530.2 4.9 532.6 56.3 103.4 34 35.5 1.0 1071 3.4 642 0.4
SBA-15 530.1 5.0 532.4 53.5 103.3 36.6 35.5 1.3 1071 3.3 641.9 0.3
TS-1 530.1 6.9 532.3 53.5 103.2 33.5 35.4 1.0 1072 4.7 641.7 0.4
SiO2 530 3.9 532.6 58.5 103.2 33.4 35.1 0.7 1072 2.8 641.9 0.6 a Loading: 2% Mn, 5% Na2WO4.
.
Among the ordered porous supports, mesoporous silica (SBA-15) gave a higher
activity compared to that of BEA and ZSM at a lower temperature. As their morphology
and dispersion of active elements looked quite identical, the surface composition of the
catalysts was examined based on XPS. Table 3.3 compares the near-surface
concentration of the metals (Na, Mn, and W) for selected catalysts with the best C2

105
yield over 20%. It is clear that the surface was enriched in Na for all the catalysts, and
its near-surface concentration was much higher than those of W and Mn when
compared to the theoretical composition. Apparently, during the high-temperature
calcination, light elements like Na is easily migrated from the inner parts of the catalysts
to the near-surface area, resulting in the observed near-surface enrichment in Na. On
the other hand, the SBA-15-supported catalyst had the highest near-surface
concentration of W (1.3%a), followed by BEA (1.1%a) and ZSM (0.9–1.0%a), which
is highly consistent with the order of CH4 conversion of these catalysts at 750 °C. This
fact together with SEM-EDS results suggests that the number of tetrahedral WO42‒
active sites available is the most important for the low-temperature CH4 activation. The
higher concentration of W on the near surface of the SBA-15-supported catalyst
compared to the ZSM- and BEA-supported catalysts could be attributed to the pore size
of the support itself. The large pore size of SBA-15 plausibly leads to more uniform
impregnation of the metal precursor. The higher CH4 conversion of BEA than ZSM
zeolite further confirmed the advantage of the larger pore size on the dispersion of W.

106
3.4. Conclusion
In this chapter, the OCM performance of Mn–Na2WO4 catalysts supported on
various Si-based supports were thoroughly investigated in order to discover the origin
of their different performance. It was found that the pure or high silica supports were
suitable to immobilize Mn–Na2WO4 When such supports were employed, the catalysts
exhibited similar performance at 800 °C. However, at a lower temperature, mesoporous
silica, SBA-15, appeared to be most promising in terms of their ability to maintain the
catalytic performance. Through a series of characterization, it was elucidated that the
large and ordered pores of SBA-15 is essential for improving the dispersion of
tetrahedral WO2‒ active sites macroscopically over particles and microscopically newer
the surface. The OCM reaction suffers from an intrinsic tradeoff between the CH4
conversion and C2 selectivity, which becomes severer at a higher temperature. The
structure-performance relationship clarified here is directly useful for developing
catalysts operatable at a lower temperature.

107
References
[1] B. Wang, S. Albarracín–Suazo, Y. Pagán–Torres, E. Nikolla, Advances in methane
conversion processes, Catal. Today, 285 (2017) 147–158.
[2] B.L. Farrell, V.O. Igenegbai, S. Linic, A Viewpoint on Direct Methane Conversion
to Ethane and Ethylene Using Oxidative Coupling on Solid Catalysts, ACS Catal., 6
(2016) 4340–4346.
[3] E.V. Kondratenko, T. Peppel, D. Seeburg, V.A. Kondratenko, N. Kalevaru, A.
Martin, S. Wohlrab, Methane conversion into different hydrocarbons or oxygenates:
current status and future perspectives in catalyst development and reactor operation,
Catal. Sci. Technol., 7 (2017) 366–381.
[4] U. Zavyalova, M. Holena, R. Schlögl, M. Baerns, Statistical analysis of past
catalytic data on oxidative methane coupling for new insights into the composition of
high–performance catalysts, ChemCatChem, 3 (2011) 1935–1947.
[5] P. Wang, G. Zhao, Y. Wang, Y. Lu, MnTiO3–driven low–temperature oxidative
coupling of methane over TiO2–doped Mn2O3–Na2WO4/SiO2 catalyst, Sci. Adv., 3
(2017) e1603180.
[6] J. Sun, J.W. Thybaut, G.B. Marin, Microkinetics of methane oxidative coupling,
Catal. Today, 137 (2008) 90–102.
[7] P. Schwach, X. Pan, X. Bao, Direct conversion of methane to value–added
chemicals over heterogeneous catalysts: challenges and prospects, Chem. Rev., 117
(2017) 8497–8520.
[8] L. Olivier, S. Haag, H. Pennemann, C. Hofmann, C. Mirodatos, A.C. van Veen,
High–temperature parallel screening of catalysts for the oxidative coupling of methane,
Catal. Today, 137 (2008) 80–89.
[9] S. Arndt, T. Otremba, U. Simon, M. Yildiz, H. Schubert, R. Schomäcker, Mn–
Na2WO4/SiO2 as catalyst for the oxidative coupling of methane. What is really known?,
Appl. Catal., A, 425–426 (2012) 53–61.
[10] M. Yildiz, Y. Aksu, U. Simon, T. Otremba, K. Kailasam, C. Göbel, F. Girgsdies,
O. Görke, F. Rosowski, A. Thomas, R. Schomäcker, S. Arndt, Silica material variation
for the MnxOy–Na2WO4/SiO2, Appl. Catal., A, 525 (2016) 168–179.
[11] M. Yildiz, U. Simon, T. Otremba, Y. Aksu, K. Kailasam, A. Thomas, R.
Schomäcker, S. Arndt, Support material variation for the MnxOy–Na2WO4/SiO2
catalyst, Catal. Today, 228 (2014) 5–14.

108
[12] A. Malekzadeh, A.K. Dalai, A. Khodadadi, Y. Mortazavi, Structural features of
Na2WO4–MOx/SiO2 catalysts in oxidative coupling of methane reaction, Catal.
Commun., 9 (2008) 960–965.
[13] S. Ji, T. Xiao, S. Li, L. Chou, B. Zhang, C. Xu, R. Hou, A.P.E. York, M.L.H.
Green, Surface WO4 tetrahedron: the essence of the oxidative coupling of methane over
M–W–Mn/SiO2 catalysts, J. Catal., 220 (2003) 47–56.
[14] T.W. Elkins, H.E. Hagelin–Weaver, Characterization of Mn–Na2WO4/SiO2 and
Mn–Na2WO4/MgO catalysts for the oxidative coupling of methane, Appl. Catal., A,
497 (2015) 96–106.
[15] M. Yildiz, Y. Aksu, U. Simon, K. Kailasam, O. Goerke, F. Rosowski, R.
Schomäcker, A. Thomas, S. Arndt, Enhanced catalytic performance of MnxOy–
Na2WO4/SiO2 for the oxidative coupling of methane using an ordered mesoporous
silica support, Chem. Commun., 50 (2014) 14440–14442.
[16] T.N. Nguyen, T.P.N. Tran, K. Takimoto, A. Thakur, S. Nishimura, J. Ohyama, I.
Miyazato, L. Takahashi, J. Fujima, K. Takahashi, T. Taniike, High–Throughput
Experimentation and Catalyst Informatics for Oxidative Coupling of Methane, ACS
Catal., 10 (2020) 921–932.
[17] S. Hou, Y. Cao, W. Xiong, H. Liu, Y. Kou, Site requirements for the oxidative
coupling of methane on SiO2–supported Mn catalysts, Ind. Eng. Chem. Res., 45 (2006)
7077–7083.
[18] C. Karakaya, H. Zhu, C. Loebick, J.G. Weissman, R.J. Kee, A detailed reaction
mechanism for oxidative coupling of methane over Mn/Na2WO4/SiO2 catalyst for non–
isothermal conditions, Catal. Today, 312 (2018) 10–22.
[19] A. Palermo, J.P.H. Vazquez, A.F. Lee, M.S. Tikhov, R.M. Lambert, Critical
influence of the amorphous silica–to–cristobalite phase transition on the performance
of Mn/Na2WO4/SiO2 catalysts for the oxidative coupling of methane, J. Catal., 177
(1998) 259–266.
[20] A. Palermo, J.P.H. Vazquez, R.M. Lambert, New efficient catalysts for the
oxidative coupling of methane, Catal. Lett., 68 (2000) 191–196.
[21] R.T. Yunarti, S. Gu, J.–W. Choi, J. Jae, D.J. Suh, J.–M. Ha, Oxidative coupling of
methane using Mg/Ti–doped SiO2–supported Na2WO4/Mn catalysts, ACS Sustain.
Chem. Eng, 5 (2017) 3667–3674.

109
[22] J. Wang, L. Chou, B. Zhang, H. Song, J. Zhao, J. Yang, S. Li, Comparative study
on oxidation of methane to ethane and ethylene over Na2WO4–Mn/SiO2 catalysts
prepared by different methods, J. Mol. Catal. A: Chem., 245 (2006) 272–277.
[23] A. Palermo, J.P. Holgado Vazquez, A.F. Lee, M.S. Tikhov, R.M. Lambert, Critical
influence of the amorphous silica–to–cristobalite phase transition on the performance
of Mn/Na2WO4/SiO2 catalysts for the oxidative coupling of methane, J. Catal., 177
(1998) 259–266.
[24] H. Liu, D. Yang, R. Gao, L. Chen, S. Zhang, X. Wang, A novel Na2WO4–Mn/SiC
monolithic foam catalyst with improved thermal properties for the oxidative coupling
of methane, Catal. Commun., 9 (2008) 1302–1306.
[25] J. Kim, L.–H. Park, J.–M. Ha, E.D. Park, Oxidative Coupling of Methane over
Mn2O3–Na2WO4/SiC Catalysts, Catalysts, 9 (2019) 363.
[26] N.S. Hayek, N.S. Lucas, C. Warwar Damouny, O.M. Gazit, Critical Surface
Parameters for the Oxidative Coupling of Methane over the Mn–Na–W/SiO2 Catalyst,
ACS Appl. Mater. Interfaces, 9 (2017) 40404–40411.

110
Chapter 4
Learning catalyst design based on bias-free dataset
for oxidative coupling of methane

111
Abstract: The discovery of synergistic multicomponent catalysts has been hardly achieved
without preknowledge-driven try-and-error cycles. Here, I generated 300 M1–M2–M3/Support
catalysts based on random sampling of a huge materials space, and evaluated their performance
in the oxidative coupling of methane using a high-throughput screening instrument. Thus
acquired catalyst big data was used to derive a guideline of combinatorial catalyst design. It
was proven that the catalyst performance was determined by the performance of constituent
combinations, not by the inclusion of specific elements. Novel synergistic combinations were
identified, and the catalyst design was successfully generalized based on the decision tree
regression analysis.
Keywords: Oxidative coupling of methane, High-throughput experimentation, Catalyst
informatics, Decision tree, Catalyst design.

112
4.1. Introduction
The history evidences serendipity as one of the major drivers in the field of catalysis
[1-4]. In particular, the design of solid catalysts often premises synergistic combinations of
multiple components. A combination can be synergistic by many causes, e.g. when two
components have complementary or cooperative roles in multi-step catalysis [5-10], when an
auxiliary component promotes/sustains the function of the main component [11-13], when
multiple entities create one specific structure on surfaces [14-18], and so on [19-22]. The
plurality of causes in turn makes estimation difficult: Expected synergy in one aspect does not
necessarily give practical synergy when the combination is negative in other unaccounted
aspects [23]. Exploitation of synergistic combinations is essential for the design of performant
solid catalysts, but they are hardly predictable. This is why serendipity in try and error still
occupies an irreplaceable role. Along with the rise of materials informatics, data science
approaches are extensively applied in the field of catalysis [24]. Since performance prediction
of solid catalysts requests a model to learn combinatorial effects, catalyst informatics would
bring breakthrough on the empirical nature of catalyst development.
Upgrading methane without mediating syngas attracts great attention due to the
increasing availability of natural gas [25]. Oxidative coupling of methane (OCM) indicates the
conversion of methane into C2 products, especially in the presence of molecular oxygen. The
OCM is featured with a persistent conversion-selectivity tradeoff caused by the inertness of
methane with respect to the desired C2 products [26]. Nonetheless, a wide variety of catalysts
are known to improve the C2 yield as compared to the non-catalytic free radical process.
Zavyalova et al. reported a pioneering work on the application of catalyst informatics in OCM
[27]. They applied the analysis of variance to 1870 data that were collected from literature.
Thus identified synergistic combinations (such as Na–La, Na–Mn, and Ba–Sr) were in line
with the understanding of experimentalists. More recently, an elegant meta-analysis approach

113
was presented by Schmack et al. [28]. Physicochemically interpretable hypotheses were
translated into machine-learnable descriptors with the aid of textbook knowledge. They were
evaluated on the literature dataset, and eventually gave a physicochemically interpretable
model that relates the catalyst composition with the C2 yield. The model successfully proposed
the importance of combining carbonate- and oxide-forming elements. On the other hand, as
was stated by the same authors, the model would be negatively affected by inconsistency of
catalyst evaluation processes among literature. Anthropogenic biases present in the literature
dataset would be also an important risk as a model learns such biases [29].
In Chapter 2, a high-throughput screening (HTS) instrument was successfully
developed for automatic performance evaluation of 20 catalysts at a predefined set of reaction
conditions in a fixed-bed configuration [30]. Here, the same HTS instrument was used to
acquire a bias-free and process-consistent OCM dataset. 300 M1–M2–M3/Support catalysts
were prepared, where the four components were randomly selected from a library. Their
performance in OCM was evaluated at 135 conditions. The obtained dataset was analyzed with
the aim to uncover hidden guidelines behind combinatorial catalyst design.

114
4.2. Materials and methods
4.2.1. Materials
Metal precursors used in this work were LiNO3, NaNO3, Mg(NO3)2, KNO3,
Ca(NO3)2·4H2O, Ti(OiPr)4, VOSO4·xH2O (x = 3–5), Mn(NO3)2·6H2O, Fe(NO3)3·9H2O,
Co(NO3)2·6H2O, Ni(NO3)2·6H2O, Cu(NO3)2·3H2O, Zn(NO3)2·6H2O, Sr(NO3)2,
Y(NO3)3·6H2O, ZrO(NO3)2·xH2O (x = 2), (NH4)6Mo7O24·4H2O, Pd(OAc)2, CsNO3, Ba(NO3)2,
La(NO3)3·6H2O, Ce(NO3)3·6H2O, Nd(NO3)3·6H2O, Eu(NO3)3·5H2O, Tb(NO3)3·5H2O,
Hf(OEt)4, and (NH4)10H2(W2O7)6. They were purchased from either of Sigma–Aldrich, Kanto
Chemical, Wako Pure Chemical Industries, and Alfa-Aesar. The following solid powders were
used as supports or as support precursors: Magnesium oxide (MgO, 5.5 m2/g, Kanto Chemical),
aluminum oxide (γ-Al2O3, 150 m2/g, Sumitomo Chemical Industry), silica gel (SiO2, 650 m2/g,
60N, Kanto Chemical), calcium hydroxide (Ca(OH)2, 3.0 m2/g, Wako Pure Chemical
Industries), titanium(IV) oxide (TiO2, 17.4 m2/g, anatase, Kanto Chemical), zirconium(IV)
oxide (ZrO2, 3.2 m2/g, Kanto Chemical), barium hydroxide (Ba(OH)2·8H2O, 1.1 m2/g, Wako
Pure Chemical Industries), lanthanum(III) oxide (La2O3, 8.3 m2/g, Wako Pure Chemical
Industries), and cerium(IV) oxide (CeO2, 3.9 m2/g, Wako Pure Chemical Industries). The
specific surface area of the supports was determined by the Brunauer–Emmett–Teller (BET)
method for the nitrogen adsorption isotherm at 77 K.
4.2.2. Catalyst library
The catalyst library was created by preparing 300 catalysts. Table 4.1 summarizes the
composition, the best performance, and the corresponding conditions for the 300 catalysts. The
catalysts were expressed in the form of M1–M2–M3/Support. The three active elements (M1–
M3) were randomly selected from either of Li, Na, Mg, K, Ca, Ti, V, Mn, Fe, Co, Ni, Cu, Zn,
Sr, Y, Zr, Mo, Pd, Cs, Ba, La, Ce, Nd, Eu, Tb, Hf, W, and “none”, where repetitive selection
of the same element was allowed. They were combined with a support which was randomly

115
picked up from either of MgO, Al2O3, SiO2, CaO, TiO2, ZrO2, BaO, La2O3, and CeO2. Note
that CaO and BaO were obtained from the corresponding hydroxides by calcination. Three-
combinations with repetitions from 28 elements (including none) and 9 supports correspond to
a total of 36,540 catalysts. Three hundreds among 36,540 might not be sufficient to find all the
important trends present in the entire parametric space. However, the 300 catalysts correspond
to sampling of respective elements and supports at least 20 times (Figure 4.1). Moreover, a
majority of the catalysts have never been reported in literature.
The catalysts were prepared according to the method described in Chapter 2 [30]. The
loading of individual elements was fixed at 0.37 mmol to a unit gram of a support. Remarkably,
the loading was duplicated when the same element was doubly selected; no metal precursor
was added when "none" was selected; and so on. A support powder was impregnated with a
solution of selected metal precursors at 50 °C for 6 h. The resultant solid was vacuum dried,
and subjected to calcination at 1000 °C under air for 3 h. Twenty catalysts were produced in
one experiment with the aids of a parallel hot stirrer (Reacti-Therm, Thermo Scientific) and a
centrifugal evaporator (CVE-3100, Eyela).
Table 4.1. Catalyst library. The composition, the best performance, and the corresponding
conditions are shown.a,b,c
No M1 M2 M3 Suppor
t
C2
yield
(%)
CH4
convers
ion (%)
C2
selectivi
ty (%)
CH4/O2
(mol/mol)
Temp.
(°C)
Total
flow
(mL/
min)
PAr
(atm)
1 Li K Mn MgO 8.2 29.0 28.3 2 800 10 0.15
2 Li Fe Tb MgO 4.7 24.7 19.1 2 850 10 0.4
3 Li Fe Hf MgO 2.5 28.1 8.8 2 900 10 0.15
4 Na Na none MgO 7.4 34.0 21.7 2 850 20 0.15
5 Na Ni Y MgO 1.0 24.6 4.1 6 750 20 0.7
6 Na Ce Tb MgO 3.8 32.1 11.9 6 900 20 0.15
7 Na Tb Hf MgO 8.6 30.9 27.7 2 800 20 0.15
8 Na Eu Hf MgO 16.6 35.6 46.7 2 750 10 0.15
9 Mg Ca Zn MgO 2.1 24.0 8.9 4 850 15 0.15
10 Mg Mn none MgO 7.9 27.1 29.0 2 850 20 0.15
11 Mg Zn Eu MgO 15.5 40.9 37.9 2 700 20 0.15
12 Mg Nd none MgO 9.5 35.5 26.8 2 850 20 0.7
13 Ca Zr La MgO 16.1 33.8 47.6 2 750 20 0.15
14 Ti Ni Cs MgO 1.6 33.2 4.8 2 800 20 0.4

116
15 Ti V Ba MgO 8.2 37.7 21.8 2 900 15 0.7
16 V Fe Ni MgO 7.6 34.3 22.0 2 800 15 0.15
17 V Mo Pd MgO 0.7 26.5 2.6 6 900 15 0.7
18 V Tb W MgO 6.7 33.6 19.9 2 850 15 0.15
19 Fe Y Nd MgO 3.6 21.5 16.9 2 800 20 0.15
20 Fe Zr none MgO 7.1 37.8 18.7 2 850 20 0.15
21 Fe Ce Tb MgO 6.2 25.0 25.0 2 800 10 0.15
22 Fe La Hf MgO 6.5 29.3 22.2 2 850 15 0.15
23 Co Zn Sr MgO 1.0 31.0 3.2 6 850 20 0.15
24 Co Zn Tb MgO 5.7 36.6 15.6 2 900 20 0.15
25 Co Y Hf MgO 7.0 26.6 26.4 2 700 20 0.15
26 Ni Y Tb MgO 5.6 18.3 30.7 4 900 20 0.7
27 Y La Ce MgO 12.1 37.8 32.1 2 700 20 0.15
28 Mo Cs La MgO 8.5 31.8 26.8 2 850 20 0.4
29 Mo Ce Tb MgO 7.3 33.2 22.0 2 800 20 0.15
30 Li Mg Hf Al2O3 3.2 40.4 7.9 2 850 15 0.15
31 Li Ca Mn Al2O3 7.2 38.4 18.8 2 850 20 0.15
32 Li Ti La Al2O3 15.5 37.4 41.4 2 850 15 0.7
33 Li Fe none Al2O3 9.2 32.2 28.4 2 850 10 0.7
34 Li Hf none Al2O3 4.9 35.2 14.0 2 900 20 0.4
35 Na K Hf Al2O3 8.2 32.0 25.7 2 850 10 0.4
36 Na Ti Cu Al2O3 11.5 20.7 55.9 4 850 20 0.4
37 Na Mn Ni Al2O3 1.2 26.6 4.5 6 850 20 0.7
38 Na Co Ni Al2O3 7.8 28.5 27.2 2 800 10 0.15
39 Na Co none Al2O3 9.3 35.7 26.2 2 850 10 0.7
40 Na Cu Ce Al2O3 3.2 27.4 11.5 2 900 10 0.15
41 Mg Mn Cs Al2O3 8.6 32.8 26.2 2 900 20 0.7
42 Mg Co Ba Al2O3 2.7 26.9 10.0 2 900 10 0.15
43 Mg La Nd Al2O3 8.2 37.7 21.6 2 850 20 0.15
44 K Mn Ni Al2O3 1.5 26.4 5.8 6 900 15 0.7
45 K Co Cs Al2O3 9.3 34.2 27.4 2 850 15 0.7
46 K Y Hf Al2O3 10.8 20.5 52.4 4 850 15 0.7
47 K La W Al2O3 4.7 24.0 19.7 2 800 20 0.4
48 Ti Mn Y Al2O3 10.4 32.4 32.2 2 850 20 0.15
49 Ti Fe Mo Al2O3 9.4 36.8 25.5 2 850 20 0.4
50 Ti Cs La Al2O3 7.6 30.7 24.9 2 800 20 0.4
51 V Cu Ba Al2O3 1.8 37.7 4.7 2 900 20 0.15
52 Fe Pd Nd Al2O3 11.6 20.3 57.3 4 850 20 0.15
53 Fe Ba none Al2O3 4.9 33.0 14.7 2 850 20 0.15
54 Fe La W Al2O3 2.7 36.3 7.5 2 850 20 0.15
55 Co Ni Zr Al2O3 1.3 32.3 4.1 2 900 20 0.15
56 Co Zn Nd Al2O3 10.2 36.1 28.3 2 850 20 0.4
57 Co Y Tb Al2O3 5.9 35.8 16.5 2 800 20 0.15
58 Ni Cu Zr Al2O3 1.6 37.8 4.2 4 750 20 0.7
59 Ni Zn La Al2O3 1.0 25.5 3.8 6 750 10 0.7
60 Cu Y Ce Al2O3 1.7 20.0 8.4 6 900 20 0.15
61 Zn Pd Cs Al2O3 2.0 26.9 7.6 6 850 15 0.7
62 Sr Pd none Al2O3 9.1 21.0 43.1 4 850 10 0.15
63 Y Pd Ba Al2O3 9.4 33.6 27.9 2 850 20 0.4
64 Zr Cs La Al2O3 9.3 31.2 29.7 2 850 15 0.7
65 Ba La W Al2O3 3.5 22.5 15.6 2 800 20 0.4
66 Li K Co SiO2 10.4 30.3 34.4 2 850 10 0.7
67 Li Fe W SiO2 6.5 36.9 17.7 2 900 20 0.4
68 Li Ni none SiO2 8.1 34.9 23.3 2 850 20 0.4
69 Li Nd Tb SiO2 8.4 26.4 31.8 2 850 20 0.4
70 Li Ni Hf SiO2 11.2 33.1 33.7 2 850 20 0.4
71 Na Sr Mo SiO2 12.9 36.6 35.2 2 850 10 0.7
72 Na Ce Tb SiO2 8.9 26.8 33.3 2 850 20 0.4
73 Mg V Pd SiO2 n.d. n.d. n.d. n.d. n.d. n.d. n.d.
74 Mg Cu Sr SiO2 7.3 27.1 27.0 2 800 10 0.15

117
75 Mg Zn Eu SiO2 7.6 43.2 17.6 2 850 20 0.15
76 K Mn La SiO2 8.1 36.5 22.2 2 850 20 0.4
77 K Zr Tb SiO2 7.7 15.3 50.4 4 900 20 0.15
78 Ca Ti Cu SiO2 9.7 34.4 28.2 2 900 20 0.7
79 Ti Sr La SiO2 8.4 29.3 28.7 2 850 20 0.15
80 Ti Mo Nd SiO2 4.5 30.8 14.8 6 900 20 0.15
81 V Pd Nd SiO2 n.d. n.d. n.d. n.d. n.d. n.d. n.d.
82 V Cs Nd SiO2 8.0 31.1 25.8 2 850 20 0.15
83 Mn Fe Cu SiO2 7.4 34.6 21.3 2 850 20 0.15
84 Mn Zn Sr SiO2 10.4 31.8 32.7 2 900 20 0.7
85 Co Ni Cu SiO2 6.1 33.9 18.1 2 850 20 0.4
86 Co Y Nd SiO2 8.7 23.5 37.1 2 800 20 0.15
87 Ni W none SiO2 0.7 2.2 30.2 2 700 15 0.7
88 Ni Ce Nd SiO2 8.3 26.9 30.9 2 850 10 0.7
89 Cu La Tb SiO2 3.9 37.0 10.5 2 900 20 0.4
90 Cu none none SiO2 8.1 34.3 23.6 2 800 10 0.15
91 Zn Sr Pd SiO2 1.2 43.5 2.8 2 850 20 0.7
92 Zr Cs Cs SiO2 2.5 18.0 13.8 6 900 15 0.15
93 Mo Ba none SiO2 8.5 32.8 25.9 2 850 20 0.4
94 Cs Ba Ce SiO2 7.8 23.2 33.6 2 850 15 0.7
95 Li V Eu CaO 13.6 36.6 37.2 2 850 20 0.7
96 Li Co Mo CaO 4.8 25.4 18.9 2 750 10 0.15
97 Li Cu Cs CaO 5.6 31.0 18.1 2 900 20 0.15
98 Na Mg Hf CaO 14.3 33.6 42.5 2 750 15 0.4
99 Na Ti Ce CaO 11.9 31.6 37.6 2 700 20 0.15
100 Na Mn La CaO 6.7 33.3 20.2 2 800 20 0.15
101 Na Cu Hf CaO 4.2 25.6 16.3 2 800 20 0.15
102 Mg Co Ce CaO 8.0 33.5 23.9 2 800 20 0.15
103 Mg Cu Eu CaO 4.6 37.7 12.2 2 900 20 0.15
104 Mg Sr Y CaO 14.4 35.6 40.5 2 800 20 0.4
105 Mg Sr Ba CaO 17.4 39.6 44.1 2 800 20 0.7
106 Mg Zr Hf CaO 15.9 36.6 43.6 2 750 20 0.15
107 K Sr Y CaO 9.9 33.2 29.8 2 700 15 0.4
108 K Y Eu CaO 13.1 40.4 32.3 2 750 20 0.15
109 Ca Mn none CaO 7.6 28.4 26.6 2 850 15 0.15
110 Ca Nd Tb CaO 7.2 38.4 18.8 2 850 20 0.15
111 Ti Fe Sr CaO 10.3 31.2 32.9 2 700 20 0.15
112 Ti Zn Tb CaO 12.5 36.1 34.6 2 700 20 0.15
113 Ti Cs Ce CaO 15.4 33.2 46.3 2 700 15 0.15
114 V Pd W CaO 0.7 30.8 2.4 6 900 10 0.7
115 V Ce Hf CaO 12.3 31.1 39.4 2 750 15 0.15
116 Mn Tb Hf CaO 8.9 27.9 31.8 2 800 10 0.15
117 Mn Fe Hf CaO 7.7 24.5 31.4 2 800 15 0.15
118 Fe Y Tb CaO 9.4 30.4 30.8 2 750 10 0.15
119 Fe Ba Ce CaO 11.6 37.6 30.9 2 750 20 0.15
120 Co Cu Nd CaO 3.2 34.4 9.3 2 900 10 0.15
121 Sr Cs La CaO 8.0 17.2 46.3 4 750 20 0.15
122 Sr Pd W CaO 1.0 33.4 3.0 6 900 15 0.7
123 Y Mo Nd CaO 13.2 40.7 32.5 2 800 20 0.4
124 Ba Eu none CaO 17.0 42.8 39.6 2 750 20 0.15
125 Li Ti V TiO2 8.4 34.2 24.5 2 850 20 0.15
126 Li Fe Ce TiO2 11.6 38.2 30.3 2 900 20 0.7
127 Li Zn Pd TiO2 7.5 35.5 21.1 2 850 20 0.15
128 Na Fe Pd TiO2 2.1 33.7 6.2 2 850 20 0.15
129 Na Co Pd TiO2 n.d. n.d. n.d. n.d. n.d. n.d. n.d.
130 Mg Mn Ce TiO2 14.2 37.4 38.0 2 850 15 0.7
131 Mg Sr Tb TiO2 10.3 36.4 28.4 2 900 20 0.7
132 Mg Ti La TiO2 12.0 32.5 37.0 2 850 15 0.7
133 Ca V Y TiO2 8.6 29.1 29.5 2 800 20 0.4
134 Ti Zn La TiO2 10.4 28.5 36.4 2 800 20 0.4

118
135 Ti Zr Ce TiO2 15.2 38.4 39.6 2 800 20 0.4
136 Ti Cs W TiO2 16.6 37.8 43.8 2 750 20 0.4
137 Ti Y Ce TiO2 1.3 24.0 5.5 2 800 10 0.15
138 V Co La TiO2 8.1 30.8 26.4 2 800 10 0.15
139 V Co Ce TiO2 5.5 30.8 17.8 2 700 10 0.15
140 V Ni Zn TiO2 6.1 30.1 20.3 2 800 10 0.15
141 V Pd none TiO2 n.d. n.d. n.d. n.d. n.d. n.d. n.d.
142 Mn Fe Nd TiO2 9.4 30.4 31.0 2 750 20 0.4
143 Mn Cu Sr TiO2 8.2 26.6 30.7 4 850 20 0.15
144 Mn Nd W TiO2 7.9 37.0 21.4 2 900 20 0.4
145 Fe Fe Ni TiO2 n.d. n.d. n.d. n.d. n.d. n.d. n.d.
146 Fe Cu Sr TiO2 8.2 39.6 20.7 2 850 20 0.15
147 Fe Zn W TiO2 15.4 31.3 49.2 4 850 20 0.15
148 Fe Sr Mo TiO2 8.3 31.2 26.4 2 800 10 0.15
149 Co Sr Hf TiO2 13.7 37.3 36.8 2 800 20 0.15
150 Ni Zn La TiO2 2.1 14.9 14.3 4 750 10 0.7
151 Ni Ce W TiO2 9.2 30.4 30.3 2 750 10 0.15
152 Ni Mo Eu TiO2 4.2 25.4 16.5 2 850 20 0.7
153 Cu Zr Tb TiO2 7.4 37.8 19.6 2 850 20 0.15
154 Cu Mo Ce TiO2 15.3 38.7 39.5 2 800 20 0.4
155 Cu La Tb TiO2 10.3 32.5 31.7 2 850 20 0.4
156 Cu Eu Eu TiO2 5.9 35.8 16.5 2 800 20 0.15
157 Zn Zn Nd TiO2 11.4 19.0 59.9 4 850 20 0.15
158 Zn Zr Tb TiO2 12.9 34.4 37.6 2 850 10 0.7
159 Zn Tb Hf TiO2 11.0 30.4 36.2 2 850 15 0.7
160 Y Cs Ce TiO2 12.4 39.1 31.8 2 850 20 0.4
161 Y Nd Tb TiO2 8.7 38.4 22.6 2 850 20 0.15
162 Mo Ba Ce TiO2 15.4 41.3 37.4 2 850 10 0.7
163 Mo Ce Nd TiO2 7.0 31.9 21.9 2 900 20 0.7
164 Mo Ce W TiO2 8.7 34.4 25.4 2 850 20 0.15
165 Cs Ba Eu TiO2 13.3 39.3 33.9 2 800 20 0.15
166 La Ce W TiO2 12.5 40.4 31.0 2 850 20 0.15
167 Ce Nd Tb TiO2 10.8 34.9 31.0 2 800 15 0.4
168 Li Ca Ca ZrO2 1.3 36.4 3.7 2 850 20 0.15
169 Li Mo Nd ZrO2 16.7 38.3 43.5 2 700 20 0.4
170 Li Ba Nd ZrO2 1.1 27.9 4.1 4 900 20 0.7
171 Li La Eu ZrO2 6.3 31.3 20.1 2 800 20 0.15
172 Li La W ZrO2 13.6 40.1 34.0 2 850 20 0.7
173 Li Co Y ZrO2 2.2 26.0 8.5 2 750 10 0.15
174 Li Tb none ZrO2 6.0 36.8 16.3 2 900 20 0.15
175 Li K Mn ZrO2 10.7 38.0 28.1 2 750 15 0.15
176 Na Ba Nd ZrO2 10.5 31.2 33.8 2 750 10 0.15
177 Na Eu W ZrO2 18.2 40.8 44.6 2 850 20 0.7
178 Na V Mo ZrO2 8.2 31.5 26.1 2 800 10 0.15
179 Na K none ZrO2 6.4 38.7 16.6 2 750 20 0.15
180 Mg V Hf ZrO2 3.2 33.7 9.4 2 850 20 0.15
181 Mg Zr W ZrO2 9.6 26.8 35.9 2 850 10 0.7
182 K Ba Nd ZrO2 8.5 29.1 29.2 2 700 20 0.4
183 K Mn Zn ZrO2 6.2 36.9 16.8 2 750 20 0.15
184 K Mn Ce ZrO2 6.6 25.6 25.8 2 800 10 0.15
185 K Pd Hf ZrO2 n.d. n.d. n.d. n.d. n.d. n.d. n.d.
186 Ca V Cu ZrO2 7.0 26.8 26.2 2 800 10 0.15
187 Ca Ni Cu ZrO2 6.3 35.6 17.8 2 750 20 0.15
188 Ca Sr Zr ZrO2 10.4 33.6 31.1 2 700 20 0.4
189 Ca Cu Hf ZrO2 1.9 31.5 6.1 2 800 20 0.15
190 V Mn W ZrO2 7.8 34.1 23.0 2 850 20 0.15
191 Mn Ba none ZrO2 5.4 27.1 20.1 2 750 15 0.15
192 Mn Tb Hf ZrO2 1.4 46.7 3.0 2 850 10 0.7
193 Mn Fe Nd ZrO2 4.7 34.2 13.8 2 850 20 0.4
194 Fe Cu Zr ZrO2 6.1 36.2 16.9 2 850 20 0.15

119
195 Co Ce Nd ZrO2 1.2 25.9 4.7 6 800 15 0.7
196 Co Sr Ba ZrO2 4.9 12.3 39.7 6 900 20 0.7
197 Ni Cs Ba ZrO2 1.2 39.6 2.9 2 700 20 0.4
198 Ni Ba Hf ZrO2 1.3 22.0 6.0 6 850 15 0.4
199 Ni Y Eu ZrO2 1.0 25.9 3.9 6 800 20 0.7
200 Zn La Ce ZrO2 3.4 35.0 9.8 2 900 20 0.15
201 Y Mo Nd ZrO2 7.4 30.1 24.5 2 800 15 0.15
202 Pd Cs Ba ZrO2 n.d. n.d. n.d. n.d. n.d. n.d. n.d.
203 La Eu W ZrO2 4.8 36.7 13.1 2 850 20 0.4
204 Li Mg Zr BaO 18.6 38.6 48.2 2 800 20 0.7
205 Li Co Zn BaO 6.2 32.7 19.0 2 900 20 0.7
206 Li Co Nd BaO 7.1 17.8 39.9 4 900 20 0.15
207 Li Co Eu BaO 13.8 34.3 40.1 2 800 15 0.15
208 Li Zr Cs BaO 16.4 36.6 44.9 2 850 20 0.7
209 Na Ca Mn BaO 9.0 28.5 31.7 2 800 20 0.4
210 Na Fe Ce BaO 9.3 33.0 28.2 2 850 20 0.4
211 Mg K Y BaO 17.0 37.2 45.6 2 850 20 0.7
212 Mg V Mn BaO 10.2 32.6 31.3 2 750 20 0.15
213 Mg Mn Ni BaO 8.7 30.0 29.1 2 850 20 0.7
214 Mg Pd none BaO 0.8 45.3 1.8 6 900 15 0.7
215 Mg Ni W BaO 9.6 24.9 38.6 2 850 20 0.7
216 K Ca Zr BaO 13.7 36.6 37.3 2 850 20 0.7
217 K V Mo BaO 18.5 32.9 56.3 2 850 20 0.7
218 K Zr La BaO 17.5 37.3 47.0 2 800 15 0.7
219 Ca Mn Mo BaO 10.3 32.5 31.7 2 850 20 0.4
220 Ca Y Zr BaO 11.0 38.3 28.6 2 800 20 0.4
221 Ca W none BaO 6.2 20.9 29.7 2 800 15 0.4
222 V Mn Cu BaO 9.9 34.2 29.1 2 850 15 0.15
223 V Fe none BaO 13.9 29.4 47.1 4 850 20 0.15
224 V Zr Eu BaO 12.9 36.2 35.6 2 900 20 0.7
225 Mn Y Hf BaO 6.1 17.2 35.5 4 900 15 0.15
226 Fe Ba La BaO 14.1 34.6 40.8 2 850 20 0.7
227 Co Zn Zr BaO 12.4 36.2 34.4 2 900 20 0.7
228 Zn Hf none BaO 16.9 36.6 46.0 2 850 20 0.7
229 Sr Mo none BaO 21.2 37.0 57.4 2 850 20 0.7
230 Sr Ba Hf BaO 10.6 35.9 29.6 2 850 20 0.7
231 Mo Cs W BaO 20.2 43.2 46.7 2 850 20 0.7
232 Ce Nd Hf BaO 15.2 35.4 43.0 2 800 20 0.15
233 Li Fe Ba La2O3 15.2 35.5 43.0 2 700 10 0.15
234 Li Y Eu La2O3 15.4 35.9 42.8 2 700 15 0.15
235 Li Ba La La2O3 15.0 37.8 39.6 2 750 20 0.4
236 Li Nd Tb La2O3 10.3 30.6 33.8 2 700 10 0.15
237 Na Ca none La2O3 15.4 33.5 45.9 2 700 20 0.15
238 Na Fe Tb La2O3 7.5 31.7 23.6 2 850 10 0.15
239 Na Pd W La2O3 1.3 37.5 3.5 4 900 15 0.7
240 Mg K Fe La2O3 11.1 19.7 56.3 4 750 20 0.15
241 Mg Ca Nd La2O3 16.2 39.1 41.3 2 750 20 0.4
242 K Co Ce La2O3 2.4 24.4 9.7 2 800 15 0.15
243 K Cu none La2O3 7.5 38.4 19.6 2 850 20 0.15
244 K none none La2O3 7.9 29.4 27.0 2 800 10 0.15
245 Ca Mn Sr La2O3 10.6 32.0 33.2 2 700 20 0.15
246 Ca Fe Tb La2O3 12.3 32.3 38.0 2 750 10 0.15
247 Ca Pd Tb La2O3 n.d. n.d. n.d. n.d. n.d. n.d. n.d.
248 Ti Co Cu La2O3 1.3 18.3 7.1 6 900 20 0.15
249 Ti Co Pd La2O3 0.6 40.6 1.5 2 700 20 0.4
250 Ti Zr Ba La2O3 4.1 33.1 12.4 2 700 20 0.15
251 Ti Ni Hf La2O3 9.6 36.4 26.4 2 900 20 0.7
252 V Fe Mo La2O3 7.7 34.2 22.5 2 800 20 0.15
253 V Mo none La2O3 14.9 41.5 35.8 2 900 20 0.7
254 V La W La2O3 14.1 34.6 40.8 2 850 20 0.7

120
255 V Ce Nd La2O3 8.4 30.6 27.3 2 700 20 0.15
256 Mn Sr Mo La2O3 10.8 29.3 36.9 2 700 15 0.15
257 Fe Cu Zr La2O3 4.9 33.0 14.7 2 850 20 0.15
258 Fe Nd Tb La2O3 13.4 32.3 41.5 2 700 10 0.15
259 Ni Hf none La2O3 0.9 41.2 2.2 2 750 20 0.4
260 Cu Mo Pd La2O3 0.5 28.2 1.8 6 900 20 0.7
261 Cu La W La2O3 8.2 37.7 21.6 2 850 20 0.15
262 Zn Y none La2O3 15.1 40.9 36.9 2 750 20 0.15
263 Zn Zr Cs La2O3 12.2 38.0 32.1 2 750 20 0.15
264 Sr Y Ce La2O3 14.8 37.1 39.9 2 700 15 0.15
265 Mo Cs Tb La2O3 13.3 30.1 44.2 2 700 10 0.15
266 Pd Ce Tb La2O3 1.1 30.8 3.6 6 900 10 0.7
267 Ba Ce Hf La2O3 13.9 39.4 35.4 2 750 20 0.15
268 La Tb none La2O3 7.8 29.9 26.2 2 750 20 0.15
269 Tb Hf W La2O3 15.2 41.7 36.5 2 750 20 0.15
270 Na K V CeO2 6.6 34.3 19.4 2 850 20 0.15
271 Na V Y CeO2 7.3 38.3 19.1 2 850 20 0.15
272 Mg K none CeO2 8.5 28.8 29.6 2 800 10 0.15
273 Mg Fe none CeO2 7.0 27.5 25.5 2 800 10 0.15
274 Mg Ni Zn CeO2 1.3 26.7 4.9 6 800 20 0.15
275 K Co Sr CeO2 6.4 32.8 19.5 2 900 20 0.4
276 K La Ce CeO2 13.4 32.3 41.5 2 700 10 0.15
277 K Ce Eu CeO2 5.1 34.4 14.8 2 900 20 0.4
278 Ti Ni Ba CeO2 4.8 36.2 13.2 2 750 15 0.7
279 Ti Zn Pd CeO2 1.2 26.0 4.6 2 800 15 0.15
280 V Sr W CeO2 1.7 24.6 7.0 6 850 20 0.4
281 V Zr Nd CeO2 7.5 35.5 21.1 2 850 20 0.15
282 V Pd W CeO2 1.6 42.9 3.7 2 800 10 0.7
283 Mn Ni Zn CeO2 n.d. n.d. n.d. n.d. n.d. n.d. n.d.
284 Mn Ni Y CeO2 2.9 32.2 9.1 2 900 20 0.4
285 Mn Sr La CeO2 8.6 35.0 24.7 2 850 20 0.15
286 Mn Y Zr CeO2 6.6 26.8 24.8 2 800 10 0.15
287 Mn Ba La CeO2 8.6 34.9 24.7 2 850 20 0.15
288 Mn none none CeO2 4.9 28.7 17.1 2 800 20 0.15
289 Mn Eu Hf CeO2 6.2 35.1 17.7 2 800 20 0.15
290 Fe Zn La CeO2 3.5 24.1 14.7 2 800 10 0.15
291 Fe Y La CeO2 5.1 25.9 19.5 2 800 10 0.15
292 Ni Sr Nd CeO2 10.2 34.4 29.8 2 800 20 0.4
293 Ni Nd Eu CeO2 8.3 32.1 25.9 2 900 20 0.7
294 Zn Pd Ce CeO2 2.2 32.3 6.8 2 800 20 0.15
295 Zn La Nd CeO2 9.2 27.9 32.9 2 750 10 0.15
296 Sr Cs none CeO2 12.5 36.1 34.8 2 800 20 0.4
297 Sr Ce none CeO2 10.9 33.9 32.1 2 700 20 0.15
298 Y Zr Eu CeO2 7.2 35.6 20.2 2 850 20 0.15
299 Mo Pd Ba CeO2 0.7 33.3 2.1 2 800 15 0.4
300 Cs Ce Nd CeO2 5.9 30.7 19.1 2 800 15 0.15 aThe catalyst composition is expressed in the form of M1–M2–M3/Support. The three active elements (M1–M3)
are sorted along the atomic number.
bThe best C2 yield of individual catalysts is reported together with the corresponding parameters. The performance
of 9 catalysts was not determined due to sintering at the calcination temperature. The corresponding cells are filled
with n.d.
cThe reaction in the absence of catalysts led to the C2 yield of 10.2% with the corresponding CH4 conversion of
29.7% and the C2 selectivity of 34.3% at the temperature of 850 °C, the CH4/O2 ratio of 2 mol/mol, the total flow
of 20 mL/min, and PAr of 0.15 atm.
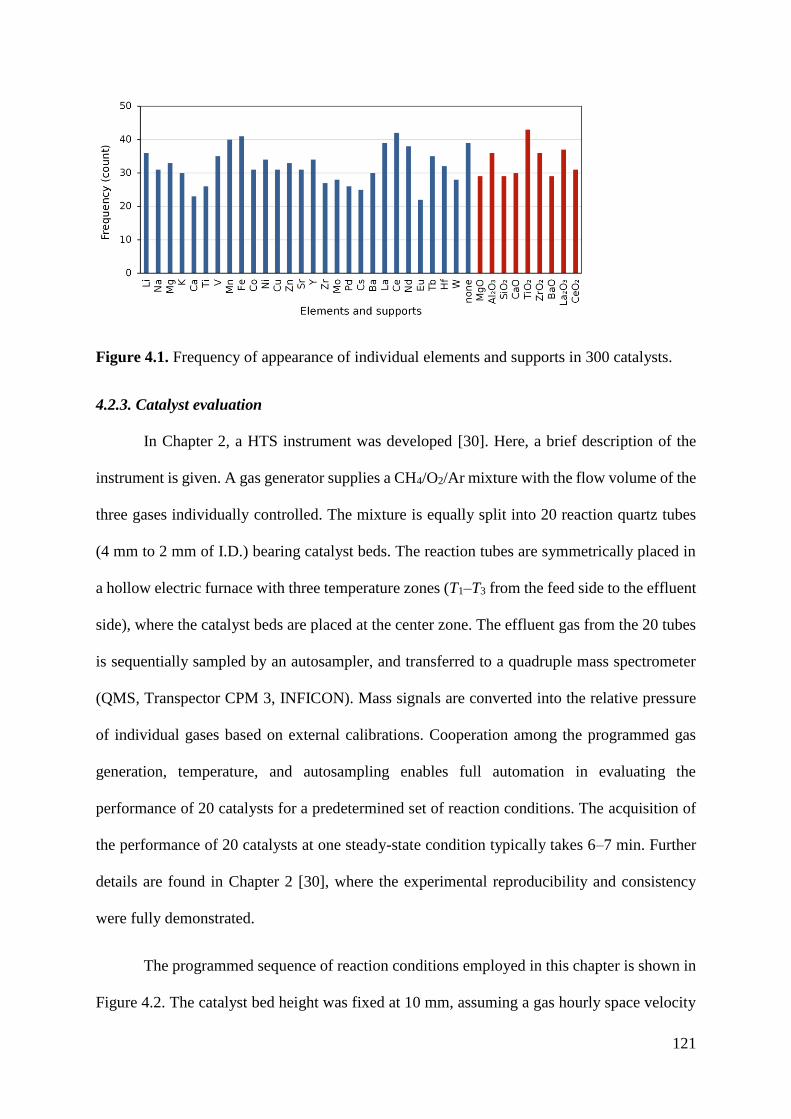
121
Figure 4.1. Frequency of appearance of individual elements and supports in 300 catalysts.
4.2.3. Catalyst evaluation
In Chapter 2, a HTS instrument was developed [30]. Here, a brief description of the
instrument is given. A gas generator supplies a CH4/O2/Ar mixture with the flow volume of the
three gases individually controlled. The mixture is equally split into 20 reaction quartz tubes
(4 mm to 2 mm of I.D.) bearing catalyst beds. The reaction tubes are symmetrically placed in
a hollow electric furnace with three temperature zones (T1–T3 from the feed side to the effluent
side), where the catalyst beds are placed at the center zone. The effluent gas from the 20 tubes
is sequentially sampled by an autosampler, and transferred to a quadruple mass spectrometer
(QMS, Transpector CPM 3, INFICON). Mass signals are converted into the relative pressure
of individual gases based on external calibrations. Cooperation among the programmed gas
generation, temperature, and autosampling enables full automation in evaluating the
performance of 20 catalysts for a predetermined set of reaction conditions. The acquisition of
the performance of 20 catalysts at one steady-state condition typically takes 6–7 min. Further
details are found in Chapter 2 [30], where the experimental reproducibility and consistency
were fully demonstrated.
The programmed sequence of reaction conditions employed in this chapter is shown in
Figure 4.2. The catalyst bed height was fixed at 10 mm, assuming a gas hourly space velocity

122
(GHSV) as a known key descriptor in OCM [27,30]. Catalysts were first activated at 1000 °C
for 160 min under O2. Then, the temperature was stepwise decreased from 900 to 850, 800,
750, and 700 °C. At each temperature, the total flow volume (10, 15, 20 mL/min/channel,
corresponding to the contact time of 0.75, 0.50, 0.38 s, respectively), the CH4/O2 ratio (2, 4, 6
mol/mol), and the Ar concentration (PAr = 0.15, 0.40, 0.70 atm) were stepwise varied.
Combined variations in the temperature, the total flow volume, the CH4/O2 ratio, and PAr lead
to 135 conditions per catalyst and 2700 observations for 20 catalysts in a single automated
operation.
Figure 4.2. Programmed sequence of reaction conditions. Each temperature step includes a
program for the gas flow.
4.2.4. Data preprocessing
The evaluation of 291 catalysts (9 catalysts could not be evaluated) at 135 conditions
afforded an OCM dataset consisting of 39,285 data points. The dataset denotes the
correspondence between the catalyst composition and the performance at individual reaction
conditions. In cost of exploring many unreported catalysts over a wide variety of conditions, I
found i) severe sintering of some catalysts (e.g. No. 202: Pd–Cs–Ba/ZrO2) during in-line
calcination at 1000 °C, and ii) carbon deposition at specific conditions. These problems resulted

123
in unnaturally high CH4 conversion and/or very poor carbon balance. Such data points were
safely excluded from any data analysis.
4.2.5. Data analysis
Decision tree classification was performed within the scikit-learn package of Python
[31]. A decision tree is built by recursive partitioning. It starts from the root node (or called
parent node) and splits into the left and right child nodes. These child nodes can then be further
split and consequently, they become parent nodes of their resulting children nodes. Data is split
on a feature which maximizes the information gain factor (IG) defined as follows,
𝐼𝐺(𝐷𝑝, 𝑓) = 𝐼(𝐷𝑝) − (𝑁𝑙𝑒𝑓𝑡
𝑁𝑝𝐼(𝐷𝑙𝑒𝑓𝑡) +
𝑁𝑟𝑖𝑔ℎ𝑡
𝑁𝑝𝐼(𝐷𝑟𝑖𝑔ℎ𝑡))
where f is a feature to perform the split. Dp, Dleft, and Dright are the data of the parent node and
the two child nodes, respectively. Np, Nleft, and Nright are the numbers of the samples at the
parent node and the child nodes, respectively. I is defined as an imputity measure, which is
used to define the homogeneity of the node. In this report, the Gini Index was used [31].
In this thesis, since our catalyst dataset is small, applying pruning methods on decision
tree is not reasonable and results in derived knowledge become too general. Hence, decision
tree was kept split until all leaf nodes were pure (dataset are completely split). The final
conclusions will be extracted after reviewing several decision trees generated by different
training set in order to avoid biases.

124
4.3. Results and discussions
4.3.1. Catalyst data acquisition, visualization, and interpretation
300 catalysts were generated based on random numbers. They were prepared, and
evaluated using the HTS instrument. 9 catalysts (Nos. 73,81,129,141,145,185,202,247,283)
were not evaluated due to severe sintering in the calcination step. The evaluation of the
remaining 291 catalysts in 135 conditions afforded 39,285 data points, which are visualized
using a scatter plot for the CH4 conversion vs. the C2 selectivity (Figure 4.3). As demonstrated
in Chapter 2 [30], the scatter plot visualization for the entire dataset provides a facile
description of a general behavior of catalysis. For instance, it dictates i) a conversion-selectivity
tradeoff for determining the upper limit of the C2 yield (Figure 4.3a), and ii) the temperature
and the CH4/O2 ratio as the two most influential conditions.
Here, according to the scope of the study, I rather focus on a relationship between the
composition and the OCM performance. The performance of the 291 catalysts was compared
in terms of the best C2 yield that individual catalysts gave among the 135 conditions. The
comparison at one fixed set of reaction conditions was not adopted as different catalysts usually
possess their own sweet spots. Thus such comparison may find catalysts which are not actually
very performant but just suitable for the selected set of conditions. This is especially important
when a wide variety of catalysts are tested as in the current study. Besides, the OCM is known
to be process-sensitive [27,32,33]. Figure 4.4 summarizes the distribution of 291 data points
corresponding to the best C2 yield data of the 291 catalysts. The star mark represents the data
point of the best C2 yield achieved in the absence of catalysts as a reference. It is known that
the OCM reaction can proceed even in the absence of catalysts via a free radical mechanism in
the gas phase [10,34]. In the current case, the catalyst-free OCM gave at best ca. 10% of the C2
yield. Considering 10% as a standard, there were catalysts which could improve the C2 yield
and those which deteriorated it by mediating combustion of CH4 into COx. Here, I classified

125
catalysts into three cases based on the best C2 yield: i) Positive (> 13%), ii) neutral (7–13%),
and iii) negative (< 7%). The C2 yield range of 10 ± 3% for the classification was determined
firstly to be symmetric with respect to the catalyst-free C2 yield of 10%, secondly to be
sufficiently larger than the experimental error of below 1% [30], and lastly to have a sufficient
number of catalysts in each of the three cases. The number of positive, neutral, and negative
catalysts was 51, 134, and 106, respectively. In Figure 4.4a, it is seen that the best C2 yield of
the 291 catalysts is distributed in the range of 0‒21%. Their average (8.3%) was found to be
lower than 10% as the standard, while a relatively large number of catalysts were classified to
be positive even though they were randomly picked up. The latter observation plausibly reflects
the fact that the library contains a relatively large number of basic elements and supports (to
be basic is one of known requirements for OCM catalysts [27,28]. When the distribution of the
data points is seen in terms of the CH4 conversion and C2 selectivity (Figure 4.4b,c), it is clear
that the selectivity was the reason of differentiating the best C2 yield of the catalysts. As for the
distribution in the reaction conditions, almost all the positive catalysts attained the best C2 yield
at the CH4/O2 ratio of 2 (Figure 4.4d). The percentage of positive catalysts increased along with
the decrease of the reaction temperature (Figure 4.4e), while there was no noticeable trends for
the total flow (cf. contact time) and PAr (cf. CH4 concentration) (Figure 4.4f,g). In summary,
the distribution analysis suggests that positive catalysts are such those which can retain high
C2 selectivity at a high O2 concentration and/or can maintain the conversion at a low
temperature.

126
Figure 4.3. Visualization of the entire OCM dataset for 291 catalysts based on scatter plots:
(a) CH4 conversion vs. C2 selectivity with the C2 yield indicated by the color. The distribution
of data points in terms of (b) the temperature and (c) the CH4/O2 ratio.

127
Figure 4.4. Data distributions corresponding to the best C2 yield for 291 catalysts: (a) C2 yield,
(b) CH4 conversion, (c) C2 selectivity, (d) CH4/O2 ratio, (e) temperature, (f) total flow, and (g)
partial pressure of Ar (atm). The colors reflect the C2 yield. The star corresponds to the data
point taken without catalysts.
Figure 4.5 shows the same scatter plots with those of Figure 4.3 using only the best C2
yield data points, where the corresponding catalyst names are written as long as the space

128
allows. One can glance at elements and supports which frequently appear in positive and
negative catalysts. For example, positive catalysts are often associated with the presence of Sr,
Mg, Mo, and BaO, while negative catalysts often accompany Cu, Pd, Ce, Al2O3, etc. However,
one also notices that the inclusion of specific components does not necessarily leads to positive
or negative catalysts. For example, Ce appears in some of positive catalysts, and Mo is
occasionally included in negative catalysts. This fact suggests that the performance is not
determined by the presence of one specific component, but combination effects are important.
When the scatter plot is colored based on the important reaction conditions, further information
can be extracted. Most of positive catalysts attained the best C2 yield at the CH4/O2 ratio of 2
(as was mentioned in Figure 4.4d). A higher CH4/O2 ratio appeared only when the catalysts
were scarcely selective or not sufficiently selective at a lower CH4/O2 ratio (Figure 4.5b). A
high C2 yield was rarely obtained at 900 C, as few catalysts can retain the selectivity at such
a harsh condition (Figure 4.5c). Positive catalysts with group 6 elements tended to give the best
C2 yield at 850 C. In particular, two entries, Sr–Mo–none/BaO and K–V–Mo/BaO, exhibited
very high C2 selectivity at 850 C. Some of positive catalysts exhibited the best performance
at 700 C, the employed lowest temperature. As known in literature [35,36], these catalysts
mostly contained rare-earth elements such as Ce and La2O3. The random exploration identified
5 catalysts whose best C2 yield exceeds 18%, which were Na–Eu–W/ZrO2, Li–Mg–Zr/BaO,
K–V–Mo/BaO, Sr–Mo–none/BaO, Mo–Cs–W/BaO. These catalysts were never reported in
literature.

129

130
Figure 4.5. Scatter plots of the best C2 yield data points for 291 catalysts. (a) The C2 yield is
indicated in the color axis. The distribution of data points in terms of (b) the CH4/O2 ratio and
(c) the temperature. The star corresponds to the data point taken without catalysts.
Figure 4.6 shows the frequency of appearance of individual elements and supports in
positive and negative catalysts. In the whole catalysts, individual components were relatively
evenly sampled (see Figure 4.1). However, when analyzed in relation to their performance,
some biased are seen in the frequency. Out of 51 positive catalysts, 21 catalysts used oxides of
group 2 elements (CaO and BaO) as the support, and the other 13 used La2O3. As for the active
elements (M1–M3), Li > (Mg, Mo, Ce, Eu) > (Ba, La, Hf) appeared relatively frequently. In
an earlier publication by Zavyalova et al., it was reported that performant OCM catalysts in
literature frequently contained Li > Mg > Na > Ca > La > Ba > Sr as active elements [27].
Indeed, Figure 4.6a finds Li and Mg as specifically positive elements, but not for the other

131
elements. The origin of this discrepancy would be explained as follows: Previous studies
explored catalysts mainly in a way to develop serendipitously identified seeds, while the
present study made exploration without preknowledge. For example, Na and Sr are elements
which are included in Mn–Na2WO4/SiO2 and La–Sr/CaO as the two most famous OCM
catalysts, but they were not frequently observed in my positive catalysts. This fact suggests that
these two elements strictly choose combinations, otherwise I was unlucky. Among the 106
negative catalysts, redox-active and/or acidic supports such as Al2O3, ZrO2, and CeO2 were
frequently observed. For active elements, mid to late transition metal elements from groups 7–
12 were found as popular choice, while they rarely appeared in the positive catalysts. The
reason to regard Mn of Mn–Na2WO4/SiO2 as a negative element must be similarly explained.
Figure 4.6. Frequency of appearance of individual elements and supports in (a) positive
catalysts (C2 yield > 13%) and (b) negative catalysts (C2 yield < 7%).
The data analysis for the individual components suggested the importance of
combinations in designing good OCM catalysts. For example, Li, which is known as the most

132
positive element in literature [24,27,37], frequently appeared not only in the positive catalysts
but also in the negative ones (Figure 4.6). Figure 4.7 shows the average performance of
individual elements and supports, which was derived by averaging the best C2 yields of
catalysts which contained specified components. The huge standard deviations indicate that the
performance of individual components was quite sensitive to the remaining three components
in the ternary system. According to these considerations, I next analyzed the performance of
binary combinations. The best C2 yields were averaged over catalysts which contained a
specific binary combination (A*B), and this value was compared with the averages of the best
C2 yields of catalysts which contained only either of the components (A or B). The 291 catalysts
are far from being sufficient to cover a huge number of potential combinations present in the
original library, and many combinations were not included in any of the 291 catalysts. Here,
the analysis was made for combinations whose frequency of appearance reached at least twice.
Figure 4.8 shows the best and worst 20 binary combinations. It is obvious that the best and
worst combinations were composed by specific elements and supports: BaO > (Zr, Cs) > (Mo,
Ba) for the best side, and Pd >> Ni > W for the worst side. Further, when one categorizes
different elements and supports (the cationic elements of oxides) based on the groups in the
periodic table, rules of making positive and negative binary combinations become clear. The
best 20 combinations were mostly explained by the combination of a 1A or 2A element with
an element of either 2A, 4A, 6A, or lanthanoid series. The combinations between 1A, 2A, and
lanthanoid series elements evoke well-known Li/MgO, La–Sr/CaO, CeO2–La2O3 [27,34,38],
while the combinations between basic elements (1A, 2A) and early transition metal elements
(3A, 4A, 6A) evoke similarly well-known Na2WO4. However, our observations were totally
different from those of the known catalysts in terms of the choice of elements: e.g. (Cs/BaO,
K/BaO) vs. Li/MgO, and (Cs–W, Cs–W, Mo–BaO) vs. Na–W. The findings of these novel
combinations would not have been achieved without the truly multidimensional exploration of

133
a huge materials space. Another advantage of such exploration is at the generalization of results
towards a catalyst design concept: The combinations between basic elements (1A, 2A) and
early transition metal elements (3A, 4A, 6A) suggest that d0 metallic salts are effective for
OCM. For the worst combinations, 80% of the combinations contained 9A or 10A elements.
These elements strongly depress the performance of positive elements (1A, 2A, 4A, and
lanthanoid series).
Figure 4.7. Performance of individual elements and supports. The best C2 yields were averaged
among catalysts containing a specific element or support.

134
Figure 4.8. (a) Best and (b) worst 20 binary combinations. The best C2 yields were averaged
among catalysts containing a specific combination (A*B), and those containing either of the
components (A or B). The numbers in the parentheses correspond to the frequency of

135
appearance of specific combinations in 291 catalysts. Note that the large error bars came from
the fact that the performance was largely influenced by the choice of the other two components
in the ternary system, and had nothing to do with the experimental error (below ±1%).
Figure 4.9 compares the average C2 yield of a specific binary combination (A*B) with
a synergy factor of the corresponding combination, which corresponds to the average C2 yield
of A*B normalized by the average C2 yield of catalysts containing either of A and B. The
synergy factor compares how performant a combination is with respect to the individual usage
of its constituents. The highly linear correlation most clearly evidences the significance of
choosing synergistic combinations in the design of performant OCM catalysts.
Figure 4.9. Relationship between the performance of catalysts and the presence of synergestic
combinations. The average C2 yield of catalysts with a specific combination (A*B) is compared
with a synergy factor. The synergy factor is defined by the ratio of the average C2 yield for
catalysts with A*B with respect to that for catalysts with either of A and B.
4.3.2. Decision tree classification
The results in 4.3.1 figured out two important ideas that the OCM performance of
catalysts could be represented by combinations and that there were generalizable combination

136
rules based on the elemental groups. Here, in order to derive a general model being directly
useful for the design of new catalysts, I made the decision tree classification. The classification
was rendered in a way that the C2 yield of the catalysts was divided into two classes: 0–13%
(Class 1: not positive), and higher than 13 % (Class 2: positive). Then, my target was to deduce
the rules and heuristics that can better classify the catalysts into the two classes.

137
Figure 4.10. Decision tree generated from 233 catalysts which were randomly selected from the 291 catalysts where catalyst descriptors are the
presence/absence of specific elements in the composition. The number in square brackets indicates the number of catalysts in class 1 and 2 in each
node. Left of a node indicates without/absence of an element, while right of a node indicates with/presence of an element.

138
Figure 4.11. Decision tree generated from 233 catalysts which were randomly selected from the 291 catalysts where catalyst descriptors are the
presence/absence of specific elements in the composition and their group (1-12) in periodic table. The number in square brackets indicates the
number of catalysts in class 1 and 2 in each node. Left of a node indicates without/absence of an element, while right of a node indicates
with/presence of an element.

139

140
Figure 4.12. Decision tree generated from 233 catalysts which randomly selected from 291 catalysts with the same descriptors with Figure 4.11.
Left of a node indicates without/absence of an element, while right of a node indicates with/presence of an element.
141
The test set consisted of 20 % catalysts which were randomly selected from the
291 catalysts. In a typical procedure, catalyst descriptors like elements were labeled as
a Boolean value for representing the absence/presence of specific elements in the
composition. A full decision tree was created until all the leaves nodes were pure.
Figure 4.10 showed the results of the decision tree with the accuracy of the train and
test set equals to 1.00 and 0.74, which can derive some useful information. Decision
tree suggested that supports (La2O3, BaO, CaO, TiO2) were generally good support for
OCM system (contributed to 32/39 cases of positive catalysts); if not, positive catalysts
should contain at least one element which is rare-earth metal. In addition, by seeing the
decision tree architecture, it can be seen the high occurrence of binary combination
among group 1, 2, and rare earth metals such as La2O3-Ba, La2O3*Tb, BaO*K,
CaO*Mg, La*Li, or MgO*Eu. The combination of among 1A, 2A, and rare earth metals
could be confirmed by the literature which were reported elsewhere [27,36,39]. The
presence of combination of group 6*group 1 for positive catalysts were also observed
as Mo*Li and W*Cs (similar to to Na*W in Mn-Na-W/SiO2) in the decision tree.
Nevertheless, decision tree could propose only a few ternary positive combinations
(such as La2O3*Tb*Hf, CaO*Mg*Sr). The reason of the limited knowledge extraction
might come from the limited amount of samples compared to total possible sample
which covers huge parametric space and the presence descriptors are currently not
sufficient to describe the catalyst performance.
In order to overcome this shortcoming, using more effective descriptors is one
of the ways to generalize the catalyst rules. It is known that elements belong in the
similar group in periodic table exhibited the similar catalyst activity. Therefore, groups
of M1-M3 elements were utilized as descriptor besides the absence/presence of

142
elements. The new decision tree was illustrated in the Figure 4.11. Figure 4.11 showed
the decision tree with the same train and test data with the Figure 4.10, where the
accuracy of train and test set could be achieved at 1.00 and 0.78, meaning that all the
leave nodes are pure. By considering the detail of the tree structure, it could be seen
that the tree structure is basically kept where positive catalysts should contain one these
of supports (La2O3, CaO, BaO or TiO2) or at least one rare-earth element in active
components. Beside the similar between two tree models, it was interesting that the new
decision tree showed shallower depth. The shallower tree depth while kept all the leave
nodes are pure were the results of sophisticated descriptors. Some positive ternary
descriptors could be found such as La2O3*group 2*group 1, La2O3*group 2*rare earth,
La2O3*Rare earth*group 6, and TiO2*group 4*rare earth. To validate the results which
are derivated from decision tree in Figure 4.11, several decision trees were plotted in
the Figure 4.12 with different training set to confirm the new findings. It is known that
results from decision tree are sensitive to the choice of training set. By refer different
decision tree results, such sensitive and unstable results could be avoid before reaching
the final conclusion.
In literature, the decision tree has been utilized mainly for predicting the
outcome of catalysis at different reaction conditions (temperature, contact time, reactant
composition) and elemental composition (% mol) of only specific catalyst system by
using literature data [40-43]. Hence, the application of machine learning model such as
decision tree was applied for optimizing the performance of a specific type of catalyst,
not for the dealing the. The reason is this problem may come from i) the limited sample
numbers in literature data, ii) the bias sampling of literature between different catalyst
systems, which results in the difficulty in correlating the catalyst performance and
catalyst descriptors. As a natural consequence of random sampling, my dataset covers

143
a variety of catalyst compositions without anthropogenic biases. Such a dataset was
proven to be useful in directly extracting knowledge of catalyst design through machine
learning.

144
4.4. Conclusions
Synergistic combinations among multiple components are the key for designing
performant solid catalysts. However, they are hard to be generalized, which is why the
history of catalyst developments largely relied on an empirical try-and-error
methodology and serendipitous findings therein. In this study, I attempted to derive a
generalized guideline of catalyst design through: i) generation of 300 M1–M2–
M3/Support catalysts based on random sampling of a huge materials space, ii)
systematic evaluation of their performance in the oxidative coupling of methane (OCM)
using a high-throughput screening (HTS) instrument, and iii) analysis of thus obtained
catalyst big data. Major findings are summarized below.
The analysis of the data distribution suggested that performant catalysts are able to
retain high C2 selectivity at a higher O2 concentration and/or to activate CH4 at a
lower temperature.
Among the evaluated 291 catalysts, 51 and 106 catalysts were classified into
positive and negative catalysts, which noticeably improved and deteriorated the C2
yield with respect to the non-catalytic free radical process. The positive and
negative catalysts individually contained specific elements and supports at
relatively high frequency. Among these, several elements had not been regarded as
positive in literature. Novel performant catalysts were thus identified.
It was evidenced that the catalyst performance was determined by the performance
of constituent combinations, rather than the inclusion of specific elements or
supports. It was also found that synergistic and antagonistic combinations
individually contained combinations between specific elements and supports. The

145
rules of such combinations could be described based on the groups in the periodic
table. This suggested general effectiveness of d0 metallic salts.
A guideline of combinatorial catalyst design was described based on the decision
tree classification analysis. Positive catalyst should contains at one support among
these support (La2O3, BaO, CaO, TiO2), or contain at least one rare-earth element.
Some positive ternary combination: La2O3*group 2*group 1, La2O3*group 2*rare
earth, La2O3*Rare earth*group 6, and TiO2*group 4*rare earth
To the end, this study successfully demonstrated the power of bias-free catalyst big
data in finding novel catalysts as well as a catalyst design guideline. It is also
important to state the essentiality of high-throughput experimentation and data
science approaches for implementing such a demanding study in a realistic
timeframe. By equipping all the essential techniques of the study, truly non-
empirical catalyst developments could be realized.

146
4.5. References
[1] E.-J. Ras, G. Rothenberg, Heterogeneous catalyst discovery using 21st century
tools: a tutorial, RSC Adv., 4 (2014) 5963-5974.
[2] W.A. Herrmann, 100 years of metal carbonyls: a serendipitous chemical discovery
of major scientific and industrial impact, J. Organomet. Chem., 383 (1990) 21-44.
[3] V. Busico, R. Pellecchia, F. Cutillo, R. Cipullo, High‐Throughput Screening in
Olefin‐Polymerization Catalysis: From Serendipitous Discovery Towards Rational
Understanding, Macromol. Rapid Commun., 30 (2009) 1697-1708.
[4] J.M. Venegas, W.P. McDermott, I. Hermans, Serendipity in catalysis research:
boron-based materials for alkane oxidative dehydrogenation, Acc. Chem. Res., 51
(2018) 2556-2564.
[5] S. Huh, H.T. Chen, J.W. Wiench, M. Pruski, V.S.Y. Lin, Cooperative catalysis by
general acid and base bifunctionalized mesoporous silica nanospheres, Angew. Chem.,
117 (2005) 1860-1864.
[6] P. Chandra, A.M. Jonas, A.E. Fernandes, Spatial coordination of cooperativity in
silica-supported Cu/TEMPO/Imidazole catalytic triad, ACS Catal., 8 (2018) 6006-6011.
[7] J.M. Notestein, A. Katz, Enhancing heterogeneous catalysis through cooperative
hybrid organic–inorganic interfaces, Chem. Eur. J., 12 (2006) 3954-3965.
[8] A. Thakur, R. Baba, T. Wada, P. Chammingkwan, T. Taniike, Cooperative Catalysis
by Multiple Active Centers of a Half-Titanocene Catalyst Integrated in Polymer
Random Coils, ACS Catal., 9 (2019) 3648-3656.
[9] J.W. Thybaut, J. Sun, L. Olivier, A.C. Van Veen, C. Mirodatos, G.B. Marin,
Catalyst design based on microkinetic models: Oxidative coupling of methane, Catal.
Today, 159 (2011) 29-36.
[10] J. Sun, J.W. Thybaut, G.B. Marin, Microkinetics of methane oxidative coupling,
Catal. Today, 137 (2008) 90-102.
[11] T. Kobayashi, T. Yamada, K. Kayano, Effect of basic metal additives on NOx
reduction property of Pd-based three-way catalyst, Appl. Catal., B, 30 (2001) 287-292.
[12] C.-H. Tsai, H.-T. Chen, S.M. Althaus, K. Mao, T. Kobayashi, M. Pruski, V.S.Y.
Lin, Rational catalyst design: a multifunctional mesoporous silica catalyst for shifting
the reaction equilibrium by removal of byproduct, ACS Catal., 1 (2011) 729-732.
[13] T.P.N. Tran, A. Thakur, D.X. Trinh, A.T.N. Dao, T. Taniike, Design of Pd@
Graphene oxide framework nanocatalyst with improved activity and recyclability in
Suzuki-Miyaura cross-coupling reaction, Appl. Catal., A, 549 (2018) 60-67.
[14] G. Kumar, E. Nikolla, S. Linic, J.W. Medlin, M.J. Janik, Multicomponent
catalysts: limitations and prospects, ACS Catal., 8 (2018) 3202-3208.

147
[15] T. Taniike, M. Terano, Coadsorption model for first-principle description of roles
of donors in heterogeneous Ziegler–Natta propylene polymerization, J. Catal., 293
(2012) 39-50.
[16] J.M. Thomas, Design, synthesis, and in situ characterization of new solid catalysts,
Angew. Chem. Int. Ed., 38 (1999) 3588-3628.
[17] G.P. Szijjártó, Z. Pászti, I. Sajó, A. Erdőhelyi, G. Radnóczi, A. Tompos, Nature of
the active sites in Ni/MgAl2O4-based catalysts designed for steam reforming of ethanol,
J. Catal., 305 (2013) 290-306.
[18] J.C. Vedrine, Revisiting active sites in heterogeneous catalysis: Their structure and
their dynamic behaviour, Appl. Catal., A, 474 (2014) 40-50.
[19] T. Taniike, T. Funako, M. Terano, Multilateral characterization for industrial
Ziegler–Natta catalysts toward elucidation of structure–performance relationship, J.
Catal., 311 (2014) 33-40.
[20] A. Thakur, T. Hamamoto, T. Ikeda, P. Chammingkwan, T. Wada, T. Taniike,
Microwave-assisted polycondensation for screening of organically-modified
TiO2/SiO2 catalysts, Appl. Catal., A, (2020) 117508.
[21] C.H. Wu, C. Liu, D. Su, H.L. Xin, H.-T. Fang, B. Eren, S. Zhang, C.B. Murray,
M.B. Salmeron, Bimetallic synergy in cobalt–palladium nanocatalysts for CO
oxidation, Nat. Catal., 2 (2019) 78-85.
[22] D.S. Mannel, M.S. Ahmed, T.W. Root, S.S. Stahl, Discovery of multicomponent
heterogeneous catalysts via admixture screening: PdBiTe catalysts for aerobic
oxidative esterification of primary alcohols, J. Am. Chem. Soc., 139 (2017) 1690-1698.
[23] G. P Szijjarto, A. Tompos, K. Héberger, J. L Margitfalvi, Synergism between
constituents of multicomponent catalysts designed for ethanol steam reforming using
partial least squares regression and artificial neural networks, Comb. Chem. High
Throughput Screen., 15 (2012) 105-113.
[24] K. Takahashi, L. Takahashi, I. Miyazato, J. Fujima, Y. Tanaka, T. Uno, H. Satoh,
K. Ohno, M. Nishida, K. Hirai, J. Ohyama, T.N. Nguyen, S. Nishimura, T. Taniike,
The rise of catalyst informatics: Towards catalyst genomics, ChemCatChem, 11 (2019)
1146-1152.
[25] A. Galadima, O. Muraza, Revisiting the oxidative coupling of methane to ethylene
in the golden period of shale gas: A review, J. Ind. Eng. Chem., 37 (2016) 1-13.
[26] B. Wang, S. Albarracín-Suazo, Y. Pagán-Torres, E. Nikolla, Advances in methane
conversion processes, Catal. Today, 285 (2017) 147-158.
[27] U. Zavyalova, M. Holena, R. Schlögl, M. Baerns, Statistical analysis of past
catalytic data on oxidative methane coupling for new insights into the composition of
high-performance catalysts, ChemCatChem, 3 (2011) 1935-1947.

148
[28] R. Schmack, A. Friedrich, E.V. Kondratenko, J. Polte, A. Werwatz, R. Kraehnert,
A meta-analysis of catalytic literature data reveals property-performance correlations
for the OCM reaction, Nat. Commun., 10 (2019) 1-10.
[29] X. Jia, A. Lynch, Y. Huang, M. Danielson, I. Lang’at, A. Milder, A.E. Ruby, H.
Wang, S.A. Friedler, A.J. Norquist, J. Schrier, Anthropogenic biases in chemical
reaction data hinder exploratory inorganic synthesis, Nature, 573 (2019) 251-255.
[30] T.N. Nguyen, T.P.N. Tran, K. Takimoto, A. Thakur, S. Nishimura, J. Ohyama, I.
Miyazato, L. Takahashi, J. Fujima, K. Takahashi, T. Taniike, High-Throughput
Experimentation and Catalyst Informatics for Oxidative Coupling of Methane, ACS
Catal., 10 (2020) 921-932.
[31] F. Pedregosa, G. Varoquaux, A. Gramfort, V. Michel, B. Thirion, O. Grisel, M.
Blondel, P. Prettenhofer, R. Weiss, V. Dubourg, J. Vanderplas, A. Passos, D.
Cournapeau, M. Brucher, M. Perrot, É. Duchesnay, Scikit-learn: Machine Learning in
Python, J. Mach. Learn. Res., (2011) 2825−2830.
[32] C. Karakaya, H. Zhu, C. Loebick, J.G. Weissman, R.J. Kee, A detailed reaction
mechanism for oxidative coupling of methane over Mn/Na2WO4/SiO2 catalyst for non-
isothermal conditions, Catal. Today, 312 (2018) 10-22.
[33] E.V. Kondratenko, M. Schlüter, M. Baerns, D. Linke, M. Holena, Developing
catalytic materials for the oxidative coupling of methane through statistical analysis of
literature data, Catal. Sci. Technol., 5 (2015) 1668-1677.
[34] V.I. Alexiadis, M. Chaar, A. van Veen, M. Muhler, J.W. Thybaut, G.B. Marin,
Quantitative screening of an extended oxidative coupling of methane catalyst library,
Appl. Catal., B, 199 (2016) 252-259.
[35] W. Liang, S. Sarsani, D. West, A. Mamedov, I. Lengyel, H. Perez, J. Lowrey,
Performance improvement for a fixed-bed reactor with layered loading catalysts of
different catalytic properties for oxidative coupling of methane, Catal. Today, 299
(2018) 60-66.
[36] D. Noon, B. Zohour, S. Senkan, Oxidative coupling of methane with La2O3–CeO2
nanofiber fabrics: A reaction engineering study, J. Nat. Gas. Sci. Eng., 18 (2014) 406-
411.
[37] E.V. Kondratenko, T. Peppel, D. Seeburg, V.A. Kondratenko, N. Kalevaru, A.
Martin, S. Wohlrab, Methane conversion into different hydrocarbons or oxygenates:
current status and future perspectives in catalyst development and reactor operation,
Catal. Sci. Technol., 7 (2017) 366-381.
[38] L. Olivier, S. Haag, H. Pennemann, C. Hofmann, C. Mirodatos, A.C. van Veen,
High-temperature parallel screening of catalysts for the oxidative coupling of methane,
Catal. Today, 137 (2008) 80-89.
[39] B.L. Farrell, V.O. Igenegbai, S. Linic, A Viewpoint on Direct Methane Conversion
to Ethane and Ethylene Using Oxidative Coupling on Solid Catalysts, ACS Catal., 6
(2016) 4340-4346.

149
[40] T. Williams, K. McCullough, J.A. Lauterbach, Enabling Catalyst Discovery
through Machine Learning and High-Throughput Experimentation, Chem. Mater., 32
(2020) 157-165.
[41] Ç. Odabaşı, M.E. Günay, R. Yıldırım, Knowledge extraction for water gas shift
reaction over noble metal catalysts from publications in the literature between 2002 and
2012, Int. J. Hydrog. Energy, 39 (2014) 5733-5746.
[42] M.E. Günay, R. Yildirim, Knowledge extraction from catalysis of the past: a case
of selective CO oxidation over noble metal catalysts between 2000 and 2012,
ChemCatChem, 5 (2013) 1395-1406.
[43] M.E. Günay, R. Yildirim, Modeling preferential CO oxidation over promoted
Au/Al2O3 catalysts using decision trees and modular neural networks, Chem. Eng. Res.
Des., 91 (2013) 874-882.

150
Chapter 5
General conclusion

151
Materials informatics is an emerging area of study, which utilizes data-driven
approaches with the expectation to bring irreversible changes in the research and
development of materials science. Even though many successful demonstrations of
materials informatics have been recorded, the lack of a proper dataset is seen as the
bottleneck of the implementation and breakthrough. While the literature data have been
accumulated and ready to use, they suffer from an insufficient scale, non-uniformity,
and anthropogenic biases towards good data with the burial of poor data. Moreover,
materials properties such as catalyst performance are highly sensitive to process
conditions, which can be varied from one literature to another literature. Therefore,
efforts to establish a uniform and sufficient dataset have to be put in the first priority.
In Chapter 2, I reported an attempt of applying high-throughput
experimentation towards the generation of catalyst big data for their usage in catalyst
informatics using oxidative coupling of methane (OCM) as an example. I have
successfully developed a high-throughput screening (HTS) instrument that
automatically acquires 4320 data points for 20 separated catalysts per run in a process-
consistent manner. From our obtained dataset, several visualization tools and machine
learning techniques were applied to successfully extract knowledge from the obtained
dataset. It was found that the OCM reaction is generally sensitive to the process
conditions, and catalyst design has a great impact on the process dependence. In
particular, the modification of Si-based support affects the performance of Mn-Na2WO4
in terms of the low-temperature activation of CH4 and the selectivity tolerance against
high O2 concentration.
In order to explore the origin of the low-temperature CH4 activation by the
modification of Si-based supports, in Chapter 3, a series of Si-based supports differing

152
in the pore size, structure, and composition were employed to immobilize the Mn-Na-
W active phase. The HTS instrument was utilized to evaluate the catalytic performance
under various reaction conditions. It was found that supports of high Si contents were
good supports in general, while specifically at low temperature, mesoporous Si-based
supports appeared to be most effective. By a series of characterization, it was elucidated
that a high Si content is advantageous in forming a cristobalite phase, which is known
to stabilize tetrahedral WO4– active species, and the presence of mesopores is important
for uniform dispersion of the active phase.
In Chapter 4, I demonstrated bias-free exploration of new OCM catalysts with
the aid of random sampling from a huge materials space, HTS, and statistical analysis.
Here, 300 M1-M2-M3/support catalysts were prepared and evaluated. Based on
statistical analysis, I successfully identified individual elements and their binary
combinations which are positive for the OCM performance. The results covered not
only with the known catalysts obtained in the past three decades but also suggested new
interactions which have never been reported.
I believe that the research works carried out in this thesis have clearly delivered
the advantages of high-throughput experimentation and catalysts informatics for
catalyst development. The same concept is widely applicable to many catalyst systems.
Therefore, as a perspective, in the future, I would like to apply this new concept to other
reaction to strengthen this concept. In this light, my thesis is expected to provide a new
direction in the research and development of catalysts.

153
List of Publications and Other Achievements
Thanh Nhat Nguyen
A) PUBLICATION
1) Thanh Nhat Nguyen, Thuy Tran Phuong Nhat, Ken Takimoto, Ashutosh Thakur,
Shun Nishimura, Junya Ohyama, Itsuki Miyazato, Lauren Takahashi, Jun Fujima,
Keisuke Takahashi, Toshiaki Taniike, High-throughput experimentation and catalyst
informatics for oxidative coupling of methane, ACS Catalysis, 2020, 10, 921–932.
2) Keisuke Takahashi, Lauren Takahashi, Itsuki Miyazato, Jun Fujima, Yuzuru Tanaka,
Takeaki Uno, Hiroko Satoh, Koichi Ohno, Mayumi Nishida, Kenji Hirai, Junya
Ohyama, Thanh Nhat Nguyen, Shun Nishimura, Toshiaki Taniike, The Rise of
Catalyst Informatics: Towards Catalyst Genomics, ChemCatChem, 2019, 11, 1146–
1152.
3) Thuy Phuong Nhat Tran, Ashutosh Thakur, Thanh Nhat Nguyen, Priyank Mohan,
Toru Wada, Patchanee Chammingkwan, Toshiaki Taniike, Understanding
chemiluminescence in catalytic oxidation of CO and hydrocarbons, Catalysis Today,
2020, doi.org/10.1016/j.cattod.2020.02.034
B) INTERNATIONAL CONFERENCE
1) Understanding the Thermal Degradation of Biobased Polyimide Derived from 4-
Aminocinnamic Acid Photodimer, Thanh Nhat Nguyen, Tatsuo Kaneko, Toshiaki
Taniike, Chemistry Conference for Young Scientists 2020 (CHEMCYS2020),
Blankenberge, Belgium, Feb. 19-21, 2020, poster presentation.
2) High-Throughput Experimentation and Catalyst Informatics in Oxidative Coupling
of Methane, Thanh Nhat Nguyen, Thuy Phuong Nhat Tran, Ashutosh Thakur, Shun
Nishimura, Keisuke Takahashi, Toshiaki Taniike, Chemistry Conference for Young
Scientists 2020 (CHEMCYS2020), Blankenberge, Belgium, Feb. 19-21, 2020, oral
presentation.

154
2) High-Throughput Experimentation in Oxidative Coupling of Methane, Thanh Nhat
Nguyen, Thuy Phuong Nhat Tran, Ashutosh Thakur, Shun Nishimura, Keisuke
Takahashi, Toshiaki Taniike, The 8th Asia Pacific Congress on Catalysis (APCAT-8),
Bangkok, Thailand, Aug. 4-7, 2019, poster presentation.
4) Thermal degradation and stabilization of bio-based polyimide, Thanh Nhat
Nguyen, Anh Thi Ngoc Dao, Tatsuo Kaneko, Toshiaki Taniike, 10th International
Conference of Modification, Degradation and Stabilization of Polymers (MoDeSt
2018), Tokyo, Japan, Sept. 2-6, 2018, poster presentation.
C) DOMESTIC CONFERENCE
1) Thermal degradation mechanism of bio-based polyimide derived from 4-
aminocinnamic acid photodimer, Thanh Nhat Nguyen, Tatsuo Kaneko, Toshiaki
Taniike, 令和元年度 エクセントコア「天然マテリアル」研究拠点シンポジウ
ム, 第11回サクラン研究会年次大会, 能美, 2019年 10月 25日, ポスター
2) Insights into the thermo-oxidative degradation of bio-based polyimide derived from
4-aminocinnamic acid photodimer, Thanh Nhat Nguyen, Tatsuo Kaneko, Toshiaki
Taniike, 第 8回 JACI/GSCシンポジウム, 東京, 2019年 6月 24-25日, ポスター.
3) Thermal degradation and stabilization of biobased polyimide from 4‑aminocinnamic
acid photodimer, Thanh Nhat Nguyen, Tatsuo Kaneko, Toshiaki Taniike平成 29年
度 日本化学会近畿支部 北陸地区講演会と研究発表会, 能美, 2017年 12月 1日,
ポスター
D) AWARD
Best Poster Presentation Award, "Understanding the Thermal Degradation of Biobased
Polyimide Derived from 4-Aminocinnamic Acid Photodimer", Thanh Nhat Nguyen,
Chemistry Conference for Young Scientists 2020 (CHEMCYS2020), Blankenberge,
Belgium, 2/2020.