Embed Size (px)
Citation preview

Dissertation
Submitted to the
Combined Faculties for the Natural Sciences and for Mathematics of the Ruperto Carola University of Heidelberg, Germany
for the degree of
Doctor of Natural Sciences
Presented by
Swarnima Joshi, MSc.
Born in: Kotdwara, India
Oral examination: 01.10.2019

Investigation of genes involved in muscle
function using zebrafish
Referees: Prof. Dr. Uwe Strähle
Dr. Thomas Dickmeis

Table of Contents 1 INTRODUCTION ...................................................................................................................... 1
1.1 GENERAL INTRODUCTION ...................................................................................................... 1 1.1.1 Types of muscles .............................................................................................................. 2 1.1.2 Skeletal muscle architecture .......................................................................................... 3 1.1.3 Sarcomere structure and muscle contraction ............................................................. 6 1.1.4 Sensory-motor coordination in zebrafish larvae ......................................................... 8
1.2 MYOGENESIS IN ZEBRAFISH .................................................................................................... 9 1.3 UNDERSTANDING GENE FUNCTION ........................................................................................ 11
1.3.1 Forward genetics: from phenotype to genotype: ..................................................... 11 1.3.2 Reverse genetics: from genotype to phenotype: ...................................................... 12
1.4 GENETIC KNOCKOUT MODEL OF APOBEC2 ............................................................................... 15 1.5 AIM OF THIS THESIS ............................................................................................................ 16
2 MATERIAL AND METHODS ................................................................................................... 17
2.1 MATERIALS ...................................................................................................................... 17 2.2 METHODS ........................................................................................................................ 21
2.2.1 Embryonic Methods and Fish handling ...................................................................... 21 2.2.2 Histological methods .................................................................................................... 23 2.2.3 Molecular biology methods ......................................................................................... 26 2.2.4 Crossing schemes .......................................................................................................... 32
3 RESULTS ............................................................................................................................... 34
3.1 ASSESSING GUIDE RNA CUTTING EFFICIENCIES WITH A SIMPLE PCR BASED METHOD ....................... 34 3.1.1 Quantification of cutting efficiency ............................................................................ 35 3.1.2 PCR-F-SEQ as a web interface ..................................................................................... 37
3.2 UNDERSTANDING THE ROLE OF APOBEC2A AND 2B GENES IN MUSCLE DEVELOPMENT ...................... 39 3.2.1 apobec2a and 2b knockout using CRISPR/Cas9 ........................................................ 39 3.2.2 Double homozygous mutants do not show any muscular defect ........................... 43 3.2.3 Pax7 positive cells were not affected in the mutant ................................................ 44 3.2.4 apobec2a/2b mRNA transcript is absent in apobec2aka98/ka98; apobec2bka99/ka99
mutants ....................................................................................................................................... 45 3.2.5 Knockdown of apobec2a in apobec2aka98/ka98; apobec2bka99/ka99 mutants ........... 46 3.2.6 Loss of apobec2a might be compensated by apobec2b mRNA upregulation ...... 46
3.3 FORWARD GENETIC APPROACH TO STUDY THE EXISTING MOBILITY MUTANT LINES ........................... 48 3.3.1 Mutants with reduced motility combined with reduced trunk muscle striation
(Group A) ..................................................................................................................................... 50 3.3.2 Mutants with reduced embryonic locomotion (Group B) ........................................ 54 3.3.3 Motility mutants isolated in the Tübingen EU screen .............................................. 57
3.4 NEXT GENERATION SEQUENCING FOR MUTATION MAPPING ........................................................ 61

3.5 VALIDATION OF THE CANDIDATE GENES .................................................................................. 62 3.5.1 Mutants classified under group A ............................................................................... 62 3.5.2 Mutants classified under group B ............................................................................... 63 3.5.3 Mutants from the Tübingen EU screen ...................................................................... 70
4 DISCUSSION .......................................................................................................................... 71
4.1 IMPORTANCE OF GUIDERNA EFFICIENCY FOR GENE EDITING ....................................................... 71 4.2 CRISPR/CAS9 AND GENETIC ROBUSTNESS ............................................................................... 73 4.3 FORWARD GENETICS: A WINDOW TO NOVELTY? ....................................................................... 76 4.4 POSTMEIOTIC MUTAGENESIS: DELETION IN T30064 ................................................................. 77 4.5 MODELING HUMAN DISEASES IN ZEBRAFISH ............................................................................ 78
5 FUTURE PERSPECTIVES ........................................................................................................ 80
6 REFERENCES ......................................................................................................................... 82
APPENDIX ..................................................................................................................................... 94

I
Dedicated to my family

II
Summary
The genetic basis of many muscle diseases is known but an understanding of the
mechanism underlying muscle weakness is often missing hence a gap remains for the
development of effective treatments of these pathologies. Since the process of muscle
development as well as function is highly conserved throughout evolution, the skeletal
muscles of zebrafish (Danio rerio) show remarkable structural and molecular similarities to
those of humans. At the same time, they also make up a considerable portion of its body.
Therefore, investigating the developmentally relevant motility genes in zebrafish could help
to decipher essential but poorly understood aspects of myogenesis.
In this project, I adopted two distinct experimental approaches. The first part of the
thesis deals with creating a genetic knockout model to understand the molecular function of
the genes apobec2a and 2b which were shown to be relevant for muscle development by our
lab. In the course of creating knockouts, we applied a novel, efficient and cost-effective
method to predict guide RNA efficiency in zebrafish. The quantitative assessment of gRNAs
was provided by the web tool, PCR-F-SEQ which was developed and optimized by us especially
for the zebrafish model system. This tool represents a simple but powerful method to screen
injected batches of embryos before sending them for raising. Although apobec2a/2b
morphants show a dystrophic phenotype, the genetic knockouts do not exhibit any muscle
phenotype indicating a possible genetic compensation.
In addition, an unbiased approach of investigating the motility mutants isolated from
Tübingen screens was used. The rate of retrieval of mutant couples from sperm samples of
the Ist and IIIrd Tübingen screens were around 66% and 40% respectively. Following the revival
and phenotypic characterization of these lines, we developed a pipeline using next generation
sequencing to accurately identify the disease-causing alleles. Mapping of mutations and
validation of candidate genes were successfully done for all the six revived lines. Amongst
which, we reported a missense mutation in choline-O-acetyltransferase a (chata) gene,
encoding an enzyme essential for the synthesis of a major neurotransmitter, acetylcholine
(ACh). The in-silico analysis showed that the substitution of serine to arginine might affect the
protein stability disrupting the catalysis of acetyl CoA and choline to form ACh.
In conclusion, this thesis showcases the challenges and strengths of both reverse and
forward genetic approaches to study vertebrate development and also highlights the
importance of strategies and tools now available for making genetic models.

III
Zusammenfassung
Die genetische Grundlage vieler Muskelerkrankungen ist zwar bekannt, aber oft fehlt
die Kenntnis des Mechanismus, der der Muskelschwäche zugrundeliegt, so daß eine Lücke für
die Entwicklung effektiver Behandlungen dieser Pathologien verbleibt. Da der Prozess der
Muskelentwicklung wie auch der Muskelfunktion in der Evolution hochgradig konserviert ist,
zeigen die Skelettmuskeln des Zebrafischs (Danio rerio) bemerkenswerte strukturelle und
molekulare Ähnlichkeiten mit denen des Menschen. Zugleich machen sie auch einen
erheblichen Teil seines Körpers aus. Daher könnte die Untersuchung von
entwickungsbiologisch relevanten Motilitätsgenen im Zebrafisch helfen, essentielle, aber
wenig verstandene Aspekte der Myogenese zu entschlüsseln.
In diesem Projekt habe ich zwei unterschiedliche experimentelle Ansätze verfolgt. Der
erste Teil der Dissertation befaßt sich mit der Erzeugung eines genetischen Knockout-Modells,
um die molekulare Funktion der Gene apobec2a und 2b zu verstehen, von denen unsere
Arbeitsgruppe gezeigt hatte, daß sie relevant für die Muskelentwicklung sind. Bei der
Erzeugung von Knockouts wandten wir eine neuartige, effiziente und kostengünstige
Methode zur Vorhersage der Guide-RNA-Effizienz im Zebrafisch an. Die quantitative
Bewertung von gRNAs erfolgte durch das Online-Werkzeug PCR-F-SEQ, das von uns entwickelt
und speziell für das Zebrafisch-Modellsystem optimiert wurde. Dieses Werkzeug stellt eine
einfache, aber mächtige Methode dar, um injizierte Chargen von Embryonen zu screenen,
bevor sie in die Aufzucht gegeben werden. Obwohl apobec2a/2b-Morphanten eine
dystrophen Phänotyp zeigen, weisen die genetischen Knockouts keinen Muskelphänotyp auf,
was auf eine mögliche genetische Kompensation hinweist.
Des weiteren wurde ein unvoreingenommer Ansatz zur Untersuchung von
Motilitätsmutanten aus den Tübinger Screens benutzt. Die Rate der Wiedergewinnung von
mutanten Paaren aus Spermienproben des I. und III. Tübinger Screens lag bei 66% bzw. 40%.
Nach der Rekonstitution und phänotypischen Charakterisierung dieser Linien führten wir eine
Next-Generation-Sequenzierung durch, um die krankheitsverursachenden Allele exakt zu
identifizieren. Kartierung der Mutationen und Validierung von Kandidatengenen wurden
erfolgreich für alle sechs rekonstituierten Linien durchgeführt. Von diesen publizierten wir
eine Missense-Mutation im choline-O-acetyltransferase a (chata)-Gen, das ein für die
Synthese des wichtigen Neurotransmitters Acetylcholin (ACh) essentielles Enzym kodiert. Die
in silico-Analyse zeigte, daß die Substitution von Serin durch Arginin die Proteinstabilität
beeinträchtigen und damit die Katalyse der Reaktion von Acetyl-CoA und Cholin zu ACh
behindern könnte.
Insgesamt demonstriert diese Doktorarbeit die Schwierigkeiten und Stärken von
revers-genetischen wie auch von vorwärts-genetischen Ansätzen zur Untersuchung der
Wirbeltierentwicklung, sowie die Wichtigkeit der Wahl der richtigen Strategie und Werkzeuge
für die Herstellung genetischer Knockout-Modelle.

IV
Acknowledgements
This dissertation would have not been possible without the support of numerous people I have
come across. First and foremost, I want to express my gratitude to my supervisor Prof. Uwe
Strähle for his insights in navigating through this long journey. I will be forever grateful to him
for providing me this opportunity.
I would like to sincerely thank Sepand for always accompanying us to the Zencode meetings
and for guiding us. Without his effort, it would have been impossible to understand the value
of teamwork.
I would like to acknowledge some other important people whose contribution to my research
work has an outstanding importance: I would like to thank Christelle for introducing me to the
topic and dealing with my research problems. She has always been there for me, kept me in
check and over the years I have come to regard her as one of my supervisors. Thank you again
for putting faith in me. Our invaluable aura of friendship will never fade. I am also very grateful
to Robert for not just providing an immense help in correcting my paper and thesis but also for
the patient guidance he has provided. His kind nature and vast knowledge provided insightful
discussions about the research work. I would like to acknowledge other members of my thesis
advisory committee, Dr. Kassel and Dr. Davidson for their encouragement and thought-
provoking comments during annual progress seminars.
The members of Strähle group have contributed immensely to my personal and
professional time at KIT. I am especially grateful for the people of the group who stuck it out in
grad school with me: Sanamjeet and Vanessa, without whom this journey would have no colors.
For this research work, NGS data generation and analysis was crucial and for that I
would like to wholeheartedly thank our sequencing facility and Sanamjeet for his efforts as well
as continuous support. Without him this piece of work would be just incomplete. Apart from
the research cooperation, I also would like to thank him for tolerating all the arguments we had
and for maintaining such a friendly relationship. I am gladly taking our friendship along!
I am particularly indebted to Vanessa for being a great colleague and a lovely friend.
Her blend of straightforward criticism combined with heart-warming support was utmost
required during tough times. I would also like to thank her for introducing me to many
protocols.
Masa and Volker shared some of their expert microscopy and muscle knowledge with
me. It was a pleasure working alongside these great PostDocs. The joy and enthusiasm Volker
have for his research was contagious and motivational for me, even during tough times in the
PhD pursuit. In regards to making this journey even more joyous, I would also like to thank rest
of the Strähle group members: Gao, Hendrik, Ariane, Luisa, Tanja, Sabrina, Angel, Dimitra. A
special thanks to Anne and Gao for their excellent support for few of my experiments.
It was my pleasure meeting and having friendly discussions with members of Dickmeis
group: Melanie, Andrea, Oksana, Mojtaba. Their presence made it even more lovely.

V
For behavioral analysis, I am very much thankful to Ravi and his screening platform. I
would also like to thank Prof. Ralf Mikut and Johannes Stegmaier for collaborating with us on
making the guide efficiency webtool. They have been extremely patient with our queries and
have contributed a lot in shaping things. I am also grateful for Marco, Nadine, Sonja, Thomas
and whole fish facility members for taking very good care of my fish lines. I very much
appreciate their continuous efforts and willingness to do frequent changes as requested.
This thesis would definitely not take its shape without the major help of Rene for
providing me with his extraordinary IT support. I am truly very grateful to him. Apart from that,
I am thankful to my funding sources; Marie Curie association that made my PhD work and stay
in Germany possible. Also, loved being a part of Zencode- ITN which provided an excellent
platform to learn and grow altogether. I am also very thankful to Prof. Carsten Daub for hosting
me for a secondment in his group at Karolinska Institute, Sweden.
Lastly, I would like to thank my family and friends for all their love and encouragement.
For my parents, brother and his wife who supported me in all my pursuits. For the presence of
my best friend Sonali here in Europe. She has provided immense support and motivation which
kept me moving forward.
And most of all for an encouraging, loving and patient person Aniruddha whose support
throughout my studies is the source of my sanity.

VI
List of figures Figure 1. Schematic representation of different types of muscles. ............................................. 2
Figure 2. Schematic representation of a cross section through vertebrate muscle. ................... 3
Figure 3. Zebrafish myotome and model of muscle contraction. ................................................ 5
Figure 4. Conduction of nerve action potential for sarcomeric contraction. ............................... 7
Figure 5. Larval response to types of stimulation. ........................................................................ 9
Figure 6. Somitic cell differentiation and migration. ................................................................. 10
Figure 7. Sequence profiles derived from four amplified fragment pools containing
CRISPR/Cas9 target sites quantify efficacy of gRNA mediated mutagenesis. ................ 35
Figure 8. Quantification of mutagenesis efficiency by different gRNAs assessed with the PCR-
F-Seq method................................................................................................................... 37
Figure 9. Web interface for applying the PCR-F-Seq method to sequence trace files provided
in the SCF format (*.scf). ................................................................................................. 38
Figure 10. In situ hybridization with apobec2a (A) and apobec2b (B) anti-sense probe at 24
hpf. ................................................................................................................................... 39
Figure 11. apobec2a and apobec2b guideRNA design and description of the mutations. ....... 41
Figure 12. Prediction of Apobec2 proteins after deletion. ........................................................ 42
Figure 13. Double homozygous (apobec2aka98/ka98
; apobec2bka99/ka99
) mutants do not exhibit a
muscle defect. .................................................................................................................. 43
Figure 14. Satellite cells are not affected in apobec2aka98/ka98; apobec2bka99/ka99 double
mutants. ........................................................................................................................... 45
Figure 15. RT-PCR confirms mRNA degradation in mutants. ..................................................... 45
Figure 16. apobec2a morpholino position and injection. .......................................................... 46
Figure 17. apobec2b is upregulated in double mutants at 24 hpf. ........................................... 47
Figure 18. Strategy for systematic study of revived ENU mutant lines. .................................... 48
Figure 19. Overview of an ENU based-forward genetic screen. ................................................ 49
Figure 20. Muscle integrity of froto27c and dustq250. ................................................................... 51
Figure 21. froto27c shows disorganized muscle fibers. ................................................................ 52
Figure 22. Complete degradation of muscle fiber structure was seen in mutants by 72 hpf. . 53
Figure 23. Immunostaining of fast and slow muscle fibers of dustq50 mutants and wild-type
siblings. ............................................................................................................................ 54
Figure 24. Phenotype of slmtt208. ................................................................................................ 55
Figure 25. Phenotype of chatatk64. ............................................................................................. 56
Figure 26. t30064 mutants show multiple defects. ................................................................... 57
Figure 27. t30064 exhibits massive muscle wasting. ................................................................. 58
Figure 28. Phenotype of t31198 mutants. ................................................................................. 59
Figure 29. Immunostaining of t31198 mutants show fibers spanning across disrupted
myosepta. ........................................................................................................................ 60
Figure 30. Vessel patterning was affected in t31198 mutants at 48 hpf. ................................. 61
Figure 31. Homozygosity score plot for tk64 covering all chromosomes. ................................ 65

VII
Figure 32. Multiple sequence alignment show conservation .................................................... 66
Figure 33. Human ChAT protein crystal structure and predicted effect of
the chatatk64mutation. ..................................................................................................... 68
Figure 34. Variants of chata mRNA and rescue of the mutant phenotype. .............................. 69

VIII
List of tables
Table 1. Oligonucleotides and Crispr guide sequences used in this project ............................. 17
Table 2. Plasmids ........................................................................................................................ 19
Table 3. BACs used in this project. ............................................................................................. 20
Table 4. Zebrafish lines revived from Tübingen and Sanger screens ........................................ 20
Table 5. Standard PCR reaction and normal PCR cycle .............................................................. 28
Table 6. Incrossing apobec2a+/- to apobec2b+/- gives rise to 25% apobec2a; apobec2b+/-
(double heterozygous) mutants (green). ........................................................................ 32
Table 7. Crossing of double heterozygous (apobec2a+/-; apobec2b+/-) gives 6.25% of
apobec2a; apobec2b-/- (double homozygous) mutants (green) ................................... 32
Table 8. Incrossing of apobec2a-/-; apobec2b+/- (homozygous for apobec2a and
heterozygous for apobec2b) gives 25% of apobec2a; apobec2b-/- (double homozygous)
mutants (green) ............................................................................................................... 33
Table 9. Mapped locus for each mutant line, the exact mutation and the best candidate gene
linked to the phenotype (from Virdi, 2019). ................................................................... 62
IX
Publications
1. “Tracking of Indels by DEcomposition is a Simple and Effective
Method to Assess Efficiency of Guide RNAs in Zebrafish.”
Etard C±, Joshi S±, Stegmaier J, Mikut R, Strähle U*.
Published: Zebrafish, 2017.
2. “Mutation of a serine near the catalytic site of the choline
acetyltransferase a gene almost completely abolishes motility of
the zebrafish embryo.”
Joshi S±, Virdi S±, Etard C, Geisler R*, Strähle U*.
Published: PLoSOne, 2018
± Authors contributed equally
* Corresponding author

1
1 Introduction
1.1 General introduction The skeletal muscle system is a crucial component of vertebrate anatomy having a
fundamental role in locomotion and equally important in metabolic homeostasis (Jackson and
Ingham, 2013; Manabe and Fujii, 2016). In a healthy state, it possesses an extraordinary ability
to regenerate the small-scale injuries which are a result of extensive daily usage. This repair
capacity is however compromised with age, genetic diseases and with large accidental
abrasions (Khodabukus et al., 2018).
Muscle diseases such as muscular dystrophies and myopathies are a heterogenous
group of diseases, sharing patterns of clinical symptoms like muscle wasting, weakness and
impaired locomotion due to muscle fiber dysfunction (Goody et al., 2017; Sevy et al., 2016).
Due to phenotypic heterogeneity, it remains very challenging to make a timely and accurate
diagnosis in order to develop a therapy. In a subset of muscular dystrophies called
dystroglycanopathies, clinical phenotypes span from severe, in case of congenital muscular
dystrophy-dystroglycanopathy affecting eye and brain, to mild cases seen in adults as limb-
girdle muscular dystrophy-dystroglycanopathy. A classical diagnostic approach involving
laboratory evaluation, imaging studies, multidisciplinary consultations and histologic
examination are still insufficient for many cases. Recently, another very successful, rapid and
patient-specific approach called next-generation sequencing (NGS), has been used to
accurately analyze the genetic cause. Thus, many of these myopathies have now been
identified and linked to one or several genes.
To determine the molecular and cellular causes of phenotypic variability for designing
therapies and to comprehend the relation between muscle development and disease,
zebrafish serve as an excellent disease model. There are several reasons for zebrafish embryos
in particular being the best suited model to study muscle development. Apart from their high
number of offsprings, ex-utero development, transparent embryos and low maintenance
costs; evolutionarily conserved muscle functions, somitic muscle accessibility and
development of motility shortly after gastrulation make them superior to other model
systems. Additionally, targeted gene inactivation using CRISPR/Cas9 in zebrafish has become
quite successful in creating genetic knockouts. The techniques are rather cost efficient and
rapid. On the other hand, large-scale random mutagenesis screens performed in zebrafish to

2
investigate developmentally relevant genes (Liu et al., 2017) have been quite successful. The
mutants generated in these screens were classified according to the observed traits and
around 1163 mutant lines were noted to display specific traits (Nüsslein-Volhard, 2012). Due
to the large number, mutant sperm stocks were established without fully investigating the
molecular causes. These samples were later brought to the European Zebrafish Resource
Center (EZRC) at KIT. Due to our utmost interest in investigating novel players of muscle
development, we took advantage of this large pool of uncharacterized lines; serving as a black
box for studying developmentally relevant genes without any bias.
1.1.1 Types of muscles Classification of vertebrate muscles is essential to understand their structure and function.
The best and widely recognized classification categorizes it into three distinct groups, striated
voluntary muscles (skeletal muscles), striated involuntary muscles (cardiac) and non-striated
involuntary muscles (smooth) (Kisia and Onyango, 2005).
Skeletal muscles are voluntary muscles, attached to the skeleton for the purpose of
movement. They are composed of myofibers which have numerous peripherally located
nuclei and organized striations (Figure 1A). Smooth muscles are composed of spindle-shaped
cells with centrally located nuclei, arranged in a `dovetail´ pattern (thin ends of cells are
adjacent to the thick middle portion of the next cell) (Figure 1B). They are non-striated,
involuntary muscles located in the walls of visceral organs. Cardiac muscles are located in the
walls of heart and are made up of myogenic fibers having centrally located nuclei (Figure 1C).
They are involuntary striated muscles which contract rhythmically from early embryonic
stages (DiFrancesco and Noble, 1985). Myogenic fibers are connected via branched
Figure 1. Schematic representation of different types of muscles. (A) Skeletal muscle is composed of myofibers, formed by the fusion of myoblast cells into a syncytium (multi-nucleated structure) with the nucleus being peripherally localized (blue). They appear striated (orange lines) i.e. arranged into repetitive functional units called sarcomeres. (B) Smooth muscles are non-striated muscles, made up of mononuclear cells which in most of the cases contract as a sheet. (C) Cardiac muscles are striated heart muscles, made up of cardiomyocytes joined together by intercalated discs (green). Nuclei are centrally localized (blue) and fibers interlinked by branches.

3
interlocking and have a distinct junctional specialization, called intercalated discs. These discs
help in spreading electrical impulses from one cell to the other.
1.1.2 Skeletal muscle architecture Skeletal muscles are characterized by a well-described arrangement of muscle fibers
(myofibers or muscle cells) and connective tissue (Frontera and Ochala, 2015). Individual
muscle is surrounded by a layer of connective tissue called Epimysium which provides strength
to the muscle (Figure 2). Myofibers within the muscle are packaged into bundles, also called
fascicle and are enveloped by a connective tissue layer called perimysium. Each individual
myofiber of the bundle is also enwrapped with a layer of connective tissue called
endomysium. Each muscle fiber is surrounded by a cell membrane called sarcolemma and is
made up of several thousand myofibrils (MacIntosh et al., 2006). Myofibrils have a highly
organized internal structure made up of myofilaments, the muscle proteins which form the
contractile units called sarcomeres.
It is composed of distinct types of fibers that are functionally adapted through differences in
their physiological and metabolic properties (Jackson and Ingham, 2013; Schiaffino and
Figure 2. Schematic representation of a cross section through vertebrate muscle. The overall muscle tissue is covered by an outer layer of connective tissue, epimysium covering fascicles, venules, arterioles and nerves. Myofibers are bundled together to form a fascicle together with narrow capillaries and surrounded by perimysium. Myofibers are coated with a thin layer of endomysium and are made up of thousands of myofibrils.

4
Reggiani, 2011). They are classified using many different criteria and according to the most
frequently used classification there are two fiber subtypes: type I and type II. Type II fibers are
subdivided into IIa and IIx (Frontera and Ochala, 2015; Galpin et al., 2012). Type I fibers are
also called slow-twitch fibers as they possess lower contraction velocity but are rich in
mitochondria which makes them aerobic in nature (Chemello et al., 2011; Pette and Staron,
1997). They are more efficient at using oxygen for ATP generation giving them ability to
contract over long durations. These fibers are also called red muscles as they contain more
myoglobin. On the contrary, Type II or fast muscle fibers inherit less mitochondria and
myoglobin, therefore are anaerobic in nature and white in color. They are adapted to generate
short speedy bursts of contractions but are fatigable unlike slow-twitch fibers which provide
more endurance and are fatigue resistant. The type of fiber proportions therefore varies
according to usage, slow fibers are numerous in marathon runners as they need long term
endurance whereas, weightlifters require fast muscles for quick and enormous force
generation for a short interval. Behavioral adaptations of fiber type are also seen in animals
where most of the fishes need to be capable of quick movement away from predators and
therefore have a high proportion of fast-twitch fibers. On the other hand, herbivorous
mammals require more slow-twitch fibers, enabling sustained muscle action required for
grazing.
Skeletal muscles in zebrafish
The musculo-skeletal system of zebrafish is simpler compared to that of tetrapods. The
muscles are aligned into sequential chevron shaped myotomes separated by a thin connective
tissue layer called vertical or transverse myosepta (Figure 3A). During early stages of
development, the myotomes are clearly visible as V-shaped structures which fold and overlap
to form a W shape in adults. The transverse myoseptum serves as a boundary for somites
which anchors the myofibrils whereas the horizontal myoseptum runs along the length of the
trunk and helps in pathfinding of cells during development.
Myosepta are functionally equivalent to myotendinous junctions in mammals;
connecting skeletal muscles to the axial skeleton, enabling contractions. They are composed
of matrix proteins mainly, dense collagen in the form of arrays and are required for adhesion
of the sarcolemma to ECM. Upon muscle contraction, the force is transmitted to the collagen
cones of the myosepta and to the vertebral column through the horizontal myosepta. The
myosepta, being elastic in nature, help in absorbing the tension and prevent it from being
transmitted to neighboring myomeres. Vertical/transverse myosepta being connected to the
skin is a requirement for movement.
The extracellular matrix (ECM) proteins such as type 1, 4, 6 collagen, tenascin C,
periostin, thrombospondin, laminin, DGC (dystrophin-glycoprotein complex consisting of
dystrophin, dystroglycan and sarcoglycan) and integrins are expressed in somite boundaries.
Mutations that prevent muscle fiber adhesion to their surrounding basement membrane
make fibers vulnerable to damage during repeated contractions and relaxations.

5
Skeletal muscle cells are amongst the largest cells found in an organism, ranging to more than
100 µm in diameter and centimeters in length. The size of the muscle is mostly determined by
the number and size of individual muscle fibers except during pathological conditions
(Frontera and Ochala, 2015). Myoblast/ skeletal muscle cells fuse together to create a
multinucleated structure (syncytium) called a myofiber. Each nucleus within the myofiber is
responsible for controlling the type of protein synthesized in that specific region of the cell,
which is called a nuclear domain. The protein expression is coordinated across adjacent
domains of a single fiber which ensures similarity of proteins across the length of the fiber.
Myofibers are composed of numerous myofibrils and are mainly composed of proteins (80%)
and sarcoplasm (8%) where proteins are categorized in three distinct classes according to their
function; contractile, regulatory and cytoskeletal proteins. Myofibrils take most of the space
squeezing other components like mitochondria, nuclei and granules to the periphery (Rosen
and Baylies, 2017). Myofibrils are made up of myofilaments which are composed of the two
most abundant contractile proteins, actin and myosin. The striated appearance of skeletal
muscle is because of the arrangement of these proteins in such a way that they create a
repetitive pattern of stripes in the myofibril. This pattern is visible under a light microscope
and is called a sarcomere, the fundamental unit of the muscle. During muscle contraction, thin
filaments slide along thick filaments, shortening the overall sarcomere length as shown in
Figure 3B.
Figure 3. Zebrafish myotome and model of muscle contraction. (A) Schematic drawing of developing zebrafish skeletal muscle myotome. Vertical myosepta separates chevron shaped (V-shaped) myotomes and exhibit an ordered arrangement. The horizontal myosepta is placed right in the middle, dividing the myotome in two halves. (B) Schematic view of sliding filaments for muscular contraction. Upon contraction, the thin filaments (blue) slide along the thick filaments (red) without changing the overall length of filaments. Such an arrangement causes the Z-lines to move closer together shrinking the overall sarcomeric structure.
6
1.1.3 Sarcomere structure and muscle contraction The sarcomere is the region between two Z-lines, which are dark and narrow lines clearly
visible in an electron micrograph. Z- lines are composed of a dense protein scaffold which
anchors actin or thin filaments. Myosin or thick filaments are attached to the Z-line with the
help of a large elastic protein called Titin (shown as blue springs in Figure 4). Titin not just
holds myosin filaments but has also been reported to contribute to force generation during
muscle actions. Light bands surrounding the Z-lines contain only thin filaments and together
are called an I-band (Figure 4). The A-band is the dark zone of the myofibril where myosin
filaments interact through myosin heads with actin filaments. The M-line is located right in
the middle of the sarcomere in the A-band where myosin filaments are held. The H-zone is
the zone in A-band, situated around the M-line and mainly composed of myosin filaments.
During contraction this zone disappears completely due to sliding of myosin over actin
filaments which shortens the distance between two Z-lines. Actin or thin filaments are also
linked to other proteins like Nebulin. These filaments are connected across sarcomeres by -
actinin which provides rigidity to the overall structure. The regulatory proteins like Calcium-
dependent troponin complex and tropomyosin play important roles in the process of
activation that leads to sliding of myofilaments and generation of force.
The sarcoplasm of the muscle fiber also includes a transverse tubular system called T-
tubules (Figure 4, shown in yellow) which are repetitive invaginations of sarcolemma or
plasma membrane. The signal for muscle contraction is relayed through the axons of the
motor neurons to muscle cells. At neuromuscular junction, the electrical signal from the motor
neuron gets transformed into a chemical signal via release of a neurotransmitter molecule
(acetylcholine) from the presynaptic membrane to the synaptic cleft by the process of
exocytosis (MacIntosh et al., 2006). The released acetylcholine then diffuses across the
synaptic cleft and binds to complementary receptors (nicotinic acetylcholine receptors) on ion
channel proteins, present on the post synaptic membrane (Wang et al., 2018). The binding of
the neurotransmitter to the receptors causes opening of sodium potassium-channels, creating
a sodium potassium gradient. Increased levels of sodium ions cause positive charge across the
post synaptic membrane, creating a membrane potential. T-tubules conduct this action
potential to the interior of the cell uniformly (Jayasinghe and Launikonis, 2013). Activation of
Voltage-dependent L-type calcium channels present on the membrane of T-tubules, triggers
the activation of ryanodine receptors to open the calcium channels located on the membrane
of sarcoplasmic reticulum (Lamboley et al., 2014). The calcium is reserved in the ends of the
sarcoplasmic reticulum called terminal cisternae, that are in close contact with the transverse
tubule system is then released into the cytoplasmic fluid. During the resting stage, the
regulatory proteins like tropomyosin (light green) and troponin (dark green) makes the myosin
binding sites on the actin molecules inaccessible as the two strands of tropomyosin wrap
around the thin filaments covering the binding sites as shown in Figure 4. In the excitatory
phase, the released calcium (in green) binds to the troponin displacing tropomyosin from the
binding sites of myosin. The myosin heads bind to ATP and upon hydrolysis into ADP and Pi

7
attains a high energy state where the myosin heads extend to the binding sites on actin. The
two filaments are then connected (cross-bridge). The byproducts ADP and Pi are then released
causing myosin to return to a low energy state called a power stroke where thin filaments are
pulled towards the center of the sarcomere. As the action potentials terminate, calcium gets
pumped back into the ER, allowing the inhibition of the direct interaction of myosin and actin
by retraction of troponin back to its state.
Figure 4. Conduction of nerve action potential for sarcomeric contraction. Nerve action potential is transferred via a network of T-tubules (yellow). The ends of the sarcoplasmic reticulum present in close proximity of T tubules release stored calcium causing topological changes in the sarcomere allowing myosin heads to bind to the actin filaments which causes pulling of actin filaments towards the M-line, causing the contraction of the sarcomere. Image adapted and modified from Frontera and Ochala, 2015.

8
1.1.4 Sensory-motor coordination in zebrafish larvae
Motility of an animal is adapted to the environment it perceives. It is achieved by the
coordination of sensory and motor components. When zebrafish sense vibrations in water
from a threat, they follow a particular escape trajectory by turning to the contralateral side,
forming a C-Shaped body curvature (Drapeau et al., 2002; Pietri et al., 2009; Umeda et al.,
2016). This fast startle response of the embryo is called C-bend´. Such an embryonic response
to touch is observed at around 21 hpf, where a twist in the body occurs due to trunk muscle
contraction. With age, this response becomes faster and a contralateral movement associated
with alternate tail flips is seen. In larvae, the tactile stimuli on the head and trunk are detected
by mechanosensory neurons, trigeminal (TG) and Rohon-Beard (RB) respectively. RB neurons
are pseudo-unipolar neurons, having central and peripheral axons (Bernhardt et al., 1990;
Metcalfe et al., 1990). These neurons are transient neuronal populations as most of them are
replaced by dorsal root ganglion neurons (DRG) within 5 days post fertilization (Reyes et al.,
2004). RB neurons cover the entire epidermis through their well-interconnected peripheral
arbors (Figure 5A). RB cell bodies reside as longitudinal columns within the dorsal spinal cord.
The central axon extends in the rostral-caudal direction, where the ascending branch reaches
the hindbrain whereas, the peripheral axons undergo multiple bifurcations, forming a highly
branched structure that innervates the skin. The longitudinally present central axons on the
ipsilateral side altogether form a tract called dorsolateral fasciculus (DLF) (Liu, 2005; Ogino K.,
2018; Umeda et al., 2016). Additionally, the central axons form synaptic contacts with
commissure primary ascendance neurons (CoPA), from which the post-commissural axons
merge with DLF on the contralateral side, enabling extension beyond the spinal cord.

9
It has been shown that robust, contralateral turning from the stimuli requires multicell
stimulation on RB neurons like that of touch (Figure 5B´´) whereas, lower grades of
stimulations (Photo-stimulation of single RB neuron) cause ipsilateral turning (Figure 5B´)
(Umeda et al., 2016) which might be a common capturing response to minimal vibrations
made by planktonic animals in water. Additionally, touch sensitivity studies done in mouse
and cells proposed Piezo1 and Piezo2 being the mechanically activated channels expressed in
many tissues (Coste et al., 2010). Piezo homologs (piezo1, piezo2a, and piezo2b) were also
found in zebrafish of which only piezo2b is expressed specifically in TG and RB neurons in
larvae at 24 hpf (Faucherre et al., 2013). These channels could potentially regulate calcium
influx in neurons in response to touch (Bhattacharya et al., 2008).
1.2 Myogenesis in zebrafish Skeletal muscle development begins with mesodermal cell commitment to the muscle lineage
by the expression of members of the basic helix loop helix family of transcription factors called
Myogenic Regulatory Factors (MRFs). myod and myf5 are the first transcribed MRFs. Loss of
function of myod or myf5 does not affect trunk and tail muscles in the embryo but double
mutants show problems with muscle differentiation, indicating a functional redundancy of
these genes.
The skeletal muscles in zebrafish originate from the paraxial mesoderm, a tissue that
forms in the blastopore during gastrulation and during embryonic axis elongation it is found
in the tail bud (Chal and Pourquié, 2017). At the shield stage, skeletal muscle occupies the
marginal zone as shown by fate mapping-studies and the muscle fiber progenitors occupy
distinct locations within this zone (Devoto et al., 1996; Stickney et al., 2000). Slow muscle
precursors are located close to the shield (future dorsal side) and fast muscle precursors
around the margin, farther away (ventral side). These precursor cells then undergo defined
movements such as involution, convergence and extension to arrange themselves in the
segmental plate by the end of gastrulation (Ochi and Westerfield, 2007). The slow muscles
differentiate earlier from a subset of cells which express myod and are located medially, close
to the notochord (Figure 6A). These cells are called adaxial cells (epithelial like cells). These
cells upon somite segmentation differentiate and elongate to form slow muscle fibers which
Figure 5. Larval response to types of stimulation. (A) Schematic view of RB neuron morphology. Cell bodies of RB neurons are dorsally located in the spinal cord and are arranged in two longitudinal columns. They exhibit two types of ipsilateral axons, central and peripheral, differing in their morphology. Central axons bifurcate and extend their branches in rostral and caudal directions whereas, peripheral axons are highly branched and innervate epidermis. (B´) Turning response of zebrafish larvae upon photo stimulation of a single RB neuron. Single neuron stimulation causes ipsilateral turning whereas (B´´) photostimulation of peripheral arbors (multicell or touch evoked) causes contralateral turning of the larvae. Figure adopted and modified from Umeda et al. 2016.

10
migrate radially to the surface of the myotome, forming a monolayer (Daggett et al., 2007) as
shown in Figure 6B, C. These fibers are known as mononucleated superficial slow fibers (SSFs).
Figure 6. Somitic cell differentiation and migration. Schematic representation of distinct localization of muscle precursor cells. (A) Transverse view of the arrangement of precursor cells at the end of gastrulation, red indicates the precursors of slow muscle cells (adaxial cells) and muscle pioneer cells; arranged around the presumptive notochord (Noto) in the center and surrounded by peripherally located fast muscle precursors in green. (B) During segmentation, adaxial cells differentiate along the dorso-ventral axis to form slow muscle cells (red), (C) Lateral migration of most of the slow twitch fibers forms a superficial layer of slow muscle fibers (SSFs in red). Some of the remaining, centrally localized adaxial cells form muscle pioneer cells (MPs in blue-red). At the same time, lateral somitic cells differentiate and fuse to form fast muscle fibers (green). The external cell layer (ECL in orange) appears in late segmentation stages. Figure modified from Yin et al. 2018 and Ochi and Westerfield, 2007.

11
The majority of the differentiating cells migrate but a small number remain medially
localized at the horizontal myosepta, close to the notochord and are called the muscle pioneer
cells (MPs) or satellite cells. At the same time another wave of FGF8-driven myod expression
differentiates the more laterally placed somitic cells into a multinucleated array of syncytial
fast muscle fibers (green) and to an external cell layer (ECL) (yellow in Figure 6C) (Stellabotte
et al., 2007). ECL is equivalent to dermomyotome. By 24 hpf, chevron-shaped blocks of muscle
are clearly visible in the embryos. In zebrafish, the spatio-temporal specification and
localization along the medial-lateral axis (ML) is under the influence of sonic hedgehog (SHH)
(Blagden et al., 1997; Wolff et al., 2003) whereas, along the dorso-ventral (DV) and anterior-
posterior (AP) axis, inputs are given by bone morphogenetic protein (BMP) and fibroblast
growth factor (FGF) respectively (Maurya et al., 2012; Nguyen-Chi et al., 2012).
1.3 Understanding gene function
1.3.1 Forward genetics: from phenotype to genotype:
Forward genetics is an unbiased approach towards understanding the genetic basis of a
particular disease by identifying genes essential in a defined biological process. The inventory
of genes known to be expressed in skeletal muscles does not provide a complete
understanding of genetics underlying the muscular function or complex phenotypes seen in
humans, suggesting a need for identifying novel players. Forward genetic approaches were
carried out to get fundamental insights about vertebrate development utilizing zebrafish as a
model system (Driever et al., 1996; Mullins et al., 1994a). Mutagenizing the whole genome
randomly is an exhaustive approach to identify genes involved in development as several
mutations are generated depending on the number and size of genes. In this approach
screening of the population of animals that accommodate random modifications throughout
the genome is performed. The modifications which alter the gene functions of interest are
expected to exhibit a particular phenotype (Lawson and Wolfe, 2011). Carriers of modified
alleles are then identified by subsequent examination of their progeny. Once an abnormal
phenotype is seen, the mutated gene can be detected by linkage mapping of the allele within
the genome, revealing genes that correlate with the observed biological process (Lawson and
Wolfe, 2011; Mullins et al., 1994b; Solnica-Krezel et al., 1994).
Mutagenesis approaches
In order to create mutagenic lesions various physical agents like X-rays or gamma rays can be
employed (Chakrabarti et al., 1983; Gridley et al., 1987). For insertional mutagenesis
approaches both DNA and retroviruses have been successfully used. (Gridley et al., 1987; Ting
et al., 1992). The exogenous DNA sequence can serve as a mutagen and also as a tag for

12
cloning the mutated gene upon integration into the genome. However, these techniques are
inefficient and generate large deletions, translocations or chromosomal aberrations which
make it challenging to accurately pinpoint the gene responsible for a mutant phenotype
(Lawson and Wolfe, 2011). Research over several years in this field found out that chemical
mutagens such as alkylating agents are far more efficient than other techniques. One of the
favored mutagens, N-ethyl-N-nitrosourea (ENU), can achieve high mutagenic loads in
zebrafish germ cells, where the induced phenotypes can be linked to lesions in one gene
(Mullins et al., 1994b). It creates DNA adducts by ethylating oxygen or nitrogen atoms in DNA
bases, which upon DNA replication results in errors (Noveroske et al., 2000). The mutation, a
single nucleotide base change, is induced prior to meiosis and is fixed by DNA replication
before developing into mature sperm cells. This reduces chances of mosaicism in the next
generation. ENU can therefore result in nonsense mutations, splice variants and missense
mutations. In zebrafish, adult males are subjected to mutagenesis by simply bathing the fish
in ENU solution (Mullins et al., 1994a; Solnica-Krezel et al., 1994). To eliminate affected post-
meiotic germ cells, several treatments at weekly intervals followed by a waiting period is
adopted. Since there are many mutations generated in adult males, they are bred to
homozygosity in F3 generations where mutations are segregated and interesting phenotypes
can be screened. The genes associated with the observed phenotype are revealed by
subsequent mapping of the responsible loci to chromosomal locations. The first large scale
genetic screens in zebrafish were carried out in Boston and Tübingen where identification of
the embryonic phenotypes was done in the F3 generations.
1.3.2 Reverse genetics: from genotype to phenotype:
Human disease modelling gives more insights about the mechanism and paves a way for drug
discovery. Zebrafish has become an impressive model to investigate such questions and also
for studying vertebrate development since 70% of human genes have orthologues in the fish.
Following genome sequencing, most of the transcripts of protein-coding genes and non-
coding genes within zebrafish genomes were annotated. Knowledge of the gene sequence
made genetic manipulations much more specific since specific mutations can be made to
evaluate the function of the gene. This kind of gene manipulation approach is called reverse
genetics. A comprehensive collection of reverse genetics tools has been developed to study
gene function in zebrafish.
Tools for genetic modifications
Morpholinos
One of the best-established and until recently, most widely used approaches is to knockdown
the target gene expression post-transcriptionally by the use of antisense morpholino
oligonucleotide analogs (morpholinos or MOs) which are artificially synthesized. They contain
13
morpholine rings as a replacement to the ribose backbone of nucleic acids which makes them
resistant to nuclease digestion and also increases their binding to complementary RNA
sequences (Summerton, 1999; Summerton and Weller, 1997). MOs exerts their effects either
by attenuating protein translation or by disrupting RNA splicing. To study early development,
MOs are directly injected into zebrafish one celled stage embryos. Other delivery methods like
electroporation and injection into yolk have also been done (Amack and Yost, 2004; Thummel
et al., 2006). Morpholinos labelled with fluorescein have been used to examine targeted
inhibition and even photo-MOs which are under UV control have been used for localized
conditional knock-downs (Hyde et al., 2012; Shestopalov et al., 2012; Tallafuss et al., 2012).
Injected embryos are then analyzed for a phenotype and the effect is detectable up to five
days after injection (Eisen and Smith, 2008; Yen et al., 2006). Although MOs are very
convenient tools they also have some limitations. The phenocopy by MOs is non-heritable,
with continuous cell divisions during development resulting in gradual dilution of MOs,
activation of the p53 pathway leading to non-specific phenotypes, and `pseudo-phenotypes´
due to off-target effects being a few of the major limitations of this tool. Additionally, there is
the possibility of incomplete gene silencing and the requirement for highly elaborate testing
of the knock-down efficiency for each morpholino. Continuous efforts to develop better
alternatives have resulted in the use of programmable nucleases like zinc finger nucleases
(ZFNs), transcription activator-like nucleases (TALENs) and recently, the CRISPR/Cas9 system.
ZFNs
ZFNs were the first successful example of a nucleases that can be used to create target specific
DNA double strand breaks (Doyon et al., 2008; Urnov et al., 2010). ZFN is a chimeric protein,
engineered synthetically by combining a series of Cys2His2 zinc-finger DNA binding domains
called a zinc finger array (ZFA) with the cleavage domain derived from FokI (a bacterial non-
specific endonuclease). Each zinc finger with its alpha helix domain, recognizes and binds to a
3 bp DNA sequence which is specific and each ZFA usually contains three to six zinc finger
motifs, recognizing a 9-18 bp target DNA sequence (Liu et al., 1997). Since FokI requires
dimerization to be fully functional, ZFNs function in pairs with specificity to opposing DNA
strands. They induce double strand breaks (DSBs) at the targeted locus which are repaired
through error prone non-homologous end joining (NHEJ) generating small insertions and
deletions in the genome. ZFNs can also induce large deletions when used together at a distant
location in order to generate two DSBs to delete region in between (Lee et al., 2010). With all
the other qualities of this tool, selection of efficient and specific ZFNs remains a challenge,
limiting its broad application. The complexity of assembling zinc fingers for target specificity
and need for laborious optimization made it less efficient. Commercially available screening
and assembly was very expensive. Furthermore, unexpected cleavage effects have been
shown to take place in a considerable frequency.
14
TALENs
Another promising reverse genetic tool for introducing targeted cleavage, TALENs were
introduced in 2011. Transcription activator like effector proteins (TALEs) are derived from
plant pathogenic bacteria called Xanthomonas. They contain a DNA-binding domain which is
composed of several tandem repeat units, each responsible for recognize and binding to a
single nucleotide in the target site (Boch et al., 2009; Moscou and Bogdanove, 2009).
Classically, TALE repeat units contain 34 amino acid residues containing a repeat variable di-
residue (RVD) at the 12th and 13th position, determining the specificity of the repeat unit.
Compared to zinc finger proteins the principle and development of TALENs is simpler, making
it an alternative promising tool. Golden Gate cloning strategy is the most widely used method
employed to construct TALENs (Cermak et al., 2011). In this method multiple DNA fragments
are assembled in a single reaction. More recent advancements brought forward much more
faster, cost effective and high-throughput methods like the fast ligation-based automatable
solid-phase high-throughput platform (FLASH), iterative capped assembly (ICA) and ligation-
independent cloning (LIC) for TALE repeat assembling (Briggs et al., 2012; Reyon et al., 2012;
Schmid-Burgk et al., 2013).
CRISPR/Cas9
It is now possible to target multiple genes in a highly efficient manner with a transformative
CRISPR/Cas9 approach (Gagnon et al., 2014; Varshney et al., 2015a). The zebrafish genome
being duplicated, targeting both of the paralogs to avoid functional redundancy is possible by
this technique (Jao et al., 2013). This approach of genome editing is not only being used to
generate knockouts but also for other purposes like allelic repair, epigenomic modulations, in
vivo chromatic imaging and lineage tracings (Demarest and Brooks-Kayal, 2018; Li et al., 2016;
Varshney et al., 2015b). Clustered Regularly Interspaced Short Palindromic repeats (CRISPR)
are DNA stretches found in the genome of bacteria and other microorganisms. These
innocuous sequences are a crucial part of their immune system. This tool has been adopted
from the observation of the adaptive defense mechanism in bacteria and archaea against
bacteriophages. They integrate snippets of foreign nucleic acids called spacers in their genome
(Barrangou et al., 2007) which form a CRISPR array, holding the memory of the former
invaders. If the invader attacks again, the bacteria produce RNA segments from these arrays
to target the invaders’ DNA. Since bacteria also have an endonuclease, Cas9, it cuts the DNA
of the invader apart, disabling the prey. The Cas9 recognizes a sequence in CRISPR which is
called the protospacer adjacent motif (PAM). This motif guides the Cas9 after a double strand
is formed.
A ground breaking application of this mechanism for targeted mutation was in
zebrafish, where CRISPR RNA is guided to the target site resulting in a double-strand break
(DSB) by Cas9 endonuclease (Hwang et al., 2013). For genome editing purposes a CRISPR is
simulated by generating a small guide RNA (20-22 bp) generated synthetically, specific to the
target (Cong et al., 2013; Mali et al., 2013). This customized single guide RNA (sgRNA)
recapitulates the function of CRISPR RNA. This RNA, being complementary to the DNA target
when injected along with Cas9 protein causes DSBs and an error prone repair creates indels
15
which interferes with the function of the gene. Synthesizing single guide RNA (sgRNA) by
annealing two oligonucleotides, serving as templates for in vitro transcription made the
process cost effective, easy and rapid (Gagnon et al., 2014). The high target efficiency and
germ line transmission made it one of the best techniques known so far. In the last few years,
the technique has been employed for many model systems and targeted mutagenesis has
enabled screening of large-number of genes. Several candidate genes have been associated
with diseases and many disease models have come forth.
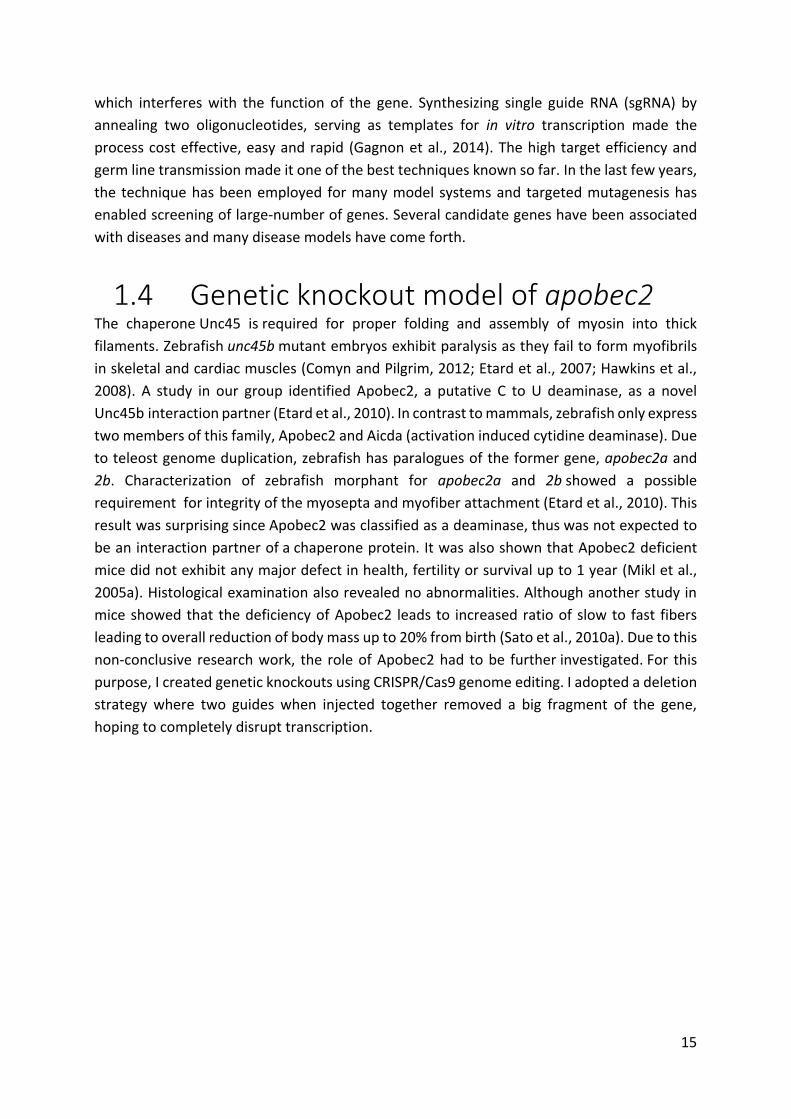
1.4 Genetic knockout model of apobec2 The chaperone Unc45 is required for proper folding and assembly of myosin into thick
filaments. Zebrafish unc45b mutant embryos exhibit paralysis as they fail to form myofibrils
in skeletal and cardiac muscles (Comyn and Pilgrim, 2012; Etard et al., 2007; Hawkins et al.,
2008). A study in our group identified Apobec2, a putative C to U deaminase, as a novel
Unc45b interaction partner (Etard et al., 2010). In contrast to mammals, zebrafish only express
two members of this family, Apobec2 and Aicda (activation induced cytidine deaminase). Due
to teleost genome duplication, zebrafish has paralogues of the former gene, apobec2a and
2b. Characterization of zebrafish morphant for apobec2a and 2b showed a possible
requirement for integrity of the myosepta and myofiber attachment (Etard et al., 2010). This
result was surprising since Apobec2 was classified as a deaminase, thus was not expected to
be an interaction partner of a chaperone protein. It was also shown that Apobec2 deficient
mice did not exhibit any major defect in health, fertility or survival up to 1 year (Mikl et al.,
2005a). Histological examination also revealed no abnormalities. Although another study in
mice showed that the deficiency of Apobec2 leads to increased ratio of slow to fast fibers
leading to overall reduction of body mass up to 20% from birth (Sato et al., 2010a). Due to this
non-conclusive research work, the role of Apobec2 had to be further investigated. For this
purpose, I created genetic knockouts using CRISPR/Cas9 genome editing. I adopted a deletion
strategy where two guides when injected together removed a big fragment of the gene,
hoping to completely disrupt transcription.

16
1.5 Aim of this thesis Skeletal muscles represent the largest tissue mass of the body and their development as well
as function is a precondition for an active lifestyle. Any skeletal muscle disorder thus hinders
basic chores of life. An acute need to better understand muscle disease pathology and the
developmental basis of skeletal muscle formation is important for selecting the proper
treatment strategies for patients.
To study the critical players for muscle development, zebrafish has long been used as
a model organism. Previous studies in our research group found putative RNA editing proteins,
Apobec2a/2b both being exorbitantly expressed in skeletal muscles and knock-down of the
paralogues leading to muscular dystrophy. This indicated that they play a role in maintaining
muscle integrity. The molecular role of this gene was yet to be elucidated and therefore, the
first aim of my thesis was to create a genetic knockout model. With the commencement of a
cleaner and targeted approach like CRISPR/Cas9, the project was based on employing this
technique to knock out both the paralogues and establish stable lines in order to analyze single
as well as double knockout lines.
In the quest of finding novel genes to better understand muscle development, another
approach was used where existing mobility mutants from Tübingen screens were selected for
the study. During the time of this large-scale mutagenesis screen, thousands of mutants were
generated but were not characterized. These lines were brought to EZRC and stored as
precious frozen sperm stocks. We chose to investigate samples from these stocks. The major
tasks were to retrieve the lines from these frozen sperm samples, assess their phenotypes and
most importantly to explore whether this type of analysis is a good approach to find novel
genes. An additional aim was to discover the causal mutations by genome sequencing.

17
2 Material and
Methods
2.1 Materials
Bacterial Strains
Cloning was done using competent cells, i.e., E. coli strains: XL1-blue obtained from Promega
or TOP10 from Thermo fisher. Bacteria were grown in 100 ml LB medium overnight shaking at
37°C. The next day 100 ml LB medium was inoculated with about 10 ml of the bacterial culture.
Cells were then grown until they reached an OD600 between 0.48 and 0.6. In this exponential
growth phase cells were centrifuged for 10 minutes at 3,200 x g at 4°C. Afterwards
supernatant was discarded and pellet was resuspended in TFB1. The suspension was then
incubated for 1 hour on ice and centrifuged at 4,000 for 10 minutes at 4°C. This pellet was
finally resuspended in TFB2. Aliquots of ~50 µl were snap frozen in liquid nitrogen and stored
at -80°C.
Oligonucleotides
Oligonucleotides used in the experiments were designed using Primer3 web version 4.1.0
software and ordered from Metabion International AG in soluble form at 100 M
concentration which were diluted in a ratio of 1:10 for a PCR reaction.
Table 1. Oligonucleotides and Crispr guide sequences used in this project
Name Sequence Usage
Apobec2a gene
apobec2a_sgRNA_
Ex1
taatacgactcactataGGAGAAAAGCCCAACAGAAGgttttaga
gctagaaa
Guide were used in
combinations:

18
apobec2a_sgRNA_i
nt1
taatacgactcactataGGCGCACTGGTGATAGGGTGgttttaga
gctagaaa
-Ex1+Int
-Int+Ex2
-Ex1+Ex2 apobec2a_sgRNA_
Ex2
taatacgactcactataGTCGCGGCTGTTCGAGTGGGgttttaga
gctagaaa
apobec2a_ex1fw GTGTTTAGTTTCAGAGATGGCCGAT Used to genotype:
amplifies the
leftover sequence
(320 bp) after
deleting part of Ex1
and intron
apobec2a_intrv CATAGATTGGGTCTTTCCCGAGG
apobec2a_int5' AGGAGCCGTAATGCTACCGCT Used to genotype:
amplifies the
leftover sequence
(330 bp) after
deleting part of Ex2
and intron
apobec2a_ex2rv CAGGGTGTGAACTGCTGTTCG
apobec2a_ex1fw +
apobec2a_ex2rv
Used to genotype: amplifies the leftover sequence (250 bp) after using Ex1 to
Ex2 guides together deleting almost the whole gene sequence
apobec2a_intana_f
w
CCAACATTAGTCCCGCCCTA Used to
differentiate
homozygous to
heterozygous fish.
500 bp fragment
amplified only in
heterozygous or
wild type cases.
apobec2a_intana_r
v
GTGTGTGTGTGTTTCCCGAA
Apobec2b gene
apobec2b_sgRNA_
Ex1
taatacgactcactataAGAGATGCCTCAAGGGAATGgttttaga
gctagaaa
Guide were used in
combinations:
-Ex1+Int
-Int+Ex2
-Ex1+Ex2
apobec2b_sgRNA_i
nt1
taatacgactcactataGTTCAGCTAGCACATGGGTGgttttagag
ctagaaa
apobec2b_sgRNA_
Ex2
taatacgactcactataGGCGTTCGTGGTTACCTGGgttttagagc
tagaaa
apobec2b_ex1fw TGGCAGACAAAAAGGACAGC Used to genotype:
amplifies the
leftover sequence
(497 bp) after
deleting part of Ex1
and intron
apobec2b_intrv CAACTTACCCAGACTGCAAATCTG
apobec2b_int5' AGTCCCATCCAGACCTGCA Used to genotype:
amplifies the
leftover sequence apobec2b_ex2rv GCTTTCAAGATCTCCACAAGC
19
(325 bp) after
deleting part of Ex2
and intron
apobec2b_ex1fw +
apobec2b_ex2rv
Used to genotype: amplifies the leftover sequence (360 bp) after using Ex1
and Ex2 guides together deleting almost the whole gene.
apobec2b_intana_f
w
ACAGCTCAGTACTTGGACCA Used to
differentiate
homozygous to
heterozygous fish.
670 bp fragment
amplified only in
heterozygous or
wild type cases.
apobec2b_intana_r
v
GGACCAAATGAACCGAACCA
ChaT gene
Primerbajan_fw CAAAAGGCCAATTGGGTAAG To check for bajan
allele
Primerbajan_rv
CCTTGCTGTTTCTCTAGACTCTCA
Chat-ageI5’
CTGGACCGGTCCGATGCCAGTTTCAAAAAGGGAAC
To amplify chat in
fragments in
combination with
chat_rvpaper
Chat_fwpaper
TCTTCAACTTTGAGGATGCCAGTTTC To amplify chat in
fragments
Chat_rvpaper
TCCTGCGTCTTATGACTTGCTTCC
Chat_EcoRI5’
CTGGGAATTCCCGATGCCAGTTTCAAAAAGGGAAC
To amplify chat in
fragments also in
combination with
chat_rvpaper
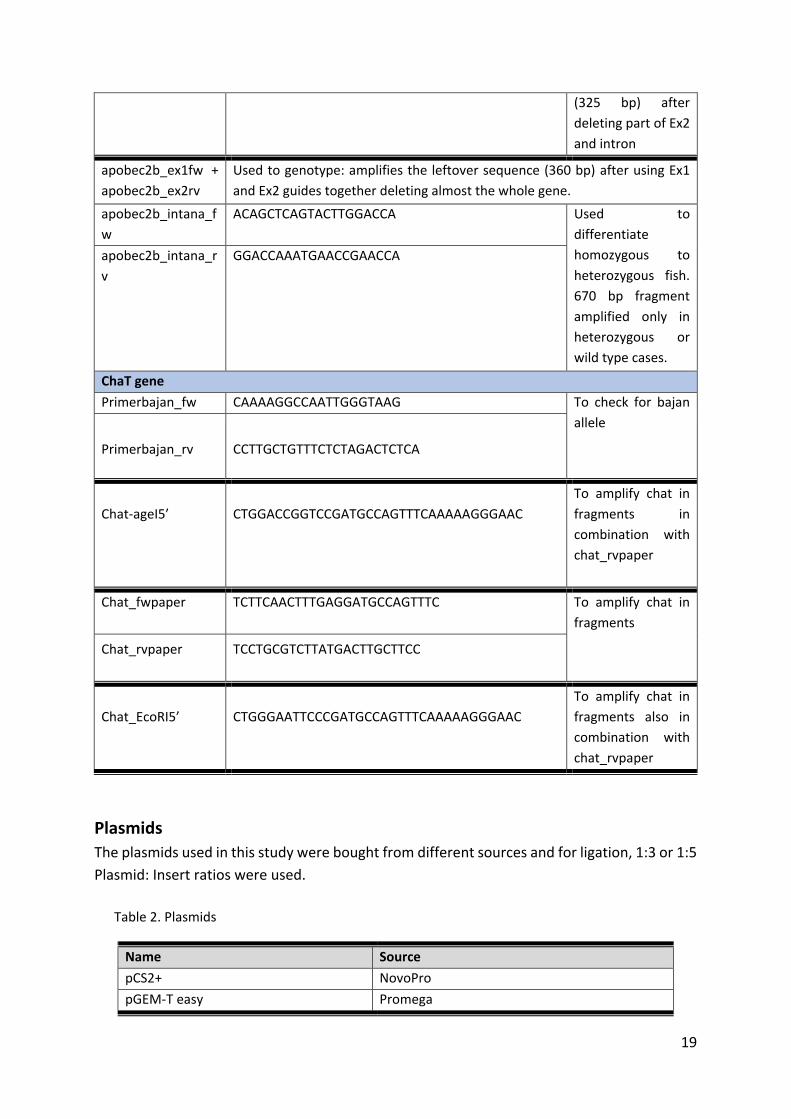
Plasmids
The plasmids used in this study were bought from different sources and for ligation, 1:3 or 1:5
Plasmid: Insert ratios were used.
Table 2. Plasmids
Name Source
pCS2+ NovoPro
pGEM-T easy Promega
20
TOPO vector Invitrogen
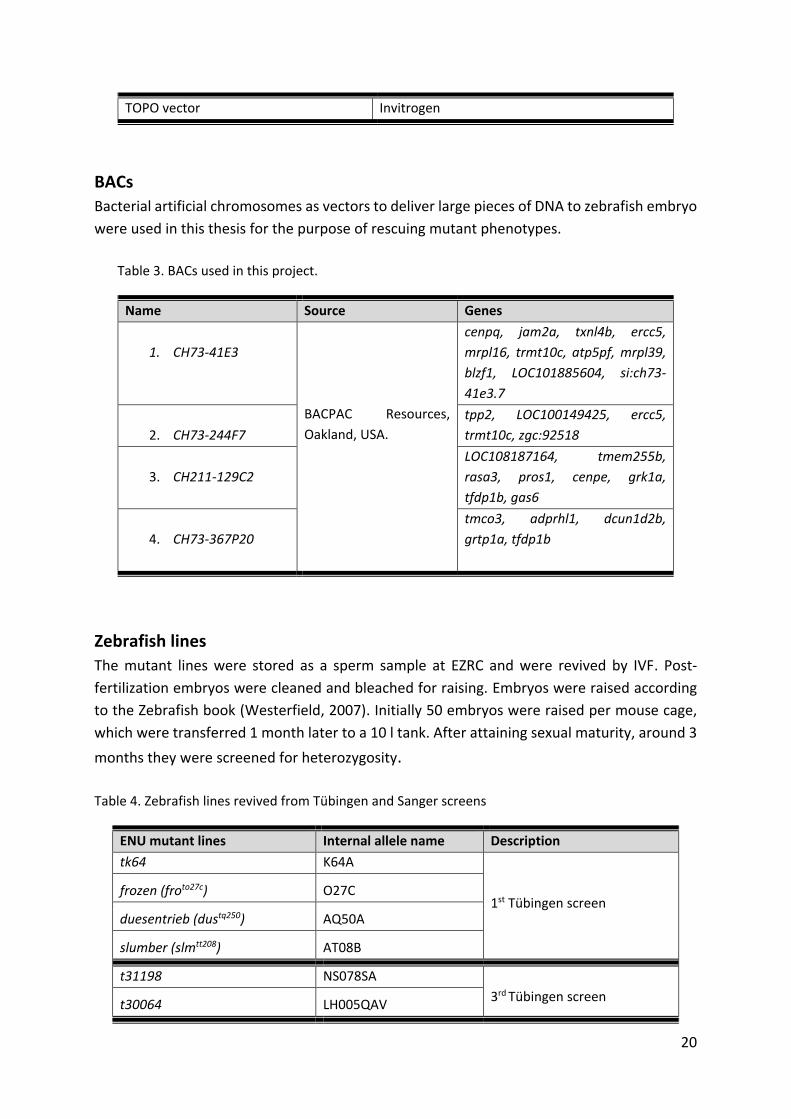
BACs
Bacterial artificial chromosomes as vectors to deliver large pieces of DNA to zebrafish embryo
were used in this thesis for the purpose of rescuing mutant phenotypes.
Table 3. BACs used in this project.
Name Source Genes
1. CH73-41E3
BACPAC Resources,
Oakland, USA.
cenpq, jam2a, txnl4b, ercc5,
mrpl16, trmt10c, atp5pf, mrpl39,
blzf1, LOC101885604, si:ch73-
41e3.7
2. CH73-244F7
tpp2, LOC100149425, ercc5,
trmt10c, zgc:92518
3. CH211-129C2
LOC108187164, tmem255b,
rasa3, pros1, cenpe, grk1a,
tfdp1b, gas6
4. CH73-367P20
tmco3, adprhl1, dcun1d2b,
grtp1a, tfdp1b
Zebrafish lines
The mutant lines were stored as a sperm sample at EZRC and were revived by IVF. Post-
fertilization embryos were cleaned and bleached for raising. Embryos were raised according
to the Zebrafish book (Westerfield, 2007). Initially 50 embryos were raised per mouse cage,
which were transferred 1 month later to a 10 l tank. After attaining sexual maturity, around 3
months they were screened for heterozygosity.
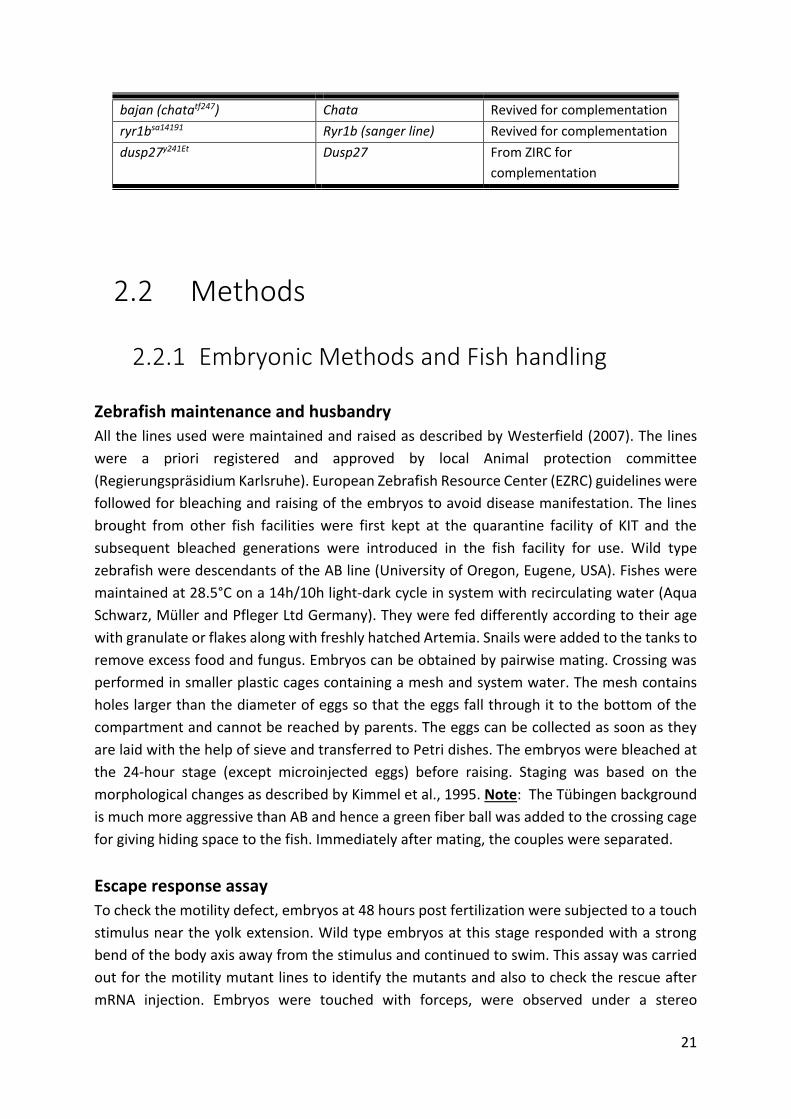
Table 4. Zebrafish lines revived from Tübingen and Sanger screens
ENU mutant lines Internal allele name Description
tk64 K64A
1st Tübingen screen
frozen (froto27c) O27C
duesentrieb (dustq250) AQ50A
slumber (slmtt208) AT08B
t31198 NS078SA
3rd Tübingen screen t30064 LH005QAV
21
bajan (chatatf247) Chata Revived for complementation
ryr1bsa14191 Ryr1b (sanger line) Revived for complementation
dusp27y241Et Dusp27 From ZIRC for
complementation
2.2 Methods
2.2.1 Embryonic Methods and Fish handling
Zebrafish maintenance and husbandry
All the lines used were maintained and raised as described by Westerfield (2007). The lines
were a priori registered and approved by local Animal protection committee
(Regierungspräsidium Karlsruhe). European Zebrafish Resource Center (EZRC) guidelines were
followed for bleaching and raising of the embryos to avoid disease manifestation. The lines
brought from other fish facilities were first kept at the quarantine facility of KIT and the
subsequent bleached generations were introduced in the fish facility for use. Wild type
zebrafish were descendants of the AB line (University of Oregon, Eugene, USA). Fishes were
maintained at 28.5°C on a 14h/10h light-dark cycle in system with recirculating water (Aqua
Schwarz, Müller and Pfleger Ltd Germany). They were fed differently according to their age
with granulate or flakes along with freshly hatched Artemia. Snails were added to the tanks to
remove excess food and fungus. Embryos can be obtained by pairwise mating. Crossing was
performed in smaller plastic cages containing a mesh and system water. The mesh contains
holes larger than the diameter of eggs so that the eggs fall through it to the bottom of the
compartment and cannot be reached by parents. The eggs can be collected as soon as they
are laid with the help of sieve and transferred to Petri dishes. The embryos were bleached at
the 24-hour stage (except microinjected eggs) before raising. Staging was based on the
morphological changes as described by Kimmel et al., 1995. Note: The Tübingen background
is much more aggressive than AB and hence a green fiber ball was added to the crossing cage
for giving hiding space to the fish. Immediately after mating, the couples were separated.
Escape response assay
To check the motility defect, embryos at 48 hours post fertilization were subjected to a touch
stimulus near the yolk extension. Wild type embryos at this stage responded with a strong
bend of the body axis away from the stimulus and continued to swim. This assay was carried
out for the motility mutant lines to identify the mutants and also to check the rescue after
mRNA injection. Embryos were touched with forceps, were observed under a stereo

22
microscope and around 25% of the off-springs of heterozygous couples showed either
diminished or complete loss of motility.
Birefringence assay
This assay was used to assess muscle integrity of the embryos and is well explained by Berger
et al., 2012. Since muscle is an organized structure containing an anisotropic (A-) band, they
shine when a bright, plane polarized light is passed through them. Defects in organization of
sarcomeric repeats are read out in the form of reduced brightness.
Microinjection of zebrafish embryos
Microinjections were performed using a gas-driven microinjector system (Tritech) and a
SMZ645 Nikon stereomicroscope on a Petri dish with the help of needles. They were
performed as described by Müller et al., 1999. The microinjection needles were prepared from
borosilicate glass capillaries with filament which were heated and pulled to form needles by
Flaming-Brown needle puller. As per the experimental setup, the needles were filled with 1-5
l injection solution containing 0.1% phenol red (tracemarker) using Eppendorf microloader
pipette tips. The eggs were collected shortly after being laid and about 2-6 nl injection solution
was injected through the chorion either into the cell itself or closer to the cell into the yolk at
one-cell stage. After the injection, the embryos were transferred to a Petri dish with embryo
water and incubated at 28°C. The injection mix depends on the experimental setup, can be
DNA/RNA or both co-injected into the embryos. For gene knockout studies, about 120 ng/l
of each guide RNA along with 300 ng/l of Cas9 protein was used as an injection mix. For BAC
injection, about 30-50 ng/l was used and for gene knockdown studies, morpholino (Gene
Tools, LLC) at 0.2 mM concentration was injected.
In vitro fertilization
Mutant lines from ENU screens were kept in the form of frozen sperm stocks at EZRC. The
chosen lines were then revived by in vitro fertilization (IVF) with AB strain wild type embryos.
For IVF, wild type female fish were anaesthetized using tricaine solution and rinsed with PBS.
The female fish was then dried with a paper towel (any excess water could activate the eggs).
The female fish was then transferred to a 6 cm diameter glass dish. A gentle pressure was
applied to the ventral side of the fish with moist hands to release the eggs slowly into the Petri
dish. Good eggs were yellowish, translucent and granular looking while whitish, watery and
cloudy eggs are bad. The sperms stored in cryovials were then removed from liquid nitrogen
and transferred to a 34°C water bath. The tube was immediately filled up with 500 l of BSMIS
preheated to 37°C. After gentle stirring with the pipette the sperms were quickly activated by
adding 500 l fructose solution and mixed by pipetting up and down once. This activated
sperm solution was then immediately transferred to eggs. The Petri dish was kept stationary
for about 30 seconds. The motility of sperm was checked under the microscope for another
40 seconds. As soon as the motility of sperm diminished, the dish was filled with water and
23
incubated at 28°C for about 3 hours before checking the fertility rate. The fertilized eggs were
then raised as described by Westerfield (2007).
Identification of heterozygous carriers
Heterozygous carriers of the mutant allele were identified by performing random brother-
sister mating. The offspring of these couples were then screened for the expected phenotype
(reduced motility, curved axis or reduced birefringence). Once a batch of mutant offspring was
identified, the couples were marked as heterozygous mutants and were crossed with the AB
wild type strain to get rid of any background mutations. The subsequent generation was then
screened again for heterozygous fishes by performing random incrosses.
2.2.2 Histological methods
Immunohistochemistry
Fixation of embryos
For immunohistochemistry and also for in situ hybridization, the embryos were dechorionated
and given time to straighten up since mutants are curved and show a motility defect. About 3
hours post dechorionation, embryos were transferred to a tube and anaesthetized before
exchanging fish water with freshly thawed BT-fix. For in situ experiments overnight fixation at
4°C was done whereas for immunohistochemistry, embryos were fixed for 1 hour at RT. The
immunostaining protocol is well described by a recent method paper (Santos et al., 2018).
Immunostaining protocol
After fixation, BT-Fix was removed and embryos were washed 4 times in the interval of 5
minutes with 1x PTW (0.1% Tween-20 in 1X PBS) to remove the fixative completely. Post
washing, to enhance the penetration cold acetone was added to the embryos and incubated
at –20°C for exactly 7 minutes. Acetone was removed and the embryos were then washed
thrice in 10-minute interval with 1X PTW. The embryos were then blocked by incubating in
BDP (1% BSA, 1% DMSO in 1X PBS) solution for about 4 hours at RT. Blocking was followed by
transferring the embryos in primary antibody solution, pre-diluted with blocking buffer.
Embryos were incubated overnight at 4°C. On day 2, the antibodies could be collected for
reuse and the embryos were washed 6 times with 1X PTW followed by blocking for about 30
minutes at RT. Post-blocking, prediluted secondary antibodies were added and incubated at
RT for about 2 hours in dark. Embryos were then washed 4 times with 1X PTW at 10-minute
interval. At this stage DRAQ5 diluted in 1X PBS (nuclear staining) was added in a few cases for
about 10 minutes. At the end, embryos were washed a few times with 1X PBS before imaging.
Whole mount in situ hybridization (WISH)
This procedure was performed as described by Oxtoby and Jowett, 1993. For this thesis,
particularly used to visualize expression in developing trunk and tail muscles at around 24 hpf.
24
Synthesis and labelling of DIG RNA probes
Templates for DIG-labelled RNA-probe synthesis were linearized plasmid DNA. About 1 µg of
linearized plasmid was added to a 20 µl reaction in water containing 4 µl 5X transcription
buffer, 1.5 µl T7/T3/Sp6 RNA polymerase and incubated for 2-3 hours at 37°C. After
incubation, the synthesized RNA probe was diluted with 10 µl RNAse free water and to this
3.75 µl 2 M NaOAc (pH4), 65 µl 100% ethanol was added for precipitating the RNA. It was then
incubated at -80°C for 30 minutes. After incubation, the solution was centrifuged at 4°C for 30
minutes and the supernatant was discarded. The RNA pellet was seen at the bottom of the
tube and was washed once with 70% ethanol by centrifuging for 5 minutes at 4°C. The
supernatant was completely removed and the pellet was air dried at RT for about 10 minutes.
Resuspension of the RNA was done in 11 µl of RNase free water. To check the quality of the
RNA, 1 µl of RNA was loaded onto a 1% agarose gel. The concentration of RNA was assessed
using a spectro-photometer, 10 µl of HYB buffer was added and it was stored at –20°C.
In situ protocol
Overnight fixed embryos were washed 3 times with 1XPTW and incubated overnight in 100%
methanol (samples were stored in methanol until processed further). All the hybridisation
steps were carried out in 0.5 ml Eppendorf tubes. Embryos were re-hydrated by sequential
transfer from 100% to 75%, 50%, 25% methanol solutions. Subsequently the embryos were
washed 4 times in the interval of 5 minutes with 1X PTW and digested with Proteinase K
depending on the stage of the embryos. After digestion, proteinase K was removed and the
embryos were washed thrice in the interval of 5 minutes with PTW. After washing, the
embryos were incubated in HYB buffer for 2-3 hours followed by overnight incubation with
the DIG labelled RNA probe diluted in preheated HYB buffer (1:300 or 1:400) at 65-70°C.
Washing buffers were incubated along overnight with the embryos. After overnight
incubation, embryos were washed twice with wash buffer 1 in a 30 minutes interval, once
with wash buffer 2 for 15 minutes, twice with wash buffer 3 in a 30 minutes interval and at
the end once with wash buffer 4 for 15 minutes to remove unhybridized probe completely.
All the washing steps were done at 65-70°C. After washing, the rest of the steps were done at
RT. Embryos were washed once with the blocking buffer for 15 minutes followed by an
overnight incubation at 4°C in anti-DIG antibody diluted in blocking buffer (1:4000). On the
third day, the antibody solution was removed and the embryos were washed 5 times in a 15
minutes interval with PTW, once with staining buffer for 5 minutes. The embryos were then
transferred to a 24-well plate carefully and washed once with staining buffer again. For
staining, the substrates BCIP (0.5 mg/ml final concentration) and NBT (0.188 mg/ml final
concentration) were mixed in staining buffer and 500 μl of this solution was added per well.
Staining was carried out in the dark to avoid background staining and was stopped through
repeated washes with PTW. The background staining was removed by washing with 100%
ethanol for about 10-15 minutes followed by washing with PTW several times for re-hydrating
the embryos before imaging (This step makes the staining blue and the embryos get curved).
25
TEM sample preparation
Mutants and wild-type like siblings at 3 days post fertilization were collected, anaesthetized
in tricaine solution followed by fixation in 500 µl Karnovski fixative solution at 4°C. Post
fixation, the samples were washed twice at 10 minutes interval with 0.1 M PIPES, re-fixed with
500 μL OsO4/K3[Fe(CN)6] solution on ice for 1 hour, washed twice for 15 minutes with 0,1 M
PIPES and finally twice for 15 minutes with ddH2O. Tissue contrasting was achieved through
overnight incubation in 2% uranyl acetate in 25% EtOH/75% ddH2O at 4°C.
Epon embedding
Samples were dehydrated by successive washing steps with increasing concentration of
ethanol (twice, 10 minutes with 50% ethanol → twice, 10 minutes with 70% ethanol → twice,
10 minutes with 95% ethanol → 4 times, 15 minutes with anhydrous ethanol). Following
complete dehydration, the embryos were washed twice for 5 minutes in dried 1,2-propylene
oxide (PO). The glycid ether 100 - epoxy resin (EPON) was stored at – 20°C to avoid
polymerization and was kept at room temperature before use. EPON was also added to the
embryos in increasing concentration (60 minutes in 33% EPON in PO → 60 minutes in 66%
EPON in PO → 30 minutes in 100% EPON and final incubation for 10 minutes in 100% EPON).
To embed the samples, rubber moulds were used which were first half-filled with EPON with
labels and incubated at 65°C for 2 hours for polymerization. This is usually done so as to be
able to orient the embryos in the middle of the mold. After polymerization, resin-soaked
embryos were transferred into these labeled polymerized beds and positioned transversely.
Post embedding of embryos, an overnight incubation at 65°C was done to completely
polymerize the resin.
Trimming, sectioning and imaging
Polymerized EPON blocks were trimmed with a Leica REICHERT ULTRATRIM before subjecting
them to ultra-sectioning using a Diamond DIATOME knife. For Toluidine blue staining, 350 nm
thick sections were cut with a Leica Ultramicrotome EM UC6 which float over the water
chamber of the knife and collected with a Diatome Perfect Loop section collector, placed on
a glass side. The sections were then stained with a freshly prepared Toluidine Blue O solution
(15 μl filtered Toluidine Blue O (1%), 35 μl 0,1M borate buffer (pH 9,5) and 950 μl ddH2O) for
about 5-7 minutes on a heating block at 80°, washed with ddH2O to remove the dye from the
section and dried again. Post staining, sections were covered with a thin layer of EPON resin
and a glass cover slip, placed on a 80°C heating block overnight for polymerization before
imaging. For TEM, 70 nm thin sections were cut and collected on a palladium-copper grid
precoated with a thin formvar. These grids with the samples were stored on a rubber sample
holder to prevent mechanical or electrostatic damages. Imaging was done with a Zeiss EM 910
Leo, 80kV Transmission electron microscope.
Evans blue dye injection
Evans blue dye is a membrane impermeable dye which was used to check the muscle fiber
integrity in the mutant embryos. The dye powder was dissolved in Ringer’s solution and

26
filtered through a sterile syringe filter. It was then injected into the peri-cardiac sinus of 48
hours old embryos which were previously anaesthetized and embedded in low melting
agarose. After injection the embryos were carved out and incubated until the 72-hour stage
the in dark. Imaging was carried out using a compound microscope. The detailed procedure is
described by Smith et al., 2015.
2.2.3 Molecular biology methods
Genomic DNA extraction (HotSHOT)
For checking the mutational efficiency of the CRISPR guide RNAs prior to raising, genomic DNA
from the injected embryos was extracted using the HotSHOT method previously described in
Etard et al. (2017).
Genotyping the adult fishes
To check and select the genetically modified fishes created via CRISPR guide injection, adult
zebrafish were genotyped by fin biopsy as described by Meeker et al., 2007. Adult fishes were
anaesthetized using tricaine and were laid laterally on a plastic tray. A smasll piece of the tail
fin was then cut using a sharp scalpel. The tail fin-cuts were transferred with forceps into a
tube containing 75 l KOH solution. The fish was then placed into a labelled box in fresh fish
water which allows zebrafish to wake up. The solution containing tail fin cuts were incubated
at 95°C for 20-30 minutes and cooled down to 4°C in a thermocycler. To this, 75 l of
neutralization buffer was added and mixed well using a pipette. About 5 l of this solution
was then used for setting up a 25 l PCR reaction (Table 5).
Genomic DNA extraction for whole genome sequencing
Sample collection
Whole genome sequencing was done to identify the allele responsible for the observed
phenotype in the previously uncharacterized mobility mutant lines we revived from ENU
screens (Table 4). From a heterozygous couple, about 50 mutant embryos (showing a
phenotype, 3 days post fertilization) and 50 phenotypically wild-type siblings were collected
in a tube. The embryos were anaesthetized and the water was removed (as much as possible).
The tube was then rapidly frozen by using liquid nitrogen. The samples were stored at -80°C
until subjected to genomic DNA extraction.
Extraction protocol
To the collected samples, 500 l of extraction buffer without proteinase K was added and
subjected to strong pipetting events so as to completely smash the embryos into the solution.
The supernatant was removed as much as possible (embryos coagulate at the bottom of the
tube so can be simply sucked up and transferred into a new tube using a precut plastic
pipette). To this, 500 µl of extraction buffer with proteinase K (final concentration 1 mg/ml)
was added. This solution was then incubated overnight at 65°C without agitation. Genomic

27
DNA was then extracted by adding 500 µl of phenol: chloroform: isoamylalcohol (25:24:1)
solution and gently shaking it at room temperature (RT) to avoid shearing of genomic DNA.
This solution was then centrifuged for 10 minutes at 13,000 rpm at RT and the supernatant
was transferred to a fresh tube using a precut 1 ml pipette tip. To this, 500 µl of 100% isopropyl
alcohol was added and centrifuged at RT for about 10 minutes at 13,000 rpm. The supernatant
was removed and the obtained pellet was washed with 75% ethanol by centrifuging it for 5
minutes at the same conditions. The supernatant was removed and the pellet was dried at RT
for about 15 minutes. The pellet was resuspended in 100 µl of deionized water for about 10
minutes at 40°C. Genomic DNA was stored at 4°C and was extracted not more than a day
before library preparation. The quality of the extracted DNA was assessed by Nanodrop
(Thermofisher Scientific) and the quantification of the sample was assessed by a Qbit
(Invitrogen) at the sequencing facility here at KIT.
Transformation of bacteria with plasmid DNA (Retransformation)
To get a larger quantity of the plasmid DNA (DNA fragment cloned into a plasmid), chemically
competent bacteria were transformed by adding around 0.6 µl of plasmid solution to a
previously thawed tube containing 100 µl of competent bacteria. After adding the plasmid
solution, bacteria were incubated on ice for about 45 minutes followed by a heat shock by
incubating this tube at 42°C for 42 seconds. After heat shock, the tube was incubated on ice
for about 5 minutes. Out of this bacterial solution, around 30 µl was plated on LB agar plates
containing a suitable antibiotic.
Isolation of plasmid DNA
For sequencing of uncharacterized clones or for restriction analysis, a small-scale plasmid DNA
extraction (“miniprep”) was carried out using a Macherery-Nagel mini prep kit whereas for
plasmid DNA preparation on a large scale a midi or maxi prep kit was used. Overnight cultures
of bacteria colony in LB-medium in a specific volume were used as the starting material for
the kit. All other instructions were followed as given by the manufacturer. The concentration
of the plasmid DNA at the end was determined using a Nanodrop spectro-photometer.
Phenol-chloroform extraction
Purification of nucleic acids was carried out by this method. DNA solutions were subjected to
equal volumes of phenol: chloroform (1:1) and vortexed for about 10 seconds. This mixture
was then centrifuged for about 20 minutes and 13,000 rpm at 4°C to allow phase separation
(the aqueous phase, the interphase and the organic phase). Nucleic acids were retrieved from
the supernatant (aqueous phase) carefully without the interphase and transferred to a new
tube. To this, about 100 l of chloroform was added, mixed vigorously and centrifuged at
13,000 rpm, 4°C for about 20 minutes. The supernatant was retrieved again and about 100 l
of isopropanol was added to it. The mixture was briefly vortexed and incubated at -80°C for
about 30 minutes. This incubated solution was then centrifuged for about 25 minutes at 4°C,
13,000 rpm. The supernatant was discarded and the precipitated DNA was washed once with
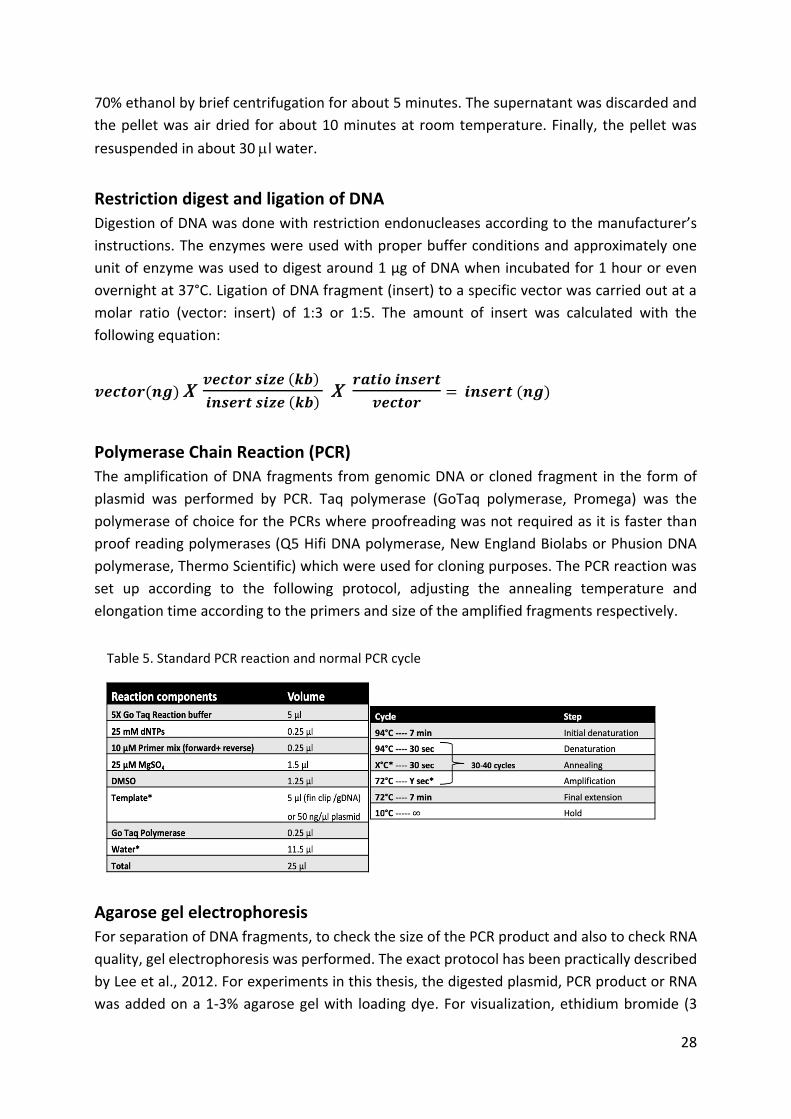
28
70% ethanol by brief centrifugation for about 5 minutes. The supernatant was discarded and
the pellet was air dried for about 10 minutes at room temperature. Finally, the pellet was
resuspended in about 30 l water.
Restriction digest and ligation of DNA
Digestion of DNA was done with restriction endonucleases according to the manufacturer’s
instructions. The enzymes were used with proper buffer conditions and approximately one
unit of enzyme was used to digest around 1 µg of DNA when incubated for 1 hour or even
overnight at 37°C. Ligation of DNA fragment (insert) to a specific vector was carried out at a
molar ratio (vector: insert) of 1:3 or 1:5. The amount of insert was calculated with the
following equation:
𝒗𝒆𝒄𝒕𝒐𝒓(𝒏𝒈) X 𝒗𝒆𝒄𝒕𝒐𝒓 𝒔𝒊𝒛𝒆 (𝒌𝒃)
𝒊𝒏𝒔𝒆𝒓𝒕 𝒔𝒊𝒛𝒆 (𝒌𝒃) X
𝒓𝒂𝒕𝒊𝒐 𝒊𝒏𝒔𝒆𝒓𝒕
𝒗𝒆𝒄𝒕𝒐𝒓 = 𝒊𝒏𝒔𝒆𝒓𝒕 (𝒏𝒈)
Polymerase Chain Reaction (PCR)
The amplification of DNA fragments from genomic DNA or cloned fragment in the form of
plasmid was performed by PCR. Taq polymerase (GoTaq polymerase, Promega) was the
polymerase of choice for the PCRs where proofreading was not required as it is faster than
proof reading polymerases (Q5 Hifi DNA polymerase, New England Biolabs or Phusion DNA
polymerase, Thermo Scientific) which were used for cloning purposes. The PCR reaction was
set up according to the following protocol, adjusting the annealing temperature and
elongation time according to the primers and size of the amplified fragments respectively.
Agarose gel electrophoresis
For separation of DNA fragments, to check the size of the PCR product and also to check RNA
quality, gel electrophoresis was performed. The exact protocol has been practically described
by Lee et al., 2012. For experiments in this thesis, the digested plasmid, PCR product or RNA
was added on a 1-3% agarose gel with loading dye. For visualization, ethidium bromide (3
Table 5. Standard PCR reaction and normal PCR cycle
29
µl/100 ml) was added to the agarose solution. An electrophoresis chamber was loaded with
TAE buffer and the solidified gel was immersed into it. After loading the samples onto the gel,
electric current was applied to allow DNA fragments to move towards the positive electrode.
For estimating the fragment length of the samples, a DNA/RNA ladder was also loaded onto
the gel along with the samples. The results were checked on a UV-transilluminator.
Isolation of DNA from agarose
To clone the fragment, to check the sequence of the PCR product or to select positive clones;
the bands of DNA stained with ethidium bromide appears glowing when visualized using UV
transilluminator. Bands corresponding to the expected size were cut out from the agarose gel
using a scalpel. The fragment was then retrieved from the gel using a Macherey-Nagel gel
extraction kit following manufacturer’s instructions. To sequence the fragments, around 200
ng of the product was sent along with appropriate primer to Metabion AG.
pGEMT-vector sub cloning
PCR derived; gel extracted fragments were cloned into pGEMT-Easy Vector (Promega). Since
this vector contains 3´dT overhangs at its multiple cloning site, the product should have 3´A
overhangs. To create these GoTaq was used alone or in combination to Q5 polymerase during
PCR. The cloning was done as described in the manufacturer’s protocol. Overnight incubation
at 16°C was done and subsequently the ligated product was used for transformation of the
competent bacteria.
Extraction of total RNA for sequencing
RNA extraction for RT PCR or RT qPCR was done by following Step 1 of the Macherey-Nagel
gel extraction kit. Step 2 was followed only when RNA extraction was done from the mutants
and wild type siblings to check the differences at the transcriptional levels (RNA sequencing).
Sample collection for RNA sequencing
From three heterozygous couples, 50 embryos each mutant and wild type were collected in 2
ml Eppendorf tubes. The stage for sample collection was dependent on the phenotype
recognition which was clear around 3 days post fertilization. The collected embryos were
frozen using liquid nitrogen and stored at -80°C until RNA extraction was started. For RNA
extraction only autoclaved tubes, filter tips, and DEPC water were used.
RNA extraction
Step 1: To the frozen embryos, 1ml of the Trizol reagent (Invitrogen) was added and
homogenized using a syringe or pipetting and vortexing until no tissue was visible. The
homogenized solution was incubated at RT for about 5 minutes followed by addition of 200
µl chloroform. The chloroform was mixed by vortexing the mixture for about 15 seconds
followed by incubation at RT for about 2 minutes before centrifuging at 13,000 rpm at 4°C for
20 minutes. After centrifugation, the upper aqueous phase was transferred to a clean 1.5 ml
30
tube. [About 1 µl glycogen (Ambion) was added to the collected aqueous phase when there
was not enough starting tissue.]. To the aqueous phase 500 µl of isopropyl alcohol was added,
mixed by vortexing and incubated for 45 minutes at -80°C. After incubation, it was centrifuged
at 13,000 rpm for 1 hour at 4°C. The supernatant was completely removed and the pellet was
seen at the bottom of the tube. The pellet was washed with 500 µl 75% ethanol and
centrifuged at the same conditions for about 5 minutes. Ethanol was removed and the pellet
was air dried for about 10 minutes at RT. The dried pellet was then resuspended in 100 µl
DEPC water.
Step 2: The second precipitation step was followed to purify the RNA for sequencing purposes.
To 100 µl of the RNA solution (from step 1), 100 µl of phenol: chloroform: IAA (25:24:1)
mixture was added, vortexed and centrifuged at 4°C for 30 minutes at 13,000 rpm. The upper
aqueous phase was the transferred to a clean 1.5 ml tube. To this, 10 µl of sodium acetate
DEPC (pH 4.5) and 250 µl 97% ethanol were added and incubated either overnight at -20°C or
for 1 hour at -80°C. Following incubation, the tubes were centrifuged at the same conditions
for about 1 hour. The supernatant was removed after centrifugation and washed with 250 µl
of 75% Ethanol. Ethanol was removed and the pellet was completely air dried for 10 minutes
at RT. The dried pellet was resuspended in 25 µl DEPC water.
The RNA concentration was measured with a nanodrop and integrity was checked by gel
electrophoresis where 28 S rRNA and 18 S rRNA of all samples appeared as two bands with
almost a 2:1 ratio; and further by checking the RIN number.
cDNA synthesis for RT PCR
DNase treatment of the RNA
To prevent genomic contamination in the resulting cDNA, DNase treatment was done prior to
cDNA synthesis. 1µg of RNA was digested with 1U DNase I (Promega) by incubating it at 37°C
for 30 minutes in DNase buffer in a 10 µl reaction. The reaction was stopped by adding RQ1
DNase stop solution (Promega) and incubating at 65°C for 10 minutes.
cDNA synthesis reaction
cDNA synthesis was done using the Maxima First Strand cDNA Synthesis Kit following the
manufacturer’s protocol. The reaction mixture contained DNase treated RNA with Maxima
first strand reaction buffer and enzyme. This mixture was incubated at 25°C (RT) for 10
minutes followed by 1 h incubation at 50°C. A final inactivation step (65°C for 10 minutes)
stopped the reaction. The resulting cDNA was stored at -20°C and diluted before use.
CRISPR/Cas9 deletion strategy and guide RNA synthesis
To disrupt the function of the gene, Crispr/Cas9 mediated gene editing was performed for
understanding function of apobec2a (apo2a) and apobec2b (apo2b) genes. To create
knockouts, a deletion strategy was chosen where two guide RNAs were injected together to
create a big deletion with a hope of disrupting gene function completely. The best guide RNAs
(20 nucleotides long) for each gene were chosen from the Chopchop website online
<https://chopchop.cbu.uib.no > and were synthesized by cloning-free guide RNA synthesis
31
(Gagnon et al., 2014). Following this protocol, 60 nucleotides long oligos containing a T7
promoter sequence, the 20 base target site without PAM and a complementary region were
annealed to a constant oligonucleotide. Annealing of both the oligonucleotides was done by
adding T4 DNA Ligase to the oligos, followed by incubation at 12°C for 20 minutes to make
double stranded DNA. The double stranded DNA was subjected to column purification (Gel
and PCR clean up kit, Macherey-Nagel) and used for RNA synthesis using Megashortscript T7
kit, Ambion. The quantity of guide RNAs was checked using Nanodrop, aliquoted and stored
at -80°C.
Knockout of apobec2a and apobec2b genes
Mutants for the apobec2a and apobec2b genes were generated using the CRISPR/Cas9
genome editing technique (Varshney et al., 2015a) by a two guide-deletion strategy where
two guides (one in exon1 and the other in intron 1 or both guides in different exons; 250 ng/µl
each) were injected with Cas9 protein to create big deletions (Figure 11A´´, B´´). The wild-type
eggs were injected at the one celled stage and raised to an F0 generation. The F0 generations
were screened for mutations by genotyping individual fishes. From three different
combinations of injections, I retrieved only positive founders for one of the deletions between
exon1 and intron 1 in apobec2a (official nomenclature of this allele: apobec2aka98). Similar to
apobec2a, a deletion of part of exon1 and intron 1 of apobec2b with an additional 7 bp
insertion (Figure 11B´´) was passed to next generation (official nomenclature apobec2bka99).
The F0 founders harboring big deletions were outcrossed with wild-type fishes and the F1
mutant generations were raised separately for apobec2a and 2b. F1 generations were further
screened for mutants where the mutants were identified from the heterozygous or wild-type
fishes by PCR. Primers were made in the deleted part and to amplify the leftover product after
deletion. The positive fishes for apobec2a, 2b were then in-crossed to check for any defects
pertaining to loss of apobec2a or 2b separately. The heterozygous fish from apobec2b were
outcrossed with apobec2b heterozygous fishes to obtain double heterozygous mutants (Table
6). Further crossing schemes were set up to reach homozygosity; apobec2aka98/ka98;
apobec2bka99/ka99 (Table 7, Table 8).

32
2.2.4 Crossing schemes
Crossing scheme to obtain double heterozygous (apobec2a; apobec2b+/-)
mutants
Crossing scheme to obtain double homozygous (apobec2a; apobec2b-/-)
mutants
AaBB (apobec2a+/-) X AABb (apobec2b+/-)
AB AB aB aB
AB
Ab
AB
Ab
Wild-type
Double heterozygous
Table 6. Incrossing apobec2a+/- to apobec2b+/- gives rise to 25% apobec2a; apobec2b+/- (double heterozygous) mutants (green).
Table 7. Crossing of double heterozygous (apobec2a+/-; apobec2b+/-) gives 6.25% of apobec2a; apobec2b-/- (double homozygous) mutants (green)
Wild-type
Double homozygous
AB Ab aB ab
AB
Ab
aB
ab
AaBb (apobec2a+/-, apobec2b+/-) X AaBb (apobec2a+/-; apobec2b+/-)

33
Crossing scheme 2 to obtain double homozygous mutants
aB ab aB ab
aB
ab
aB
ab
aaBb (apobec2a-/-, apobec2b+/-) X aaBb (apobec2a-/-; apobec2b+/-)
Wild-type
Double homozygous
Table 8. Incrossing of apobec2a-/-; apobec2b+/- (homozygous for apobec2a and heterozygous for apobec2b) gives 25% of apobec2a; apobec2b-/- (double homozygous) mutants (green)

34
3 Results
3.1 Assessing guide RNA cutting efficiencies with a simple PCR based method
gRNA/Cas9 complex when injected in the zebrafish embryo causes the induction of different
indels and frequently not all target sequences are mutated, resulting in a mix of wild-type and
different mutant alleles. Also cutting efficiencies of gRNAs are quite variable. Therefore, to
assess the cutting efficiency, we applied TIDE (Tracking Indels by sequence trace
DEcomposition) to zebrafish and developed an improved method and software for it which
we called PCR-F-Seq (Polymerase Chain Reaction-Fragment- Sequencing). We chose highly
efficient guides available in our lab where phenotypes could be seen already in F0 generations.
Guides for rp2 gene shows highest efficiency followed by bbs1, pik3r4 and from our experience
with bbs4 being a highly inefficient guide and was used as a negative control. PCR-F-Seq takes
advantage of the heterogeneity in mutant allele generation, to assess the cutting efficiency of
gRNAs specifically applied to zebrafish model system. Genomic DNA flanking the target site of
the gRNA is amplified from genomic DNA which was prepared from a pool of zebrafish
embryos injected with specific gRNAs and Cas9 protein (Figure 7A). The resulting mixes of
mutant and wild-type PCR fragments were directly Sanger sequenced without cloning into a
plasmid. The derived sequencing profiles which deviate around the PAM sequences show
reduced height and heterogeneity of sequencing peaks at positions downstream of it (Figure
7B, Figure S 1A-H) because sequences representing different indels are averaged. In parallel,
to assess the efficacy of mutagenesis directly, we determined the number of mutant
sequences among randomly picked individual subclones of the PCR fragment pools by
sequencing of individual subclones (Figure 7C, Figure S 1, Figure S 2). High cutting efficacy
results in a high number of mutant clones among the subcloned individual fragments and
therefore the guide against rp2 shows highest efficiency followed by bbs1, pik3r4 and bbs4 as
highly inefficient guides. The sequence profiles of fragment pools derived from gRNAs with
such high cutting efficiency revealed a clearly reduced sequencing signal that showed strong
heterogeneity of base specific peaks at the positions downstream of the mutated region in
the direction of sequencing (Figure 7B, Figure S 1).

35
3.1.1 Quantification of cutting efficiency These observations suggest that the efficiency of gRNA performance may be deduced
quantitatively from the degree of deviation from the wild-type sequencing profile present in
the mutant profile: Downstream of the indels in direction of sequencing, we expect a certain
level of randomization at individual sequence positions that should quantitatively correlate
with the abundance of mutant sequence in the PCR pool. We extracted the relative maximum
peak intensities within 50 nucleotides before and 50 nucleotides after the PAM sequence and
calculated the median of these intensities in the two areas (Figure S 3). In this way, peaks that
are perfectly randomized attain only 25% (1/4 for every nucleotide) of the maximum relative
height observed when there is no deviation from the wild-type pattern. To convert these
relative median heights to a cutting efficiency, we scaled the two obtained values to the
Figure 7. Sequence profiles derived from four amplified fragment pools containing CRISPR/Cas9 target sites quantify efficacy of gRNA mediated mutagenesis. (A) Scheme illustrating steps of PCR-F-Seq: Zebrafish eggs were injected with gRNA and Cas9 protein. Genomic DNA was extracted from pools of 15 one-day old embryos, and the DNA flanking the PAM site was PCR-amplified. One of the amplification primers was used for Sanger sequencing of the PCR fragments (Figure S 2B). (B) Examples of sequencing profiles obtained from sequencing of the PCR fragment pools of four different gRNA/Cas9 injections. gRNAs directed against rp2, bbs1 and pik3r4 resulted in sequence profiles of fragment pools with strongly reduced electropherogram peaks downstream of the PAM sequence (vertical line). In contrast, the gRNA directed against bbs10 yielded a sequence profile of the PCR fragment pools that appeared unchanged downstream of the PAM sequence. (C) Chart showing the number of mutant (green) and wild-type (red) subclones for each of the gRNAs tested in (B). PCR fragments were subcloned and a total of 18 subclones for each gRNA were sequenced. The 18 sequenced fragments comprised more than 50% mutant fragments when gRNAs directed against rp2, bbs1 and pik3r4 were injected. In contrast, and as revealed also by the sequencing profile shown in (B), injection of a gRNA against bbs10 did not result in any mutant fragment among the 18 tested subclones.

36
interval [0,1], such that the lowest possible relative height of 25% was set to 1 (maximum
cutting efficiency) and the larger median value corresponded to 0 (no cut, wild-type
sequence). We analyzed the sequencing profiles summarized in Figure S 1A-H with this
method (Figure 8A). The PCR-F-Seq based quantification of the cutting efficiency of the tested
gRNAs correlates well with the cutting efficiencies obtained from sequencing single subclones
(Figure 8B).
We next wished to assess the sensitivity of PCR-F-Seq and tested at which ratio we
could detect a single mutant sequence mixed with a wild-type sequence. With the PCR-F-Seq
method, we detected as little as 6% mutant fragment in a wild-type fragment background
(Figure 8C).

37
3.1.2 PCR-F-SEQ as a web interface Since much higher efficiencies are required for gRNAs to be good tools for genome editing
(Shin et al., 2014) (Hoshijima et al., 2016), the sensitivity of PCR-F-Seq is more than sufficient.
When applying the method to genotyping of the progeny of mutant carriers, tracing of
individual heterozygous carriers (Figure 8C) and distinguishing them from homozygous mutant
or wild-type animals is easily achieved. To facilitate use of the PCR-F-Seq method, we designed
a user-friendly, open source web interface which allows to derive cutting efficiencies of gRNAs
by simply importing the sequence trace files in the SCF format (*.scf) (Figure 9, http://iai-gec-
server.iai.kit.edu). The web interface automatically generates a preview image for each of the
sequences to refine the location of interest (i.e. the PAM location) and subsequently allows
evaluating the cutting efficiency.
Figure 8. Quantification of mutagenesis efficiency by different gRNAs assessed with the PCR-F-Seq method. (A) Chart showing relative cutting efficiency calculated from the sequencing profile of the PCR fragment pool derived from 15 embryos 24 hours after injection with gRNAs directed against rp2, hsp90aa1.1 (indicated as hsp90a), bbs1, unc45b, pik3r4, bbs10, apobec2a-exon1 (indicated as apo-ex1) and apobec2a-exon2 (indicated as apo-ex2). +, embryos injected with the indicated gRNA/Cas9; -, uninjected sibling controls. (B) Mutagenesis efficiency calculated from sequencing profiles with the PCR-F-Seq method was plotted against the proportion of mutant PCR fragments among 18 subcloned fragments (Figure 1C, Figure S 1A-H). The regression coefficient R2 is 0.954. (C) Wild-type fragment was mixed with a mutant fragment at variable ratios ranging from 100% wild-type to 100% bbs1 mutant fragment and each fragment mix was Sanger sequenced. The presence of mutant sequence was calculated from the sequencing profiles using the PCR-F-Seq method. Good correlation with the increasing amount of mutant sequence in the mixes was noted. For comparison, the same fragment was amplified from a heterozygous bbs1 zebrafish, subjected to Sanger sequencing as pool, and the resulting sequencing profile analyzed by the PCR-F-Seq algorithm. As expected for the 50% abundance of the mutant fragment in this pool, the relative detection of the fragment was 0.5. Thus, the method also allows identification of heterozygous animals. Please note that the method detects differences between the sequencing quality before and after the PAM sequence. Therefore, 100% wild-type or 100% mutant fragment both show relative mutagenesis values of 0. For more details see Figure S 4.

38
Figure 9. Web interface for applying the PCR-F-Seq method to sequence trace files provided in the SCF format (*.scf). The interface provides a brief introduction to the usage of the tool (A) where all the steps are explained in detail. For the first step, a file upload section (B) appears where the file* containing peaks was uploaded. A preview dialog that allows to adjust the PAM location as well as the radius to use for cutting efficiency calculations (C) appears immediately after the upload is completed and finally a dialog for automated cutting efficiency estimation on a per-sequence basis (D) is produced. Results can be viewed online or downloaded for subsequent analyses. *The original Sanger sequencing peaks in AB1 format were converted to SCF format by simply exporting the original files as SCF files using the plasmid editor, ApE. Figure courtesy: IAI, KIT.
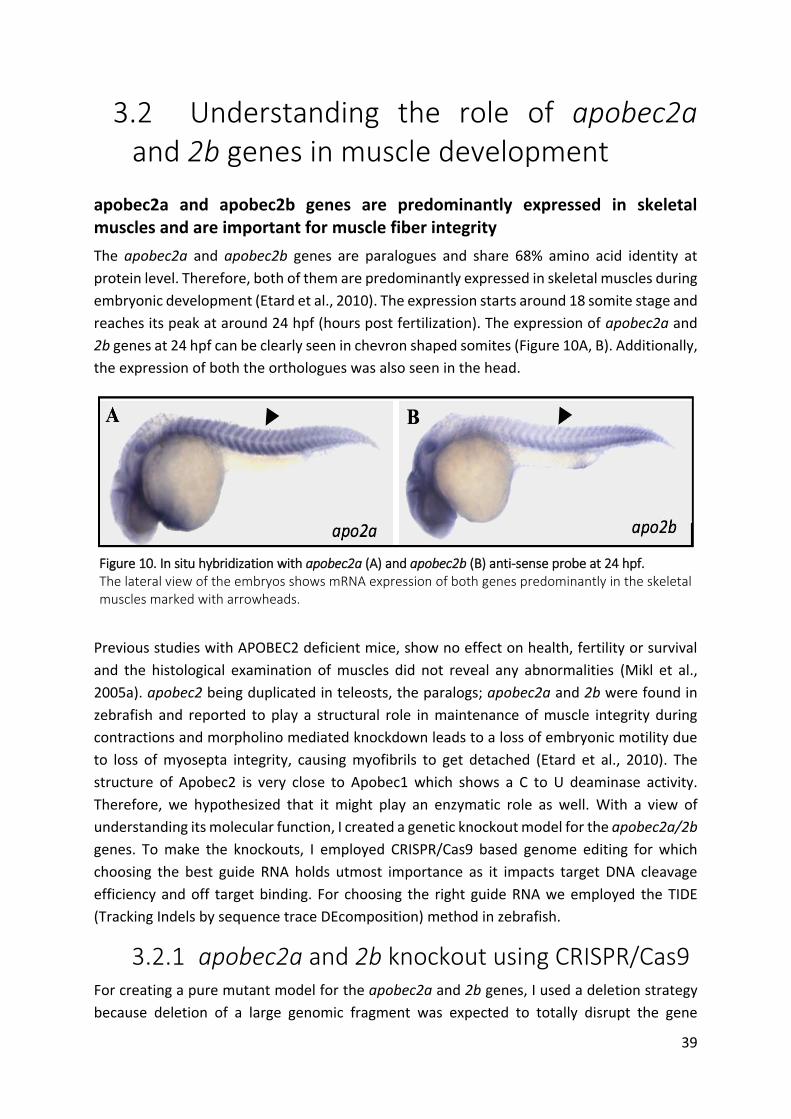
39
3.2 Understanding the role of apobec2a and 2b genes in muscle development
apobec2a and apobec2b genes are predominantly expressed in skeletal muscles and are important for muscle fiber integrity
The apobec2a and apobec2b genes are paralogues and share 68% amino acid identity at
protein level. Therefore, both of them are predominantly expressed in skeletal muscles during
embryonic development (Etard et al., 2010). The expression starts around 18 somite stage and
reaches its peak at around 24 hpf (hours post fertilization). The expression of apobec2a and
2b genes at 24 hpf can be clearly seen in chevron shaped somites (Figure 10A, B). Additionally,
the expression of both the orthologues was also seen in the head.
Previous studies with APOBEC2 deficient mice, show no effect on health, fertility or survival
and the histological examination of muscles did not reveal any abnormalities (Mikl et al.,
2005a). apobec2 being duplicated in teleosts, the paralogs; apobec2a and 2b were found in
zebrafish and reported to play a structural role in maintenance of muscle integrity during
contractions and morpholino mediated knockdown leads to a loss of embryonic motility due
to loss of myosepta integrity, causing myofibrils to get detached (Etard et al., 2010). The
structure of Apobec2 is very close to Apobec1 which shows a C to U deaminase activity.
Therefore, we hypothesized that it might play an enzymatic role as well. With a view of
understanding its molecular function, I created a genetic knockout model for the apobec2a/2b
genes. To make the knockouts, I employed CRISPR/Cas9 based genome editing for which
choosing the best guide RNA holds utmost importance as it impacts target DNA cleavage
efficiency and off target binding. For choosing the right guide RNA we employed the TIDE
(Tracking Indels by sequence trace DEcomposition) method in zebrafish.
3.2.1 apobec2a and 2b knockout using CRISPR/Cas9 For creating a pure mutant model for the apobec2a and 2b genes, I used a deletion strategy
because deletion of a large genomic fragment was expected to totally disrupt the gene
Figure 10. In situ hybridization with apobec2a (A) and apobec2b (B) anti-sense probe at 24 hpf. The lateral view of the embryos shows mRNA expression of both genes predominantly in the skeletal muscles marked with arrowheads.

40
function. Deletions were successfully performed by choosing different guide combinations:
close to the start codon and the first intron, in the first intron and second exon or in the first
and last exon to delete the whole gene. Other attempted deletions were not transmissible in
the germline and therefore were not detected in the F1 generation. The only combination
which was germline transmissible in both genes is schematically shown in Figure 11A, B. in
order to check the mutational efficiency of the guide, 24 h after injection each batch was
tested by the PCR-F-SEQ method. The Sanger sequencing electropherograms (A´, B´) showcase
multiple peaks near the PAM sequence due to sequence polymorphisms, indicated by the
dotted box, where sequencing practically stops. In apobec2a, a DNA fragment of 4.6 kb was
snipped off consisting of partly exon1 and intron1 sequence; disrupting the splice junction.
Similar to that, in apobec2b a deletion of 2.2 kb excising the splice junction was made. An
additional insertion of 7 bp was observed, creating a frameshift. The exact mutation in both
cases was further confirmed in the F1 generation by genotyping using fin clips, and exact indels
were shown by multiple sequence alignment (Figure 11A´´, B´´).
1 2
5’....CAAGAAAGAGGAGAAAAGCCCAACAGAAGCGGAGAAACCCGA...3’
5’...GGGTGGCAGGGCGCACTGGTGATAGGGTGAGGAGCTCTAAT...3’apo2a_sgRNA_Ex1
apo2a_sgRNA_int1
deletion of 4.6kb
Ex1
int1
A
A´ A´´

41
In zebrafish, the paralogues, apobec 2a and 2b both contain two exons and a cytidine
deaminase domain which might have a function of mRNA editing, converting C (cytidine) to U
(uridine). The apobec2a gene is located on chromosome 22 and encodes for a 267 amino acid
long protein whereas, the apobec2b gene encodes for a 273 amino acid protein on
chromosome 23. The cutting efficiency of guides used was about 60% and only one mutation
was germline transmissible in each of them. Therefore, I used these alleles to generate stable
single knockout lines (apobec2aka98 and apobec2bka99). The deletion causes removal of the
splice junction and hence might affect mRNA splicing events. For apobec2a, the allele with a
deletion of 4.6 kb (apobec2aka98) remains in-frame and is predicted to translate into a shorter
Figure 11. apobec2a and apobec2b guideRNA design and description of the mutations. (A, B) Schematic overview of the strategy to make big deletions in the apobec2a and 2b genes. The intron is marked in black and the coding exons of apobec2a and 2b are labelled in light blue and dark blue respectively, the target sites are indicated by grey lines in exon1 and intron followed by the target sequences where PAM sequences are highlighted in red. The location of PCR primers (Forward and reverse) is indicated by arrows in both the cases. (A´, B´) Sanger sequencing chromatogram of PCR amplified fragment left from the injected batch (F0) showcasing indels in the form of multiple peaks near the PAM, indicated by the rectangular dotted box marked with an arrow. (A´´, B´´). Sequence alignment of the fragment amplified from F1 positive fish to that of wild-type sequence, showing a deletion of a 4.6kb fragment and a deletion of a 2.2kb fragment along with an insertion of 7 bases marked by a red dotted box, in apobec2a and apobec2b respectively.
12
5’....CAAAAAATGAAGAGATGCCTCAAGGGAATGGGGAGATACCAGA...3’
5’...AATTCAATGTTCAGCTAGCACATGGGTGTGGTGTTCAGAT...3’apo2b_sgRNA_Ex1
apo2b_sgRNA_int1
B
B´ B´´
int1
Ex1
deletion of 2.2kb
insertion of 7bp

42
protein having 222 amino acids. Since the splice junction is deleted, another protein is also
predicted which might result from retainment of the part of intron1, leading to a premature
stop codon forming a very short protein of 50 amino acids.
A
A´
B
B´
Figure 12. Prediction of Apobec2 proteins after deletion. (A, B) Schematic drawings of the predicted sequence of Apobec2a and 2b mutant proteins. (A´) Putative sequence of the Apobec2a mutant protein with properly spliced product gives a truncated 222 amino acid protein where part of exon1 is missing whereas in the case of aberrant splicing, the intron is retained which leads to a premature stop codon giving a 50 amino acid protein lacking the cytidine deaminase like domain. (B´) Apobec2b mutant allele with a 2.2kb deletion along with a 7bp insertion which lead to a frameshift with a premature stop codon with or without correct splicing. The putative truncated proteins would lack the cytidine deaminase like domain. aa= amino acids.

43
3.2.2 Double homozygous mutants do not show any muscular defect
Mutants were crossed to homozygosity, apobec2aka98/ka98 and apobec2bka99/ka99. Both the
individual homozygous lines were viable and fertile. There were no visible defects observed.
The double homozygous mutants were then generated by incrossing, as per the scheme (Table
7, Table 8) to establish a pure double homozygous mutant generation. The maternal-zygotic
double mutants were also established and henceforth called apobec2aka98/ka98;
apobec2bka99/ka99 or double mutants. Unlike morphants, double mutants do not show any early
phenotype as well. Neither any obvious motility defect nor any lethality was seen. The muscle
integrity of apobec2aka98/ka98; apobec2bka99/ka99 mutants was maintained as shown by
birefringence (Figure 13A´, B´) which is similar to the unrelated wild-type embryos of same
age.
Figure 13. Double homozygous (apobec2aka98/ka98
; apobec2bka99/ka99
) mutants do not exhibit a muscle defect. At 48 hpf, birefringence of mutants is similar to their wild-type siblings. Immunohistochemistry
with (C, C´) -sarcoglycan antibody staining sarcomere boundaries, (D, D´) A1025 antibody
staining all muscle myosin and (E, E´) nAchRs at NMJ stained by -bungarotoxin do not reveal any difference in mutants (C´, D´, E´) compared to wild-type (C, D, E) at 72 hpf. nAchRs-
nicotinic acetylcholine receptors, NMJ- neuromuscular junction. Scale bars = 20 m.

44
To investigate the muscle components in depth, immunohistochemistry was
performed. The myofibrillar components F-actin (Figure 14A,D), all types of muscle myosin
(Figure 13D, D’), and -sarcoglycan (Figure 13C, C´) were all properly localized just like in the
wild-type embryos and show no defects. Further, the characterization of neuro-muscular
components like nicotinic acetylcholine receptors (nAChR) by fluorescently labeled
bungarotoxin binding irreversibly to subunits of the receptor showed a punctate pattern
similar to that of wild-type siblings (Figure 13E, E´).
3.2.3 Pax7 positive cells were not affected in the mutant
Previous in vitro experiments with single myofiber cultures of APOBEC2 knockout mice
showed a significant reduction of satellite cells (Ohtsubo et al., 2017). To examine any such
changes in the number or localization of Pax7 positive nuclei in our double mutants,
immunohistochemistry was performed at 72 hpf. Pax7 positive nuclei were located along the
transverse and horizontal myosepta (TM, HM), dorsal and ventral edge (DE and VE), and
normal migration to the central portion was seen in later stages as shown in Figure 14.
Immunostainings of the mutants (Figure 14B, B´) did not show any defect in number and
localization of satellite cells compared to wild type.

45
3.2.4 apobec2a/2b mRNA transcript is absent in apobec2aka98/ka98; apobec2bka99/ka99 mutants
The consequences of genomic sequence deletion on the mRNA transcript were analyzed using
RT-PCR. mRNA was extracted from double homozygous mutants and unrelated wild-type at
24 hpf. The RT-PCR product corresponding to Exon2 of both apobec2a and 2b genes was
completely absent in mutants (Figure 15), suggesting early mRNA degradation of both
apobec2a and 2b. Several other combinations of primers were not able to amplify any product
in mutant sample.
Figure 14. Satellite cells are not affected in apobec2aka98/ka98; apobec2bka99/ka99 double mutants. Schematic representation of the location of satellite cells in zebrafish muscles is shown on top right for reference. (A, A´) Immunohistochemistry with phalloidin (green) marking F-actin, (B, B´) Pax7 staining for satellite cells located at the dermomyotome, (C, C´) merged images do not show any differences between unrelated wild-type (A, B, C) and (A´, B´, C´) mutants at 72 hpf. DE, VE = dorsal and ventral edge respectively; HM, TM = horizontal and transverse myosepta respectively; CP= central portion. Dermomyotome consists of DE, VE, HM, TM.
Figure 15. RT-PCR confirms mRNA degradation in mutants. WT and mutant allele RT-PCR products resolved on 2% agarose gel. On the left panel, the apobec2a profile in wild-type embryos (A) shows a clear band of about 300 bp which is missing in the double homozygous mutant (B). Similarly, on the right panel, the apobec2b profile in wild-type embryos (A) shows a band of about 600 bp which is missing in the double homozygous mutant (B). M= marker.

46
3.2.5 Knockdown of apobec2a in apobec2aka98/ka98; apobec2bka99/ka99 mutants
Injection of the start-site morpholino against apobec2a (Mo[ATG]-apobec2a) was previously
shown to impair embryonic motility (Etard et al., 2010). Since neither apobec2aka98/ka98 nor
apobec2b ka99/ka99 show any muscle phenotype, I injected the same morpholino as previously
described into apobec2bka99/ka99 as well as double apobec2 mutants. These injections induce a
motility defect, pericardial edema as well as smaller eyes in both the lines (Figure 16).
3.2.6 Loss of apobec2a might be compensated by apobec2b mRNA upregulation
To check the mRNA profiles in the apobec2aka98/ka98; apobec2bka99/ka99 mutants, I performed
chromogenic ISH for apobec2a and 2b at 24 and 48 hpf. The expression patterns of both the
genes are quite similar, primarily in the somites and the expression peaks at 24 hpf (Figure
17A-D). Surprisingly, the expression of apobec2a was completely lost in the mutants at 24 hpf
(Figure 17A´) whereas the expression of apobec2b was upregulated at this stage as shown by
the arrow (Figure 17B´). By 48 hpf, the expression of both apobec2a and apobec2b was
completely lost in the mutants (Figure 17C´, D´). This suggests that the upregulation of
apobec2b in the double mutants might be accounted for by genetic compensation.
Figure 16. apobec2a morpholino position and injection. The morphant exhibiting pericardial edema shown by an arrowhead and smaller eyes is shown by a dotted circle. Additionally, the morphants had a curved body axis.
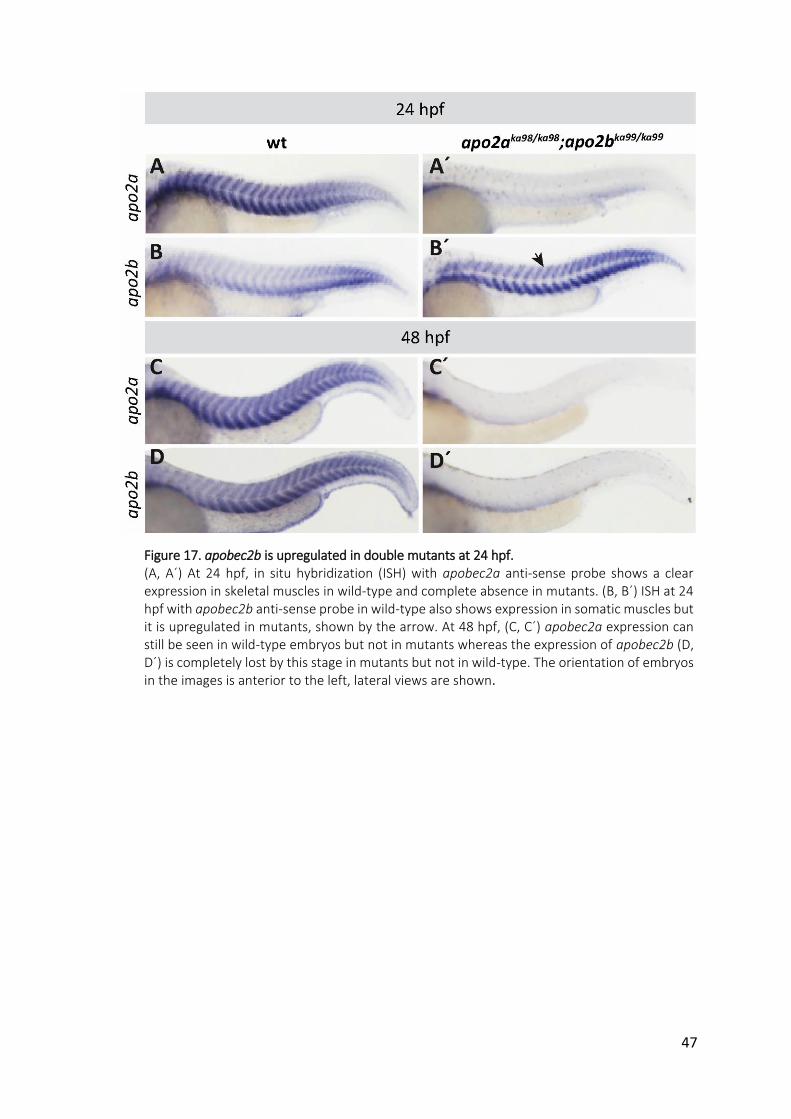
47
Figure 17. apobec2b is upregulated in double mutants at 24 hpf. (A, A´) At 24 hpf, in situ hybridization (ISH) with apobec2a anti-sense probe shows a clear expression in skeletal muscles in wild-type and complete absence in mutants. (B, B´) ISH at 24 hpf with apobec2b anti-sense probe in wild-type also shows expression in somatic muscles but it is upregulated in mutants, shown by the arrow. At 48 hpf, (C, C´) apobec2a expression can still be seen in wild-type embryos but not in mutants whereas the expression of apobec2b (D, D´) is completely lost by this stage in mutants but not in wild-type. The orientation of embryos in the images is anterior to the left, lateral views are shown.

48
3.3 Forward genetic approach to study the existing mobility mutant lines
Several hundreds of the mutants were isolated in large-scale mutagenesis screens which were
done at the Max Planck Institute of Developmental Biology, Tübingen in 1993 and 2004 (1st
and 3rd screens respectively). These phenotypic screens were done in order to retrieve
putative developmentally relevant genes. Many of the mutant lines from these screens were
stored at the EZRC in the form of frozen sperm stocks and remain uncharacterized. We thus
took the advantage of studying some of these uncharacterized lines and for that, we revived
a few of them as mentioned in Table 4. We chose the lines which exhibit drastic muscle or
mobility phenotypes with a hope to discover new developmentally critical muscle genes. The
lines were revived by IVF and each of them was randomly incrossed at around 3 months, to
find heterozygous couples as depicted in Figure 19. To characterize the mutant lines, I
followed a series of common steps with each line. The strategy is shown in Figure 18 .
1.
2.
3.
4.
5.
Figure 18. Strategy for systematic study of revived ENU mutant lines. A series of steps were followed in order to discover the cause of the phenotype in each uncharacterized line. After crossing the heterozygous couples for each line, step 1. mobility assessment of the mutants was performed where ability to self dechorionate and response to touch were noted. After the identification of mutants, in step 2 birefringence was recorded to confirm if there is a muscle disruption. In step 3 a detailed study of the various muscle components was performed by immunostaining. The mutation was then mapped by whole genome or RNA sequencing (step 4). After curating the candidate gene list, the best candidate was validated in step 5 by complementation or rescue experiments.

49
wt
wt
Figure 19. Overview of an ENU based-forward genetic screen. ENU treated males were outcrossed with wild-type females and the progeny (F1) were raised and crossed to identify heterozygous couples based on the phenotype observed in the progeny. Identified heterozygous F1 males were sacrificed and the samples of cryopreserved sperm were archived. Sperm from each identified carrier was used then to generate an F2 generation through in-vitro fertilization (IVF), done in house at the EZRC and heterozygous carriers were then retrieved by progeny screening (25% motility defect). ENU = Ethyl nitrosourea, +/m = mutation carrier, +/+ =wild-type, m/m = mutant fish, wt =wild-type, IVF= in vitro fertilization.

50
Phenotypic groups of the revived mutant lines After retrieval of 6 lines by IVF from the 1st Tübingen screen, I was successful in recovering
mutant couples from 4 lines. The other 2 mutant lines when revived had a low fertility rate
and only females survived. Whereas, from the 3rd Tübingen screen, out of 5 revived lines, I
could recover positive couples from only 2. After many random crossings for other 3 lines, I
couldn’t see any phenotype in the progeny as described earlier. For all of the identified lines,
a simple and fast motility test was carried out on the progeny. As mentioned by (Granato et
al., 1996), most of the locomotion mutants are embryonically lethal. Accordingly, we found
that the homozygous alleles were not viable. Motility mutants from 1996 Tübingen screens
belong to three major groups: Group A no or reduced motility combined with reduced muscle
striation; Group B no obvious muscle defects but reduced/ abolished embryonic locomotion,
Group C no obvious muscle defects and motility abnormal (Granato et al., 1996). The mutant
lines from the 3rd Tübingen screen were identified based on their satellite cells using antibody
staining against Pax7, with the aim to identify new genes involved in satellite cell specification
and regeneration (R. Geisler, personal communication).
3.3.1 Mutants with reduced motility combined with reduced trunk muscle striation (Group A)
duesentrieb (dustq250) and frozen (froto27c) were classified under this group. Mutants in this
group were further subdivided into four distinct phenotypic groups where froto27c belongs to
the A1 subtype (immotile mutants with no or reduced striation) and dustq250 belongs to A2
subgroup (mutants with reduced motility, reduced striation). froto27c mutants are not able to
hatch due to compromised motility and upon manual dechorionation, they remain curved for
a few hours since straightening up is passive. The mutants are easily distinguished from the
unaffected siblings due to their enlarged pericardium with blood accumulation over the yolk
(Figure 20C). At 24 hpf, the mutants cannot escape on touch, they only twitch in response to
external stimuli and by 72 hpf they become completely immotile. They are viable only until 4
dpf (days post fertilization) although there is no significant difference in the heart rate to that
of the wild-type embryos. The froto27c mutants exhibit a drastic muscle phenotype as seen by
birefringence images (explained in Methods) where the mutants show significantly reduced
brightness compared to their unaffected siblings (Figure 20A, A´). Apart from the dystrophic
muscles, the mutants also exhibit an unusual otolith number. Otoliths are crystalline deposits
of calcium carbonate and proteins which are clearly visible as pairs under a dissecting
microscope in each otic vesicle of zebrafish larvae (Whitfield et al., 2002). The two sensory
patches that develop in the larval ear are called the maculae. Utricular and saccular macula
tethers the stones with the help of arrays of sensory hair and supporting cells present on the
epithelium. The ear stones help in hearing and maintaining body balance in adult fish. The
unaffected siblings of froto27c have two otoliths in each ear (2+2) (Figure 20D) whereas the
mutants exhibit three otoliths in one ear and two in the other (2+3) (Figure 20D´) or sometimes
even three otoliths in both ears (3+3). Quantification of the otolith number confirmed our

51
findings where most of the mutants lie in the 2+3 category whereas, the siblings remain
unaffected (Figure 20E).
To investigate the phenotype in detail, immunostaining against various muscle components
was performed. froto27c mutants at 24 hpf show a clear loss of the Z-line indicated by patchy
-actinin staining (Figure 21B, H). At higher magnifications the difference between wild-type
and mutants can be clearly noted (Figure 21B´, H´). Only few residual striated fibers were seen
in the mutant embryos depicted by arrows (Figure 21J´). The fast and slow twitch fibers also
remain unorganized (Figure 21D, J and E, K respectively) and only residual striations were seen
in the mutant embryos as shown by the arrows in higher magnification images (Figure 21D´,
Figure 20. Muscle integrity of froto27c and dustq250. At 48 hpf, (A, A´) birefringence of the froto27c mutants is considerably reduced compared to their wild type-like siblings and (B, B´) the birefringence of dustq250 mutants is similar to their wild-type-like siblings, showcasing no obvious defect in muscle architecture, (C) froto27c mutants additionally exhibit an enlarged heart cavity and (D, D´) abnormal otolith number. (E) Quantification of the number of otoliths in mutants (froto27c) and unaffected siblings (wt). 86% of the mutants show abnormal number of otoliths from which 16% show 3 otoliths in each ear and 70% lie in 2+3 category. Only 14% outliers were seen and n=150.

52
J´ and E´, K´ respectively). By 72 hpf, the muscle fibers show almost no striations and slow
muscle myosin does not retain any organization (Figure 22A, A´). Titin, a giant protein
connecting Z line to the M line is also completely disorganized (Figure 22B, B´).
Figure 21. froto27c shows disorganized muscle fibers. Immunohistochemistry of wild type and mutants with phalloidin (green) marking F-actin (fast muscle fibers), α-actinin marking z-discs (red), and merge (A-C, G-I respectively). Higher magnification images (A´- C´) of wild type siblings show a proper organization of α-actinin on Z-discs and complete disorganization in mutants (G´-I´). Actin and slow muscle myosin are properly organized in wild-type (D-F) and at higher magnifications (D´-F´). froto27c shows complete disorganization of the fiber architecture (J-L) and only residual organized fibers were
seen at higher magnifications (J´-L´). Scale bars A-F, G-L = 25 m, A´-F´, G´-L = 6 m.

53
Embryos mutant for dustq250 (duesentrieb, internal allele name AQ50A) can hatch from their
chorion but only react with a low-speed escape response to external stimuli. The escape
response worsens over time and mutants can be fully distinguished from wild-type siblings at
72 hpf. The muscle architecture seems intact as indicated by birefringence showing no obvious
difference compared to the unaffected siblings (Figure 20B´, B respectively). The mutants die
within a week due to the drop-in heart beat rate over time. To investigate in detail, I
performed immunostaining of muscle components of the mutants at different stages of
development and there were no visible differences observed organization of fast and slow
muscle myosin. Since, muscles were not affected but the mobility was impaired, I investigated
the motor neuron profile and the acetylcholine receptors at the NMJ. Both of the stainings
shows no visible difference to those of the siblings.
Figure 22. Complete degradation of muscle fiber structure was seen in mutants by 72 hpf. froto27c mutants show completely disorganized slow twitch fibers (A, A´). Titin staining also shows complete disruption of overall sarcomeric organization in mutants (B, B´), F-actin
(green) and -actinin (red) co-immunostaining show well organized actinin at Z-discs, in rare cases some structural organization in the fibres was seen as shown by the arrow (B´,
C´). Scale bars A, A´ = 25 m, B, B´, C, C´= 12 m.

54
3.3.2 Mutants with reduced embryonic locomotion (Group B)
Two of the revived mutant lines from the Tubingen I screen, slmtt208 and tk64 were classified
under this phenotypic group. slmtt208 (slumber, internal allele name AT08B) was further placed
in subgroup B6 (mutants with reduced motility). The mutant slmtt208 do not dechorionate due
to reduced motility and after manual dechorionation they remain curved. At 48 hpf, the
mutants only twitch in response to an external stimulus whereas the wild-type escapes
rapidly. The muscle architecture remains intact as shown by birefringence (Figure 24A, A´).
The homozygous mutants are not viable, they die within 5 days. Investigating the muscle
architecture of slmtt208 mutants in detail was done by immunostaining for different muscle
components like actin and myosin filaments, as well as titin which holds myosin filaments.
Additionally, bungarotoxin staining was performed to check the profile of acetylcholine
receptors at neuromuscular junctions (NMJ). F-actin stained by phalloidin (Figure 24B, B´) and
myosin stained by A1025 antibody (Figure 24C, C´) at 48 hpf do not show any disorganization.
At 72 hpf, bungarotoxin shows punctate staining in the mutants similar to that of their
unaffected siblings (Figure 24D, D´). Titin staining also shows no defects in mutants as shown
by the zoomed images compared to their wild-type siblings (Figure 24E´-G´ and Figure 24E-G
respectively).
Figure 23. Immunostaining of fast and slow muscle fibers of dustq50 mutants and wild-type siblings. Slow twitch muscles (red) and actin filaments (green) are properly organized in the mutants.

55
tk64 exhibits practically very similar phenotype like that of slmtt208 mutants. The homozygous
mutants remain unhatched and curved upon manual dechorionation (Figure 25C). Around 3
hours post-dechorionation, the mutants straighten up and cannot be distinguished from their
wild-type siblings (Figure 25B) until assessed by touch response. The response of mutants to
touch worsens over time. However, the integrity of the muscles was also conserved in these
mutants as shown by birefringence (Figure 25D, E) and in-depth analysis of the skeletal muscle
components showcases no obvious defects (Figure 25F-I). The myofibrillar components like F-
actin, myosin, -actinin, -sarcoglycan were all properly localized and show no defects. Post
synaptic ACh receptors were labelled using florescent-conjugated alpha-bungarotoxin. Both
Chatatk64 and wild-type larvae show well developed postsynaptic receptor clusters (Figure 25J,
K).
Figure 24. Phenotype of slmtt208. Birefringence of slmtt208 mutants (A´) is similar to wild-type siblings (A). Immunohistochemistry with
phalloidin labeling F-actin (B, B´), A1025 labeling all muscle myosin (C, C´) at 48 hpf and -bungarotoxin (D, D´) and titin (F, F´) at 72 hpf do not reveal differences between wild-type (B, D, E,
F, G) and slmtt208 mutants (B´, D´, E´, F´, G´). Scale bars B, B´, C, C´, D, D´= 20 m and E, E´, F, F´, G,
G´= 6 m.

56
The presynaptic vesicular acetylcholine transporter responsible for transporting acetylcholine
into secretory vesicles is also not affected in the mutants (Figure 25L, M).
Figure 25. Phenotype of chatatk64. Wild-type embryo (A), chatatk64 mutant 3 hours after de-chorionation (B) and immediately after de-chorionation (C). Note that (B) is indistinguishable from (A). Birefringence is similar in wild-type (D) and chatatk64 mutant (E). Immunohistochemistry with phalloidin (red)
marking F-actin, and α-actinin (green) (F, G), -sarcoglycan (H, I), -bungarotoxin (J, K) and VAChT (L, M) do not reveal differences between wild-type (G, I, K, M) and chatatk64 mutant
(F, H, J, L) at 48 hpf. Scale bars F, G = 6 m, insert F, G = 2 m; H-K = 20 m.
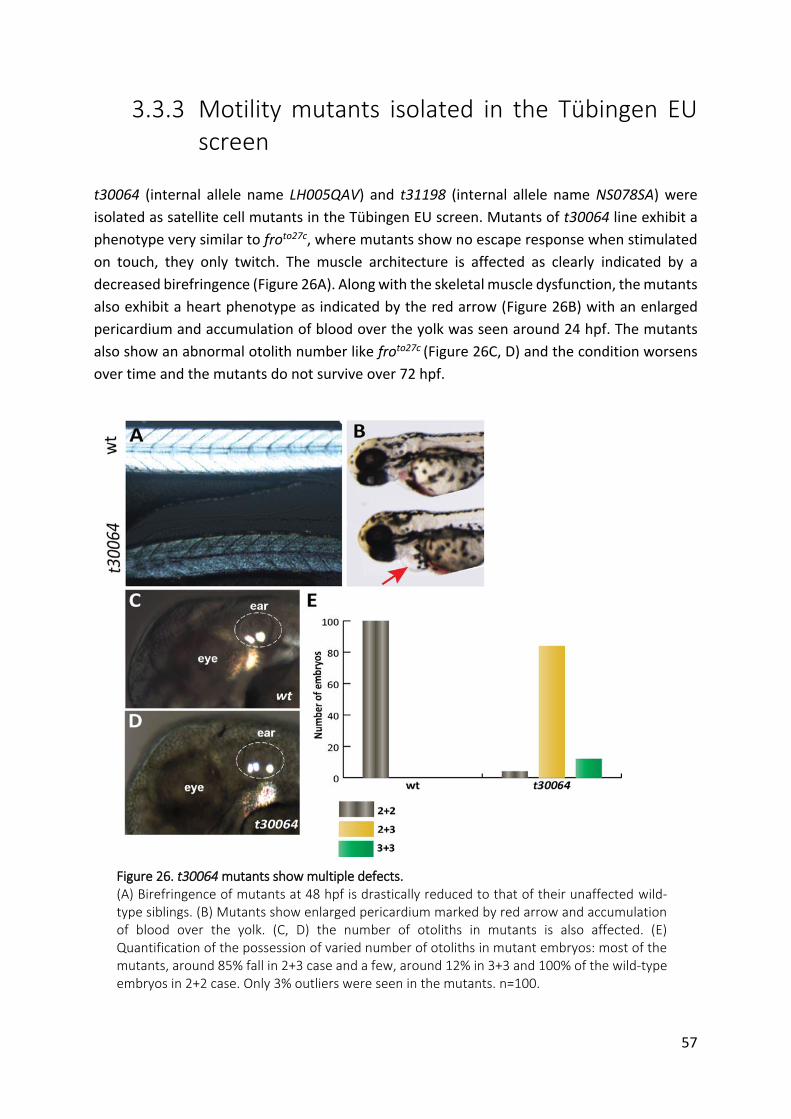
57
3.3.3 Motility mutants isolated in the Tübingen EU screen
t30064 (internal allele name LH005QAV) and t31198 (internal allele name NS078SA) were
isolated as satellite cell mutants in the Tübingen EU screen. Mutants of t30064 line exhibit a
phenotype very similar to froto27c, where mutants show no escape response when stimulated
on touch, they only twitch. The muscle architecture is affected as clearly indicated by a
decreased birefringence (Figure 26A). Along with the skeletal muscle dysfunction, the mutants
also exhibit a heart phenotype as indicated by the red arrow (Figure 26B) with an enlarged
pericardium and accumulation of blood over the yolk was seen around 24 hpf. The mutants
also show an abnormal otolith number like froto27c (Figure 26C, D) and the condition worsens
over time and the mutants do not survive over 72 hpf.
Figure 26. t30064 mutants show multiple defects. (A) Birefringence of mutants at 48 hpf is drastically reduced to that of their unaffected wild-type siblings. (B) Mutants show enlarged pericardium marked by red arrow and accumulation of blood over the yolk. (C, D) the number of otoliths in mutants is also affected. (E) Quantification of the possession of varied number of otoliths in mutant embryos: most of the mutants, around 85% fall in 2+3 case and a few, around 12% in 3+3 and 100% of the wild-type embryos in 2+2 case. Only 3% outliers were seen in the mutants. n=100.

58
Since this line shows a phenotype quite similar to froto27c, I had to verify that both lines carry
mutation on different genes. Thus, I performed complementation test by setting up 3
independent crosses between heterozygous froto27c and t30064 fishes. All three independent
crosses gave wild-type like embryos, clearly indicating that the mutations of both genes
complete each other and thus are two independent mutations responsible for the observed
phenotype. Further detailed study of the muscle structure shows a clear absence of muscle
fiber architecture in mutants (Figure 27A, A´). Immunostainings revealed disruption of both
slow and fast muscle fibers, only some residual striations were present (Figure 27B, C and B´,
C´ inserts). -actinin localized on Z-discs is completely disorganized in mutants at 48 hpf
(Figure 27D, D´ and E, E´ respectively), although integrity of myoseptal proteins is not affected
in the mutants as shown by immunostaining with -sarcoglycan antibody (Figure 27F, F´) at 48
hpf. Additionally, the nAchRs subunits and motor neurons do not show any obvious defects in
mutants at 72 hpf (Figure 27G, H, I and G´, H´, I´).
Figure 27. t30064 exhibits massive muscle wasting. (A, A´) Brightfield images of the mutant show absence of striated muscle fibers. At 48 hpf (B, B´) the slow muscle fibers are unorganized which can be seen in the zoomed inserts in the images, (C, C´) the fast fibers in mutants are also completely unorganized and only residual striations can be
seen in the mutants, (D, D´) all muscle myosin and (E, E´) -actinin are also completely disrupted,
(F, F´) -sarcoglycan is properly organized at the myosepta similar to their wild-type siblings. At 72 hpf, double staining for nAChR subunits and acetylated tubulin show no difference in mutants where (G, H, I) corresponds to wild-type siblings and (G´, H´, I´) to t30064. Double staining of F-actin (J, J´) and satellite cells (K, K´) shows a complete degradation of actin filament structure in mutants but no effect on the profile of satellite cells as seen in merged images (L, L´). Scale bars A-L, A´-L´ =
20 m; B-E, B´-E´ insert = 6 m.

59
As this line was identified as a satellite cell mutant, I investigated the number and profile of
satellite cells by performing double immunostaining for F-actin and Pax7 antibody (Figure 27L,
L´). At 72 hpf, mutants show almost no residual striations (Figure 27J, J´) and to our surprise
the number and location of satellite cells were also not affected in mutants (Figure 27K, K´).
Mutants from t31198 on the other hand also show an abnormal escape response
which worsens over time. The overall muscle architecture was not affected in the mutants as
indicated by birefringence (Figure 28A) which is similar to their wild-type siblings. At 5 dpf,
t31198 mutant embryos exhibit an uninflated swim bladder (Figure 28B) because of which the
mutants stay at the bottom of the cage and die around 14 dpf.
A detailed analysis of the muscle components revealed disrupted horizontal myosepta in
mutants as shown by the arrowheads (Figure 28C, D and Figure 29A´, B´). The slow muscle
(Figure 29A, A´) and fast muscle (Figure 29B, B´) fiber architecture was maintained in the
mutants although the myofibrils span across the defective somite boundaries and continue
until the next boundary to adhere to, as shown by arrows (Figure 29B´). Since nAchR subunits
are also present at the myosepta, immunostaining showed that the receptor localization
follows the pattern of broken myosepta in the mutants as shown in Figure 29C, C´.
Additionally, the satellite cell localization was also affected by the broken myosepta as the
satellite cells were also aligned to the broken myosepta as shown by dotted lines (Figure 29D,
Figure 28. Phenotype of t31198 mutants. (A) mutants do not reveal difference in birefringence to their wild-type siblings at 48 hpf. (B) At 120 hpf, mutants lack swim bladder (arrows). (C, D) Confocal brightfield image of mutants shows discontinuous horizontal
myosepta (arrowhead). Scale bar C, D = 30 m.
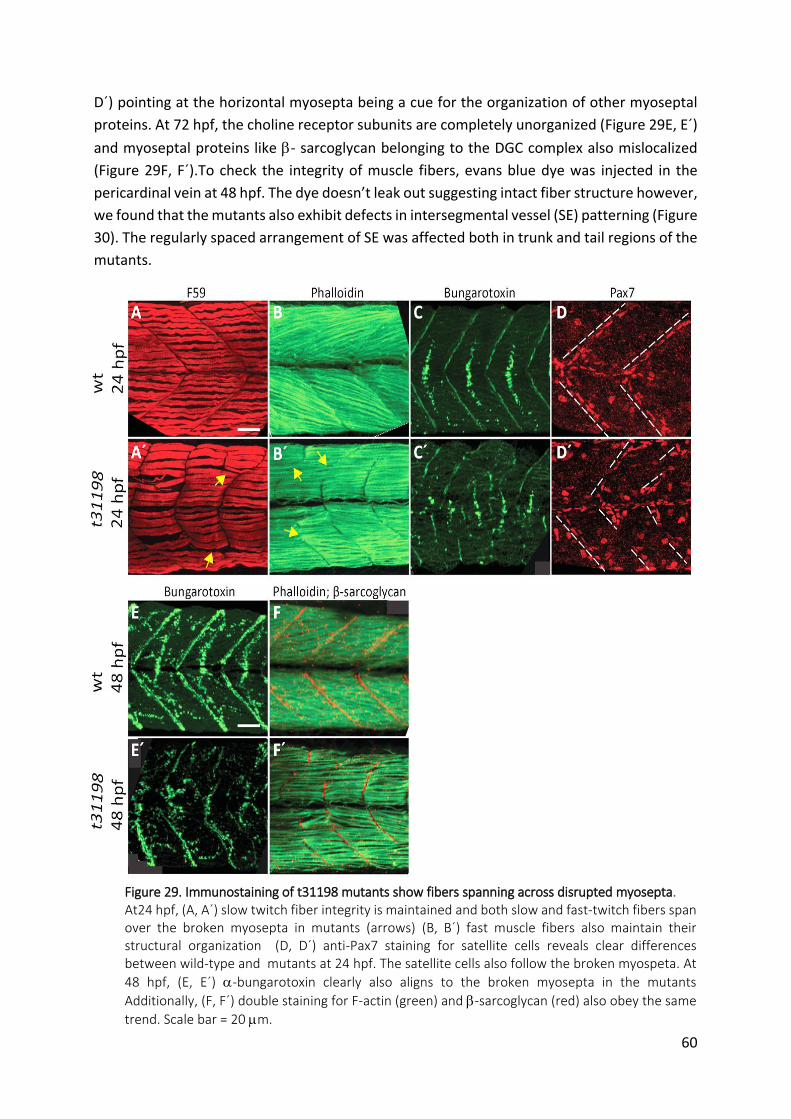
60
D´) pointing at the horizontal myosepta being a cue for the organization of other myoseptal
proteins. At 72 hpf, the choline receptor subunits are completely unorganized (Figure 29E, E´)
and myoseptal proteins like - sarcoglycan belonging to the DGC complex also mislocalized
(Figure 29F, F´).To check the integrity of muscle fibers, evans blue dye was injected in the
pericardinal vein at 48 hpf. The dye doesn’t leak out suggesting intact fiber structure however,
we found that the mutants also exhibit defects in intersegmental vessel (SE) patterning (Figure
30). The regularly spaced arrangement of SE was affected both in trunk and tail regions of the
mutants.
Figure 29. Immunostaining of t31198 mutants show fibers spanning across disrupted myosepta. At24 hpf, (A, A´) slow twitch fiber integrity is maintained and both slow and fast-twitch fibers span over the broken myosepta in mutants (arrows) (B, B´) fast muscle fibers also maintain their structural organization (D, D´) anti-Pax7 staining for satellite cells reveals clear differences between wild-type and mutants at 24 hpf. The satellite cells also follow the broken myospeta. At
48 hpf, (E, E´) -bungarotoxin clearly also aligns to the broken myosepta in the mutants
Additionally, (F, F´) double staining for F-actin (green) and -sarcoglycan (red) also obey the same
trend. Scale bar = 20 m.
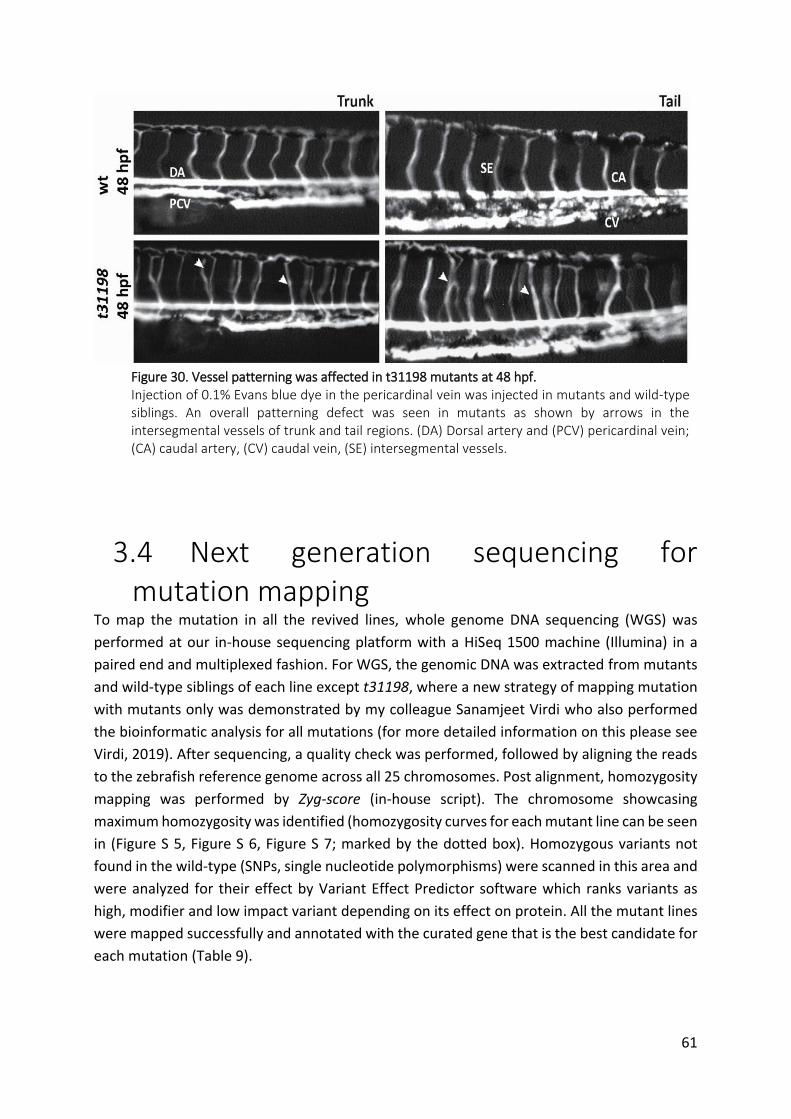
61
3.4 Next generation sequencing for mutation mapping
To map the mutation in all the revived lines, whole genome DNA sequencing (WGS) was
performed at our in-house sequencing platform with a HiSeq 1500 machine (Illumina) in a
paired end and multiplexed fashion. For WGS, the genomic DNA was extracted from mutants
and wild-type siblings of each line except t31198, where a new strategy of mapping mutation
with mutants only was demonstrated by my colleague Sanamjeet Virdi who also performed
the bioinformatic analysis for all mutations (for more detailed information on this please see
Virdi, 2019). After sequencing, a quality check was performed, followed by aligning the reads
to the zebrafish reference genome across all 25 chromosomes. Post alignment, homozygosity
mapping was performed by Zyg-score (in-house script). The chromosome showcasing
maximum homozygosity was identified (homozygosity curves for each mutant line can be seen
in (Figure S 5, Figure S 6, Figure S 7; marked by the dotted box). Homozygous variants not
found in the wild-type (SNPs, single nucleotide polymorphisms) were scanned in this area and
were analyzed for their effect by Variant Effect Predictor software which ranks variants as
high, modifier and low impact variant depending on its effect on protein. All the mutant lines
were mapped successfully and annotated with the curated gene that is the best candidate for
each mutation (Table 9).
Figure 30. Vessel patterning was affected in t31198 mutants at 48 hpf. Injection of 0.1% Evans blue dye in the pericardinal vein was injected in mutants and wild-type siblings. An overall patterning defect was seen in mutants as shown by arrows in the intersegmental vessels of trunk and tail regions. (DA) Dorsal artery and (PCV) pericardinal vein; (CA) caudal artery, (CV) caudal vein, (SE) intersegmental vessels.
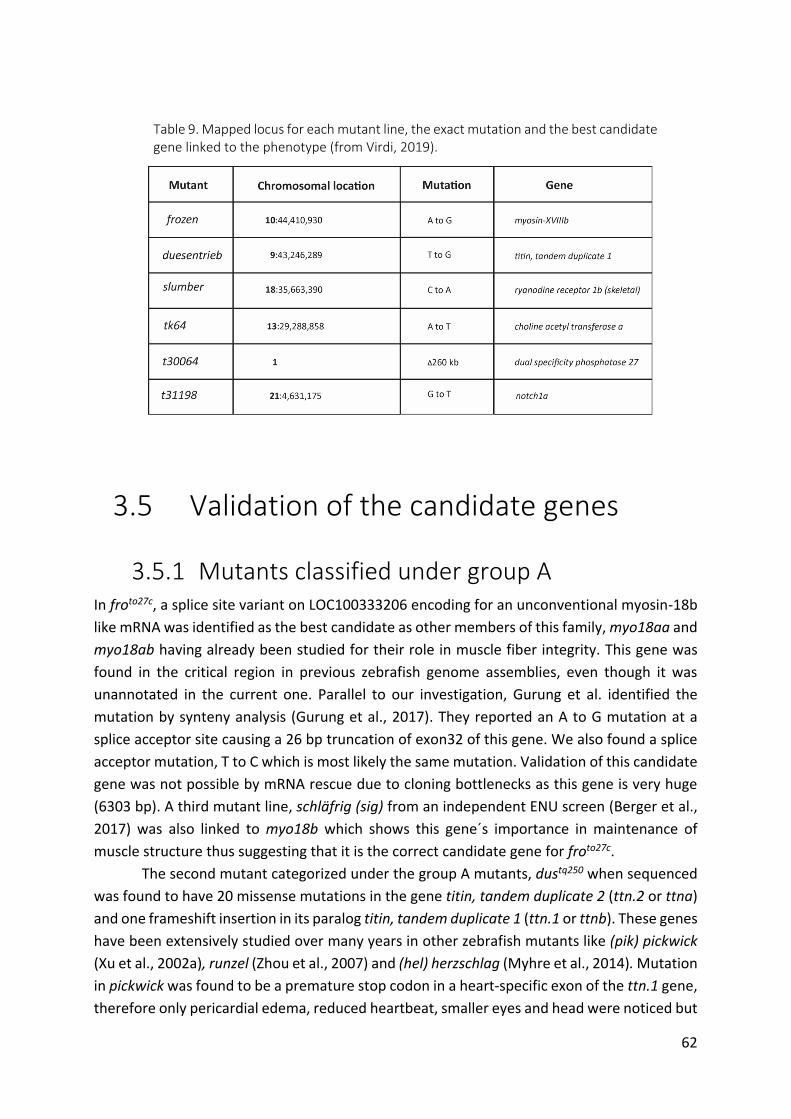
62
3.5 Validation of the candidate genes
3.5.1 Mutants classified under group A In froto27c, a splice site variant on LOC100333206 encoding for an unconventional myosin-18b
like mRNA was identified as the best candidate as other members of this family, myo18aa and
myo18ab having already been studied for their role in muscle fiber integrity. This gene was
found in the critical region in previous zebrafish genome assemblies, even though it was
unannotated in the current one. Parallel to our investigation, Gurung et al. identified the
mutation by synteny analysis (Gurung et al., 2017). They reported an A to G mutation at a
splice acceptor site causing a 26 bp truncation of exon32 of this gene. We also found a splice
acceptor mutation, T to C which is most likely the same mutation. Validation of this candidate
gene was not possible by mRNA rescue due to cloning bottlenecks as this gene is very huge
(6303 bp). A third mutant line, schläfrig (sig) from an independent ENU screen (Berger et al.,
2017) was also linked to myo18b which shows this gene´s importance in maintenance of
muscle structure thus suggesting that it is the correct candidate gene for froto27c.
The second mutant categorized under the group A mutants, dustq250 when sequenced
was found to have 20 missense mutations in the gene titin, tandem duplicate 2 (ttn.2 or ttna)
and one frameshift insertion in its paralog titin, tandem duplicate 1 (ttn.1 or ttnb). These genes
have been extensively studied over many years in other zebrafish mutants like (pik) pickwick
(Xu et al., 2002a), runzel (Zhou et al., 2007) and (hel) herzschlag (Myhre et al., 2014). Mutation
in pickwick was found to be a premature stop codon in a heart-specific exon of the ttn.1 gene,
therefore only pericardial edema, reduced heartbeat, smaller eyes and head were noticed but
Table 9. Mapped locus for each mutant line, the exact mutation and the best candidate gene linked to the phenotype (from Virdi, 2019).

63
skeletal muscles were not affected. The locus containing the mutation in hel was found to
contain the titin gene cassette, where the two paralogous copies of the gene, ttn.1 and ttn.2
were present. Since this mutant showed trunk muscle dystrophy along with pericardial edema,
the ttn.1 gene was the best candidate. hel and pik did not genetically complement each other,
confirming that they are mutant alleles of the same gene (Myhre et al., 2014). We compared
our mutant dustq250 with hel by performing genetic complementation. Three independent
crosses of heterozygous mutant hel+/- and dustq250 +/- adult fish were set up and the offspring
were assessed. We found that 98% of larvae were normal suggesting that both alleles could
complement each other. This led to the conclusion that the mutation dustq250 carries does not
affect the same locus as hel, as it could compensate the loss. Therefore ttn.2 is the more likely
candidate. However, since, titin is the largest protein known and shows heterogeneity of
phenotypes depending on the mutation (exon-dependent phenotypes) which could lead to
partial intragenic complementation, we could not confirm the exact mutation in the titin locus
responsible for the phenotype of dustq250.
3.5.2 Mutants classified under group B The slmtt208 line was sequenced by a mutant only strategy reducing the overall expense of
sequencing. 2 mutations were found to be of highest impact; a premature stop codon in ryr1b
and a splice site mutation in AL844192.1. The ryr1b gene encodes for one of the ryanodine
receptors which are a family of intracellular Ca2+ release channels that regulate the flux of Ca2+
from internal stores (endoplasmic and sarcoplasmic reticulum) to the cytosol (Ingham, 2009;
Wu et al., 2011). One of the five zebrafish ryr genes, ryr1b is expressed in both fast and slow
muscles functions in excitation-contraction coupling in striated muscles resulting in muscle
contraction. Embryonic development requires maintenance of Ca2+ gradients and mutations
in human homologs of RyRs affect Ca2+ influx and efflux causing cardiac diseases and
myopathies. On the other hand, AL844192 is a long intergenic non-coding RNA (lincRNA).
LincRNAs have been found to play an essential role in numerous biological processes and
transcriptomic studies in other model organisms point out their role in skeletal muscle
contraction, as well as targeting genes in muscle growth and development (Zou et al., 2017).
Since the muscle architecture of slmtt208 mutants was intact, ryr1b remained the best
candidate gene which could cause the defective motility in the larvae through abnormal levels
of calcium which would worsen with time eventually rendering the mutants completely
immotile. To check whether ryr1b is the right candidate gene responsible for the motility
defect in our mutant line, we revived an already existing Sanger mutant line, ryr1bsa14191
containing a stop codon in exon22 of this gene. A genetic complementation test was
performed between ryr1bsa14191+/- and slmtt208+/- heterozygous adult fishes. The phenotype
of the progeny from three such independent crosses was then assessed and we saw that 25%
of the embryos possessed a similar phenotype to slmtt208 homozygous mutants (i.e. they
couldn’t complement) suggesting that both are mutant alleles of ryr1b gene. This mutant was
thus a successful example of mapping without sequencing wild-type siblings.

64
The second mutant from this category, tk64 was sequenced in parallel with wild-type
siblings. Around 101 variants were identified, out of which after curating for effect of variants
only two missense mutants were left for our investigation. An A to C transversion in cxcl18a.1
gene (chemokine (C-X-C motif) ligand 18a, duplicate 1) and a T to A transversion in chata
(choline O-acetyl transferase a) gene was seen. Mutation in chata was predicted to be
deleterious in nature while that in cxcl18a.1 was tolerated. cxcl18a.1 belongs to a protein
family having chemokine activity whereas chata is a well-known gene involved in
neuromuscular transmission. This gene codes for an enzyme, choline O-acetyl transferase a
which catalysis the synthesis of a major neurotransmitter, acetylcholine (ACh). Mutations in
this gene are reported to have an effect on muscles in humans. An already existing chata
mutant in zebrafish called bajan was reported (Wang et al., 2008) containing a point mutation
(A to C) at the splice acceptor site of the second intron of chata. This line was revived by us for
performing genetic complementation testing. Three independent crosses of heterozygous
mutant bajan+/- and tk64 +/- adult fish were set up and the phenotype of offspring were
assessed. We found 25% of larvae were affected suggesting that both are mutant alleles of
chata gene. To further confirm, a rescue experiment was done by injecting wild-type mRNA
into the mutants and 99% rescue of the phenotype was seen (Figure 34 B) (Joshi et al., 2018).
3.5.2.1 tk64 was identified as a novel mutant allele of zebrafish chata
To find the exact cause of the observed phenotype we performed whole genome sequencing
at the NGS facility of KIT. The sequencing was done in a paired end, multiplexed manner. The
reads obtained were first checked for the quality (per base) and mapped for homozygosity.
The maximum homozygosity was found on chromosome 13 shown by the elevated orange
peak (Figure 31). The bioinformatic analysis was done by my colleague Sanamjeet Virdi, ITG,
KIT. The variants in this area were identified by comparing to the wild-type, and categorized
as low, modifier, or high impact variants with respect to their effect on the protein. After
careful curation, a T to A transversion giving rise to a serine to arginine substitution at position
102 in chata (choline-o-acetyl transferase a) was predicted to have a deleterious/high impact
effect on the protein. Also, the function of this gene perfectly fits to the observed phenotype.
In humans, mutations occurring in this gene correspond to a disease called congenital
myasthenic syndrome with episodic apnea (CMS-EA) causing muscle weakness and sudden,
recurrent episodes of respiratory arrest but a large number of these patients remain still
genetically undiagnosed due to clinical variabilities within patients.
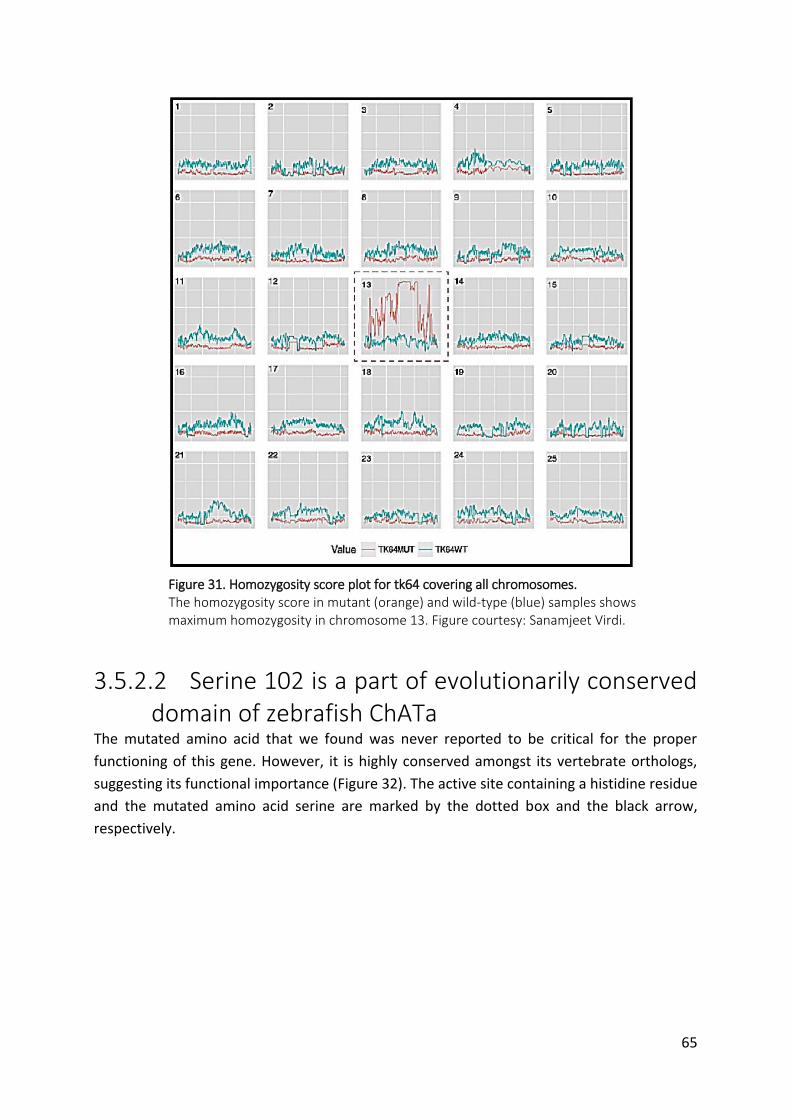
65
3.5.2.2 Serine 102 is a part of evolutionarily conserved domain of zebrafish ChATa
The mutated amino acid that we found was never reported to be critical for the proper
functioning of this gene. However, it is highly conserved amongst its vertebrate orthologs,
suggesting its functional importance (Figure 32). The active site containing a histidine residue
and the mutated amino acid serine are marked by the dotted box and the black arrow,
respectively.
Figure 31. Homozygosity score plot for tk64 covering all chromosomes. The homozygosity score in mutant (orange) and wild-type (blue) samples shows maximum homozygosity in chromosome 13. Figure courtesy: Sanamjeet Virdi.
a

66
3.5.2.3 Amino acid change from serine to arginine might affect protein stability
In silico analysis for protein conformation was done by my colleague Sanamjeet Virdi, using
several prediction programs, in order to determine the functional effect of the mutation on
the protein structure. Introducing a serine to arginine change was predicted to give an
unstable protein (Cutoff Scanning Matrix program (mCSM) (Pires et al., 2014). mCSM
measures the difference of the Gibbs free energy of unfolding between wild-type and mutant
proteins. The program predicted a stability change (ΔΔG) of -0.98 Kcal/mol, where the
negative value categorizes the change as destabilizing. The functional impact of the S102R
substitution was also checked with PANTHER-PSEP (Position-Specific Evolutionary
Preservation) v9.0 (Tang and Thomas, 2016) which predicted the change as “probably
damaging” because the position in the protein has been evolutionarily conserved for more
than 450 million years. The structure prediction of zebrafish ChATa was done using another
Figure 32. Multiple sequence alignment show conservation Vertebrate transcripts (residue range 50-349 in human 70kDa CHAT Isoform R, UniProtKB ID: P28329-3) showing that serine and histidine (active site) residues are highly conserved among zebrafish, human, mouse, rat and chicken. Figure courtesy: Sanamjeet Virdi.
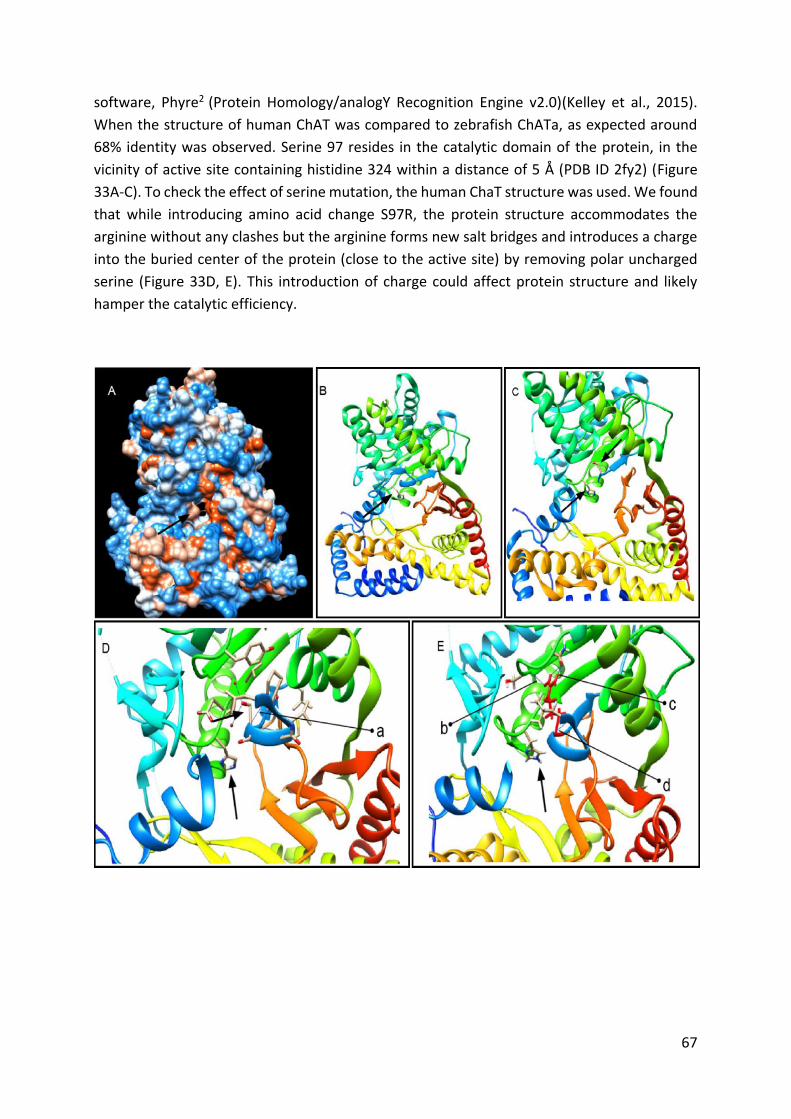
67
software, Phyre2 (Protein Homology/analogY Recognition Engine v2.0)(Kelley et al., 2015).
When the structure of human ChAT was compared to zebrafish ChATa, as expected around
68% identity was observed. Serine 97 resides in the catalytic domain of the protein, in the
vicinity of active site containing histidine 324 within a distance of 5 Å (PDB ID 2fy2) (Figure
33A-C). To check the effect of serine mutation, the human ChaT structure was used. We found
that while introducing amino acid change S97R, the protein structure accommodates the
arginine without any clashes but the arginine forms new salt bridges and introduces a charge
into the buried center of the protein (close to the active site) by removing polar uncharged
serine (Figure 33D, E). This introduction of charge could affect protein structure and likely
hamper the catalytic efficiency.
68
3.5.2.4 Complete rescue was achieved by injecting wild-type chata mRNA
To prove that the missense mutation found in chatatk64 is indeed responsible for the observed
phenotype, we performed rescue experiments. Wild-type chata and chatatk64 allele were
cloned from cDNA derived from wild-type and mutant embryos, respectively (Figure 34A).
Synthetic mRNAs of wild-type and mutant chatatk64 carrying the missense mutation were
injected into zygotes obtained from heterozygous chatatk64 incross. Embryos were examined
at 48 hpf for their motility by the touch response assay. Since chatatk64 is recessive, 25%
homozygous mutant embryos from crosses of heterozygous parents show the mutant
phenotype in uninjected controls (Figure 34B). However, only 1% of the embryos resulting
from such crosses injected with wild-type chata mRNA showed a motility defect upon touch,
suggesting behavioral rescue (Figure 34B). As expected, the S102R mutant chatatk64 mRNA did
not rescue the phenotype (Figure 34B) resulting in approximately 25% motility mutants, thus
confirming that the missense mutation causing S102R is responsible for the observed motility
phenotype. Surprisingly, in the course of our cDNA amplifications; we noted a shorter
fragment that is weakly present in PCR fragments amplified from wild-type and more strongly
in PCR fragments from mutant cDNA (Figure 34A). Sequencing of the PCR fragments revealed
that these shorter fragments represent the same mRNA variant that lacks exon3. This suggests
that this variant, henceforth called as ΔEx3, is naturally expressed in both wild-type and
mutants but its abundance is increased in the chatatk64 mutants. Because exon3 encodes part
of the catalytic site of ChAT, the deletion is predicted to abolish its enzymatic activity. To
exclude any possibility that this variant contributes to the observed motility phenotype, a
synthetic mRNA encoding ΔEx3 was injected into embryos derived
from chatatk64 heterozygous incross. This variant was unable to rescue the phenotype:
approximately 30% embryos showed the motility defect (Figure 34B). Moreover, the
remaining 70% of embryos did not show any additional defects, suggesting that at least under
these assay conditions ΔEx3 is non-functional and does not contribute to the observed motility
defect phenotype. Our results on tk64 have been published (Joshi et al., 2018).
Figure 33. Human ChAT protein crystal structure and predicted effect of the chatatk64mutation. (A) Front view of protein crystal structure of human ChAT showing catalytic tunnel and (B) active site histidine H324. Residues 90 to 391 comprise the catalytic domain according to the human ChAT protein structure PDB ID 2fy2 (90–394 in 70 kDa ChAT Isoform R, UniProtKB ID: P28329-3 (Kim et al., 2006). The length of the N-terminal domain of the protein differs by 118 residues from the canonical protein isoform M (UniProtKB ID: P28329-1) and the structure starts at residue 8 (Arredondo et al., 2015). (C) Serine residue in the vicinity of active site in the protein (residues 90–95 are removed from the structure for better visualization). (D) Wild-type serine residue S97 forming a salt bridge a = 1.80 Å with residue L92 (residues 88–91 and 235–243 are deleted from the structure for better visualization). (E) Serine to arginine mutation S97R after structure minimization in UCSF chimera. R97 (in red) forms a new H-bond with serine S307 b = 2.50 Å; salt bridge with L92 d = 1.80 Å; and two new H-bonds with glutamine 309 c = [2.43 Å and 1.64 Å] (residues 86–90 and 236–246 are deleted from the structure for better visualization).

69
Figure 34. Variants of chata mRNA and rescue of the mutant phenotype. A. cDNA fragments amplified by RT-PCR, left: Overlapping RT-PCR amplicons obtained with three different primer pairs (P1, P2 and P3). With each of the primer pairs two different PCR products, with and without exon3 were amplified from wild-type siblings, chatatk64 and unrelated wild-type cDNAs and confirmed by Sanger sequencing. From left, lane 1 wild-type siblings; lane 2: homozygous chatatk64; lane 3 and 4: unrelated wild-type embryos. Right: Schematic diagram of the sequenced PCR products of zebrafish chata, top: wild-type; middle: chatatk64; bottom: ΔEx3. For each of the primer pairs, the ΔEx3 product is more pronounced in the mutants than in the siblings or unrelated wild-types. B. Wild-type chata mRNA rescues the chatatk64 phenotype. Embryos were assessed with respect to their motility phenotype at 72 hpf after injection. In the wild-type mRNA injected embryos only 1% were mutants showing 99% rescue whereas the mRNA with missense mutation as in chatatk64 (Mut_chata) and lacking exon3 (ΔEx3_chata) gave a Mendelian ratio of mutants in the injected population. Significance was checked with Student's t-test at P<0.05. Asterisks and "n.s." above the bars represent significant and non-significant p values respectively. Data shown is mean ± standard deviation (n ≥ 17).

70
3.5.3 Mutants from the Tübingen EU screen t30064 was mapped to the telomere region of chromosome 1. Since telomeres are repetitive
areas and are not well annotated, there were many problems to pinpoint the exact candidate
as none of the genes could explain such a drastic muscle phenotype. Therefore, we performed
total RNA sequencing to check the transcriptomic profile of genes in mutants in comparison
to their wild-type siblings. Differential gene analysis revealed more than half of the top
differentially regulated genes to have a negative fold change value. These genes were found
to be clustered altogether on the telomere. To confirm the results of RNA sequencing, I
performed qPCR for 5 genes in this cluster and found that the mRNA of all these genes was
completely absent which indicated a big telomeric deletion of about 260 kilobases. While
comparing our results with previous genome assemblies (Zv9) in order to find the candidate
responsible for muscle defect, dusp27 (dual specificity phosphatase 27) was found. This gene
was missing in the latest assembly (GRCz11) and was located on KZ116034.1, an unplaced
scaffold. This gene was shown to be predominantly expressed in muscles and mutations in this
gene (duspy241) results in complete disorganization of sarcomere assembly and pericardial
edema in zebrafish (Fero et al., 2014) just like t30064 mutants. Since dusp27 is also a very huge
gene, cloning to rescue remained a bottleneck. The mutant line y241 was brought from ZIRC
to perform genetic complementation.
The other mutant line revived from this screen, t31198 exhibiting discontinuous
myosepta was mapped to chromosome 21 and three candidate genes were found where the
mutation with the highest impact was found to be a premature stop codon in the notch1a
gene. Among other candidate genes, kcnt1 (potassium channel, subfamily T, member 1)
encodes a voltage gated potassium channel having diverse functions from regulating
neurotransmitter release to smooth muscle contraction. Mutations found in these genes
cause seizures in humans (Lim et al., 2016). Segmentation of somites is under the control of
Delta-Notch signaling and zebrafish mutants showing segmentation defect predominantly fall
in this pathway (van Eeden et al., 1996). aei (after eight) mapped to deltaD, bea (beamter)
mapped to deltaC, des (deadly seven) mapped to notch1a and fss (fused somites) mapped to
tbx24 (Gray et al., 2001; Holley et al., 2000; Holley et al., 2002; Jülich et al., 2005; Nikaido et
al., 2002) all show somite boundary defects. Fss mutants survive to adulthood while des
mutants are late embryonically lethal like t31198 mutants. Since the segmentation clock is
controlled by oscillating delta and notch concentrations, notch1a having a stop codon was
selected to be the best candidate.

71
4 Discussion
4.1 Importance of guideRNA efficiency for gene editing
The guide RNA molecule (gRNA) is the major component of editing a DNA target using
CRISPR/Cas9 methodology. gRNAs bind to the target site via base complementarity, enabling
precise cleavage by Cas9. The principal requirement for the success of a CRISPR experiment is
the target accuracy and efficiency of the guide RNA chosen. Therefore, constant efforts are
made in the community for optimizing the design of gRNAs. Many studies have led to rules of
sequence composition of gRNA relating to its efficiency and validated them across many
locations. One such rule is that sgRNAs with more than 50% GC content and a guanine adjacent
to PAM show better activity whereas, one or two mismatches at the 5´ of the target hamper
its activity. Although many such rules are followed, studies have found that none of them are
statistically significant (Varshney et al., 2015a).
Many web based tools assist in designing sgRNA, such as CHOPCHOP, CRISPRscan and
CasBLASTR (Kleinstiver et al., 2015; Montague et al., 2014; Moreno-Mateos et al., 2015). Some
of these tools also take care of off-target matches and work only for a certain species. Others
are designed for multiple species. Avoiding polymorphisms to prevent problems with binding
of nucleases or primers, uniqueness of sequence to prevent off-targets recognition and
avoiding multiple CpG residues in the target sequence to keep the target accessible to
nucleases are three basic considerations for choosing a target in a gene to be manipulated
(Varshney et al., 2015c). Even though these tools effectively provide information on the best
locus-specific gRNA sequences with their probable efficiencies, the editing of the target loci is
still neither perfect nor very efficient in many cases.
In zebrafish, CRISPR/Cas9 has been successfully used for gene knockouts and recently
for knock-ins. Efficient gRNAs can generate bi-allelic mutations where the phenotypes of
recessive mutations were seen in the F0 generation immediately. This implies that the
efficiency of gRNAs could modulate phenotype visibility and hence is a crucial step for an

72
experiment. Due to the genome duplication in teleosts, to create zebrafish mutants; one
needs to target multiple genes at once to obtain complete knockouts, making the process
much more cumbersome. The standard procedure of screening for indels is often performed
in the F0 generations by analyzing the genomic DNA of adults. This procedure is time-
consuming as it requires a waiting time of about 2 months during which a possible inefficiency
of gRNA used in the experiment cannot be ruled out. This calls for the development of
sensitive, fast and reliable methods to evaluate the effectiveness of gRNAs. Moreover,
genotyping on a large scale to maintain mutant lines needs a cost-effective solution.
Several assays have been developed to identify mutations of target loci and the most
common method used was the DNA mismatch nuclease assay where T7 endonuclease (Jao et
al., 2013) and surveyor nuclease (Qiu et al., 2004) are used to identify mutants. However, while
this method is simple and cost effective it has poor specificity in zebrafish due to the very high
polymorphism. Restriction fragment length polymorphism (RFLP) can be used to screen target
mutagenicity (Hruscha et al., 2013) but this method is not design friendly as presence of a
restriction enzyme site at the target loci reduces the possible targets. Both of these techniques
do not provide precise information about the mutations. Recently an improvised technique,
HRMA (high resolution melting analysis), was successfully used to take the readout of guide
RNA efficacy as early as 4 h post injection (Parant et al., 2009; Samarut et al., 2016) in
zebrafish. This technique combined DNA extraction using the HotSHOT method with
fluorescent PCR reactions which monitors DNA denaturation at a very high resolution.
Regardless of all its advantages, a need for an expensive light cycler and requirement of
specific software for data analysis makes it unhandy for many laboratories.
To overcome all these limitations, we developed and applied TIDE (Tracking of Indels
by DEcomposition) to zebrafish, which was applied independently to cells earlier by Brinkman
et al., 2014. This method employs HotShOT to extract DNA from injected embryos followed
by PCR amplification of the target locus which is then subjected to capillary sequencing and
hence we call it PCR-F-SEQ in accordance to the sequential steps. Hence, we injected
previously known guides of variable efficiencies to assess the competence of the method. The
Sanger sequencing profiles were found to deviate around PAM for guides against rp2, bbs1
and pik3r4 whereas, guide against bbs4 do not. These deviations are due to profound
heterogeneity of bases at this location which is caused by the indels. The subcloned PCR
product for each guide was used to infer mutagenesis efficacy by randomly sequencing
subclones. As expected, high cutting efficacy indeed leads to a high number of mutant clones.
To quantify the cutting efficiency of individual guides, we exploited the degree of
deviation of peaks found close to the PAM site in Sanger sequencing derived
electropherograms. The peak intensities before and after PAM varies significantly and
therefore correlates well with the cutting efficiency. We also created an artificial mix of
variable percentages of wild-type and mutant fragments to understand the potential
detection window of this method. We found out that the method is quite robust and can
detect as little as 6% mutant fragment in the wild-type background.

73
Moreover, this technique could even detect a single indel and is very much capable of
deducing heterozygous fish by analyzing the chromatogram. In parallel, we developed an open
access webtool (accessible to the community) which provides clear information on
mutagenicity post injection. We thus demonstrated PCR-F-SEQ, a high-throughput method to
screen the gRNAs in zebrafish by quantitatively estimating their cutting efficiencies. This
method employs simple lab machinery and is rather cost effective.
4.2 Crispr/Cas9 and genetic robustness
To decipher the role of a gene, targeted interference with gene function has been widely used
in the zebrafish community. Two of the many strategies known namely, targeted knock down
and knock out of the gene have been employed. Transient knock down of gene function using
morpholinos, an antisense reagent has been rigorously used in countless studies. They bind to
target mRNAs and prevent their translation or splicing. Many morpholinos could efficiently
phenocopy well- characterized mutants and hence became the tool of choice for interfering
with the gene function. However, the occurrence of phenotypes caused by non-specific
binding to unintended targets could not be differentiated therefore, raising questions on
relying solely on them (Stainier and Schulte-Merker, 2014; Tao et al., 2011).
Meanwhile, our ability to evaluate gene function has been further heightened by the recent
advancements in the field of reverse genetics. Efficient tools like TALE nucleases (TALENs) and
the Crispr/Cas9 system have been implemented to generate targeted mutations. Even though
they can bind and cleave off-target loci, mutations can be segregated away from the mutation
of interest by subsequent outcrosses. The ease of generating mutants has provided an
opportunity to compare morphant with mutant phenotypes. Despite of the same goal of
functional inactivation, surprisingly many cases have supported the observation that these
strategies can result in different phenotypes. Also, an overwhelming number of engineered
mutants (knockouts) do not exhibit an obvious phenotype. Many mechanisms of such a
genetic robustness of engineered mutants have been proposed; functional redundancy,
genetic compensation and transcriptional adaptation being some of the major ones (El-
Brolosy and Stainier, 2017; Rossi et al., 2015; Tautz, 1992).
APOBEC2 belongs to a family of proteins some of which having RNA editing capability.
However, its target has remained elusive. It is abundantly expressed in skeletal muscles (Liao
et al., 1999; Wedekind et al., 2003) but initial studies in knockout mice exhibit no muscle
phenotype (Mikl et al., 2005b). To understand its role, another study on the same knockout
line was performed by Sato et al. (2010b). They found a shift of fiber type from fast to slow in
the soleus muscle of APOBEC2 deficient mice. Although the reduction of muscle mass and the
fiber type switch were evident at younger ages, the histological evidence was seen only at an
74
older age. A follow up study has shown that even though apobec2 is localized at Z-lines, the
sarcomeric structure in Apobec-deficient mice was not affected (Sato et al., 2018). Instead,
the deficiency of apobec2 causes mitochondrial defects leading to increased mitophagy in 10-
month-old mice.
Previous study in our group identified an interaction between muscle myosin, Unc45b
and Apobec2b (Etard et al., 2010). It was also shown by our group that Apobec2 proteins show
colocalization with Unc45b at the myoseptal boundaries which might act as an anchor for
muscle fibers. Knockdown of apobec2 genes in zebrafish leads to detachment of myofiber
from the boundaries. Other studies in zebrafish have shown apobec2 to be involved in
regulating retina and optic nerve regeneration independent of any cytosine deaminase
function that they could possibly have (Powell et al., 2012; Powell et al., 2014). Most of the
members of this protein family are involved in either DNA or RNA editing (Conticello, 2008)
but such a catalytic function of APOBEC2 has been questioned (Siriwardena et al., 2016).
In order to resolve such phenotypic discrepancies and to characterize the function of
the gene, we decided to establish a genetic knockout zebrafish model. Therefore, we
performed genetic manipulation of the apobec2a and apobec2b genes using the CRISPR/Cas9
technique. Various guide RNA combinations were used to delete large parts of the gene
(subsection 3.2.1). The only transmissible deletion was one affecting the splice junction
between exon 1 and intron 1 which was then further investigated. The other deletions could
probably be lethal/untolerated and therefore were not transmitted to the next generation.
We found that apobec2aka98/ka98 and apobec2bka99/ka99 single mutants do not show any
visible muscle defect. Also, there was no lethality observed. Therefore, a double knockout line
was established (apobec2aka98/ka98; apobec2bka99/ka99). To rule out the possibility of maternal
contribution, we further investigated the maternal-zygotic (MZ) apobec mutants. The MZ
mutants also do not recapitulate the morphant phenotype. A detailed examination of these
mutants did not show any obvious defects in muscle architecture, as shown by the
immunohistochemistry. Since it was also reported that loss of APOBEC2 led to defective
satellite cell self-renewability in mice (Ohtsubo et al., 2018), I also checked the profile of
satellite cells in double mutants by immunostaining using an antibody against Pax7, a marker
for quiescent satellite cells. The loss of Apobec2 in our mutants had no effect on the number
and location of satellite cells. Since in mice the phenotype progresses with age, we raised the
MZ mutants to adulthood and did not find any signs of lethargy or muscle weakness. However,
there is a need for performing in-depth analysis of mutants by subjecting them to stress in
order to check their overall muscle strength.
Investigating the effect of the mutations on the mRNA of apobec2a and 2b by RT-PCR
shows a complete loss of PCR products in mutant samples for both the genes. This complete
absence of PCR product indicates early mRNA degradation. To confirm the PCR results, in situ
hybridization using probes against apobec2a and 2b genes was performed. Interestingly, we
found that apobec 2b shows transient upregulation in apobec2a mutants at 24 hpf which

75
completely disappears by 48 hpf. This might suggest compensation by the paralogous gene,
which is frequently seen.
The phenotypic discrepancy between morphant and mutant could have several
reasons, morpholino off target effects being one of them. Morpholinos can prevent
translation of both maternal and zygotic transcripts and recent studies have shown that over
80% of morphant phenotypes could not be confirmed by genetic knockouts (Kok et al., 2015).
This disparity thus encourages us not to completely rely on morpholino based results.
For this project, in order to assess the specificity of morpholino and to evaluate the
effectiveness of our apobec2a MO, I injected it into apobec2bka99/ka99, into apobec2aka98/ka98;
apobec2bka99/ka99 double mutants and into wild-type as a control. Since an appropriate dose
of the morpholino had already been chosen in previous work and all controls had been
thoroughly performed (Etard et al., 2010), I used the same concentration for my experiments.
After injection, the embryos were analyzed and at 24 hpf about 80% of the embryos show a
dystrophic phenotype. A significant number of these show smaller eyes and curved body. This
might suggest a possible off-target effect of the MO or the possibility of a mutant transcript
being targeted, which would imply that the mutants are not null. Several different PCRs did
not support any such possibility but it cannot be completely ruled out.
The mechanisms underlying compensation in mutants are very complex and a non-
deleterious genomic lesion is not sufficient to trigger a genetic compensatory response (Rossi
et al., 2015). Since the mutants I developed have deleterious lesions, it might indicate an early
trigger for the machinery to cope with the loss by upregulating completely unrelated gene in
zebrafish. This could only be tested by looking at the transcriptomic profile of the mutants.
Another possibility of transcriptional adaptation is highly likely to occur in these
mutants if there is a mutant transcript being produced, as it has been recently reported that
RNA decay activates this process. It was seen that this is a dominant phenomenon as
heterozygous animals also display this kind of adaptation, just a little less pronounced to that
of the homozygotes (El-Brolosy et al., 2019). It was shown that only specific DNA lesions
regulate this adaptation as it was not seen in all mutant alleles of a gene. Pre-mRNA levels
were not affected and mutant transcripts exhibited shorter half- lives, clearly indicating
mutant mRNA decay. Alleles that fail to transcribe the mutated gene should not display such
an adaptation which points out that transcribed mRNA triggers this adaptation.
Transcriptomic profiling of many knockout models has indicated a consistent
correlation between sequence similarity and transcriptional adaptation (El-Brolosy et al.,
2019). To our surprise the mutated apobec2b mRNA was found to be upregulated in which
was unexpected since the genetic manipulation is supposed to generate premature stop
codon. This upregulation of apobec 2b mRNA therefore indicate a possible transcript being
generated.
76
This study thus indicates a need for further experiments comparing apobec2 mutants and
morphants to investigate whether the degradation of mutant mRNA is causing transcriptional
adaptation that suppresses the phenotype. It also indicates that the type of mutation induced,
plays a major role in triggering gene compensatory pathways.
Many of the human genetic diseases are caused by missense or in-frame insertions or
deletions (indels). The missense and indel mutations are unlikely to lead to mutant mRNA
degradation. Nonsense mutations on the other hand are less common and might lead to
mRNA decay and upregulation of related genes thus, suppressing the phenotype. This clearly
suggests that there is a need to generate missense mutations or indels in model organisms
and study them with a view of better understanding disease pathology in humans.
4.3 Forward genetics: a window to novelty?
Forward genetics begins with a heritable trait of interest and strives to discover the alleles
accounting for the observed defect using genetic mapping. It is one of the most powerful
methods to enable understanding of the genetic basis of various human diseases (Moresco et
al., 2013). Phenotypic driven research has led to various novel and unexpected discoveries. In
zebrafish, two large-scale random mutagenesis screens performed in the 1990s identified
thousands of mutants and established zebrafish as a mainstream model for development
biology research (Driever et al., 1996; Haffter et al., 1996a).
Tübingen Ist and IIIrd ENU mutagenesis screens produced together over 2000 mutants and
many of these alleles were stored as frozen sperm samples due to limited space, resources
and phenotypic variability of the isolated mutants. These mutant lines are not yet analyzed
and therefore serve as a great tool for identifying novel developmentally relevant genes. In
this study we revived mutant lines showcasing mobility defects. We found out that the
revivability of sperm samples varies quite a lot between different Tübingen screen (TU)
samples. We revived a total of 10 lines and found that the revivability rate of samples from
the Ist and IIIrd TU screens is about 66% and 40% respectively. As an additional difficulty, we
noticed the Tübingen background to be behaviorally quite aggressive. Therefore, while
crossing we either resorted to separating the fishes quickly after mating or we kept a small
fiber ball in the mating box to provide hiding space. Once the mutant couples were identified,
to detect the gene linked to phenotype remained a bottleneck for such studies over the years.
Traditionally, mapping the underlying mutations was a labor-intensive task which took
several months and occasionally even years. However, the methods of mapping have evolved
with the technological advancements and next generation sequencing based approaches,
which has enabled fast and accurate mapping. Whole genome sequencing thus is a promising
approach for discovering genetic perturbations. Massively parallel sequencing technology
supports multiplexing the samples but the abundance of data that is generated requires

77
resources for data storage along with computational expertise for further analysis (Clark et al.,
2011).
Recent advances in single nucleotide polymorphism algorithms have enabled fast
mapping and cloning of recessive ENU mutations (Bowen et al., 2012; Leshchiner et al., 2012;
Voz et al., 2012). Therefore, in this research work a robust bioinformatic pipeline, `Zyg-score’
was developed which can consistently and accurately map the mutations, independent to the
different experimental strategies (sequencing wild-type and mutant pools or sequencing only
mutant pools obtained from different couples). The novel strategy of sequencing only mutants
is cost-efficient and allows one to buy increased sequencing coverage (S. Virdi, 2019;
manuscript in preparation). The six revived mutant lines were successfully mapped (Table 9),
slmtt208 using novel mutant only strategy. Curiously, most of them were alleles of already
known genes which might indicate that the identified genes are mutational ‘hot spots’, and
more effort is needed to saturate the genome. Screening for unique phenotypes can be
another way to identify novel genes.
However, some pitfalls have been realized that limit the use of these random mutagenesis
approaches. One of the major disadvantages of this approach is that it relies completely on
the zebrafish genome assembly. To annotate the variants, it becomes a necessity to have an
accurate genome assembly to prevent missing of the candidate gene. Apart from that, the
depth and integrity of such screens is also limited because it is impossible to incapacitate every
gene in the genome by random mutagenesis as these screens rely on measurable phenotypes
which can be missing in case of redundant loci or early compensation.
4.4 Postmeiotic mutagenesis: deletion in
t30064
N-ethyl-N-nitrosourea (ENU), the DNA alkylating agent is the most widely used chemical
mutagen for introducing point mutations. In zebrafish, the mutations are induced in the
spermatogonia stem cells which is achieved by repeated treatment of adult males at weekly
intervals followed by a brief gap before mating (Mullins et al., 1994b; Solnica-Krezel et al.,
1994). This waiting period is extremely important to eliminate the affected post-meiotic germ
cells which fixes the mutations and leads to non-mosaic off springs in the next generation. A
great majority of the pre-meiotic mutations are point mutations suitable for functional
analysis of the genes.
Post meiotic ENU mutagenesis on the other hand, is accomplished by quick mating (~2
weeks) after a single treatment (Alexander et al., 1998; Appel et al., 1999). The range of
mutations induced in this way has not been extensively analyzed. Such a mutagenesis
approach leads to mosaic progeny and non-Mendelian transmission which makes the

78
screening difficult. In the early 2000s it was reported that postmeiotic mutagenesis using ENU
can cause wide spectrum of lesions including big deletions (Imai et al., 2000). Among a total
of five alleles that were found in their screen, four were deletions ranging from < 3cM to ≥ 20
cM. The reason for the observed difference in lesion type in pre and postmeiotic treatments
could be due one of the several reasons: due to the chromatin conformation, ploidy of sperm
cells and spermatogonia or different DNA repair pathways. Similar effects were seen in mice
as well as in medaka suggesting that the sperm stage determines the type of mutation induced
(Russell et al., 1989; Shimada and Shima, 1998).
To our surprise, one of the revived mutants from the 3rd Tübingen screen, t30064, was
found to have a large deletion on the telomere of LG1. Although the screen primarily was
based on mutagenizing premeiotic sperm cells, this rare case highlights the heterogeneity that
one should expect while dealing with mutants from such screens.
The deleted locus consists of a tightly packed cluster of about 17 genes which were
found to be completely absent in our qPCR data. Several different BACs covering genes in this
region were injected into the progeny of heterozygous parents, but none of them could rescue
the muscle defect. Our search for the right candidate brought us to search in older genome
assemblies for a gene in this area that might be a possible candidate for such a phenotype. As
we anticipated, a gene called dual specificity phosphatase 27 (dusp27) was missing in this
region in the current assembly. This gene was included in an unplaced scaffold whereas in
older assemblies, it was in the telomeric region of chromosome 1. Loss of this gene is known
to lead to massive disruption of myofibrils causing compromised motility in zebrafish (Fero et
al., 2013). Due to the humungous size of this gene, cloning for rescue purposes was not
possible and apart from that, a BAC containing this gene was also not available. However, a
dusp27 mutant line was imported from ZIRC. It has been revived and will be used for
complementation testing.
4.5 Modeling human diseases in zebrafish A myriad of mutants with disruption of conserved genes analogous to human disease loci were
identified in chemical mutagenesis screens (Amsterdam and Hopkins, 2006; Haffter et al.,
1996b; Santoriello and Zon, 2012). Genomic approaches have helped in identifying several
gene variants in disease pathology and have been proofread in zebrafish.
Muscle mutants emerged from these screens that serve as excellent models for many
of the diseases. sapje (dystrophin) for Duchenne muscular dystrophy and Becker muscular
dystrophy (Bassett and Currie, 2003; Berger et al., 2010; Guyon et al., 2009), laminin α2
(candyfloss) for congenital muscular dystrophy type 1A (MDC1A) and (LGMD) Limb-girdle
muscular dystrophy (Hall et al., 2007), dystroglycan 1 (dag1, also named patchytail) also for

79
LGMD (Gupta et al., 2011). In our screening, we have found another allele for ryr1b gene which
has been reported to be a model for a myotonic muscular dystrophy (MmD), central core
disease (CCD) (Hirata et al., 2007) NOTCH1 mutations in humans causes either Adams-Oliver
syndrome or cardiovascular defects (Kerstjens-Frederikse et al., 2016; Stittrich et al., 2014).
Another zebrafish mutant allele of notch1a was identified in our study which shows a
similar phenotype to that of other already reported alleles (Therapontos and Vargesson,
2010). Titin is a huge protein and plays developmental, regulatory, structural and mechanical
roles in cardiac and skeletal muscles (Ferreiro, 2016). Due to its gigantic size and complexity
the spectrum of diseases caused by mutations in this gene was initially underestimated.
Mutations in this gene in humans are linked to cardiomyopathies, titinopathy, limb-girdle
muscular dystrophy type 2J (LGMD2J), congenital centronuclear myopathy (CNM) and many
more (Gigli et al., 2016; LeWinter and Granzier, 2013). Homozygous mutant mice for this gene
exhibit progressive muscle degeneration (Charton et al., 2010; Garvey et al., 2001). Zebrafish
mutant models like runzel and pickwick showcase myofibrillar disorganization and
cardiomyopathy respectively. (Steffen et al., 2007; Xu et al., 2002b). We have reported
another allele of this gene showing none of the phenotypes researched earlier. The mutant
exhibits a motility defect but no obvious muscle or heart defects are seen. Due to the presence
of extensive genetic variability, it is rather a challenge to determine disease causing mutations.
These disease models can serve as a great platform for assessing drug efficacies since
zebrafish showcases comparable effects with the drugs that are used to treat human diseases
(Lin, 2012).
Another gene, CHAT, has been associated with congenital myasthenic syndrome associated
with episodic apnea (CMS-EA) (Ohno et al., 2001). We have reported a new allele of this gene
which is conserved in humans. The CHAT gene in humans has also been recently associated
with an increased risk of Alzheimer’s disease (Hálová et al., 2018; Poirel et al., 2018) and
therefore, it is rather important to report novel alleles which might add information to better
understand the pathology of human diseases. Another zebrafish ChAT mutant, bajtf247c (bajan)
was reported to have a splice site mutation creating an early stop codon upstream of the
catalytic site. Thus, the entire protein is eliminated. In contrast chatatk64 is a missense
mutation in the catalytic domain of the enzyme. This mutation is situated close to the catalytic
tunnel and identifies thus an important amino acid for proper functioning of the enzyme. Since
no other mutant alleles are reported and zebrafish ChAT morphants are lethal, it is therefore
a better model for human presynaptic CMS and might help in discovering therapeutic
compounds for this disease.
80
5 Future
perspectives This thesis has utilized both reverse and forward genetic approaches to understand muscle
development and function. In order to understand the molecular function and putative
deaminase activity of the apobec2a/b genes in zebrafish, I created genetic knockouts.
Contrary to our previous finding with morpholinos, apobec2a/b maternal-zygotic double
mutants did not show any defects. Neither the muscle architecture nor stem cells were
affected in the mutants which diverges from the recent findings in mice (Ohtsubo et al., 2017;
Sato et al., 2018).
Due to the type of mutation which was introduced in these genes, i.e., deletion of
splice junctions, it becomes extremely important to check the mRNA splicing in order to
understand clearly if there any cryptic splice site is utilized; giving rise to transcripts that might
still be functional. For this purpose, RNA sequencing will not only reveal alternately spliced
products but also throw a light on differentially regulated genes. Any transcriptional
adaptation would be clearly represented in such a data.
Apobec2 deficient mice exhibit a mild phenotype only in older stages and therefore, it
becomes necessary to check the muscle sections of adult zebrafish mutants. Apart from
histological studies, muscle integrity of the adults can be assessed by a swim tunnel assay
(Mwaffo et al., 2017; Palstra et al., 2011).
Since the double mutants show transient upregulation of apobec2 mRNA; it will be
extremely informative to check the profile of these genes in single mutants. We have seen
that apobec2a morpholino injections in both apobec2bka99/ka99 and apobec2aka98/ka98;
apobec2bka99/ka99 could replicate the original morphant phenotype and to determine whether
this is due to MO off-target effects, mutants lacking MO binding site can be created and
assessed for a phenotype upon injections. Since the double mutants still contain the apobec2a
morphant binding site, this cannot clearly invalidate the morpholino effect.

81
We have utilized the Tübingen screens as a valuable resource for studying
developmentally relevant genes and have come across an uncommon deletion case. We have
hypothesized that the dusp27 gene is responsible for the muscle phenotype in t30064 mutant.
This will be confirmed by complementation testing with a dusp27 line imported from ZIRC.
froto27c and t30064 share a similar muscle and ear phenotype but are linked to different
chromosomes. The unconventional myosin, myo18b, mutated in froto27c has not been
reported to play a role in inner ear development. Therefore, deciphering its role in otolith
development and function might be another direction to explore.

82
6 References
Alexander, J., Stainier, D. Y. R. and Yelon, D. (1998). Screening mosaic F1 females for mutations affecting zebrafish heart induction and patterning. Dev. Genet.
Amack, J. D. and Yost, H. J. (2004). The T box transcription factor no tail in ciliated cells controls zebrafish left-right asymmetry. Curr. Biol.
Amsterdam, A. and Hopkins, N. (2006). Mutagenesis strategies in zebrafish for identifying genes involved in development and disease. Trends Genet.
Appel, B., Fritz, A., Westerfield, M., Grunwald, D. J., Eisen, J. S. and Riley, B. B. (1999). Delta-mediated specification of midline cell fates in zebrafish embryos. Curr. Biol.
Barrangou, R., Fremaux, C., Deveau, H., Richards, M., Boyaval, P., Moineau, S., Romero, D. A. and Horvath, P. (2007). CRISPR provides acquired resistance against viruses in prokaryotes. Science (80-. ).
Bassett, D. I. and Currie, P. D. (2003). The zebrafish as a model for muscular dystrophy and congenital myopathy. Hum. Mol. Genet. 12, R265–R270.
Berger, J., Berger, S., Hall, T. E., Lieschke, G. J. and Currie, P. D. (2010). Dystrophin-deficient zebrafish feature aspects of the Duchenne muscular dystrophy pathology. Neuromuscul. Disord.
Berger, J., Sztal, T. and Currie, P. D. (2012). Quantification of birefringence readily measures the level of muscle damage in zebrafish. Biochem. Biophys. Res. Commun.
Berger, J., Berger, S., Li, M. and Currie, P. D. (2017). Myo18b is essential for sarcomere assembly in fast skeletal muscle. Hum. Mol. Genet.
Bernhardt, R. R., Chitnis, A. B., Lindamer, L. and Kuwada, J. Y. (1990). Identification of spinal neurons in the embryonic and larval zebrafish. J. Comp. Neurol.
Bhattacharya, M. R. C., Bautista, D. M., Wu, K., Haeberle, H., Lumpkin, E. A. and Julius, D. (2008). Radial stretch reveals distinct populations of mechanosensitive mammalian somatosensory neurons. Proc. Natl. Acad. Sci. 105, 20015 LP – 20020.
Blagden, C. S., Currie, P. D., Ingham, P. W. and Hughes, S. M. (1997). Notochord induction of zebrafish slow muscle mediated by sonic hedgehog. Genes Dev.
Boch, J., Scholze, H., Schornack, S., Landgraf, A., Hahn, S., Kay, S., Lahaye, T., Nickstadt, A. and Bonas, U. (2009). Breaking the code of DNA binding specificity of TAL-type III effectors. Science (80-. ).
Bowen, M. E., Henke, K., Siegfried, K. R., Warman, M. L. and Harris, M. P. (2012). Efficient
83
mapping and cloning of mutations in zebrafish by low-coverage whole-genome sequencing. Genetics.
Briggs, A. W., Rios, X., Chari, R., Yang, L., Zhang, F., Mali, P. and Church, G. M. (2012). Iterative capped assembly: Rapid and scalable synthesis of repeat-module DNA such as TAL effectors from individual monomers. Nucleic Acids Res.
Brinkman, E. K., Chen, T., Amendola, M. and Van Steensel, B. (2014). Easy quantitative assessment of genome editing by sequence trace decomposition. Nucleic Acids Res.
Cermak, T., Doyle, E. L., Christian, M., Wang, L., Zhang, Y., Schmidt, C., Baller, J. A., Somia, N. V., Bogdanove, A. J. and Voytas, D. F. (2011). Efficient design and assembly of custom TALEN and other TAL effector-based constructs for DNA targeting. Nucleic Acids Res.
Chakrabarti, S., Streisinger, G., Singer, F. and Walker, C. (1983). Frequency of γ-ray induced specific locus and recessive lethal mutations in mature germ cells of the zebrafish, brachydanio rerio. Genetics 103, 109–123.
Chal, J. and Pourquié, O. (2017). Making muscle: skeletal myogenesis <em>in vivo</em> and <em>in vitro</em> Development 144, 2104 LP – 2122.
Charton, K., Danièle, N., Vihola, A., Roudaut, C., Gicquel, E., Monjaret, F., Tarrade, A., Sarparanta, J., Udd, B. and Richard, I. (2010). Removal of the calpain 3 protease reverses the myopathology in a mouse model for titinopathies. Hum. Mol. Genet.
Chemello, F., Bean, C., Cancellara, P., Laveder, P., Reggiani, C. and Lanfranchi, G. (2011). Microgenomic Analysis in Skeletal Muscle: Expression Signatures of Individual Fast and Slow Myofibers. PLoS One 6, e16807.
Clark, M. D., Guryev, V., Bruijn, E. de, Nijman, I. J., Tada, M., Wilson, C., Deloukas, P., Postlethwait, J. H., Cuppen, E. and Stemple, D. L. (2011). Single nucleotide polymorphism (SNP) panels for rapid positional cloning in zebrafish. In Methods in Cell Biology, .
Comyn, S. A. and Pilgrim, D. (2012). Lack of Developmental Redundancy between Unc45 Proteins in Zebrafish Muscle Development. PLoS One.
Cong, L., Ran, F. A., Cox, D., Lin, S., Barretto, R., Habib, N., Hsu, P. D., Wu, X., Jiang, W., Marraffini, L. A., et al. (2013). Multiplex genome engineering using CRISPR/Cas systems. Science 339, 819–823.
Conticello, S. G. (2008). The AID/APOBEC family of nucleic acid mutators. Genome Biol. 9, 229.
Coste, B., Mathur, J., Schmidt, M., Earley, T. J., Ranade, S., Petrus, M. J., Dubin, A. E. and Patapoutian, A. (2010). Piezo1 and Piezo2 are essential components of distinct mechanically activated cation channels. Science (80-. ).
Daggett, D. F., Domingo, C. R., Currie, P. D. and Amacher, S. L. (2007). Control of morphogenetic cell movements in the early zebrafish myotome. Dev. Biol.
Demarest, S. T. and Brooks-Kayal, A. (2018). From molecules to medicines: the dawn of targeted therapies for genetic epilepsies. Nat. Rev. Neurol.
Devoto, S. H., Melançon, E., Eisen, J. S. and Westerfield, M. (1996). Identification of separate slow and fast muscle precursor cells in vivo, prior to somite formation. Development.
DiFrancesco, D. and Noble, D. (1985). A model of cardiac electrical activity incorporating ionic pumps and concentration changes. Philos. Trans. R. Soc. Lond. B. Biol. Sci.
Doyon, Y., McCammon, J. M., Miller, J. C., Faraji, F., Ngo, C., Katibah, G. E., Amora, R., Hocking, T.
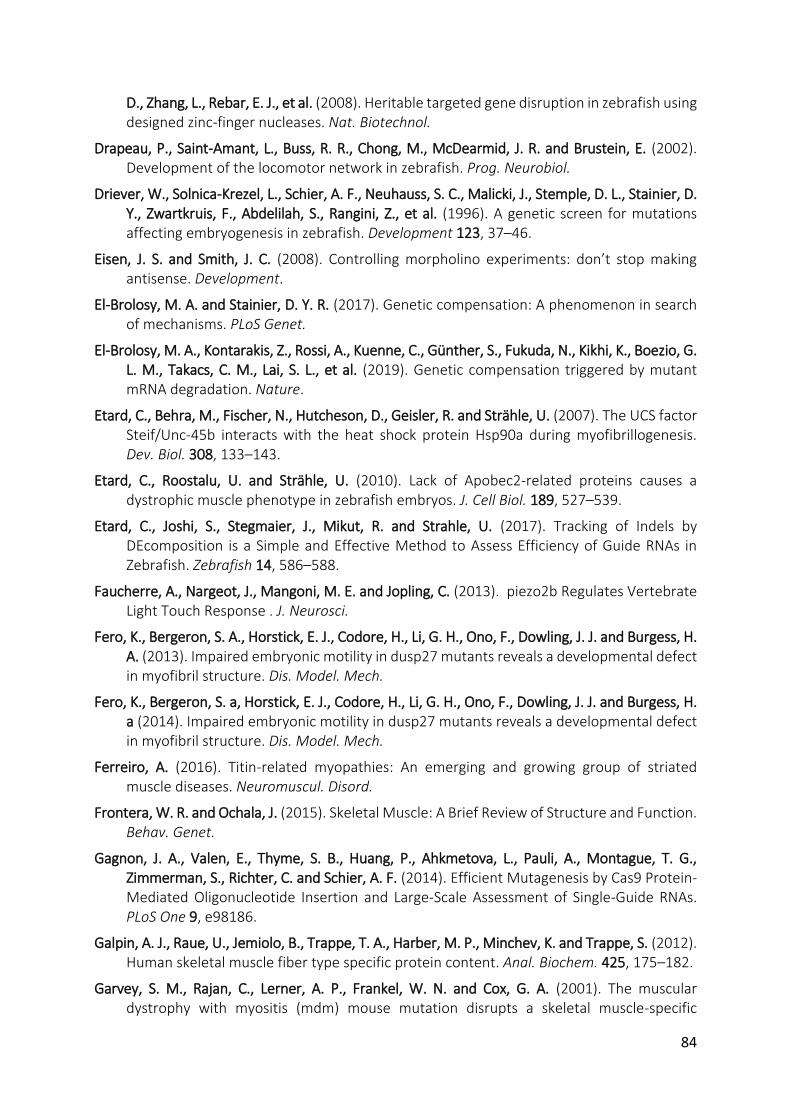
84
D., Zhang, L., Rebar, E. J., et al. (2008). Heritable targeted gene disruption in zebrafish using designed zinc-finger nucleases. Nat. Biotechnol.
Drapeau, P., Saint-Amant, L., Buss, R. R., Chong, M., McDearmid, J. R. and Brustein, E. (2002). Development of the locomotor network in zebrafish. Prog. Neurobiol.
Driever, W., Solnica-Krezel, L., Schier, A. F., Neuhauss, S. C., Malicki, J., Stemple, D. L., Stainier, D. Y., Zwartkruis, F., Abdelilah, S., Rangini, Z., et al. (1996). A genetic screen for mutations affecting embryogenesis in zebrafish. Development 123, 37–46.
Eisen, J. S. and Smith, J. C. (2008). Controlling morpholino experiments: don’t stop making antisense. Development.
El-Brolosy, M. A. and Stainier, D. Y. R. (2017). Genetic compensation: A phenomenon in search of mechanisms. PLoS Genet.
El-Brolosy, M. A., Kontarakis, Z., Rossi, A., Kuenne, C., Günther, S., Fukuda, N., Kikhi, K., Boezio, G. L. M., Takacs, C. M., Lai, S. L., et al. (2019). Genetic compensation triggered by mutant mRNA degradation. Nature.
Etard, C., Behra, M., Fischer, N., Hutcheson, D., Geisler, R. and Strähle, U. (2007). The UCS factor Steif/Unc-45b interacts with the heat shock protein Hsp90a during myofibrillogenesis. Dev. Biol. 308, 133–143.
Etard, C., Roostalu, U. and Strähle, U. (2010). Lack of Apobec2-related proteins causes a dystrophic muscle phenotype in zebrafish embryos. J. Cell Biol. 189, 527–539.
Etard, C., Joshi, S., Stegmaier, J., Mikut, R. and Strahle, U. (2017). Tracking of Indels by DEcomposition is a Simple and Effective Method to Assess Efficiency of Guide RNAs in Zebrafish. Zebrafish 14, 586–588.
Faucherre, A., Nargeot, J., Mangoni, M. E. and Jopling, C. (2013). piezo2b Regulates Vertebrate Light Touch Response . J. Neurosci.
Fero, K., Bergeron, S. A., Horstick, E. J., Codore, H., Li, G. H., Ono, F., Dowling, J. J. and Burgess, H. A. (2013). Impaired embryonic motility in dusp27 mutants reveals a developmental defect in myofibril structure. Dis. Model. Mech.
Fero, K., Bergeron, S. a, Horstick, E. J., Codore, H., Li, G. H., Ono, F., Dowling, J. J. and Burgess, H. a (2014). Impaired embryonic motility in dusp27 mutants reveals a developmental defect in myofibril structure. Dis. Model. Mech.
Ferreiro, A. (2016). Titin-related myopathies: An emerging and growing group of striated muscle diseases. Neuromuscul. Disord.
Frontera, W. R. and Ochala, J. (2015). Skeletal Muscle: A Brief Review of Structure and Function. Behav. Genet.
Gagnon, J. A., Valen, E., Thyme, S. B., Huang, P., Ahkmetova, L., Pauli, A., Montague, T. G., Zimmerman, S., Richter, C. and Schier, A. F. (2014). Efficient Mutagenesis by Cas9 Protein-Mediated Oligonucleotide Insertion and Large-Scale Assessment of Single-Guide RNAs. PLoS One 9, e98186.
Galpin, A. J., Raue, U., Jemiolo, B., Trappe, T. A., Harber, M. P., Minchev, K. and Trappe, S. (2012). Human skeletal muscle fiber type specific protein content. Anal. Biochem. 425, 175–182.
Garvey, S. M., Rajan, C., Lerner, A. P., Frankel, W. N. and Cox, G. A. (2001). The muscular dystrophy with myositis (mdm) mouse mutation disrupts a skeletal muscle-specific

85
domain of titin. Genomics.
Gigli, M., Begay, R. L., Morea, G., Graw, S. L., Sinagra, G., Taylor, M. R. G., Granzier, H. and Mestroni, L. (2016). A Review of the Giant Protein Titin in Clinical Molecular Diagnostics of Cardiomyopathies . Front. Cardiovasc. Med. 3, 21.
Goody, M. F., Carter, E. V, Kilroy, E. A., Maves, L. and Henry, C. A. (2017). “Muscling” Throughout Life: Integrating Studies of Muscle Development, Homeostasis, and Disease in Zebrafish. Curr. Top. Dev. Biol. 124, 197–234.
Granato, M., van Eeden, F. J., Schach, U., Trowe, T., Brand, M., Furutani-Seiki, M., Haffter, P., Hammerschmidt, M., Heisenberg, C. P., Jiang, Y. J., et al. (1996). Genes controlling and mediating locomotion behavior of the zebrafish embryo and larva. Development 123, 399–413.
Gray, M., Moens, C. B., Amacher, S. L., Eisen, J. S. and Beattie, C. E. (2001). Zebrafish deadly seven Functions in Neurogenesis. Dev. Biol. 237, 306–323.
Gridley, T., Soriano, P. and Jaenisch, R. (1987). Insertional mutagenesis in mice. Trends Genet. 3, 162–166.
Gupta, V., Kawahara, G., Gundry, S. R., Chen, A. T., Lencer, W. I., Zhou, Y., Zon, L. I., Kunkel, L. M. and Beggs, A. H. (2011). The zebrafish dag1 mutant: A novel genetic model for dystroglycanopathies. Hum. Mol. Genet.
Gurung, R., Ono, Y., Baxendale, S., Lee, S. L. C., Moore, S., Calvert, M. and Ingham, P. W. (2017). A Zebrafish Model for a Human Myopathy Associated with Mutation of the Unconventional Myosin MYO18B. Genetics 205, 725 LP – 735.
Guyon, J. R., Goswami, J., Jun, S. J., Thorne, M., Howell, M., Pusack, T., Kawahara, G., Steffen, L. S., Galdzicki, M. and Kunkel, L. M. (2009). Genetic isolation and characterization of a splicing mutant of zebrafish dystrophin. Hum. Mol. Genet.
Haffter, P., Granato, M., Brand, M., Mullins, M. C., Hammerschmidt, M., Kane, D. a, Odenthal, J., van Eeden, F. J., Jiang, Y. J., Heisenberg, C. P., et al. (1996a). The identification of genes with unique and essential functions in the development of the zebrafish, Danio rerio. Development 123, 1–36.
Haffter, P., Granato, M., Brand, M., Mullins, M. C., Hammerschmidt, M., Kane, D. A., Odenthal, J., van Eeden, F. J., Jiang, Y. J., Heisenberg, C. P., et al. (1996b). The identification of genes with unique and essential functions in the development of the zebrafish, Danio rerio. Development.
Hall, T. E., Bryson-Richardson, R. J., Berger, S., Jacoby, A. S., Cole, N. J., Hollway, G. E., Berger, J. and Currie, P. D. (2007). The zebrafish candyfloss mutant implicates extracellular matrix adhesion failure in laminin 2-deficient congenital muscular dystrophy. Proc. Natl. Acad. Sci.
Hálová, A., Janoutová, J., Ewerlingová, L., Janout, V., Bonczek, O., Zeman, T., Gerguri, T., Balcar, V. J. and Šerý, O. (2018). CHAT gene polymorphism rs3810950 is associated with the risk of Alzheimer’s disease in the Czech population. J. Biomed. Sci. 25, 41.
Hawkins, T. A., Haramis, A.-P., Etard, C., Prodromou, C., Vaughan, C. K., Ashworth, R., Ray, S., Behra, M., Holder, N., Talbot, W. S., et al. (2008). The ATPase-dependent chaperoning activity of Hsp90a regulates thick filament formation and integration during skeletal muscle myofibrillogenesis. Development.

86
Hirata, H., Watanabe, T., Hatakeyama, J., Sprague, S. M., Saint-Amant, L., Nagashima, A., Cui, W. W., Zhou, W. and Kuwada, J. Y. (2007). Zebrafish relatively relaxed mutants have a ryanodine receptor defect, show slow swimming and provide a model of multi-minicore disease. Development.
Holley, S. A., Geisler, R. and Nüsslein-Volhard, C. (2000). Control of her1 expression during zebrafish somitogenesis by a Delta- dependent oscillator and an independent wave-front activity. Genes Dev.
Holley, S. A., Julich, D., Rauch, G. J., Geisler, R. and Nüssleinvolhard, C. (2002). her1 and the notch pathway function within the oscillator mechanism that regulates zebrafish somitogenesis. Development.
Hoshijima, K., Jurynec, M. J. and Grunwald, D. J. (2016). Precise genome editing by homologous recombination. Methods Cell Biol.
Hruscha, A., Krawitz, P., Rechenberg, A., Heinrich, V., Hecht, J., Haass, C. and Schmid, B. (2013). Efficient CRISPR/Cas9 genome editing with low off-target effects in zebrafish. Development 140, 4982–7.
Hwang, W. Y., Fu, Y., Reyon, D., Maeder, M. L., Tsai, S. Q., Sander, J. D., Peterson, R. T., Yeh, J.-R. J. and Joung, J. K. (2013). Efficient genome editing in zebrafish using a CRISPR-Cas system. Nat. Biotechnol.
Hyde, D. R., Godwin, A. R. and Thummel, R. (2012). <em>In vivo</em> Electroporation of Morpholinos into the Regenerating Adult Zebrafish Tail Fin. J. Vis. Exp.
Imai, Y., Feldman, B., Schier, A. F. and Talbot, W. S. (2000). Analysis of chromosomal rearrangements induced by postmeiotic mutagenesis with ethylnitrosourea in zebrafish. Genetics.
Ingham, P. W. (2009). The power of the zebrafish for disease analysis. Hum. Mol. Genet. 18, R107–R112.
Jackson, H. E. and Ingham, P. W. (2013). Control of muscle fibre-type diversity during embryonic development: The zebrafish paradigm. Mech. Dev. 130, 447–457.
Jao, L.-E., Wente, S. R. and Chen, W. (2013). Efficient multiplex biallelic zebrafish genome editing using a CRISPR nuclease system. Proc. Natl. Acad. Sci.
Jayasinghe, I. D. and Launikonis, B. S. (2013). Three-dimensional reconstruction and analysis of the tubular system of vertebrate skeletal muscle. J. Cell Sci.
Joshi, S., Virdi, S., Etard, C., Geisler, R. and Strähle, U. (2018). Mutation of a serine near the catalytic site of the choline acetyltransferase a gene almost completely abolishes motility of the zebrafish embryo. PLoS One.
Jülich, D., Hwee Lim, C., Round, J., Nicolaije, C., Schroeder, J., Davies, A., Geisler, R., Lewis, J., Jiang, Y.-J. and Holley, S. A. (2005). beamter/deltaC and the role of Notch ligands in the zebrafish somite segmentation, hindbrain neurogenesis and hypochord differentiation. Dev. Biol. 286, 391–404.
Kelley, L. A., Mezulis, S., Yates, C. M., Wass, M. N. and Sternberg, M. J. E. (2015). The Phyre2 web portal for protein modeling, prediction and analysis. Nat. Protoc. 10, 845.
Kerstjens-Frederikse, W. S., van de Laar, I. M. B. H., Vos, Y. J., Verhagen, J. M. A., Berger, R. M. F., Lichtenbelt, K. D., Klein Wassink-Ruiter, J. S., van der Zwaag, P. A., du Marchie Sarvaas, G. J., Bergman, K. A., et al. (2016). Cardiovascular malformations caused by NOTCH1 mutations

87
do not keep left: data on 428 probands with left-sided CHD and their families. Genet. Med. 18, 914.
Khodabukus, A., Prabhu, N., Wang, J. and Bursac, N. (2018). In Vitro Tissue-Engineered Skeletal Muscle Models for Studying Muscle Physiology and Disease. Adv. Healthc. Mater.
Kimmel, C. B., Ballard, W. W., Kimmel, S. R., Ullmann, B. and Schilling, T. F. (1995). Stages of embryonic development of the zebrafish. Dev. Dyn.
Kisia, S. M. and Onyango, D. W. (2005). Muscular System of Vertebrates. Science Publishers.
Kleinstiver, B. P., Prew, M. S., Tsai, S. Q., Topkar, V. V, Nguyen, N. T., Zheng, Z., Gonzales, A. P. W., Li, Z., Peterson, R. T., Yeh, J.-R. J., et al. (2015). Engineered CRISPR-Cas9 nucleases with altered PAM specificities. Nature 523, 481.
Kok, F. O., Shin, M., Ni, C.-W., Gupta, A., Grosse, A. S., van Impel, A., Kirchmaier, B. C., Peterson-Maduro, J., Kourkoulis, G., Male, I., et al. (2015). Reverse genetic screening reveals poor correlation between morpholino-induced and mutant phenotypes in zebrafish. Dev. Cell 32, 97–108.
Lamboley, C. R., Murphy, R. M., Mckenna, M. J. and Lamb, G. D. (2014). Sarcoplasmic reticulum Ca2+ uptake and leak properties, and SERCA isoform expression, in type I and type II fibres of human skeletal muscle. J. Physiol.
Lawson, N. D. and Wolfe, S. A. (2011). Forward and Reverse Genetic Approaches for the Analysis of Vertebrate Development in the Zebrafish. Dev. Cell 21, 48–64.
Lee, H. J., Kim, E. and Kim, J. S. (2010). Targeted chromosomal deletions in human cells using zinc finger nucleases. Genome Res.
Lee, P. Y., Costumbrado, J., Hsu, C.-Y. and Kim, Y. H. (2012). Agarose Gel Electrophoresis for the Separation of DNA Fragments. J. Vis. Exp.
Leshchiner, I., Alexa, K., Kelsey, P., Adzhubei, I., Austin-Tse, C. A., Cooney, J. D., Anderson, H., King, M. J., Stottmann, R. W., Garnaas, M. K., et al. (2012). Mutation mapping and identification by whole-genome sequencing. Genome Res.
LeWinter, M. M. and Granzier, H. L. (2013). Titin Is a Major Human Disease Gene. Circulation.
Li, M., Zhao, L., Page-McCaw, P. S. and Chen, W. (2016). Zebrafish Genome Engineering Using the CRISPR–Cas9 System. Trends Genet.
Liao, W., Hong, S. H., Chan, B. H., Rudolph, F. B., Clark, S. C. and Chan, L. (1999). APOBEC-2, a cardiac- and skeletal muscle-specific member of the cytidine deaminase supergene family. Biochem. Biophys. Res. Commun. 260, 398–404.
Lim, C. X., Ricos, M. G., Dibbens, L. M. and Heron, S. E. (2016). KCNT1 mutations in seizure disorders: The phenotypic spectrum and functional effects. J. Med. Genet.
Lin, Y. Y. (2012). Muscle diseases in the zebrafish. Neuromuscul. Disord.
Liu, Y. (2005). Central and Peripheral Axon Branches from One Neuron Are Guided Differentially by Semaphorin3D and Transient Axonal Glycoprotein-1. J. Neurosci.
Liu, Q., Segal, D. J., Ghiara, J. B., Barbas Iii, C. F. and Lerner, R. A. (1997). Design of polydactyl zinc-finger proteins for unique addressing within complex genomes (molecule designzinc-finger proteinsgenome addressingtranscriptional regulationgene therapy). Biochemistry.
Liu, J., Zhou, Y., Qi, X., Chen, J., Chen, W., Qiu, G., Wu, Z. and Wu, N. (2017). CRISPR/Cas9 in zebrafish: an efficient combination for human genetic diseases modeling. Hum. Genet.

88
MacIntosh, B. R., Gardiner, P. F. and McComas, A. J. (2006). Skeletal muscle : form and function.
Mali, P., Yang, L., Esvelt, K. M., Aach, J., Guell, M., DiCarlo, J. E., Norville, J. E. and Church, G. M. (2013). RNA-guided human genome engineering via Cas9. Science (80-. ).
Manabe, Y. and Fujii, N. L. (2016). Experimental research models for skeletal muscle contraction. J. Phys. Fit. Sport. Med. 5, 373–377.
Maurya, A. K., Tan, H., Souren, M., Wang, X., Wittbrodt, J. and Ingham, P. W. (2012). Integration of Hedgehog and BMP signalling by the engrailed2a gene in the zebrafish myotome. Development.
Meeker, N. D., Hutchinson, S. A., Ho, L. and Trede, N. S. (2007). Method for isolation of PCR-ready genomic DNA from zebrafish tissues. Biotechniques.
Metcalfe, W. K., Myers, P. Z., Trevarrow, B., Bass, M. B. and Kimmel, C. B. (1990). Primary neurons that express the L2/HNK-1 carbohydrate during early development in the zebrafish. Development 110, 491 LP – 504.
Mikl, M. C., Watt, I. N., Lu, M., Reik, W., Davies, S. L., Neuberger, M. S. and Rada, C. (2005a). Mice deficient in APOBEC2 and APOBEC3. Mol. Cell. Biol. 25, 7270–7277.
Mikl, M. C., Watt, I. N., Lu, M., Reik, W., Davies, S. L., Neuberger, M. S. and Rada, C. (2005b). Mice deficient in APOBEC2 and APOBEC3. Mol. Cell. Biol. 25, 7270–7277.
Montague, T. G., Cruz, J. M., Gagnon, J. A., Church, G. M. and Valen, E. (2014). CHOPCHOP: a CRISPR/Cas9 and TALEN web tool for genome editing. Nucleic Acids Res. 42, W401–W407.
Moreno-Mateos, M. A., Vejnar, C. E., Beaudoin, J.-D., Fernandez, J. P., Mis, E. K., Khokha, M. K. and Giraldez, A. J. (2015). CRISPRscan: designing highly efficient sgRNAs for CRISPR-Cas9 targeting in vivo. Nat. Methods 12, 982.
Moresco, E. M. Y., Li, X. and Beutler, B. (2013). Going Forward with Genetics. Am. J. Pathol.
Moscou, M. J. and Bogdanove, A. J. (2009). A simple cipher governs DNA recognition by TAL effectors. Science (80-. ).
Müller, F., Chang, B., Albert, S., Fischer, N., Tora, L. and Strähle, U. (1999). Intronic enhancers control expression of zebrafish sonic hedgehog in floor plate and notochord. Development.
Mullins, M. C., Hammerschmidt, M., Haffter, P. and Nüsslein-Volhard, C. (1994a). Large-scale mutagenesis in the zebrafish: in search of genes controlling development in a vertebrate. Curr. Biol.
Mullins, M. C., Hammerschmidt, M., Haffter, P. and Nüsslein-Volhard, C. (1994b). Large-scale mutagenesis in the zebrafish: in search of genes controlling development in a vertebrate. Curr. Biol. 4, 189–202.
Mwaffo, V., Zhang, P., Romero Cruz, S. and Porfiri, M. (2017). Zebrafish swimming in the flow: a particle image velocimetry study. PeerJ 5, e4041–e4041.
Myhre, J. L., Hills, J. A., Prill, K., Wohlgemuth, S. L. and Pilgrim, D. B. (2014). The titin A-band rod domain is dispensable for initial thick filament assembly in zebrafish. Dev. Biol.
Nguyen-Chi, M. E., Bryson-Richardson, R., Sonntag, C., Hall, T. E., Gibson, A., Sztal, T., Chua, W., Schilling, T. F. and Currie, P. D. (2012). Morphogenesis and Cell Fate Determination within the Adaxial Cell Equivalence Group of the Zebrafish Myotome. PLoS Genet.
Nikaido, M., Kawakami, A., Sawada, A., Furutani-Seiki, M., Takeda, H. and Araki, K. (2002). Tbx24,

89
encoding a T-box protein, is mutated in the zebrafish somite-segmentation mutant fused somites. Nat. Genet.
Noveroske, J. K., Weber, J. S. and Justice, M. J. (2000). The mutagenic action of N-ethyl-N-nitrosourea in the mouse. Mamm. Genome.
Nüsslein-Volhard, C. (2012). The zebrafish issue of <em>Development</em> Development 139, 4099 LP – 4103.
Ochi, H. and Westerfield, M. (2007). Signaling networks that regulate muscle development: Lessons from zebrafish. Dev. Growth Differ. 49, 1–11.
Ogino K., H. H. (2018) (2018). Rohon-Beard Neuron in Zebrafish. In Zebrafish, Medaka, and Other Small Fishes. Springer, Singapore, .
Ohno, K., Tsujino, A., Brengman, J. M., Harper, C. M., Bajzer, Z., Udd, B., Beyring, R., Robb, S., Kirkham, F. J. and Engel, A. G. (2001). Choline acetyltransferase mutations cause myasthenic syndrome associated with episodic apnea in humans. Proc. Natl. Acad. Sci. 98, 2017–2022.
Ohtsubo, H., Sato, Y., Suzuki, T., Mizunoya, W., Nakamura, M., Tatsumi, R. and Ikeuchi, Y. (2017). Data supporting possible implication of APOBEC2 in self-renewal functions of myogenic stem satellite cells: Toward understanding the negative regulation of myoblast differentiation. Data Br. 12, 269–273.
Ohtsubo, H., Sato, Y., Matsuyoshi, Y., Suzuki, T., Mizunoya, W., Nakamura, M., Tatsumi, R. and Ikeuchi, Y. (2018). Fluorescence microscopy data on expression of Paired Box Transcription Factor 7 in skeletal muscle of APOBEC2 knockout mice. Data Br. 17, 1348–1351.
Oxtoby, E. and Jowett, T. (1993). Cloning of the zebrafish krox-20 gene (krx-20) and its expression during hindbrain development. Nucleic Acids Res.
Palstra, A. P., Tudorache, C., Rovira, M., Brittijn, S. A., Burgerhout, E., van den Thillart, G. E. E. J. M., Spaink, H. P. and Planas, J. V (2011). Establishing Zebrafish as a Novel Exercise Model: Swimming Economy, Swimming-Enhanced Growth and Muscle Growth Marker Gene Expression. PLoS One 5, e14483.
Parant, J. M., George, S. A., Pryor, R., Wittwer, C. T. and Yost, H. J. (2009). A rapid and efficient method of genotyping zebrafish mutants. Dev. Dyn. 238, 3168–3174.
Pette, D. and Staron, R. S. (1997). Mammalian skeletal muscle fiber type transitions. Int. Rev. Cytol.
Pietri, T., Manalo, E., Ryan, J., Saint-Amant, L. and Washbourne, P. (2009). Glutamate drives the touch response through a rostral loop in the spinal cord of zebrafish embryos. Dev. Neurobiol.
Pires, D. E. V, Ascher, D. B. and Blundell, T. L. (2014). mCSM: predicting the effects of mutations in proteins using graph-based signatures. Bioinformatics 30, 335–42.
Poirel, O., Mella, S., Videau, C., Ramet, L., Davoli, M. A., Herzog, E., Katsel, P., Mechawar, N., Haroutunian, V., Epelbaum, J., et al. (2018). Moderate decline in select synaptic markers in the prefrontal cortex (BA9) of patients with Alzheimer’s disease at various cognitive stages. Sci. Rep. 8, 938.
Powell, C., Elsaeidi, F. and Goldman, D. (2012). Injury-Dependent Muller Glia and Ganglion Cell Reprogramming during Tissue Regeneration Requires Apobec2a and Apobec2b. J. Neurosci.

90
Powell, C., Cornblath, E. and Goldman, D. (2014). Zinc-binding domain-dependent, deaminase-independent actions of apolipoprotein B mRNA-editing enzyme, catalytic polypeptide 2 (apobec2), mediate its effect on zebrafish retina regeneration. J. Biol. Chem.
Qiu, P., Shandilya, H., D’Alessio, J. M., O’Connor, K., Durocher, J. and Gerard, G. F. (2004). Mutation detection using SurveyorTM nuclease. Biotechniques.
Reyes, R., Haendel, M., Grant, D., Melancon, E. and Eisen, J. S. (2004). Slow degeneration of zebrafish Rohon-Beard neurons during programmed cell death. Dev. Dyn. 229, 30–41.
Reyon, D., Tsai, S. Q., Khgayter, C., Foden, J. A., Sander, J. D. and Joung, J. K. (2012). FLASH assembly of TALENs for high-throughput genome editing. Nat. Biotechnol.
Rosen, J. N. and Baylies, M. K. (2017). Myofibrils put the squeeze on nuclei. Nat. Cell Biol. 19, 1148–1150.
Rossi, A., Kontarakis, Z., Gerri, C., Nolte, H., Hölper, S., Krüger, M. and Stainier, D. Y. R. (2015). Genetic compensation induced by deleterious mutations but not gene knockdowns. Nature.
Russell, L. B., Russell, W. L., Rinchik, E. M. and Hunsicker, P. R. (1989). Factors affecting the nature of induced mutations.p. United States.
Samarut, É., Lissouba, A. and Drapeau, P. (2016). A simplified method for identifying early CRISPR-induced indels in zebrafish embryos using High Resolution Melting analysis. BMC Genomics 17, 547.
Santoriello, C. and Zon, L. I. (2012). Hooked! Modeling human disease in zebrafish. J. Clin. Invest. 122, 2337–2343.
Santos, D., Monteiro, S. M. and Luzio, A. (2018). General whole-mount immunohistochemistry of zebrafish (Danio rerio) embryos and larvae protocol. In Methods in Molecular Biology, .
Sato, Y., Probst, H. C., Tatsumi, R., Ikeuchi, Y., Neuberger, M. S. and Rada, C. (2010a). Deficiency in APOBEC2 leads to a shift in muscle fiber type, diminished body mass, and myopathy. J. Biol. Chem.
Sato, Y., Probst, H. C., Tatsumi, R., Ikeuchi, Y., Neuberger, M. S. and Rada, C. (2010b). Deficiency in APOBEC2 leads to a shift in muscle fiber type, diminished body mass, and myopathy. J. Biol. Chem.
Sato, Y., Ohtsubo, H., Nihei, N., Kaneko, T., Sato, Y., Adachi, S. I., Kondo, S., Nakamura, M., Mizunoya, W., Iida, H., et al. (2018). Apobec2 deficiency causes mitochondrial defects and mitophagy in skeletal muscle. FASEB J.
Schiaffino, S. and Reggiani, C. (2011). Fiber Types in Mammalian Skeletal Muscles. Physiol. Rev. 91, 1447–1531.
Schmid-Burgk, J. L., Schmidt, T., Kaiser, V., Höning, K. and Hornung, V. (2013). A ligation-independent cloning technique for high-throughput assembly of transcription activator-like effector genes. Nat. Biotechnol.
Sevy, A., Cerino, M., Gorokhova, S., Dionnet, E., Mathieu, Y., Verschueren, A., Franques, J., Maues de Paula, A., Figarella-Branger, D., Lagarde, A., et al. (2016). Improving molecular diagnosis of distal myopathies by targeted next-generation sequencing. J. Neurol. Neurosurg. &amp; Psychiatry 87, 340 LP – 342.
Shestopalov, I. A., Pitt, C. L. W. and Chen, J. K. (2012). Spatiotemporal resolution of the Ntla

91
transcriptome in axial mesoderm development. Nat. Chem. Biol.
Shimada, A. and Shima, A. (1998). Combination of genomic DNA fingerprinting into the medaka specific-locus test system for studying environmental germ-line mutagenesis. Mutat. Res. Mol. Mech. Mutagen. 399, 149–165.
Shin, J., Chen, J. and Solnica-Krezel, L. (2014). Efficient homologous recombination-mediated genome engineering in zebrafish using TALE nucleases. Development.
Siriwardena, S. U., Chen, K. and Bhagwat, A. S. (2016). Functions and Malfunctions of Mammalian DNA-Cytosine Deaminases. Chem. Rev. 116, 12688–12710.
Smith, S. J., Horstick, E. J., Davidson, A. E. and Dowling, J. (2015). Analysis of Zebrafish Larvae Skeletal Muscle Integrity with Evans Blue Dye. J. Vis. Exp.
Solnica-Krezel, L., Schier, A. F. and Driever, W. (1994). Efficient recovery of ENU-induced mutations from the zebrafish germline. Genetics 136, 1401–1420.
Stainier, D. Y. R. and Schulte-Merker, S. (2014). Out with the old, in with the new: reassessing morpholino knockdowns in light of genome editing technology. Development.
Steffen, L. S., Guyon, J. R., Vogel, E. D., Howell, M. H., Zhou, Y., Weber, G. J., Zon, L. I. and Kunkel, L. M. (2007). The zebrafish runzel muscular dystrophy is linked to the titin gene. Dev. Biol.
Stellabotte, F., Dobbs-McAuliffe, B., Fernandez, D. A., Feng, X. and Devoto, S. H. (2007). Dynamic somite cell rearrangements lead to distinct waves of myotome growth. Development.
Stickney, H. L., Barresi, M. J. F. and Devoto, S. H. (2000). Somite development in zebrafish. Dev. Dyn. 219, 287–303.
Stittrich, A. B., Lehman, A., Bodian, D. L., Ashworth, J., Zong, Z., Li, H., Lam, P., Khromykh, A., Iyer, R. K., Vockley, J. G., et al. (2014). Mutations in NOTCH1 Cause Adams-Oliver Syndrome. Am. J. Hum. Genet.
Summerton, J. (1999). Morpholino antisense oligomers: The case for an RNase H-independent structural type. Biochim. Biophys. Acta - Gene Struct. Expr.
Summerton, J. and Weller, D. (1997). Morpholino antisense oligomers: design, preparation, and properties. Antisense Nucleic Acid Drug Dev.
Tallafuss, A., Gibson, D., Morcos, P., Li, Y., Seredick, S., Eisen, J. and Washbourne, P. (2012). Turning gene function ON and OFF using sense and antisense photo-morpholinos in zebrafish. J. Cell Sci.
Tang, H. and Thomas, P. D. (2016). PANTHER-PSEP: predicting disease-causing genetic variants using position-specific evolutionary preservation. Bioinformatics 32, 2230–2232.
Tao, S., Witte, M., Bryson-Richardson, R. J., Currie, P. D., Hogan, B. M. and Schulte-Merker, S. (2011). Zebrafish prox1b mutants develop a lymphatic vasculature, and prox1b does not specifically mark lymphatic endothelial cells. PLoS One.
Tautz, D. (1992). Redundancies, development and the flow of information. BioEssays.
Therapontos, C. and Vargesson, N. (2010). Zebrafish notch signalling pathway mutants exhibit trunk vessel patterning anomalies that are secondary to somite misregulation. Dev. Dyn.
Thummel, R., Bai, S., Sarras, M. P., Song, P., McDermott, J., Brewer, J., Perry, M., Zhang, X., Hyde, D. R. and Godwin, A. R. (2006). Inhibition of zebrafish fin regeneration using in vivo electroporation of morpholinos against fgfr1 and msxb. Dev. Dyn.

92
Ting, C. N., Rosenberg, M. P., Snow, C. M., Samuelson, L. C. and Meisler, M. H. (1992). Endogenous retroviral sequences are required for tissue-specific expression of a human salivary amylase gene. Genes Dev.
Umeda, K., Ishizuka, T., Yawo, H. and Shoji, W. (2016). Position- and quantity-dependent responses in zebrafish turning behavior. Sci. Rep. 6, 27888.
Urnov, F. D., Rebar, E. J., Holmes, M. C., Zhang, H. S. and Gregory, P. D. (2010). Genome editing with engineered zinc finger nucleases. Nat. Rev. Genet.
van Eeden, F. J. M., Granato, M., Schach, U., Brand†, M., Furutani-Seiki, M., Haffter, P., Hammerschmidt, M., Heisenberg, C.-P., Jiang, Y.-J., Kane, D. A., et al. (1996). Mutations affecting somite formation and patterning in the zebrafish, Danio. Development.
Varshney, G. K., Pei, W., Lafave, M. C., Idol, J., Xu, L., Gallardo, V., Carrington, B., Bishop, K., Jones, M., Li, M., et al. (2015a). High-throughput gene targeting and phenotyping in zebrafish using CRISPR/Cas9. Genome Res.
Varshney, G. K., Sood, R. and Burgess, S. M. (2015b). Understanding and Editing the Zebrafish Genome. Adv. Genet. 92, 1–52.
Varshney, G. K., Sood, R. and Burgess, S. M. (2015c). Understanding and Editing the Zebrafish Genome. Adv. Genet.
Voz, M. L., Coppieters, W., Manfroid, I., Baudhuin, A., von Berg, V., Charlier, C., Meyer, D., Driever, W., Martial, J. A. and Peers, B. (2012). Fast homozygosity mapping and identification of a zebrafish enu-induced mutation by whole-genome sequencing. PLoS One.
Wang, M., Wen, H. and Brehm, P. (2008). Function of Neuromuscular Synapses in the Zebrafish Choline-Acetyltransferase Mutant bajan. J. Neurophysiol. 100, 1995–2004.
Wang, L., Geist, J., Grogan, A., Hu, L.-Y. R. and Kontrogianni-Konstantopoulos, A. (2018). Thick Filament Protein Network, Functions, and Disease Association. Compr. Physiol. 631–709.
Wedekind, J. E., Dance, G. S. C., Sowden, M. P. and Smith, H. C. (2003). Messenger RNA editing in mammals: new members of the APOBEC family seeking roles in the family business. Trends Genet. 19, 207–216.
Westerfield, M. (2007). The Zebrafish Book: A guide for the laboratory use of zebrafish (Danio rerio).
Whitfield, T. T., Riley, B. B., Chiang, M. Y. and Phillips, B. (2002). Development of the zebrafish inner ear. Dev. Dyn.
Wolff, C., Roy, S. and Ingham, P. W. (2003). Multiple muscle cell identities induced by distinct levels and timing of Hedgehog activity in the zebrafish embryo. Curr. Biol.
Wu, H. H., Brennan, C. and Ashworth, R. (2011). Ryanodine receptors, a family of intracellular calcium ion channels, are expressed throughout early vertebrate development. BMC Res. Notes 4, 541.
Xu, X., Meiler, S. E., Zhong, T. P., Mohideen, M., Crossley, D. A., Warren, W. and Fishman, M. C. (2002a). Cardiomyopathy in zebrafish due to mutation in an alternatively spliced exon of titin. 30, 205–209.
Xu, X., Meiler, S. E., Zhong, T. P., Mohideen, M., Crossley, D. A., Burggren, W. W. and Fishman, M. C. (2002b). Cardiomyopathy in zebrafish due to mutation in an alternatively spliced exon of titin. Nat. Genet.

93
Yen, H. J., Tayeh, M. K., Mullins, R. F., Stone, E. M., Sheffield, V. C. and Slusarski, D. C. (2006). Bardet-Biedl syndrome genes are important in retrograde intracellular trafficking and Kupffer’s vesicle cilia function. Hum. Mol. Genet.
Zhou, Y., Kunkel, L. M., Zon, L. I., Steffen, L. S., Howell, M. H., Guyon, J. R., Vogel, E. D. and Weber, G. J. (2007). The zebrafish runzel muscular dystrophy is linked to the titin gene. Dev. Biol.
Zou, C., Li, J., Luo, W., Li, L., Hu, A., Fu, Y., Hou, Y. and Li, C. (2017). Transcriptome analysis reveals long intergenic non-coding RNAs involved in skeletal muscle growth and development in pig. Sci. Rep.

94
Appendix
A1 Supplementary figures

95
Number of seq
yellow = PAM, red = differs from WT
smyd1b (reverse sequence) Wt = 2 TGTGTG TCGGCCAGAACATTCTCCTGTTTCTCCACACACTC
2 TGTGTG TCGGCCAGA ATTCTCCTGTTTCTCCACACACTC
1 TGTGTG TCGGCCAG TTCTCCTGTTTCTCCACACACTC
3 TGTGTG TCGGCCA TTCACCTGTTTCTCCACACACTC
1 TGTGTG TCGGCCAGCCCATTCTCCTGTTTCTCCACACACTC
1 TGTGTG TCTCCTGTTTCTCCACACACTC
1 TGTGTG TCGGCCAGAACACAACGTCCTCCTGTTTCTCCACACACTC
1 TGTGTG TCGGCCA TTCTCCTGTTTCTCCACACACTC
1 TGTGTG TCGGCCAGAACATGTGGTGTCTCCATGTGTGTGTCTCCTGTTTCTCCACACACTC
1 TGTGTG TCAGCCAGAACACACCCACATTCTCCTGTTTCTCCACACACTC
1 TGTGTG TCGGCCA-‐ TTCTCCTGTTTCTCCACACACTC
1 TGTGTG TCAGCCAGAACACACCCACATTCTCCTGTTTCTCCACACACTC
hsp90a Wt = 4 CAAAGGCCTTCATGGAGGCTCTGCAGGCCGGAGCGGACATTTCTATGATCGGTCAGTTCGGTGTGGGCT
1 CAAAGGCCTTCATGGAGGCTCTGCAGGC-‐GG ACATTTCTATGATCGGTCAGTTCGGTGTGGGCT
2 CAAAGGCCTTCATGGAGGCTCTGCAGGC-‐GG GACATTTCTATGATCGGTCAGTTCGGTGTGGGCT
1 CAAAGGCCTTCATGGAGGCCCTGCAGGC ATTTCTATGATCGGTCAGTTCGGTGTGGGCT
1 CAAAGGCCTTCATGGAGGCTCTGCAGGCCTGCAGGCAGAGCGGACATTTCTATGATCGGTCAGTTCGGT
1 CAAAGGCCTTCATGGAGGCTCTGCAG GACATTTCTATGATCGGTCAGTTCGGTGTGGGCT
1 CAAAGGCCTTCATGGAGGCTCAGC ACATTTCTATGATCGGTCAGTTCGGTGTGGGCT
1 CAAAGGCCTTCATGGAGGCTTT GTGGGCT
1 CAAAGGCCTTCATGGAGGCTCTGCAGACATTTCTATGATCTGCTCTGCWGAGCGGACATTTCTATGATCGGTCAGT
1 CAAAGGCCTTCATGGAGGCACTGCAGCG GACATTTCTATGATCGGTCAGTTCGGTGTGGGCT
1 CAAAGGCCTTCATGGAGGCTCTGCAGG CCATTTCTATGATCGGTCAGTTCGGTGTGGGCT
1 CAAAGGCCTTCATGGAGGCTCTGCAGGCGG ACATTTCTATGATCGGTCAGTTCGGTGTGGGCT
1 CAAAGGCCTTCATGGAGGCTCTGCAGGCATTTCTAGAGCGGACATTTCTATGATCGGTCAGTTCGGTGTGGGCT
1 CAAAGGCCTTCATGGAGGCTCTGCAGGCGGACATTTCTCTGAGCGGACATTTCTATGATCGGTCAGTTCGGTGTGGG
bbs1 Wt = 6 GAGCAGGACGTCTGGTGTCAGGCCA AGGAGGTGAGCTGCTA
1 GAGCAGGACGTCTGGTGTCGTGAGCTGCTA AGGAGGTGAGCTGCTA
1 GAGCAGGACGTCTGGTGTCAGGAGGTGCCA AGGAGGTGAGCTGCTA
1 GAGCAGGACGTCTGGT GTGAGCTGCTA
1 GAGCAGGAG GTGAGCTGCTA
1 GAGCAGGACGTCTGGTGTCAA AGGAGGTGAGCTGCTA
1 GAGCAGGACGTCTGGTGTC AGGAGGTGAGCTGCTA
1 GAGCAGGACGTCTGGTGTCAGGCAAACCTTAATAGCAGGTGAGCTGCTA
1 GAGCAGGACGTCTGGTGTCAGG GAGGTGAGCTGCTA
1 GAGCAGGACGTCTGGTGTCAGGACCTGACACCAAGGAGGTGAGCTGCTA
1 GAGCAGGACGTCTGGTGTCAGGAGGAGCCA AGGAGGTGAGCTGCTA
1 GAGCAGGACGTCTGGTGTCAGG GGAGGTGAGCTGCTA
2 GAGCAGGACGTCTGGTGTCAAG GAGGTGAGCTGCTA
unc45b Wt = 8 CATGGCTGTGGACAATGAAGAGATTGCTC TGGCTACTGCAAACCTCTT
1 AGATCTGGCTACTGGCTAATGAAGAGATC TGGCTACTGCAAACCTCTT
1 CATGGCTGTGGACAATGAAGAGAT-‐ACTC TGGCTACTGCAAACCTCTT
1 CATGGCTGTGGACAATGAAGAGACTGCACAGCSTC TGGCTACTGCAAACCTCTT
1 CATGGCTGTGGACGATGAAGAGAT TGGCTACTGCAAACCTCTT
1 CATGGCTGTGGACAATGAAGAGATATCCTC TGGCTACTGCAAACCTCTT
1 CATGGCTGTGGACAATGAAGAGATGGTGTCTC TGGCTACTGCAAACCTCTT
1 CATGGCTATGGACAATGAAGAGAT TACTGCAAACCTCTT
1 CATGGCTGTGGACAATGAAGAGA TGGCTACTGCAAACCTCTT
1 CATGGCTGTGGACAATGAAGAG GTACTGCAAACCTCTT
1 CATGGCTGTGGACAATGAAGAGAT TGGCTACTGCAAACCTCTT
Wt = 2
1
1
3
1
2
1
1
1
1
1
1
1
1
rp2 (seq reverse) GAGCTTGCCTGGTAACCTGCCCACGGTCTCA TTCTTGAGGCCTGTCAG
GAGCTTGCCTGGTAACCAGCCCACC-‐AGG CA TTCTTGAGGCCTGTCAG
GAGCTTGCCTGGTARCCTGCCCACTAACCTGTCTCA TTCTTGAGGCCTGTCAG
GAGCTTGCCTGGTAACCTGCCCTCA TTCTTGAGGCCTGTCAG
GAGCTTGCCTGGTAACCTGCCC ACGGCCTGTCAG
GAGCTTGCCTGGTAACCTGCCCACGTCTCA TTCTTGAGGCCTGTCAG
GAGCTTGCCTGGTAACCTGCCCAGGCCTCTCA TTCTTGAGGCCTGTCAG
GAGCTTGCCTGGTAACCTGCCCACCTGCCTGTCTCA TTCTTGAGGCCTGTCAG
GAGCTTGC CTCA TTCTTGAGGCCTGTCAG
GAGCTTGCCTGGTAACCTGAGGCCTCATTCTTGAGGCCTCA TTCTTGAGGCCTGTCAG
GAGCTTGCCTGGTAACCTGCCC-‐CGTTACCA TTCTTGAGGCCTGTCAG
GAGCTTGCCTGGTAACCTGCCCACCAGATTACTTGAATATCTCTGACAGGCCTCATATCTCTGACAGGCCTCA TTCTTGAGGCCTGTCAG
GAGCTTGCCTGGTAACCTGCCCTGGTCTCA TTCTTGAGGCCTGTCAG
GAGCTTGCCTGGTAACCTGCCC CA TTCTTGAGGCCTGTCAG
Wt = 18
bbs10 GACTTCCTGTTGGCTGCTCTGAGGTGATTGAAGGCCT GGTTGTGACTCGTGATTGGTCAGTGTGGACTGA
Wt = 18
apobec2aexon1 GGCAGAAAATGATGCCAAGAAAGAGGAGAAAAGCCCAACAGAAGCGGAGAAACCCGAAGTGA
Wt = 18
apobec2aexon2 CTGCGCTCCAGGAAGAACATCCGGCTGGCCATCTTTTCGTCGCGGCTGTTCGAGT
A
Figure S 1. (A-H) Examples of sequencing profiles obtained from sequencing the PCR fragments from pools of F0 embryos injected with gRNAs directed against rp2 (A), hsp90a (B), bbs1 (C), unc45b (D), pik3r4 (E), bbs10 (F), apobec2a-exon1 (G), apobec2a-exon2 (H). The upper sequence in each case corresponds to the sequencing profile obtained from sequencing the PCR fragment of uninjected embryos. The proportion of the number of mutant subclones relative to the total number of subclones is indicated for each gRNA. A total of 18 subclones was sequenced for each gRNA.

96
forward reverse Guide + PAM Expected
size (bp)
smyd1b GTGGTGAAGATCTGCCGTG GGTATCCGTCCACCATCTTG GGAGAAACAGGAGAATGTTCTGG 163
hsp90a GACAGATCCGAGCAAACTGG CGAAGTCTGGCTTGACAGTG GGAGGCTCTGCAGGCCGGAGCGG 338
bbs1 ATGGACCTGCACGAGCC CGTAGTGATCTGACAGACAGTGG GGACGTCTGGTGTCAGGCCAAGG 428
unc45b GTTTGCGTCCCAAAGGCAAC CAATGGTGAAAAGGCACTTGG GGACAATGAAGAGATTGCTCTGG 427
rp2 AGGAAGCCAGAGAGCAAAGA GACCGGACCTAACACAATGC GGCCTCAAGAATGAGACCGTGGG 284
bbs110 CCATAGCGACAAACTGGAGC CAGGTGAATGTGGTGCTGTC GGCTGCTCTGAGGTGATTGAAGG 435
apobecexon1 GTGTTTAGTTTCAGAGATGGCCGAT ATGGCGGCAGCTCTATAGGTTC GGAGAAAAGCCCAACAGAAGCGG 278
apobecexon2 GAACGTGGAGTACTCGTCCGG CAGGGTGTGAACTGCTGTTCG GGCTGGCCATCTTTTCGTCGCGG 423
B
Figure S 2. (A) Sequence alignment of the area around the PAM sequence of 18 subclones of PCR fragment pools from each gRNA injection. “Number of seq” indicates the number of mutant and wild-type clones for each sequence. The PAM is indicated in yellow. The black sequence represents the nucleotides identical to wild-type and the bases in red the sequence that diverged is highlighted. Note that for bbs10 and for apobec2a exon1 and 2, no fragments with mutations were found. (B) Primers used to amplify the sequences flanking the target area of the different gRNAs along with the expected product size. Primers used for sequencing are indicated in red.

97
Figure S 3. Illustration of the processing steps involved in quantifying mutagenesis efficiency from
sequencing profiles in PCR-F-Seq. The DNA flanking the region targeted by the gRNA was amplified and the fragment pool consisting of wild-type and mutant fragments was subjected to Sanger sequencing. To demonstrate that the method can be used for genotyping of indel mutant carriers, the fragment pool was amplified from a bbs1 heterozygous zebrafish embryo, thus consisting only of wild-type and a single mutant sequence (see Fig. S4B) with a 5 bp deletion (unpublished). (A) Raw electropherogram of the intensity values for the four nucleotides A, C, G, T and the associated phred score. Intensity values of the bases were scaled to match the value range of the phred score. (B) Relative signal intensities obtained by converting the raw signal intensities to percentages at each location. Clear peaks are observed left of the black bar (PAM location or user-defined location of interest) and ambiguous peaks are observed on the right-hand side. (C) Maximum relative intensity values of 50 bases before and 50 bases after the specified location of interest. Colored bars indicate the median values of the relative intensity values before and after the location of interest, respectively. (D) Box plots of the relative intensity value distributions before and after the location of interest. (E) Bar plots of the median values with error bars indicating the standard error of the mean. (F) Derived estimate for the gRNA mutagenesis efficiency, calculated as described in the main text. The estimated frequency of about 46% is close to the expected 50% for a bbs1 heterozygous zebrafish embryo.
Figure S 4. (A) Mixture of two different PCR fragments (obtained from wild type and bbs1 homozygous mutant, respectively) in different proportions (in %). The number above each mix refers to the original sequencing data (see File S1). (B) Sequence comparison of the two clones used for mixing. The PAM is indicated in red. (C) Sequence visualization of the PAM area for each mixture. The number refers to the original sequence data (see (A), and File S1).

98
A
B
Figure S 5. Homozygosity score plotted over all of the chromosomes. (A) Homozygosity score in mutant (blue) and wild-type (orange) samples, elevated homozygosity seen in the telomeric region of chromosome 9 in dustq250 (AQ50) and (B) In mutant (orange) and wild-type (blue) samples of froto27c, elevated homozygosity seen in the telomeric region of chromosome 10; both highlighted by the red box.
99
Figure S 6. Homozygosity score plotted over all of the chromosomes. Elevated homozygosity was seen in chromosome 18 of slmtt208, highlighted by the red box.

100
A
B
Figure S 7. Homozygosity score plotted over of all chromosomes. Homozygosity score in mutant (orange) and wild-type (blue) samples, (A) elevated homozygosity seen in the telomeric region of chromosome 1 in t30064 (LH005), (B) elevated homozygosity was seen on chromosome 21 in t31198 (NS078); both highlighted by the red box.

101
A2 Materials
Laboratory equipment The laboratory equipment used in the study is listed below with the details on their
manufacturer.
Name Company
Bacterial incubators Heraeus, Hanau, Germany
Cool centrifuge J2-HS Beckman, Stuttgart, Germany
Dissection forceps Fine Tip No. 5, Dumont
Eppendorf microcentrifuge tubes Eppendorf, Hamburg, Germany
Falkon tubes Greiner, Nurtingen, Germany
FemtoJet microinjector Eppendorf, Hamburg, Germany
Flaming-Brown needle puller Sutter Instruments, USA
Gas microinjector Tritech research Inc., L.A., USA
Glass capillaries, 1.0mm outer diameter,
0.58mm inner diameter with filament (TW100)
WPI Inc., USA
Incubator for fish embryos Heraeus, Hanau, Germany
Magnetic thermomixer Heidolph, Rosenfeld, Germany
MicroAmpTM 96-Well Full Plate Cover Applied Biosystems, Foster city, USA
Microcentrifuge 5417 R and C Eppendorf, Hamburg, Germany
Microloader tips Eppendorf, Hamburg, Germany
Confocal microscope TCS SP2, fluorescent
microscope DMI6000 SD, fluorescent
stereomicroscope MZ FLI-II
Leica Microsystems, Wetzlar, Germany
Stereomicroscope SMZ645 Nikon, Japan
Multitank recirculation system Schwarz GmbH, Germany
NanoDrop ND-1000 Peqlab, Erlangen, Germany
Neubauer chamber Roth, Karlsruhe, Germany
Omnifix® RF 0.01R 1ml syringe Braun, Melsungen AG, Germany
PCR-Thermocycler Peqlab, Erlangen, Germany; Eppendorf,
Hamburg, Germany
Petri dishes Greiner, Nurtingen, Germany
Pipette tips Corning, UK
qPCR 96-well FrameStar Fastplate Steinbrenner Laborsysteme, Germany
qPCR Clear Seal Klebe-Folie Steinbrenner Laborsysteme, Germany
Thermomixer Eppendorf, Hamburg, Germany
Vortex Bender & Hobein, Karlsruhe
Water bath diverse

102
Chemicals All the chemicals used in this thesis with their corresponding sources are mentioned in the table below.
Name Source
1-phenyl-2-tricaine Sigma-Aldrich, Taufkirchen, Germany
4',6-diamidino-2-phenylindole (DAPI) Sigma-Aldrich, Taufkirchen, Germany
Acetic acid Merck, Darmstadt, Germany
Agarose Peqlab, Erlangen, Germany
Ammoniumacetate Merck, Darmstadt, Germany
Ampicillin Roth, Karlsruhe, Germany
Bacto Agar Roth, Karlsruhe, Germany
Calcium acetate Roth, Karlsruhe, Germany
Calciumchloride Sigma-Aldrich, Taufkirchen, Germany
Chloroform Sigma-Aldrich, Taufkirchen, Germany
Citric acid Roth, Karlsruhe, Germany
Dimethylsulfoxide (DMSO) Fluka, Neu-Ulm, Germany
Disodiumhydrogen phosphate Roth, Karlsruhe, Germany
Dithiothreitol (DTT) Roth, Karlsruhe, Germany
DNA-Ladder GeneRuler (Mix-1kb) Thermo Fisher Scientific, Waltham, USA
DNA-Ladder GeneRuler 50bp Thermo Fisher Scientific, Waltham, USA
DNAseI Ambion Ltd, Warrington, UK
dNTPs Promega, Mannheim, Germany
Ethanol (EtOH) Roth, Karlsruhe, Germany
Ethidiumbromide Roth, Karlsruhe, Germany
Ethylene diaminetetra acetic acid (EDTA) Roth, Karlsruhe, Germany
Formaldehyde Merck, Darmstadt, Germany
GeneArtTM PlatinumTM Cas9 nuclease (3
μg/μL) Invitrogen, Carlsbad, USA
Glycerol Roth, Karlsruhe, Germany
GoTaq DNA polymerase Promega, Mannheim, Germany
GoTaq qPCR Master Mix Promega, Mannheim, Germany
Hydrochloric acid (HCl) Merck, Darmstadt, Germany
Isoamyl alcohol Roth, Karlsruhe, Germany
Isopropanol Roth, Karlsruhe, Germany
Potassium chloride Sigma-Aldrich, Taufkirchen, Germany
Kanamycin Sigma-Aldrich, Taufkirchen, Germany
Low melting agarose Roth, Karlsruhe, Germany
Magnesium sulphate (MgSO4) Sigma-Aldrich, Taufkirchen, Germany
Maxi script T7 Kit Life Technologies GmbH, Darmstadt, Germany

103
Maxima First strand cDNA Synthesis Kit for
RT-qPCR Thermo Fisher Scientific, Waltham, USA
Methanol (MeOH) Roth, Karlsruhe, Germany
Methylene blue Interpret, Germany
mMESSAGEmMACHINE T3 Transcription
Kit Ambion, Darmstadt, Germany
Megashortscript T7 Kit Ambion, Darmstadt, Germany
NucleoBond BAC 100 Macherey-Nagel, Duren, Germany
Nucleospin purification Kits Macherey-Nagel, Duren, Germany
Oligonucleotides Metabion, Planegg, Germany
Paraformaldehyde Merck, Darmstadt, Germany
pCS2+ vector
Phosphate Buffered Saline (PBS) Life Technologies GmbH, Darmstadt, Germany
pGEMT-easy Promega, Mannheim, Germany
Phenol Roth, Karlsruhe, Germany
Phenol Red Roth, Karlsruhe, Germany
Proteinase K Sigma-Aldrich, Taufkirchen, Germany
Q5 Hifi DNA Polymerase New England Biolabs, Frankfurt a.M, Germany
QIAGEN Plasmid Midi purification kit Qiagen, Hilden, Germany
QIAGEN Plasmid Maxi Kit Qiagen, Hilden, Germany
Restriction enzymes New England Biolabs, Frankfurt a.M, Germany
Sodium acetate (NaAc) Roth, Karlsruhe, Germany
Sodium chloride (NaCl) Roth, Karlsruhe, Germany
Sodium hydrogen carbonate (NaHCO3) Roth, Karlsruhe, Germany
Sodium hydroxide (NaOH) Roth, Karlsruhe, Germany
Sodiumdodecylsulphate (SDS) Roth, Karlsruhe, Germany
Sp6/T3/T7 RNA polymerase Life Technologies GmbH, Darmstadt, Germany
T4 DNA Ligase New England Biolabs, Frankfurt a.M, Germany
T4 DNA Polymerase New England Biolabs, Frankfurt a.M, Germany
Tricaine methane sulphonate Von Pharmaq Ltd., Hampshire, United Kingdom
Tris-base Roth, Karlsruhe, Germany
Tris-HCl Roth, Karlsruhe, Germany
Triton-X-100 Roth, Karlsruhe, Germany
Tween20 Roth, Karlsruhe, Germany
Solution and buffers All solutions were prepared using autoclaved deionized water in sterile vessels and, if necessary, were autoclaved again before use. Below is the detailed recipe for each reagent used in this thesis.

104
Name Recipe
20x SSC-Buffer 3 M NaCl, 0.3 M sodium citrate
Blocking buffer 1x PBS, 0.1% v/v Tween20, 0.2% w/v BSA, 1% v/v
DMSO; stored at 4°C
Blocking buffer ISH 1% BSA, 1% DMSO in 1X PBS
BSMIS solution 75 mM NaCl, 70 mM KCl, 2 mM CaCl2, 1 mM
MgSO4, 20 mM Tris pH8 filled upto 1L; stored at
4°C
BT-fix 4% w/v PFA, 4% w/v sucrose, 0.12 mM CaCl2, 0.2
M Na2HPO4, 0.2 M NaH2PO4; stored at -20°C
E3 medium (60x) 5 mM NaCl, 0.17 mM KCl, 10 mM HEPES, 0.33
mM MgSO4, 0.33 mM CaCl2
Extraction buffer (whole genome
sequencing)
80 mM Tris-HCl pH 8.5, 200 mM NaCl, 0.5% SDS,
5 mM EDTA
Fructose solution 0.5% Fructose in egg water; can be stored at 4°C
for two weeks
Hybridization (HYB) buffer 50% v/v formamide, 5x SSC, 500 μg/ml yeast
RNA, 50 μg/ml heparin, 0.1% v/v Tween20, 9 mM
citric acid; stored at -20°C
KOH solution (50x) 1.25 M KOH, 10 mM EDTA; stored at 4°C
Neutralization buffer (50x) 315.2g Tris-Hcl in 1l water; stored at 4°C
Pronase solution 0.01 g/ml Pronase in E3 medium; stored at -20°C
Proteinase K solution 10 μg/ml proteinase K in PTW; stored at -20°C
PTW 1x PBS, 0.1% v/v Tween20
PTU solution 0.0003% w/v phenylthiourea, 1x E3 medium
Staining buffer 100 mM Tris-HCl pH 9.5, 50 mM MgCl2, 100 mM
NaCl, 0.5% v/v Tween20
TE buffer 10 mM Tris-HCl pH 8.0, 1 mM EDTA
Wash buffer 1 50% formamide, 50% 2x SSC; 0.1% v/v Tween20
Wash buffer 2 2x SSC, 0.1% v/v Tween20
Wash buffer 3 0.2% SSC, 0.1% v/v Tween20
Wash buffer 4 50% PTW, 0.5% v/v 20x SSC, 0.05% v/v Tween20
Softwares The softwares used in this thesis were mostly open source and available on the mentioned websites. Adobe Illustrator however were provided by KIT.
Name Usage Source
Adobe illustrator
CS6
Used for figure
configuration
Adobe
ApE Plasmid editor Wayne Davis from the University of Utah

105
ChopChop Online tool to design
guide RNAs
http://chopchop.cbu.uib.no/
Clustal Omega Online tool for multiple
sequence alignment
https://www.ebi.ac.uk/Tools/msa/clusta lo/
ExPASy translate
tool
Online tool to predict
protein sequences
https://web.expasy.org/translate/
Ensembl Gene sequence database,
genome browser
https://www.ensembl.org/index.html
Ligation
calculator
Online tool to calculate
ligation mixes
http://2011.igem.org/Team:UT_Dallas/li
gation
Primer3 version
4.1.0
Online tool to design PCR
primers
http://primer3.ut.ee/
Punnett Square
Calculator
Online tool for assessing
genotypes derived from
mendelian principles
http://scienceprimer.com/punnett- square-
calculator
Antibodies The primary antibodies used in this thesis were stored at 4°C post thawing but the original vials were stored at -20°C. The secondary antibodies however were always stored at 4°C away from light. The antibody solutions are made just before the final incubation step and primary antibodies were reused.
Primary Antibodies
Name Species of
origin
Target Source
-actinin
(1:300)
Mouse - skeletal and cardiac muscle actinin (Z
line)
Sigma
F59
(1:500)
Mouse Slow muscle myosin Developmental
Studies Hybridoma
Bank [DSHB],
University of Iowa
A1025
(1:100)
Mouse All muscle myosin Developmental
Studies Hybridoma
Bank [DSHB],
University of Iowa
Laminin
(1:100)
Rabbit Basement membrane (horizontal
myosepta)
Sigma
Titin
(1:250)
Mouse Titin localized around A-I junction
(skeletal and cardiac muscle)
Sigma

106
-sarcoglycan
(1:100)
Mouse Component of sarcoglycan complex,
link between F-actin and extracellular
matrix
Novocastra, Leica
Pax7
(1:50)
Mouse Courtesy: Dr. Olivier Kassel In house at KIT
Acetylated
𝛼 −tubulin
(1:500)
Mouse microtubules Sigma
Secondary Antibodies
-bungarotoxin
Alexa Four 488
(1:1000)
Venom from
Bungarus
multicinctus
Acetylcholine receptors in skeletal
muscle (neuromuscular junction)
Molecular probes
Alexa Flour 488
or 546
Phalloidin
(1:1000)
Toxin from
Amanita
phalloides
(death cap
mushrooms)
Filamentous actin Thermo fisher
scientific
Alexa flour 546
(1:1000)
Donkey anti-
mouse
Red fluorescence Invitrogen
Alexa flour 488
(1:1000)
Donkey anti-
mouse
Green fluorescence Invitrogen
DRAQ5 (1:2000) Nuclear
staining
From blue to red fluorescence Thermo fisher
scientific

107