Embed Size (px)
Citation preview

1
Do Value Investors Add Value?
George Athanassakos* Ben Graham Chair in Value Investing
Richard Ivey School of Business The University of Western Ontario London, Ontario, Canada N6A 3K7
[email protected] www.bengrahaminvesting.ca
Version 09.20-1
January 2010
Please do not Quote without Permission
Comments Welcome
* This paper represents an extension of a pilot study carried out at the Richard Ivey School of Business in 2008 by George Athanassakos, Reyer Barel and Saj Karsan entitled “Searching for and Finding Value: Canadian Evidence 1999-2006”. The pilot project and its extension have been funded by an Ivey Research Grant and would not have been possible without the hard work and commitment of a group of students who worked diligently on company valuations. The students and the time periods they covered are Reyer Barel and Saj Karsan (1999-2006), Dalton Baretto, Scott Gryba, Ali Sabur and Carter Yu (1985-1998) and Scott Gryba, Ali Sabur and Carter Yu (2007-2009). Many thanks also go to Carly Vanderheyden for excellent assistance.

2
Do Value Investors Add Value?
A B S T R A C T
The purpose of this paper is first to examine whether a value premium exists following a
mechanical screening process (i.e., the search process) in the Canadian markets between two distinctly
different periods, 1985-1999 and 1999-2007, and second whether value investors add value in the stock
selection process by being able to find truly undervalued stocks from the universe of the possibly
undervalued stocks identified from the search process. We find that a strong and pervasive value
premium exists in Canada over our sample periods that persists in bull and bear markets and during
recessions/recoveries. Value stocks, on average, beat growth stocks even when using the very
mechanical screening of the search process. Furthermore, this paper demonstrates that value investors
do add value, in the sense that their process of selecting truly undervalued stocks, via in-depth security
valuation of the possibly undervalued stocks and arriving at their investment decision using the concept
of “margin of safety”, produces positive excess returns over and above the naive approach of simply
selecting low P/E - P/BV ratio stocks. The paper was extended to the years of the “great recession”
(2008-2009) and despite the fact that over this extended period we had a severe recession and bear
market, on average, the sophisticated portfolio still beat the naïve value portfolio, consistent with
earlier evidence.

3
Do Value Investors Add Value?
1. Introduction
A large body of academic research has shown that value stocks (i.e., low price-to-earnings (P/E)
or price-to-book value (P/BV) stocks) tend to have higher average returns than growth stocks (i.e., high
P/E or high P/BV stocks). Basu (1977) was the first to confirm the existence of a value premium, namely,
that value stocks outperform growth stocks. More recently, Chan, Hamao and Lakonishok (1991), Fama
and French (1992, 1993, 1996), Lakonishok, Shleifer and Vishny (1994), Chan and Lakonishok (2004) and
Athanassakos (2009 (a), (b)) have found evidence consistent with a positive value premium in markets
around the globe using not only P/E based classifications of stocks into value and growth, but also other
search criteria which value investors have traditionally used to divide stocks into value and growth, such
as P/BV and dividend yield.
While academic papers, such as the ones referred to above, have claimed to examine value and
growth strategies and their performance, such claim is only partly correct. The problem with the
academic classification of stocks into value and growth is that such stock selection approach is only part
of what value investors do! Value investors use the above mentioned screening process, namely
screening for the low P/E or low P/BV stocks, to identify possibly undervalued stocks. But this is not all.
This is the first step they follow in stock selection. Once the possibly undervalued stocks are screened
out, value investors then proceed to the second step of their analysis which is to identify the stocks that
are truly undervalued by valuing individually each stock and arriving at their investment decision using
the concept of the “margin of safety”.
Unfortunately, academics do not and cannot know which stocks value investors eventually
choose to invest in and so they only look at the first step of value investors’ stock selection process.
After all, academics know that it is from this group of low P/E or low P/BV stocks that value investors
tend to select stocks to invest in. Consequently, academics tend to call the low P/E (or P/BV) stocks
value stocks and the high P/E (or P/BV) stocks growth stocks, as this latter group of stocks is not the
group of stocks from which value investors typically tend to select stocks to invest in. The first step of
stock selection, and the one the academics have examined, is a naïve process and entirely mechanical.
Anyone can run such a stock screening selection process to identify possibly undervalued stocks. The
value that value investors add, however, is with regards to their second step of stock selection, namely,

4
valuing each stock individually and using the concept of “margin of safety” in order to identify the truly
undervalued stocks. And it is this step in particular that previous academic research has not examined.
Using Canadian data for two distinctly different sub-periods 1985-1999 and 1999-2007, this
paper has two objectives.1 The first is to confirm that a value premium exists in our sample of stocks
using a search process (i.e., the first step of stock selection) that consists of cross-sorting stocks by both
P/E and P/BV ratios. Our hypothesis here is that we expect (potentially) value stocks (i.e., low P/E - low
P/BV) to beat growth stocks (i.e., high P/E - high P/BV).2 The second is to examine whether the second
step of valuation and stock selection that value investors follow adds any value. In this regard, our
hypothesis is that if value investors really add any value, stocks found to be truly undervalued (i.e., the
truly value stocks), on average, beat stocks selected naïvely via the first step of stock selection (i.e., the
potentially value stocks).3 So the question is: Do value investors add any value? Answering this question
is the key objective of this paper, and the paper’s main contribution. Previous academic research has
said nothing about the value of value investors; this paper will.
We find that a strong and pervasive value premium exists in Canada over our sample sub-
periods that persist in bull and bear markets and during recessions/recoveries. Furthermore, this paper
demonstrates that value investors do add value, in the sense that their process of selecting truly
undervalued stocks, via in-depth security valuation of the possibly undervalued stocks and arriving at
their investment decision using the concept of “margin of safety”, produces positive excess returns over
and above a naive approach of simply selecting low P/E - P/BV ratio stocks.
The rest of the paper is structured as follows. Section 2 discusses the data and methodology.
Section 3 presents the empirical findings, while section 4 concludes the paper.
1 The first sub-period, 1985-1999, was characterized by a classic bull market when markets witnessed a continuous
upward trend, whereas the second sub-period, 1999-2007, with the exception of the materials and oil sectors, was characterized by relatively flat markets. 2 Previous academic evidence supports this hypothesis (See Basu (1977), Chan, Hamao and Lakonishok (1991), Fama
and French (1992, 1993, 1996), Lakonishok, Shleifer and Vishny (1994), Chan and Lakonishok (2004) and Athanassakos (2009 (a), (b))). 3 The performance of legendary value investors, such as Mr. Warren Buffett and Mr. Walter Schloss, over long time
periods supports this hypothesis. Under Mr. Buffett, Berkshire Hathaway has averaged a 25%+ annual return to its shareholders for the last 25 years, while employing large amounts of capital and minimal debt. Mr. Schloss and his son Edwin, over the period 1956 to 2000, provided investors a compounded return of 15.3% compared with the S&P 500’s annual return on 11.5% (See http://www.bengrahaminvesting.ca/Teaching_Applications/Guest_Speakers/2008_speakers.htm).

5
2. Data and Methodology
This paper uses data from COMPUSTAT from which earnings per share (E), book value per share
(BV), shares outstanding, stock prices, and dividends paid are obtained, and from which trailing price to
earnings (P/E) and price to book value (P/BV) ratios and market cap are derived. For the trailing P/E and
P/BV ratios, the price (P) is as of the end of April of year (t) and E and BV are, respectively, the December
(t-1) fully diluted annual earnings per share and book value per share for companies with fiscal year end
December (t-1), as reported in COMPUSTAT. Market cap is derived by multiplying price per share times
shares outstanding at the end of April of year t. Annual total stock returns for the second sub-period are
calculated as the price change plus the dividend from April of year t to April of year t+1 over the price in
April of year t, using COMPUSTAT. For the first sub-period, due to data unavailability, annual total
returns were calculated as above, but data for the calculation were obtained from the Canadian
Financial Markets Research Center (CFMRC) data base.
Our sample includes all December fiscal year end non-financial services companies that trade on
the Toronto Stock Exchange (TSX).4 Based on this, we started with COMPUSTAT’s industrial 4443 year-
firm observations (data) belonging to 1263 companies for the period 1985-1999, and 4503 year-firm
observations (data) belonging to 1081 companies for the period 1999-2007. We carried out a number of
screenings to the data. Companies are not income trusts. Companies are required to have return data
available for the year following the determination of P/E and P/BV ratios unless a company was acquired
in which case the stock return for the remaining annual period was assumed to be the Canadian t-bill 6
month rate obtained from the Bank of Canada database. To prevent problems arising from including
negative or extremely positive P/E and P/BV ratio firms, and eliminate likely data errors (See La Porta,
Lakonishok, Shleifer and Vishny (1997), Griffin and Lemmon (2002) and Cohen, Polk and Vuolteenaho
(2003)), we have excluded negative P/E and P/BV ratios, as well as P/E ratios in excess of 150 and P/BV
in excess of 20. Firms had to have both P/E and P/BV ratios within the aforementioned boundaries to be
4 We exclude financial services companies, such as banks and insurance companies, since the high leverage normally
employed by these companies does not have the same meaning as for non-financial companies for which high leverage indicates financial distress.

6
included in the sample. Finally, to be included in our sample a stock had to have a price over $1. 5,6
Our data, which are adjusted for stock splits and stock dividends, are for each year over two
distinctly different sub-periods, 1985-1999 and 1999-2007. These periods were chosen and kept
separate for the following reasons: The first sub-period was characterized by a steadily rising stock
market, while the second sub-period was a most challenging period for the stock market – with the
exception of the materials and oil sectors, the stock market overall remained mostly flat over this sub-
period which also included the burst of the stock market bubble. After all aforementioned screenings,
we end up with 2139, in 1985-1999, and 1301, in 1999-2007, cross sectional-time series (firm-year)
observations belonging to a cumulative number of 406 and 377 unique companies, respectively over the
two sample sub-periods. The tables below report the total number of observations (companies
examined) per year for each sub-period.
Sub-period 1985-1999
Year Number of Observations
1985 133
1986 142
1987 139
1988 168
1989 147
1990 135
1991 126
1992 98
1993 116
1994 164
1995 222
1996 174
1997 178
1998 197
5 Since our sample only includes firms with fiscal year end December of year (t-1), all firms have released their annual
reports needed for the valuations and information for earnings per share and book value per share by April of year (t). 6 For sub-period 1985-1999, the no income trust screen eliminated 182 observations, price over $1 39 observations,
the P/E restrictions 722 observations and the P/BV restrictions 108 observations. In addition, 407 and further 846 observations were eliminated as there were no price and EPS data, respectively available in COMPUSTAT. For sub-period 1999-2007, the no income trust screen eliminated 971 observations, price over $1 622 observations, the P/E restrictions 563 observations and the P/BV restrictions 15 observations. In addition, 811 and further 220 observations were eliminated as there were no price and EPS data, respectively available in COMPUSTAT.
Sub-period 1999-2007
Year Number of
Observations
1999 162
2000 175
2001 177
2002 148
2003 144
2004 150
2005 167 2006 178

7
At the end of April of every year (t), starting either in 1985 or in 1999, firms are ranked based on
trailing P/E ratios from low to high and the ranked firms are divided into four groups of equal size. Each
P/E based quartile is then subdivided into four quartiles based on P/BV ratios from low to high. This
process is repeated for each year of our sample. Membership in a quartile changes each year as
multiples change from year to year. Inclusion in a quartile depends on a stock’s multiple in relation to
other stocks’ multiples. Because P/E and P/BV ratios change over time, an arbitrary measure across time
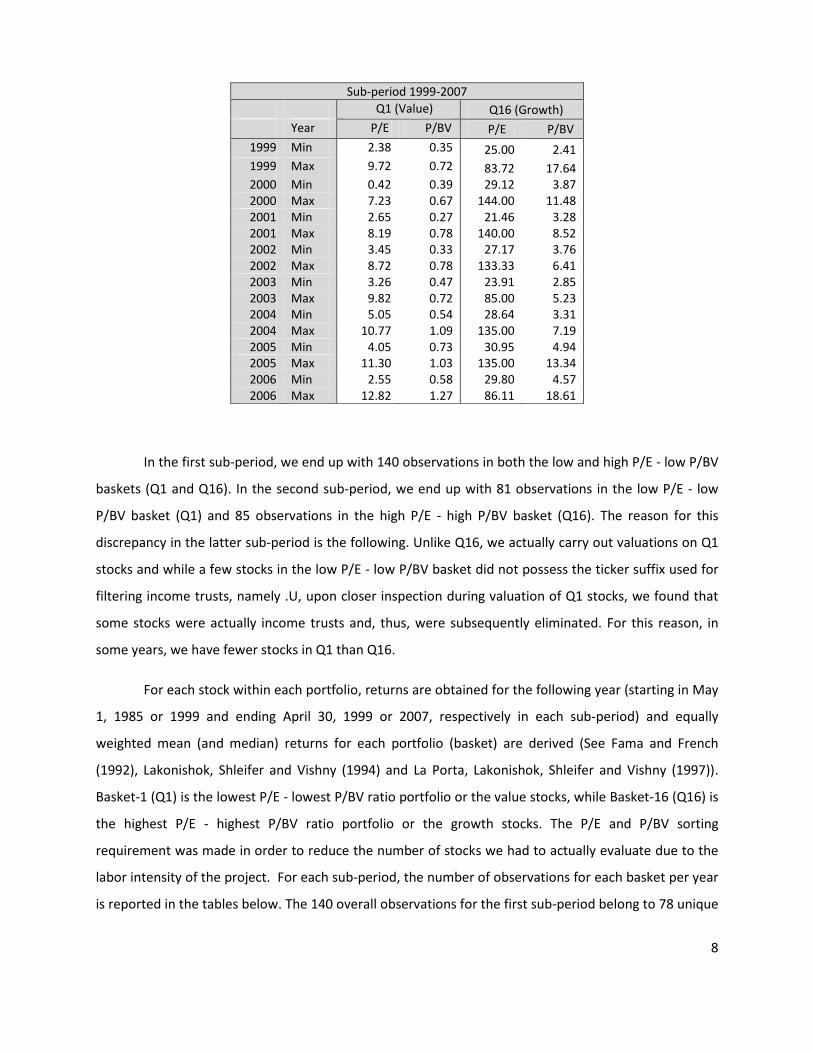
for all stocks in our sample would be inappropriate. The range of P/E – P/BV ratios per year for the low
P/E – low P/BV basket (Q1) and the high P/E – high P/BV basket (Q16), per sub-period, are reported in
the tables below.
Sub-period 1985-1999
Q1 (Value) Q16 (Growth)
Year P/E P/BV P/E P/BV
1985 Min 3.15 0.48 17.73 2.87
1985 Max 8.92 0.74 52.28 8.00 1986 Min 3.87 0.40 24.22 4.46 1986 Max 10.25 0.86 48.65 17.42 1987 Min 1.61 0.23 29.18 4.23 1987 Max 13.93 1.23 101.48 30.00 1988 Min 1.18 0.11 22.52 2.87 1988 Max 8.28 0.90 49.50 10.51 1989 Min 7.30 0.43 18.68 2.33 1989 Max 8.88 1.01 55.09 12.70 1990 Min 3.93 0.14 18.71 2.29 1990 Max 6.84 0.79 41.60 6.46 1991 Min 2.41 0.14 26.14 1.78 1991 Max 9.49 0.82 103.13 8.47
1992 Min 7.49 0.42 35.94 2.83
1992 Max 11.88 1.09 146.15 4.55 1993 Min 5.68 0.70 53.33 2.99 1993 Max 13.01 1.12 93.75 13.54 1994 Min 2.28 0.41 37.09 4.01 1994 Max 10.95 1.15 130.00 47.77 1995 Min 2.76 0.26 25.51 2.79 1995 Max 10.18 0.91 105.00 6.91 1996 Min 1.41 0.45 33.27 3.91 1996 Max 9.13 0.78 137.50 12.15 1997 Min 4.40 0.70 26.41 3.18 1997 Max 12.10 1.04 89.63 5.87 1998 Min 0.66 0.56 32.45 4.04 1998 Max 15.45 1.02 129.41 20.51
8
In the first sub-period, we end up with 140 observations in both the low and high P/E - low P/BV
baskets (Q1 and Q16). In the second sub-period, we end up with 81 observations in the low P/E - low
P/BV basket (Q1) and 85 observations in the high P/E - high P/BV basket (Q16). The reason for this
discrepancy in the latter sub-period is the following. Unlike Q16, we actually carry out valuations on Q1
stocks and while a few stocks in the low P/E - low P/BV basket did not possess the ticker suffix used for
filtering income trusts, namely .U, upon closer inspection during valuation of Q1 stocks, we found that
some stocks were actually income trusts and, thus, were subsequently eliminated. For this reason, in
some years, we have fewer stocks in Q1 than Q16.
For each stock within each portfolio, returns are obtained for the following year (starting in May
1, 1985 or 1999 and ending April 30, 1999 or 2007, respectively in each sub-period) and equally
weighted mean (and median) returns for each portfolio (basket) are derived (See Fama and French
(1992), Lakonishok, Shleifer and Vishny (1994) and La Porta, Lakonishok, Shleifer and Vishny (1997)).
Basket-1 (Q1) is the lowest P/E - lowest P/BV ratio portfolio or the value stocks, while Basket-16 (Q16) is
the highest P/E - highest P/BV ratio portfolio or the growth stocks. The P/E and P/BV sorting
requirement was made in order to reduce the number of stocks we had to actually evaluate due to the
labor intensity of the project. For each sub-period, the number of observations for each basket per year
is reported in the tables below. The 140 overall observations for the first sub-period belong to 78 unique
Sub-period 1999-2007
Q1 (Value) Q16 (Growth)
Year P/E P/BV P/E P/BV
1999 Min 2.38 0.35 25.00 2.41 1999 Max 9.72 0.72 83.72 17.64 2000 Min 0.42 0.39 29.12 3.87 2000 Max 7.23 0.67 144.00 11.48 2001 Min 2.65 0.27 21.46 3.28 2001 Max 8.19 0.78 140.00 8.52 2002 Min 3.45 0.33 27.17 3.76 2002 Max 8.72 0.78 133.33 6.41 2003 Min 3.26 0.47 23.91 2.85 2003 Max 9.82 0.72 85.00 5.23 2004 Min 5.05 0.54 28.64 3.31 2004 Max 10.77 1.09 135.00 7.19 2005 Min 4.05 0.73 30.95 4.94 2005 Max 11.30 1.03 135.00 13.34 2006 Min 2.55 0.58 29.80 4.57 2006 Max 12.82 1.27 86.11 18.61

9
companies for Q1 and 75 unique companies for Q16. The 81 overall observations in Q1 and 85
observations in Q16 for sub-period 1999-2007 correspond to 48 and 59 unique companies, respectively.
Sub-period 1985-1999
Q1 (Value) Q16 (Growth)
Year Number of
observations Number of
observations
1985 8 8
1986 9 9
1987 9 9
1988 11 11
1989 10 10
1990 9 9
1991 8 8
1992 7 7
1993 8 8
1994 11 11
1995 14 14
1996 11 11
1997 12 12
1998 13 13
Sub-period 1999-2007
Q1 (Value) Q16 (Growth)
Year Number of
observations Number of
observations
1999 10 10
2000 10 11
2001 11 12
2002 8 9
2003 9 10
2004 10 10
2005 11 11
2006 12 12
Total 81 85
A time series of non-overlapping annual returns are obtained for each stock within the Q1 and
Q16 portfolios (and for each portfolio) from May 1, 1985 (1999) to April 30, 1999 (2007). Summary
statistics of variables of interest (i.e., value and growth stock returns, value premium, market cap) for
the various stocks and portfolios are calculated and univariate analysis ensues that looks at value and
growth stock performance and the value premium. If a stock stopped trading due to an acquisition, then
the remaining of the year returns for this stock were estimated as being the Canadian 6-month t-bill rate
of return obtained from the Bank of Canada database. For Q1, there were 1 stock in 1986, 1993, 1996,
1997, and 2002, and 2 stocks in 2000 that stopped trading within a given year. For Q16, there were 1
stock in 1986, 1987, 1997, 2000, 2001 and 2002 that stopped trading within a given year. Combined in
Q1 and Q16, we had overall 7 companies in 1985-1999 and 6 companies in 1999-2007 for which we had
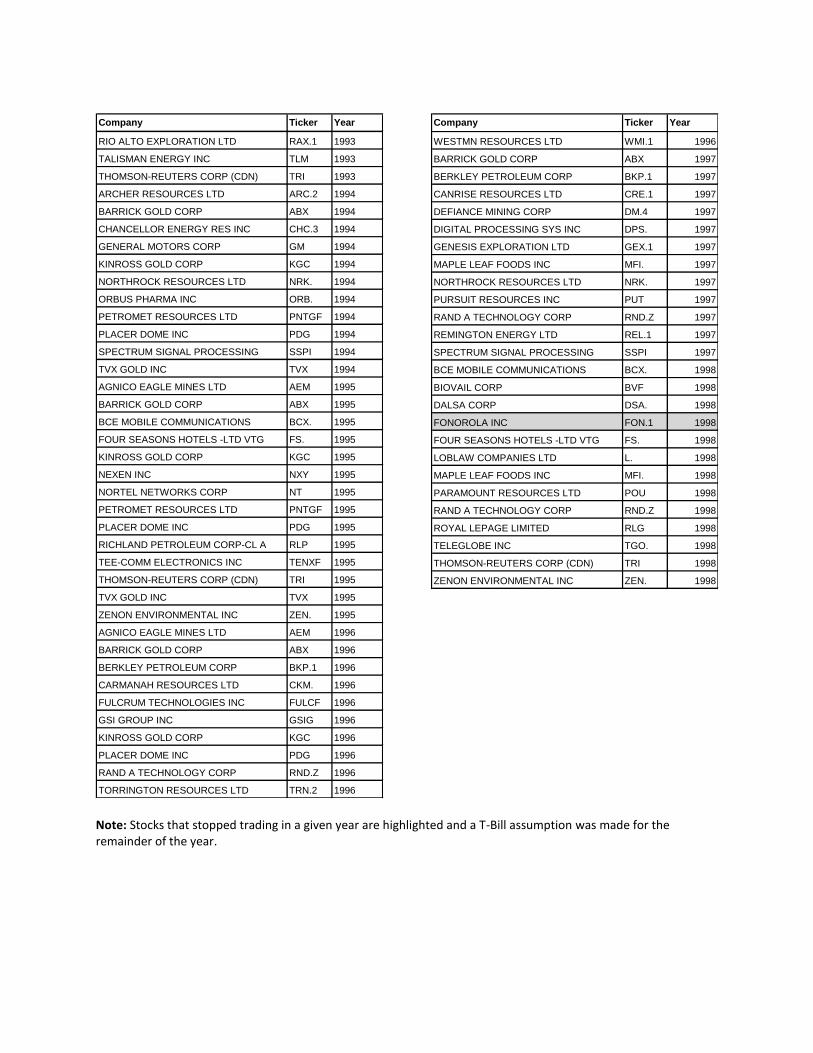
to use the 6 month t-bill assumption. Appendices A, B (which show the stocks contained in Q1 and Q16)
and D (which shows the stocks from Q1 selected as truly undervalued after careful valuation) highlight
the stocks that stopped trading within a year and the t-bill assumption had to be made.

10
As soon as a value premium is established, we then go on to determine whether the second step
of the value investing process, namely, valuing each stock and determining whether it is truly
undervalued to buy, will beat the naïvely determined value stocks, namely, the first step of the value
investing process.
To determine the truly undervalued stocks, the naively chosen stocks from Q1 were individually
valued. The annual reports of the companies in question were obtained from Sedar.com. The objective
here was to see if investing in the truly undervalued stocks, using a valuation approach employed by
value investors, will lead to returns higher than those of the naively chosen Q1 stocks.
For each stock in Q1, two valuations were carried out. First, the net replacement value of each
company’s assets (called Net Asset Value) was estimated using an approach similar to the one described
in Greenwald etc. (2001). Second, a Free cash Flow (FCF) based valuation for each company was
produced (called Earnings Power Value), by normalizing FCFs and discounting them to infinity using a
perpetuity formula. The discount rate was the weighted average costs of capital (WACC), with the cost
of equity obtained from the bond plus risk premium approach described in Athanassakos (1998), and
the cost of debt obtained from the company’s rating and the YTM of similarly rated companies obtained
from Canadian Bond Rating Service and Scotia Capital Markets (1985-1999) and Moodys and Bloomberg
(1999-2007). The weights in the WACC formula were the company’s target capital structure weights.
Value investors believe that in the long run, in a free entry market, the return on invested
capital (ROIC) will be equal to WACC, and so for the majority of companies the Discounted Cash Flow
(DCF) model becomes one of perpetuity. However, if a company has a sustainable competitive
advantage, a (real) growth assumption is incorporated in the DCF model and the value with growth (Vg)
is derived.
Consequently, for each company two values were derived. One is the Net Asset Value (NAV)
and the other the Earnings Power Value (EPV). Where exactly the company’s intrinsic value lies depends
on strategic analysis and the probabilities of possible outcomes. If the NAV exceeds the EPV, a catalyst
was assumed depending on the probability of a takeover or the probability of management change
given public information available in the financial press. In this case, the company’s intrinsic value was
between NAV and EPV. Whether the intrinsic value was closer to NAV than EPV depended on how high
or low the probability of the aforementioned changes was, respectively. If EPV was above NAV, then an
11
analysis of the company’s competitive environment was made to determine whether the company had
a sustainable competitive advantage. If that was the case, then the company’s intrinsic value was its
EPV; if not, the company’s intrinsic value was between EPV and NAV. How close to EPV or NAV the
intrinsic value was depended on how strong we felt, given available information and our strategic
analysis of the industry and company, the probability of sustainability of competitive advantage was.
The lower this probability, the closer to NAV the intrinsic value was and vice versa. If a (real) growth
assumption was necessary, then the value with growth was estimated (Vg) which for obvious reasons
exceeded EPV (the no growth valuation to perpetuity). In this case, the company’s intrinsic value was Vg.
We found 87 cases in the first sub-period and 54 cases in the second sub-period, in which NAV was
above EPV, 2 and 18 cases, respectively for which EPV was above NAV and no case and only 1 case,
respectively for which a growth assumption was necessary, that is, when Vg was higher than EPV.7 Once,
the intrinsic value is estimated, the entry price is calculated as 2/3 of the intrinsic value. This allows for
1/3 margin of safety. The entry price in the growth case is the lower of EPV or 2/3 of Vg.
If a stock’s current price is below the entry price, a decision is made to invest in this stock; the
stock is truly undervalued. Otherwise, a decision is made not to invest in the stock in the following 12
month period. At the end of each 12-month period, stocks are liquidated and annual returns are
calculated for this period. At the beginning of the next 12-month period, new intrinsic values and entry
prices are re-estimated. Stocks whose current price is below their re-estimated entry price are invested
in the new sophisticated portfolio for the following 12 months, and the process continues for every
subsequent 12-month period. That is, at the beginning of each 12-month period, every stock in the
sophisticated portfolio needs to have met the condition of having a price less than its entry price to
justify its position in the following year’s sophisticated portfolio. While this portfolio rebalancing may
not be entirely true for all value investors many of whom may still be invested in the stock as long as it
hasn’t reached its intrinsic value, the fact that a stock has moved up over the previous year and is now
7 In the first sub-period, the valuation team found a number of companies that were outside their “circle of
competence” to value reliably. These companies were (26) resource companies (eliminated due to uncertain real options), (6) private equity firms or holding companies (eliminated due to uncertain value of investments or holdings) and (12) companies of high business and financial risk (due to extreme financial distress situations). In addition, five companies had no data available and 2 companies were recent IPOs for which no historical data were available and they were thus eliminated from the valuation step. The exclusion of such companies also helped reduce the number of companies that had to be valued and made the project more manageable. As a result, 89 companies were actually valued and not 140 as originally indicated for sub-period 1985-1999. In the second sub-period, where there were fewer companies to be valued, at the valuation step, the valuation team eliminated six companies that had high business and financial risk and two companies for which annual reports were not available. No other companies were eliminated in this sub-period as the valuation team felt that the remaining companies were within their “circle of competence” and could be reasonably valued. As a result, 73 companies were actually valued and not 81 as originally indicated for sub-period 1999-2007.

12
above its new entry price may mean that much of the upside on the stock has been realized and better
investment opportunities may exist in other stocks with price less than entry price that are worth
investing in with higher upside. Besides, our objective is to compare the returns of the sophisticated
portfolio to those of the naïve Q1 portfolio and, to do this accurately and consistently, we need to
derive annual total returns for both portfolios. Since the assumption of once a year rebalancing applies
to Q1, the same assumption is also made for the sophisticated portfolio. The final number of stocks per
year in the invested “sophisticated” portfolio (Q1S) is shown below. The total number of stocks
purchased in the sophisticated portfolio corresponds to 44 companies (30 unique companies) in the first
sub-period and 33 companies (24 unique companies) in the second sub-period. That is, a few companies
were repeat members of the sophisticated portfolio as, year after year, they met the price less than
entry price condition.
Sub-period 1985-1999
Year
# of Stocks in Sophisticated Portfolio
1985 3
1986 3
1987 2
1988 2
1989 3
1990 3
1991 1
1992 1
1993 3
1994 3
1995 4
1996 5
1997 7
1998 4
Sub-period 1999-2007
Year
# of Stocks in Sophisticated Portfolio
1999 4
2000 6
2001 5
2002 4
2003 4
2004 2
2005 4
2006 4
To our knowledge, this is the first study to examine both steps of the value investing decision
making approach and explore whether value investors add value to the strictly mechanical search
process.
13
3. Empirical Results
3.1. Step 1: The search Process - Is There a Value Premium?
Tables 1 and 2 report, respectively, the mean and median annual returns of P/E - P/BV sorted
value (Q1) and growth (Q16) portfolios and the value premium (Q1 minus Q16) per year and overall.
Table 1 also reports the variance of returns of the value and growth portfolios and their Sharpe ratio
performance metrics for the two sub-periods examined. Figures 1 and 2, on the other hand, shows
diagrammatically how the value premium has behaved over the two sub-periods.
It is quite apparent from these Tables that a value premium exists and it is quite impressive for
its size and consistency, particularly for the 1999-2007 sub-period. The value premium in Table 1 is
mostly positive. In the years when the value premium is negative, the size of the value premium is
relatively small, when compared with the years when the value premium is positive. In Table 2, all
annual value premiums are positive. For 1985-1999, the mean (median) annual value premium (Q1-Q16)
is 2.4% (3.7%). For 1999-2007, the mean (median) annual value premium is 16.60% (16.00%). For
comparative purposes, using only P/E sorting, Athanassakos (2009 (a)) finds that the mean value
premium in Canada for the period 1985-2005 is 6.30%, whereas Athanassakos (2009 (b)), using again P/E
sorting, finds that the mean value premium in the US is 6.24%, 11.40% and 6.00% for AMEX, NASDAQ
and NYSE stocks, respectively for the period 1986-2006.
Tables 1 and 2 also allow us a glimpse into the behavior of the value premium during recessions
and/or bear markets. For example, www.thedowtheory.com/bear&recessions.htm reports years 2000
and 2002 as bear market years and years 1991 and 2001 as recessionary years. With the exception of
the mean value premium in 1991 which is negative, Tables 1 and 2 show that irrespective of the state of
the world, the value strategy normally beats the growth strategy. Table 1, Panel A shows that in 1991, a
recessionary year, the growth strategy beats the value strategy by 6.3%. Table 1, Panel B, however,
shows that in the bear market years value and growth portfolios experience about the same return,
whereas in 2001, the year of recession, value clearly beats growth. In Table 2, Panel A, which shows
medians for the period 1985-1999, the value premium is positive in 1991, the recessionary year. In
Table 2, panel B, which shows medians for the period 1999-2007, all value premiums are positive in both
bear markets years (2000 and 2002) and recessionary year (2001). It can also be easily inferred from
Tables 1 and 2 that, value premiums in adverse states of the world are mostly comparable to the value
14
premiums at favorable states of the world over our two sample periods, particularly the 1999-2007 sub-
period. These findings are consistent with Athanassakos (2009 (a), (b)) and Kwag and Lee (2006) who,
similar to our findings, show that value stocks in Canada and the US, on average, outperform growth
stocks throughout the business cycle.
How does the variance and firm-size of the value stocks compare to those of the growth stocks?
Table 1 reports the variance of the annual returns of the value and growth portfolios, while Table 3
reports market cap of the value and growth portfolios per year over our two sub-periods. These tables
show that value stocks tend to be smaller than growth stocks and that while the value portfolio has
higher annual variance of returns than the growth portfolio in the second sub-period, the opposite is the
case in the first sub-period. The smaller size of Q1 vs. Q16 may imply that the outperformance of value
over growth stocks is driven by risk, as normally one would expect smaller stocks to have higher risk
than larger stocks. However, if risk drove the findings, one would expect to find (a) consistently higher
variance in the returns of value vs. growth stocks and (b) that the higher risk of value stocks is
manifested more vividly during adverse states of the world (such as recessions and bear markets) at
which time growth would beat value strategies. As this is not the case, one cannot attribute the return
differences between value and growth stocks to possible higher risk of value stocks. The risk issue will
also be addressed in the following section, where risk is incorporated in the valuation exercise, intrinsic
value, entry price and final investment decision making.
Nevertheless, regardless of which way one wants to interpret this evidence, Table 1 shows that
the Sharpe ratio of value stocks (0.24 in 1985-1999; and 0.83 in 1999-2007) exceeds the Sharpe ratio of
growth stocks (0.14 in 1985-1999; and 0.75 in 1999-2007) indicating that value stocks have had a better
risk adjusted performance than growth stocks over our sample sub-periods. The p-value of the
difference between the Sharpe ratios of these two portfolios, calculated based on a test of significance
discussed in Jobson and Korkie (1981), is 0.09 in 1985-1999 and 0.03 in 1999-2007.
Could it be that the value premium is driven only by a few value stocks with very large positive
returns? Table 4 reports the percentage of stocks with positive and the percentage of stocks with
negative returns for the value and growth portfolios for every year over our sample sub-periods. In the
first sub-period, both value and growth stocks experience more positive than negative returns in 9 out
of the 14 years. In the second sub-period, in every year, more stocks in the value portfolio have positive

15
returns than negative. This is true only in 4 out of the 8 years for the growth portfolio. Consequently,
the value premium is pervasive and not the result of a few outliers.
3.2. Step 2: Valuation – Is Any Value Added?
Now that we established that there is a value premium over our sample sub-periods which is
consistent with previous academic research, the question is: can a value investor with his/her ability to
value stocks, using value investing principles, do better than an approach that naively picks a basket of
stocks with the lowest P/E – P/BV ratio combination?
All stocks that were previously sorted in the value basket (Q1) are now individually valued in a
very time consuming and laborious way. First, the intrinsic value of a stock is estimated as discussed
earlier and then the entry price is calculated as intrinsic value less 1/3 of the intrinsic value - the margin
of safety. If a stock’s current price is below its entry price, a decision is made to buy this particular stock.
If not, a decision is made not to purchase the stock. We refer to the portfolio with the stocks in which
we choose to invest as the “sophisticated portfolio” (Q1S), whereas the value portfolio Q1 is referred to
as the “naïve portfolio”. The annual and overall mean and median returns of the sophisticated portfolio
and its excess returns from the naïve value Q1 portfolio are reported in Tables 5 and 6. Figures 3 and 4,
on the other hand, show diagrammatically the excess return of the sophisticated portfolio over the
naïve portfolio over the two sample sub-periods. Appendix C shows the kind of reports we produced for
each stock in portfolio Q1. Appendix D reports the actual stocks we chose to purchase and include in the
sophisticated portfolio (Q1S) per sub-period after painstaking valuations.
The sophisticated portfolio (Q1S) beats the naïve Q1 portfolio both in mean and median returns.
The mean (median) outperformance in sub-period 1985-1999 is 1.10% (3.30%), while in sub-period
1999-2007 is 13.20% (3.80%). Tables 5 and 6 also show that the sophisticated portfolio beats the naïve
one in both bear market years and the recessionary market years. Irrespective of the state of the world,
both the mean and median returns of the sophisticated portfolio exceed those for the naive portfolio.
Moreover, it can be easily inferred from Tables 5 and 6 that the sophisticated portfolio outperforms the
naïve portfolio by more in adverse states of the world than in favorable states of the world. Finally,
Table 7 reports that, in general, the percentage of positive returns in the sophisticated portfolio is higher
than the percentage of positive returns in the naïve portfolio.

16
Table 5 also shows that the variance of the sophisticated portfolio is somewhat higher than the
variance of the naïve one, while Table 8 shows that the market cap of these two portfolios is about the
same. The risk adjusted returns of the sophisticated portfolio exceed those of the “naive portfolio” as
exemplified by the higher Sharpe ratio of the sophisticated portfolio than the naïve one (See Tables 5
and 6). The Sharpe ratio for the sophisticated and naïve portfolios is 0.30 vs. 0.24 in 1985-1999, and 1.07
vs. 0.83, in 1999-2007, respectively.8 The p-value of the difference between the Sharpe ratios of these
two portfolios, again calculated based on a test of significance discussed in Jobson and Korkie (1981), is
0.15 in 1985-1999 and 0.01 in 1999-2007.9
Moreover, the valuation exercise described above and the eventual decision to buy a stock in
the sophisticated portfolio accounts for risk and makes the final stock selection less risky in the sense of
reducing the possibility of loss of capital.10 Preserving capital is of paramount importance in the
investment decision process of value investors. The margin of safely taken off the intrinsic value to
arrive at the entry price ensures downside protection that goes beyond diversification without
sacrificing the returns of the chosen stocks. In addition, Q1 and Q1S are both from the same basket of
stocks and have the same market cap as shown in Table 8. And the fact that the sophisticated portfolio
beats the naïve one by more in adverse than favorable states of the world further supports the
argument that the risk of the sophisticated portfolio is not higher than that of the naïve portfolio.
Hence, risk does not seem to drive the outperformance of the stocks that value investors choose to
eventually invest in (i.e., the truly undervalued stocks), which is the key contribution of this paper.
Finally, not only does the sophisticated portfolio beats the naïve portfolio Q1, but Q1
significantly beats Q16, making the sophisticated portfolio outperform Q16 by a substantial amount,
8 It is possible that the exclusion of the companies indicated in footnote #7 from the second step of the value investing
process may have impacted the strength of the findings in the first sub-period as there may have been many truly undervalued stocks among the excluded companies. 9 It should be noted that this test has low power in the sense that is it is difficult to find statistical significance even if
the true difference in Sharpe ratios is not zero. 10
The issue of whether risk or behavioral factors drive the value premium has arisen because academics deal only with the first step of the value investing process. Not knowing what stocks value investors tend to buy, academics resort to arguments about risk to justify the value premium (See Fama and French (1992, 1993, 1996)). However, if one knows the intrinsic value of a stock and its entry price (which accounts for the margin of safety), and, hence, what stocks value investors would buy, as per second step of the value investing process, then he/she should know the risk of the portfolio/stocks. In the valuation process, risk is adjusted through the risk premium in the discount factor and in the final selection process risk is controlled for via the margin of safety.
17
which is too large to be explained by possible risk differences. As a result, value investors proceeding to
the second step in the stock selection process do add value.11
3.3. How About 2007-2009?
This study had started well before the credit crisis of 2008-2009 engulfed the world economies
and markets. It ended right at the time the credit crisis hit.
As data have now become available for 2008 and 2009, and as readers will be interested in
knowing how the value investing approach worked over this period of crisis, we decided to extend this
paper to also include the credit crisis period.
The methodology and process are the same as described earlier. Following same screenings as
before, we end up with 223 observations in 2007 and 183 observations in 2008. We then form Q1 (the
value portfolio) and Q16 (the growth portfolio) for 2007 and 2008 with the following ranges for P/E and
P/BV: Q1-2007 (min P/E: 3.60, max P/E: 11.92; min P/BV: 0.71, max P/BV: 1.23); Q1-2008 (min P/E:
3.80, max P/E: 11.14; min P/BV: 0.62, max P/BV: 1.10); Q16-2007 (min P/E: 33.46, max P/E: 144.14; min
P/BV: 5.38, max P/BV: 10.15); Q16-2008 (min P/E: 31.04, max P/E: 112.47; min P/BV: 4.36, max P/BV:
15.93). There were 14 observations in 2007 and 12 observations in 2008 for Q1 and Q16. We only found
2 truly undervalued stocks in 2007 and only 1 truly undervalued stock in 2008, and these stocks were
included in the sophisticated portfolio.
Tables 9 and 10 show the mean and median annual returns for Q1 and Q16, while Tables 11 and
12 show the mean and median annual returns for Q1S (the “sophisticated” (value) portfolio) and Q1 (the
“naïve” (value) portfolio) for the period May 1, 2007 to April 30, 2009. In addition, this time, the Tables
also show the returns for Q1, Q16 and Q1S from May 1, 2008 to September 30, 2009 (referred to as
2008 extended). These Tables’ extended period returns represent seventeen month returns for Q1, Q16
and Q1S portfolios, as if the stock selections and compositions for value, growth and sophisticated
portfolios had not changed from May to September 2009. Appendix E shows the stocks included in Q1,
Q16 and Q1S.
11
Our sophisticated portfolio is quite concentrated. However, the margin of safety acts as a way to protect capital which is distinct from, and in many respects consistent with, diversification. Moreover, the superior performance of the sophisticated portfolio is consistent with Kacperczyk et al. (2007) who find that all concentrated funds in their study did well, but the more concentrated did the best.

18
We see that over the two years of the “great recession”, the mean and median returns for the
growth portfolio exceed those for the value portfolio by a significant amount for both the normal and
extended period. On the other hand, the sophisticated portfolio under-performed the naïve portfolio in
2007, but significantly outperformed it in 2008 for both the normal and extended 2008 period. In 2008,
the sophisticated portfolio outperformed both the naive value and the growth portfolio. On average,
over the two year period, the sophisticated portfolio beat the naïve portfolio and the growth portfolio.
Moreover, the sophisticated portfolio beat the naive during the recession and the bear market period of
May 1, 2008 to April 30, 2009. These findings are consistent with those reported earlier for 1985-2007.
4. Conclusions
Value investors wish to buy stocks at a discount to intrinsic value. To find the heavily discounted
stocks, value investors follow a two step process. First they search for possibly undervalued stocks, using
screening metrics, such as P/E and/or P/BV ratios. Second, they carefully apply a valuation technology to
all possibly undervalued stocks that passed the first step and arrive at their investment decision by
applying the concept of “margin of safety” in order to determine which among those stocks are truly
undervalued.
The purpose of this paper was first to examine whether a value premium existed following a
mechanical screening process (i.e., the search process) in the Canadian markets between 1985-1999 and
1999-2007, and second whether value investors added value in the stock selection process by being able
to find truly undervalued stocks from the universe of the possibly undervalued stocks identified from the
search process.
First, we apply a cross-sorting process whereby value stocks are defined as the low P/E - low
P/BV stocks and growth stocks as the high P/E - high P/BV stocks. Second, we examine whether the
previously identified value stocks beat the growth stocks. Third, we focus on the low P/E – low P/BV
stocks, which we carefully value and apply the concept of ”margin of safety” to identify the truly
undervalued stocks among them. Finally, we compare the returns of the truly undervalued stocks to
those of the naively chosen value stocks of the search process.
We find that a strong and pervasive value premium exists in Canada over our sample period that
persists in bull and bear markets and during recessions/recoveries. Value stocks, on average, beat
growth stocks even when using a very mechanical screening of the search process. Furthermore, this

19
paper demonstrates that value investors do add value, in the sense that their process of selecting truly
undervalued stocks, via in-depth security valuation of the possibly undervalued stocks and arriving at
their investment decision using the concept of “margin of safety”, produces positive excess returns over
and above the naive approach of simply selecting low P/E - P/BV ratio stocks.
The paper was extended to the years of the “great recession” and despite the fact that over this
extended period we had a severe recession and bear market, on average, the sophisticated portfolio still
beat the naïve value portfolio, consistent with earlier evidence.
In conclusion, value investors proceeding to the second step of the stock selection process do
add value.

20
References
Athanassakos, G. (2009 (a)). Value vs. Growth Stock Returns and the Value Premium: The Canadian
Experience 1985-2005, Canadian Journal of Administrative Studies 26 (2), pp. 109-129.
Athanassakos, G. (2009 (b)). The Performance, Pervasiveness and Determinants of Value Premium in
Different US Exchanges: 1986-2006”, Working paper, Richard Ivey School of Business, The
University of Western Ontario, Canada.
Athanassakos, G. (1998). Estimating Expected Equity Risk-Premia and the Cost of Equity Using the Bond
Plus Risk-Premium Approach: The Canadian Experience,” Multinational Finance Journal 3, 1998,
pp. 229-254.
Basu, S. (1977). Investment Performance of Common Stocks in Relation to Their Price to earnings Ratios:
A Test of the Efficient Market Hypothesis, Journal of Finance 32, 663-682.
Chan, L. K. C., Hamao, Y. & Lakonishok, J. (1991). Fundamentals and Stock Returns in Japan, Journal of
Finance 46, 1739-1764.
Chan, L. K. C. & Lakonishok, J. (2004). Value and Growth Investing: Review and Update, Financial
Analysts’ Journal, January/February, 71-84.
Cohen, R. B., Polk, C. & Vuolteenaho, T. (2003). The Value Spread, Journal of Finance 58, 609-641.
Fama, E. F. & French, K. R. (1992). The Cross Section of Expected Stock Returns, Journal of Finance 47,
427-465.
Fama, E. F. & French, K. R. (1993). Common Risk Factors in the Returns on Stocks and Bonds, Journal of
Financial Economics 33, 3-56.
Fama, E. F. & French, K. R. (1996). Multifactor Explanations of Asset Pricing Anomalies, Journal of
Finance 51, 55-84.
Greenwald, B. C. N., J. Kahn, P. D. Sonkin and M. Van Biema (2001). “Value Investing: From Graham to
Buffett and Beyond”, Wiley Finance, John Wiley & Sons, Inc., Hoboken, N.J.
21
Griffin, J. M. & Lemmon, M. L. (2002). Book to Market Equity, Distress Risk, and Stock Returns, Journal of
Finance 57, 2317-2336.
Jobson, I.D. & Korkie, B. M. (1981). Performance Hypothesis Testing with the Sharpe and Treynor
Measures, Journal of Finance 36, 889-908.
Kacperczyk, M., C. Sialm & L. Zheng (2007). Industry Concentration and Mutual Fund Performance,
Journal of Investment Management 5, No.1, 49-69.
Kwag, S. W. & Lee, S. W. (2006). Value Investing and the Business Cycle, Journal of Financial Planning,
Article 7, August, pp. 1-10.
Lakonishok, J. Shleifer, A. & Vishny, R. W. (1994). Contrarian Investment, Extrapolation and Risk, Journal
of Finance 49, 1541-1578.
La Porta, R., Lakonishok, J., Schleifer, A. & Vishny, R. W. (1997). Good News for Value Stocks: Further
Evidence on Market Efficiency, Journal of Finance 50, 1715-1742.

Table 1
Mean Annual (%) Returns to P/E – P/BV Ratio Based Value (Q1) and Growth (Q16) Strategies by Year
Panel A: 1985 – 1999
Value Premium
Year Q1 Q16 Q1-Q16
1985 12.4% -3.4% 15.8%
1986 81.8% 47.3% 34.6%
1987 -2.2% -12.3% 10.1%
1988 15.0% -7.2% 22.2%
1989 -13.8% 8.9% -22.7%
1990 1.1% 19.3% -18.2%
1991 -10.8% -4.5% -6.3%
1992 9.4% 98.1% -88.7%
1993 36.3% 3.0% 33.4%
1994 3.8% -9.2% 13.0%
1995 7.1% 16.1% -9.0%
1996 20.6% -1.2% 21.8%
1997 54.1% 9.7% 44.4%
1998 -16.3% 1.0% -17.3%
Overall average 14.2% 11.8% 2.4%
Variance 7.4% 8.5%
Risk-free rate 7.8% 7.8%
SHARPE ratio* 0.24 0.14
Mean Return
Panel B: 1999-2007
Value Premium
Year Q1 Q16 Q1-Q16
1999 5.7% 10.9% -5.2%
2000 1.5% 4.8% -3.3%
2001 45.4% 9.7% 35.7%
2002 -4.6% -4.2% -0.4%
2003 92.8% 29.7% 63.1%
2004 32.5% 33.4% -0.9%
2005 84.8% 53.2% 31.6%
2006 17.8% 5.6% 12.2%
Overall average 34.5% 17.9% 16.6%
Variance 14.0% 3.6%
Risk-free rate 3.6% 3.6%
SHARPE ratio** 0.83 0.75
Mean Return
* The p-value of the difference between the Sharpe ratios of the two portfolios is 0.09. ** The p-value of the difference between the Sharpe ratios of the two portfolios is 0.03.

Table 2
Median Annual (%) Returns to P/E – P/BV Ratio Based Value (Q1) and Growth (Q16) Strategies by Year
Panel A: 1985 – 1999
Value Premium
Year Q1 Q16 Q1-Q16
1985 9.3% -17.9% 27.2%
1986 60.9% 34.9% 26.0%
1987 -7.3% -25.2% 17.9%
1988 1.6% -5.2% 6.7%
1989 -23.8% 1.4% -25.2%
1990 2.1% 14.8% -12.7%
1991 -3.5% -15.4% 11.9%
1992 19.1% 107.8% -88.7%
1993 21.4% 9.4% 12.0%
1994 -1.5% -13.8% 12.3%
1995 12.9% 20.4% -7.5%
1996 15.8% -25.1% 40.9%
1997 33.6% 11.6% 21.9%
1998 -26.9% 2.7% -29.6%
Overall median 5.7% 2.1% 3.7%
Median Return
Panel B: 1999-2007
Value Premium
Year Q1 Q16 Q1-Q16
1999 1.4% -4.8% 6.2%
2000 0.6% -17.7% 18.3%
2001 20.1% 8.4% 11.6%
2002 1.8% -8.8% 10.7%
2003 89.4% 26.0% 63.4%
2004 28.6% 16.2% 12.4%
2005 42.1% 34.4% 7.7%
2006 22.9% 2.5% 20.4%
Overall median 21.5% 5.5% 16.0%
Median Return
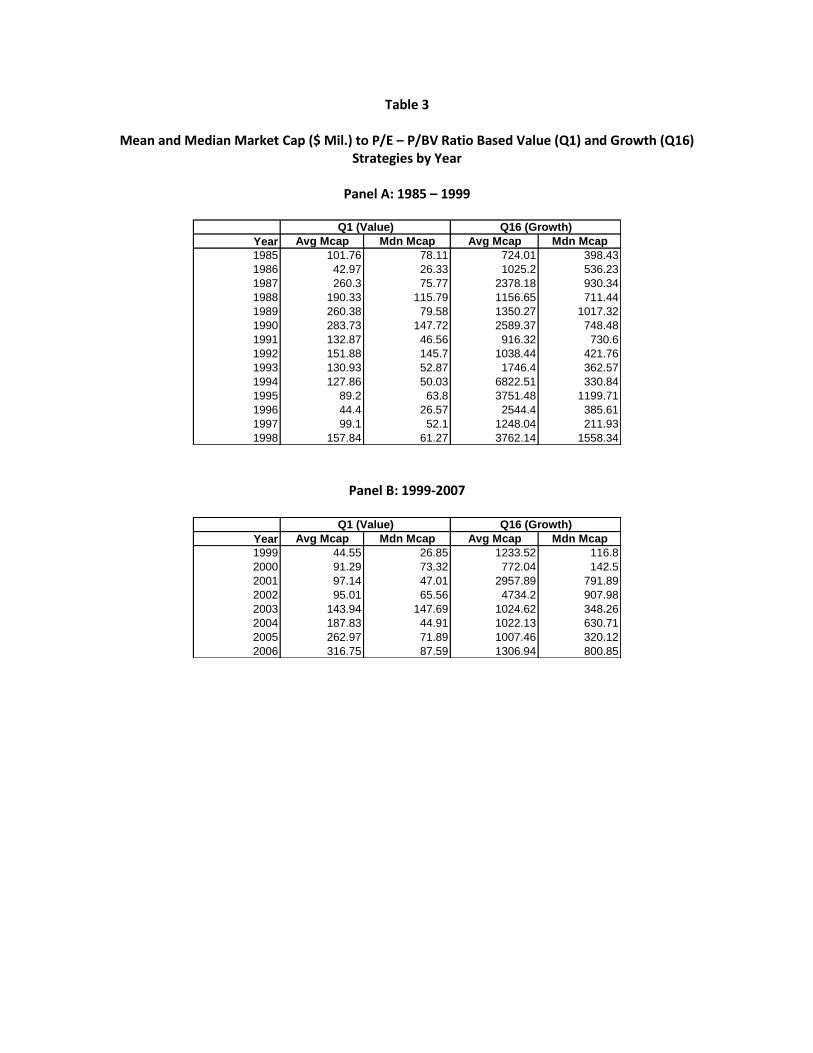
Table 3
Mean and Median Market Cap ($ Mil.) to P/E – P/BV Ratio Based Value (Q1) and Growth (Q16) Strategies by Year
Panel A: 1985 – 1999
Year Avg Mcap Mdn Mcap Avg Mcap Mdn Mcap
1985 101.76 78.11 724.01 398.43
1986 42.97 26.33 1025.2 536.23
1987 260.3 75.77 2378.18 930.34
1988 190.33 115.79 1156.65 711.44
1989 260.38 79.58 1350.27 1017.32
1990 283.73 147.72 2589.37 748.48
1991 132.87 46.56 916.32 730.6
1992 151.88 145.7 1038.44 421.76
1993 130.93 52.87 1746.4 362.57
1994 127.86 50.03 6822.51 330.84
1995 89.2 63.8 3751.48 1199.71
1996 44.4 26.57 2544.4 385.61
1997 99.1 52.1 1248.04 211.93
1998 157.84 61.27 3762.14 1558.34
Q1 (Value) Q16 (Growth)
Panel B: 1999-2007
Year Avg Mcap Mdn Mcap Avg Mcap Mdn Mcap
1999 44.55 26.85 1233.52 116.8
2000 91.29 73.32 772.04 142.5
2001 97.14 47.01 2957.89 791.89
2002 95.01 65.56 4734.2 907.98
2003 143.94 147.69 1024.62 348.26
2004 187.83 44.91 1022.13 630.71
2005 262.97 71.89 1007.46 320.12
2006 316.75 87.59 1306.94 800.85
Q1 (Value) Q16 (Growth)
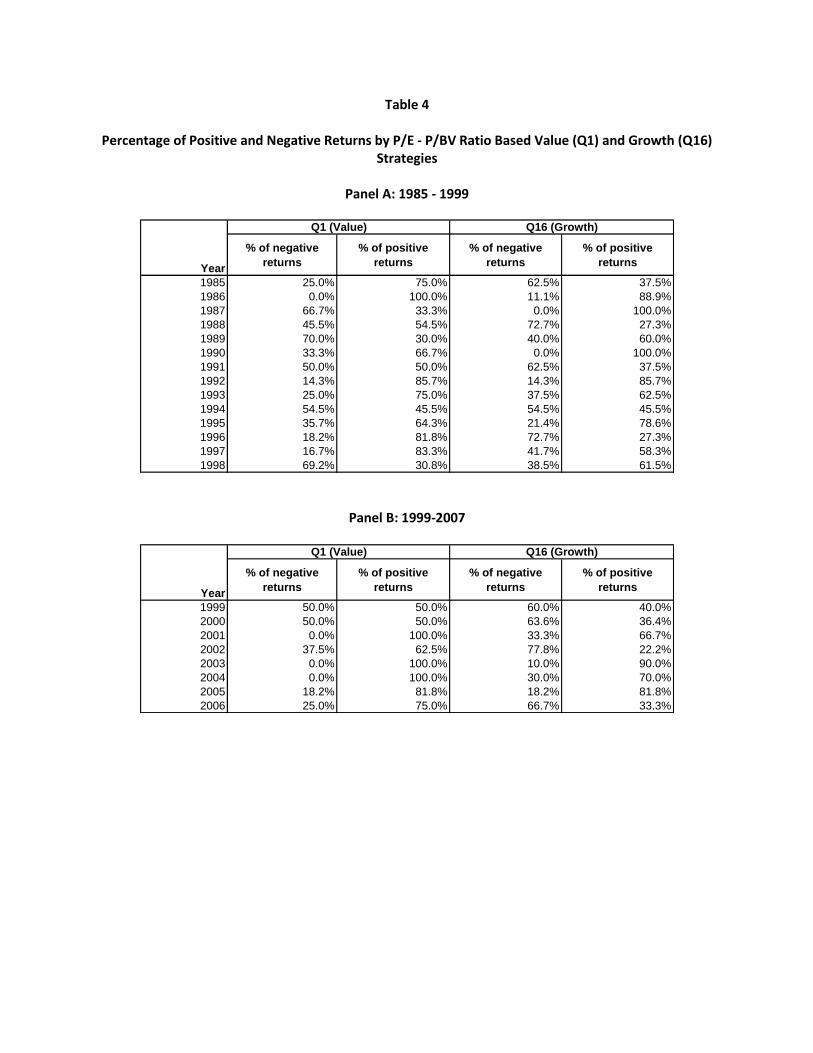
Table 4
Percentage of Positive and Negative Returns by P/E ‐ P/BV Ratio Based Value (Q1) and Growth (Q16) Strategies
Panel A: 1985 - 1999
Year
% of negative
returns
% of positive
returns
% of negative
returns
% of positive
returns
1985 25.0% 75.0% 62.5% 37.5%
1986 0.0% 100.0% 11.1% 88.9%
1987 66.7% 33.3% 0.0% 100.0%
1988 45.5% 54.5% 72.7% 27.3%
1989 70.0% 30.0% 40.0% 60.0%
1990 33.3% 66.7% 0.0% 100.0%
1991 50.0% 50.0% 62.5% 37.5%
1992 14.3% 85.7% 14.3% 85.7%
1993 25.0% 75.0% 37.5% 62.5%
1994 54.5% 45.5% 54.5% 45.5%
1995 35.7% 64.3% 21.4% 78.6%
1996 18.2% 81.8% 72.7% 27.3%
1997 16.7% 83.3% 41.7% 58.3%
1998 69.2% 30.8% 38.5% 61.5%
Q1 (Value) Q16 (Growth)
Panel B: 1999-2007
Year
% of negative
returns
% of positive
returns
% of negative
returns
% of positive
returns
1999 50.0% 50.0% 60.0% 40.0%
2000 50.0% 50.0% 63.6% 36.4%
2001 0.0% 100.0% 33.3% 66.7%
2002 37.5% 62.5% 77.8% 22.2%
2003 0.0% 100.0% 10.0% 90.0%
2004 0.0% 100.0% 30.0% 70.0%
2005 18.2% 81.8% 18.2% 81.8%
2006 25.0% 75.0% 66.7% 33.3%
Q1 (Value) Q16 (Growth)

Table 5
Mean Annual (%) Returns to P/E – P/BV Ratio Based (“Naïve”) Value (Q1) and “Sophisticated” Value (Q1S) Strategies by Year
Panel A: 1985 – 1999
Value Investor Premium
Year Q1S Q1 Q1S - Q1
1985 20.3% 12.4% 7.9%
1986 4.2% 81.8% -77.6%
1987 -18.8% -2.2% -16.6%
1988 48.8% 15.0% 33.8%
1989 -20.0% -13.8% -6.2%
1990 10.6% 1.1% 9.5%
1991 16.7% -10.8% 27.5%
1992 10.5% 9.4% 1.1%
1993 55.7% 36.3% 19.4%
1994 33.9% 3.8% 30.1%
1995 4.7% 7.1% -2.4%
1996 16.1% 20.6% -4.5%
1997 49.6% 54.1% -4.5%
1998 -18.2% -16.3% -1.9%
Overall average 15.3% 14.2% 1.1%
Variance 6.2% 7.4%
Risk-free rate 7.8% 7.8%
SHARPE ratio* 0.3 0.24
Mean Return
Panel B: 1999-2007
Value Investor Premium
Year Q1S Q1 Q1S - Q1
1999 5.7% 5.7% 0.0%
2000 13.9% 1.5% 12.4%
2001 71.7% 45.4% 26.4%
2002 27.5% -4.6% 32.2%
2003 100.4% 92.8% 7.6%
2004 24.7% 32.5% -7.8%
2005 112.7% 84.8% 27.9%
2006 25.0% 17.8% 7.2%
Overall average 47.7% 34.5% 13.2%
Variance 17.1% 14.0%
Risk-free rate 3.6% 3.6%
SHARPE ratio** 1.07 0.83
Mean Return
* The p-value of the difference between the Sharpe ratios of the two portfolios is 0.15. ** The p-value of the difference between the Sharpe ratios of the two portfolios is 0.01.

Table 6
Median Annual (%) Returns to P/E – P/BV Ratio Based (“Naïve”) Value (Q1) and “Sophisticated” Value
(Q1S) Strategies by Year
Panel A: 1985 – 1999
Value Investor Premium
Year Q1S Q1 Q1S - Q1
1985 7.5% 9.3% -1.8%
1986 5.2% 60.9% -55.7%
1987 -18.8% -7.3% -11.5%
1988 48.8% 1.6% 47.2%
1989 -23.7% -23.8% 0.1%
1990 6.5% 2.1% 4.4%
1991 16.7% -3.5% 20.2%
1992 10.5% 19.1% -8.6%
1993 65.9% 21.4% 44.5%
1994 29.2% -1.5% 30.7%
1995 4.6% 12.9% -8.3%
1996 15.8% 15.8% 0.0%
1997 31.8% 33.6% -1.8%
1998 -31.1% -26.9% -4.2%
Overall median 9.0% 5.7% 3.3%
Median Return
Panel B: 1999-2007
Value Investor Premium
Year Q1S Q1 Q1S - Q1
1999 1.4% 1.4% 0.0%
2000 9.6% 0.6% 9.1%
2001 46.3% 20.1% 26.2%
2002 25.6% 1.8% 23.8%
2003 34.0% 89.4% -55.4%
2004 24.7% 28.6% -3.9%
2005 115.5% 42.1% 73.4%
2006 25.0% 22.9% 2.1%
Overall median 25.3% 21.5% 3.8%
Median Return

Table 7
Percentage of Positive and Negative Returns by P/E ‐ P/BV Ratio Based Naïve Value (Q1) and Sophisticated Value (Q1S) Strategies
Panel A: 1985 – 1999
Year
% of negative
returns
% of positive
returns
% of negative
returns
% of positive
returns
1985 0.0% 100.0% 25.0% 75.0%
1986 0.0% 100.0% 0.0% 100.0%
1987 100.0% 0.0% 66.7% 33.3%
1988 0.0% 100.0% 45.5% 54.5%
1989 100.0% 0.0% 70.0% 30.0%
1990 0.0% 100.0% 33.3% 66.7%
1991 0.0% 100.0% 50.0% 50.0%
1992 0.0% 100.0% 14.3% 85.7%
1993 0.0% 100.0% 25.0% 75.0%
1994 0.0% 100.0% 54.5% 45.5%
1995 50.0% 50.0% 35.7% 64.3%
1996 40.0% 60.0% 18.2% 81.8%
1997 28.6% 71.4% 16.7% 83.3%
1998 75.0% 25.0% 69.2% 30.8%
Q1S (Sophisticated) Q1 (Value)
Panel B: 1999-2007
Year
% of negative
returns
% of positive
returns
% of negative
returns
% of positive
returns
1999 50.0% 50.0% 50.0% 50.0%
2000 33.3% 66.7% 50.0% 50.0%
2001 0.0% 100.0% 0.0% 100.0%
2002 0.0% 100.0% 37.5% 62.5%
2003 0.0% 100.0% 0.0% 100.0%
2004 0.0% 100.0% 0.0% 100.0%
2005 0.0% 100.0% 18.2% 81.8%
2006 25.0% 75.0% 25.0% 75.0%
Q1S (Sophisticated) Q1 (Value)

Table 8
Mean and Median Market Cap ($Mil.) to P/E – P/BV Ratio Based Naïve Value (Q1) and Sophisticated Value (Q1S) Strategies by Year
Panel A: 1985 – 1999
Year Avg Mcap Mdn Mcap Avg Mcap Mdn Mcap
1985 54.78 54.59 101.76 78.11
1986 43.62 29.03 42.97 26.33
1987 23.92 23.92 260.3 75.77
1988 52.91 52.91 190.33 115.79
1989 687.23 220.32 260.38 79.58
1990 544.07 293.81 283.73 147.72
1991 32.1 32.1 132.87 46.56
1992 36.96 36.96 151.88 145.7
1993 159.99 62.46 130.93 52.87
1994 186.35 64.2 127.86 50.03
1995 138 25.68 89.2 63.8
1996 39.99 26.57 44.4 26.57
1997 100.75 32.11 99.1 52.1
1998 88.4 89.97 157.84 61.27
Q1S (Sophisticated) Q1 (Value)
Panel B: 1999-2007
Year Avg Mcap Mdn Mcap Avg Mcap Mdn Mcap
1999 34.18 33.78 44.55 26.85
2000 88.28 35.98 91.29 73.32
2001 77.36 37.94 97.14 47.01
2002 61.58 65.56 95.01 65.56
2003 81.08 76.54 143.94 147.69
2004 425.09 425.09 187.83 44.91
2005 51.74 55.9 262.97 71.89
2006 203.29 111.12 316.75 87.59
Q1S (Sophisticated) Q1 (Value)

Table 9
Mean Annual (%) Returns to P/E – P/BV Ratio Based Value (Q1) and Growth (Q16) Strategies by Year 2007-2009
Value Premium
Q1 Q16 Q1 – Q16
2007 -30.20% 20.20% -50.40%
2008 -58.20% -33.50% -24.70%
2008 (Extended)* -31.20% -16.60% -14.60%
Year
Mean Return
Table 10
Median Annual (%) Returns to P/E – P/BV Ratio Based Value (Q1) and Growth (Q16) Strategies by Year 2007-2009
Value Premium
Q1 Q16 Q1 – Q16
2007 -31.30% 9.60% -40.90%
2008 -62.30% -34.40% -27.90%
2008 (Extended)* -34.00% -14.60% -19.30%
Year
Median Return
* May 1, 2008 - September 30, 2009.

Table 11
Mean Annual (%) Returns to P/E – P/BV Ratio Based (“Naïve”) Value (Q1) and “Sophisticated” Value (Q1S) Strategies by Year
2007-2009
Value Investor Premium
Q1S Q1 Q1S - Q1
2007 -45.70% -30.20% -15.50%
2008 -13.00% -58.20% 45.20%
2008 (Extended)* 64.70% -31.20% 95.90%
Year
Mean Return
Table 12
Median Annual (%) Returns to P/E – P/BV Ratio Based Naïve Value (Q1) and Sophisticated Value (Q1S) Strategies by Year
2007-2009
Value Investor Premium
Q1S Q1 Q1S - Q1
2007 -45.70% -31.30% -14.40%
2008 -13.00% -62.30% 49.30%
2008 (Extended)* 64.70% -34.00% 98.70%
Year
Median Return
* May 1, 2008 - September 30, 2009.

Figure 1
Mean and Median Annual (%) Value Premia to P/E – P/BV Ratio Based Value (Q1) and Growth (Q16) Strategies by Year: 1985-1999
-90
-70
-50
-30
-10
10
30
50
1985 1986 1987 1988 1989 1990 1991 1992 1993 1994 1995 1996 1997 1998Mean
Median

Figure 2
Mean and Median Annual (%) Value Premia to P/E – P/BV Ratio Based Value (Q1) and Growth (Q16) Strategies by Year: 1999-2007
-10.00
0.00
10.00
20.00
30.00
40.00
50.00
60.00
70.00
1999 2000 2001 2002 2003 2004 2005 2006
Mean
Median

Figure 3
Mean and Median Annual (%) Returns to P/E – P/BV Ratio Based Naïve Value (Q1) and Sophisticated Value (Q1S) Strategies by Year: 1985-1999
-80
-60
-40
-20
0
20
40
60
1985 1986 1987 1988 1989 1990 1991 1992 1993 1994 1995 1996 1997 1998Mean
Median

Figure 4
Mean and Median Annual (%) Returns to P/E – P/BV Ratio Based Naïve Value (Q1) and Sophisticated Value (Q1S) Strategies by Year: 1999-2007
-60
-40
-20
0
20
40
60
80
1999 2000 2001 2002 2003 2004 2005 2006
Mean
Median

APPENDIX A.1 Low P/E and P/B Stocks – Possibly Undervalued Stocks: 1985-1999 Company Ticker Year
ABITIBI CONSOLIDATED INC ABY 1985
ALIANT INC AIT. 1985
CANADA MALTING CO LTD CMG.2 1985
CANADIAN AIRLINES CORP CA.1 1985
FARADAY RESOURCES INC CFY. 1985
GOODYEAR CANADA INC GT.1 1985
HOWDEN (D.H.) & CO LTD HDH 1985
WESTFIELD MINERALS LTD WFD. 1985
CONWEST EXPLORATION CEXCF 1986
FARADAY RESOURCES INC CFY. 1986
FOUR SEASONS HOTELS -LTD VTG FS. 1986
MAJESTIC CONTRACTORS LTD MJC 1986
MORRISON PETROLEUMS LTD MRP.1 1986
QUEBECTEL GROUP INC QTG 1986
TRICENTROL PLC TCT.1 1986
ULSTER PETROLEUM LTD ULP 1986
WESTFIELD MINERALS LTD WFD. 1986
CANADIAN AIRLINES CORP CA.1 1987
CANBRA FOODS LTD CBF.2 1987
DOFASCO INC DFS. 1987
FP RESOURCES LTD FPL.Z 1987
FRUEHAUF CANADA INC FRH. 1987
GENERAL ELECTRIC CANADA INC GEZ 1987
GSW INC -CL B GSW.Z. 1987
HAWKER SIDDELEY CANADA HSC. 1987
ISLAND TELEPHONE CO LTD IT.1 1987
CANADA MALTING CO LTD CMG.2 1988
CANADIAN AIRLINES CORP CA.1 1988
CANRON INC -CL A VTG CL.A 1988
CONWEST EXPLORATION CEXCF 1988
CORE-MARK INTL INC-OLD CMK.4 1988
FARADAY RESOURCES INC CFY. 1988
GOODYEAR CANADA INC GT.1 1988
TALISMAN ENERGY INC TLM 1988
TRANSALTA CORP TAC 1988
WARDAIR INC WDI 1988
WILMINGTON CAP MGMT -CL A WCM.A 1988
BRENDA MINES LTD BND.1 1989
Company Ticker Year
CANAM GROUP INC CAM. 1989
CASSIDYS LTD CYL. 1989
DOFASCO INC DFS. 1989
FARADAY RESOURCES INC CFY. 1989
IVACO INC -CL A IVA. 1989
MASONITE INTERNATIONAL CORP MHM 1989
ROLLAND INC RL.1 1989
SLATER STEEL INC SSI. 1989
WILMINGTON CAP MGMT -CL A WCM.A 1989
BROOKFIELD HOMES LTD BRH. 1990
DOFASCO INC DFS. 1990
GWIL INDUSTRIES GWS. 1990
POTASH CORP SASK INC POT 1990
SLATER STEEL INC SSI. 1990
TALISMAN ENERGY INC TLM 1990
TDZ HOLDINGS CORP TDZ 1990
WESTBURNE INC WBI.2 1990
WESTFIELD MINERALS LTD WFD. 1990
ALGOMA CENTRAL CORP ALC. 1991
BROOKFIELD HOMES LTD BRH. 1991
EQUITY SILVER MINES -CL A EST.A. 1991
GWIL INDUSTRIES GWS. 1991
MELCOR DEVELOPMENT LTD MRD. 1991
PRINCETON MINING PMC.1 1991
RIO ALGOM LTD ROM.2 1991
TALISMAN ENERGY INC TLM 1991
ALGOMA CENTRAL CORP ALC. 1992
ATCO LTD -CL I ACO.X 1992
BROOKFIELD HOMES LTD BRH. 1992
FORTIS INC FTS. 1992
IPSCO INC IPS.2 1992
PHOTO ENGRAVERS & ELECTROTYP PHE. 1992
WESTFIELD MINERALS LTD WFD. 1992
ALGOMA CENTRAL CORP ALC. 1993
ATCO LTD -CL I ACO.X 1993
CASCADES INC CAS. 1993
FIRST MARITIME MNG CORP LTD FMM.1 1993
GREYVEST CAPITAL INC GFI.1 1993

Company Ticker Year
GSW INC -CL B GSW.Z. 1993
MELCOR DEVELOPMENT LTD MRD. 1993
MONARCH DEVELOPMENT CORP MON.1 1993
ALGOMA CENTRAL CORP ALC. 1994
ATCO LTD -CL I ACO.X 1994
CARMA CORP -CL A CVP.A 1994
CFS GROUP INC CFZ. 1994
GLENTEL INC GLN. 1994
MELCOR DEVELOPMENT LTD MRD. 1994
MONARCH DEVELOPMENT CORP MON.1 1994
MULTIBANC NT FINANCIAL CORP MIB.1 1994
SENVEST CAPITAL INC SEC. 1994
TERASEN INC TER.1 1994
TIE/TELECOMMUN CANADA LTD TTI.2 1994
ATLANTIS COMM INC -SUB VTG ATV.1 1995
CARMA CORP -CL A CVP.A 1995
FP RESOURCES LTD FPL.Z 1995
GWIL INDUSTRIES GWS. 1995
HARROWSTON INC -CL A HRW. 1995
INTERNATIONAL COLIN ENERGY KCN.1 1995
MAPLE LEAF FOODS INC MFI. 1995
MELCOR DEVELOPMENT LTD MRD. 1995
NOBLE CHINA INC NMO. 1995
NUGAS LTD NGS. 1995
SENVEST CAPITAL INC SEC. 1995
SLATER STEEL INC SSI. 1995
SYNERGISTICS INDS LTD -CL A SGX.A 1995
WILMINGTON CAP MGMT -CL A WCM.A 1995
ADVENTURE ELECTRONICS INC AVN.1 1996
CARMA CORP -CL A CVP.A 1996
CONSOLTEX GROUP INC CTX.1 1996
FIRST MARITIME MNG CORP LTD FMM.1 1996
IVACO INC -CL A IVA. 1996
NORTHSTAR AEROSPACE INC NAS. 1996
ROLLAND INC RL.1 1996
SENVEST CAPITAL INC SEC. 1996
SYNERGISTICS INDS LTD -CL A SGX.A 1996
WESTFIELD MINERALS LTD WFD. 1996
GLENTEL INC GLN. 1997
HAMMOND MFG LTD -CL A HMM.A 1997
HARRIS STEEL GROUP INC HSG. 1997
HARROWSTON INC -CL A HRW. 1997
MELCOR DEVELOPMENT LTD MRD. 1997
ROLLAND INC RL.1 1997
SENVEST CAPITAL INC SEC. 1997
SINO-FOREST CORP TRE. 1997
SLATER STEEL INC SSI. 1997
SYNERGISTICS INDS LTD -CL A SGX.A 1997
WILMINGTON CAP MGMT -CL A WCM.A 1997
AECON GROUP INC ARE. 1998
BOLIDEN AB BLS. 1998
CANAM GROUP INC CAM. 1998
FIRST MARITIME MNG CORP LTD FMM.1 1998
FP RESOURCES LTD FPL.Z 1998
GLENTEL INC GLN. 1998
HAMMOND MFG LTD -CL A HMM.A 1998
IVACO INC -CL A IVA. 1998
MELCOR DEVELOPMENT LTD MRD. 1998
SCOTTS RESTAURANTS SRG.1 1998
STERLING CENTRECORP INC CDA SCF. 1998
SENVEST CAPITAL INC SEC. 1998
WILMINGTON CAP MGMT -CL A WCM.A 1998
Note: Stocks that stopped trading in a given year are highlighted and a T‐Bill assumption was made for the remainder of the year
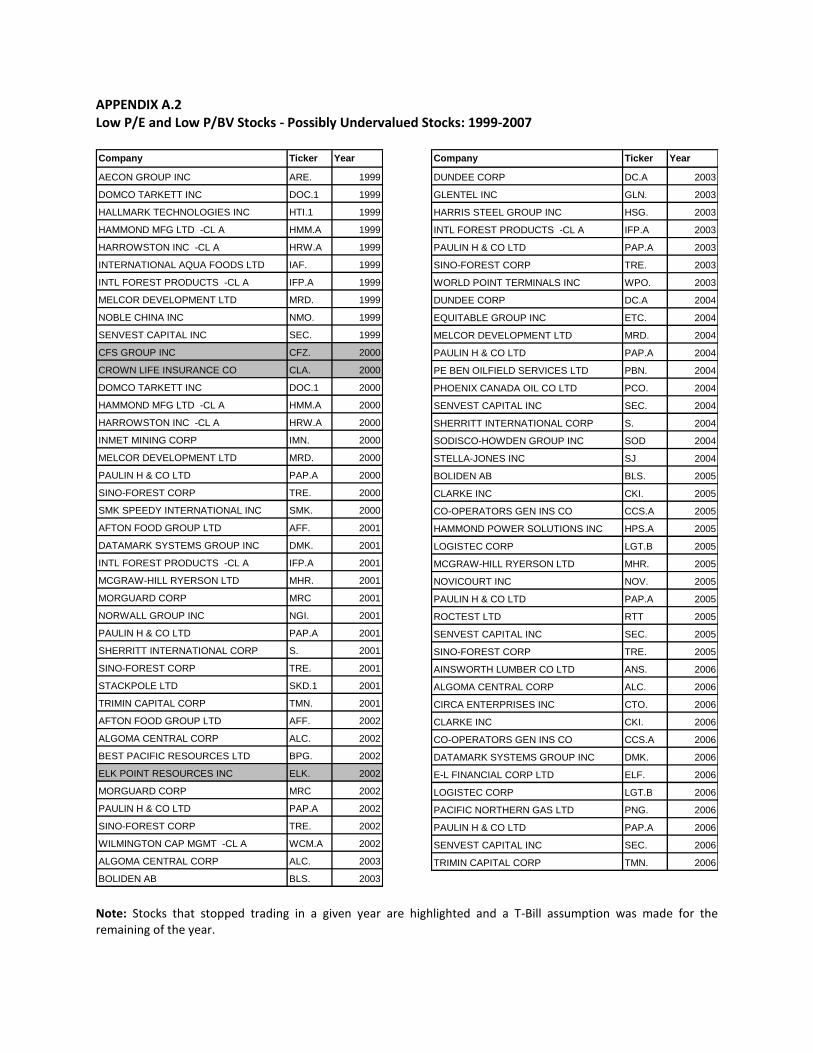
APPENDIX A.2 Low P/E and Low P/BV Stocks - Possibly Undervalued Stocks: 1999-2007 Company Ticker Year
AECON GROUP INC ARE. 1999
DOMCO TARKETT INC DOC.1 1999
HALLMARK TECHNOLOGIES INC HTI.1 1999
HAMMOND MFG LTD -CL A HMM.A 1999
HARROWSTON INC -CL A HRW.A 1999
INTERNATIONAL AQUA FOODS LTD IAF. 1999
INTL FOREST PRODUCTS -CL A IFP.A 1999
MELCOR DEVELOPMENT LTD MRD. 1999
NOBLE CHINA INC NMO. 1999
SENVEST CAPITAL INC SEC. 1999
CFS GROUP INC CFZ. 2000
CROWN LIFE INSURANCE CO CLA. 2000
DOMCO TARKETT INC DOC.1 2000
HAMMOND MFG LTD -CL A HMM.A 2000
HARROWSTON INC -CL A HRW.A 2000
INMET MINING CORP IMN. 2000
MELCOR DEVELOPMENT LTD MRD. 2000
PAULIN H & CO LTD PAP.A 2000
SINO-FOREST CORP TRE. 2000
SMK SPEEDY INTERNATIONAL INC SMK. 2000
AFTON FOOD GROUP LTD AFF. 2001
DATAMARK SYSTEMS GROUP INC DMK. 2001
INTL FOREST PRODUCTS -CL A IFP.A 2001
MCGRAW-HILL RYERSON LTD MHR. 2001
MORGUARD CORP MRC 2001
NORWALL GROUP INC NGI. 2001
PAULIN H & CO LTD PAP.A 2001
SHERRITT INTERNATIONAL CORP S. 2001
SINO-FOREST CORP TRE. 2001
STACKPOLE LTD SKD.1 2001
TRIMIN CAPITAL CORP TMN. 2001
AFTON FOOD GROUP LTD AFF. 2002
ALGOMA CENTRAL CORP ALC. 2002
BEST PACIFIC RESOURCES LTD BPG. 2002
ELK POINT RESOURCES INC ELK. 2002
MORGUARD CORP MRC 2002
PAULIN H & CO LTD PAP.A 2002
SINO-FOREST CORP TRE. 2002
WILMINGTON CAP MGMT -CL A WCM.A 2002
ALGOMA CENTRAL CORP ALC. 2003
BOLIDEN AB BLS. 2003
Company Ticker Year
DUNDEE CORP DC.A 2003
GLENTEL INC GLN. 2003
HARRIS STEEL GROUP INC HSG. 2003
INTL FOREST PRODUCTS -CL A IFP.A 2003
PAULIN H & CO LTD PAP.A 2003
SINO-FOREST CORP TRE. 2003
WORLD POINT TERMINALS INC WPO. 2003
DUNDEE CORP DC.A 2004
EQUITABLE GROUP INC ETC. 2004
MELCOR DEVELOPMENT LTD MRD. 2004
PAULIN H & CO LTD PAP.A 2004
PE BEN OILFIELD SERVICES LTD PBN. 2004
PHOENIX CANADA OIL CO LTD PCO. 2004
SENVEST CAPITAL INC SEC. 2004
SHERRITT INTERNATIONAL CORP S. 2004
SODISCO-HOWDEN GROUP INC SOD 2004
STELLA-JONES INC SJ 2004
BOLIDEN AB BLS. 2005
CLARKE INC CKI. 2005
CO-OPERATORS GEN INS CO CCS.A 2005
HAMMOND POWER SOLUTIONS INC HPS.A 2005
LOGISTEC CORP LGT.B 2005
MCGRAW-HILL RYERSON LTD MHR. 2005
NOVICOURT INC NOV. 2005
PAULIN H & CO LTD PAP.A 2005
ROCTEST LTD RTT 2005
SENVEST CAPITAL INC SEC. 2005
SINO-FOREST CORP TRE. 2005
AINSWORTH LUMBER CO LTD ANS. 2006
ALGOMA CENTRAL CORP ALC. 2006
CIRCA ENTERPRISES INC CTO. 2006
CLARKE INC CKI. 2006
CO-OPERATORS GEN INS CO CCS.A 2006
DATAMARK SYSTEMS GROUP INC DMK. 2006
E-L FINANCIAL CORP LTD ELF. 2006
LOGISTEC CORP LGT.B 2006
PACIFIC NORTHERN GAS LTD PNG. 2006
PAULIN H & CO LTD PAP.A 2006
SENVEST CAPITAL INC SEC. 2006
TRIMIN CAPITAL CORP TMN. 2006
Note: Stocks that stopped trading in a given year are highlighted and a T-Bill assumption was made for the remaining of the year.

APPENDIX B.1 High P/E and High P/B Stocks: 1985-1999
Company Ticker Year
AGNICO EAGLE MINES LTD AEM 1985
BRUNSWICK MINING & SMLT CORP BMS.1 1985
CAMPBELL RED LAKE MINES CRK.1 1985
KIENA GOLD MINES LTD KGM.1 1985
LUMONICS INC-OLD LUM.1 1985
THOMSON NEWSPAPERS -CL A THM.A 1985
TIE/TELECOMMUN CANADA LTD TTI.2 1985
WESTMN RESOURCES LTD WMI.1 1985
AGNICO EAGLE MINES LTD AEM 1986
BATTLE MOUNTAIN GOLD CO BMG. 1986
CAMPBELL RED LAKE MINES CRK.1 1986
CASCADES INC CAS. 1986
CONNAUGHT BIOSCIENCES INC CSESF 1986
HIGH LINER FOODS INC HLF. 1986
MACLEAN HUNTER MHP. 1986
NOMA INDUSTRIES LTD -CL A NMA.A 1986
THOMSON NEWSPAPERS -CL A THM.A 1986
AGNICO EAGLE MINES LTD AEM 1987
BARRICK GOLD CORP ABX 1987
BATTLE MOUNTAIN GOLD CO BMG. 1987
CAMPBELL RED LAKE MINES CRK.1 1987
CONNAUGHT BIOSCIENCES INC CSESF 1987
CRESTBROOK FOREST INDS LTD CFI.1 1987
LAC MINERALS LTD LAC 1987
MCDONALD'S CORP MCD 1987
PIONEER METALS CORP PSM. 1987
AGNICO EAGLE MINES LTD AEM 1988
BARRICK GOLD CORP ABX 1988
BATTLE MOUNTAIN GOLD CO BMG. 1988
CONNAUGHT BIOSCIENCES INC CSESF 1988
EQUITY SILVER MINES -CL A EST.A. 1988
HUSKY ENERGY INC HSE. 1988
IU INTERNATIONAL CORP IU 1988
LAC MINERALS LTD LAC 1988
MACLEAN HUNTER MHP. 1988
RANGER OIL LTD RGO 1988
THOMSON-REUTERS CORP (CDN) TRI 1988
ALBERTA NATURAL GAS CO LTD ANG. 1989
Company Ticker Year
AMAX GOLD INC AU.2 1989
BARRICK GOLD CORP ABX 1989
FOUR SEASONS HOTELS -LTD VTG FS. 1989
HUSKY ENERGY INC HSE. 1989
LAC MINERALS LTD LAC 1989
MACLEAN HUNTER MHP. 1989
RANGER OIL LTD RGO 1989
SOUTHAM INC STM.1 1989
THOMSON-REUTERS CORP (CDN) TRI 1989
BARRICK GOLD CORP ABX 1990
BATTLE MOUNTAIN GOLD CO BMG. 1990
CZAR RESOURCES LTD CZR.1 1990
DRAXIS HEALTH INC DRAX 1990
HUSKY ENERGY INC HSE. 1990
MCDONALD'S CORP MCD 1990
NORTEL NETWORKS CORP NT 1990
PINNACLE RESOURCES LTD PNN.1 1990
PIONEER NATURAL RESOURCES PCX. 1990
AMAX GOLD INC AU.2 1991
BARRICK GOLD CORP ABX 1991
BATTLE MOUNTAIN GOLD CO BMG. 1991
DRAXIS HEALTH INC DRAX 1991
HUSKY ENERGY INC HSE. 1991
MACLEAN HUNTER MHP. 1991
MORGAN HYDROCARBONS MHX. 1991
RANCHMENS RESOURCES LTD RRL.1 1991
BARRICK GOLD CORP ABX 1992
DORSET EXPLORATION LTD DXL.2 1992
FOUR SEASONS HOTELS -LTD VTG FS. 1992
HUSKY ENERGY INC HSE. 1992
MACLEAN HUNTER MHP. 1992
PARAMOUNT RESOURCES LTD POU 1992
PINNACLE RESOURCES LTD PNN.1 1992
DORSET EXPLORATION LTD DXL.2 1993
HUSKY ENERGY INC HSE. 1993
INTENSITY RESOURCES LTD ITY. 1993
INVERNESS PETROLEUM LTD IES.1 1993
PARAMOUNT RESOURCES LTD POU 1993
Company Ticker Year
RIO ALTO EXPLORATION LTD RAX.1 1993
TALISMAN ENERGY INC TLM 1993
THOMSON-REUTERS CORP (CDN) TRI 1993
ARCHER RESOURCES LTD ARC.2 1994
BARRICK GOLD CORP ABX 1994
CHANCELLOR ENERGY RES INC CHC.3 1994
GENERAL MOTORS CORP GM 1994
KINROSS GOLD CORP KGC 1994
NORTHROCK RESOURCES LTD NRK. 1994
ORBUS PHARMA INC ORB. 1994
PETROMET RESOURCES LTD PNTGF 1994
PLACER DOME INC PDG 1994
SPECTRUM SIGNAL PROCESSING SSPI 1994
TVX GOLD INC TVX 1994
AGNICO EAGLE MINES LTD AEM 1995
BARRICK GOLD CORP ABX 1995
BCE MOBILE COMMUNICATIONS BCX. 1995
FOUR SEASONS HOTELS -LTD VTG FS. 1995
KINROSS GOLD CORP KGC 1995
NEXEN INC NXY 1995
NORTEL NETWORKS CORP NT 1995
PETROMET RESOURCES LTD PNTGF 1995
PLACER DOME INC PDG 1995
RICHLAND PETROLEUM CORP-CL A RLP 1995
TEE-COMM ELECTRONICS INC TENXF 1995
THOMSON-REUTERS CORP (CDN) TRI 1995
TVX GOLD INC TVX 1995
ZENON ENVIRONMENTAL INC ZEN. 1995
AGNICO EAGLE MINES LTD AEM 1996
BARRICK GOLD CORP ABX 1996
BERKLEY PETROLEUM CORP BKP.1 1996
CARMANAH RESOURCES LTD CKM. 1996
FULCRUM TECHNOLOGIES INC FULCF 1996
GSI GROUP INC GSIG 1996
KINROSS GOLD CORP KGC 1996
PLACER DOME INC PDG 1996
RAND A TECHNOLOGY CORP RND.Z 1996
TORRINGTON RESOURCES LTD TRN.2 1996
Company Ticker Year
WESTMN RESOURCES LTD WMI.1 1996
BARRICK GOLD CORP ABX 1997
BERKLEY PETROLEUM CORP BKP.1 1997
CANRISE RESOURCES LTD CRE.1 1997
DEFIANCE MINING CORP DM.4 1997
DIGITAL PROCESSING SYS INC DPS. 1997
GENESIS EXPLORATION LTD GEX.1 1997
MAPLE LEAF FOODS INC MFI. 1997
NORTHROCK RESOURCES LTD NRK. 1997
PURSUIT RESOURCES INC PUT 1997
RAND A TECHNOLOGY CORP RND.Z 1997
REMINGTON ENERGY LTD REL.1 1997
SPECTRUM SIGNAL PROCESSING SSPI 1997
BCE MOBILE COMMUNICATIONS BCX. 1998
BIOVAIL CORP BVF 1998
DALSA CORP DSA. 1998
FONOROLA INC FON.1 1998
FOUR SEASONS HOTELS -LTD VTG FS. 1998
LOBLAW COMPANIES LTD L. 1998
MAPLE LEAF FOODS INC MFI. 1998
PARAMOUNT RESOURCES LTD POU 1998
RAND A TECHNOLOGY CORP RND.Z 1998
ROYAL LEPAGE LIMITED RLG 1998
TELEGLOBE INC TGO. 1998
THOMSON-REUTERS CORP (CDN) TRI 1998
ZENON ENVIRONMENTAL INC ZEN. 1998
Note: Stocks that stopped trading in a given year are highlighted and a T‐Bill assumption was made for the remainder of the year.

Company Ticker Year
ENGLOBE CORP EG 2003
ENSIGN ENERGY SERVICES INC ESI. 2003
GREAT NORTHERN EXPL LTD GNL 2003
HIGH RIVER GOLD MINES LTD HRG 2003
MACDONALD DETTWILER & ASSOC MDA. 2003
OLYMPIA ENERGY INC OLY. 2003
SHOPPERS DRUG MART CORP SC. 2003
TRICAN WELL SERVICE LTD TCW. 2003
WESTJET AIRLINES LTD WJA 2003
CELTIC EXPLORATION LTD CLT. 2004
DALSA CORP DSA. 2004
FIRST QUANTUM MINERALS LTD FM. 2004
GREAT CANADIAN GAMING CORP GC 2004
MANITOBA TELECOM SVCS INC MBT. 2004
SNC-LAVALIN GROUP INC SNC. 2004
VAQUERO ENERGY LTD VAQ 2004
WESTJET AIRLINES LTD WJA 2004
WORKBRAIN CORP WB. 2004
ZENON ENVIRONMENTAL INC ZEN. 2004
BLACKROCK VENTURES INC BVI 2005
CALVALLEY PETROLEUM INC CVI.A 2005
CARMANAH TECHNOLOGIES CORP CMH. 2005
FIRST QUANTUM MINERALS LTD FM. 2005
GREAT CANADIAN GAMING CORP GC 2005
IMPERIAL METALS CORP III. 2005
KICK ENERGY CORP KEC 2005
ONEX CORP OCX 2005
PRAIRIE SCHOONER PETROLEUM PSL. 2005
SNC-LAVALIN GROUP INC SNC. 2005
VAQUERO ENERGY LTD VAQ 2005
BLACKROCK VENTURES INC BVI 2006
BOW VALLEY ENERGY LTD BVX. 2006
DIVESTCO INC DVT 2006
GALLEON ENERGY INC GO.A 2006
MACDONALD DETTWILER & ASSOC MDA. 2006
MINACS WORLDWIDE INC MXW 2006
PETROBANK ENERGY RES LTD PBG. 2006
PROEX ENERGY LTD PXE. 2006
SNC-LAVALIN GROUP INC SNC. 2006
TMX GROUP INC X. 2006
TRANZEO WIRELESS TECH INC TZT 2006
WESTERN LAKOTA ENERGY SVCS WLE 2006
APPENDIX B.2 High P/E and High P/BV Stocks: 1999-2007 Company Ticker Year
AASTRA TECHNOLOGIES LTD AAH. 1999
BISSETT & ASSOC INVT MGT LTD BIM. 1999
GUARDIAN CAP GRP LTD -CL A GCG.A 1999
IONIC ENERGY INC IOI. 1999
LOBLAW COMPANIES LTD L. 1999
PARAMOUNT RESOURCES LTD POU 1999
PETROBANK ENERGY RES LTD PBG. 1999
POST ENERGY CORP PSN.1 1999
VAQUERO ENERGY LTD VAQ 1999
ZENON ENVIRONMENTAL INC ZEN. 1999
AASTRA TECHNOLOGIES LTD AAH. 2000
AD OPT TECHNOLOGIES INC AOP. 2000
ALIANT INC AIT. 2000
CRS ROBOTICS CORP ROB. 2000
ENSIGN ENERGY SERVICES INC ESI. 2000
JANNA SYSTEMS INC JAN. 2000
KNOWLEDGE HOUSE INC KHI. 2000
MOSAIC GROUP INC MGX. 2000
PALADIN LABS INC PLB. 2000
PASON SYSTEMS INC PSI. 2000
WESTJET AIRLINES LTD WJA 2000
CAUSEWAY ENERGY CORP CUW. 2001
ENSOURCE ENERGY SERVICES INC EEN. 2001
GAUNTLET ENERGY CORP GAU 2001
GUARDIAN CAP GRP LTD -CL A GCG.A 2001
LOBLAW COMPANIES LTD L. 2001
MACDONALD DETTWILER & ASSOC MDA. 2001
MANITOBA TELECOM SVCS INC MBT. 2001
SHAWCOR LTD -CL A SCL.A 2001
SPIRE ENERGY LTD SEY 2001
TRICAN WELL SERVICE LTD TCW. 2001
WESTJET AIRLINES LTD WJA 2001
WESTON (GEORGE) LTD WN. 2001
DALSA CORP DSA. 2002
DUPONT CANADA -CL A DUP.A 2002
HERITAGE OIL CORP HOC. 2002
LOBLAW COMPANIES LTD L. 2002
MACDONALD DETTWILER & ASSOC MDA. 2002
TEMPEST ENERGY CORP TMY.A 2002
WESTJET AIRLINES LTD WJA 2002
WESTON (GEORGE) LTD WN. 2002
ZENON ENVIRONMENTAL INC ZEN. 2002
DUPONT CANADA -CL A DUP.A 2003 Note: Stocks that stopped trading in a given year are highlighted and a T-Bill assumption was made for the remaining of the year.

H Paulin (TSE: PAP.A) April 1st, 2005
Price Graph Summary of Analysis and Recommendation
Entry Price: $37.83 Intrinsic Value / Share ($): 56.75 Margin of Safety (%) 33.3 P/BV: .93 P/E: 8.0 Market Cap is ($millions): 39.9 # of Analysts Covering: 0
Current Price: $37.50 Overview Profile: H Paulin was founded in 1920 and is a manufacturer and distributor of fasteners, fluid system products, automotive parts and screw machine components. All manufacturing facilities are located in Ontario and consist of cold heading, nut forming, metal stamping, screw machine, adhesive coating, and packaging processes. Distribution facilities are located in Vancouver, Edmonton, Winnipeg, Toronto, Montreal, Moncton and Cleveland. Management: Paulin’s President, Richard Paulin, has been on the board of directors since 1980. While a majority of board members are independent, the chairman of the board is also the company president, which may represent a conflict of interest. Furthermore, the company leases property (on the order of $750,000 per year) from its controlling shareholders. Two Paulin family accounts own a combined 70% of the company. The company has been paying a small dividend since 2003, currently yielding 1.25% Value Indicators: The stock has a P/B ratio of .93 and a P/E of 8. This is a small cap company with a market cap of $39.9M, with no institutional analysts covering this stock. The current market price offers investors a discount to both the earnings power as well as the replacement value of assets estimated later. The company has seen sales and income growth in both its manufacturing as well as its distribution segments.
Valuation: Stock is Undervalued
Business and Financial Risk: We classify Paulin as having medium business risk. While the manufacturing segment is highly cyclical, the company’s operating margin has stayed between 3.4% and 7% through the last operating cycle. Furthermore, manufacturing now represents only 2/3 of sales and continues to have less bearing on financial results as sales growth has been increasing rapidly in the distribution segment. The company uses contracts as part of its distribution business, which allows for some revenue certainty. However, 23% of the company’s sales are from one customer, increasing its risk. We classify Paulin as having medium financial risk. They have a current debt to capital ratio of 40% including operating
leases, which is consistent with its capital structure of the last several years and what we think the company should target. Note that the company does not carry cash, opting instead to use its operating line of credit, which could cause financing difficulties under extraordinary circumstances. Given our assessment of the company’s business and financial risks, we estimate Paulin’s debt rating at BBB, resulting in a weighted average cost of capital (WACC) of 8.7%, versus an ROIC (replacement) of 8.3%. An Asset Based Purchase: Since Paulin’s WACC exceeds its ROIC, this is an asset based investment. Moreover, almost 80% of the company’s assets are liquid (A/R and inventories), therefore there is an opportunity to buy liquid assets (namely A/R and inventory) at a discount. We estimate Net Asset Value (NAV) of $58.44/share and Earnings Power Value (EPV) of $55.06/share. Incorporating a 50% catalyst contribution to these estimates, due to the fact that most of the NAV is in liquid assets and that the company has remained a family run business with continued control for many years, we arrive at an intrinsic value of $56.75/share. Considering a 33% margin of safety yields an entry price of $37.83/share. Hence, our recommendation is to purchase the stock at the current price.
Recommendation
BUY
APPENDIX C Sample Report Produced for each Possibly Undervalued Stock of Q1 to Decide Whether to Include or not Include a Q1 Stock in the Sophisticated Portfolio of Truly Undervalued Stocks
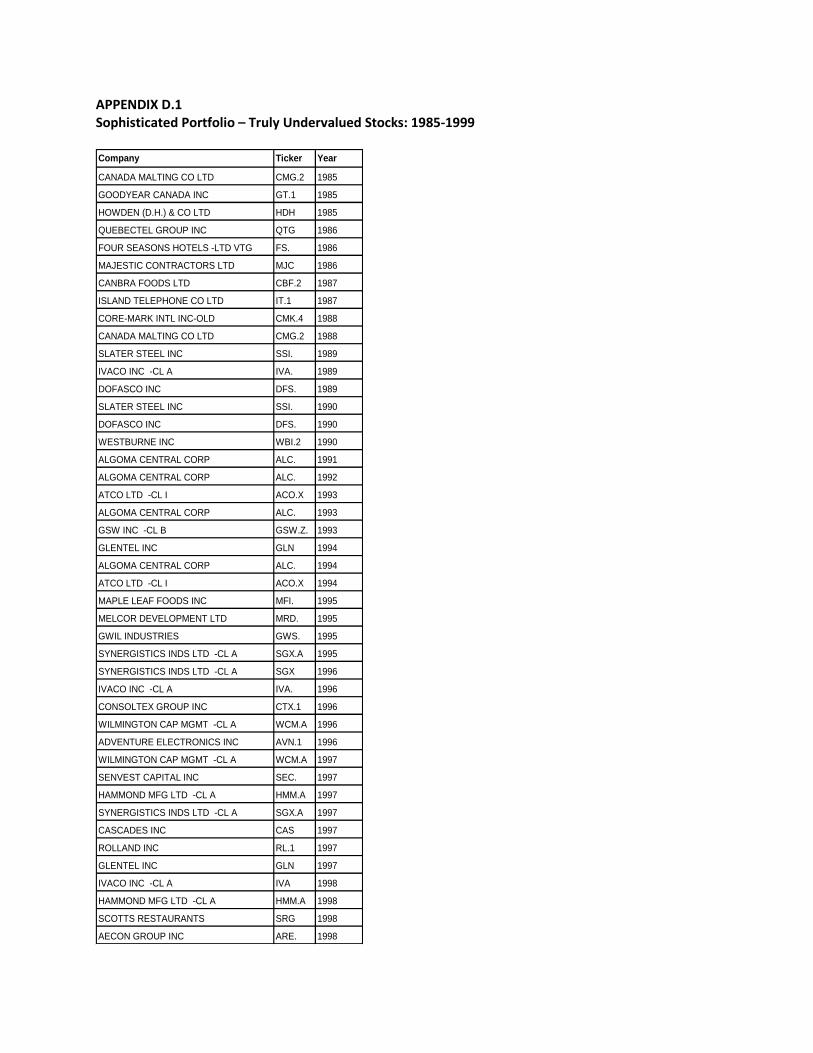
APPENDIX D.1 Sophisticated Portfolio – Truly Undervalued Stocks: 1985-1999 Company Ticker Year
CANADA MALTING CO LTD CMG.2 1985
GOODYEAR CANADA INC GT.1 1985
HOWDEN (D.H.) & CO LTD HDH 1985
QUEBECTEL GROUP INC QTG 1986
FOUR SEASONS HOTELS -LTD VTG FS. 1986
MAJESTIC CONTRACTORS LTD MJC 1986
CANBRA FOODS LTD CBF.2 1987
ISLAND TELEPHONE CO LTD IT.1 1987
CORE-MARK INTL INC-OLD CMK.4 1988
CANADA MALTING CO LTD CMG.2 1988
SLATER STEEL INC SSI. 1989
IVACO INC -CL A IVA. 1989
DOFASCO INC DFS. 1989
SLATER STEEL INC SSI. 1990
DOFASCO INC DFS. 1990
WESTBURNE INC WBI.2 1990
ALGOMA CENTRAL CORP ALC. 1991
ALGOMA CENTRAL CORP ALC. 1992
ATCO LTD -CL I ACO.X 1993
ALGOMA CENTRAL CORP ALC. 1993
GSW INC -CL B GSW.Z. 1993
GLENTEL INC GLN 1994
ALGOMA CENTRAL CORP ALC. 1994
ATCO LTD -CL I ACO.X 1994
MAPLE LEAF FOODS INC MFI. 1995
MELCOR DEVELOPMENT LTD MRD. 1995
GWIL INDUSTRIES GWS. 1995
SYNERGISTICS INDS LTD -CL A SGX.A 1995
SYNERGISTICS INDS LTD -CL A SGX 1996
IVACO INC -CL A IVA. 1996
CONSOLTEX GROUP INC CTX.1 1996
WILMINGTON CAP MGMT -CL A WCM.A 1996
ADVENTURE ELECTRONICS INC AVN.1 1996
WILMINGTON CAP MGMT -CL A WCM.A 1997
SENVEST CAPITAL INC SEC. 1997
HAMMOND MFG LTD -CL A HMM.A 1997
SYNERGISTICS INDS LTD -CL A SGX.A 1997
CASCADES INC CAS 1997
ROLLAND INC RL.1 1997
GLENTEL INC GLN 1997
IVACO INC -CL A IVA 1998
HAMMOND MFG LTD -CL A HMM.A 1998
SCOTTS RESTAURANTS SRG 1998
AECON GROUP INC ARE. 1998
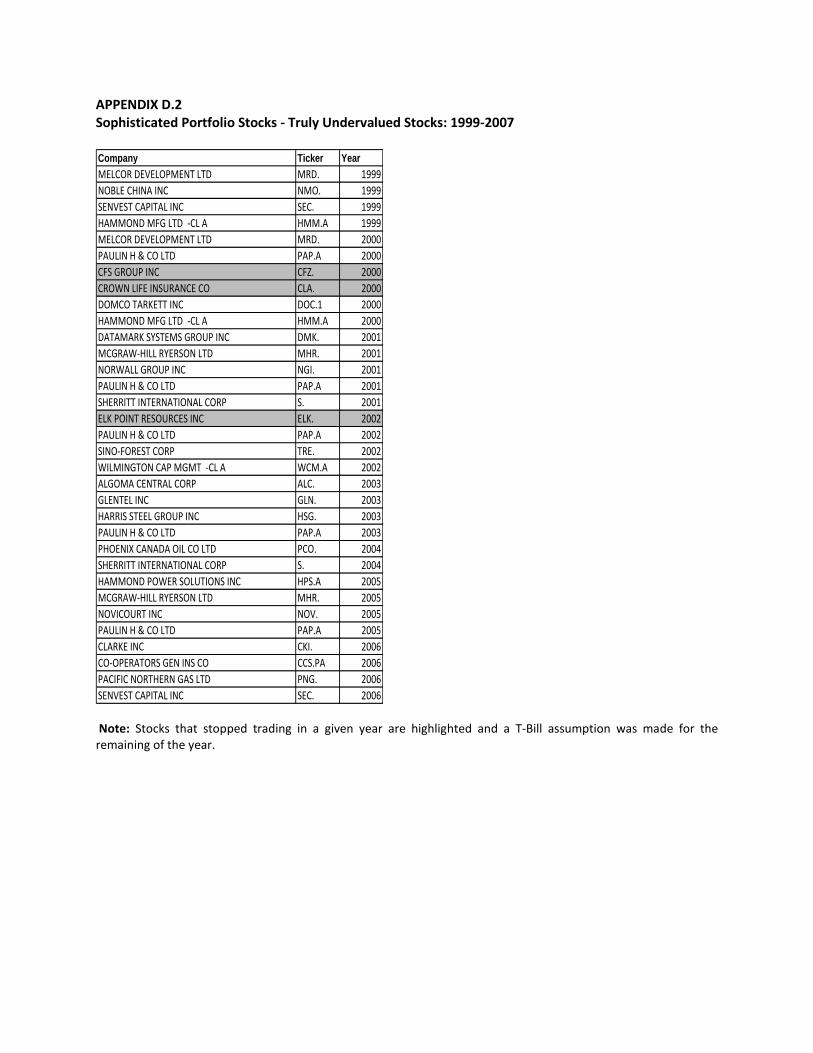
APPENDIX D.2 Sophisticated Portfolio Stocks - Truly Undervalued Stocks: 1999-2007 Company Ticker Year
MELCOR DEVELOPMENT LTD MRD. 1999
NOBLE CHINA INC NMO. 1999
SENVEST CAPITAL INC SEC. 1999
HAMMOND MFG LTD -CL A HMM.A 1999
MELCOR DEVELOPMENT LTD MRD. 2000
PAULIN H & CO LTD PAP.A 2000
CFS GROUP INC CFZ. 2000
CROWN LIFE INSURANCE CO CLA. 2000
DOMCO TARKETT INC DOC.1 2000
HAMMOND MFG LTD -CL A HMM.A 2000
DATAMARK SYSTEMS GROUP INC DMK. 2001
MCGRAW-HILL RYERSON LTD MHR. 2001
NORWALL GROUP INC NGI. 2001
PAULIN H & CO LTD PAP.A 2001
SHERRITT INTERNATIONAL CORP S. 2001
ELK POINT RESOURCES INC ELK. 2002
PAULIN H & CO LTD PAP.A 2002
SINO-FOREST CORP TRE. 2002
WILMINGTON CAP MGMT -CL A WCM.A 2002
ALGOMA CENTRAL CORP ALC. 2003
GLENTEL INC GLN. 2003
HARRIS STEEL GROUP INC HSG. 2003
PAULIN H & CO LTD PAP.A 2003
PHOENIX CANADA OIL CO LTD PCO. 2004
SHERRITT INTERNATIONAL CORP S. 2004
HAMMOND POWER SOLUTIONS INC HPS.A 2005
MCGRAW-HILL RYERSON LTD MHR. 2005
NOVICOURT INC NOV. 2005
PAULIN H & CO LTD PAP.A 2005
CLARKE INC CKI. 2006
CO-OPERATORS GEN INS CO CCS.PA 2006
PACIFIC NORTHERN GAS LTD PNG. 2006
SENVEST CAPITAL INC SEC. 2006 Note: Stocks that stopped trading in a given year are highlighted and a T-Bill assumption was made for the remaining of the year.

APPENDIX E.1
Low P/E and Low P/BV Stocks - Possibly Undervalued Stocks: 2007-2009
Company Ticker Year
BRAMPTON BRICK LTD -CL A BBL.A 2007
BUILDERS ENERGY SRVCS TRUST BET.Z 2007
CANADIAN SUB-SURFACE ENERGY CSE.Z 2007
CANFOR CORP CFP. 2007
CIRCA ENTERPRISES INC CTO. 2007
COLLICUTT ENERGY SVCS LTD COH.Z 2007
CORETEC INC CYY 2007
ENERCHEM INTL INC ECH. 2007
HIGH ARCTIC ENERGY SERVICES HWO. 2007
INTL FOREST PRODUCTS -CL A IFP.A 2007
PAULIN H & CO LTD PAP.A 2007
PEBERCAN INC PBC. 2007
SENVEST CAPITAL INC SEC. 2007
WEST FRASER TIMBER CO WFT. 2007
ALTAGAS UTILITY GROUP INC AUI. 2008
AUTOMODULAR CORP AM. 2008
CASCADES INC CAS. 2008
CLARKE INC CKI. 2008
DIVESTCO INC DVT 2008
DUNDEE CORP DC.A 2008
EGI FINANCIAL HOLDINGS INC EFH. 2008
HOMBURG INVEST INC HII.B 2008
HYDUKE ENERGY SERVICES INC HYD. 2008
LINAMAR CORP LNR. 2008
MARTINREA INTL INC MRE. 2008
PEBERCAN INC PBC. 2008
Note: Stocks that stopped trading in a given year are highlighted and a T-Bill assumption was made for the
remaining of the year.

APPENDIX E.2
High P/E and High P/BV Stocks: 2007-2009
Company Ticker Year
AVCORP INDUSTRIES INC AVP. 2007
CAMECO CORP CCJ 2007
HANFENG EVERGREEN INC HF. 2007
MERCATOR MINERALS LTD ML 2007
MERIDIAN GOLD INC MDG 2007
PETROBANK ENERGY RES LTD PBG. 2007
POTASH CORP SASK INC POT 2007
RALLY ENERGY CORP RAL.Z 2007
RITCHIE BROS AUCTIONEERS INC RBA 2007
ROGERS COMMUNICATIONS -CL B RCI 2007
SILVER STANDARD RES INC SSRI 2007
WESTERN OIL SANDS INC WTO.Z 2007
WORLD POINT TERMINALS INC WPO. 2007
ZCL COMPOSITES INC ZCL 2007
AGNICO EAGLE MINES LTD AEM 2008
CAMECO CORP CCJ 2008
CONSTELLATION SOFTWARE INC CSU. 2008
OILEXCO INC OIL. 2008
PETROBANK ENERGY RES LTD PBG. 2008
PETROMINERALES LTD PMG. 2008
POTASH CORP SASK INC POT 2008
PRISTINE POWER INC PPX. 2008
ROGERS COMMUNICATIONS -CL B RCI 2008
SNC-LAVALIN GROUP INC SNC. 2008
SOLIUM CAPITAL INC SUM 2008
WATERFURNACE RENEWABLE ENRGY WFI. 2008
Note: Stocks that stopped trading in a given year are highlighted and a T-Bill assumption was made for the
remaining of the year.

APPENDIX E.3
Sophisticated Portfolio Stocks - Truly Undervalued Stocks: 2007-2009
Company Ticker Year
CIRCA ENTERPRISES INC CTO. 2007
PAULIN H & CO LTD PAP.A 2007
ALTAGAS UTILITY GROUP INC AUI. 2008